DESIGN OPTIMIZATION FOR THE TWO-STAGE BIVARIATE … · design parameters for the MEWMA control...
39
DESIGN OPTIMIZATION FOR THE TWO-STAGE BIVARIATE PATTERN RECOGNITION SCHEME . MOHD SHUKRI BIN MOKHTAR A thesis submitted in partial fulfilment of the requirements for the award of the degree of Masters of Mechanical Engineering Faculty of Mechanical and Manufacturing Engineering Universiti Tun Hussein Onn Malaysia JUNE 2015
Transcript of DESIGN OPTIMIZATION FOR THE TWO-STAGE BIVARIATE … · design parameters for the MEWMA control...
DESIGN OPTIMIZATION FOR THE TWO-STAGE
BIVARIATE PATTERN RECOGNITION SCHEME
.
MOHD SHUKRI BIN MOKHTAR
A thesis submitted in partial fulfilment of the
requirements for the award of the degree of
Masters of Mechanical Engineering
Faculty of Mechanical and Manufacturing Engineering
Universiti Tun Hussein Onn Malaysia
JUNE 2015
v
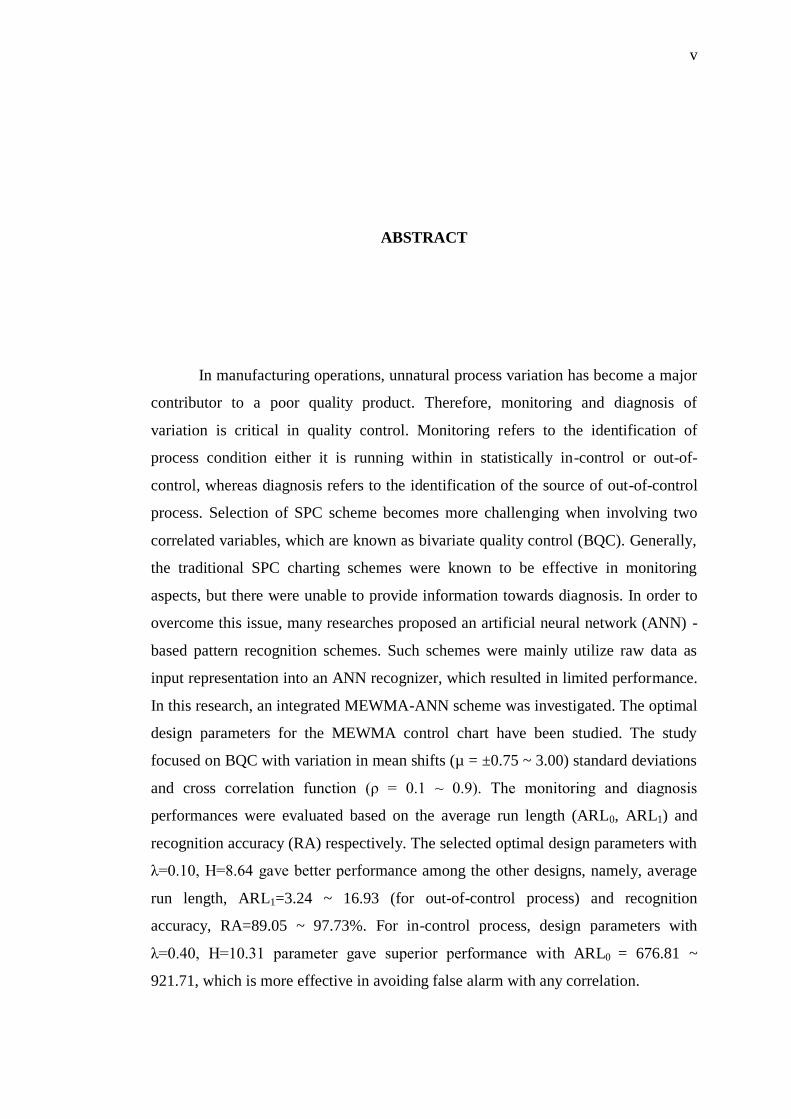
ABSTRACT
In manufacturing operations, unnatural process variation has become a major
contributor to a poor quality product. Therefore, monitoring and diagnosis of
variation is critical in quality control. Monitoring refers to the identification of
process condition either it is running within in statistically in-control or out-of-
control, whereas diagnosis refers to the identification of the source of out-of-control
process. Selection of SPC scheme becomes more challenging when involving two
correlated variables, which are known as bivariate quality control (BQC). Generally,
the traditional SPC charting schemes were known to be effective in monitoring
aspects, but there were unable to provide information towards diagnosis. In order to
overcome this issue, many researches proposed an artificial neural network (ANN) -
based pattern recognition schemes. Such schemes were mainly utilize raw data as
input representation into an ANN recognizer, which resulted in limited performance.
In this research, an integrated MEWMA-ANN scheme was investigated. The optimal
design parameters for the MEWMA control chart have been studied. The study
focused on BQC with variation in mean shifts (µ = ±0.75 ~ 3.00) standard deviations
and cross correlation function (ρ = 0.1 ~ 0.9). The monitoring and diagnosis
performances were evaluated based on the average run length (ARL0, ARL1) and
recognition accuracy (RA) respectively. The selected optimal design parameters with
λ=0.10, H=8.64 gave better performance among the other designs, namely, average
run length, ARL1=3.24 ~ 16.93 (for out-of-control process) and recognition
accuracy, RA=89.05 ~ 97.73%. For in-control process, design parameters with
λ=0.40, H=10.31 parameter gave superior performance with ARL0 = 676.81 ~
921.71, which is more effective in avoiding false alarm with any correlation.

vi
ABSTRAK
Di dalam operasi pembuatan, proses variasi telah menjadi penyumbang
kepada penghasilan produk yang berkualiti rendah. Oleh itu, proses pemantauan dan
diagnosis variasi adalah sangat penting dalam kawalan kualiti. Proses pemantauan
merujuk kepada mengenal pasti keadaan proses sama ada berada dalam keadaan
statistik terkawal ataupun di luar kawalan, manakala proses diagnosis merujuk
kepada mengenal pasti sumber proses di luar kawalan. Pemilihan skim SPC menjadi
semakin mencabar apabila ia melibatkan dua pembolehubah yang berkolerasi, di
mana ia juga di kenali sebagai kawalan kualiti bivariat (BQC). Secara amnya, skim
carta SPC tradisional adalah berkesan didalam aspek pemantauan, tetapi ia tidak
mampu menyediakan maklumat ke arah diagnosis. Untuk menangani isu ini, ramai
penyelidik telah mencadangkan skim rangkaian neural tiruan (ANN) berasakan corak
pengiktirafan. Skim ini terutamanya menggunakan data sebenar sebagai perwakilan
input yang menghasilkan prestasi terhad. Dalam kajian ini, skim bersepadu
MEWMA-ANN telah dikaji. Rekabentuk parameter optimal untuk carta kawalan
MEWMA juga telah dikaji. Kajian memfokuskan kepada kawalan kualiti bivariat
(BQC) dengan variasi dalam perubahan min (µ = ±0.75 ~ 3.00) sisihan piawai dan
fungsi korelasi bersilang (ρ = 0.1 ~ 0.9). Proses pemantauan dan diagnosis dinilai
berdasarkan purata panjang larian (ARL0, ARL1) dan ketepatan pengecaman (RA).
Rekabentuk parameter optimal terpilih dengan parameter λ=0.10, H=8.64 telah
menunjukkan keputusan terbaik berbanding yang lain,iaitu, purata panjang larian
ARL1=3.24 ~ 16.93 (untuk proses luar kawalan) dan ketepatan pengecaman,
RA=89.05 ~ 97.73%. Untuk proses dalam kawalan, rekabentuk parameter dengan
parameter λ=0.40, H=10.31 telah menunjukkan prestasi unggul dengan ARL0 =
676.81 ~ 921.71, dimana ia lebih berkesan dalam mengelakkan penggera kesalahan
dengan mana-mana kolerasi.

vii
CONTENTS
TITLE i
DECLARATION ii
ACKNOWLEDGEMENT iv
ABSTRACT v
ABSTRAK vi
CONTENTS vii
LIST OF TABLES xi
LIST OF FIGURES xii
LIST OF ABBREVIATIONS xiv
CHAPTER 1 INTRODUCTION
1.1 Introduction 1
1.2 Statement of Problem 2
1.3 Objectives 3
1.4 Scopes 3
1.5 Definitions of Terms 4
1.6 Expected Result 6
1.7 Summary 6
viii
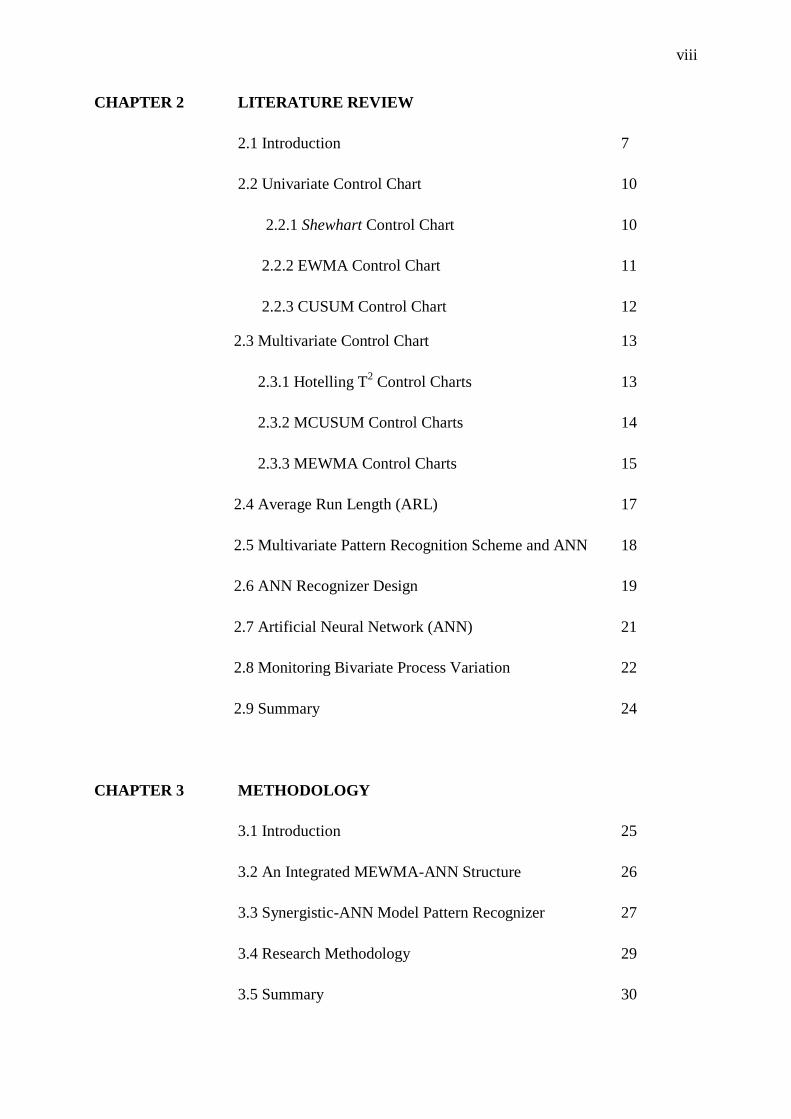
CHAPTER 2 LITERATURE REVIEW
2.1 Introduction 7
2.2 Univariate Control Chart 10
2.2.1 Shewhart Control Chart 10
2.2.2 EWMA Control Chart 11
2.2.3 CUSUM Control Chart 12
2.3 Multivariate Control Chart 13
2.3.1 Hotelling T2 Control Charts 13
2.3.2 MCUSUM Control Charts 14
2.3.3 MEWMA Control Charts 15
2.4 Average Run Length (ARL) 17
2.5 Multivariate Pattern Recognition Scheme and ANN 18
2.6 ANN Recognizer Design 19
2.7 Artificial Neural Network (ANN) 21
2.8 Monitoring Bivariate Process Variation 22
2.9 Summary 24
CHAPTER 3 METHODOLOGY
3.1 Introduction 25
3.2 An Integrated MEWMA-ANN Structure 26
3.3 Synergistic-ANN Model Pattern Recognizer 27
3.4 Research Methodology 29
3.5 Summary 30

ix
CHAPTER 4 RESULT AND DISCUSSION
4.1 Introduction 31
4.2 Integrated MEWMA-ANN Scheme 32
4.3 Bivariate Patterns 34
4.4 Data Generator 35
4.5 ANN Trainer 38
4.6 Performance Results and Evaluation 40
4.6.1 Bivariate Normal Pattern 41
4.6.2 Bivariate Shift Pattern 42
4.6.3 Design parameters for MEWMA control chart 44
( λ = 0.05, H=7.35)
4.6.4 Design parameters for MEWMA control chart 45
( λ = 0.10, H=8.64)
4.6.5 Design parameters for MEWMA control chart 46
( λ = 0.20, H=9.65)
4.6.6 Design parameters for MEWMA control chart 47
( λ = 0.30, H=10.08)
4.6.7 Design parameters for MEWMA control chart 48
( λ = 0.40, H=10.31)
4.7 Comparison with Previous Research 49
4.8 Overall Performance of MEWMA Control 51
Chart Parameter.
4.9 Summary 54

x
CHAPTER 5 CONCLUSION AND RECOMMENDTION
5.1 Conclusion 55
5.2 Recommendation 56
REFERENCE 57
APPENDICES 61
xi
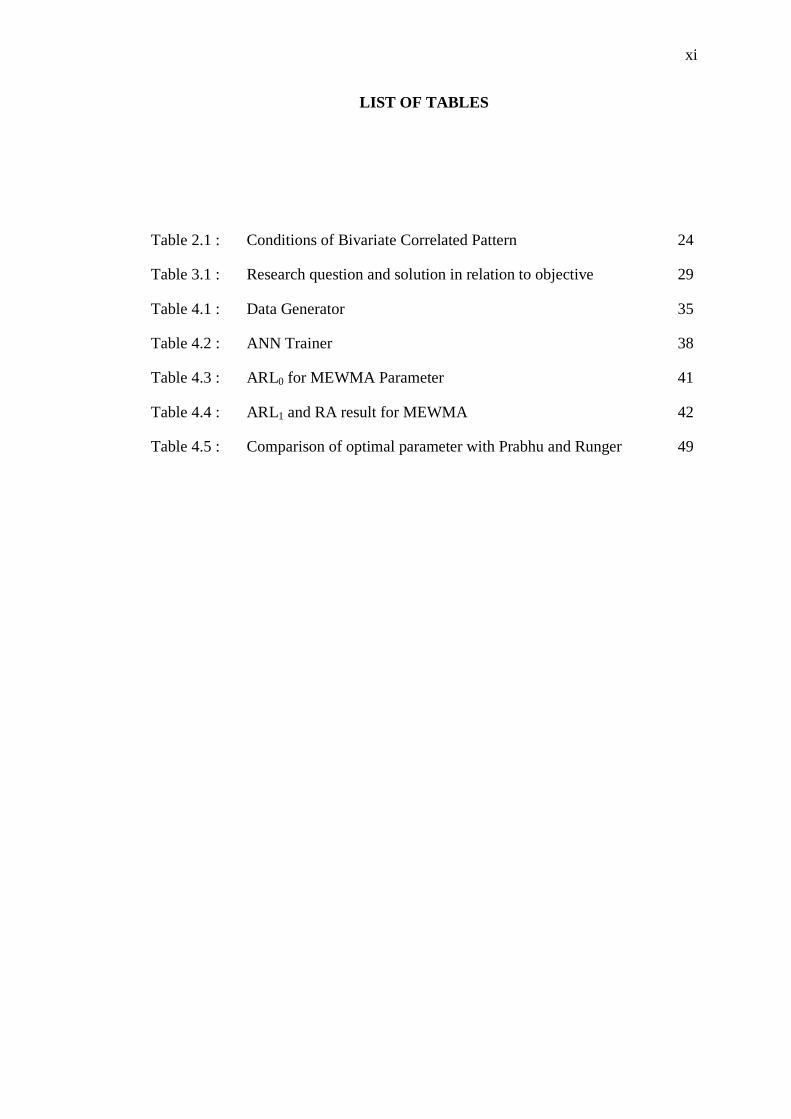
LIST OF TABLES
Table 2.1 : Conditions of Bivariate Correlated Pattern 24
Table 3.1 : Research question and solution in relation to objective 29
Table 4.1 : Data Generator 35
Table 4.2 : ANN Trainer 38
Table 4.3 : ARL0 for MEWMA Parameter 41
Table 4.4 : ARL1 and RA result for MEWMA 42
Table 4.5 : Comparison of optimal parameter with Prabhu and Runger 49
xii
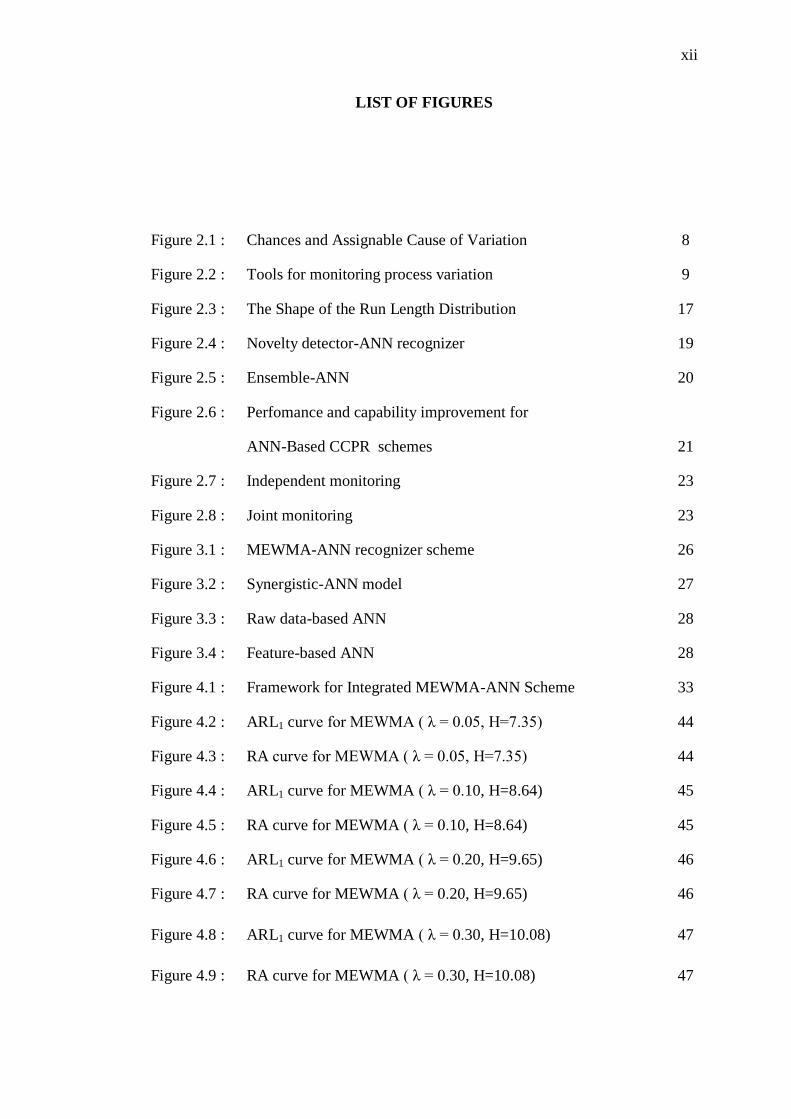
LIST OF FIGURES
Figure 2.1 : Chances and Assignable Cause of Variation 8
Figure 2.2 : Tools for monitoring process variation 9
Figure 2.3 : The Shape of the Run Length Distribution 17
Figure 2.4 : Novelty detector-ANN recognizer 19
Figure 2.5 : Ensemble-ANN 20
Figure 2.6 : Perfomance and capability improvement for
ANN-Based CCPR schemes 21
Figure 2.7 : Independent monitoring 23
Figure 2.8 : Joint monitoring 23
Figure 3.1 : MEWMA-ANN recognizer scheme 26
Figure 3.2 : Synergistic-ANN model 27
Figure 3.3 : Raw data-based ANN 28
Figure 3.4 : Feature-based ANN 28
Figure 4.1 : Framework for Integrated MEWMA-ANN Scheme 33
Figure 4.2 : ARL1 curve for MEWMA ( λ = 0.05, H=7.35) 44
Figure 4.3 : RA curve for MEWMA ( λ = 0.05, H=7.35) 44
Figure 4.4 : ARL1 curve for MEWMA ( λ = 0.10, H=8.64) 45
Figure 4.5 : RA curve for MEWMA ( λ = 0.10, H=8.64) 45
Figure 4.6 : ARL1 curve for MEWMA ( λ = 0.20, H=9.65) 46
Figure 4.7 : RA curve for MEWMA ( λ = 0.20, H=9.65) 46
Figure 4.8 : ARL1 curve for MEWMA ( λ = 0.30, H=10.08) 47
Figure 4.9 : RA curve for MEWMA ( λ = 0.30, H=10.08) 47
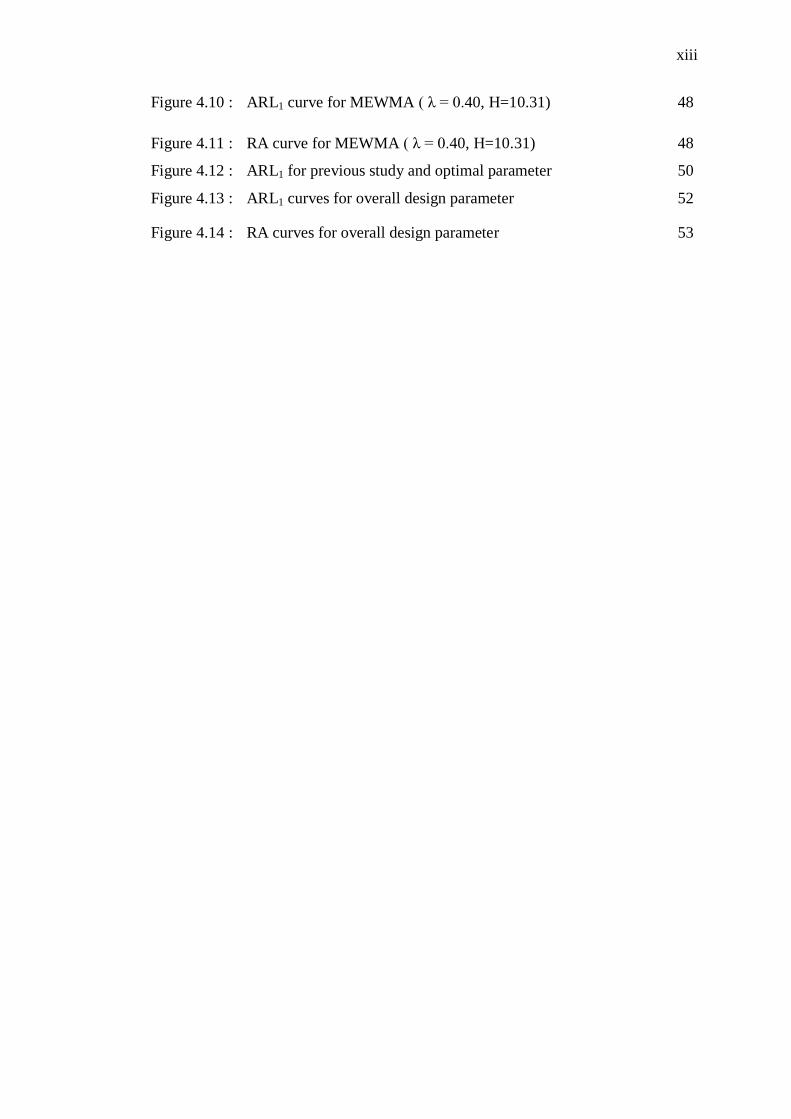
xiii
Figure 4.10 : ARL1 curve for MEWMA ( λ = 0.40, H=10.31) 48
Figure 4.11 : RA curve for MEWMA ( λ = 0.40, H=10.31) 48
Figure 4.12 : ARL1 for previous study and optimal parameter 50
Figure 4.13 : ARL1 curves for overall design parameter 52
Figure 4.14 : RA curves for overall design parameter 53
xiv
LIST OF ABBREVIATIONS
SPC - Statistical Process Control
MSPC - Multivariate Statistical Process Control
MEWMA - Multivariate Exponentially Weighted Moving Average
MCUSUM - Multivariate cumulative sum
ANN - Artificial Neural Network
BQC - Bivariate Quality Control
EWMA - Exponentially Weighted Moving Average
CUSUM - Cumulative Sum
CCP - Control Chart Patterns
CCPR - Control Chart Pattern Recognition
ARL - Average Run Lengths
ARL0 - Average Run Lengths for in-control process
ARL1 - Average Run Length for out-of-control process
RA - Recognition Accuracy
MLP - Multi-layer perceptrons
LVQ - Learning vector quantization
RBF - Radial basis function
ART - Adaptive resonance theory
SOM - Kohonen self-organizing mapping
CHAPTER 1
INTRODUCTION
1.1 Introduction
Nowadays, quality control is important to ensure the product that produce is
satisfied with the customer requirement. In order to achieve good quality,
manufacturer has faces a lot of obstacles during the manufacturing process. One of
the critical parts is the process variation. The process variation is always exist and
inherent along the production process. Therefore, to ensure that the quality is good
and satisfied the customer need, many company or industrial practitioner has been
implemented the powerful tools which is statistical process control (SPC). The
common tool that has been used is control chart. As such is Shewhart control chart
that was developed by Walter A. Shewhart in 1920s at the Bell Telephone
Laboratories. However, not all the quality can be monitored by the Shewhart control
chart. This is because the Shewhart control has a limitation in which this type of
control chart only able to detect the large shifts of process means. In detecting the
small shifts of process mean, the Shewhart control chart is unable to trace or slower.
Today, customers are sensitive about quality of product or services that they
paid. So, when the quality involves two correlated variables (bivariate), the powerful
and appropriate SPC tools is needed to help the production stage to maintain quality
in long term production. In this research, the author will conducted the experiment by
2
using the MEWMA – ANN pattern recognition scheme in terms of monitoring and
diagnosis the quality control. This scheme involve two-stage of monitoring which are
multivariate exponentially moving average (MEWMA) and the second stage is
artificial neural network (ANN) which is namely as a synergistic ANN. The design
and modelling of input data representation in training and pre – testing ANN – based
model are based on Lehman (1977) model, whereas the validation tests are
performed using actual manufacturing process data. In this research also mainly used
the MATLAB software to evaluate the performance of the MEWMA-ANN schemes.
Whereas the design parameter for MEWMA control chart was determine according
to the Prabhu and Rungger (1997).
1.2 Statement of Problem
In manufacturing industry, variation process is known to be a major
contributor to a poor quality product. It is important to select an effective scheme for
monitoring and diagnosis variation towards maintaining the quality level. This
selection becomes more critical when involving two correlated variables, which is
known as bivariate. It is known that the traditional statistical process control (SPC)
charting schemes are effective in monitoring aspects, but there are lack of diagnosis.
In recent years, numerous types of SPC pattern recognition schemes have been
proposed to overcome the diagnosis problem. One of them is the Two-Stage scheme,
which integrates the SPC charting and an artificial neural network (ANN) pattern
recognition techniques (Masood and Hassan, 2014). This scheme is effective to
perform joint monitoring and diagnosis but the design parameter for SPC chart were
determined based on trial and error. In this study, further investigation has been
performed to find the optimal design parameters for the SPC chart. This research will
be focused on several parameters as recommended in previous research (Prabhu and
Runger, 1997).
3
1.3 Objectives
The objectives of this study are:
i. To develop a two-stage pattern recognition scheme for recognizing
bivariate process variation.
ii. To investigate an optimal design parameter for the two-stage pattern
recognition scheme.
iii. To evaluate the recognition performance of the proposed design.
1.4 Scopes
The scope of this research are as listed below:
i. The bivariate process variables are dependent to each other based on
linear cross correlation (p).
ii. The predictable patterns of process variation are limited to sudden
shifts (upward shifts and downward shifts).
iii. Magnitudes of variation (sudden shifts) are limited within ± 3
standard deviations based on control limits of Shewhart control chart
iv. Design and modelling of input data representation in training and pre-
testing ANN-based model are based on Lehman (1977) model.
4
1.5 Definition of Terms
The following terms are important and frequently used in this research:
(a) Process monitoring and diagnosis.
Process monitoring refers to the identification of process status either it is
running within a statistically in-control or has become a statistically out-
of-control. While, process diagnosis refers to the identification of sources
of variation in relation to a statistically out-of-control process.
(b) Sources of variation.
Sources of variation refers to a component variable or group of
component variables that indicate a bivariate process has become out-of-
control. In this research, it is focused on sudden shift in process mean
(process mean shifts). This information is useful towards diagnosing the
root cause error.
(c) On-line process.
Refers to in-process environment in manufacturing industries, that is,
during manufacturing operation is running. Based on individual samples,
continuous data streams patterns will be produced through automated
measuring and inspection devices. An in-control process is represented by
random/normal patterns, while an out-of-control process is represented by
gradual trend or sudden shift pattern.
5
(d) De facto level (de facto monitoring level).
De facto level refers to a widely acceptable average run length value for
the first false alarm to occur in monitoring process variable or quality
characteristics. Specifically, it refers to ARL0 ≥ 370 based on the
traditional univariate SPC charting schemes such as Shewhart, CUSUM
and EWMA control charts.
(e) Control chart patterns (CCPs).
Refer to the patterns of univariate process data streams that can be
indicated graphically using Shewhart control chart.
(f) Bivariate patterns.
Bivariate patterns refer to the unified patterns that are able to indicate the
linear correlation between two dependent variables.
(g) Accurate diagnosis.
Accurate diagnosis refers to a desirable diagnosis performance, that is,
effective to correctly identify the source of variation with high
recognition accuracy (≥ 95%).
(h) Pattern recognition.
Pattern recognition is an operation of extracting information from an
unknown process data streams or signals, and assigning it to one of the
prescribed classes or categories (Haykin, 1999). In this research, it deals
with bivariate patterns.
6
(i) Pattern recognition scheme.
Pattern recognition scheme refers to a set of related procedures
formulated and presented in a unified manner for addressing the problem
of control chart pattern recognition (Hassan, 2002).
1.6 Expected Result
In this project, the design parameters for MEWMA control chart has been
chosen based on Prabhu and Runger 1997. The proposed design was evaluated
based on average run length (ARL0, ARL1) and recognition accuracy (RA).
1.7 Summary
This chapter reviews the introduction, statement of problem, objectives,
scope, definition of terms, and expected result. In this research, the existing charting
scheme which is MEWMA – ANN pattern recognition scheme was used to
monitoring and diagnosis pattern recognition (Masood and Hassan, 2012). Therefore,
an optimal design parameter for MEWMA control chart has been investigated in
order to obtain the better parameter design.
CHAPTER 2
LITERATURE REVIEW
2.1 Introduction
In manufacturing industries nowadays, process variation is a major
problem that the industrial practitioners have to encounter. It also has become a
major source of poor quality. Today, customers are sensitive about the quality of
product or services that they have paid. As technology has growing up rapidly, the
statistical process control (SPC) is a powerful tool that can encounter the process
variation. Most of the process exhibits some variability. Process variation can be
classified into one of two categories which are chance cause or assignable cause of
process variation. The chance cause is the probability error that existed in a stable
process data stream in which there is no specific cause involved. This may be due to
the parallax error in measurement, and if it can be minimized by averaging the
measurement data. Whereas an assignable cause is a specific cause or systematic
error that affects a process to be unstable. As an example, it could be the machining
tool wear, misalignment of fixture, machine vibration, new operator and so on that
causes machining work piece dimension out of control. Both chances and assignable
cause of variation illustrated in Figure 2.1.

8
Figure 2.1 : Chances and assignable cause of variation (Montgomery, 2009).
Figure 2.1 shows that from initial time t0 until certain period t1, the process
shown in statistical control that is only chance causes are present. Within this period,
process mean and standard deviation are in control value, µ0 and σ0. There are three
variation possibility may be happen in the process environment. As shown at time t1,
an assignable cause may shift the process mean (µ1>µ0) but maintain the dispersion
(σ0). While at time t2, other assignable cause may effect the dispersion (σ2>σ0) but
maintain the mean (µ0). Lastly as shown at t3, other assignable cause may effects
both process mean and dispersion shifts normally to be out-of-control, µ3<µ0 and
σ3>σ0.
Statistical process control (SPC) is a powerful collection of problem solving
tools useful in both achieving process stability and improving capability in term of
reduction the variability. SPC is one of the sophisticated technology developments
because it is based on sound underlying principles, is easy to use, has significant
impact, and can be applied to any process. A primary tool and most commonly used
for SPC is a control chart. Among many type of control chart, Shewhart control chart
are widely use in practice due to the simplicity. The Shewhart control chart is a
statistical method to monitor the process sample average by determining the mean
(µ) and the limits feature which are upper control limits and lower control limit.
According to the Montgomery (2009), the Shewhart control chart is only effective to
9
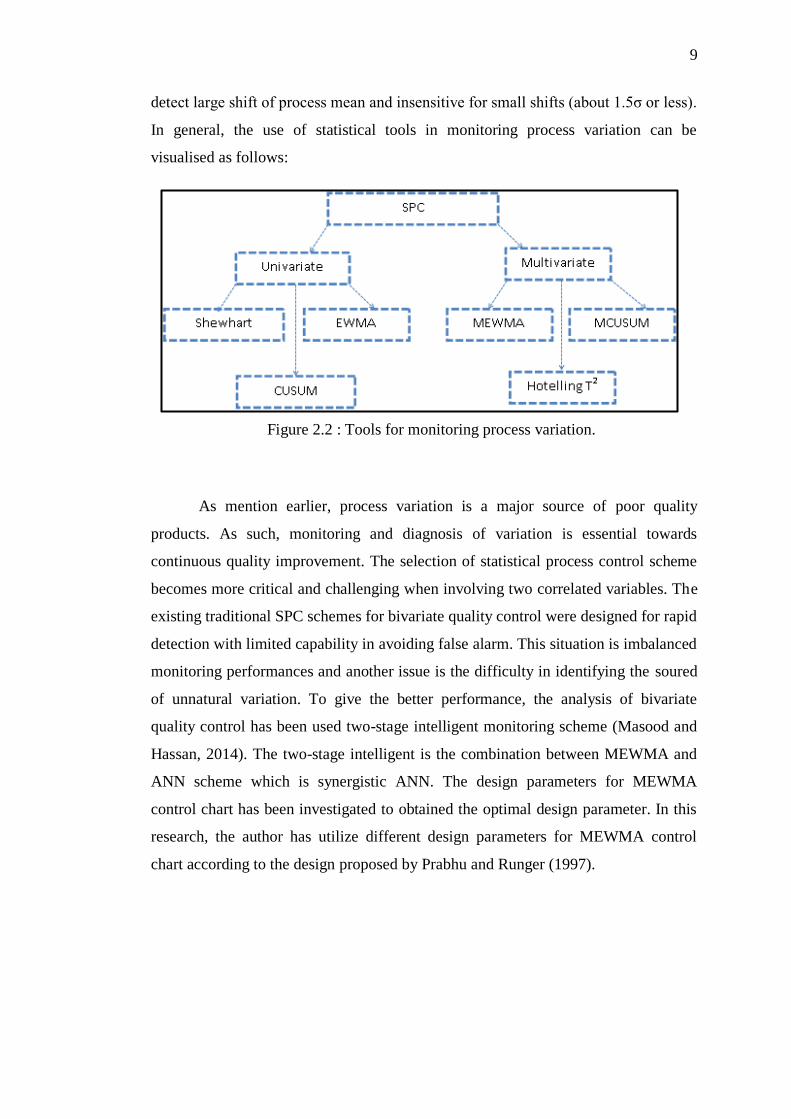
detect large shift of process mean and insensitive for small shifts (about 1.5σ or less).
In general, the use of statistical tools in monitoring process variation can be
visualised as follows:
As mention earlier, process variation is a major source of poor quality
products. As such, monitoring and diagnosis of variation is essential towards
continuous quality improvement. The selection of statistical process control scheme
becomes more critical and challenging when involving two correlated variables. The
existing traditional SPC schemes for bivariate quality control were designed for rapid
detection with limited capability in avoiding false alarm. This situation is imbalanced
monitoring performances and another issue is the difficulty in identifying the soured
of unnatural variation. To give the better performance, the analysis of bivariate
quality control has been used two-stage intelligent monitoring scheme (Masood and
Hassan, 2014). The two-stage intelligent is the combination between MEWMA and
ANN scheme which is synergistic ANN. The design parameters for MEWMA
control chart has been investigated to obtained the optimal design parameter. In this
research, the author has utilize different design parameters for MEWMA control
chart according to the design proposed by Prabhu and Runger (1997).
Figure 2.2 : Tools for monitoring process variation.
10
2.2 Univariate Control Charts
The univariate control charts are used to monitor a single quality
characteristic. These kinds of control chart have been popular and widely implement
in industry due to their simplicity. Shewhart control chart, the exponentially
weighted moving average (EWMA) control chart and the cumulative sum (CUSUM)
chart are classified into univariate control chart.
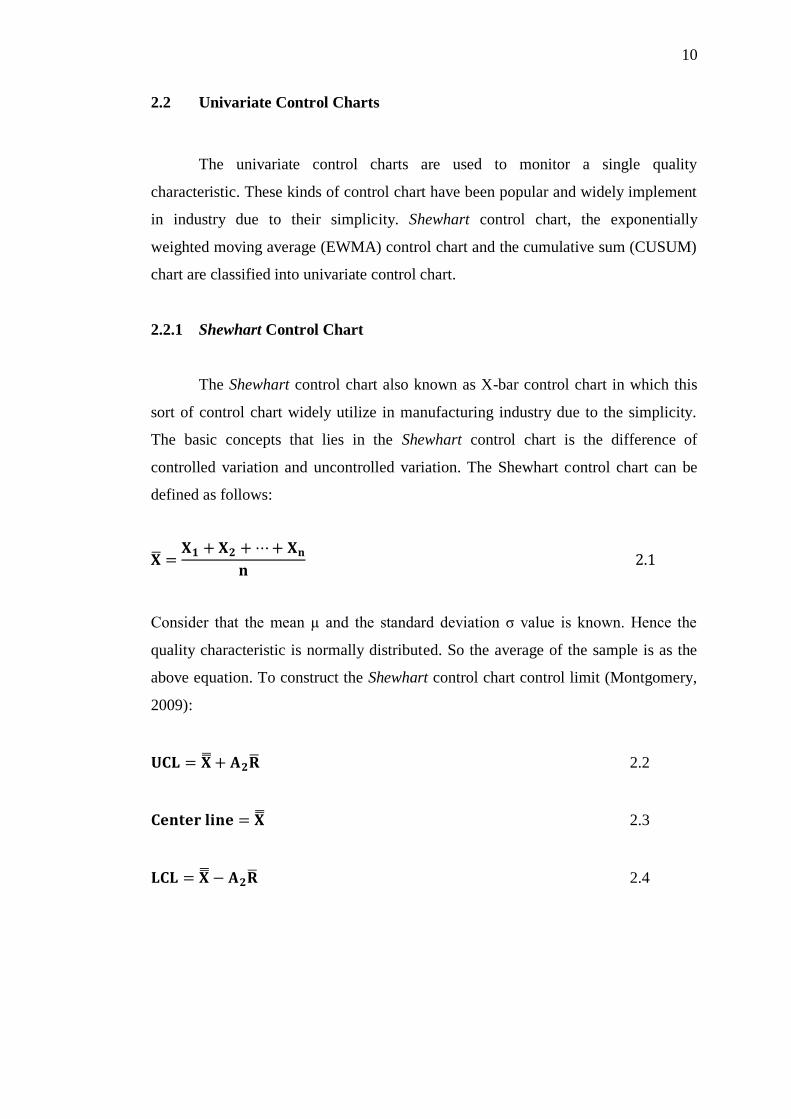
2.2.1 Shewhart Control Chart
The Shewhart control chart also known as X-bar control chart in which this
sort of control chart widely utilize in manufacturing industry due to the simplicity.
The basic concepts that lies in the Shewhart control chart is the difference of
controlled variation and uncontrolled variation. The Shewhart control chart can be
defined as follows:
Consider that the mean µ and the standard deviation σ value is known. Hence the
quality characteristic is normally distributed. So the average of the sample is as the
above equation. To construct the Shewhart control chart control limit (Montgomery,
2009):
2.2
2.3
2.4
11
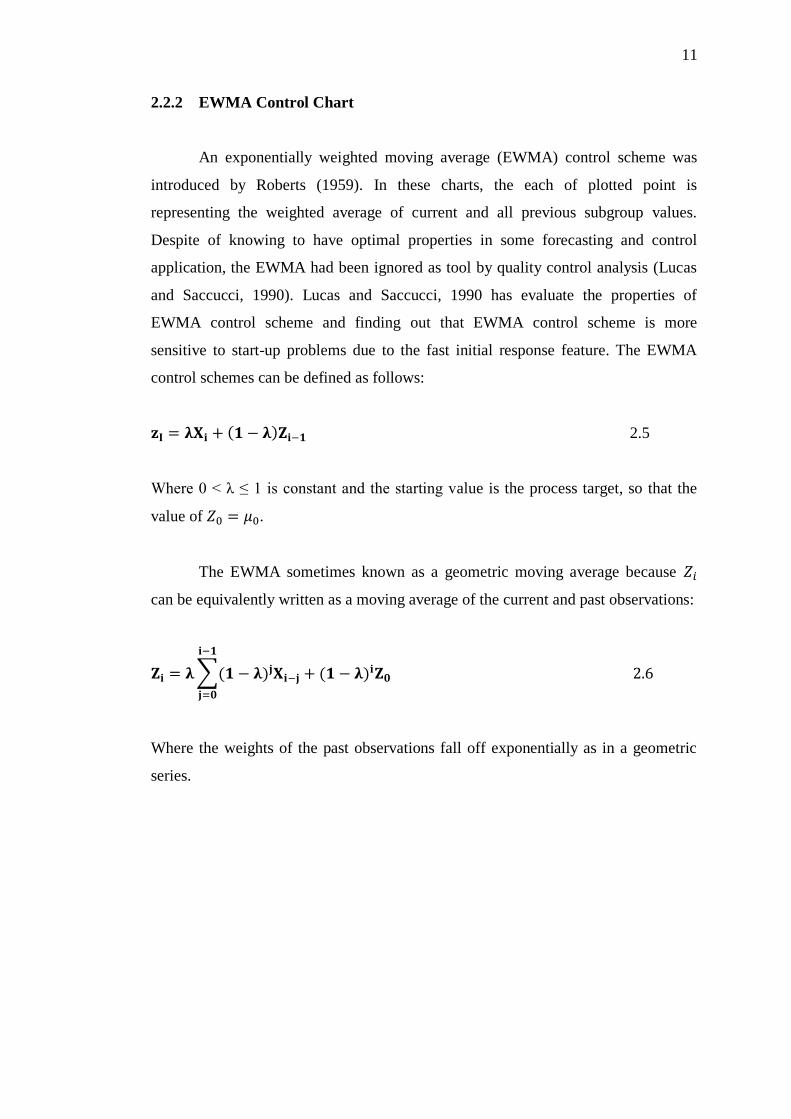
2.2.2 EWMA Control Chart
An exponentially weighted moving average (EWMA) control scheme was
introduced by Roberts (1959). In these charts, the each of plotted point is
representing the weighted average of current and all previous subgroup values.
Despite of knowing to have optimal properties in some forecasting and control
application, the EWMA had been ignored as tool by quality control analysis (Lucas
and Saccucci, 1990). Lucas and Saccucci, 1990 has evaluate the properties of
EWMA control scheme and finding out that EWMA control scheme is more
sensitive to start-up problems due to the fast initial response feature. The EWMA
control schemes can be defined as follows:
( ) 2.5
Where 0 < λ ≤ 1 is constant and the starting value is the process target, so that the
value of .
The EWMA sometimes known as a geometric moving average because
can be equivalently written as a moving average of the current and past observations:
∑( ) ( )
Where the weights of the past observations fall off exponentially as in a geometric
series.

12
2.2.3 CUSUM Control Chart
In general, the cumulative sum or CUSUM control chart was developed by
Page in 1954. In these chart, it plots the cumulative sums of the sample values
deviations of a quality characteristic from a target value against time. Previously, the
researchers has stated that CUSUM control chart is more effective and efficient
rather than Shewhart control chart for detecting smaller variation in the average. The
tabular CUSUM work by accumulating derivations from µ0 in which there are above
target with one statistic C+
another one is that are below target with statistic C-. Both
of C+ and C
- statistics are called
one-sided upper and lower cusums respectively.
They can be defined as follows:
, ( )
- 2.7
, ( )
- 2.8
Where the starting values are
. The K notation is representing the
reference value and basically it is often chosen halfway between the target µ0 and the
shift of mean which one is interested in detecting. Hence,
| |
Both values of and
in the CUSUM are accumulate deviation from the target
value µ0 in which there are greater than K. If any of them that are exceed the decision
interval H, totally it can be said that the process is out-of-control. In CUSUM control
scheme, it is important for proper selection of these two parameter K and H
respectively. The proper selection of this parameter will determine the performance
of the CUSUM. A reasonable value of H is five times the process standard deviation
σ. According to the Montgomery, the parameters of the CUSUM chart are as
follows:
2.10
2.11

13
2.3 Multivariate Control Charts
Nowadays, the quality engineering aspect becomes more challenging and
critical in manufacturing engineering process. Due to this, the importance of
multivariate control charts has been escalated because more quality features are
measured in mass production than ever before. The most common multivariate
control chart are multivariate exponentially weighted moving average (MEWMA)
control chart, multivariate cumulative sum (MCUSUM) control chart and
multivariate Shewhart control chart. In this dissertation, the author will study the
optimal design parameter for MEWMA.
2.3.1 Hotelling T2 Control Charts
In general, the Hotelling T2 chart is a direct analog of the univariate Shewhart
chart. This kind of control chart is can be considered the most popular multivariate
control chart for monitoring several quality characteristics. The Hotelling T2 chart
was proposed by Hotelling H, 1947. There are two types of the Hotelling T2 chart
which are sub-grouped data and the other one is individual observations. The most
frequent observation in industry process is involving individual observations.
Consider that m samples, each of size n = 1 are available and that ρ is the number of
quality characteristics observed in each sample. Let and S be the sample mean
vector and covariance matrix of these observations respectively. Then the Hotelling
can be as follows;
( ) ( ) 2.12
Whereas for the upper control limit (UCL) and lower control limit (LCL) for
monitoring processes are
( )( )
2.14
14
Where is the upper α percentage point of F distribution with parameters p
and m-p. However, the Hotelling T2
is not effective in detecting small and moderate
mean shifts as the variable process is increases it lose the efficiency in detection of
process variation.
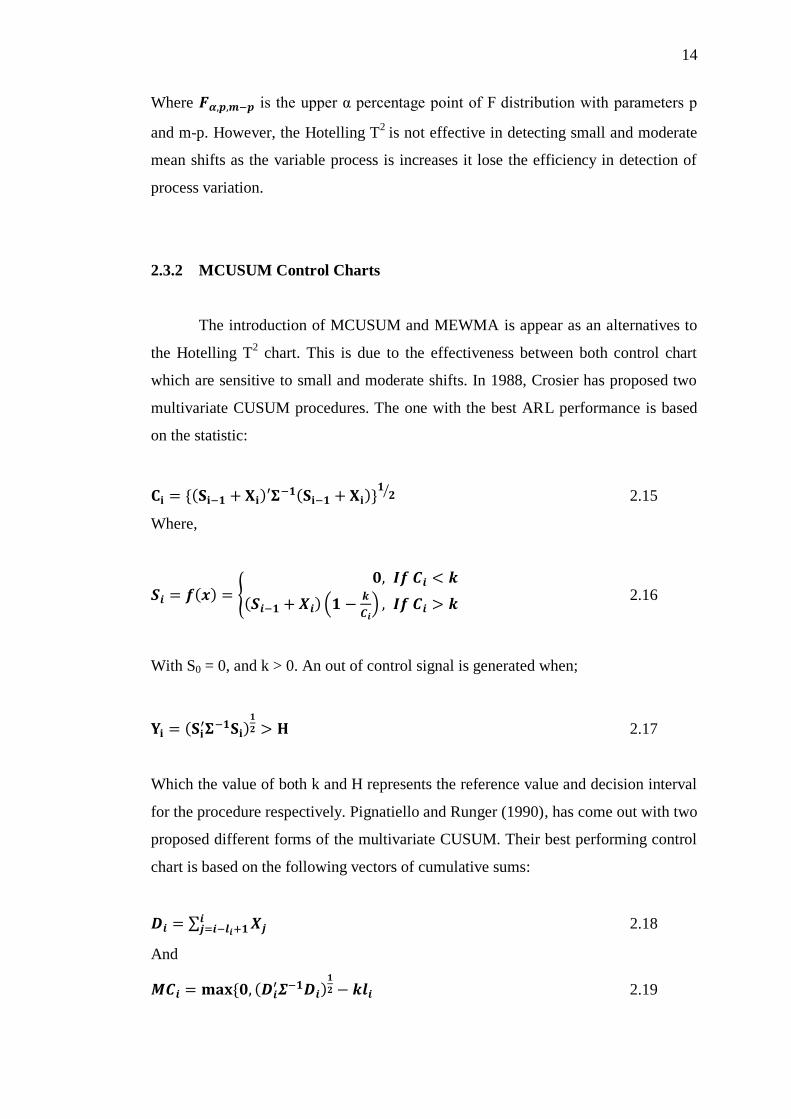
2.3.2 MCUSUM Control Charts
The introduction of MCUSUM and MEWMA is appear as an alternatives to
the Hotelling T2 chart. This is due to the effectiveness between both control chart
which are sensitive to small and moderate shifts. In 1988, Crosier has proposed two
multivariate CUSUM procedures. The one with the best ARL performance is based
on the statistic:
*( ) ( )+
⁄ 2.15
Where,
( ) {
( ) .
/
2.16
With S0 = 0, and k > 0. An out of control signal is generated when;
( )
2.17
Which the value of both k and H represents the reference value and decision interval
for the procedure respectively. Pignatiello and Runger (1990), has come out with two
proposed different forms of the multivariate CUSUM. Their best performing control
chart is based on the following vectors of cumulative sums:
∑ 2.18
And
* ( )
2.19
15
Where k > 0, li = li-1 + 1 if MCi-1 > 0 and li = 1 otherwise. An out of control signal is
generated if MCi > H.
2.3.3 MEWMA Control Charts
Although the Shewhart control chart is widely implemented today, there is
some limitation of this control chart. The Shewhart control chart is relatively
insensitive to small and moderate shifts in the mean vector. Meanwhile, both of the
cumulative sum and EWMA control charts were developed to trigger the small shifts
in the univariate case. This will led to the development of a multivariate EWMA
control chart (Lowry et al. 1992). The MEWMA is a logical extension of the
univariate EWMA and is defined as follow (Montgomery, 2009) :
( ) 2.20
where, λ is a smoothing parameter (0 < λ ≤ 1) and it is assumed . The
MEWMA control chart give a warning signal when,
∑
2.21
where H is a specified control limit and the covariance matrix, ∑ is given as :
, ( ) - 2.22
In the bivariate case, the MEWMA statistics can be defined as follows (Masood,
2014) :
[
( ) ( )
( )( )]
(
)
2.23
( ) ( ) 2.24
( ) ( ) 2.25
16
Covariance matrix of MEWMA :
∑
( )[
] 2.26
The standardized samples (Z1i, Z2i) with cross correlation function (ρ) were used.
Hence, σ1 = σ2 = 1; σ12 = ρ. λ and i notations represent the constant parameter and
number of samples. In this research, the design parameter will be set according to the
Prabhu and Runger, (1997).
17
2.4 Average Run length (ARL)
Basically, the statistical process control chart was developed to detect process
shifts as faster as possible when the process signal out-of-control. Another method to
trace the out-of-control process rather than control chart is the average run length
(ARL) of the control chart. In general, the ARL is the number of points average in
which it must be plotted before the point indicates an out-of-control condition. Note
that for a Shewhart control chart ARL can be defined as follow:
Which is the notation of ρ is represent the probability any point that exceeds the
control limit. Thus, the same equation can be used to evaluate the control chart
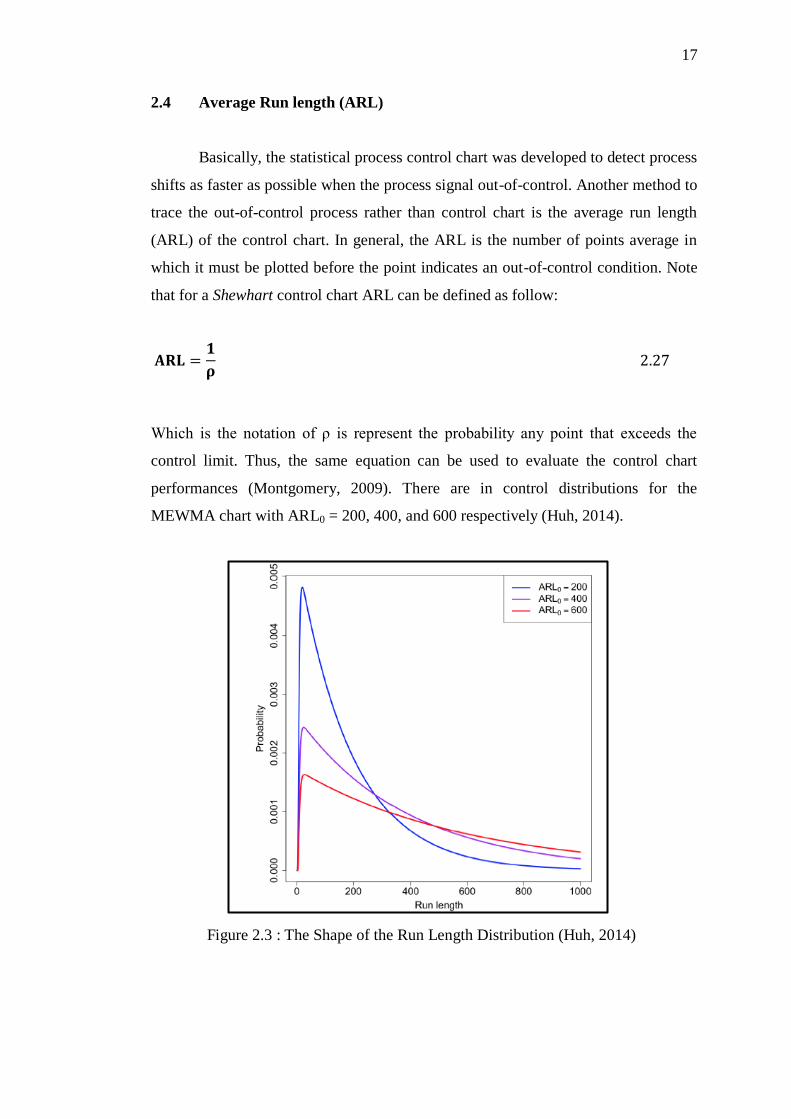
performances (Montgomery, 2009). There are in control distributions for the
MEWMA chart with ARL0 = 200, 400, and 600 respectively (Huh, 2014).
Figure 2.3 : The Shape of the Run Length Distribution (Huh, 2014)
18
In monitoring aspects, the ARL0 values measure how long it could maintain
stable process running without false alarm. While the values of ARL1 measure how
fast it could detect the mean shift. These values were computed based on the
correctly classified patterns (Masood and Hassan, 2012). In other words, it can be
said that ARL0 is in control process whereas ARL1 is out of control process. In
bivariate process, Masood and Hassan (2014) has compared the ARLs and
recognition accuracy (RA) between the proposed scheme with the traditional MSPC.
As a resulted, it shows that the proposed design gave the superior performance than
the traditional MSPC.
2.5 Multivariate Pattern Recognition Scheme and ANN
Nowadays, the pattern recognition has widely use and utilize in various field
of area research. In manufacturing processes, pattern recognition is act to reveal
potential quality problems. One of the approaches for recognizing different control
chart patterns is develop the various shape features of the patterns. This approach
will help and assist the users to easily can understand how a particular pattern is
identified. To make it more effective, the artificial neural network (ANN) will
analyse the pattern recognition from the shape feature that they read. ANN with
feature extracted from the process data as input vector representation can facilitate
efficient pattern recognition. There are various models of ANN and it can be
categorized into single model and combined model. Multi-layer perceptrons (MLP),
learning vector quantization (LVQ), radial basis function (RBF), adaptive resonance
theory (ART) and Kohonen self-organizing mapping (SOM) can be classified as
single ANN models. The application of single ANN models are commonly limited to
simple recognition cases. This is different for the combined ANN models. The
combined ANN models were investigated for dealing with more complex cases.
In this research, multi-layer perceptrons (MLP) model trained with back-propagation
(BPN) algorithm was applied for the ANN. This model has been widely used and
proven effective for univariate statistical process control pattern recognition

19
(SPCPR). (Pham and Oztemel, 1993; Hwang and Hubele, 1993; Cheng 1995; 1997;
Guh et al., 1999a; 1999b; Guh and Tannock, 1999; Guh and Hsieh, 1999; Perry et
al., 2001; Hassan et al., 2003; Al-Assaf, 2004; Al-Assaf and Assaleh, 2005; Gauri
and Chakraborty, 2006; 2008) as well as for bivariate pattern recognition (Niaki and
Abbasi, 2005; Guh, 2007).
2.6 ANN Recognizer Design
The existing multivariate pattern recognition schemes are categorized into
two which are ANN-Based model and Integrated MSPC-ANN model based on
external structures. Generally, the ANN-based models are designed to perform
simultaneously for monitoring and diagnosis process. Zorriassatine et al. (2003) has
come out with the designing of a novelty detector-ANN which functions for
recognizing normal pattern and sudden shift patterns namely upward shift and
downward shift. Only two sources of variation investigate which are upward shift
(1,0) and upward shift (0,1). The upward shift (1,0) class represents only variable-1
is shifted, meanwhile upward shift (0,1) class represents only variable-2 is shifted.
The performance of the scheme was evaluated based on recognition accuracy (RA)
and no performance based on average run length (ARL0, ARL1) reported.
Figure 2.4 : Novelty detector-ANN recognizer (Zorriassatine et al., 2003)
20
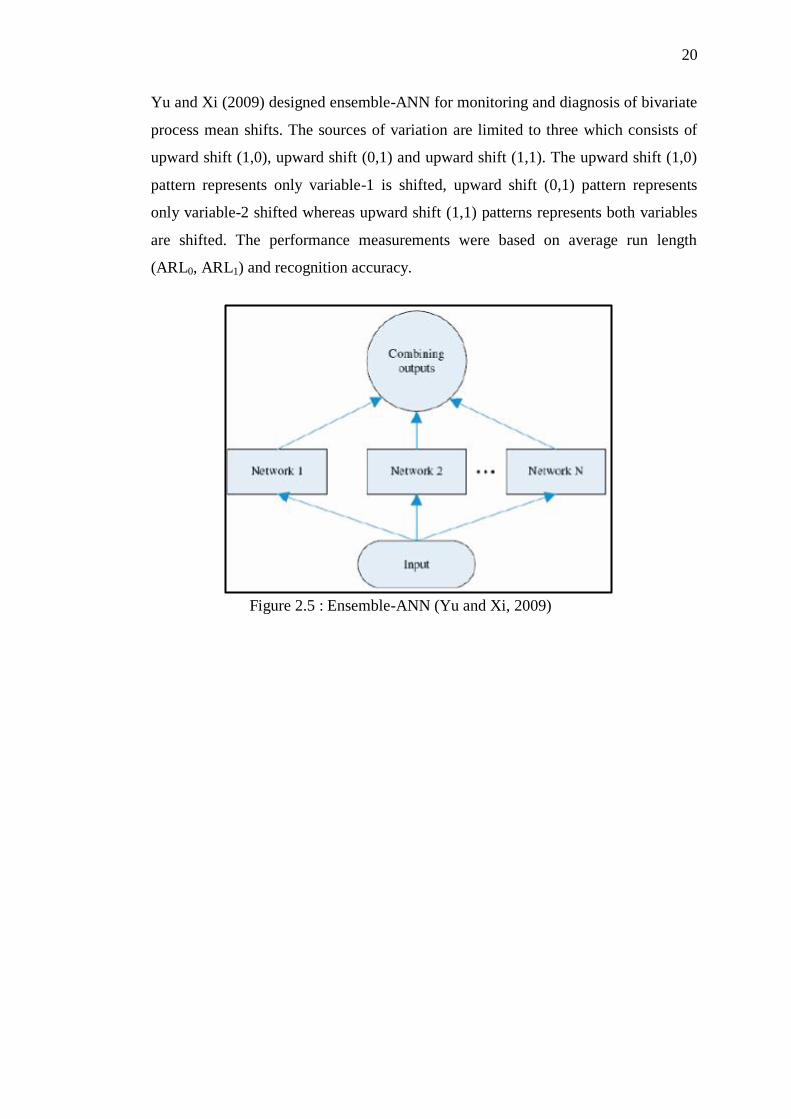
Yu and Xi (2009) designed ensemble-ANN for monitoring and diagnosis of bivariate
process mean shifts. The sources of variation are limited to three which consists of
upward shift (1,0), upward shift (0,1) and upward shift (1,1). The upward shift (1,0)
pattern represents only variable-1 is shifted, upward shift (0,1) pattern represents
only variable-2 shifted whereas upward shift (1,1) patterns represents both variables
are shifted. The performance measurements were based on average run length
(ARL0, ARL1) and recognition accuracy.
Figure 2.5 : Ensemble-ANN (Yu and Xi, 2009)
21
2.7 Artificial Neural Network (ANN)
Artificial Neural Networks (ANN) now is widely used in many fields. It is
become well established and viable. In quality control engineering field, it becomes
well known as many researchers today has utilize the ANN in their research project.
ANN has been applied to statistical process control (SPC) since late 1980s. One of
the main reasons for the application of ANN to SPC is to automate the SPC charts
interpretation. The proposed ANN will act as an automatic decision making in SPC
towards replacing the human interpretation. The aim is to diagnose the source of
variation with minimum human intervention. Control chart pattern recognition
(CCPR) has become an active area of research since late 1980s. Zorriassatine and
Tannock (1998) has provided a useful review on the application of ANN for CCPR.
Around late 1980s also and early in the 1990s, the application of ANN has started to
replace the rule based expert system in recognition and interpretation of univariate
control chart patterns (CCP). This has extend to the further investigation on ANN
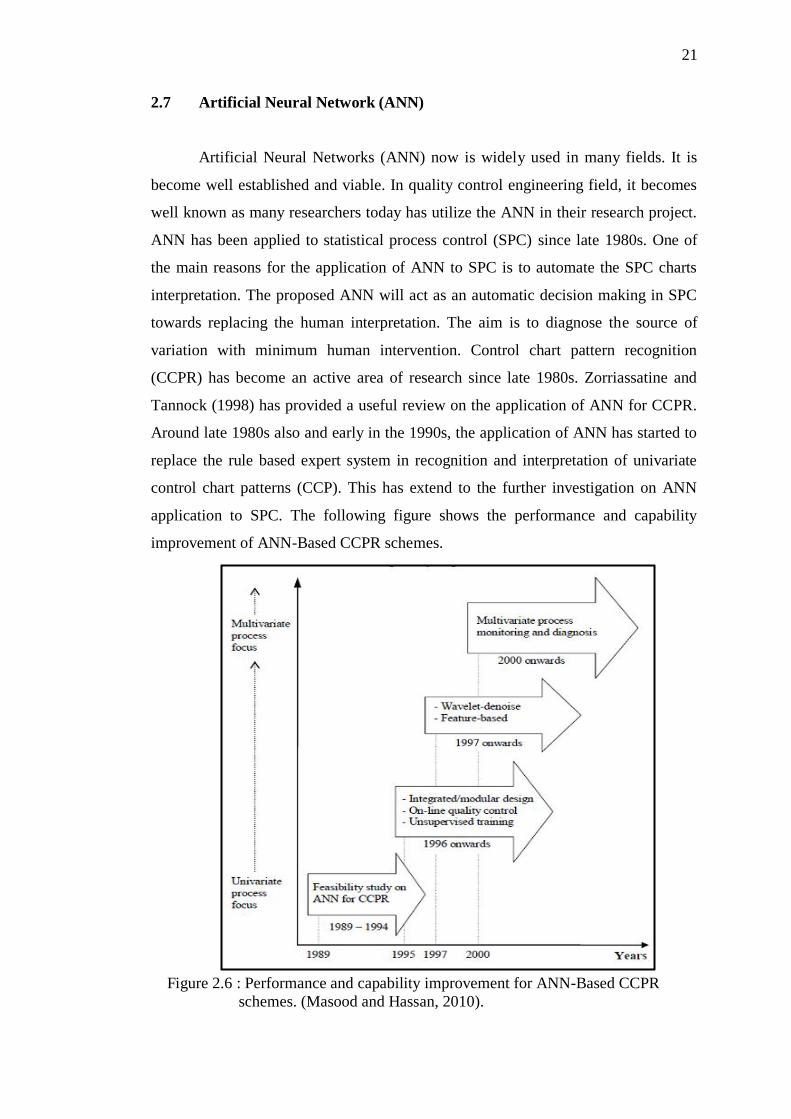
application to SPC. The following figure shows the performance and capability
improvement of ANN-Based CCPR schemes.
Figure 2.6 : Performance and capability improvement for ANN-Based CCPR
schemes. (Masood and Hassan, 2010).

22
2.8 Monitoring Bivariate Process Variation
In manufacturing industries, an appropriate SPC charting scheme is necessary
when the quality feature of the product involves two correlated variables also as
known as bivariate. It is important to monitor and diagnose these variables jointly.
Monitoring process can be describe as an identification of process condition either in
a statistically in-control or out-of-control, while diagnosis process is refers to the
identification of the source variables for out-of-control condition.
The existing MSPC charting schemes such as Hotelling T2 (1947),
multivariate cumulative sum (MCUSUM) (Crosier, 1988), and multivariate
exponentially weighted moving average (MEWMA) (Lowry et., al 1992; Prabhu and
Runger 1997) are known to be effective in monitoring aspect. However, these MSPC
unable to provide diagnosis information which is greatly useful for a quality
practitioner in finding the root cause error and solution for corrective action. When
involving two or more dependent variables, it should be monitored and diagnosed
simultaneously. This method is known as multivariate quality control (MQC)
(Montgomery, 2009). Simultaneous monitoring and diagnosed method is capable to
detect the unusual sample with respect to the other sample according to the joint
control region. Another one is the approach based on different Shewhart control chart
which is independent monitoring approach that is nearly impossible to detect an
assignable cause in the presence of bivariate correlated sample (Montgomery, 2009).

23
Figure 2.7 : Independent monitoring (Montgomery, 2009)
Generally, bivariate process is the simplest case in multivariate quality control when
only two variables are being monitored dependently.
Figure 2.8 : Joint monitoring (Montgomery, 2009).
24
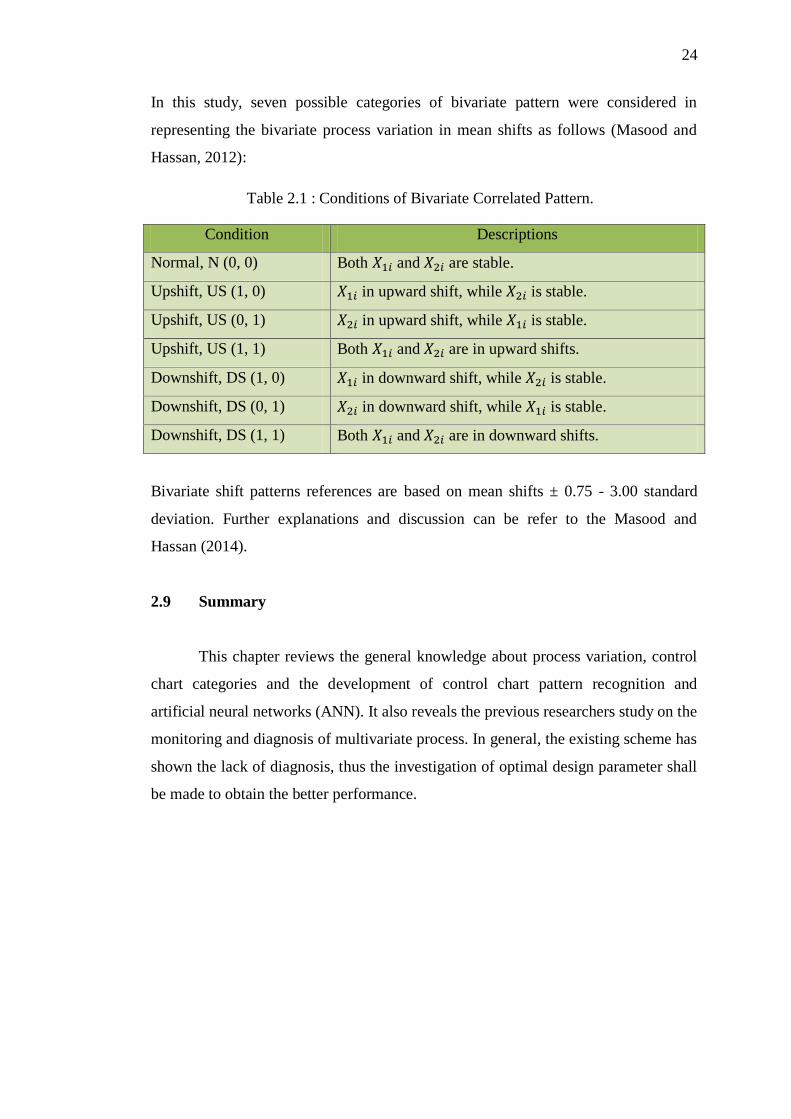
In this study, seven possible categories of bivariate pattern were considered in
representing the bivariate process variation in mean shifts as follows (Masood and
Hassan, 2012):
Table 2.1 : Conditions of Bivariate Correlated Pattern.
Bivariate shift patterns references are based on mean shifts ± 0.75 - 3.00 standard
deviation. Further explanations and discussion can be refer to the Masood and
Hassan (2014).
2.9 Summary
This chapter reviews the general knowledge about process variation, control
chart categories and the development of control chart pattern recognition and
artificial neural networks (ANN). It also reveals the previous researchers study on the
monitoring and diagnosis of multivariate process. In general, the existing scheme has
shown the lack of diagnosis, thus the investigation of optimal design parameter shall
be made to obtain the better performance.
Condition Descriptions
Normal, N (0, 0) Both and are stable.
Upshift, US (1, 0) in upward shift, while is stable.
Upshift, US (0, 1) in upward shift, while is stable.
Upshift, US (1, 1) Both and are in upward shifts.
Downshift, DS (1, 0) in downward shift, while is stable.
Downshift, DS (0, 1) in downward shift, while is stable.
Downshift, DS (1, 1) Both and are in downward shifts.
REFERENCES
Al-Assaf, Y. (2004). “Recognition of Control Chart Patterns Using Multi-Resolution
Wavelets Analysis and Neural Networks.” Computers and Industrial Engineering.
Vol. 47. pp. 17 − 29.
Assaleh, K. and Al-Assaf, Y. (2005). “Features Extraction and Analysis for
Classifying Causable Patterns in Control Charts.” Computers and Industrial
Engineering. Vol. 49. pp. 168 − 181.
Chen, L. H. and Wang, T. Y. (2004). “Artificial Neural Networks to Classify Mean
Shifts from Multivariate χ2
Chart Signals.” Computers and Industrial Engineering.
Vol. 47. pp. 195 − 205.
Cheng, C. S. (1995). “A Multi-Layer Neural Network Model for Detecting Changes
in The Process Mean.” Computers and Industrial Engineering. Vol. 28 No. 1. pp. 51
− 61.
Cheng, C. S. (1997). “A Neural Network Approach for the Analysis of Control Chart
Patterns.” International Journal of Production Research. Vol. 35 No. 3. pp. 667 −
697.
Crosier, R. B. (1988). Multivariate generalizations of cumulative sum quality-control
schemes. Technometrics, 30(3), 291-303.
58
El-Midany, T. T., El-Baz, M. A. and Abd-Elwahed, M. S. (2010). “A Proposed
Framework for Control Chart Pattern Recognition in Multivariate Process Using
Artificial Neural Networks.” Expert Systems with Applications. Vol. 37. pp. 1035 −
1042.
Gauri, S. K. and Chakraborty, S. (2006). “Feature-Based Recognition of Control
Chart Patterns.” Computers and Industrial Engineering. Vol. 51. pp. 726 − 742.
Gauri, S. K. and Chakraborty, S. (2008). “Improved Recognition of Control Chart
Patterns Using Artificial Neural Networks.” International Journal of Advanced
Manufacturing Technology. Vol. 36. pp. 1191 − 1201.
Guh, R. S., Tannock, J. D. T., & O'Brien, C. (1999a). IntelliSPC: a hybrid intelligent
tool for on-line economical statistical process control. Expert Systems with
Applications, 17(3), 195-212.
Guh, R. S., Zorriassatine, F., Tannock, J. D. T. and O’Brien, C. (1999b). “On-Line
Control Chart Pattern Detection and Discrimination - A Neural Network Approach.”
Artificial Intelligence in Engineering. Vol. 13. pp. 413 − 425.
Guh, R. S. and Tannock, J. D. T. (1999). “Recognition of Control Chart Concurrent
Patterns Using a Neural Network Approach.” International Journal of Production
Research. Vol. 37 No. 8. pp. 1743 − 1765.
Guh, R. S. and Hsieh, Y. C. (1999). “A Neural Network Based Model for Abnormal
Pattern Recognition of Control Charts.” Computers and Industrial Engineering. Vol.
36. pp. 97 − 108.
Guh, R. S. (2007). “On-Line Identification and Quantification of Mean Shifts in
Bivariate Processes Using a Neural Network-Based Approach.” Quality and
Reliability Engineering International. Vol. 23. pp. 367 − 385.
Hassan, A., Nabi Baksh, M. S., Shaharoun, A. M. and Jamaludin, H. (2003).
“Improved SPC Chart Pattern Recognition Using Statistical Features.” International
Journal of Production Research. Vol. 41 No. 7. pp. 1587 − 1603.
Haykin S (1999) Neural networks: a comprehensive foundation. Prentice Hall, New
Jersey

59
Hotelling, H. H. (1947). Multivariate quality control. In C. Eisenhart, M. W. Hastay,
& W. A. Wallis (Eds.), Techniques of statistical analysis. New York: McGraw-Hill.
Hwang, H. B. and Hubele, N. F. (1993). “Back-Propagation Pattern Recognizers for
X-bar Control Charts: Methodology and Performance.” Computers and Industrial
Engineering. Vol. 24 No. 2. pp. 219 − 235.
Hwarng, H. B. (1997). “A Neural Network Approach to Identifying Cyclic
Behaviour on Control Charts: A Comparative Study.” International Journal of
Systems Science. Vol. 28 No. 1. pp. 99 − 112.
Ick Huh (2014) “Optimal Monitoring Methods for Univariate and Multivariate
EWMA Control Charts.” McMaster University: Ph.D. Thesis.
Lehman, R. S. (1977). “Computer Simulation and Modeling: An Introduction.”
London: Lawrence Erlbaum.
Lowry, C. A., Woodall, W. H., Champ, C. W. and Rigdon, S. E. (1992). “A
Multivariate Exponentially Weighted Moving Average Control Chart.”
Technometrics. Vol. 34. No 1. pp. 46 − 53.
Lucas, J. M. and Saccucci, M. S. (1990). “Exponentially Weighted Moving Average
Control Schemes: Properties and Enhancements.” Technometrics. Vol. 32. No. 1. pp.
1 − 29.
Masood. I. (2004) “SPC Charting Procedure for Monitoring of Small and Large
Shifts in Process Mean”. Universiti Teknologi Malaysia: Masters Thesis.
Masood, I., & Hassan, A. (2012). An Integrated MEWMA-ANN scheme towards
balanced monitoring and accurate diagnosis of bivariate process mean shifts.Journal
of King Saud University-Computer and Information Sciences, 24(2), 93-100.
Masood, I., & Hassan, A. (2014). Bivariate quality control using two-stage intelligent
monitoring scheme. Expert Systems with Applications, 41(16), 7579-7595.
Montgomery, D. C. (2009). Introduction to statistical quality control. John Wiley &
Sons.

60
Niaki, S. T. A. and Abbasi, B. (2005). “Fault Diagnosis in Multivariate Control
Charts Using Artificial Neural Networks.” Quality and Reliability Engineering
International. Vol. 21. pp. 825 − 840.
Perry M. B., Spoerre, J. K. and Velasco, T. (2001). “Control Chart Pattern
Recognition Using Back Propagation Artificial Neural Networks.” International
Journal of Production Research. Vol. 39 No. 15. pp. 3399 − 3418.
Pignatiello, J. J., & Runger, G. C. (1990). Comparisons of multivariate CUSUM
charts. Journal of quality technology, 22(3), 173-186.
Pham, D. T. and Oztemel, E. (1993). “Control Chart Pattern Recognition Using
Combinations of Multilayer Perceptrons and Learning Vector Quantization Neural
Networks.” Proc. Instn. Mech. Engrs. Vol. 207. pp. 113 − 118.
Prabhu, S. S. and Runger, G. C. (1997). “Designing a Multivariate EWMA Control
Chart.” Journal of Quality Technology. Vol. 29 No. 1. pp. 8 − 15.
Yu, J. B., Xi, L. F. and Zhou, X. J. (2009). “Identifying Source(s) of Out-of-Control
Signals in Multivariate Manufacturing Processes Using Selective Neural Network
Ensemble.” Engineering Applications of Artificial Intelligence. Vol. 22. pp. 141 −
152.
Yu, J. B. and Xi, L. F. (2009). “A Neural Network Ensemble-Based Model for On-
Line Monitoring and Diagnosis of Out-of-Control Signals in Multivariate
Manufacturing Processes.” Expert Systems with Applications. Vol. 36. pp. 909 − 921.
Zorriassatine, F., & Tannock, J. D. T. (1998). A review of neural networks for
statistical process control. Journal of intelligent manufacturing, 9(3), 209-224.
Zorriassatine, F., Tannock, J. D. T. and O’Brien, C (2003). “Using Novelty Detection
to Identify Abnormalities Caused by Mean Shifts in Bivariate Processes.” Computers
and Industrial Engineering. Vol. 44. pp. 385 − 408.