
Demand Forecasting - University of Readingblogs.reading.ac.uk/tsbe/files/2017/04/1.1_J_Caplin... ·...
64
Place your chosen image here. The four corners must just cover the arrow tips. For covers, the three pictures should be the same size and in a straight line. Demand Forecasting Jeremy Caplin Energy Forecasting Manager National Grid
Transcript of Demand Forecasting - University of Readingblogs.reading.ac.uk/tsbe/files/2017/04/1.1_J_Caplin... ·...

Place your chosen image here. The four corners must just cover the arrow tips. For covers, the three pictures should be the same size and in a straight line.
Demand Forecasting
Jeremy CaplinEnergy Forecasting ManagerNational Grid

Place your chosen image here. The four corners must just cover the arrow tips. For covers, the three pictures should be the same size and in a straight line.
National Grid Overview

3
Facts:
Total employees - 24,000
Largest UK utility
2nd largest US energy utility
FTSE 25 company
National Grid Overview50:50
Transmission
UKUS
Distribution
Electricity Gas

4
National Grid – UK – Electricity
Transmission
7,200 km overhead line 1500 km underground cable 336 substations

5
National Grid – US – Electricity
Transmission
14,355 km line169 km cable520 substations
Distribution andGeneration116,636 km circuit644 substations3.5 million customers50 generation plants

Electricity National Control Centre

TO
TO
TO/SO
GBSO
Owns, builds and maintains assets
Operates the system Provides customer interface
TO/SO Code to define interfaces such as outage planning and investment decisions
GBSO
Balances the GB System Configures the GB
Transmission System Operational planning Connection and Use of System
Agreements with Generators, Suppliers and Distribution companies
GB charging and billing
Electricity Operations - who is responsible for what?
Transmission Owner (TO)
System Operator (SO)
OFFTO’s

System Operator – Two key roles
Managing electricity flows across the networks
Balancing the generation and demand

Demand Generation forced outages / trips Transmission circuit faults Market participants positions Weather events
Whilst ensuring Security Equipment ratings Voltage and frequency tolerance Cost minimisation
Managing uncertainties

Outage Planning and Co-ordination
System not geographically balanced for generation and demand.
Bottle-necks arise that requires power flow to be “constrained”.
Solutions include demand transfers, intertripping, re-switching, QB tapping etc.
2200MW
6000MW
7000MW
11000MW

Place your chosen image here. The four corners must just cover the arrow tips. For covers, the three pictures should be the same size and in a straight line.
Energy Forecasting

Energy Forecasting

National Demand
Unmetered Generation
What is Demand

National Demand suppressed by unmetered generation
20000
25000
30000
35000
40000
45000
0
5000
10000
15000
20000
25000
embedded wind Embedded solar 20150413 Demand 20150413 Virtual Demand

15
National Demand: min by min fluctuations

What Affects National Demand?
Time of Year
Time of Day
Day of Week
Weather
Unmetered Generation
Bank Holidays
School Holidays
TV
Special Events
Reaction to power price
Connection charge minimisation

National Demand: time of year effect

National Demand: variability during a week (GMT)

National Demand: variability during a week (BST)

National Demand: variability during a week (BST)

Illumination
Dem
and
(MW
)
Dull: High Demand
Bright: Low Demand
The Impact of Weather: Illumination

Cold: High Demand
Hot: Quite High Demand
Temperature
Dem
and
(MW
)The Impact of Weather: Temperature
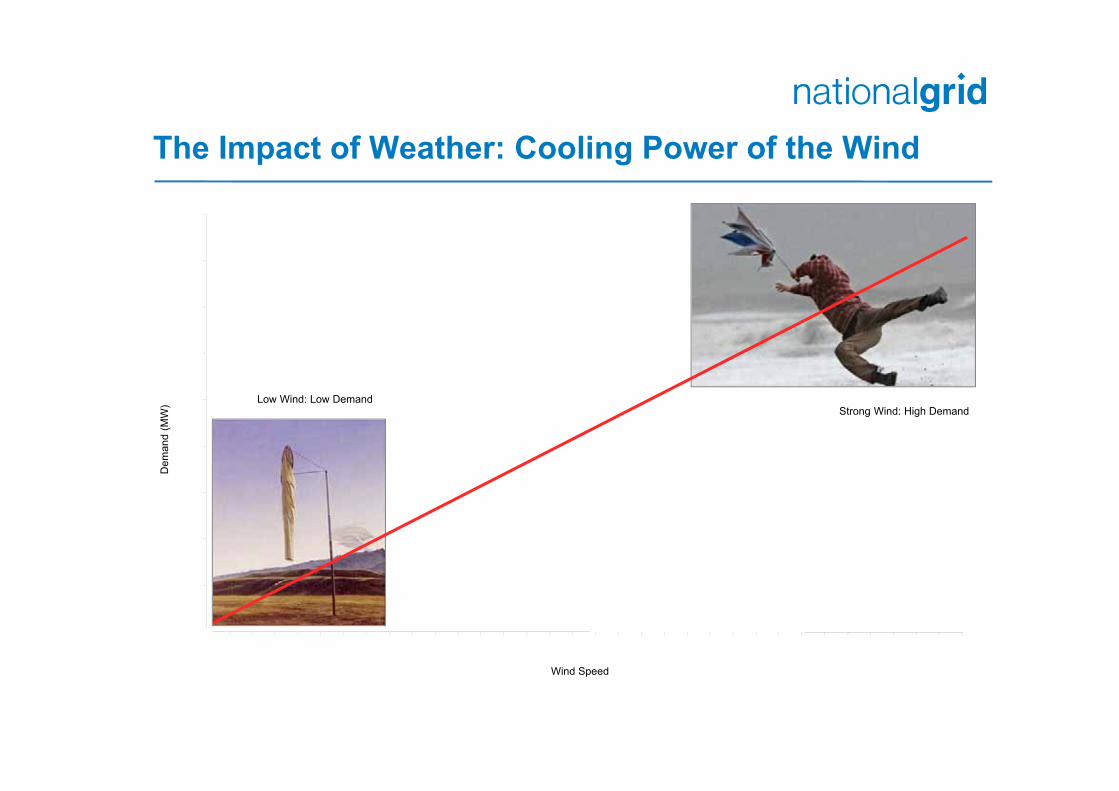
Strong Wind: High DemandLow Wind: Low Demand
Wind Speed
Dem
and
(MW
)The Impact of Weather: Cooling Power of the Wind

The Impact of Weather: Rain

25
Temperature(1°C fall in cold conditions)
Cloud cover(clear sky to thick cloud)
Precipitation(no rain to heavy rain)
Temperature(1°C rise in hot conditions)
+ 500 MW
+ 500 MW
+ 1,000 MW
+ 1,500 MW
Cooling power(10 mph rise in cold conditions) + 1,000 MW
The Impact of Weather Some Numbers
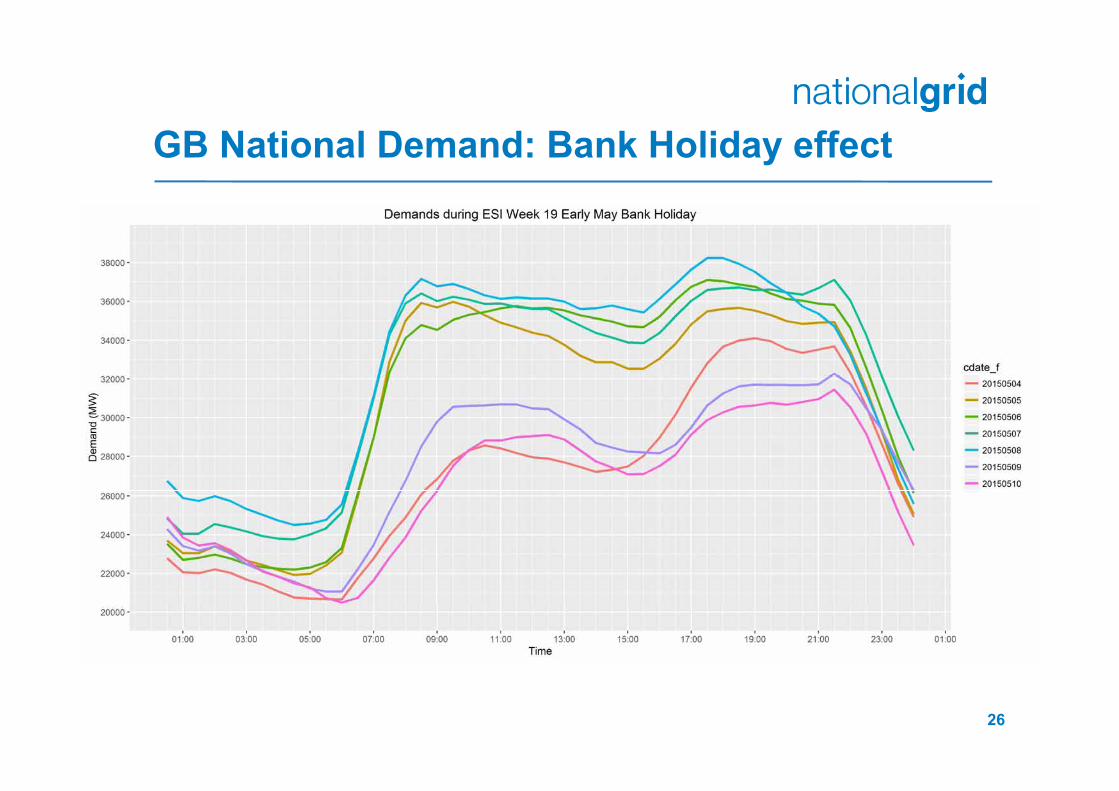
GB National Demand: Bank Holiday effect
26

GB National Demand: Xmas effect
27

GB National Demand: Triad avoidance / CDM
28
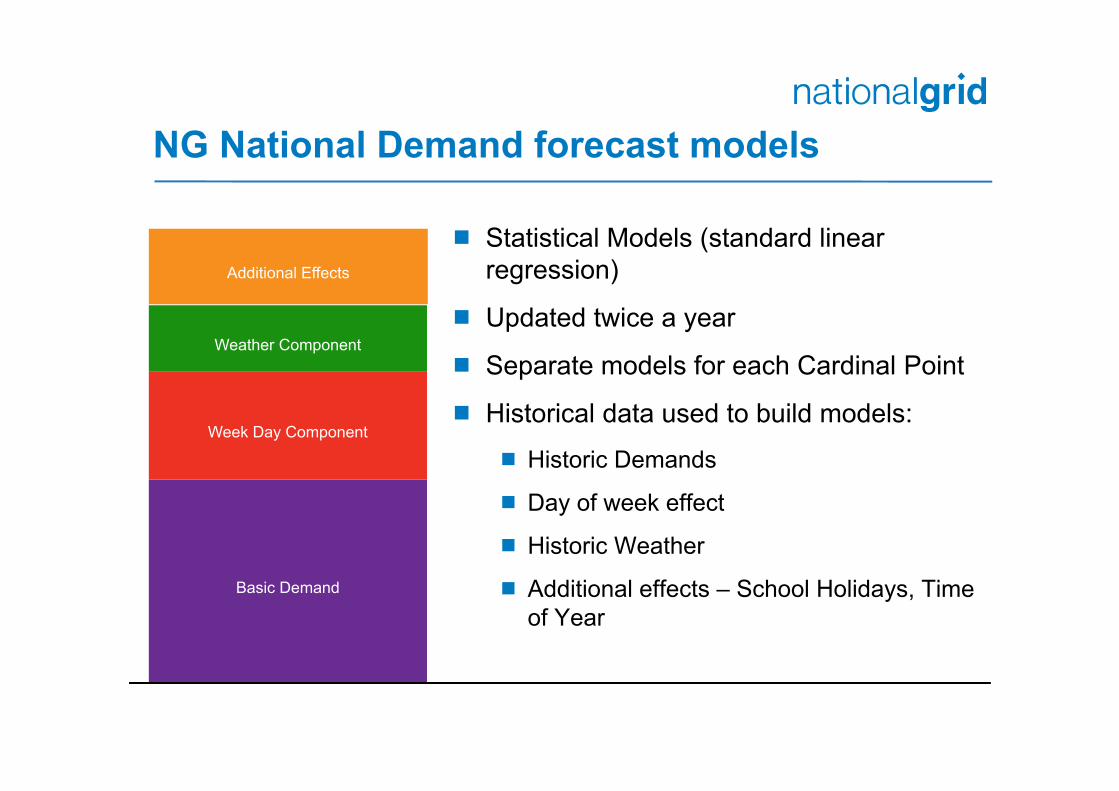
Statistical Models (standard linear regression)
Updated twice a year
Separate models for each Cardinal Point
Historical data used to build models: Historic Demands
Day of week effect
Historic Weather
Additional effects – School Holidays, Time of Year
Basic Demand
Week Day Component
Weather Component
NG National Demand forecast models
Additional Effects

Weather variables used in modelling
30
Weather variables used in Forecast Models represent
TemperatureTE and TO
IlluminationEI and related ID
Wind SpeedWS
Cooling Power of Wind (Chill Factor)CP

Met Office Forecast Data
31
Data source is Met Office
Forecast data for ~ 106 locations
Forecast arrives 4 times a day. Each forecast is for the next 14 days ahead and at hourly resolution
Weather variables that come through: temperature, solar radiation, wind speed and wind direction
Met Office weather files timestamps
Files processed & ready to use by Goal run weather file used for
GMT BSTYYYYMMDD 02:30 03:30 04:30 04:00, 09:00, Nominal (D+1)YYYYMMDD 08:30 09:30 10:30 12:00, BPS (D+1), Pre-Nom (D+2)YYYYMMDD 14:30 15:30 16:30 19:30YYYYMMDD 20:30 21:30 22:30 23:00

Met Office Forecast Data
32
Renewable generation calculations: the data for the nearest weather station to the generator is used
Weather station name Station code
Station number
Station weighting (% of Nat. Avg.)
Heathrow LN 772 28Bristol Filton BR 628 18
Birmingham C/H BM 535 16Hawarden MN 321 14Glasgow GW 134 10
Leconfield LF 382 7Leeming LM 257 7
Demand calculation: Forecast data for 7 main stations are used, weighted by population, to give National Average

Met Office Actual Data
33
We receive actual weather data for 45 Met Office weather stations Rest of the forecast stations are “Virtual MetMast” stations with no actual recorded
data Data is received for every hour
arrives at 30 minutes past the hour

GB National Demand: Cardinal Points

BST 2016 CP chart
W/Beginning 00:30 01:00 01:30 02:00 02:30 03:00 04:00 04:30 07:30 08:00 09:00 09:30 10:30 11:00 13:00 13:30 16:30 17:00 18:00 18:30 19:00 19:30 20:00 20:30 21:00 21:30 22:00 22:30 23:00 24:00
28-Mar-16
1F
1S 1A
04 1B 2F 2A 2B 3B
3C
4A 4B
4C
04-Apr-16 4A 4B11-Apr-1618-Apr-16
4A 4B25-Apr-1602-May-1609-May-16
4A 4B
16-May-1623-May-1630-May-1606-Jun-1613-Jun-16
1A
20-Jun-1627-Jun-1604-Jul-1611-Jul-1618-Jul-1625-Jul-16
01-Aug-1608-Aug-1615-Aug-16 4A 4B22-Aug-1629-Aug-16 4A 4B05-Sep-16
1S 1A 3C W/E F
12-Sep-16 4A 4B19-Sep-1626-Sep-16 4A 4B03-Oct-1610-Oct-16 4B17-Oct-16 4B24-Oct-16

Each Cardinal Point has a minimum of two forecast models: At least one conventional model
At least one trend model
Difference between conventional and trend models:
NG National Demand forecast models
CP Trend model trends on:
1F previous day 1F
1A previous day 1A
1B previous day 1B
2F in day 1B
2A in day 1B
2B in day 1B & in day 2A
3B in day 1B & in day 2A
3C / DP in day 1B & in day 2A
4B in day 1B & in day 2A
4C in day 1B & in day 2A
Basic Demand
Week Day Component
Weather Component
Additional Effects
Previous relevant demand that a trend model trends on
Trend models
Basic Demand
Week Day Component
Weather Component
Additional Effects
Conventional models

Example of the 3B statistical model equations for the conventional and trend models:
37
NG National Demand forecast models
3B conventional model
53501.31 + 633.29 * Y12 + 24.05 * R + -0.17 * R*R + -1211.94 * Fri + -6189.44 * Sat + -5772.22 * Sun + -702.67 * TE15_0 + -17.05 * (EI12_0 + EI15_0) + 48.32 * WS15_0
3B trend model trending on 1B in day demand
32803.04 + 0.71 * L1B_0 + -1108.77 * Tue + -1319.84 * (Wed + Thu) + -2326.37 * Fri + -6238.73 * Sat + -5023.05 * Sun + -274.39 * T015_0 + -23.78 * (EI12_0 + EI15_0) + 47.26 * WS15_0
3B trend model trending on 2A in day demand16004.87 + 0.74 * L2A_0 + -1079.74 * Fri + -2176.56 * Sat + -0.02 * R*R + -196.6 * T015_0 + -14.03 * (EI12_0 + EI15_0) + 57.34 * WS15_0

Place your chosen image here. The four corners must just cover the arrow tips. For covers, the three pictures should be the same size and in a straight line.
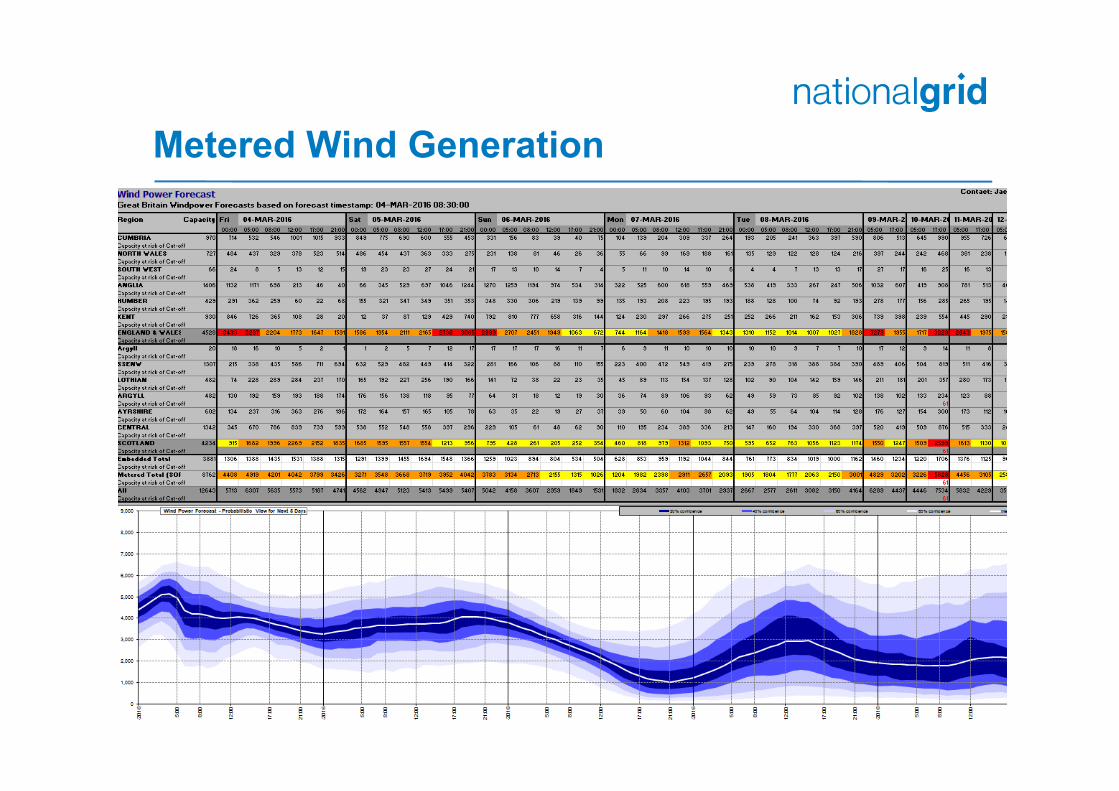
Wind Generation

Wind Power Forecasting- Feb 17- Metered Wind Capacity ~ 10,100 MW- Unmetered ~ 4,800 MW- Mar 16- Metered Wind Capacity ~ 9,200 MW- Unmetered ~ 4,200 MW
National Demand ForecastMetered Wind Power Forecast
Unmetered Wind FarmsMetered Wind Farms
Wind Generation

40
Load Curve Optimisation Using Actual Wind Speed Data
-0.2
0.0
0.2
0.4
0.6
0.8
1.0
1.2
0 5 10 15 20 25
Current Model Optimised Based on Actual WS

41-0.2
0.0
0.2
0.4
0.6
0.8
1.0
1.2
0 2 4 6 8 10 12 14 16 18 20
Current Model Optimised Based on Forecast WS
Load Curve Optimisation Using Forecast Wind Speed Data to Remove Bias

42
Alternative Load Curves
0.0
0.2
0.4
0.6
0.8
1.0
1.2
0 2 4 6 8 10 12 14 16 18 20
Current Model Optimised Based on Actual WS Optimised Based on Forecast WS
Metered Wind Generation
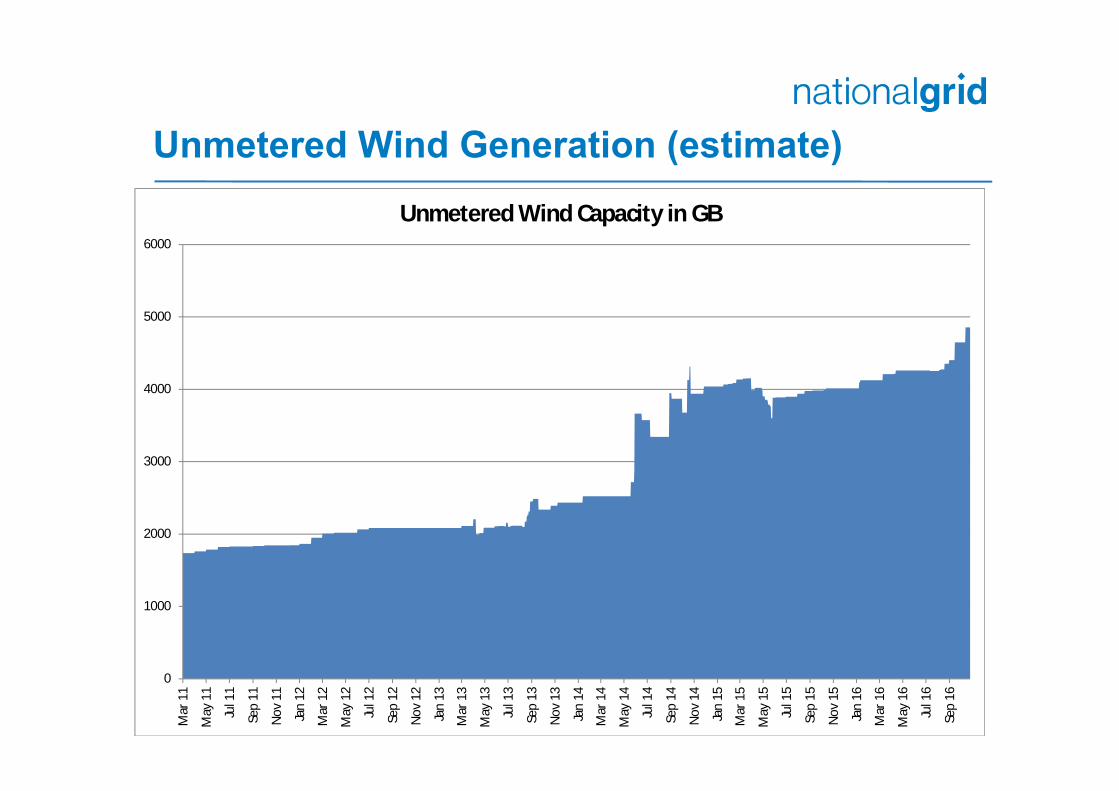
Unmetered Wind Generation (estimate)
0
1000
2000
3000
4000
5000
6000
Mar
11
May
11
Jul 1
1
Sep
11
Nov
11
Jan
12
Mar
12
May
12
Jul 1
2
Sep
12
Nov
12
Jan
13
Mar
13
May
13
Jul 1
3
Sep
13
Nov
13
Jan
14
Mar
14
May
14
Jul 1
4
Sep
14
Nov
14
Jan
15
Mar
15
May
15
Jul 1
5
Sep
15
Nov
15
Jan
16
Mar
16
May
16
Jul 1
6
Sep
16
Unmetered Wind Capacity in GB

Impact of PV
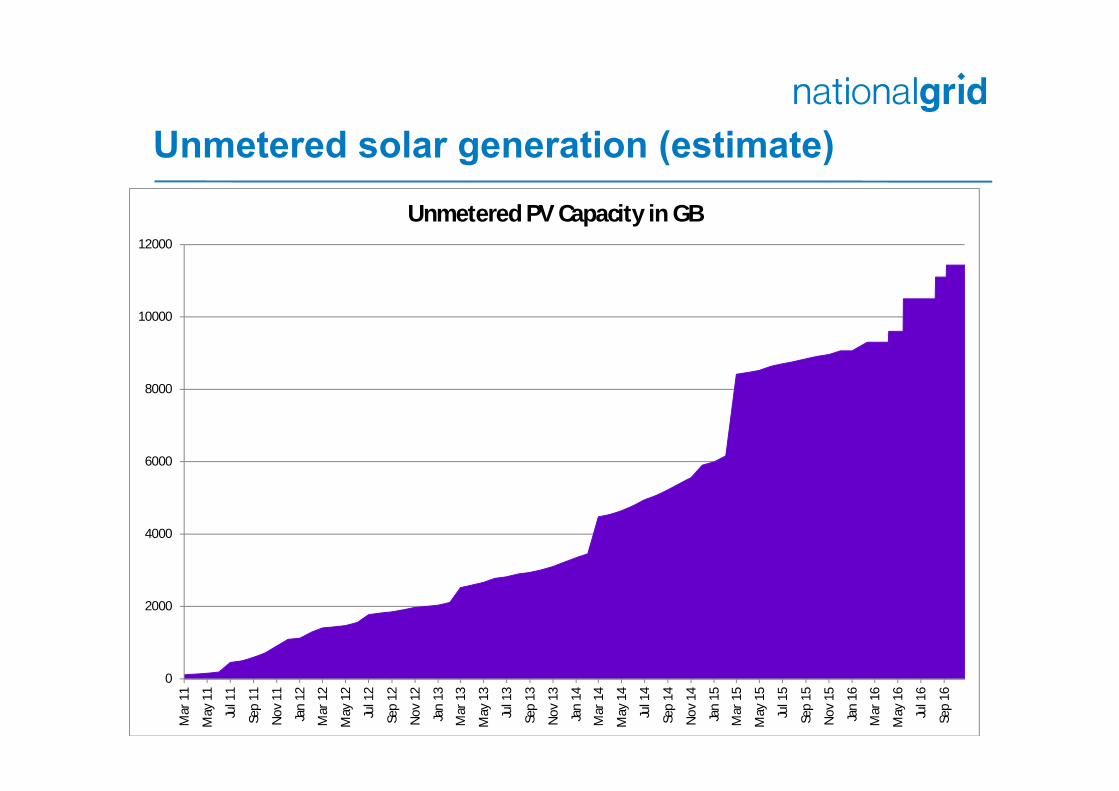
Unmetered solar generation (estimate)
0
2000
4000
6000
8000
10000
12000
Mar
11
May
11
Jul 1
1
Sep
11
Nov
11
Jan
12
Mar
12
May
12
Jul 1
2
Sep
12
Nov
12
Jan
13
Mar
13
May
13
Jul 1
3
Sep
13
Nov
13
Jan
14
Mar
14
May
14
Jul 1
4
Sep
14
Nov
14
Jan
15
Mar
15
May
15
Jul 1
5
Sep
15
Nov
15
Jan
16
Mar
16
May
16
Jul 1
6
Sep
16
Unmetered PV Capacity in GB

Location of individual PV sites
Increasing Volatility
Two consecutive Saturdays in June

Saturday 13 Jun 2015
0030
0200
0330
0500
0630
0800
0930
1100
1230
1400
1530
1700
1830
2000
2130
2300
Saturday 06 Jun 2015
18,000
20,000
22,000
24,000
26,000
28,000
30,000
32,000
34,000
36,000
38,000
0030
0200
0330
0500
0630
0800
0930
1100
1230
1400
1530
1700
1830
2000
2130
2300
Saturdays 06 and 13 Jun 2015
18,000
20,000
22,000
24,000
26,000
28,000
30,000
32,000
34,000
36,000
38,000
0030
0200
0330
0500
0630
0800
0930
1100
1230
1400
1530
1700
1830
2000
2130
2300
Difference between sunny and cloudy SaturdaysSaturday 6th June
Sunny
Windy
Saturday 13th June
Overcast
Still

Difference between sunny and cloudy SaturdaysSaturday 06 Jun 2015
18,000
20,000
22,000
24,000
26,000
28,000
30,000
32,000
34,000
36,000
38,000
0030
0200
0330
0500
0630
0800
0930
1100
1230
1400
1530
1700
1830
2000
2130
2300
Saturday 13 Jun 2015
0030
0200
0330
0500
0630
0800
0930
1100
1230
1400
1530
1700
1830
2000
2130
2300

Difference between sunny and cloudy SaturdaysSaturday 06 Jun 2015
18,000
20,000
22,000
24,000
26,000
28,000
30,000
32,000
34,000
36,000
38,000
0030
0200
0330
0500
0630
0800
0930
1100
1230
1400
1530
1700
1830
2000
2130
2300
Embedded Conventional Generation
Saturday 13 Jun 2015
0030
0200
0330
0500
0630
0800
0930
1100
1230
1400
1530
1700
1830
2000
2130
2300
Embedded Conventional Generation

Difference between sunny and cloudy SaturdaysSaturday 06 Jun 2015
18,000
20,000
22,000
24,000
26,000
28,000
30,000
32,000
34,000
36,000
38,000
0030
0200
0330
0500
0630
0800
0930
1100
1230
1400
1530
1700
1830
2000
2130
2300
Embedded Wind Generation Embedded Conventional Generation
Saturday 13 Jun 2015
0030
0200
0330
0500
0630
0800
0930
1100
1230
1400
1530
1700
1830
2000
2130
2300
Embedded Wind Generation Embedded Conventional Generation

Difference between sunny and cloudy SaturdaysSaturday 06 Jun 2015
18,000
20,000
22,000
24,000
26,000
28,000
30,000
32,000
34,000
36,000
38,000
0030
0200
0330
0500
0630
0800
0930
1100
1230
1400
1530
1700
1830
2000
2130
2300
Solar (PV) Generation Embedded Wind GenerationEmbedded Conventional Generation
Saturday 13 Jun 2015
0030
0200
0330
0500
0630
0800
0930
1100
1230
1400
1530
1700
1830
2000
2130
2300
Solar (PV) Generation Embedded Wind GenerationEmbedded Conventional Generation

Difference between sunny and cloudy SaturdaysSaturday 06 Jun 2015
18,000
20,000
22,000
24,000
26,000
28,000
30,000
32,000
34,000
36,000
38,000
0030
0200
0330
0500
0630
0800
0930
1100
1230
1400
1530
1700
1830
2000
2130
2300
Demand on Transmission System Solar (PV) GenerationEmbedded Wind Generation Embedded Conventional Generation
Saturday 13 Jun 2015
0030
0200
0330
0500
0630
0800
0930
1100
1230
1400
1530
1700
1830
2000
2130
2300
Demand on Transmission System Solar (PV) GenerationEmbedded Wind Generation Embedded Conventional Generation

Increasing Reliance on Weather Forecasts
Solar Radiation is hard to forecast
Physics of cloud formation highly complex
Some metrological conditions particularly challenging
Can see large errors – particularly when clouds form or clear unexpectedly
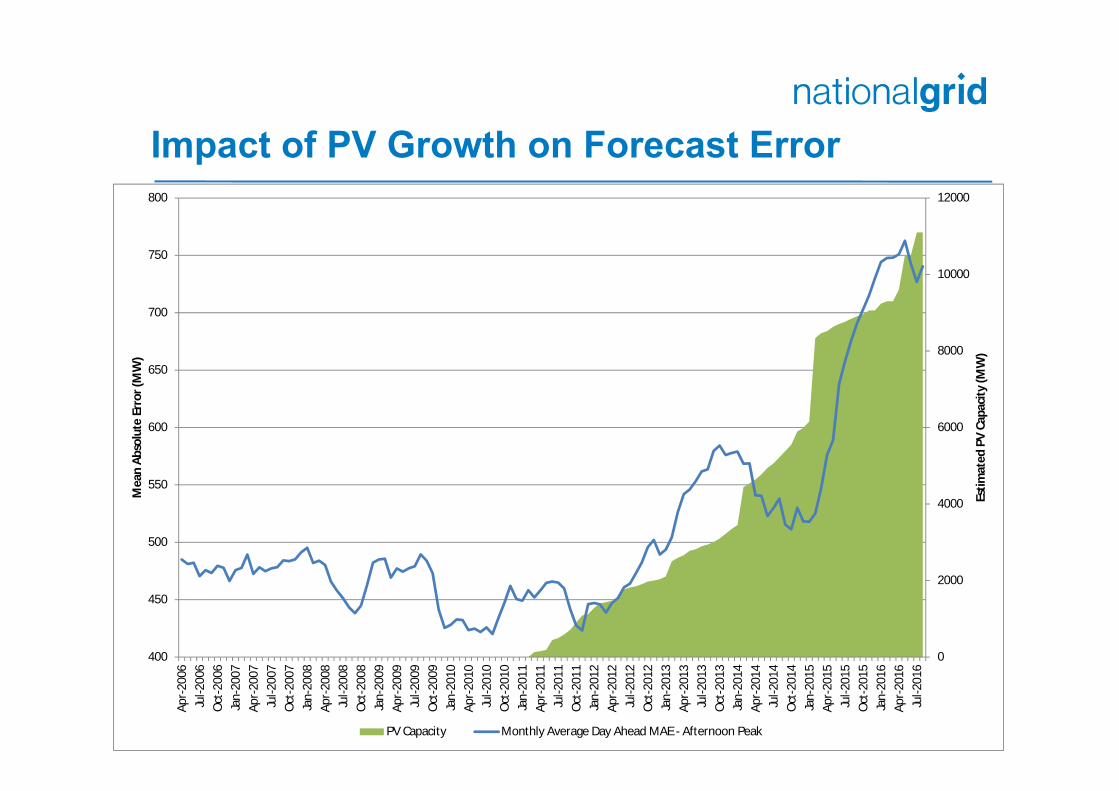
Impact of PV Growth on Forecast Error
0
2000
4000
6000
8000
10000
12000
400
450
500
550
600
650
700
750
800Ap
r-200
6Ju
l-200
6Oc
t-200
6Ja
n-20
07Ap
r-200
7Ju
l-200
7Oc
t-200
7Ja
n-20
08Ap
r-200
8Ju
l-200
8Oc
t-200
8Ja
n-20
09Ap
r-200
9Ju
l-200
9Oc
t-200
9Ja
n-20
10Ap
r-201
0Ju
l-201
0Oc
t-201
0Ja
n-20
11Ap
r-201
1Ju
l-201
1Oc
t-201
1Ja
n-20
12Ap
r-201
2Ju
l-201
2Oc
t-201
2Ja
n-20
13Ap
r-201
3Ju
l-201
3Oc
t-201
3Ja
n-20
14Ap
r-201
4Ju
l-201
4Oc
t-201
4Ja
n-20
15Ap
r-201
5Ju
l-201
5Oc
t-201
5Ja
n-20
16Ap
r-201
6Ju
l-201
6
Estim
ated
PV
Capa
city
(MW
)
Mea
n Ab
solu
te E
rror
(MW
)
PV Capacity Monthly Average Day Ahead MAE - Afternoon Peak

Impact of Solar Radiation Forecast
0
100
200
300
400
500
600
0700 0800 0900 1000 1100 1200 1300 1400 1500 1600 1700 1800 1900 2000 2100
Mea
n Ab
solu
te E
rror
(MW
)
Time of Day
Mean Absolute Error of Demand Forecast Caused by Error in Solar Radiation Forecast
0
100
200
300
400
500
600
0700 0800 0900 1000 1100 1200 1300 1400 1500 1600 1700 1800 1900 2000 2100
Mea
n Ab
solu
te E
rror
(MW
)
Time of Day
Mean Absolute Error of Demand Forecast Caused by Error in PV Generation Model

59
Effect of Solar Eclipse on Demand - 11 August 1999
33000
33500
34000
34500
35000
35500
36000
3650009
:00
09:1
0
09:2
0
09:3
0
09:4
0
09:5
0
10:0
0
10:1
0
10:2
0
10:3
0
10:4
0
10:5
0
11:0
0
11:1
0
11:2
0
11:3
0
11:4
0
11:5
0
12:0
0
12:1
0
12:2
0
12:3
0
12:4
0
12:5
0
13:0
0
Time
Dem
and
MW
Tue 10/08/1999Wed 11/08/1999
Start of the eclipse 2200MW dropin demand
Min @11:15
Totality
3000MWincrease indemand
Max @11:44
End of theeclipse

60
35000
36000
37000
38000
39000
40000
41000
42000
43000
44000
45000
07:0
0
07:1
0
07:2
0
07:3
0
07:4
0
07:5
0
08:0
0
08:1
0
08:2
0
08:3
0
08:4
0
08:5
0
09:0
0
09:1
0
09:2
0
09:3
0
09:4
0
09:5
0
10:0
0
10:1
0
10:2
0
10:3
0
10:4
0
10:5
0
11:0
0
Effect of Eclipse
Normal Day
Lost PV
People slow to turn lights offActual Demand
Demand Suppression as people go out to watch
Additional Lighting Load
Lost Embedded Wind

61
Effect of Embedded PV Demand at Indian QueensWednesday 8th April 2015
-50
0
50
100
150
200
250
300
30 130
230
330
430
530
630
730
830
930
1030
1130
1230
1330
1430
1530
1630
1730
1830
1930
2030
2130
2230
2330

62
How Good Are We – PV Forecast 21-28 Feb 17
0
1000
2000
3000
4000
5000
6000
0100
0700
1300
1900
0100
0700
1300
1900
0100
0700
1300
1900
0100
0700
1300
1900
0100
0700
1300
1900
0100
0700
1300
1900
0100
0700
1300
1900
PV Forecast Model with Actual Solar Radiation Forecast PV Generation Best View of Actual PV Generation
In Day 0830 PV

63
National Demand Forecast 21-28 Feb 17
20000
25000
30000
35000
40000
45000
50000
55000
0030
0630
1230
1830
0030
0630
1230
1830
0030
0630
1230
1830
0030
0630
1230
1830
0030
0630
1230
1830
0030
0630
1230
1830
0030
0630
1230
1830
In Day Forecast
Forecast Demand
Wed
Thu
Fri Sat
Sun
Mon
Tue

Current Energy Forecasting projects
Sheffield Solar in partnership with the University of Sheffield Better view of the live out-put of PV generation in GB
Met Office Improving the methodology of forecasting solar radiation
University of Reading Improve the conversion of solar RA into generated MW Provide historical time series of renewables load factor Investigate use of satellite and radar data to modify the solar RA forecast
Modelling Embedded Non-Weather Variable Generation Improved modelling of PV at substation level Improved Embedded Wind modelling Improved PV Power Curves Live display of estimated PV output in Control Room Short term PV forecast based on current observations New methods to estimate current PV capacity