chpt3 forecasting handout - csuohio.educis.csuohio.edu/~ichen/ch3.pdf3-31 Forecasting Other...
9
CHAPTER 3 Forecasting Homework Problems: # 2,3,4,8(a),22(a)(b),23,25,27 on pp. 125-131. 3-2 Forecasting • Forecast – a statement about the future value of a variable of interest • We make forecasts about such things as weather, demand, and resource availability, profits, costs, productivity, etc. • Forecasts are an important element in making informed decisions Forecast 3-3 Forecasting Accounting Cost/profit estimates Finance Cash flow and funding Human Resources Hiring/recruiting/training Marketing Pricing, promotion, strategy MIS IT/IS systems, services Operations Demand, Schedules, MRP, workloads Product/service design New products and services Uses of Forecasts 3-4 Forecasting Two Important Aspects of Forecasts • Expected level of demand • The level of demand may be a function of some structural variation (vs. random variation) such as trend or seasonal variation • Accuracy • Related to the potential size of forecast error 3-5 Forecasting Features Common to All Forecasts 1. Techniques assume some underlying causal system that existed in the past will persist into the future => 2. Forecasts are rarely perfect 3. Forecasts for groups of items are more accurate than those for individual items 4. Forecast accuracy decreases as the forecasting horizon increases e.g., ! 3-6 Forecasting Elements of a Good Forecast The forecast • should be timely • should be accurate • should be reliable • should be expressed in meaningful units (e.g., • should be in writing • technique should be simple to understand and use • should be cost effective
Transcript of chpt3 forecasting handout - csuohio.educis.csuohio.edu/~ichen/ch3.pdf3-31 Forecasting Other...
3-1 Forecasting
CHAPTER3
Forecasting
Homework Problems: # 2,3,4,8(a),22(a)(b),23,25,27 on pp. 125-131.
3-2 Forecasting
• Forecast – astatementaboutthefuturevalueofavariableofinterest• Wemakeforecastsaboutsuchthingsasweather,demand,andresourceavailability,profits,costs,productivity,etc.
• Forecastsareanimportantelementinmakinginformeddecisions
Forecast
3-3 Forecasting
Accounting Cost/profitestimates
Finance Cashflowandfunding
HumanResources Hiring/recruiting/training
Marketing Pricing,promotion,strategy
MIS IT/ISsystems,services
Operations Demand,Schedules,MRP,workloads
Product/servicedesign Newproductsandservices
Uses of Forecasts3-4 Forecasting
Two Important Aspects of Forecasts
• Expectedlevelofdemand• Thelevelofdemandmaybeafunctionofsomestructuralvariation (vs.randomvariation)suchastrendorseasonalvariation
• Accuracy• Relatedtothepotentialsizeofforecasterror
3-5 Forecasting
Features Common to All Forecasts1. Techniquesassumesomeunderlyingcausal system
thatexistedinthepastwillpersistintothefuture=>
2. Forecastsarerarelyperfect3. Forecastsforgroups ofitemsaremoreaccurate
thanthoseforindividualitems4. Forecastaccuracydecreasesastheforecasting
horizonincreasese.g.,
!
3-6 Forecasting
Elements of a Good Forecast
Theforecast• shouldbetimely• shouldbeaccurate• shouldbereliable• shouldbeexpressedinmeaningfulunits(e.g.,• shouldbeinwriting• techniqueshouldbesimpletounderstandanduse• shouldbecosteffective
3-7 Forecasting
Steps in the Forecasting Process
1. Determinethepurposeoftheforecast2. Establishatimehorizon3. Selectaforecastingtechnique4. Obtain,clean,andanalyzeappropriatedata5. Maketheforecast6. Monitortheforecast
3-8 Forecasting
Forecast Accuracy and Control
• Forecasterswanttominimizeforecasterrors• Itisnearlyimpossibletocorrectlyforecastreal-worldvariablevaluesonaregularbasis
• So,itisimportanttoprovideanindicationoftheextenttowhichtheforecastmightdeviatefromthevalueofthevariablethatactuallyoccurs
• Forecastaccuracyshouldbeanimportantforecastingtechniqueselection criterion
3-9 Forecasting
Types of Forecasts
• Judgmental - usessubjectiveinputs(e.g.,)
• Timeseries- useshistorical dataassumingthefuturewillbelikethepast
• Associativemodels- usesexplanatory variablestopredictthefuture
(e.g.,ISM/NAPMpurchasingmanagerindex,)
3-10 Forecasting
Forecast Accuracy and Control (contd.)
• Forecasterrorsshouldbemonitored• Error=Actual– Forecast• Iferrorsfallbeyondacceptablebounds,correctiveactionmaybenecessary
• UCL&LCL=?
3-11 Forecasting
ForecastAccuracyMetrics
MADmeasuresthemagnitudeofforecasterror
MSEweightserrorsaccordingtotheirsquaredvalues
MAPEweightserrorsrelativeto actualvalues
Bias(meanerror)measuresconsistentlyhighorlowforecast
3-12 Forecasting
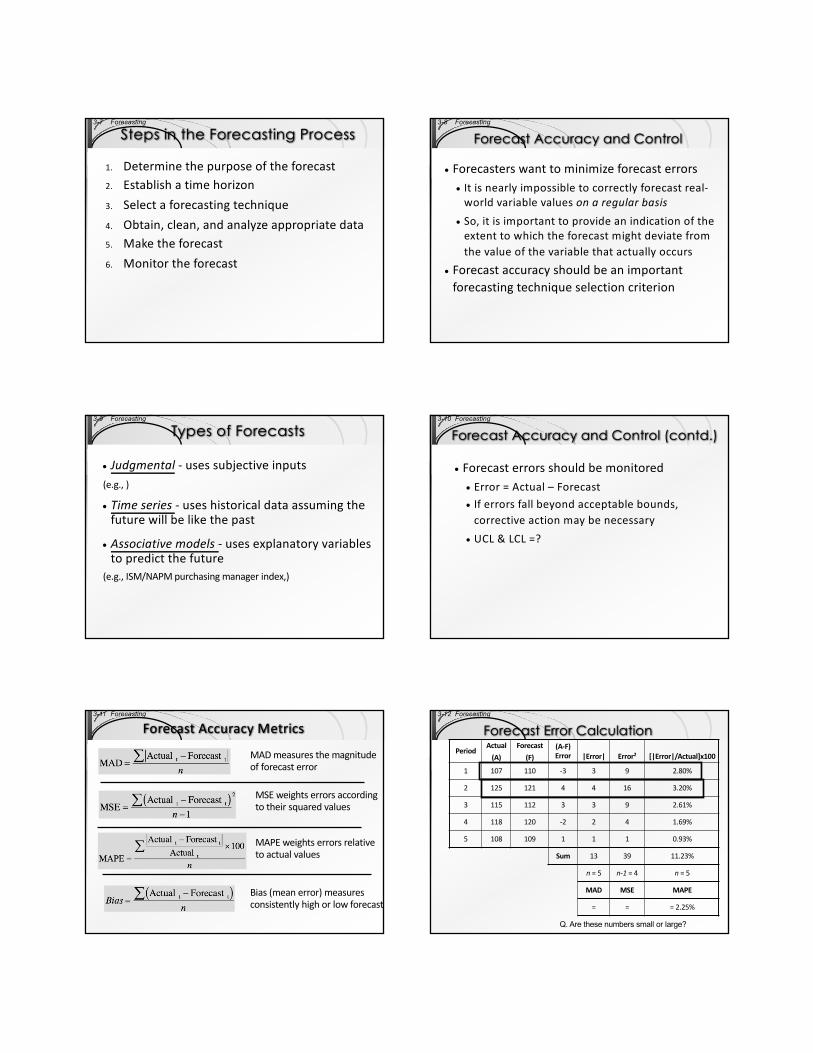
Forecast Error CalculationPeriod
Actual(A)
Forecast(F)
(A-F)Error |Error| Error2 [|Error|/Actual]x100
1 107 110 -3 3 9 2.80%
2 125 121 4 4 16 3.20%
3 115 112 3 3 9 2.61%
4 118 120 -2 2 4 1.69%
5 108 109 1 1 1 0.93%
Sum 13 39 11.23%
n=5 n-1=4 n=5
MAD MSE MAPE
= = =2.25%
Q. Are these numbers small or large?
3-13 Forecasting
Forecasting Approaches• QualitativeForecasting
• Qualitativetechniquespermittheinclusionofsoft informationsuchas:• Humanfactors• Personalopinions• Hunches
• Thesefactorsaredifficult,orimpossible,toquantify
• QuantitativeForecasting• Quantitativetechniquesinvolveeithertheprojectionofhistoricaldataorthedevelopmentofassociativemethodsthatattempttousecausalvariables tomakeaforecast
• Thesetechniquesrelyonhard data
3-14 Forecasting
Judgmental Forecasts
• Forecaststhatusesubjectiveinputssuchasopinionsfromconsumersurveys,salesstaff,managers,executives,andexperts• Executiveopinions• Salesforceopinions• Consumersurveys• Delphimethod
3-15 Forecasting
Time Series Forecasts
• Forecaststhatprojectpatterns identifiedinrecenttime-seriesobservations• Time-series:atime-orderedsequenceofobservationstakenatregular timeintervals
• Assumethatfuturevaluesofthetime-seriescanbeestimatedfrompastvaluesofthetime-series
3-16 Forecasting
Time Series Forecasts
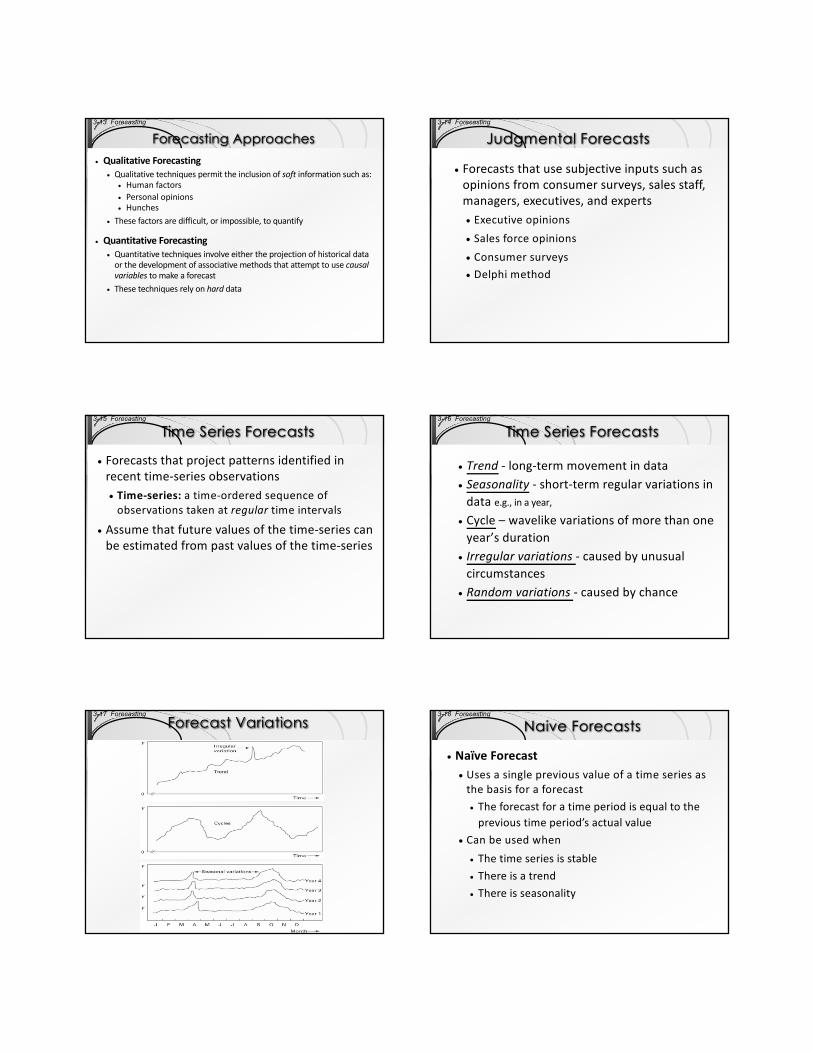
• Trend - long-termmovementindata• Seasonality - short-termregularvariationsindatae.g.,inayear,
• Cycle – wavelikevariationsofmorethanoneyear’sduration
• Irregularvariations- causedbyunusualcircumstances
• Randomvariations- causedbychance
3-17 Forecasting
Forecast Variations3-18 Forecasting
Naive Forecasts
• NaïveForecast• Usesasinglepreviousvalueofatimeseriesasthebasisforaforecast• Theforecastforatimeperiodisequaltotheprevioustimeperiod’sactual value
• Canbeusedwhen• Thetimeseriesisstable• Thereisatrend• Thereisseasonality
3-19 Forecasting
Time-Series Forecasting-- Averaging• TheseTechniquesworkbestwhenaseriestendstovaryaboutanaverage• Averagingtechniquessmoothvariationsinthedata• Theycanhandlestepchangesorgradualchangesinthelevelofaseries
• Techniques• Movingaverage• Weightedmovingaverage• Exponentialsmoothing
3-20 Forecasting
Moving Averages
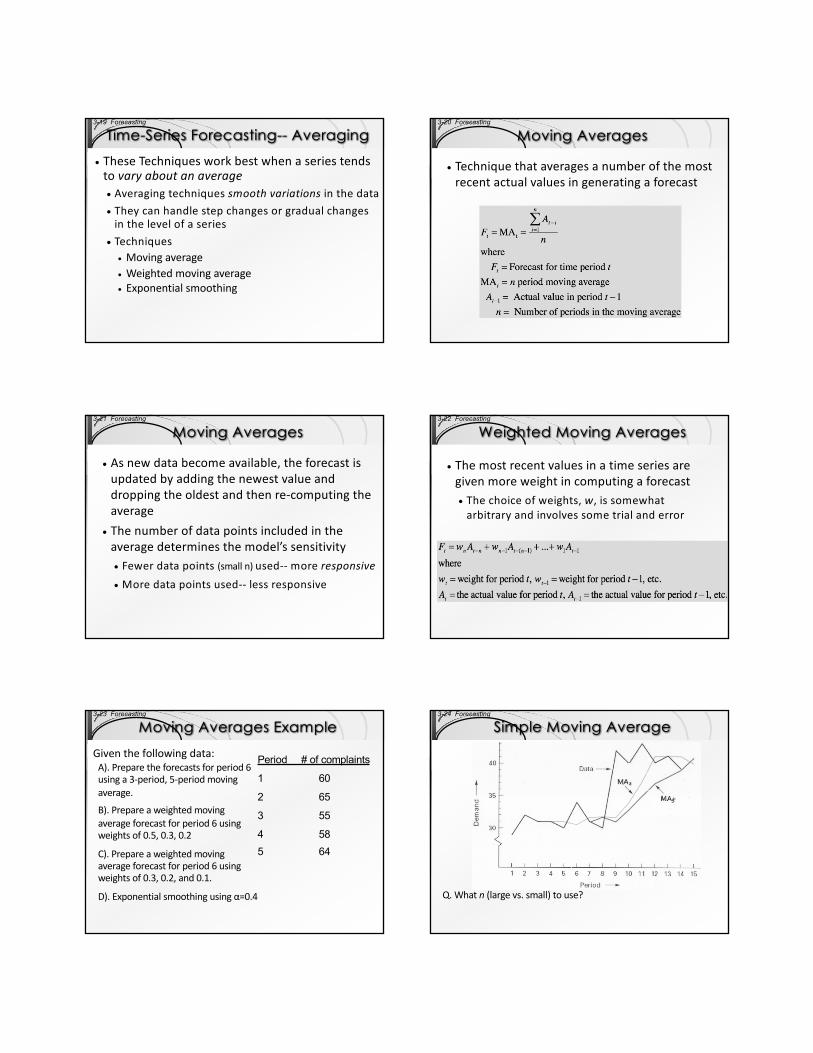
• Techniquethataveragesanumberofthemostrecent actualvaluesingeneratingaforecast
3-21 Forecasting
Moving Averages
• Asnewdatabecomeavailable,theforecastisupdatedbyaddingthenewestvalueanddroppingtheoldestandthenre-computingtheaverage
• Thenumberofdatapointsincludedintheaveragedeterminesthemodel’ssensitivity• Fewerdatapoints(smalln)used-- moreresponsive• Moredatapointsused-- lessresponsive
3-22 Forecasting
Weighted Moving Averages
• Themostrecent valuesinatimeseriesaregivenmoreweightincomputingaforecast• Thechoiceofweights,w,issomewhatarbitraryandinvolvessometrialanderror
3-23 Forecasting
Moving Averages ExampleGiventhefollowingdata: Period # of complaints
1 60
2 65
3 55
4 585 64
A).Preparetheforecastsforperiod6usinga3-period,5-periodmovingaverage.
B).Prepareaweightedmovingaverageforecastforperiod6usingweightsof0.5,0.3,0.2
C).Prepareaweightedmovingaverageforecastforperiod6usingweightsof0.3,0.2,and0.1.
D).Exponentialsmoothingusingα=0.4
3-24 Forecasting
Simple Moving Average
Q.Whatn (largevs.small)touse?
3-25 Forecasting
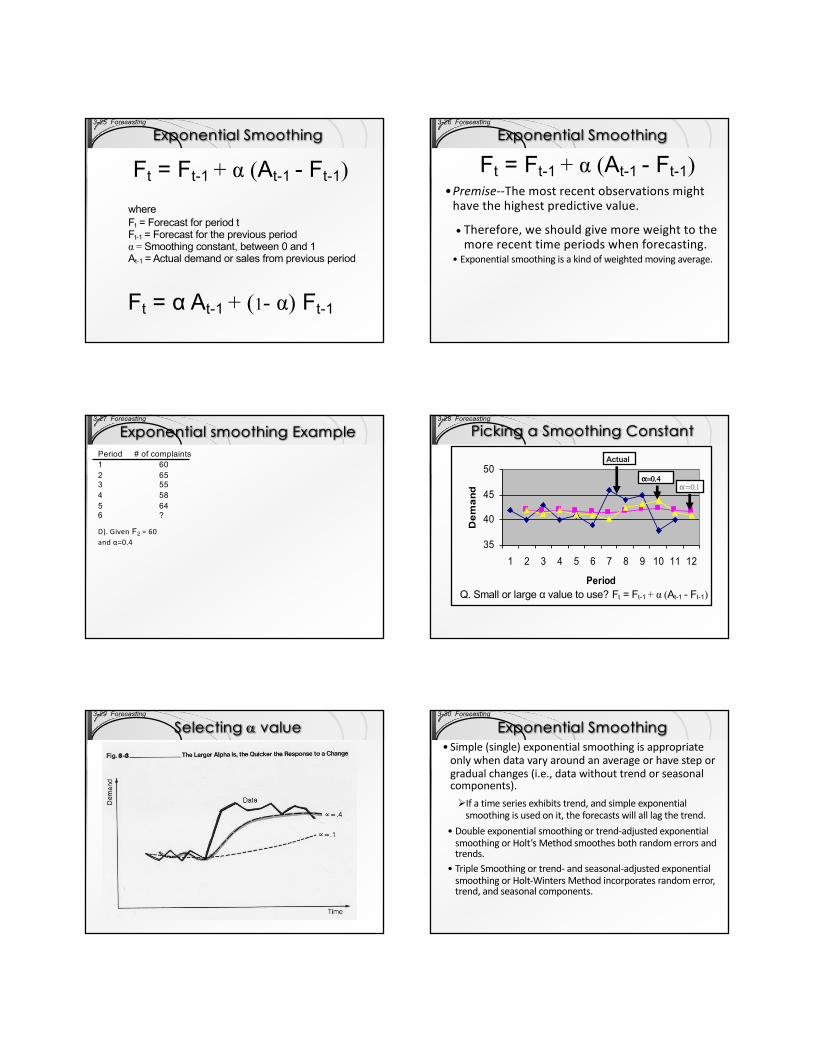
Exponential Smoothing
Ft = Ft-1 + α (At-1 - Ft-1)
Ft = α At-1 + (1- α) Ft-1
where Ft = Forecast for period tFt-1 = Forecast for the previous periodα = Smoothing constant, between 0 and 1At-1 = Actual demand or sales from previous period
3-26 Forecasting
Exponential Smoothing
•Premise--Themostrecentobservationsmighthavethehighestpredictivevalue.
• Therefore,weshouldgivemoreweighttothemorerecenttimeperiodswhenforecasting.
Ft = Ft-1 + α (At-1 - Ft-1)
• Exponentialsmoothingisakindofweightedmovingaverage.
3-27 Forecasting
Exponential smoothing ExamplePeriod # of complaints1 602 653 554 585 646 ?
D).Given F2 =60andα=0.4
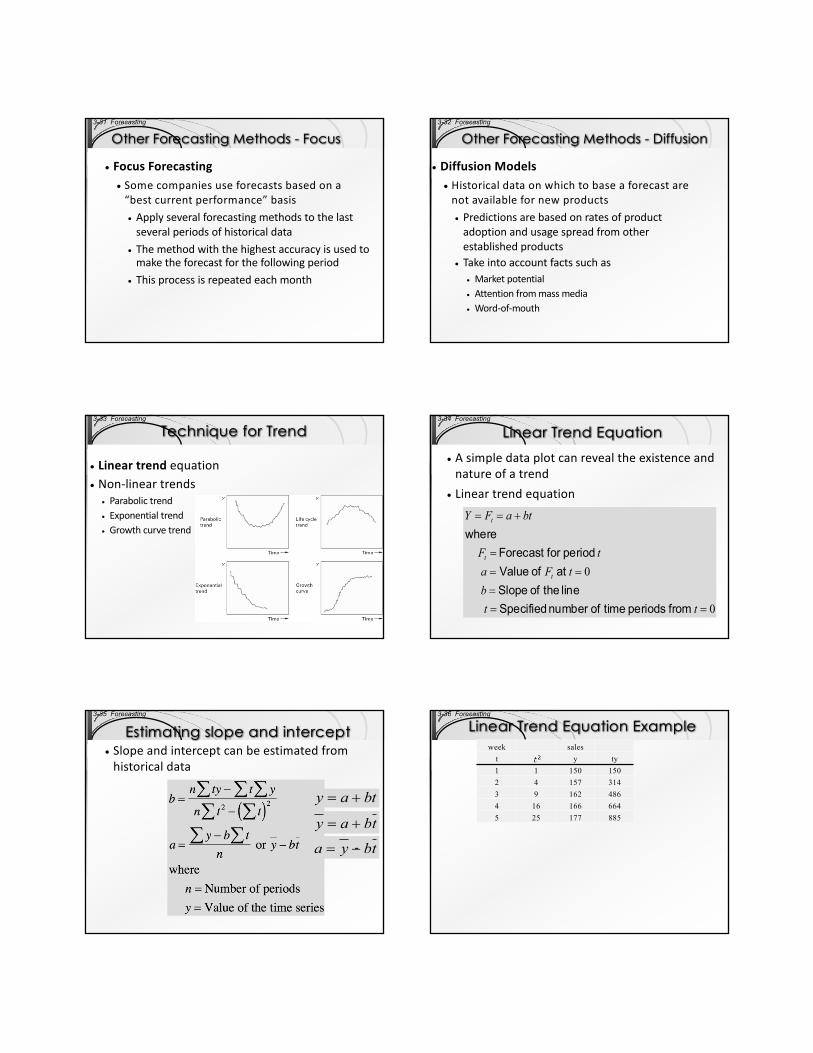
3-28 Forecasting
Picking a Smoothing Constant
35
40
45
50
1 2 3 4 5 6 7 8 9 10 11 12
Period
Demand α=0.1
α=0.4
Actual
Q. Small or large α value to use? Ft = Ft-1 + α (At-1 - Ft-1)
3-29 Forecasting
Selecting a value3-30 Forecasting
Exponential Smoothing• Simple(single)exponentialsmoothingisappropriateonlywhendatavaryaroundanaverageorhavesteporgradualchanges(i.e.,datawithouttrend orseasonalcomponents).ØIfatimeseriesexhibitstrend,andsimpleexponentialsmoothingisusedonit,theforecastswillalllagthetrend.
• Doubleexponentialsmoothingortrend-adjusted exponentialsmoothingorHolt’sMethodsmoothesbothrandomerrorsandtrends.
• TripleSmoothingortrend- andseasonal-adjustedexponentialsmoothingorHolt-Winters Methodincorporatesrandomerror,trend,andseasonalcomponents.
3-31 Forecasting
Other Forecasting Methods - Focus
• FocusForecasting• Somecompaniesuseforecastsbasedona“bestcurrentperformance”basis• Applyseveralforecastingmethodstothelastseveralperiodsofhistoricaldata
• Themethodwiththehighestaccuracyisusedtomaketheforecastforthefollowingperiod
• Thisprocessisrepeatedeachmonth
3-32 Forecasting
Other Forecasting Methods - Diffusion
• DiffusionModels• Historicaldataonwhichtobaseaforecastarenot availablefornewproducts• Predictionsarebasedonratesofproductadoptionandusagespreadfromotherestablishedproducts
• Takeintoaccountfactssuchas• Marketpotential• Attentionfrommassmedia• Word-of-mouth
3-33 Forecasting
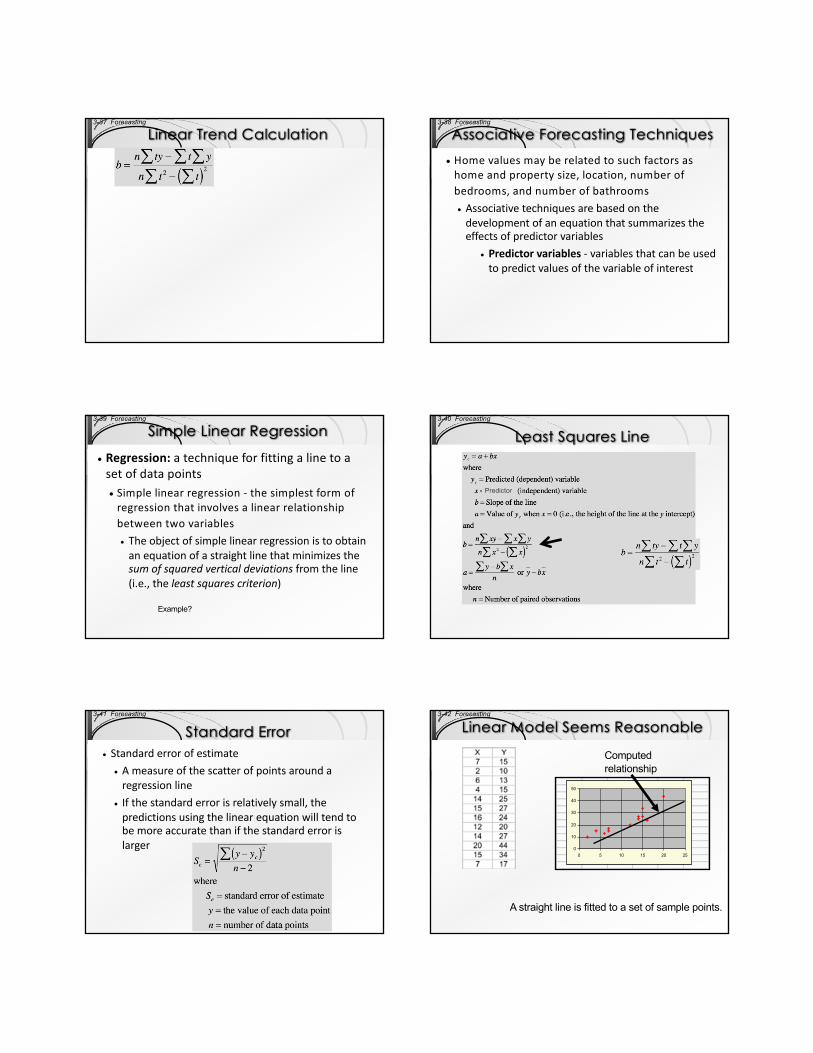
Technique for Trend
• Lineartrendequation• Non-lineartrends
• Parabolictrend• Exponentialtrend• Growthcurvetrend
3-34 Forecasting
Linear Trend Equation• Asimpledataplot canrevealtheexistenceandnatureofatrend
• Lineartrendequation
0
0
===
===
+==
ttb
tFatF
btaFY
t
t
t
from periods time of number Specified line the of Slope at of Value
period for Forecast where
3-35 Forecasting
Estimating slope and intercept• Slopeandinterceptcanbeestimatedfromhistoricaldata
btay +=
tbay +=
tbya -= -
3-36 Forecasting
Linear Trend Equation Exampleweek sales
t y ty1 1 150 1502 4 157 3143 9 162 4864 16 166 6645 25 177 885
3-37 Forecasting
Linear Trend Calculation3-38 Forecasting
Associative Forecasting Techniques• Homevaluesmayberelatedtosuchfactorsashomeandpropertysize,location,numberofbedrooms,andnumberofbathrooms• Associativetechniquesarebasedonthedevelopmentofanequationthatsummarizestheeffectsofpredictor variables
• Predictorvariables - variablesthatcanbeusedtopredictvaluesofthevariableofinterest
3-39 Forecasting
Simple Linear Regression
• Regression:atechniqueforfittingalinetoasetofdatapoints• Simplelinearregression- thesimplestformofregressionthatinvolvesalinearrelationshipbetweentwo variables• Theobjectofsimplelinearregressionistoobtainanequationofastraightlinethatminimizesthesumofsquaredverticaldeviationsfromtheline(i.e.,theleastsquarescriterion)
Example?
3-40 Forecasting
Least Squares Line
Predictor
3-41 Forecasting
Standard Error• Standarderrorofestimate
• Ameasureofthescatterofpointsaroundaregressionline
• Ifthestandarderrorisrelativelysmall,thepredictionsusingthelinearequationwilltendtobemoreaccuratethanifthestandarderrorislarger
3-42 Forecasting
Linear Model Seems Reasonable
A straight line is fitted to a set of sample points.
0
10
20
30
40
50
0 5 10 15 20 25
Computedrelationship
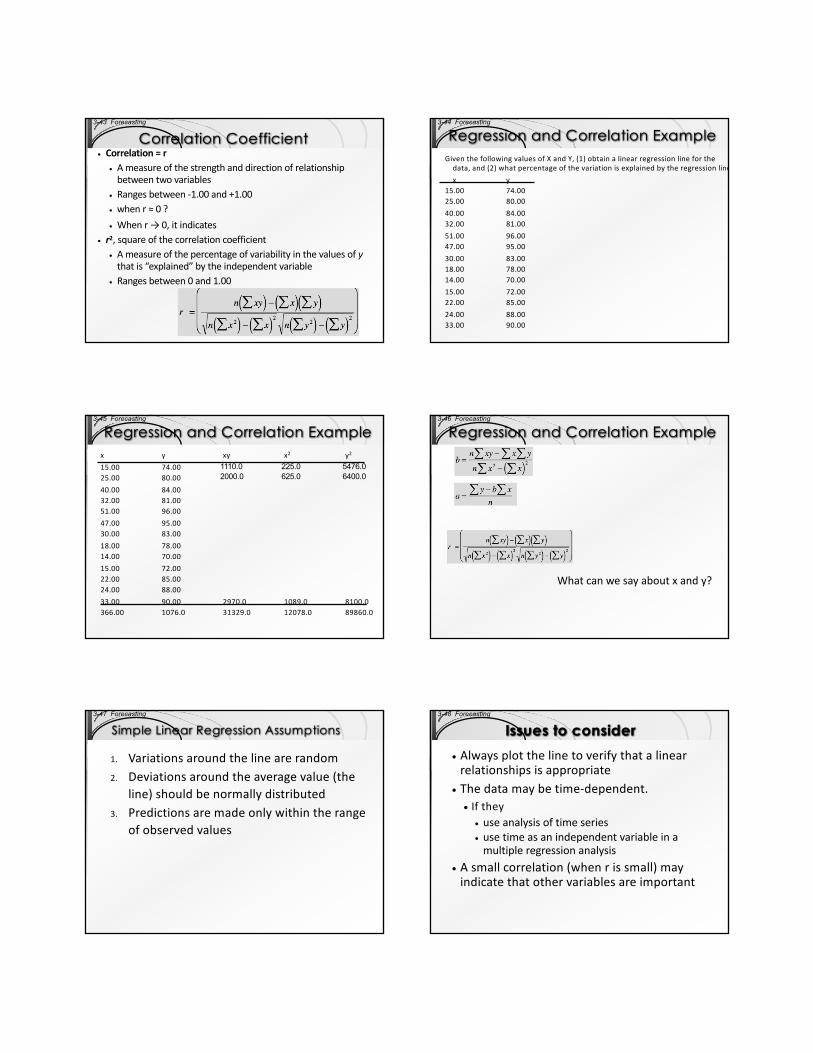
3-43 Forecasting
Correlation Coefficient• Correlation=r
• Ameasureofthestrength anddirection ofrelationshipbetweentwovariables
• Rangesbetween-1.00and+1.00• whenr≈0?• Whenr→0,itindicates
• r2,squareofthecorrelationcoefficient• Ameasureofthepercentageofvariabilityinthevaluesofythatis“explained”bytheindependentvariable
• Rangesbetween0and1.00
3-44 Forecasting
Regression and Correlation ExampleGiventhefollowingvaluesofXandY,(1)obtainalinearregressionlineforthedata,and(2)whatpercentageofthevariationisexplainedbytheregressionline?x y
15.00 74.0025.00 80.0040.00 84.0032.00 81.0051.00 96.0047.00 95.0030.00 83.0018.00 78.0014.00 70.0015.00 72.0022.00 85.0024.00 88.0033.00 90.00
3-45 Forecasting
Regression and Correlation Examplex y xy x2 y2
15.00 74.0025.00 80.0040.00 84.0032.00 81.0051.00 96.0047.00 95.0030.00 83.0018.00 78.0014.00 70.0015.00 72.0022.00 85.0024.00 88.0033.00 90.00 2970.0 1089.0 8100.0366.00 1076.0 31329.0 12078.0 89860.0
1110.0 225.0 5476.02000.0 625.0 6400.0
3-46 Forecasting
Regression and Correlation Example
Whatcanwesayaboutxandy?
3-47 Forecasting
Simple Linear Regression Assumptions
1. Variationsaroundthelinearerandom2. Deviationsaroundtheaveragevalue(the
line)shouldbenormallydistributed3. Predictionsaremadeonlywithintherange
ofobservedvalues
3-48 Forecasting
Issues to consider• Alwaysplot thelinetoverifythatalinearrelationshipsisappropriate
• Thedatamaybetime-dependent.• Ifthey
• useanalysisoftimeseries• usetimeasanindependentvariableinamultipleregressionanalysis
• Asmallcorrelation(whenrissmall)mayindicatethatothervariablesareimportant
3-49 Forecasting
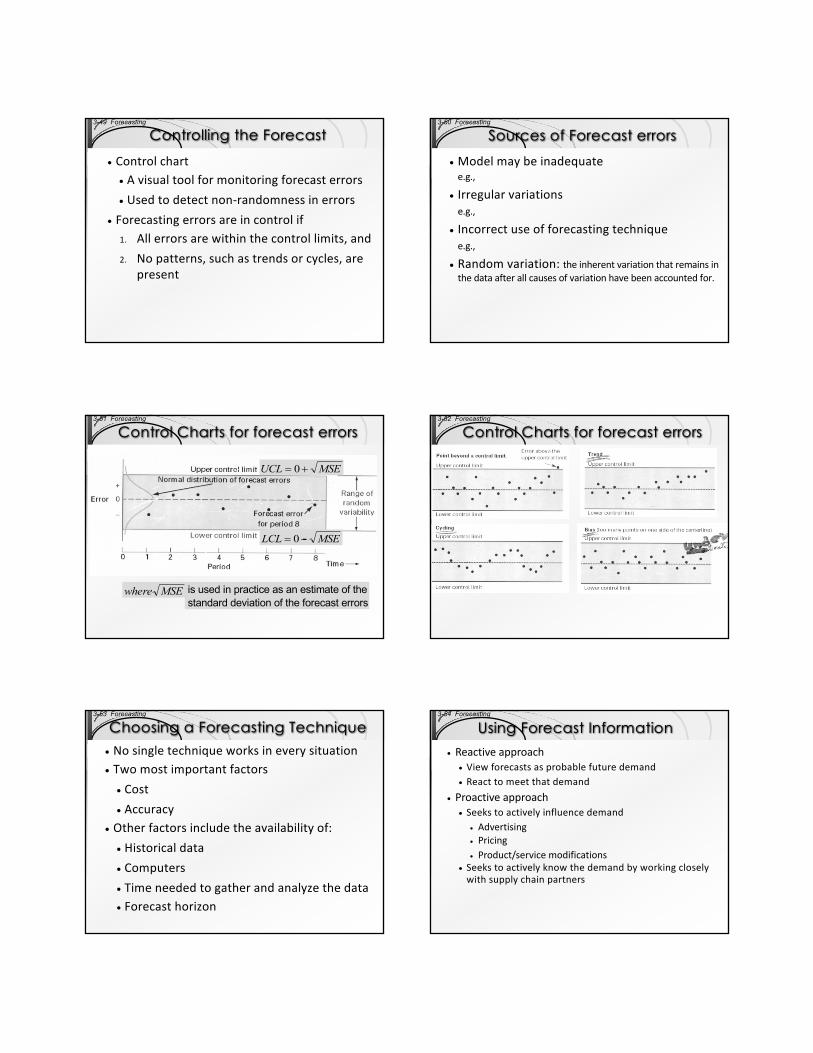
Controlling the Forecast
• Controlchart• Avisualtoolformonitoringforecasterrors• Usedtodetectnon-randomnessinerrors
• Forecastingerrorsareincontrolif1. Allerrorsarewithinthecontrollimits,and2. Nopatterns,suchastrendsorcycles,are
present
3-50 Forecasting
Sources of Forecast errors• Modelmaybeinadequatee.g.,
• Irregularvariationse.g.,
• Incorrectuseofforecastingtechniquee.g.,
• Randomvariation:theinherentvariationthatremainsinthedataafterallcausesofvariationhavebeenaccountedfor.
3-51 Forecasting
Control Charts for forecast errors
MSEUCL += 0
MSELCL -= 0
MSEwhere is used in practice as an estimate of the standard deviation of the forecast errors
-
3-52 Forecasting
Control Charts for forecast errors
3-53 Forecasting
Choosing a Forecasting Technique• Nosingletechniqueworksineverysituation• Twomostimportantfactors
• Cost• Accuracy
• Otherfactorsincludetheavailabilityof:• Historicaldata• Computers• Timeneededtogatherandanalyzethedata• Forecasthorizon
3-54 Forecasting
Using Forecast Information• Reactiveapproach
• Viewforecastsasprobablefuturedemand• Reacttomeetthatdemand
• Proactiveapproach• Seekstoactivelyinfluence demand
• Advertising• Pricing• Product/servicemodifications
• Seekstoactivelyknow thedemandbyworkingcloselywithsupplychainpartners


![[PPT]ERP Implementation - csuohio.educis.csuohio.edu/~ichen/413ch1A.pptx · Web viewImplementation Success/Failure ERP success/failure: 40% achieved partial implementation 60-90%](https://static.fdocuments.in/doc/165x107/5ab24bb77f8b9ad9788d2791/ppterp-implementation-ichen413ch1apptxweb-viewimplementation-successfailure.jpg)