Decarbonisation Strategy March TfN Board Transport for the ...
92
1 Decarbonisation Strategy – March TfN Board Transport for the North Contents Chapter 1 Introduction Chapter 2 TfN’s Decarbonisation Trajectory Chapter 3 Estimating current and future emissions Chapter 4 Decarbonisation Pathways Chapter 5 Policy analysis Chapter 6 Consideration of embodied carbon Chapter 7 Climate change adaptation and resilience Chapter 8 Stimulating Clean Growth in the North Chapter 9 TfN’s priority actions to 2025 Chapter 10 Internal assurance, monitoring and evaluation Annex A Detailed Policy Recommendations Appendix 1 Decarbonisation Modelling Methodology Acknowledgements This Strategy document has been informed by policy analysis support provided by Element Energy and Systra, as well as research undertaken on behalf of TfN by Arcadis, into opportunities to aid clean growth in the North. We would also like to extend our thanks to the DecarboN8 network and in particular Professor Greg Marsden of the Institute of Transport Studies at the University of Leeds for his general advice and his review of both the Strategy document and TfN’s No-Carb tool. Chapter 1 - Introduction The science is conclusive - the world is facing a climate emergency. In the UK, transport is the largest contributing sector to greenhouse gas emissions, accounting for 22% of all emissions in 2019 1 , of which more than 95% are from road transport. Furthermore, transport emissions have actually grown overall since 2013, despite modest falls in the last few years 2 . Whilst it is possible that 2020 figures will show a drop in emissions due to reduced levels of travel during the COVID-19 lockdown, this is likely to be temporary, with demand for car travel rebounding more quickly than public transport, approaching pre-pandemic levels. In our Strategic Transport Plan, published in 2019, Transport for the North (TfN) committed to scoping, developing and implementing a ‘Pathway to 2050’ in line with the then UK law of achieving an 80% reduction in national emissions by 2050 (now superseded by the current UK Government 1 This relates to surface transport and does not include emissions from aviation and shipping. 2 https://www.gov.uk/government/statistics/final-uk-greenhouse-gas-emissions-national-statistics-1990-to- 2019
Transcript of Decarbonisation Strategy March TfN Board Transport for the ...
1
Decarbonisation Strategy – March TfN Board
Transport for the North
Contents
Chapter 1 Introduction
Chapter 2 TfN’s Decarbonisation Trajectory
Chapter 3 Estimating current and future emissions
Chapter 4 Decarbonisation Pathways
Chapter 5 Policy analysis
Chapter 6 Consideration of embodied carbon Chapter 7 Climate change adaptation and resilience
Chapter 8 Stimulating Clean Growth in the North
Chapter 9 TfN’s priority actions to 2025
Chapter 10 Internal assurance, monitoring and evaluation Annex A Detailed Policy Recommendations
Appendix 1 Decarbonisation Modelling Methodology
Acknowledgements
This Strategy document has been informed by policy analysis support provided by Element Energy
and Systra, as well as research undertaken on behalf of TfN by Arcadis, into opportunities to aid
clean growth in the North.
We would also like to extend our thanks to the DecarboN8 network and in particular Professor Greg
Marsden of the Institute of Transport Studies at the University of Leeds for his general advice and his
review of both the Strategy document and TfN’s No-Carb tool.
Chapter 1 - Introduction
The science is conclusive - the world is facing a climate emergency.
In the UK, transport is the largest contributing sector to greenhouse gas emissions, accounting for
22% of all emissions in 20191, of which more than 95% are from road transport. Furthermore,
transport emissions have actually grown overall since 2013, despite modest falls in the last few
years2.
Whilst it is possible that 2020 figures will show a drop in emissions due to reduced levels of travel
during the COVID-19 lockdown, this is likely to be temporary, with demand for car travel rebounding
more quickly than public transport, approaching pre-pandemic levels.
In our Strategic Transport Plan, published in 2019, Transport for the North (TfN) committed to
scoping, developing and implementing a ‘Pathway to 2050’ in line with the then UK law of achieving
an 80% reduction in national emissions by 2050 (now superseded by the current UK Government
1 This relates to surface transport and does not include emissions from aviation and shipping. 2 https://www.gov.uk/government/statistics/final-uk-greenhouse-gas-emissions-national-statistics-1990-to-2019
2
commitment to achieve net zero emissions by 2050). For the surface transport sector, this meant
that road transport emissions would need to be near-zero and rail would need to be decarbonised
by 2050.
TfN and our partners believe that an acceleration towards a zero-carbon transport network must be
at the heart of public policy making and investment decisions. Our ambition for the North is to travel
faster and further than national policy and maximise the clean growth opportunities that
decarbonisation can provide for the North. Through this Decarbonisation Strategy, TfN and our
partners are committing to a regional near-zero carbon surface transport network by 2045.
The achievement of TfN’s vision of a thriving North of England, where world class transport supports
sustainable economic growth, excellent quality of life and improved opportunities for all, is
contingent on how we can reduce our greenhouse gas emissions across everything that we do, and
then, making the right decisions at the right time.
The Role of TfN
Through its statutory powers, TfN acts as ‘one voice’ for the North, communicating pan-Northern
priorities to the Secretary of State for Transport. We have a clear remit to identify the transport
infrastructure required to support transformational economic growth in the North, and to prioritise
that investment. This places TfN and partners in a strategic position to identify the transport
infrastructure and policy measures that are required to achieve the North’s decarbonisation
ambitions.
When prioritising transport infrastructure delivery in the region, TfN must make decisions based on
a knowledge of how those projects and programmes are likely to support or challenge the region’s
decarbonisation objectives. This Decarbonisation Strategy provides a tool to robustly consider how
our Investment Programme is performing in this respect. It will also provide guidance to support an
appropriate sequencing of those investments and the mitigation actions that may be needed to
deliver transformational economic growth in line with decarbonisation ambitions.
While most of the responsibility for policy implementation lies with national and local government,
TfN operates at a geographical and institutional level that allows us to facilitate a regional approach
to decarbonisation measures and research, for example, developing a pan-regional electric vehicle
charging infrastructure framework. Indeed, a high proportion of the emissions from private road
vehicles is generated by longer distance regional-level trips, with our analysis indicating that around
60% of road transport emissions in the North originate from trips on the Major Road Network. This
means TfN has both an opportunity and a responsibility to help reduce this significant share of road
transport emissions.
TfN is also uniquely placed to assist our partners in the development of place-based solutions by
analysing emissions at a more disaggregate level and providing enhanced evidence, data platforms
and intelligence to inform bespoke local and regional strategies. This can in turn support national
policies to take account of spatial and social variation.
At a project level, TfN has a responsibility to ensure that the design and construction of our projects
and programmes reduce lifecycle carbon and to encourage partners to adopt similarly ambitious
policies.
3
The North is also extremely well placed to support the testing and trialling of many emerging
technologies that will be crucial to transport decarbonisation in the UK, including through existing
initiatives such as the UK’s first Hydrogen Transport Hub in the Tees Valley, Zero Carbon Humber and
HyNet North West. Through partnerships and co-working with Local Authorities, Local Enterprise
Partnerships, transport providers and regional academic and industry players, TfN is committed to
promoting the North as hub for innovation, research and the testing of emerging technologies.
(STP INNOVATION DIAGRAM HERE)
Finally, TfN needs to lead by example. Whilst the focus of this strategy is upon understanding,
measuring and reducing the emissions from surface transport in the North and the construction and
operation of the proposed schemes within our Investment Programme; it is important that we look
to reduce the emissions resulting from TfN directly as a result of our everyday business. These are
called our ‘organisational emissions’.
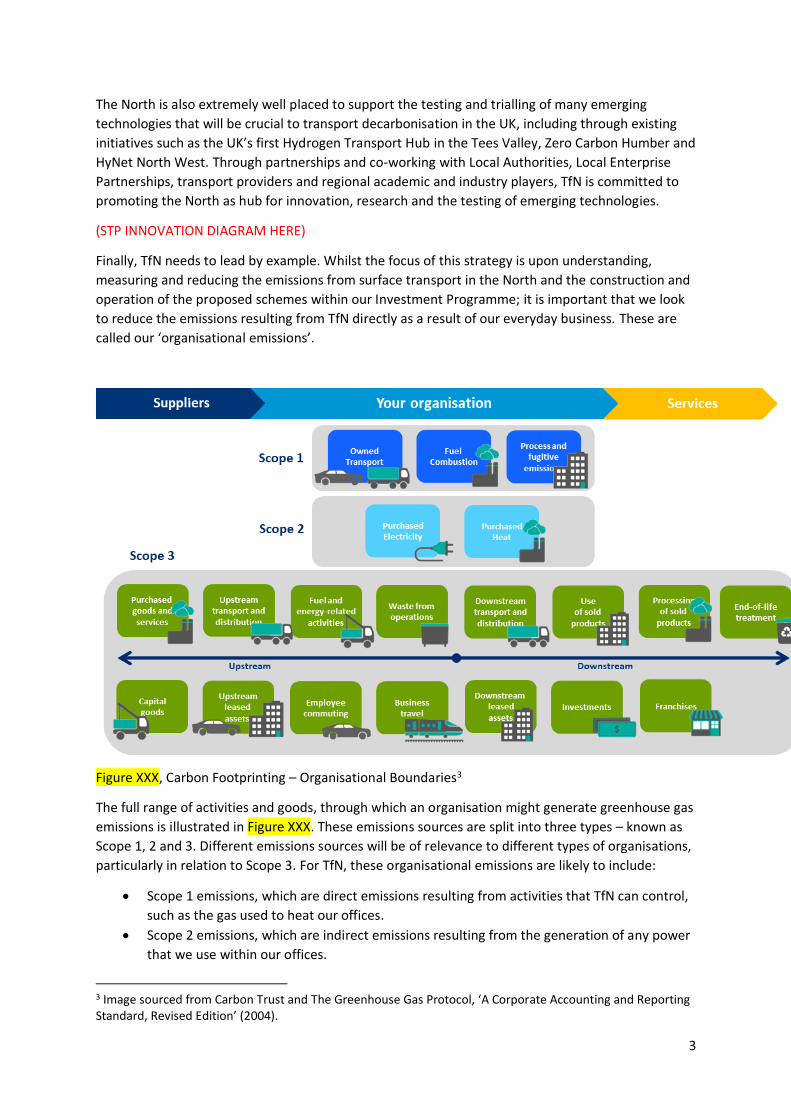
Figure XXX, Carbon Footprinting – Organisational Boundaries3
The full range of activities and goods, through which an organisation might generate greenhouse gas
emissions is illustrated in Figure XXX. These emissions sources are split into three types – known as
Scope 1, 2 and 3. Different emissions sources will be of relevance to different types of organisations,
particularly in relation to Scope 3. For TfN, these organisational emissions are likely to include:
• Scope 1 emissions, which are direct emissions resulting from activities that TfN can control,
such as the gas used to heat our offices.
• Scope 2 emissions, which are indirect emissions resulting from the generation of any power
that we use within our offices.
3 Image sourced from Carbon Trust and The Greenhouse Gas Protocol, ‘A Corporate Accounting and Reporting Standard, Revised Edition’ (2004).
4
• Scope 3 emissions, which cover indirect emissions as a result of our operations that are
outside of TfN’s direct control, albeit we can influence them through our working practices.
This includes things like the emissions from the manufacture and transport of goods we use,
like stationery and IT equipment, and also services we purchase, like cleaning and catering.
It also includes emissions generated by our employees commuting and business travel,
along with those generated by the disposal of our waste and our water consumption.
TfN is committed, by 2022, to understanding the carbon footprint of its organisational Scope 1 and 2
emissions and agreeing a target date for reducing these emissions to net-zero.
In the same timeframe, TfN will also develop a suitable carbon footprint scope for measuring its
organisational Scope 3 emissions. This will reflect data availability, our environmental goals and the
sources we can influence.
Emissions generated from the design, construction and operation of schemes within our Investment
Programme, along with changes to the emissions generated by surface transport in the North as a
result of TfN activity, are the main focus of this strategy document. Our approach to measuring
these emissions and our Decarbonisation Trajectory are covered within Chapters 2 to 6.
Why a Decarbonisation Strategy?
To achieve a near-zero emissions surface transport network in the North by 2045, there must be a
clear understanding of the policies and measures required to bridge the gap between future
emissions projections and future emissions targets. TfN’s Decarbonisation Strategy reflects work
undertaken to define four plausible baseline emissions trajectories, based on our Future Travel
Scenarios, and to identify and assess the gap between each trajectory and TfN’s Decarbonisation
Trajectory.
We have also undertaken a policy analysis to understand the policy ambition and suite of policy
measures that could fill the policy gap for each scenario. This provides insights into the key, low-
regret policy measures required under all scenarios, as well as the areas where TfN and partners are
likely to require additional national support to achieve decarbonisation ambitions.
In terms of local action, this policy analysis provides tested, evidence based packages of measures
that can be used by our partners and other organisations across our region, when developing their
own plans.
Building upon these findings, this strategy lays out the North’s minimum expectations in relation to
both local and national decarbonisation policy ambitions. It is intended to provide an overarching
framework for our partners and other organisations across the region to meet their decarbonisation
responsibilities and ambitions.
The Strategy also recognises the importance of considering embodied carbon and climate change
adaptation and resilience, drawing on the experience of our delivery partners, Highways England
and Network Rail in these areas.
Finally, this strategy outlines TfN’s key commitments to enabling the decarbonisation of surface
transport in the North. Developed through research and engagement with partners, regional
research bodies and industry, these relate to activities that would benefit from coordination at the
regional level and can be most effectively undertaken by TfN. As part of this analysis, a key
consideration for TfN, has been how the decarbonisation of transport can support our partners’
economic growth ambitions, championing clean growth opportunities across our region. Cross-
5
sectoral co-operation and planning will be essential if the North is to deliver both a decarbonised
transport system and capitalise on the possibilities from green industrial revolution, especially with
the energy generation and distribution sector.
The timeline for undertaking these activities is outlined within Chapter 9, Priority Actions to 2025.
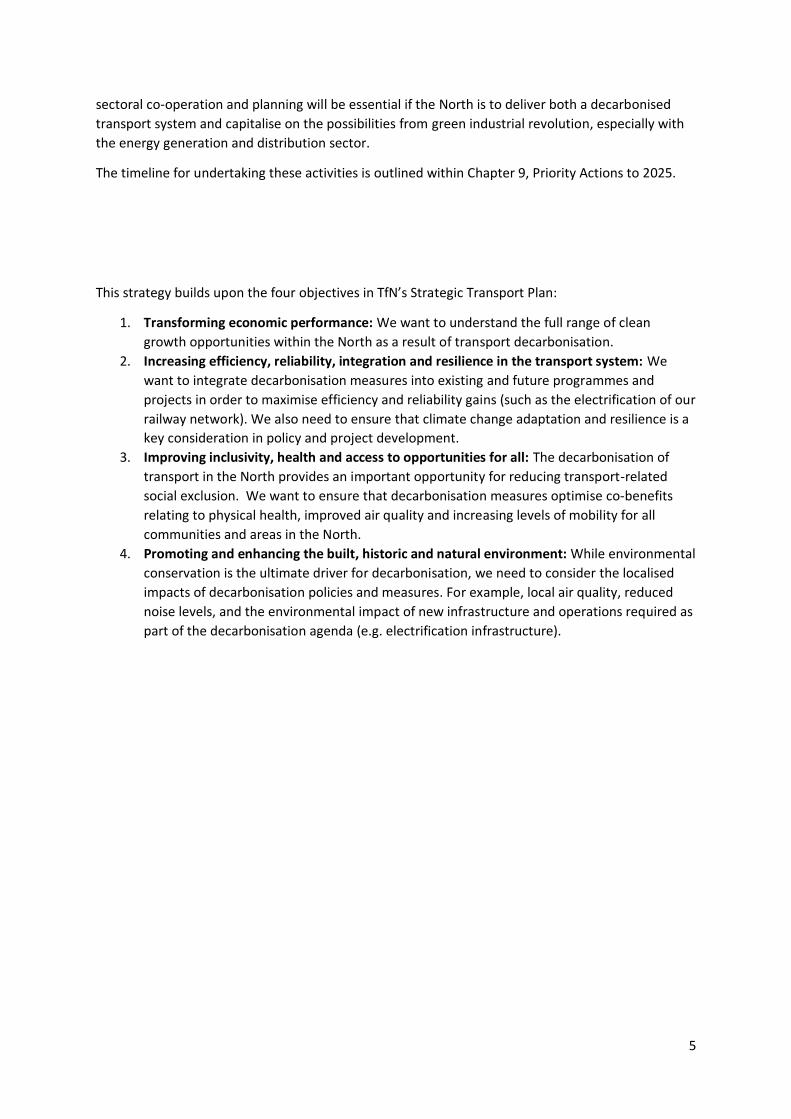
This strategy builds upon the four objectives in TfN’s Strategic Transport Plan:
1. Transforming economic performance: We want to understand the full range of clean
growth opportunities within the North as a result of transport decarbonisation.
2. Increasing efficiency, reliability, integration and resilience in the transport system: We
want to integrate decarbonisation measures into existing and future programmes and
projects in order to maximise efficiency and reliability gains (such as the electrification of our
railway network). We also need to ensure that climate change adaptation and resilience is a
key consideration in policy and project development.
3. Improving inclusivity, health and access to opportunities for all: The decarbonisation of
transport in the North provides an important opportunity for reducing transport-related
social exclusion. We want to ensure that decarbonisation measures optimise co-benefits
relating to physical health, improved air quality and increasing levels of mobility for all
communities and areas in the North.
4. Promoting and enhancing the built, historic and natural environment: While environmental
conservation is the ultimate driver for decarbonisation, we need to consider the localised
impacts of decarbonisation policies and measures. For example, local air quality, reduced
noise levels, and the environmental impact of new infrastructure and operations required as
part of the decarbonisation agenda (e.g. electrification infrastructure).
4
Chapter 2 - TfN’s Decarbonisation Trajectory
What is TfN’s Decarbonisation Trajectory?
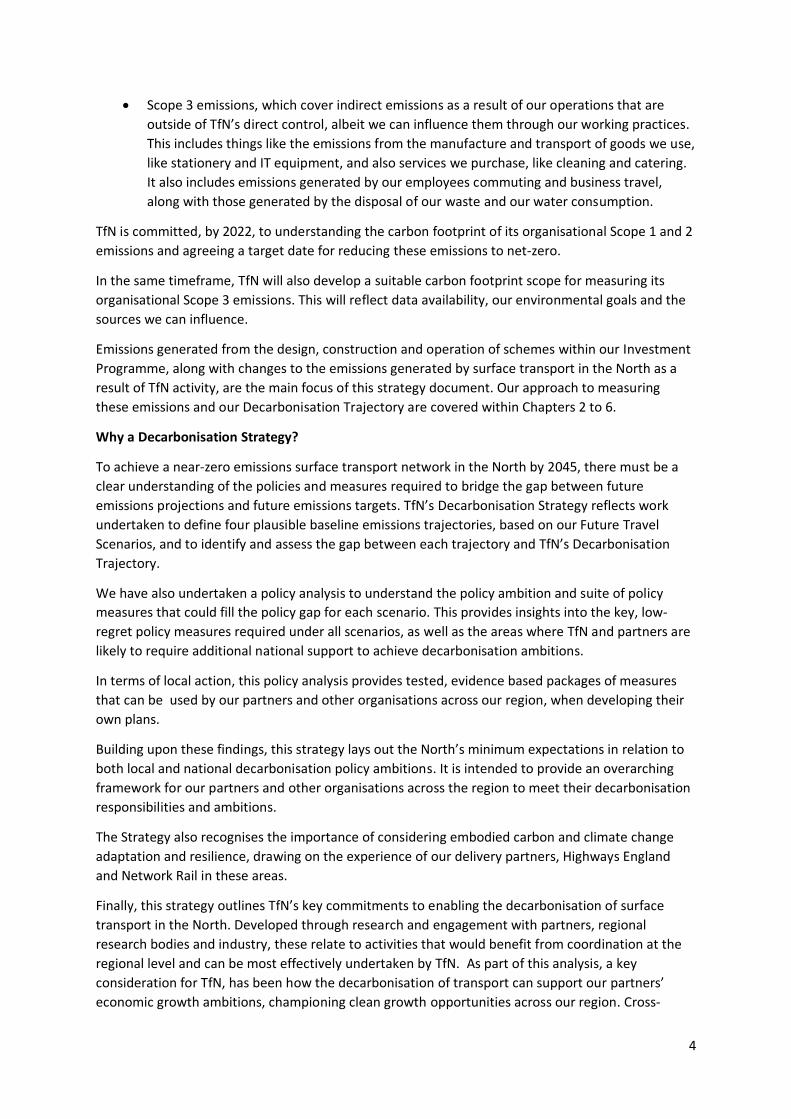
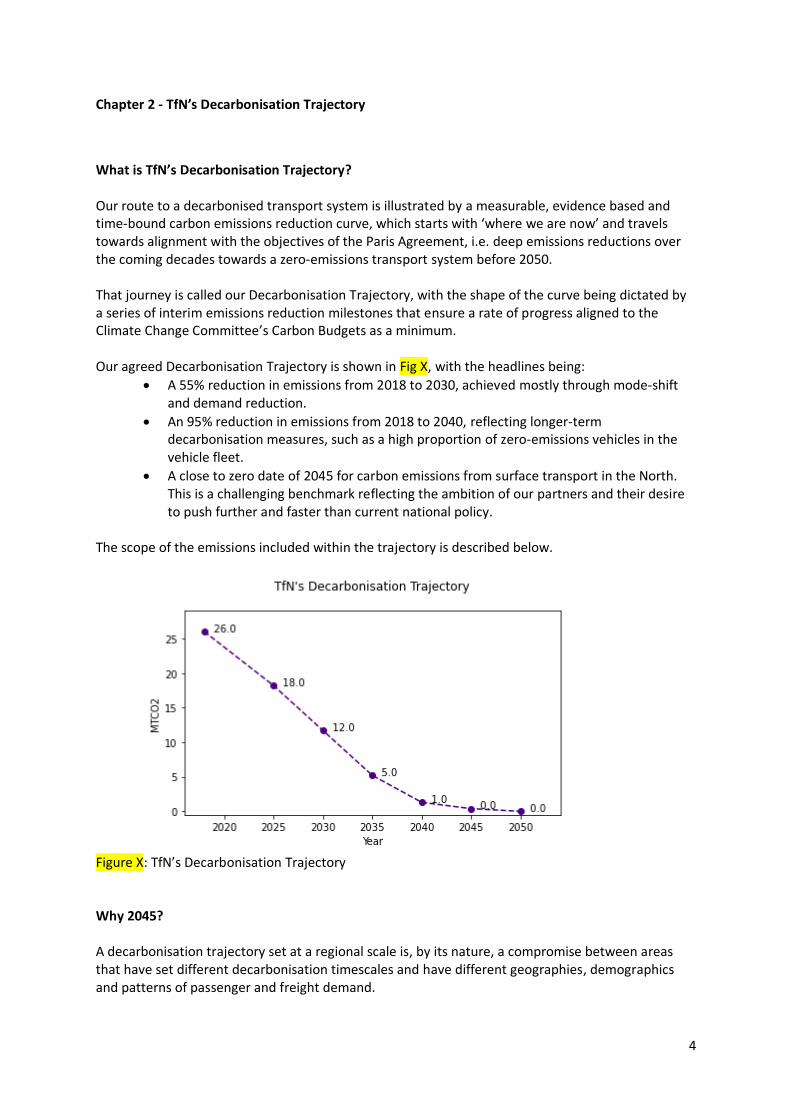
Our route to a decarbonised transport system is illustrated by a measurable, evidence based and time-bound carbon emissions reduction curve, which starts with ‘where we are now’ and travels towards alignment with the objectives of the Paris Agreement, i.e. deep emissions reductions over the coming decades towards a zero-emissions transport system before 2050. That journey is called our Decarbonisation Trajectory, with the shape of the curve being dictated by a series of interim emissions reduction milestones that ensure a rate of progress aligned to the Climate Change Committee’s Carbon Budgets as a minimum. Our agreed Decarbonisation Trajectory is shown in Fig X, with the headlines being:
• A 55% reduction in emissions from 2018 to 2030, achieved mostly through mode-shift and demand reduction.
• An 95% reduction in emissions from 2018 to 2040, reflecting longer-term decarbonisation measures, such as a high proportion of zero-emissions vehicles in the vehicle fleet.
• A close to zero date of 2045 for carbon emissions from surface transport in the North. This is a challenging benchmark reflecting the ambition of our partners and their desire to push further and faster than current national policy.
The scope of the emissions included within the trajectory is described below.
Figure X: TfN’s Decarbonisation Trajectory
Why 2045? A decarbonisation trajectory set at a regional scale is, by its nature, a compromise between areas that have set different decarbonisation timescales and have different geographies, demographics and patterns of passenger and freight demand.

5
A number of our partners have set ambitious, economy-wide decarbonisation targets with net-zero dates pre-2040 for their authority areas. The contribution of transport emissions reductions to these economy-wide targets will depend on progress in other sectors and the assumed availability of negative emissions measures, but it is clear that these authorities are aiming for transport emissions close to zero by 2040. In preparing a Decarbonisation Trajectory, TfN seeks to achieve a compromise by moving faster than current national policy and the Climate Change Committee’s advised trajectory, while being mindful of the varying levels of progress that our partners have made in terms of their own climate change responses. In this way, TfN’s Decarbonisation Trajectory considers the ambitions of the whole region, but does not override or specify local place-based targets. Indeed, the deep emissions reductions achieved by our most ambitious partners over shorter timescales will be needed if the region is to align itself, as a whole, with the level of reductions suggested by TfN’s Decarbonisation Trajectory.
The interim points along our trajectory effectively represent an average for the region, with some areas’ local transport systems decarbonising more quickly, while some may decarbonise slightly slower. The end point of our Decarbonisation Trajectory means that by 2045, emissions from surface transport in the North will need to be close to zero. Figure X illustrates how different places within the North may move ahead with different trajectories, helping to achieve an average regional trajectory, but with all places reaching close to zero by the agreed end date.
Figure X: TfN’s Decarbonisation Trajectory reflects an average across local authorities that can decarbonise slightly slower or slightly faster.
Aligned to this, the programmes and projects that together make up TfN’s Investment Programme should collectively emit close to zero carbon dioxide emissions by 2045. It is also true that many of these projects and programmes may actively help reduce emissions in the longer term, for example, rail schemes may lead to a reduction in car vehicle and road freight mileage. This consideration will be important as we look to benchmark ourselves against our trajectory over the coming decades.
6
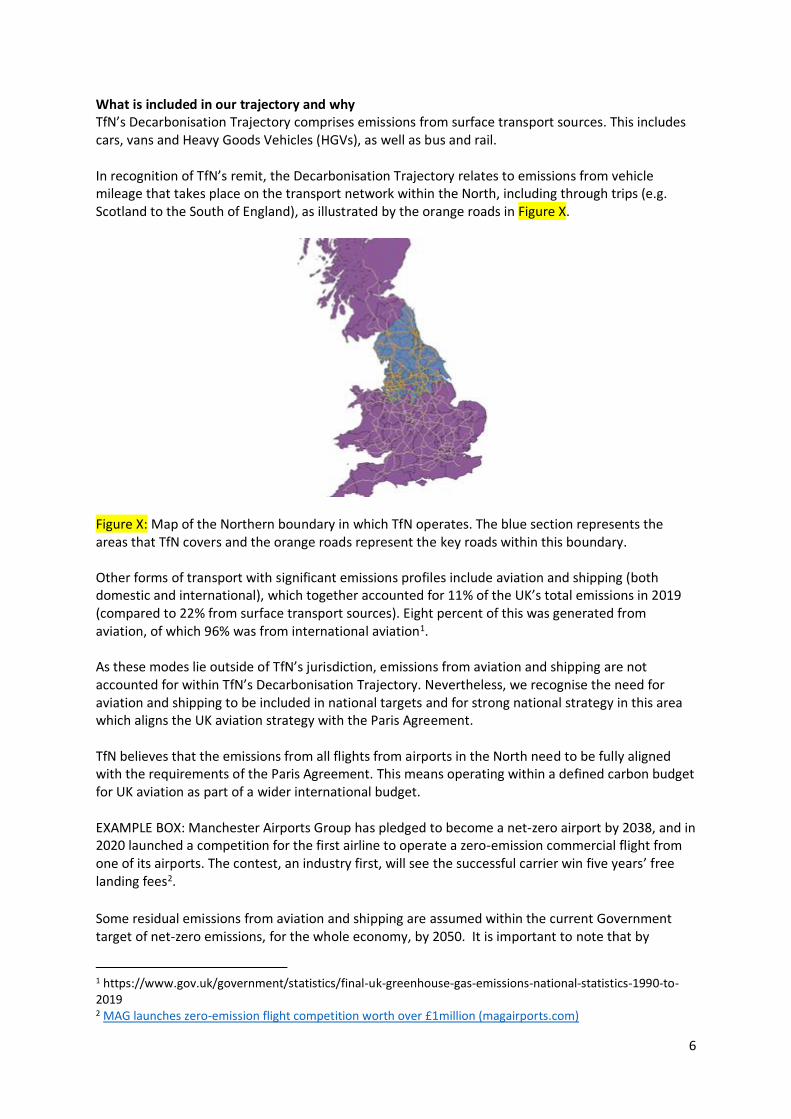
What is included in our trajectory and why TfN’s Decarbonisation Trajectory comprises emissions from surface transport sources. This includes cars, vans and Heavy Goods Vehicles (HGVs), as well as bus and rail. In recognition of TfN’s remit, the Decarbonisation Trajectory relates to emissions from vehicle mileage that takes place on the transport network within the North, including through trips (e.g. Scotland to the South of England), as illustrated by the orange roads in Figure X.
Figure X: Map of the Northern boundary in which TfN operates. The blue section represents the areas that TfN covers and the orange roads represent the key roads within this boundary.
Other forms of transport with significant emissions profiles include aviation and shipping (both domestic and international), which together accounted for 11% of the UK’s total emissions in 2019 (compared to 22% from surface transport sources). Eight percent of this was generated from aviation, of which 96% was from international aviation1. As these modes lie outside of TfN’s jurisdiction, emissions from aviation and shipping are not accounted for within TfN’s Decarbonisation Trajectory. Nevertheless, we recognise the need for aviation and shipping to be included in national targets and for strong national strategy in this area which aligns the UK aviation strategy with the Paris Agreement. TfN believes that the emissions from all flights from airports in the North need to be fully aligned with the requirements of the Paris Agreement. This means operating within a defined carbon budget for UK aviation as part of a wider international budget. EXAMPLE BOX: Manchester Airports Group has pledged to become a net-zero airport by 2038, and in 2020 launched a competition for the first airline to operate a zero-emission commercial flight from one of its airports. The contest, an industry first, will see the successful carrier win five years’ free landing fees2.
Some residual emissions from aviation and shipping are assumed within the current Government target of net-zero emissions, for the whole economy, by 2050. It is important to note that by
1 https://www.gov.uk/government/statistics/final-uk-greenhouse-gas-emissions-national-statistics-1990-to-2019 2 MAG launches zero-emission flight competition worth over £1million (magairports.com)
7
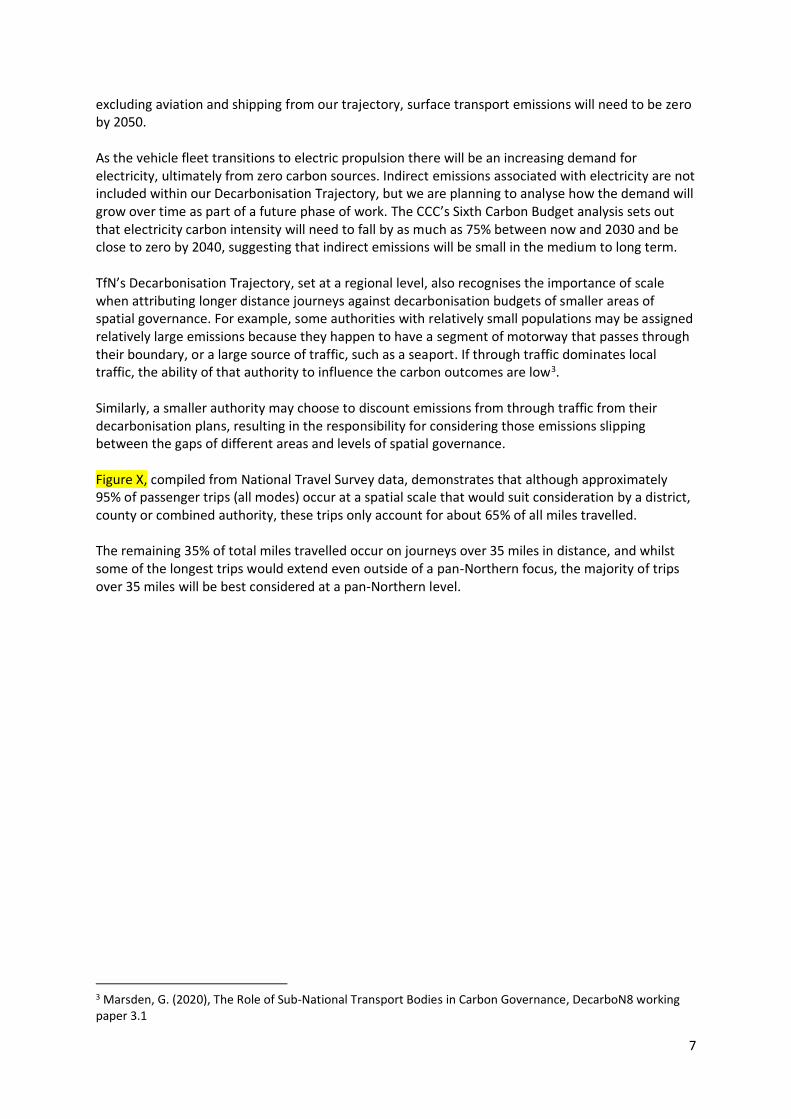
excluding aviation and shipping from our trajectory, surface transport emissions will need to be zero by 2050. As the vehicle fleet transitions to electric propulsion there will be an increasing demand for electricity, ultimately from zero carbon sources. Indirect emissions associated with electricity are not included within our Decarbonisation Trajectory, but we are planning to analyse how the demand will grow over time as part of a future phase of work. The CCC’s Sixth Carbon Budget analysis sets out that electricity carbon intensity will need to fall by as much as 75% between now and 2030 and be close to zero by 2040, suggesting that indirect emissions will be small in the medium to long term. TfN’s Decarbonisation Trajectory, set at a regional level, also recognises the importance of scale when attributing longer distance journeys against decarbonisation budgets of smaller areas of spatial governance. For example, some authorities with relatively small populations may be assigned relatively large emissions because they happen to have a segment of motorway that passes through their boundary, or a large source of traffic, such as a seaport. If through traffic dominates local traffic, the ability of that authority to influence the carbon outcomes are low3. Similarly, a smaller authority may choose to discount emissions from through traffic from their decarbonisation plans, resulting in the responsibility for considering those emissions slipping between the gaps of different areas and levels of spatial governance. Figure X, compiled from National Travel Survey data, demonstrates that although approximately 95% of passenger trips (all modes) occur at a spatial scale that would suit consideration by a district, county or combined authority, these trips only account for about 65% of all miles travelled. The remaining 35% of total miles travelled occur on journeys over 35 miles in distance, and whilst some of the longest trips would extend even outside of a pan-Northern focus, the majority of trips over 35 miles will be best considered at a pan-Northern level.
3 Marsden, G. (2020), The Role of Sub-National Transport Bodies in Carbon Governance, DecarboN8 working paper 3.1
8
Figure X: Percentage of trips (all modes) and percentage of all miles, by trip length4
How we use our trajectory Providing guidance To understand the impact of our Investment Plan in terms of carbon emissions, we need to understand a number of things:
• Where are we likely to be living and working in the future, and what will our travel habits and patterns look like?
• What national and local transport policy is likely to be in place that may affect the carbon emissions of transport?
Once we understand the answers to these two questions, we can work out the approximate carbon emissions from surface transport at a number of set points in the future. These are our future baseline emissions, and when you join these points together, it forms our baseline trajectory.
Of course, the future is not certain, and for that reason TfN has created and modelled a number of Future Travel Scenarios. These scenarios have given us the ability to calculate transport emissions change by scenario and area type - providing four plausible baseline emission trajectories. The scenarios were finalised in late 2020, and their underlying assumptions account
4 Source: Addel, M. Wadud, Z. and Anable, J. ‘An exploratory analysis of long distance travel in England’, 99th Annual Meeting of the Transportation Research Board (TRB), Jan 2020, Washington DC.
9
for both the economic shock due to the pandemic and a range of plausible outcomes for longer-term behavioural trends that could be affected by COVID-19, such as remote working. We will add to these any increase or reduction of emissions stimulated by our projects and programmes within our Investment Programme at any given point. Chapter 3 explains more about the characteristics of each Future Travel Scenario and how they have been used.
If our baseline trajectories, plus any emissions changes as a result of our Investment Programme, exceed our Decarbonisation Trajectory at any point in the future, the gap between the two is known as the Policy Gap. As part of the preparation of this strategy, TfN has modelled the Policy Gap for a number of interim points along the Decarbonisation Trajectory.
This Decarbonisation Strategy sets out how these Policy Gaps may be addressed through three main areas:
• Identification of additional local policy commitment required to achieve the Decarbonisation Trajectory.
• Identification of additional national policy commitment required to achieve the Decarbonisation Trajectory.
• Identification of actions that TfN could take to support our local partners and national government in developing and implementing their own measures.
The identification of required additional policy commitment is important as it helps TfN and its partners evidence and illustrate the additional support required from national government to achieve our decarbonisation ambitions as a region. This support could be in the form of additional national policy or Government provision of more devolved funding or powers. Chapter 4 sets out the change in policy commitment that we believe is required to bridge the policy gap found in each Future Travel Scenario, and Chapter 5 identifies and provides qualitative guidance on the measures that are likely to be required to achieve those policy commitments.
Making the right decisions
At a strategic level, we need to understand how TfN’s Investment Programme (IP) affects the future projected emissions from surface transport in the North.
A number of Intervention Sequencing Strategies, which could deliver our IP, are due to be appraised against a number of environmental, social and economic criteria, to understand the full range of benefits that could be delivered by each Sequencing Strategy. As part of this process, changes to surface transport emissions generated in the North, as a result of these schemes will be modelled so that we understand what local and national decarbonisation policy commitment will be required at different points in the future to allow the schemes to be delivered within the parameters of TfN’s Decarbonisation Trajectory. Ultimately, we will be asking the question: ‘what needs to be true, if the North is to effectively decarbonise its surface transport as well as enjoy the significant connectivity, economic and environmental benefits that our IP will deliver?’
Recognising that the development of local and national policy is ultimately the responsibility of our partners and national government respectively, and that our actual future travel habits may occur differently from the four plausible Future Travel Scenarios we have modelled, TfN will
10
embed consideration of our Decarbonisation Trajectory within the business case development process for individual projects within our Investment Programme.
This means that when the time comes to start to develop each individual project, over the next 30 years, we shall assess whether the carbon impact of the project is consistent with the Decarbonisation Trajectory, given the prevailing external policy context, travel habits and patterns. Recognising the detailed, and sometimes extended, consenting and design processes that precede the construction of major infrastructure projects, we shall assess the carbon impact of the project at both the concept / early design stage and then again once the detailed design is known, pre-construction.
In relation to the early design stage assessment, where a project may not deliver operational emissions in line with our Decarbonisation Trajectory, TfN will require mitigation measures to be developed as part of the project. Mitigation could take the form of fundamental design changes, influencing national government for further policy support or implementation of further local transport decarbonisation policy measures.
Following detailed design and before the start of construction, we will model the expected changes to surface transport emissions in the North during the expected year of opening to understand the potential success of any mitigation measures employed. If those changes to emissions are not consistent with our decarbonisation trajectory, we shall consider additional mitigation measures such as investigating further options to provide the same transport outcomes, through to employing carbon sequestration measures such as integrating tree planting into schemes or investigating the feasibility of using innovative carbon ‘absorbing’ construction materials.
If it is not possible to mitigate the project’s impact upon emissions, the delivery of the project may be re-sequenced within the Investment Programme to a date when the future travel context enables the project to operate within the Decarbonisation Trajectory. For example, a particular road project may be re-scheduled to a point when the majority of additional traffic generated is by zero emission vehicles.
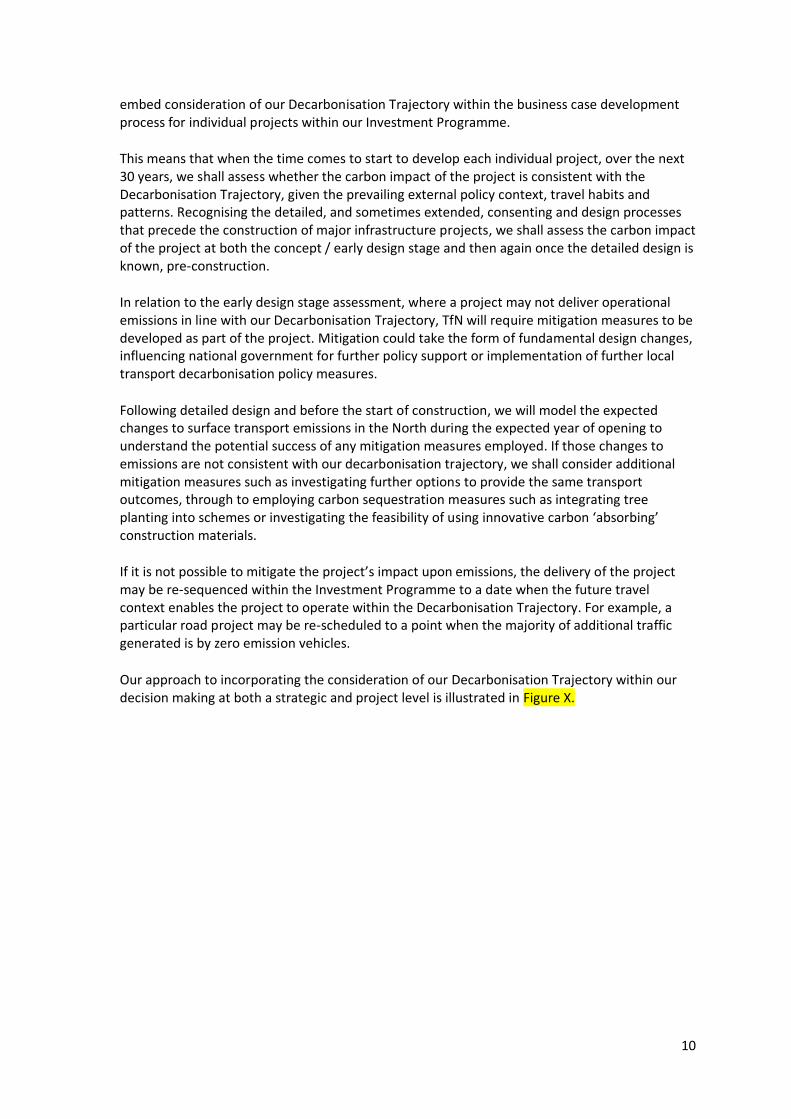
Our approach to incorporating the consideration of our Decarbonisation Trajectory within our decision making at both a strategic and project level is illustrated in Figure X.
11
Figure X: Framework for assessing a project against TfN’s Decarbonisation Trajectory
10
This document is Not for Publication - On-going Research
This document is Not for Publication - On-going Research
Chapter 3 - Estimating current and future emissions
Estimating current and future emissions is key to identifying the policy gap between baseline and
decarbonisation trajectories. TfN’s Northern Carbon Modelling Tool, NoCarb, was developed for this
purpose, taking in historic demand, fleet and emissions data as well as those associated with TfN’s
Future Travel Scenarios.
This chapter outlines the context and rationale behind TfN’s Future Travel Scenarios, and how they
have been used through our Decarbonisation Pathway work as a tool for exploring plausible futures
for which emissions can be estimated. As the starting point for all four Future Travel Scenarios, the
chapter goes on to outline baseline emissions estimates for 2018, before presenting the unique
emissions trajectory of each Future Travel Scenario.
Future Travel Scenarios
TfN’s Future Travel Scenarios explore how trends in society, the economy and national policy could
influence the level and distribution of travel demand in the future. By using a series of different
Future Travel Scenarios, we aim to future-proof our decision-making as much as possible, making it
resilient to wide-ranging and cross-sector uncertainties.
The Future Travel Scenarios represent factors1 that are external to TfN’s direct control, acting as
‘reference cases’ to test the performance of TfN strategies and policies against objectives. They form
the starting point for TfN’s Decarbonisation Pathways.
In each scenario, the level of national government ambition and support for decarbonisation in the
North is different, as is the level and distribution of travel demand2.
Assessing the decarbonisation ‘policy gap’ - that is, the gap between each Future Travel Scenario’s
emissions trajectory and the decarbonisation trajectory - will allow TfN to develop a resilient
Decarbonisation Strategy that can adapt to different future circumstances. The policies and
measures that are likely to bridge this policy gap are captured in TfN’s Decarbonisation Pathways,
which address the different levels of additional action required under each of TfN’s four Future
Travel Scenarios. This recognises that the same action applied in different scenarios will result in
different levels of efficacy in terms of the emissions reductions required.
The Future Travel Scenarios were developed in partnership with Local Authority partners, national
delivery partners and academic experts and informed by local strategies and priorities. The scenarios
represent uncertainty across the following five external factors:
1. Growth in the population and economy;
2. Spatial planning policy and economic distribution;
3. National policy on environment and sustainability;
4. Technological change and advancement; and
5. Social and behavioural change.
The key elements of the scenarios can be summarised using the following set of ‘what if’ questions:
1 A list of travel-related development, policies and measures under each Future Travel Scenario can be found in the Future Transport Measures and Solutions Annex. 2 Key national policy changes up to December 2020 are reflected within the Scenarios.
11
This document is Not for Publication - On-going Research
This document is Not for Publication - On-going Research
• Scenario 1: Just About Managing - What if society keeps developing broadly following
existing trends? What if there is a gradual shift in lifestyles and travel, public and political
behaviours do not alter, and we don’t give up certain ‘luxuries’, leaving major developments
and change to be shaped by market forces.
• Scenario 2: Prioritised Places – What if society becomes focused on quality of life, place-
making and community, rather than primarily economic growth? This scenario is led by a
change in priorities, with its biggest driver being the push for a fairer redistribution of
economic prosperity.
• Scenario 3: Digitally Distributed – What if Northern Powerhouse ambitions3 are realised by
using technology solutions to create connections and agglomeration across towns and
cities? This scenario is led by technology and some policy influence, as we fully embrace
technological change, work remotely, and use an accessible service-based transport system
with connected and autonomous shared mobility options.
• Scenario 4: Urban Zero Carbon – What if society achieves Northern Powerhouse ambitions
by using policy interventions to maximise energy efficient city growth and urban
densification? This scenario is led by public and political attitudes to climate action and
urban place-making, with the biggest drivers being strong Government policy, resulting in
fast action on zero-emission transport systems and places, with integrated planning across
energy, spatial and other sectors.
TfN’s Future Travel Scenarios Report provides a comprehensive overview of the process undertaken
to develop the new Future Travel Scenarios. It also delves into the contextual factors underlying
each scenario and the expected implications on transport.
Modelling carbon emissions in the North
Over the past two years, TfN’s Technical Assurance, Modelling and Economics (TAME) team has
been developing and refining the Analytical Framework; a consistent set of data, modelling tools and
appraisal approaches designed for TfN’s programmes of transport strategy and business case
development. TfN’s NoCarb model forms part of the Analytical Framework and draws on other
framework elements and data sources to estimate future vehicle emissions. These inputs relate to:
1. The composition of the vehicle fleet by size and fuel type;
2. The distribution of travel demand;
3. Emissions per kilometre travelled for each distinct type of vehicle.
Using these inputs, NoCarb carries out two core functions:
1. Projecting the make-up of future fleets using sales scenarios; and
2. Calculating emissions using fleet, emissions and demand inputs.
The first step involves projecting the make-up of the vehicle fleet under each of TfN’s Future Travel
Scenarios, while the second step estimates emissions based on the composition of the fleet and
distance travelled in a given year. Estimates of kilometres travelled by each vehicle type under each
of the Future Travel Scenarios were produced using TfN’s travel demand modelling tools. Further
information on NoCarb and these travel demand modelling tools is provided in Annex B.
3 As set out in the Northern Powerhouse Independent Economic Review.
12
This document is Not for Publication - On-going Research
This document is Not for Publication - On-going Research
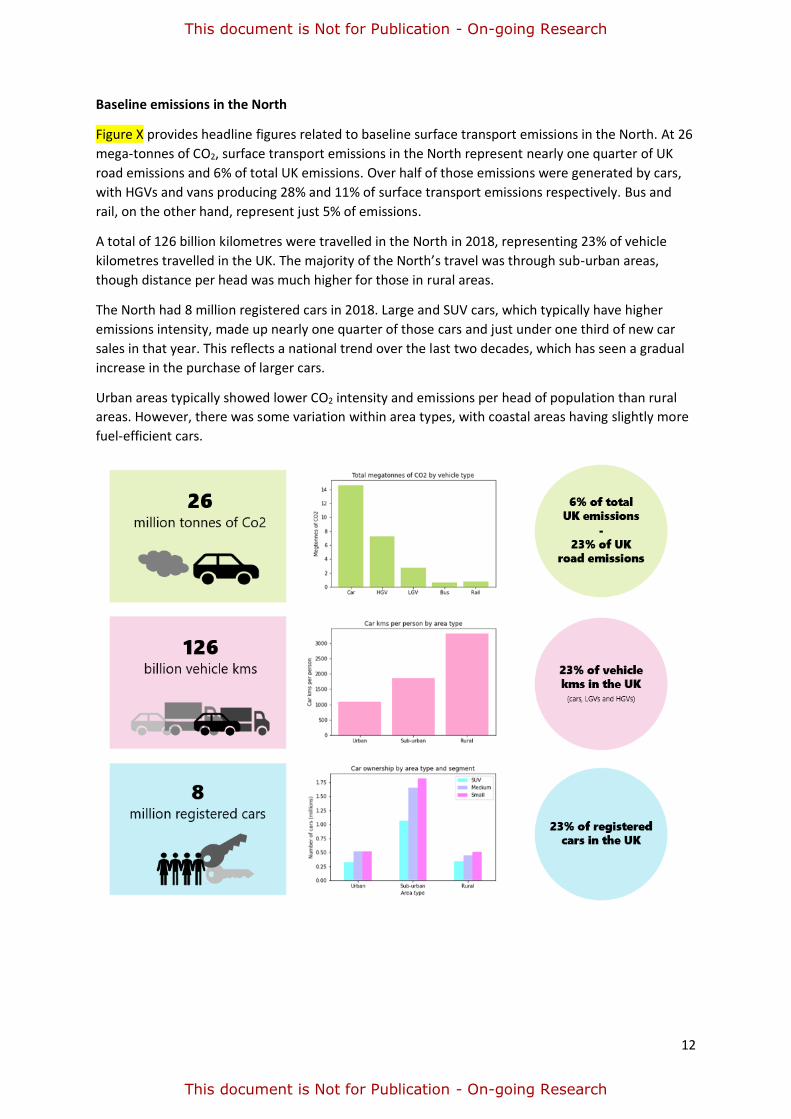
Baseline emissions in the North
Figure X provides headline figures related to baseline surface transport emissions in the North. At 26
mega-tonnes of CO2, surface transport emissions in the North represent nearly one quarter of UK
road emissions and 6% of total UK emissions. Over half of those emissions were generated by cars,
with HGVs and vans producing 28% and 11% of surface transport emissions respectively. Bus and
rail, on the other hand, represent just 5% of emissions.
A total of 126 billion kilometres were travelled in the North in 2018, representing 23% of vehicle
kilometres travelled in the UK. The majority of the North’s travel was through sub-urban areas,
though distance per head was much higher for those in rural areas.
The North had 8 million registered cars in 2018. Large and SUV cars, which typically have higher
emissions intensity, made up nearly one quarter of those cars and just under one third of new car
sales in that year. This reflects a national trend over the last two decades, which has seen a gradual
increase in the purchase of larger cars.
Urban areas typically showed lower CO2 intensity and emissions per head of population than rural
areas. However, there was some variation within area types, with coastal areas having slightly more
fuel-efficient cars.
13
This document is Not for Publication - On-going Research
This document is Not for Publication - On-going Research
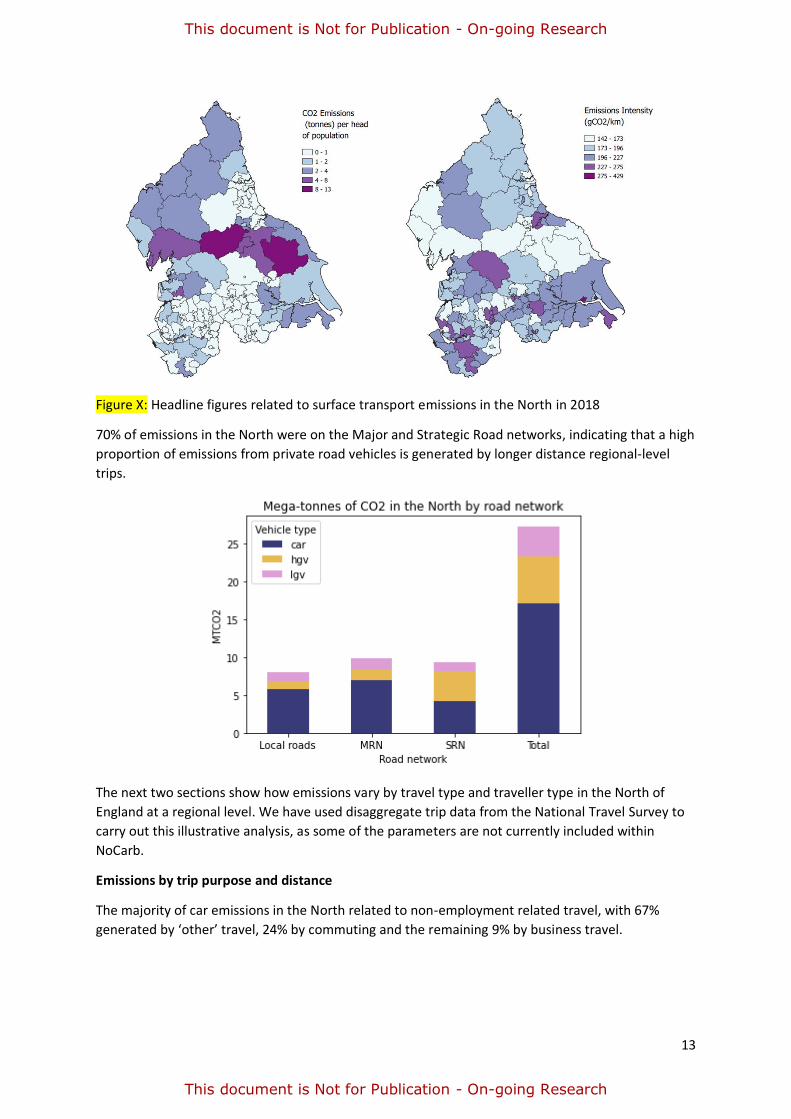
Figure X: Headline figures related to surface transport emissions in the North in 2018
70% of emissions in the North were on the Major and Strategic Road networks, indicating that a high
proportion of emissions from private road vehicles is generated by longer distance regional-level
trips.
The next two sections show how emissions vary by travel type and traveller type in the North of
England at a regional level. We have used disaggregate trip data from the National Travel Survey to
carry out this illustrative analysis, as some of the parameters are not currently included within
NoCarb.
Emissions by trip purpose and distance
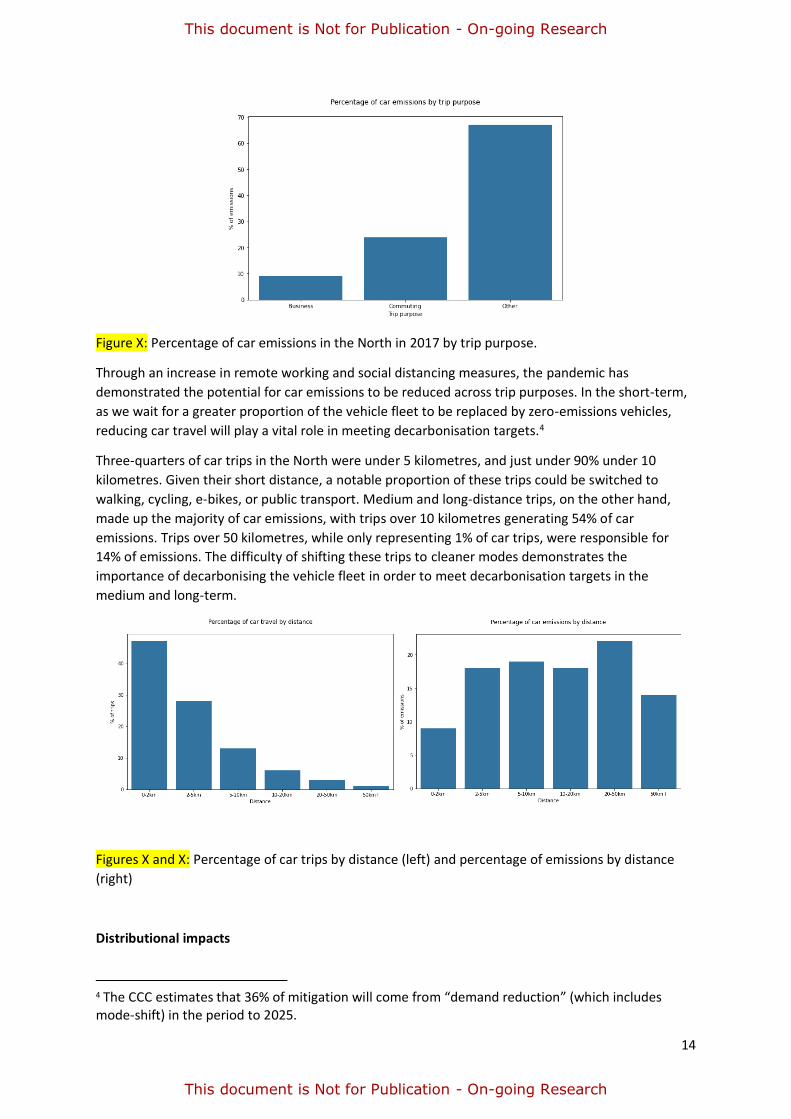
The majority of car emissions in the North related to non-employment related travel, with 67%
generated by ‘other’ travel, 24% by commuting and the remaining 9% by business travel.
14
This document is Not for Publication - On-going Research
This document is Not for Publication - On-going Research
Figure X: Percentage of car emissions in the North in 2017 by trip purpose.
Through an increase in remote working and social distancing measures, the pandemic has
demonstrated the potential for car emissions to be reduced across trip purposes. In the short-term,
as we wait for a greater proportion of the vehicle fleet to be replaced by zero-emissions vehicles,
reducing car travel will play a vital role in meeting decarbonisation targets.4
Three-quarters of car trips in the North were under 5 kilometres, and just under 90% under 10
kilometres. Given their short distance, a notable proportion of these trips could be switched to
walking, cycling, e-bikes, or public transport. Medium and long-distance trips, on the other hand,
made up the majority of car emissions, with trips over 10 kilometres generating 54% of car
emissions. Trips over 50 kilometres, while only representing 1% of car trips, were responsible for
14% of emissions. The difficulty of shifting these trips to cleaner modes demonstrates the
importance of decarbonising the vehicle fleet in order to meet decarbonisation targets in the
medium and long-term.
Figures X and X: Percentage of car trips by distance (left) and percentage of emissions by distance
(right)
Distributional impacts
4 The CCC estimates that 36% of mitigation will come from “demand reduction” (which includes mode-shift) in the period to 2025.
15
This document is Not for Publication - On-going Research
This document is Not for Publication - On-going Research
Distribution of emissions by employment group5
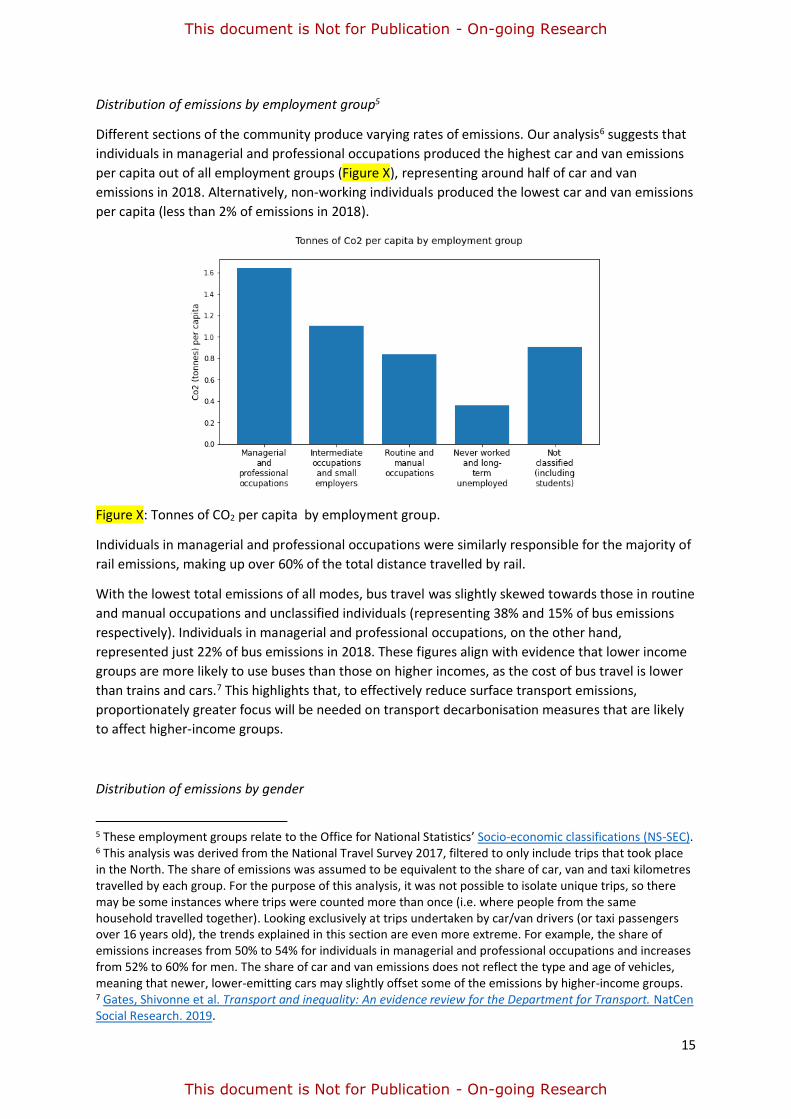
Different sections of the community produce varying rates of emissions. Our analysis6 suggests that
individuals in managerial and professional occupations produced the highest car and van emissions
per capita out of all employment groups (Figure X), representing around half of car and van
emissions in 2018. Alternatively, non-working individuals produced the lowest car and van emissions
per capita (less than 2% of emissions in 2018).
Figure X: Tonnes of CO2 per capita by employment group.
Individuals in managerial and professional occupations were similarly responsible for the majority of
rail emissions, making up over 60% of the total distance travelled by rail.
With the lowest total emissions of all modes, bus travel was slightly skewed towards those in routine
and manual occupations and unclassified individuals (representing 38% and 15% of bus emissions
respectively). Individuals in managerial and professional occupations, on the other hand,
represented just 22% of bus emissions in 2018. These figures align with evidence that lower income
groups are more likely to use buses than those on higher incomes, as the cost of bus travel is lower
than trains and cars.7 This highlights that, to effectively reduce surface transport emissions,
proportionately greater focus will be needed on transport decarbonisation measures that are likely
to affect higher-income groups.
Distribution of emissions by gender
5 These employment groups relate to the Office for National Statistics’ Socio-economic classifications (NS-SEC). 6 This analysis was derived from the National Travel Survey 2017, filtered to only include trips that took place in the North. The share of emissions was assumed to be equivalent to the share of car, van and taxi kilometres travelled by each group. For the purpose of this analysis, it was not possible to isolate unique trips, so there may be some instances where trips were counted more than once (i.e. where people from the same household travelled together). Looking exclusively at trips undertaken by car/van drivers (or taxi passengers over 16 years old), the trends explained in this section are even more extreme. For example, the share of emissions increases from 50% to 54% for individuals in managerial and professional occupations and increases from 52% to 60% for men. The share of car and van emissions does not reflect the type and age of vehicles, meaning that newer, lower-emitting cars may slightly offset some of the emissions by higher-income groups. 7 Gates, Shivonne et al. Transport and inequality: An evidence review for the Department for Transport. NatCen Social Research. 2019.

16
This document is Not for Publication - On-going Research
This document is Not for Publication - On-going Research
Responsible for 52% of car and van travel in the North, men produce slightly higher car and van
emissions per capita than women (Figure X). This is equivalent to the gender split of drivers, with
52% of trips recorded as having a man as the main driver. Trips taken by men also have slightly lower
car occupancies, with an average of 1.93 people in a car or van compared to 2 for women.
Figure X: Tonnes of CO2 per capita by gender.
Men represent just over half of rail emissions, making up 55% of rail travel in the North. The
opposite is true for bus travel, with 55% of emissions produced by women.
Distribution of emissions by age
Over 50% of car and van emissions, and 60% of rail emissions, were produced by people aged 30-60
years old. Covering most of the working age population, this likely reflects more commuting,
business and escort8 trips.
50-60 year-olds had the highest share of car and van emissions per capita out of all age groups
(Figure X), while children, teenagers and people over 80 had the lowest per capita emissions.
8 Such as driving children to school or other activities.
17
This document is Not for Publication - On-going Research
This document is Not for Publication - On-going Research
Figure X: Tonnes of CO2 per capita by age group.9
Bus travel was weighted more towards groups outside of the typical working age. 11-19 year-olds
represented the highest share of bus emissions at 22%, and 60-69 and 70-79 year-olds together
represented 29% of bus emissions.
What this means for decarbonisation
While this section provides a high-level overview of how emissions can vary across groups, it is not
an exhaustive list; nor does it capture the complex relationships between income, gender, age,
disability, location (to name a few) and carbon consumption. For example, research suggests that
low-income individuals in rural areas experience the worst effects of transport poverty, with high
transport costs and low public transport access.10 Nevertheless, emissions intensity and emissions
per head is often higher in rural areas compared to urban and sub-urban areas. This means that
these individuals could be disproportionately disadvantaged by targeted decarbonisation measures,
such as emissions-based fees for road-use charging.
Considering the impact of decarbonisation methods on different groups is critical to ensuring that
the gap between disadvantaged and privileged groups is narrowed rather than widened. This is
discussed further in Chapter 5.
Future emissions estimates
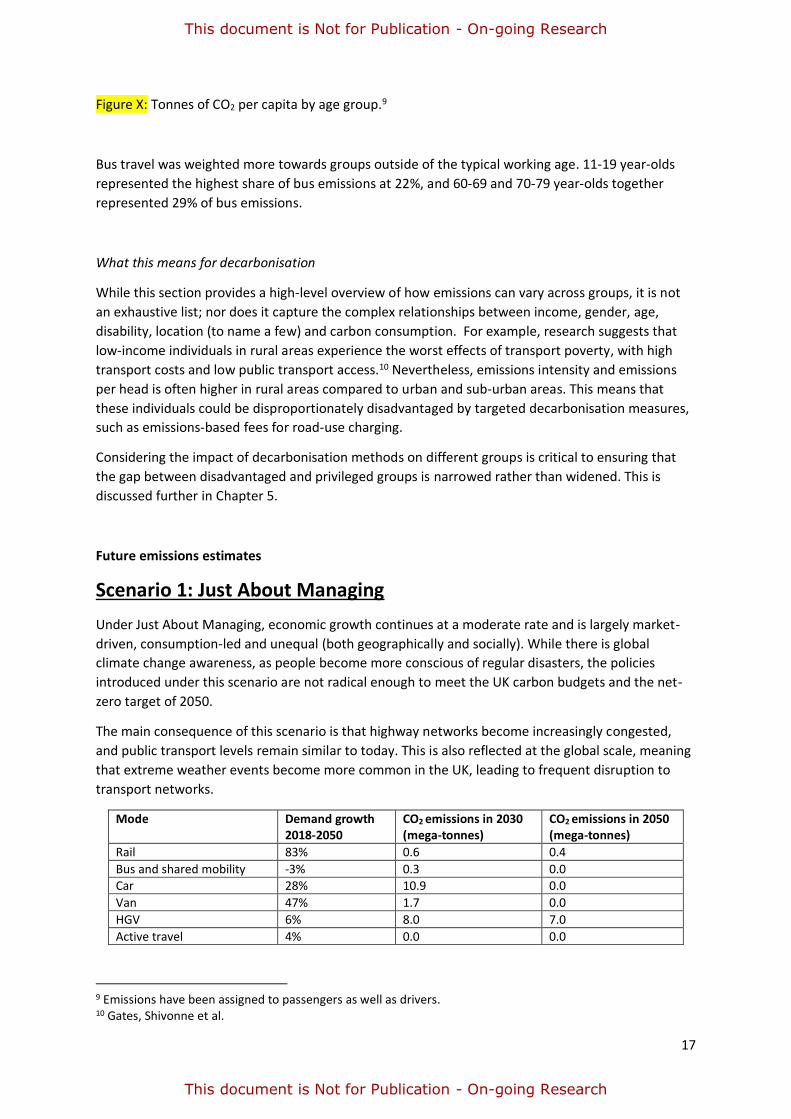
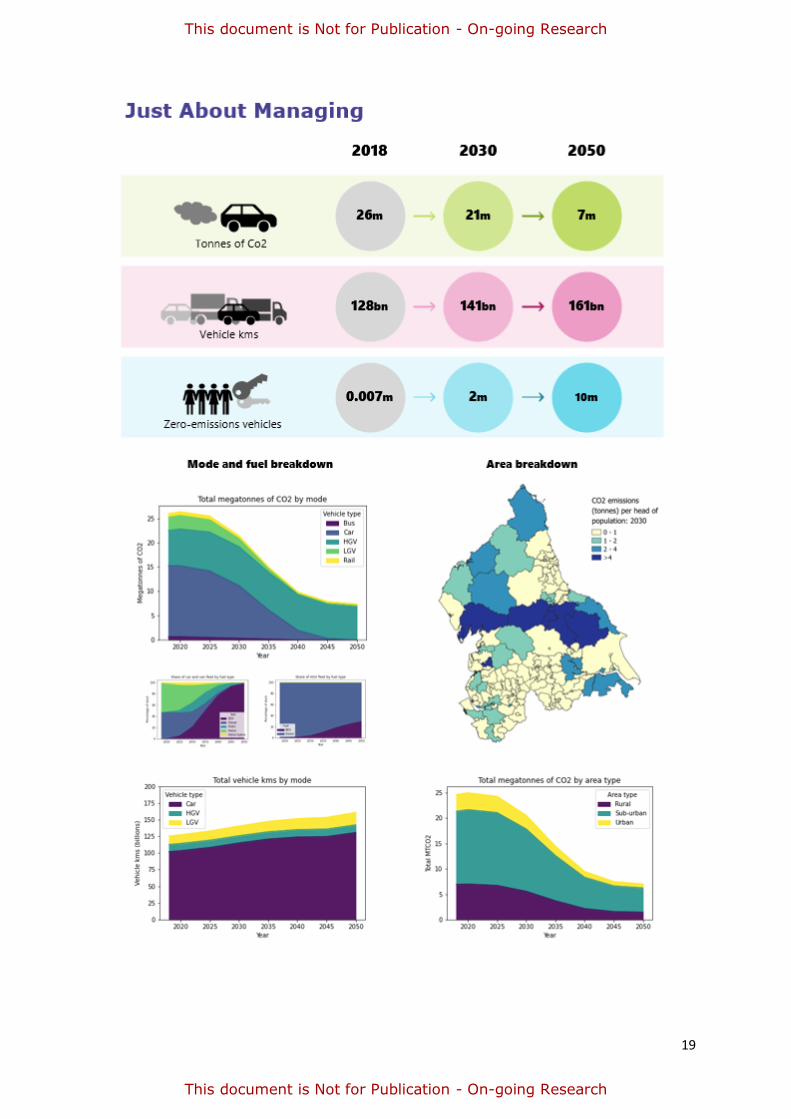
Scenario 1: Just About Managing
Under Just About Managing, economic growth continues at a moderate rate and is largely market-
driven, consumption-led and unequal (both geographically and socially). While there is global
climate change awareness, as people become more conscious of regular disasters, the policies
introduced under this scenario are not radical enough to meet the UK carbon budgets and the net-
zero target of 2050.
The main consequence of this scenario is that highway networks become increasingly congested,
and public transport levels remain similar to today. This is also reflected at the global scale, meaning
that extreme weather events become more common in the UK, leading to frequent disruption to
transport networks.
Mode Demand growth 2018-2050
CO2 emissions in 2030 (mega-tonnes)
CO2 emissions in 2050 (mega-tonnes)
Rail 83% 0.6 0.4
Bus and shared mobility -3% 0.3 0.0 Car 28% 10.9 0.0
Van 47% 1.7 0.0
HGV 6% 8.0 7.0
Active travel 4% 0.0 0.0
9 Emissions have been assigned to passengers as well as drivers. 10 Gates, Shivonne et al.
18
This document is Not for Publication - On-going Research
This document is Not for Publication - On-going Research
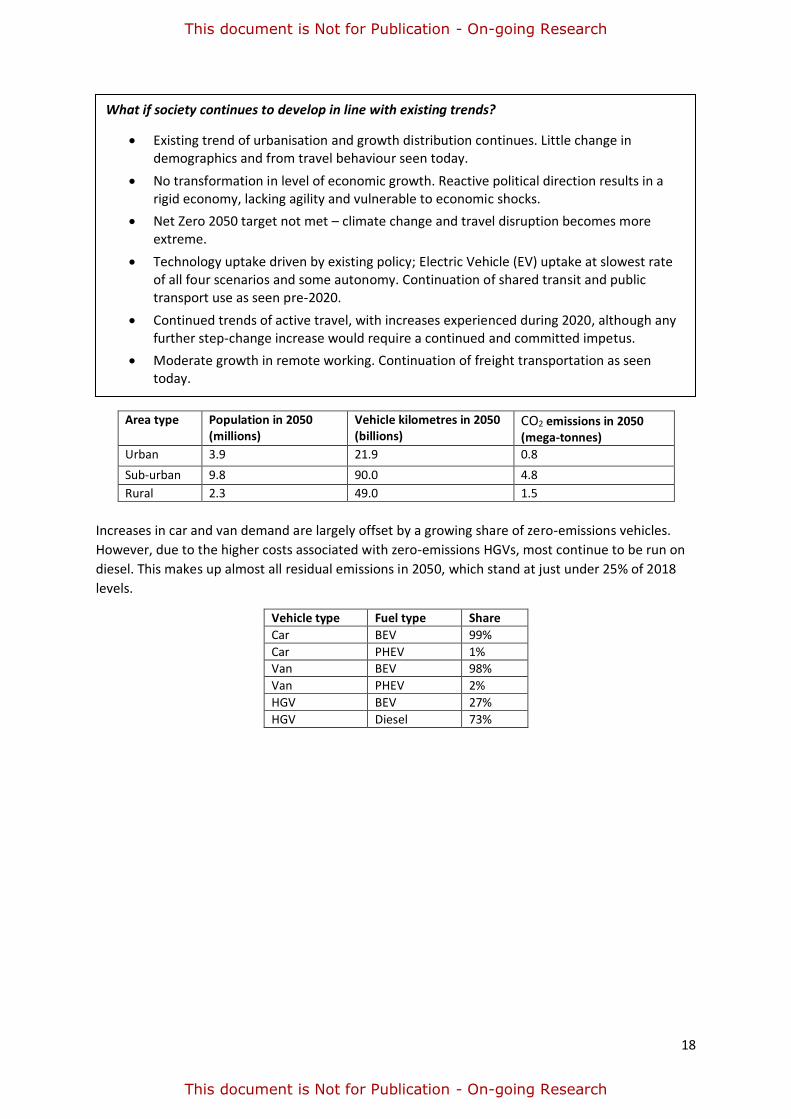
Area type Population in 2050 (millions)
Vehicle kilometres in 2050 (billions)
CO2 emissions in 2050 (mega-tonnes)
Urban 3.9 21.9 0.8
Sub-urban 9.8 90.0 4.8
Rural 2.3 49.0 1.5
Increases in car and van demand are largely offset by a growing share of zero-emissions vehicles.
However, due to the higher costs associated with zero-emissions HGVs, most continue to be run on
diesel. This makes up almost all residual emissions in 2050, which stand at just under 25% of 2018
levels.
Vehicle type Fuel type Share
Car BEV 99%
Car PHEV 1% Van BEV 98%
Van PHEV 2%
HGV BEV 27%
HGV Diesel 73%
What if society continues to develop in line with existing trends?
• Existing trend of urbanisation and growth distribution continues. Little change in demographics and from travel behaviour seen today.
• No transformation in level of economic growth. Reactive political direction results in a rigid economy, lacking agility and vulnerable to economic shocks.
• Net Zero 2050 target not met – climate change and travel disruption becomes more extreme.
• Technology uptake driven by existing policy; Electric Vehicle (EV) uptake at slowest rate of all four scenarios and some autonomy. Continuation of shared transit and public transport use as seen pre-2020.
• Continued trends of active travel, with increases experienced during 2020, although any further step-change increase would require a continued and committed impetus.
• Moderate growth in remote working. Continuation of freight transportation as seen today.
19
This document is Not for Publication - On-going Research
This document is Not for Publication - On-going Research
20
This document is Not for Publication - On-going Research
This document is Not for Publication - On-going Research
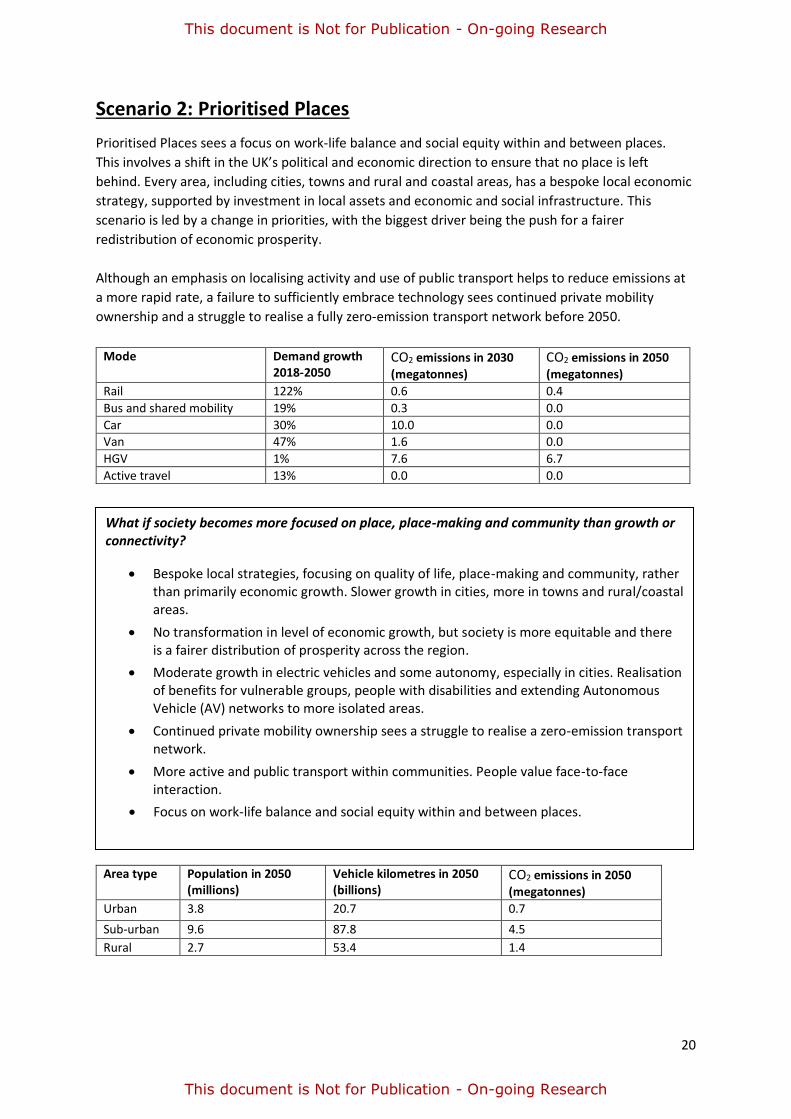
Scenario 2: Prioritised Places
Prioritised Places sees a focus on work-life balance and social equity within and between places.
This involves a shift in the UK’s political and economic direction to ensure that no place is left
behind. Every area, including cities, towns and rural and coastal areas, has a bespoke local economic
strategy, supported by investment in local assets and economic and social infrastructure. This
scenario is led by a change in priorities, with the biggest driver being the push for a fairer
redistribution of economic prosperity.
Although an emphasis on localising activity and use of public transport helps to reduce emissions at
a more rapid rate, a failure to sufficiently embrace technology sees continued private mobility
ownership and a struggle to realise a fully zero-emission transport network before 2050.
Area type Population in 2050 (millions)
Vehicle kilometres in 2050 (billions)
CO2 emissions in 2050 (megatonnes)
Urban 3.8 20.7 0.7
Sub-urban 9.6 87.8 4.5
Rural 2.7 53.4 1.4
Mode Demand growth 2018-2050
CO2 emissions in 2030 (megatonnes)
CO2 emissions in 2050 (megatonnes)
Rail 122% 0.6 0.4
Bus and shared mobility 19% 0.3 0.0
Car 30% 10.0 0.0
Van 47% 1.6 0.0
HGV 1% 7.6 6.7
Active travel 13% 0.0 0.0
What if society becomes more focused on place, place-making and community than growth or connectivity?
• Bespoke local strategies, focusing on quality of life, place-making and community, rather than primarily economic growth. Slower growth in cities, more in towns and rural/coastal areas.
• No transformation in level of economic growth, but society is more equitable and there is a fairer distribution of prosperity across the region.
• Moderate growth in electric vehicles and some autonomy, especially in cities. Realisation of benefits for vulnerable groups, people with disabilities and extending Autonomous Vehicle (AV) networks to more isolated areas.
• Continued private mobility ownership sees a struggle to realise a zero-emission transport network.
• More active and public transport within communities. People value face-to-face interaction.
• Focus on work-life balance and social equity within and between places.
21
This document is Not for Publication - On-going Research
This document is Not for Publication - On-going Research
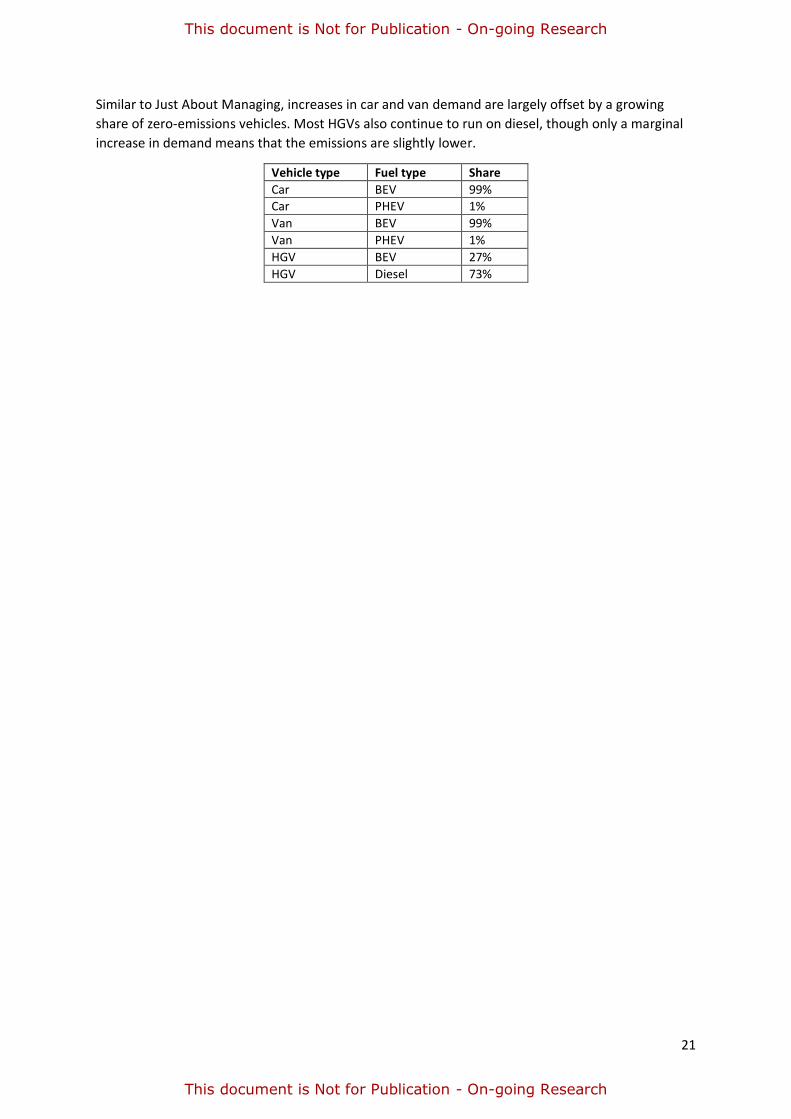
Similar to Just About Managing, increases in car and van demand are largely offset by a growing
share of zero-emissions vehicles. Most HGVs also continue to run on diesel, though only a marginal
increase in demand means that the emissions are slightly lower.
Vehicle type Fuel type Share
Car BEV 99% Car PHEV 1%
Van BEV 99%
Van PHEV 1%
HGV BEV 27%
HGV Diesel 73%

22
This document is Not for Publication - On-going Research
This document is Not for Publication - On-going Research

23
This document is Not for Publication - On-going Research
This document is Not for Publication - On-going Research
Scenario 3: Digitally Distributed
This scenario sees a future where digital and technological advances accelerate, transforming how
we work, travel and live. In general, we embrace these technological changes and the move towards
a distributed, service-based transport system, with the biggest drivers being technical advances and
a willingness to embrace mobility-as-a-service and shared mobility.
Long-term climate change targets are met, but there is slow progress in the short-term due to a
general preference for individualised mobility over traditional public transport.
Area type Population in 2050 (millions)
Vehicle kilometres in 2050 (billions)
CO2 emissions in 2050 (megatonnes)
Urban 4.0 24.4 0.1
Sub-urban 10.6 101.4 0.8
Rural 2.6 54.9 0.3
With just under 1 MTCO2 of residual emissions in 2050, this scenario sees the benefits of
decarbonising HGVs earlier, with over 85% running on hydrogen or battery electric fuel cells.
Vehicle type Fuel type Share
Car BEV 100% Van BEV 100%
HGV BEV 38%
HGV Diesel 14%
HGV Hydrogen 47%
Mode Demand growth 2018-2050
CO2 emissions in 2030 (megatonnes)
CO2 emissions in 2050 (megatonnes)
Rail 78% 0.6 0.0
Bus and shared mobility 11% 0.3 0.0 Car 44% 9.6 0.0
Van 74% 1.6 0.0
HGV 4% 7.9 1.2
Active travel 6% 0.0 0.0
What if society achieves Northern Powerhouse Independent Economic Review (NPIER) outcomes by using technological solutions to create connection and agglomeration across towns and cities?
• Growth dispersed between cities and towns and less city-centric.
• High uptake of EV, Ultra Low Emissions Vehicles (ULEVs), Zero Emissions Vehicles (ZEVs) and driverless vehicles means zero emissions before 2050 (but slow progress in short-term). Some fiscal and regulatory action to influence technology use, but congestion persists in places due to availability of transport options. Increased digital remote working and dispersed employment means trip lengths are longer but less often.
• General willingness to embrace Mobility-as-a-Service (MaaS) and shared mobility - through technology acceptance which supports increased efficiency and use of road capacity.
• Freight warehousing, distribution and logistics centres are distributed.
• Transformational economic growth as towns and cities see polycentric agglomeration and become
more interdependent, due to better skills-matching within geographical areas.

24
This document is Not for Publication - On-going Research
This document is Not for Publication - On-going Research
25
This document is Not for Publication - On-going Research
This document is Not for Publication - On-going Research
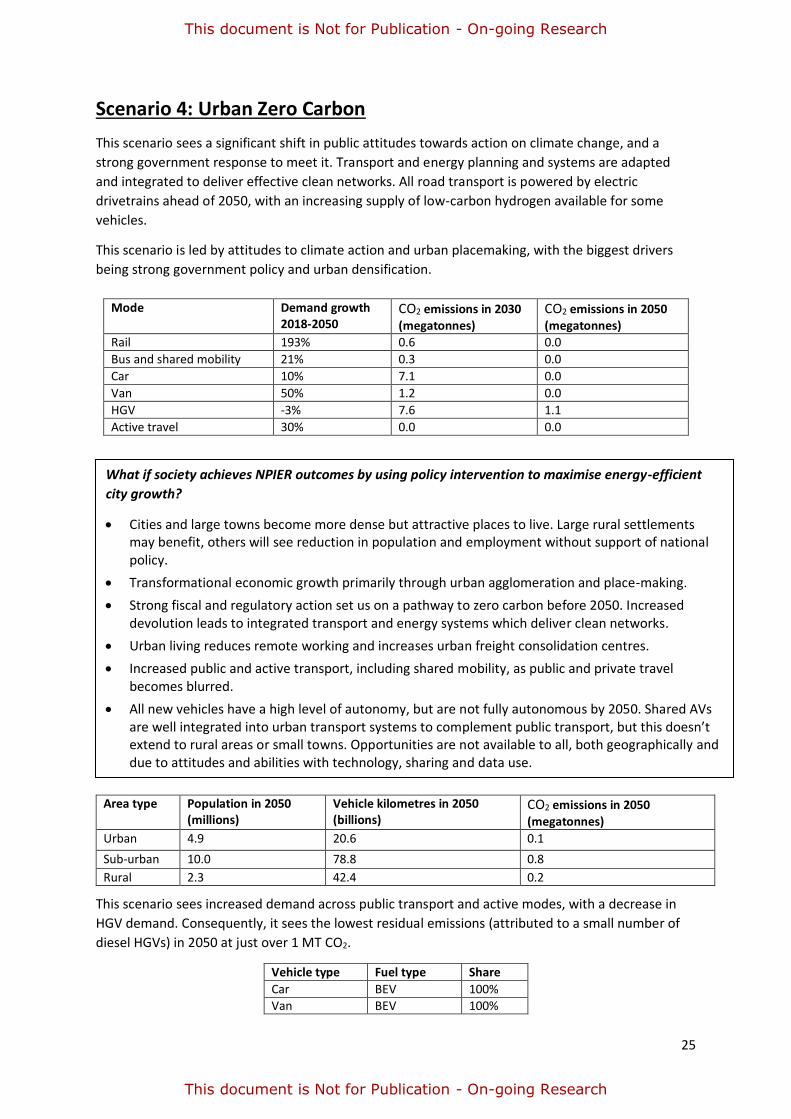
Scenario 4: Urban Zero Carbon
This scenario sees a significant shift in public attitudes towards action on climate change, and a
strong government response to meet it. Transport and energy planning and systems are adapted
and integrated to deliver effective clean networks. All road transport is powered by electric
drivetrains ahead of 2050, with an increasing supply of low-carbon hydrogen available for some
vehicles.
This scenario is led by attitudes to climate action and urban placemaking, with the biggest drivers
being strong government policy and urban densification.
Mode Demand growth 2018-2050
CO2 emissions in 2030 (megatonnes)
CO2 emissions in 2050 (megatonnes)
Rail 193% 0.6 0.0
Bus and shared mobility 21% 0.3 0.0
Car 10% 7.1 0.0
Van 50% 1.2 0.0
HGV -3% 7.6 1.1
Active travel 30% 0.0 0.0
Area type Population in 2050 (millions)
Vehicle kilometres in 2050 (billions)
CO2 emissions in 2050
(megatonnes)
Urban 4.9 20.6 0.1
Sub-urban 10.0 78.8 0.8
Rural 2.3 42.4 0.2
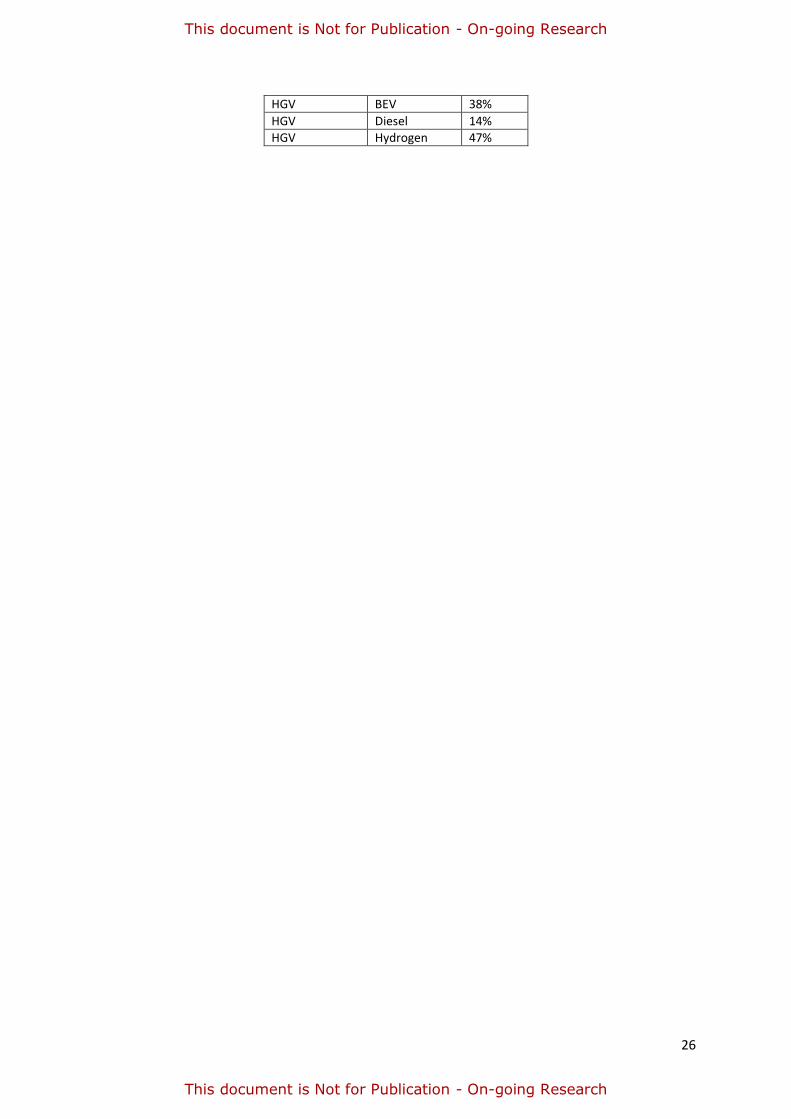
This scenario sees increased demand across public transport and active modes, with a decrease in
HGV demand. Consequently, it sees the lowest residual emissions (attributed to a small number of
diesel HGVs) in 2050 at just over 1 MT CO2.
Vehicle type Fuel type Share
Car BEV 100% Van BEV 100%
What if society achieves NPIER outcomes by using policy intervention to maximise energy-efficient
city growth?
• Cities and large towns become more dense but attractive places to live. Large rural settlements may benefit, others will see reduction in population and employment without support of national policy.
• Transformational economic growth primarily through urban agglomeration and place-making.
• Strong fiscal and regulatory action set us on a pathway to zero carbon before 2050. Increased devolution leads to integrated transport and energy systems which deliver clean networks.
• Urban living reduces remote working and increases urban freight consolidation centres.
• Increased public and active transport, including shared mobility, as public and private travel becomes blurred.
• All new vehicles have a high level of autonomy, but are not fully autonomous by 2050. Shared AVs are well integrated into urban transport systems to complement public transport, but this doesn’t extend to rural areas or small towns. Opportunities are not available to all, both geographically and due to attitudes and abilities with technology, sharing and data use.
26
This document is Not for Publication - On-going Research
This document is Not for Publication - On-going Research
HGV BEV 38%
HGV Diesel 14% HGV Hydrogen 47%

27
This document is Not for Publication - On-going Research
This document is Not for Publication - On-going Research
27
Chapter 4 – Decarbonisation Pathways
Chapter 2 set out TfN’s Decarbonisation Trajectory and Chapter 3 introduced the Future Travel
Scenarios, which show varying levels of progress towards that trajectory as a result of background
trends and the different plausible policy approaches that national government might take. In this
chapter we examine the ‘policy gap’ that could exist between these baseline scenarios and the
trajectory, establishing the broad Decarbonisation Pathways that TfN and partners could seek to
follow to close the gap in the coming decades.
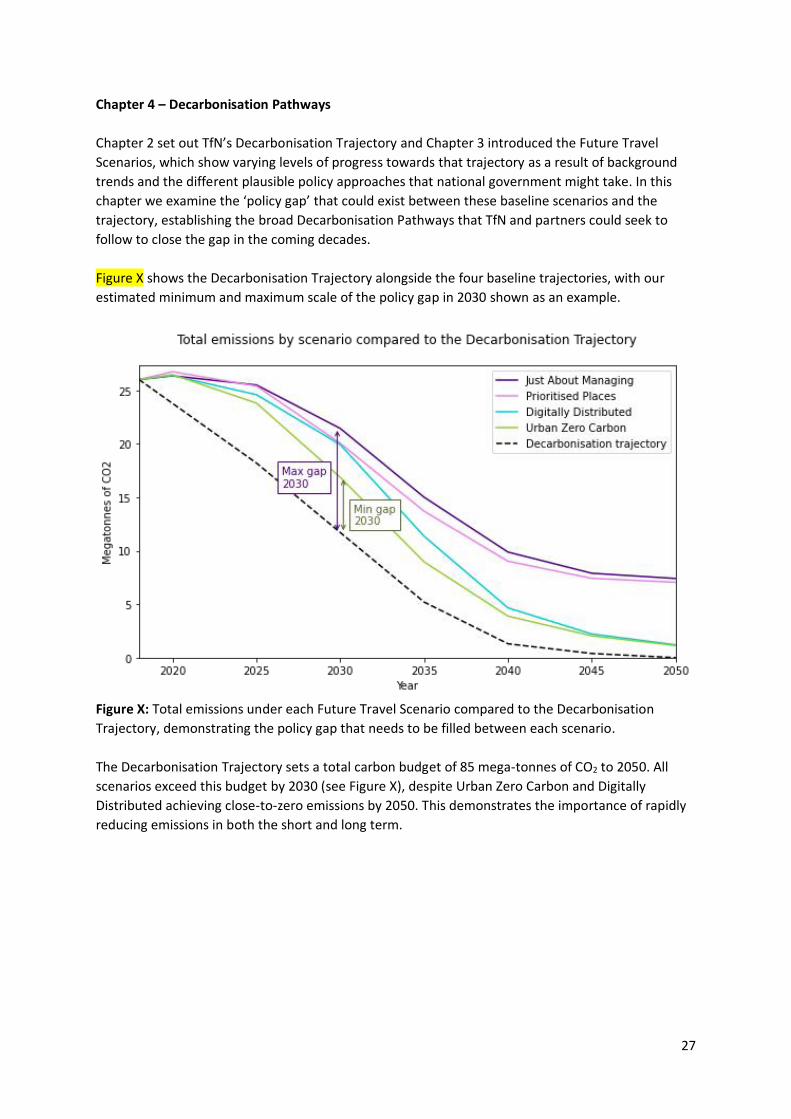
Figure X shows the Decarbonisation Trajectory alongside the four baseline trajectories, with our
estimated minimum and maximum scale of the policy gap in 2030 shown as an example.
Figure X: Total emissions under each Future Travel Scenario compared to the Decarbonisation
Trajectory, demonstrating the policy gap that needs to be filled between each scenario.
The Decarbonisation Trajectory sets a total carbon budget of 85 mega-tonnes of CO2 to 2050. All
scenarios exceed this budget by 2030 (see Figure X), despite Urban Zero Carbon and Digitally
Distributed achieving close-to-zero emissions by 2050. This demonstrates the importance of rapidly
reducing emissions in both the short and long term.
28
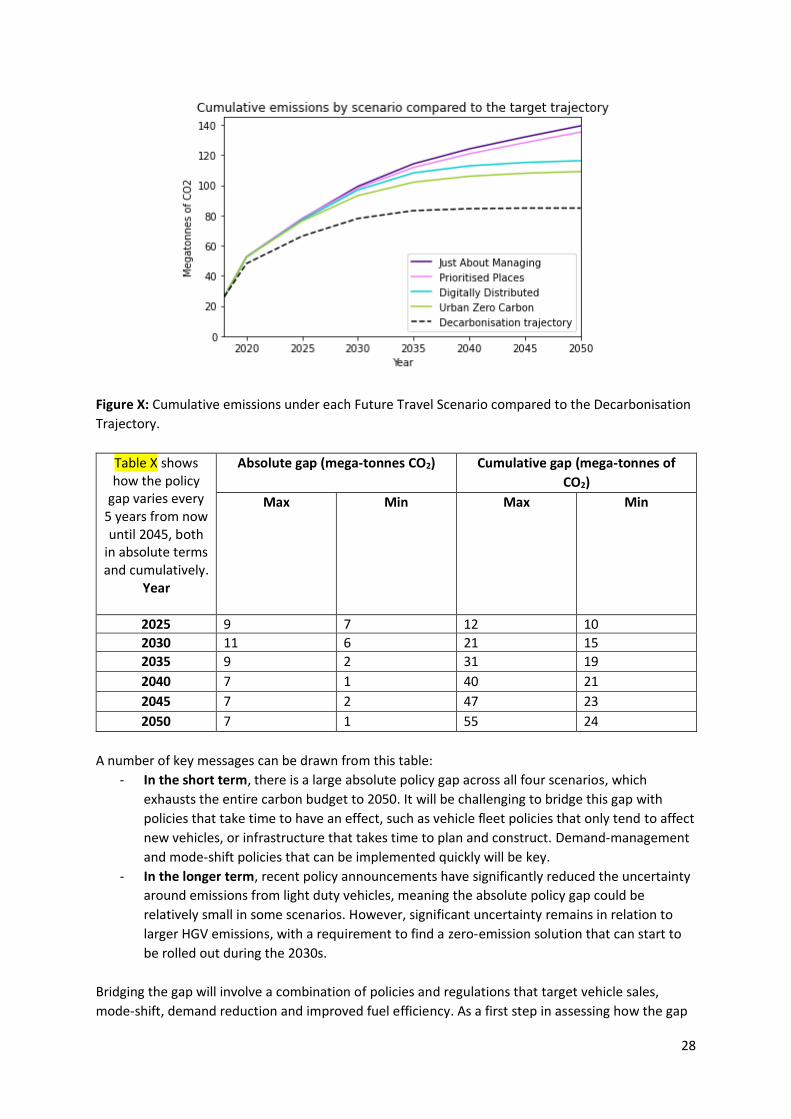
Figure X: Cumulative emissions under each Future Travel Scenario compared to the Decarbonisation
Trajectory.
Table X shows how the policy
gap varies every 5 years from now until 2045, both
in absolute terms and cumulatively.
Year
Absolute gap (mega-tonnes CO2) Cumulative gap (mega-tonnes of
CO2)
Max Min Max Min
2025 9 7 12 10
2030 11 6 21 15
2035 9 2 31 19
2040 7 1 40 21
2045 7 2 47 23
2050 7 1 55 24
A number of key messages can be drawn from this table:
- In the short term, there is a large absolute policy gap across all four scenarios, which
exhausts the entire carbon budget to 2050. It will be challenging to bridge this gap with
policies that take time to have an effect, such as vehicle fleet policies that only tend to affect
new vehicles, or infrastructure that takes time to plan and construct. Demand-management
and mode-shift policies that can be implemented quickly will be key.
- In the longer term, recent policy announcements have significantly reduced the uncertainty
around emissions from light duty vehicles, meaning the absolute policy gap could be
relatively small in some scenarios. However, significant uncertainty remains in relation to
larger HGV emissions, with a requirement to find a zero-emission solution that can start to
be rolled out during the 2030s.
Bridging the gap will involve a combination of policies and regulations that target vehicle sales,
mode-shift, demand reduction and improved fuel efficiency. As a first step in assessing how the gap
29
can be closed, we have established some broad-brush ‘rules of thumb’ on the scale of change
needed in the vehicle fleet and in road transport demand – we refer to these as our Decarbonisation
Pathways. In Chapter 5, we set out a more detailed analysis of the policies that might be needed to
achieve the required scale of change. This policy analysis forms the building blocks of our
Decarbonisation Strategy.
Each of the Future Travel Scenarios reflect the Government’s ban on the sale of new petrol and
diesel vehicles from 2030 and new hybrid vehicles by 2035, though the timing and potential for
decarbonisation of HGVs is still largely uncertain. While the 2030 ban is a significant reform, rapidly
increasing zero-emissions vehicle sales and shifting towards smaller, less polluting vehicles sales in
the period to 2025 will be crucial and further policy commitment will likely be needed.1
In addition to a change in fleet composition, policies that shift demand to active and public transport
modes, reduce demand overall and improve fuel efficiency will be necessary in both the short and
long-term. These policies are especially important in the short-term as fleet composition changes
and infrastructure developments take time to implement.
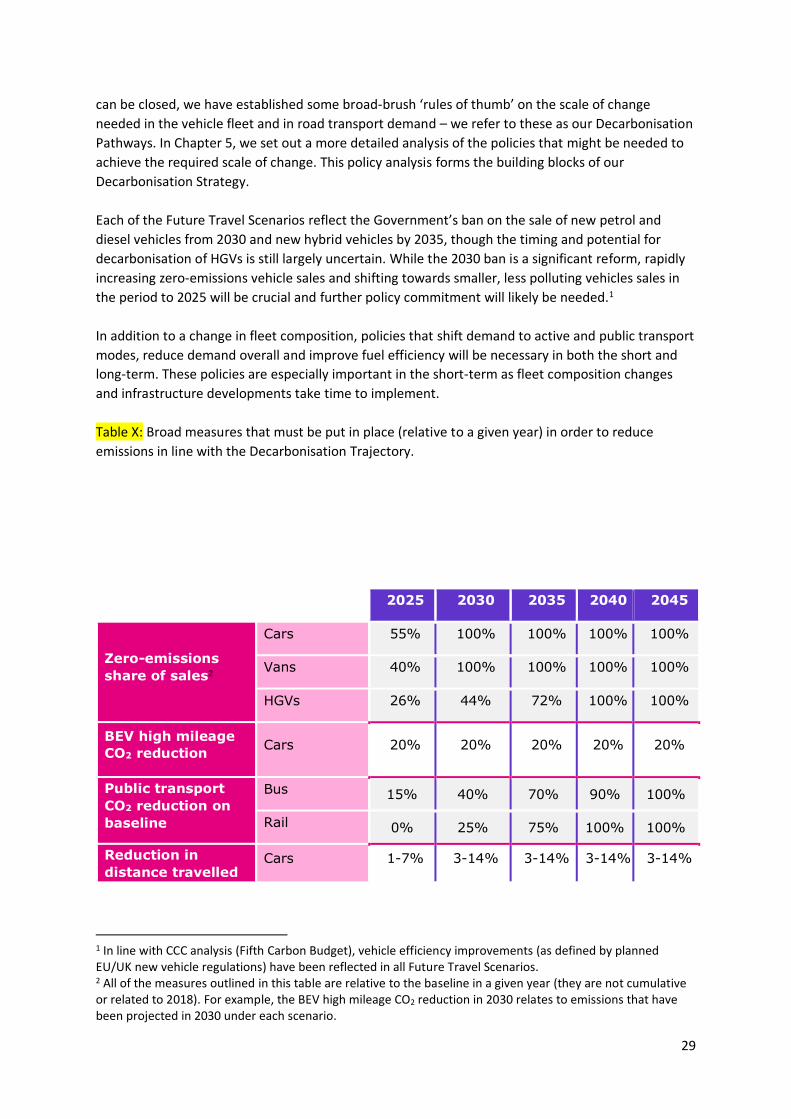
Table X: Broad measures that must be put in place (relative to a given year) in order to reduce
emissions in line with the Decarbonisation Trajectory.
1 In line with CCC analysis (Fifth Carbon Budget), vehicle efficiency improvements (as defined by planned EU/UK new vehicle regulations) have been reflected in all Future Travel Scenarios. 2 All of the measures outlined in this table are relative to the baseline in a given year (they are not cumulative or related to 2018). For example, the BEV high mileage CO2 reduction in 2030 relates to emissions that have been projected in 2030 under each scenario.
2025 2030 2035 2040 2045
Zero-emissions
share of sales2
Cars 55% 100% 100% 100% 100%
Vans 40% 100% 100% 100% 100%
HGVs 26% 44% 72% 100% 100%
BEV high mileage
CO2 reduction Cars 20% 20% 20% 20% 20%
Public transport
CO2 reduction on
baseline
Bus 15% 40% 70% 90% 100%
Rail 0% 25% 75% 100% 100%
Reduction in
distance travelled Cars 1-7% 3-14% 3-14% 3-14% 3-14%
30
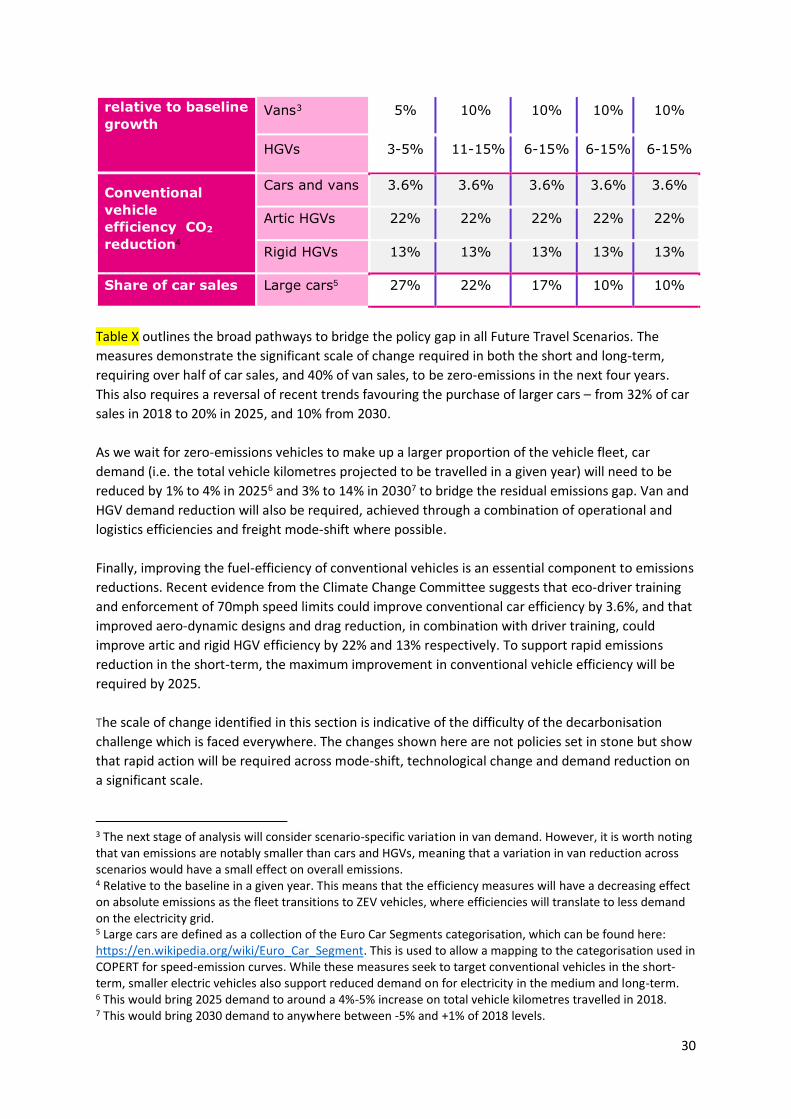
Table X outlines the broad pathways to bridge the policy gap in all Future Travel Scenarios. The
measures demonstrate the significant scale of change required in both the short and long-term,
requiring over half of car sales, and 40% of van sales, to be zero-emissions in the next four years.
This also requires a reversal of recent trends favouring the purchase of larger cars – from 32% of car
sales in 2018 to 20% in 2025, and 10% from 2030.
As we wait for zero-emissions vehicles to make up a larger proportion of the vehicle fleet, car
demand (i.e. the total vehicle kilometres projected to be travelled in a given year) will need to be
reduced by 1% to 4% in 20256 and 3% to 14% in 20307 to bridge the residual emissions gap. Van and
HGV demand reduction will also be required, achieved through a combination of operational and
logistics efficiencies and freight mode-shift where possible.
Finally, improving the fuel-efficiency of conventional vehicles is an essential component to emissions
reductions. Recent evidence from the Climate Change Committee suggests that eco-driver training
and enforcement of 70mph speed limits could improve conventional car efficiency by 3.6%, and that
improved aero-dynamic designs and drag reduction, in combination with driver training, could
improve artic and rigid HGV efficiency by 22% and 13% respectively. To support rapid emissions
reduction in the short-term, the maximum improvement in conventional vehicle efficiency will be
required by 2025.
The scale of change identified in this section is indicative of the difficulty of the decarbonisation
challenge which is faced everywhere. The changes shown here are not policies set in stone but show
that rapid action will be required across mode-shift, technological change and demand reduction on
a significant scale.
3 The next stage of analysis will consider scenario-specific variation in van demand. However, it is worth noting that van emissions are notably smaller than cars and HGVs, meaning that a variation in van reduction across scenarios would have a small effect on overall emissions. 4 Relative to the baseline in a given year. This means that the efficiency measures will have a decreasing effect on absolute emissions as the fleet transitions to ZEV vehicles, where efficiencies will translate to less demand on the electricity grid. 5 Large cars are defined as a collection of the Euro Car Segments categorisation, which can be found here: https://en.wikipedia.org/wiki/Euro_Car_Segment. This is used to allow a mapping to the categorisation used in COPERT for speed-emission curves. While these measures seek to target conventional vehicles in the short-term, smaller electric vehicles also support reduced demand on for electricity in the medium and long-term. 6 This would bring 2025 demand to around a 4%-5% increase on total vehicle kilometres travelled in 2018. 7 This would bring 2030 demand to anywhere between -5% and +1% of 2018 levels.
relative to baseline
growth Vans3 5% 10% 10% 10% 10%
HGVs 3-5% 11-15% 6-15% 6-15% 6-15%
Conventional
vehicle
efficiency CO2
reduction4
Cars and vans 3.6% 3.6% 3.6% 3.6% 3.6%
Artic HGVs 22% 22% 22% 22% 22%
Rigid HGVs 13% 13% 13% 13% 13%
Share of car sales Large cars5 27% 22% 17% 10% 10%
30
Chapter 5 – Policy analysis Within the previous chapters, we have:
1. introduced our four Future Travel Scenarios; 2. explained how they have been used to estimate future emissions (our baseline trajectories); 3. identified the difference between future emissions under each scenario and those that
would be required under our Decarbonisation Trajectory (known as the Policy Gap); 4. identified the broad-brush level of policy commitment required (our Decarbonisation
Pathways) to bridge those Policy Gaps and achieve our Decarbonisation Trajectory. This chapter provides further detail about the measures required to deliver on these policy commitments and the relevant roles and responsibilities of government, our Partners and TfN in implementing them. The measures are grouped into the following themes:
1. Zero Emission Vehicles (ZEVs) 2. Demand Management 3. Improvements to conventional vehicle efficiency
Each theme is accompanied by a high-level summary of policies and actions that our evidence suggests will help achieve the changes set out in Table X in chapter 4. This includes high-level analysis of the broad scale of policy commitment required under each theme, covering quantified and costed policies where possible. It also includes some high-level narrative on the distribution of responsibility across the themes:
1. TfN: Measures that could be effectively undertaken at a regional scale or a Sub-national Transport Body level of governance and therefore led or facilitated by TfN.
2. Government: Actions required by national government that should be brought forward in the Transport Decarbonisation Plan, including additional national policies and appropriate devolution of funding and powers.
3. TfN Partners: Measures that might be employed by our partners, subject to receiving sufficient national funding, recognising that each place within our region will have different decarbonisation timescales and different geographies, demographics and patterns of passenger and freight demand that require a bespoke place-based approach.
Further details of these packages of policies is provided in Annex A – Detailed policy recommendations. It’s important to note that the measures identified for consideration at a local level are intended as guidance for our partners to aid their consideration of the most effective mix of measures and actions, applicable to their individual places. We recognise that local policy makers are best placed to understand what will and won’t work, for the communities within their own areas. In recognition of the unique landscapes underlying each scenario, the magnitude of change varies across scenarios. This is especially the case for demand reduction, but applies across most other measures, where the gap between baseline projections and required decarbonisation changes (such as ZEV sales) is larger in some scenarios than others. This means our analysis has allowed us to develop supporting policy recommendations that can be adapted and implemented differently, depending on the evolution of future travel trends.
31
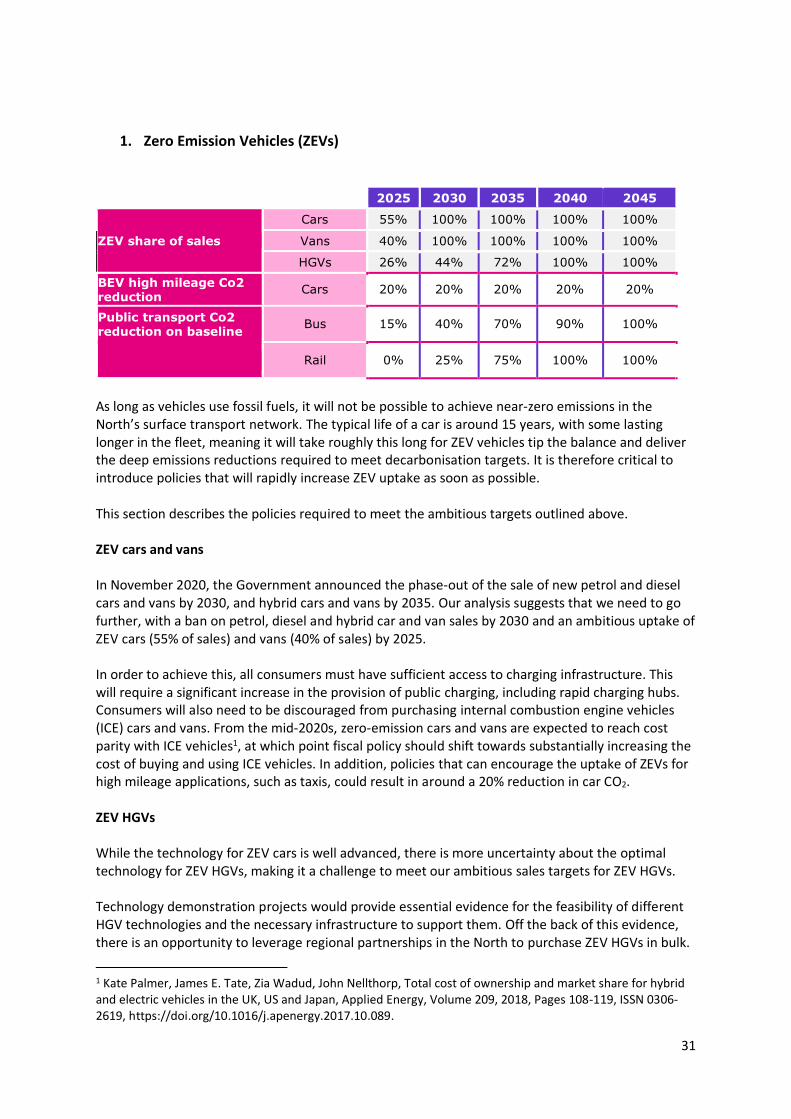
1. Zero Emission Vehicles (ZEVs)
2025 2030 2035 2040 2045
ZEV share of sales
Cars 55% 100% 100% 100% 100%
Vans 40% 100% 100% 100% 100%
HGVs 26% 44% 72% 100% 100%
BEV high mileage Co2 reduction
Cars 20% 20% 20% 20% 20%
Public transport Co2 reduction on baseline
Bus 15% 40% 70% 90% 100%
Rail 0% 25% 75% 100% 100%
As long as vehicles use fossil fuels, it will not be possible to achieve near-zero emissions in the North’s surface transport network. The typical life of a car is around 15 years, with some lasting longer in the fleet, meaning it will take roughly this long for ZEV vehicles tip the balance and deliver the deep emissions reductions required to meet decarbonisation targets. It is therefore critical to introduce policies that will rapidly increase ZEV uptake as soon as possible. This section describes the policies required to meet the ambitious targets outlined above. ZEV cars and vans In November 2020, the Government announced the phase-out of the sale of new petrol and diesel cars and vans by 2030, and hybrid cars and vans by 2035. Our analysis suggests that we need to go further, with a ban on petrol, diesel and hybrid car and van sales by 2030 and an ambitious uptake of ZEV cars (55% of sales) and vans (40% of sales) by 2025. In order to achieve this, all consumers must have sufficient access to charging infrastructure. This will require a significant increase in the provision of public charging, including rapid charging hubs. Consumers will also need to be discouraged from purchasing internal combustion engine vehicles (ICE) cars and vans. From the mid-2020s, zero-emission cars and vans are expected to reach cost parity with ICE vehicles1, at which point fiscal policy should shift towards substantially increasing the cost of buying and using ICE vehicles. In addition, policies that can encourage the uptake of ZEVs for high mileage applications, such as taxis, could result in around a 20% reduction in car CO2. ZEV HGVs While the technology for ZEV cars is well advanced, there is more uncertainty about the optimal technology for ZEV HGVs, making it a challenge to meet our ambitious sales targets for ZEV HGVs. Technology demonstration projects would provide essential evidence for the feasibility of different HGV technologies and the necessary infrastructure to support them. Off the back of this evidence, there is an opportunity to leverage regional partnerships in the North to purchase ZEV HGVs in bulk.
1 Kate Palmer, James E. Tate, Zia Wadud, John Nellthorp, Total cost of ownership and market share for hybrid and electric vehicles in the UK, US and Japan, Applied Energy, Volume 209, 2018, Pages 108-119, ISSN 0306-2619, https://doi.org/10.1016/j.apenergy.2017.10.089.
32
This would help draw significant numbers of vehicles into the region (with potential cost savings) and send a message to original equipment manufacturers (OEMs) that the demand is there. ZEV buses Electric buses are increasingly being trialled and rolled out across towns and cities, spurred on by the need to improve air quality as well as reduce carbon emissions. In general, these buses are being used for shorter routes where buses have more recharging opportunities, and longer routes will likely require technological improvements for electric buses, or hydrogen options. Decarbonising rail Route electrification is the most efficient way of reducing rail emissions in the long-term. Not only does it remove tailpipe emissions on those routes, but it supports the use of bi-mode trains on other routes. Overhead electrification also helps to improve rail journey times and reliability, making rail a more attractive mode of transport and encouraging mode shift. Improvements to rail services are covered in more detail in the Demand Management section below. Building on Network Rail’s Traction Network Decarbonisation Strategy (TNDS)2, a regional plan should be formulated laying out the order and timing in which higher-density routes will be electrified and identifying routes where alternative technology is a permanent solution. The current rail fleet in the North is of mixed vintage. There is scope to develop a plan that cascades rolling stock as electrification develops to push out the worst polluters. Electric-only trains are a known quantity and low-risk, but other ZEV technologies (battery-electric, battery and hydrogen) will need further testing to understand their viability2: 1. Battery technology is emerging rapidly, but range is constrained, and it requires charging
infrastructure. 2. Hydrogen presents risks around the quantity needed and the knock-on impacts on operational
costs (fuelling time and capacity to carry fuel needed).
2 Traction Decarbonisation Network Strategy, Interim Programme Business Case, Network Rail (2020)
ZEV policy in action: In 2020, Norway became the first country in the world to see the sale of
electric cars overtake those of petrol, diesel and hybrid vehicles. Battery electric vehicles
(BEVs) sales made up over 54 per cent of all new cars sold in 2020, up from over 42 per cent in
2019. Norway is currently leading the way in EV ownership in Europe. By 2025, the country
aims to ban the sale of all fossil fuel cars. Oslo launched its first municipal EV charging
infrastructure program in 2008, providing incentives including free parking for EVs, exemption
from a congestion tax, and exemptions from Low Emission Zone (LEZ) fees. Only zero tailpipe
emission taxis will be able to operate in the city from 2023. The city is deploying fossil free
public transport from 2020 and is considering a ban on petrol and diesel cars within the city
centre by 2024
ZEV policy in action: In Sweden, an increase in EV usage can be traced to the government’s
recently adjusted incentive scheme that sees a tax increase for vehicles with high emissions. In
addition, cars with low CO2 emissions can receive up to €5,700 as a grant.
33
Quantifying the policy commitment – ZEVs Global action to build new markets for Electric Vehicles, as well as wider investment in battery technology and manufacturing processes, has led to significant reductions in the costs of ZEV cars and vans. However, to achieve the ambitious levels of uptake in our pathway, further policy commitment will be required in the 2020s. As noted above, a combination of policies that help to differentiate the upfront costs of new ZEV and ICE vehicles will be required, as well as a coherent and comprehensive approach to the electric chargepoint network, involving a mixture of public and private investment. ZEV HGVs will require a similar combination of investment in vehicles and infrastructure, with public funding required to accelerate the transition. Decarbonising rail will require primarily public investment and infrastructure and rolling stock, but there are significant wider public benefits to these investments that offset some of these costs. Table X summarises our high-level quantification of the policy commitments and investments required for the North to 2030.
Area High-level quantification of policy commitment for the North (2020 prices)
Notes on implementation and public/private investment split
ZEV cars and vans
To reach our 2025 pathway, grants or equivalent tax differentials for new ZEVs need to continue until around 2022, totalling around £210m in 2021 and £590m in 2022 for the Northern car and van fleet3. Around £230m annual investment in Northern charging infrastructure is needed by 2025, and around £350m by 20304. This will deliver around 2.4 million installed chargepoints across the region by 2030.
Support for vehicles could be focused on taxation (e.g. VED), with minimal or modest additional grant funding. Some public investment is needed for charging infrastructure, but a proportion could be delivered by private investment if the Government develops new markets and innovative regulatory regimes.
ZEV HGVs
Grants or equivalent tax differentials for ZEV HGVs need to be introduced in the next few years, ramping up to a total of around £2m in 2025 and £50m in 2030 for the Northern HGV fleet5. Around £110m cumulative investment in Northern HGV charging and refuelling infrastructure is needed by 20306.
More significant public investment in vehicles and infrastructure likely to be needed initially, but private investment could take over in the 2030s. An even fleet share of electric and hydrogen fuelled ZEV HGVs is assumed in these costing estimates, in line with CCC assumptions.
Decarbonising rail
The Network Rail TDNS interim business case suggests that a zero-emission rail network by 2040 could have a net present value ranging from a £4.4bn net cost to a £480m net benefit, with much of this wide range due to uncertain technology costs. This is a whole UK figure as Network Rail did not split these costs out by region. TfN
Mostly public investment required, but there are also significant wider public benefits, such as faster, more reliable journeys.
3 Cost outputs are developed using Element Energy’s car and van choice model ECCo, developed for DfT 4 Calculated by Element Energy for TfN using a method developed by the ICCT, which can be found here: https://theicct.org/publications/charging-gap-UK-2020 5 Cost outputs are developed using Element Energy’s truck choice model, developed for CCC 6 Data taken from Ricardo analysis for the CCC and scaled to match TfN area, available at: : https://www.theccc.org.uk/publication/zero-emission-hgv-infrastructure-requirements/
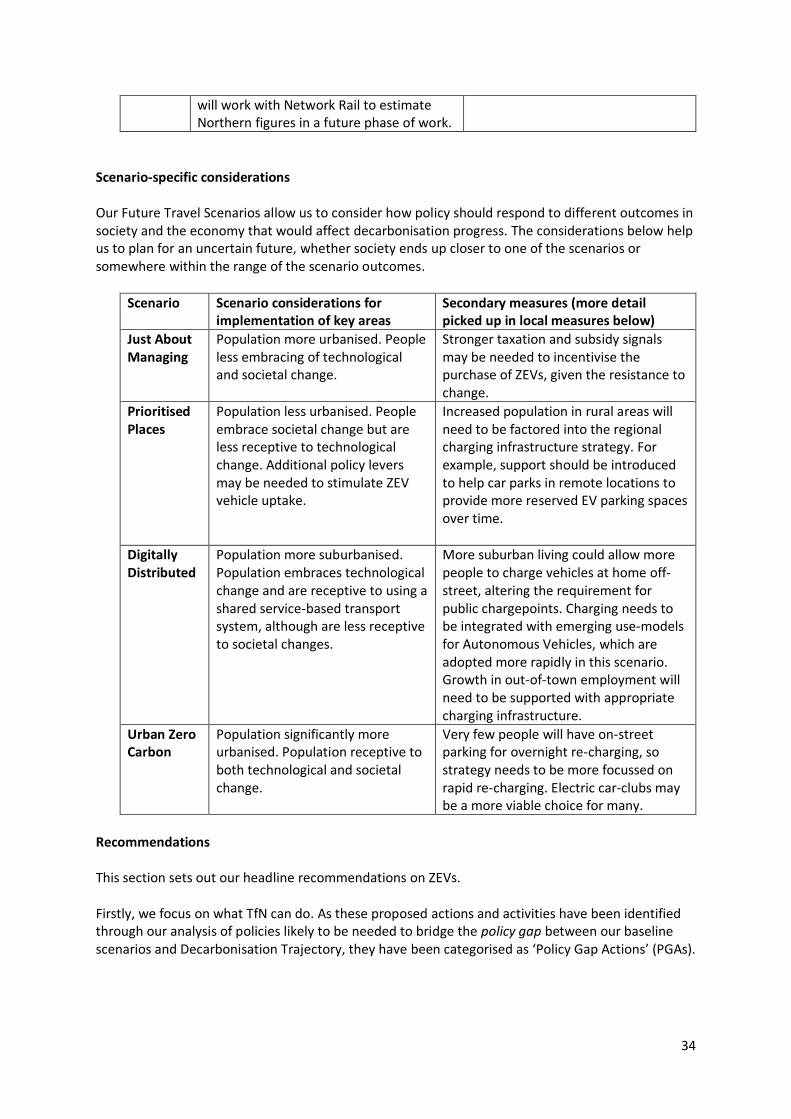
34
will work with Network Rail to estimate Northern figures in a future phase of work.
Scenario-specific considerations Our Future Travel Scenarios allow us to consider how policy should respond to different outcomes in society and the economy that would affect decarbonisation progress. The considerations below help us to plan for an uncertain future, whether society ends up closer to one of the scenarios or somewhere within the range of the scenario outcomes.
Scenario Scenario considerations for implementation of key areas
Secondary measures (more detail picked up in local measures below)
Just About Managing
Population more urbanised. People less embracing of technological and societal change.
Stronger taxation and subsidy signals may be needed to incentivise the purchase of ZEVs, given the resistance to change.
Prioritised Places
Population less urbanised. People embrace societal change but are less receptive to technological change. Additional policy levers may be needed to stimulate ZEV vehicle uptake.
Increased population in rural areas will need to be factored into the regional charging infrastructure strategy. For example, support should be introduced to help car parks in remote locations to provide more reserved EV parking spaces over time.
Digitally Distributed
Population more suburbanised. Population embraces technological change and are receptive to using a shared service-based transport system, although are less receptive to societal changes.
More suburban living could allow more people to charge vehicles at home off-street, altering the requirement for public chargepoints. Charging needs to be integrated with emerging use-models for Autonomous Vehicles, which are adopted more rapidly in this scenario. Growth in out-of-town employment will need to be supported with appropriate charging infrastructure.
Urban Zero Carbon
Population significantly more urbanised. Population receptive to both technological and societal change.
Very few people will have on-street parking for overnight re-charging, so strategy needs to be more focussed on rapid re-charging. Electric car-clubs may be a more viable choice for many.
Recommendations This section sets out our headline recommendations on ZEVs. Firstly, we focus on what TfN can do. As these proposed actions and activities have been identified through our analysis of policies likely to be needed to bridge the policy gap between our baseline scenarios and Decarbonisation Trajectory, they have been categorised as ‘Policy Gap Actions’ (PGAs).
35
We have then turned to the areas the Government should prioritise in its Transport Decarbonisation Plan and subsequent actions, and finally look at recommendations for our partners to consider. Further detail is provided in Annex A – Detailed Policy Recommendations. TfN – What actions should we prioritise? Road vehicles PGA1: Develop a pan-northern ZEV infrastructure plan to ensure trans-boundary road trips are considered, factoring in interoperability across the region and optimal locations for high-power charging hubs on the Major Road Network, with input from Local Authorities and the Distribution Network Operators (DNOs). PGA2: Work with Local Authority partners and Highways England to facilitate large ZEV truck trials in high traffic corridors in the North. PGA3: Work with Local Authorities and freight stakeholders to help aggregate large orders of ZEV vans and trucks across the North and overcome demand shortages. Rail PGA4: Through the Northern Powerhouse Rail programme, support the government and Network Rail in identifying appropriate routes for electrification and associated implementation. PGA5: Work with Network Rail and train operating companies to ensure service patterns are based around the progression of electrification and minimising the use of diesel-only trains. PGA6: Influence Government to trial alternative technology freight locomotives in the North. PGA7: Work with Network Rail to ensure there is sufficient capacity to allow freight traffic to run directly and with minimal dwell times, reducing emissions from existing diesels. National Government – What actions are needed in the Transport Decarbonisation Plans and Subsequent Actions? Road vehicles
1. Strengthen the existing policy to phase-out ICE car and van sales by 2030 to include hybrids. 2. Increase taxes on new ICE vehicles from the early 2020s, with rates escalating in line with
emissions intensity. 3. Develop a coherent and comprehensive strategy for charging infrastructure, defining a role
for local and regional bodies, providing public funding where appropriate and developing a regulatory regime that enables the private sector to invest and ensure interoperability.
4. As more ZEV HGV models become available in the 2020s, introduce a system of strong grants and tax incentives.
5. Fund large ZEV HGV trials in high-traffic corridors. 6. Implement measures to rapidly increase supply of ZEV models. This could include measures
that stimulate domestic manufacture, which also have the potential to drive green growth in the North (see Chapter 8).
Rail
1. In partnership with Network Rail, identify and fund a core network for electrification with the highest traffic density, then prioritise secondary, lower density routes where alternative technology will be the permanent solution.
2. For routes where alternative technology is the long-term solution, provide funding to procure new rolling stock.

36
3. In partnership with delivery bodies, work with freight operating companies to understand the need for incremental electrification of freight.
4. Support freight operating companies and rolling stock builders in the development of alternative technology freight locomotives.
Local Partners – Where should local action be prioritised? General
1. Develop a model for delivery and maintenance of electric vehicle charging infrastructure,
covering rapid hubs, on-street charging, public parking spaces, and council fleets. Initially
proactive bidding for Government funds will be needed, but over time private sector
investment will support this, subject to an effective national and local regulatory regime.
2. Implement a common procurement framework for infrastructure across administrative
areas to encourage economies of scale and interoperability across the region.
3. Carry out community engagement to increase understanding of EVs and EV infrastructure.
4. Implement policies to prioritise ZEV shared transport, such as car share and car clubs.
5. Collectively adopt taxi licensing policies that require new vehicles to be zero-emission. This
will need to be coupled with provision of charging infrastructure at taxi ranks.
6. Aggregate purchases of ZEV vans and trucks across the North (supported by TfN).
7. Engage with bus operators to set targets and standards for rapid roll-out of ZEV buses.
In smaller towns, villages and dispersed communities: 8. Incentivise EV uptake (including electric bikes) and development of home charging
infrastructure through direct funding and awareness raising (e.g. telematic tests, EV trials). 9. Develop charging infrastructure at rural tourist spots to counter range anxiety. These should
be developed in such a way to avoid unsustainable traffic levels within protected rural areas (e.g. National Park park & ride schemes).
2. Demand management
2025 2030 2035 2040 2045
Reduction in distance
travelled relative to
baseline growth
Cars 1-7% 3-14% 3-14% 3-14% 3-14%
Vans 5% 10% 10% 10% 10%
HGVs 3-5% 11-15% 6-15% 6-15% 6-15%
As it will take time for new ZEV vehicle sales to translate into a substantial proportion of the fleet, it is essential to shift journeys away from private cars to sustainable modes and find ways to avoid journeys. In the long term, as the fleet becomes predominantly electrified, even if running on energy generated through renewable sources, a ZEV will still have a significant carbon footprint through the emissions embodied in its manufacture. Travel demand reduction also provides a range of other co-benefits, even with a predominantly electrified fleet, such as improving local air quality and safety whilst reducing congestion and avoiding potential transport related social exclusion issues. A shift to active travel also has the potential to improve the physical and mental wellbeing of users. These demand reductions will require significant behavioural change – from a culture focused on personal car use to one that
37
embraces shared mobility and active travel – and a comprehensive set of policies and supporting infrastructure to facilitate it. There is a large and growing evidence base on the policies required to achieve this behaviour change7. Here we summarise the key areas:
1. Encouraging mode shift to walking, cycling, micro-mobility and public transport 2. Disincentivising car use and avoiding travel 3. Encouraging the uptake of shared mobility 4. Improving freight efficiency 5. Ensuring transport and land-use planning processes encourage sustainable choices
Encouraging mode shift to walking, cycling, micro-mobility and public transport To achieve significant mode shift, investment will be required in bus, rail and cycling infrastructure to improve journey times and quality and ensuring these networks are accessible and affordable to all. Funding must be made available for bus and rail, including: investment to deliver improved journey times and reliability; targeted reduction and flexibility in fares; network expansions; and fleet improvements. Marketing and engagement must also be used to rebuild public confidence in the safety and value of public transport following the pandemic. Increasing uptake in active travel will require policies and investments that promote comfort, safety and convenience. Local planning policies can play a role, for example by protecting pedestrian use of pavements and supporting active commuting by requiring workplaces to provide appropriate facilities. Policies should also promote safe and accessible use of e-bikes and scooters for longer distance trips. Both local and national planning policy should place greater emphasis on the location of new development in relation to existing and proposed public transport hubs. New developments without easy access to public transport should consider how appropriate alternatives are incorporated (e.g. shared transport solutions). A related approach is to remove the need to travel long distances by creating ‘15- or 20-minute neighbourhoods’, where residents can meet most needs within a short walk or cycle and use public transport to access other services. Disincentivising car use and avoiding travel In addition to making alternative options more attractive, policies that make car travel less attractive or encourage people to avoid travel altogether should be part of the mix. These policies can also generate revenue that can be reinvested in sustainable transport solutions. These measures will be particularly important given the low running costs of Electric Vehicles, which will lead to significant demand growth and make mode shift more difficult if appropriate price signals are not introduced. Road user charging could be one option to manage demand as a complement to and eventual replacement for fuel duty. This could include measures such as congestion charging and road tolls. Smart technology solutions should be used to target charges at the most congested times of day, the most polluting vehicles and at discretionary car trips, rather than essential travel, for example by key workers. Time-of-day and emissions-based pricing would have the added benefits of improving network efficiency and incentivising the purchase of ZEVs. Parking policy is another important tool to manage demand for car travel. This can include reducing parking supply in urban centres and introducing schemes like a Workplace Parking Levy (see example
7 See for example:
- https://www.gov.uk/government/publications/switching-to-sustainable-transport-a-rapid-evidence-assessment
- https://www.transportforqualityoflife.com/policyresearch/ - https://www.local.gov.uk/decarbonising-transport
38
box X). City centre land occupied by parking is often valuable and can be repurposed, for example as cycling infrastructure or green space. Related policies that restrict car access, such as Low Traffic Neighbourhoods, can also be effective at reducing car use and car ownership. Working from home has become a necessity for many during 2020, and this has been linked to a decrease in car traffic. Ongoing home-working after the pandemic will lead to fewer commuter trips, but evidence is mixed on the net carbon impact of this trend due to travel activities that can replace commuting or using more energy per person in the home setting compared to the office. On balance, evidence suggests there is likely to be an energy saving in most circumstances8 and home-working should be supported, particularly where it provides other benefits to quality of life. Encouraging the uptake of shared mobility Shared mobility refers to a number of different services that make low or zero emission vehicles accessible to people. They can involve lift sharing, car hire, car clubs, demand-responsive bus services, taxis, and cycle and e-scooter hire schemes. Widespread availability of such services can reduce the need to own a car, and lower car ownership is strongly correlated with lower car use9. Use of shared vehicles can be encouraged through the provision of dedicated car club parking spaces combined with stringent parking standards for new development. The use of planning obligations and the Community Infrastructure Levy can fund shared vehicle provision in new developments. Similar approaches can be adopted with cycle hire schemes, and the UK e-scooter trial offers an opportunity to increase the impact of such schemes by incorporating new forms of mobility. Demand-responsive bus services are more convenient for many travellers than traditional bus services in that they are not bound to a fixed route or timetable. Supporting the provision of these services would help reduce car dependency and complement established public transport networks. This may be particularly important in settings with lower population density, where traditional public transport services need to be heavily subsidised. Mobility-as-a-Service (MaaS) can encompass the benefits of all these modes, providing a platform to access different mobility solutions. Such services offer reduced cost, low-carbon options in areas with low EV home-charging potential, linking public transport and improving accessibility and reliability. ‘Mobility Credits’ could be used as an incentive to trade older, more polluting private cars for public transport or shared vehicle use. Improving freight efficiency Freight operators are already strongly incentivised towards efficiency, as it helps them to increase their competitiveness. However, some opportunities are not being taken due to market failures, such as a lack of information, an inability to coordinate between operators, or a consumer willingness to pay for fast deliveries at the expense of energy efficient outcomes. These barriers can be overcome through a number of policies described below. Road-user charging is one way to incentivise operators to use vehicles more efficiently. By increasing the unit cost per mile, there will be an additional incentive to reduce vehicles running empty which will improve vehicle efficiency and make rail a more financially competitive option. This would be complemented by other freight efficiency measures, where information and technology alternatives help prevent policy costs being passed on to consumers.
8 A systematic review of the energy and climate impacts of teleworking. Hook et, al, ERL (2020) 9 https://www.creds.ac.uk/shared-mobility-where-now-where-next/
39
‘Just-in-time’ deliveries and next day deliveries can significantly reduce opportunities for freight consolidation. A campaign to encourage shippers to offer a green shipping option as standard could demonstrate best practice, whilst lower prices for, and the provision of information about, green shipping options could influence consumer behaviour. Other ‘green’ shipping practices include deliveries in low traffic periods and encouraging consumer uptake of local community drop off/pick up points, reducing emissions due to congestion and improving last-mile delivery efficiency. Accurate and sharable data on goods and vehicles could allow optimisation between companies that reduces empty running of vehicles. Data formats and sharing protocols must be designed to allow this sharing without risk of prosecution under anti-collusion regulation. This sharing would also enable government and local planning bodies to track freight data to make evidence-based decisions about freight optimisation and consolidation centre planning. Ensuring transport and land-use planning processes encourage sustainable choices The transport and land-use planning process can have a substantial impact on the relative investment in car use versus more sustainable modes. Several of the policies outlined above are determined by this process but in this section, we focus on the processes themselves. Augmented project appraisal processes could encourage a reduction in demand through a stronger focus on projects’ environmental impacts. This would see a more rigorous assessment of a transport project’s impact on carbon, air quality and the urban realm, as well as the whole life carbon impacts of infrastructure development and of manufacturing cars. There is also an opportunity to improve integration between public health and transport. Health providers could disseminate resources to encourage physical activity to replace short car trips, and land-use planning could be integrated with behavioural change programmes to reduce carbon. Scenario-specific considerations
Scenario Scenario considerations for implementation of key areas
Secondary measures (more detail picked up in local measures below)
Just About Managing
Population more urbanised. People less embracing of technological and societal change.
Slow progress in ZEV and public transport uptake may mean more restrictive additional measures on car travel.
Prioritised Places
Population less urbanised. People embrace societal change but are less receptive to technological change.
Regulation to support rural on-demand MaaS services. Enabling home-working in remote areas by ensuring full fibre internet access. Implement planning policy to support localisation of travel needs. Direct mobility credit schemes at communities in smaller towns with fewer public transport options, and at those living in areas of low EV home-charging capability.
Digitally Distributed
Population more sub-urbanised. Population embraces technological change and are receptive to using a shared service-based transport system, although are less receptive to societal changes.
With a more distributed population, e-bikes in particular, may be an effective way to increase the uptake of active travel modes for those living in more dispersed communities. Supporting strategic park-and-ride to avoid CAVs congesting urban areas. Implement policies to promote CAVs in a way that increases the coverage of MaaS systems, particularly to connect town and cities.
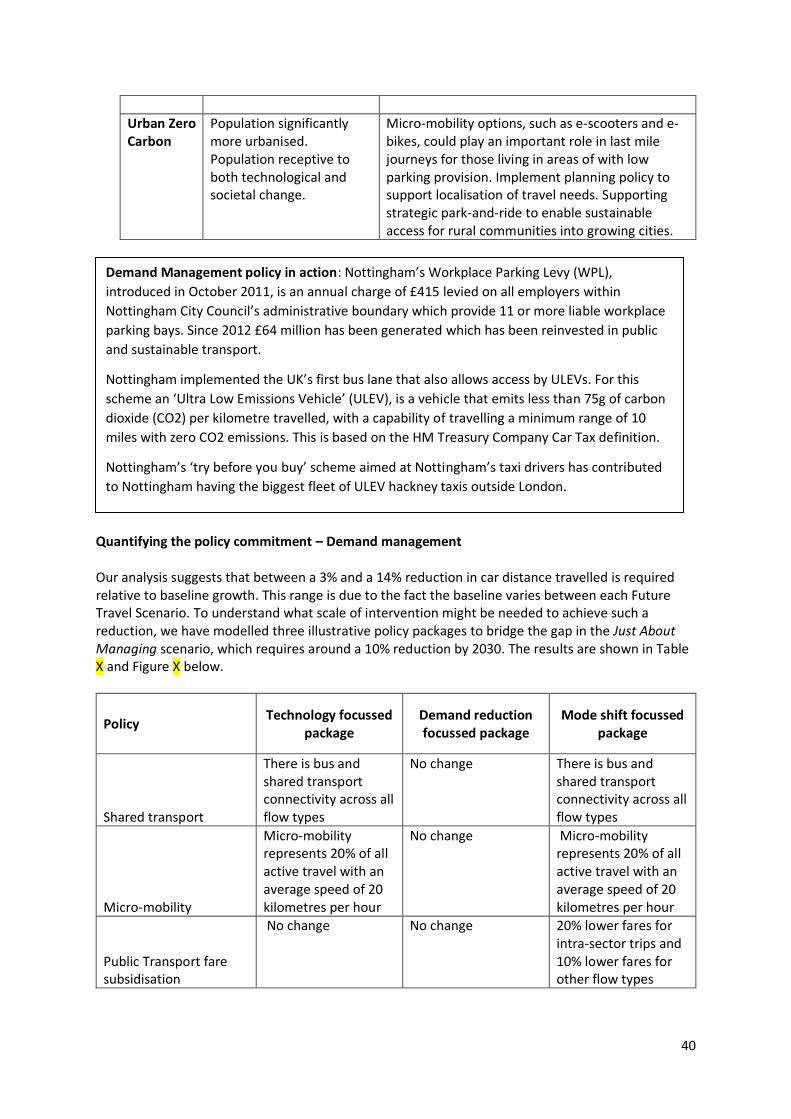
40
Urban Zero Carbon
Population significantly more urbanised. Population receptive to both technological and societal change.
Micro-mobility options, such as e-scooters and e-bikes, could play an important role in last mile journeys for those living in areas of with low parking provision. Implement planning policy to support localisation of travel needs. Supporting strategic park-and-ride to enable sustainable access for rural communities into growing cities.
Quantifying the policy commitment – Demand management Our analysis suggests that between a 3% and a 14% reduction in car distance travelled is required relative to baseline growth. This range is due to the fact the baseline varies between each Future Travel Scenario. To understand what scale of intervention might be needed to achieve such a reduction, we have modelled three illustrative policy packages to bridge the gap in the Just About Managing scenario, which requires around a 10% reduction by 2030. The results are shown in Table X and Figure X below.
Policy Technology focussed
package Demand reduction focussed package
Mode shift focussed package
Shared transport
There is bus and shared transport connectivity across all flow types
No change There is bus and shared transport connectivity across all flow types
Micro-mobility
Micro-mobility represents 20% of all active travel with an average speed of 20 kilometres per hour
No change Micro-mobility represents 20% of all active travel with an average speed of 20 kilometres per hour
Public Transport fare subsidisation
No change No change 20% lower fares for intra-sector trips and 10% lower fares for other flow types
Demand Management policy in action: Nottingham’s Workplace Parking Levy (WPL),
introduced in October 2011, is an annual charge of £415 levied on all employers within
Nottingham City Council’s administrative boundary which provide 11 or more liable workplace
parking bays. Since 2012 £64 million has been generated which has been reinvested in public
and sustainable transport.
Nottingham implemented the UK’s first bus lane that also allows access by ULEVs. For this
scheme an ‘Ultra Low Emissions Vehicle’ (ULEV), is a vehicle that emits less than 75g of carbon
dioxide (CO2) per kilometre travelled, with a capability of travelling a minimum range of 10
miles with zero CO2 emissions. This is based on the HM Treasury Company Car Tax definition.
Nottingham’s ‘try before you buy’ scheme aimed at Nottingham’s taxi drivers has contributed
to Nottingham having the biggest fleet of ULEV hackney taxis outside London.
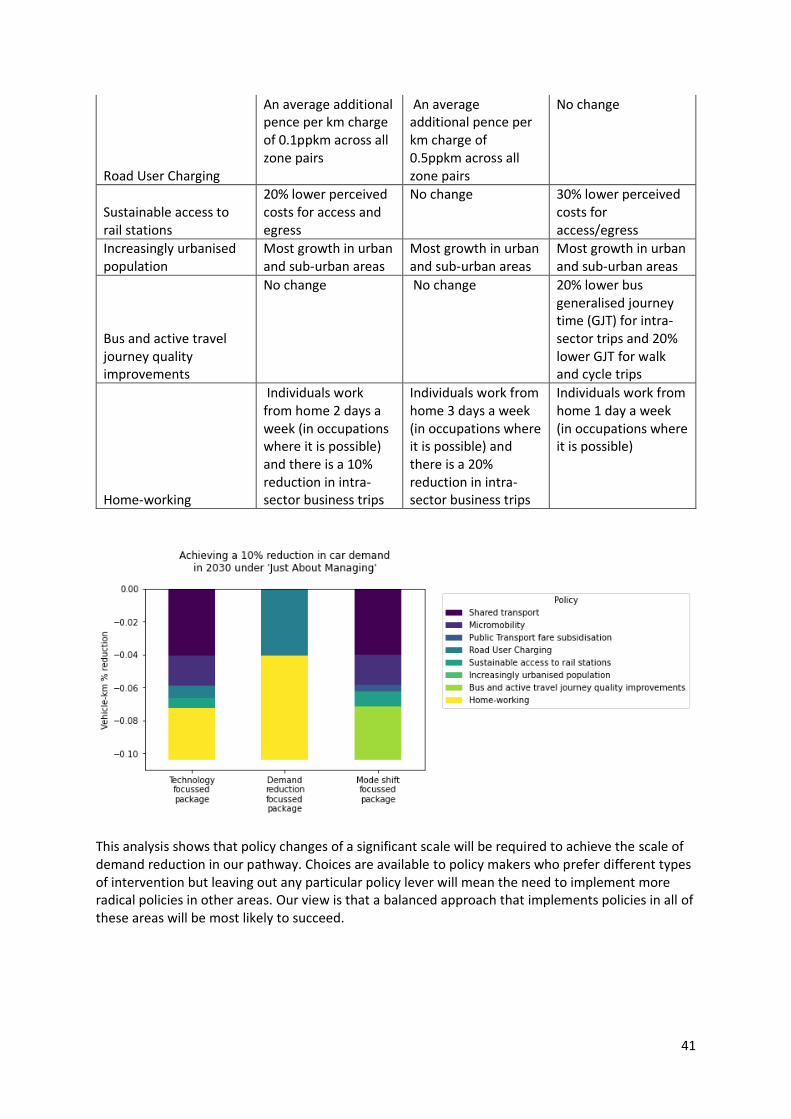
41
Road User Charging
An average additional pence per km charge of 0.1ppkm across all zone pairs
An average additional pence per km charge of 0.5ppkm across all zone pairs
No change
Sustainable access to rail stations
20% lower perceived costs for access and egress
No change 30% lower perceived costs for access/egress
Increasingly urbanised population
Most growth in urban and sub-urban areas
Most growth in urban and sub-urban areas
Most growth in urban and sub-urban areas
Bus and active travel journey quality improvements
No change No change 20% lower bus generalised journey time (GJT) for intra-sector trips and 20% lower GJT for walk and cycle trips
Home-working
Individuals work from home 2 days a week (in occupations where it is possible) and there is a 10% reduction in intra-sector business trips
Individuals work from home 3 days a week (in occupations where it is possible) and there is a 20% reduction in intra-sector business trips
Individuals work from home 1 day a week (in occupations where it is possible)
This analysis shows that policy changes of a significant scale will be required to achieve the scale of demand reduction in our pathway. Choices are available to policy makers who prefer different types of intervention but leaving out any particular policy lever will mean the need to implement more radical policies in other areas. Our view is that a balanced approach that implements policies in all of these areas will be most likely to succeed.
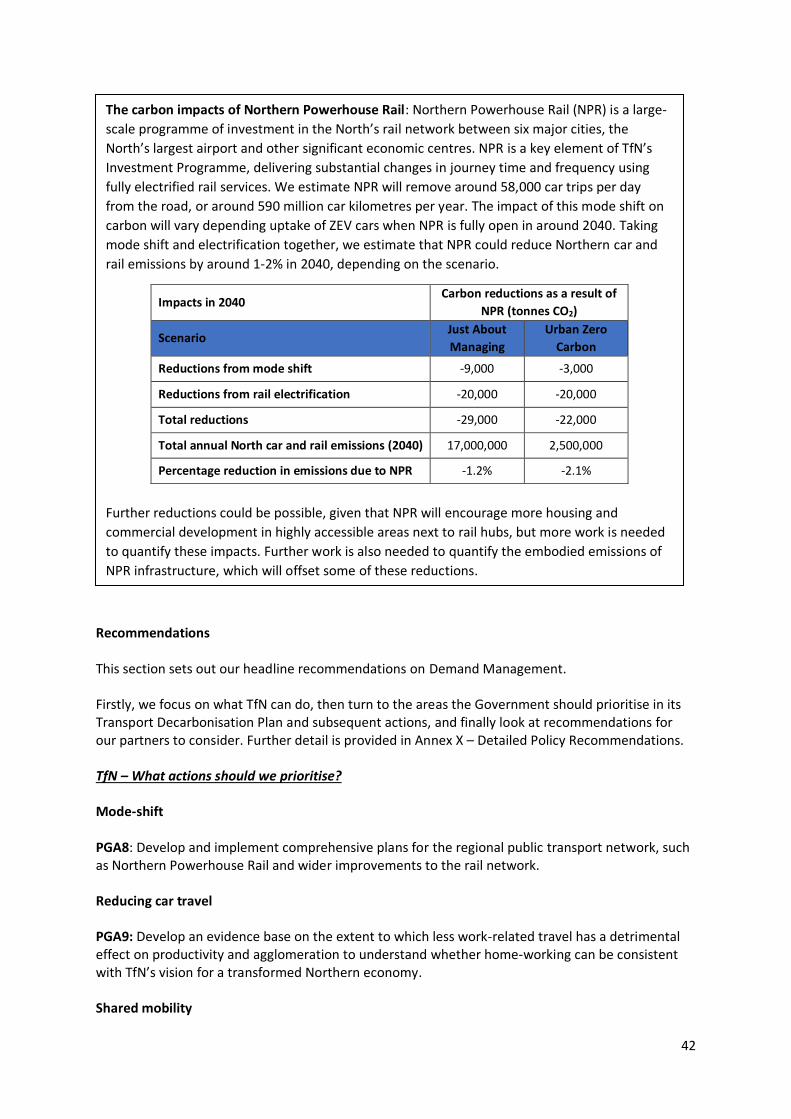
42
Recommendations This section sets out our headline recommendations on Demand Management. Firstly, we focus on what TfN can do, then turn to the areas the Government should prioritise in its Transport Decarbonisation Plan and subsequent actions, and finally look at recommendations for our partners to consider. Further detail is provided in Annex X – Detailed Policy Recommendations. TfN – What actions should we prioritise? Mode-shift PGA8: Develop and implement comprehensive plans for the regional public transport network, such as Northern Powerhouse Rail and wider improvements to the rail network. Reducing car travel PGA9: Develop an evidence base on the extent to which less work-related travel has a detrimental effect on productivity and agglomeration to understand whether home-working can be consistent with TfN’s vision for a transformed Northern economy. Shared mobility
The carbon impacts of Northern Powerhouse Rail: Northern Powerhouse Rail (NPR) is a large-
scale programme of investment in the North’s rail network between six major cities, the
North’s largest airport and other significant economic centres. NPR is a key element of TfN’s
Investment Programme, delivering substantial changes in journey time and frequency using
fully electrified rail services. We estimate NPR will remove around 58,000 car trips per day
from the road, or around 590 million car kilometres per year. The impact of this mode shift on
carbon will vary depending uptake of ZEV cars when NPR is fully open in around 2040. Taking
mode shift and electrification together, we estimate that NPR could reduce Northern car and
rail emissions by around 1-2% in 2040, depending on the scenario.
Impacts in 2040 Carbon reductions as a result of
NPR (tonnes CO2)
Scenario Just About
Managing
Urban Zero
Carbon
Reductions from mode shift -9,000 -3,000
Reductions from rail electrification -20,000 -20,000
Total reductions -29,000 -22,000
Total annual North car and rail emissions (2040) 17,000,000 2,500,000
Percentage reduction in emissions due to NPR -1.2% -2.1%
Further reductions could be possible, given that NPR will encourage more housing and
commercial development in highly accessible areas next to rail hubs, but more work is needed
to quantify these impacts. Further work is also needed to quantify the embodied emissions of
NPR infrastructure, which will offset some of these reductions.
43
PGA10: Use our role on within the Rail North Partnership to promote shared mobility at train stations, including car share, car club, cycle hire and e-scooter schemes. PGA11: Provide evidence and strategic support to partners to identify opportunities for shared mobility. Freight efficiency PGA12: Work with Government to support regional coordination of measures to improve logistics efficiency, including consolidation centres, mode shift to rail and information democratisation schemes. Planning policies PGA13: Influence government to develop appraisal guidance that includes the full impacts of transport projects on carbon. National Government – What actions are needed in the Transport Decarbonisation Plans? Mode-shift
1. Work with train operating companies to implement a targeted reduction in rail fares and increase integration and flexibility of ticketing systems.
2. Provide a substantial and consistent funding stream to Local Authorities to improve public transport and active travel networks.
Reducing car travel 3. Develop a coherent plan for taxing and pricing car travel that accounts for reduced Fuel Duty
revenues and incentivises key outcomes such as reduced overall car travel, more efficient road network operation and uptake of ZEVs.
4. Support employers to roll-out home working, flexible working and remote working hubs. Shared mobility
5. Ensure Local Authority funding and planning regimes support share mobility solutions alongside traditional public transport options.
6. Require employers to report on emissions from all employee travel to encourage a shift towards vehicle sharing.
Freight efficiency
7. Require shippers to provide consumers with information on emissions from different shipping options and encourage uptake through information and pricing.
8. Fund a project to develop common data collection methods, formats and sharing platforms that overcome competition and privacy barriers, and enforce data reporting to government.
9. Establish a framework for consolidation centre planning as well as funding and support for Local Authorities to perform local area assessments.
10. Support the licensing of high capacity vehicles on specific roads (major motorways) for specific users where the benefits are clear.
Planning policies
11. Use the National Planning Framework to promote ‘15/20-minute neighbourhoods’. 12. Develop appraisal guidance that includes the full impacts of transport projects on carbon.
Local Partners – Where should local action be prioritised?
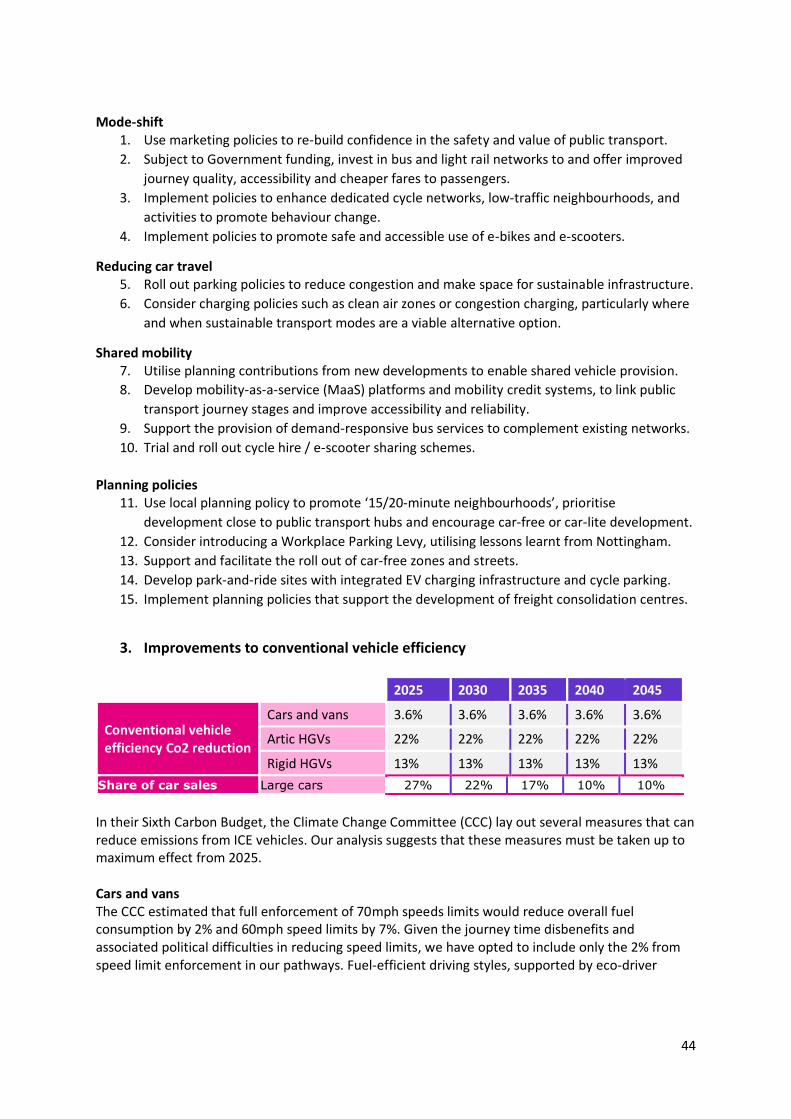
44
Mode-shift
1. Use marketing policies to re-build confidence in the safety and value of public transport.
2. Subject to Government funding, invest in bus and light rail networks to and offer improved
journey quality, accessibility and cheaper fares to passengers.
3. Implement policies to enhance dedicated cycle networks, low-traffic neighbourhoods, and
activities to promote behaviour change.
4. Implement policies to promote safe and accessible use of e-bikes and e-scooters.
Reducing car travel 5. Roll out parking policies to reduce congestion and make space for sustainable infrastructure.
6. Consider charging policies such as clean air zones or congestion charging, particularly where
and when sustainable transport modes are a viable alternative option.
Shared mobility 7. Utilise planning contributions from new developments to enable shared vehicle provision.
8. Develop mobility-as-a-service (MaaS) platforms and mobility credit systems, to link public
transport journey stages and improve accessibility and reliability.
9. Support the provision of demand-responsive bus services to complement existing networks.
10. Trial and roll out cycle hire / e-scooter sharing schemes.
Planning policies
11. Use local planning policy to promote ‘15/20-minute neighbourhoods’, prioritise
development close to public transport hubs and encourage car-free or car-lite development.
12. Consider introducing a Workplace Parking Levy, utilising lessons learnt from Nottingham.
13. Support and facilitate the roll out of car-free zones and streets.
14. Develop park-and-ride sites with integrated EV charging infrastructure and cycle parking.
15. Implement planning policies that support the development of freight consolidation centres.
3. Improvements to conventional vehicle efficiency
2025 2030 2035 2040 2045
Conventional vehicle efficiency Co2 reduction
Cars and vans 3.6% 3.6% 3.6% 3.6% 3.6%
Artic HGVs 22% 22% 22% 22% 22%
Rigid HGVs 13% 13% 13% 13% 13%
Share of car sales Large cars 27% 22% 17% 10% 10%
In their Sixth Carbon Budget, the Climate Change Committee (CCC) lay out several measures that can reduce emissions from ICE vehicles. Our analysis suggests that these measures must be taken up to maximum effect from 2025. Cars and vans The CCC estimated that full enforcement of 70mph speeds limits would reduce overall fuel consumption by 2% and 60mph speed limits by 7%. Given the journey time disbenefits and associated political difficulties in reducing speed limits, we have opted to include only the 2% from speed limit enforcement in our pathways. Fuel-efficient driving styles, supported by eco-driver
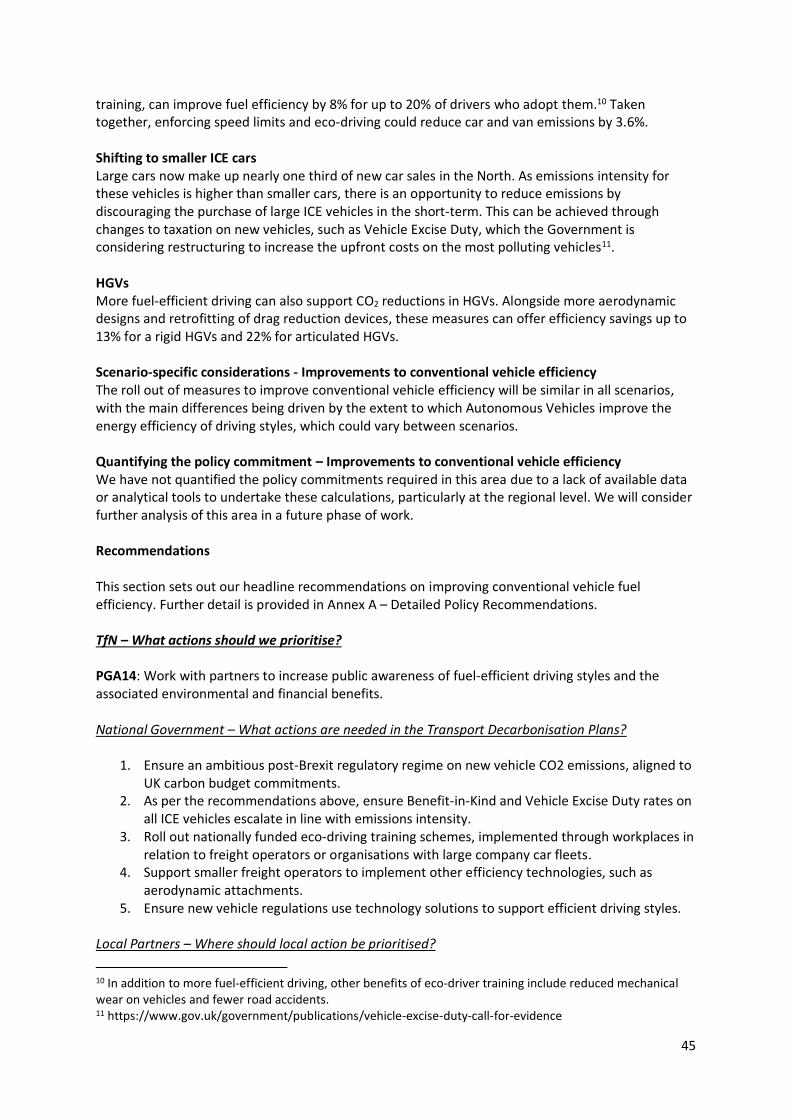
45
training, can improve fuel efficiency by 8% for up to 20% of drivers who adopt them.10 Taken together, enforcing speed limits and eco-driving could reduce car and van emissions by 3.6%. Shifting to smaller ICE cars Large cars now make up nearly one third of new car sales in the North. As emissions intensity for these vehicles is higher than smaller cars, there is an opportunity to reduce emissions by discouraging the purchase of large ICE vehicles in the short-term. This can be achieved through changes to taxation on new vehicles, such as Vehicle Excise Duty, which the Government is considering restructuring to increase the upfront costs on the most polluting vehicles11. HGVs More fuel-efficient driving can also support CO2 reductions in HGVs. Alongside more aerodynamic designs and retrofitting of drag reduction devices, these measures can offer efficiency savings up to 13% for a rigid HGVs and 22% for articulated HGVs. Scenario-specific considerations - Improvements to conventional vehicle efficiency The roll out of measures to improve conventional vehicle efficiency will be similar in all scenarios, with the main differences being driven by the extent to which Autonomous Vehicles improve the energy efficiency of driving styles, which could vary between scenarios. Quantifying the policy commitment – Improvements to conventional vehicle efficiency We have not quantified the policy commitments required in this area due to a lack of available data or analytical tools to undertake these calculations, particularly at the regional level. We will consider further analysis of this area in a future phase of work. Recommendations This section sets out our headline recommendations on improving conventional vehicle fuel efficiency. Further detail is provided in Annex A – Detailed Policy Recommendations. TfN – What actions should we prioritise? PGA14: Work with partners to increase public awareness of fuel-efficient driving styles and the associated environmental and financial benefits. National Government – What actions are needed in the Transport Decarbonisation Plans?
1. Ensure an ambitious post-Brexit regulatory regime on new vehicle CO2 emissions, aligned to UK carbon budget commitments.
2. As per the recommendations above, ensure Benefit-in-Kind and Vehicle Excise Duty rates on all ICE vehicles escalate in line with emissions intensity.
3. Roll out nationally funded eco-driving training schemes, implemented through workplaces in relation to freight operators or organisations with large company car fleets.
4. Support smaller freight operators to implement other efficiency technologies, such as aerodynamic attachments.
5. Ensure new vehicle regulations use technology solutions to support efficient driving styles. Local Partners – Where should local action be prioritised?
10 In addition to more fuel-efficient driving, other benefits of eco-driver training include reduced mechanical wear on vehicles and fewer road accidents. 11 https://www.gov.uk/government/publications/vehicle-excise-duty-call-for-evidence

46
1. Extend existing demand management and pollution abatement measures (e.g. Ultra Low
Emission Zones) to consider fuel efficiency of private cars, so as to tackle the trend towards
driving larger, heavier private vehicles (e.g. SUVs).
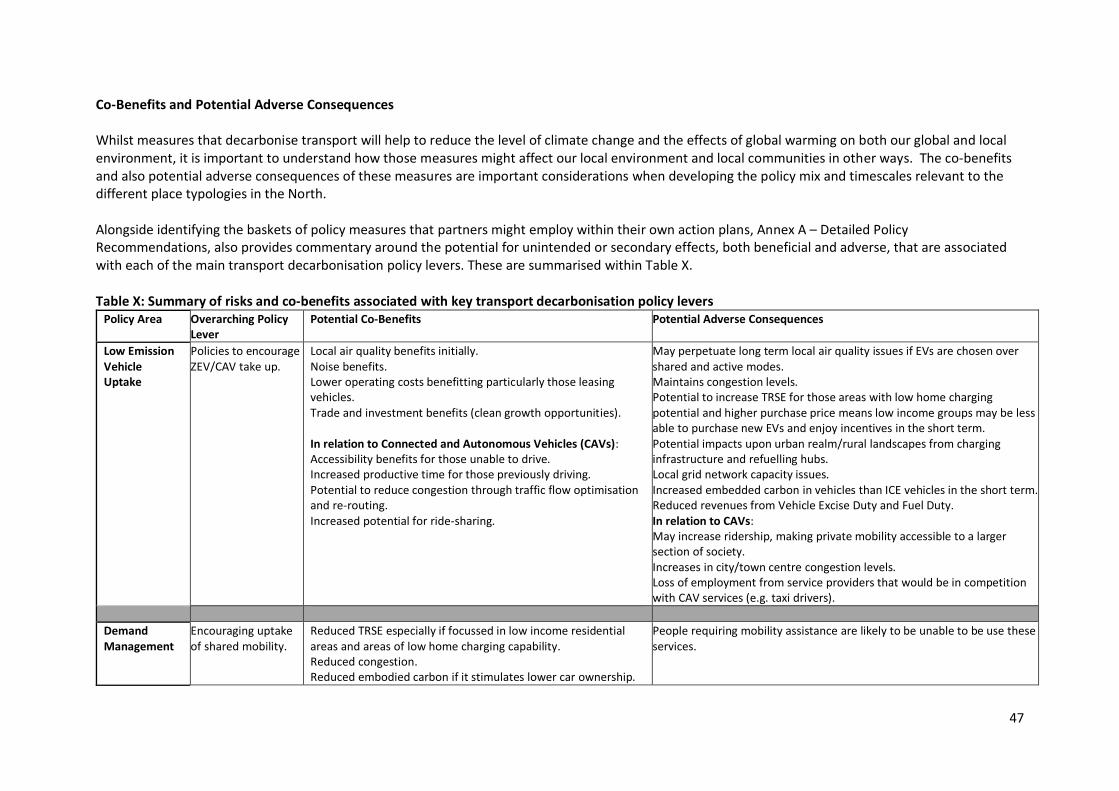
47
Co-Benefits and Potential Adverse Consequences Whilst measures that decarbonise transport will help to reduce the level of climate change and the effects of global warming on both our global and local environment, it is important to understand how those measures might affect our local environment and local communities in other ways. The co-benefits and also potential adverse consequences of these measures are important considerations when developing the policy mix and timescales relevant to the different place typologies in the North. Alongside identifying the baskets of policy measures that partners might employ within their own action plans, Annex A – Detailed Policy Recommendations, also provides commentary around the potential for unintended or secondary effects, both beneficial and adverse, that are associated with each of the main transport decarbonisation policy levers. These are summarised within Table X. Table X: Summary of risks and co-benefits associated with key transport decarbonisation policy levers
Policy Area Overarching Policy Lever
Potential Co-Benefits Potential Adverse Consequences
Low Emission Vehicle Uptake
Policies to encourage ZEV/CAV take up.
Local air quality benefits initially. Noise benefits. Lower operating costs benefitting particularly those leasing vehicles. Trade and investment benefits (clean growth opportunities). In relation to Connected and Autonomous Vehicles (CAVs): Accessibility benefits for those unable to drive. Increased productive time for those previously driving. Potential to reduce congestion through traffic flow optimisation and re-routing. Increased potential for ride-sharing.
May perpetuate long term local air quality issues if EVs are chosen over shared and active modes. Maintains congestion levels. Potential to increase TRSE for those areas with low home charging potential and higher purchase price means low income groups may be less able to purchase new EVs and enjoy incentives in the short term. Potential impacts upon urban realm/rural landscapes from charging infrastructure and refuelling hubs. Local grid network capacity issues. Increased embedded carbon in vehicles than ICE vehicles in the short term. Reduced revenues from Vehicle Excise Duty and Fuel Duty. In relation to CAVs: May increase ridership, making private mobility accessible to a larger section of society. Increases in city/town centre congestion levels. Loss of employment from service providers that would be in competition with CAV services (e.g. taxi drivers).
Demand Management
Encouraging uptake of shared mobility.
Reduced TRSE especially if focussed in low income residential areas and areas of low home charging capability. Reduced congestion. Reduced embodied carbon if it stimulates lower car ownership.
People requiring mobility assistance are likely to be unable to be use these services.
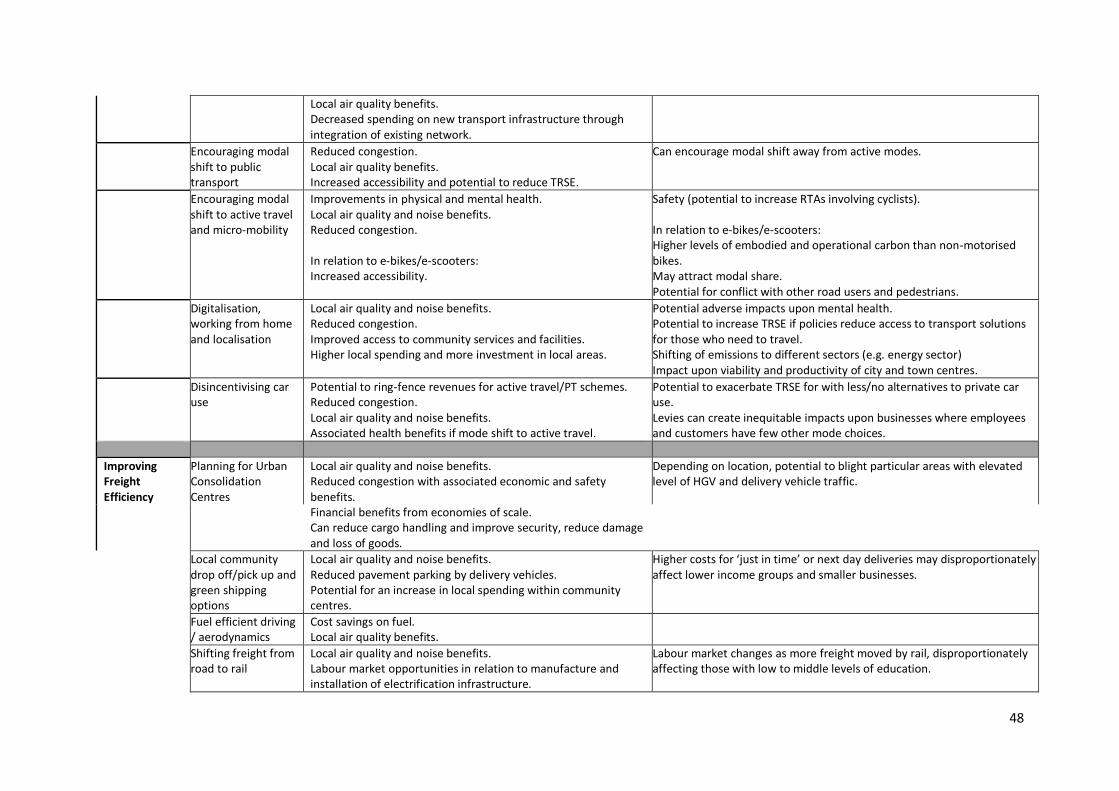
48
Local air quality benefits. Decreased spending on new transport infrastructure through integration of existing network.
Encouraging modal shift to public transport
Reduced congestion. Local air quality benefits. Increased accessibility and potential to reduce TRSE.
Can encourage modal shift away from active modes.
Encouraging modal shift to active travel and micro-mobility
Improvements in physical and mental health. Local air quality and noise benefits. Reduced congestion. In relation to e-bikes/e-scooters: Increased accessibility.
Safety (potential to increase RTAs involving cyclists). In relation to e-bikes/e-scooters: Higher levels of embodied and operational carbon than non-motorised bikes. May attract modal share. Potential for conflict with other road users and pedestrians.
Digitalisation, working from home and localisation
Local air quality and noise benefits. Reduced congestion. Improved access to community services and facilities. Higher local spending and more investment in local areas.
Potential adverse impacts upon mental health. Potential to increase TRSE if policies reduce access to transport solutions for those who need to travel. Shifting of emissions to different sectors (e.g. energy sector) Impact upon viability and productivity of city and town centres.
Disincentivising car use
Potential to ring-fence revenues for active travel/PT schemes. Reduced congestion. Local air quality and noise benefits. Associated health benefits if mode shift to active travel.
Potential to exacerbate TRSE for with less/no alternatives to private car use. Levies can create inequitable impacts upon businesses where employees and customers have few other mode choices.
Improving Freight Efficiency
Planning for Urban Consolidation Centres
Local air quality and noise benefits. Reduced congestion with associated economic and safety benefits. Financial benefits from economies of scale. Can reduce cargo handling and improve security, reduce damage and loss of goods.
Depending on location, potential to blight particular areas with elevated level of HGV and delivery vehicle traffic.
Local community drop off/pick up and green shipping options
Local air quality and noise benefits. Reduced pavement parking by delivery vehicles. Potential for an increase in local spending within community centres.
Higher costs for ‘just in time’ or next day deliveries may disproportionately affect lower income groups and smaller businesses.
Fuel efficient driving / aerodynamics
Cost savings on fuel. Local air quality benefits.
Shifting freight from road to rail
Local air quality and noise benefits. Labour market opportunities in relation to manufacture and installation of electrification infrastructure.
Labour market changes as more freight moved by rail, disproportionately affecting those with low to middle levels of education.
49
Transport Related Social Exclusion and Distributional Impacts
It will be important that policy makers at both a local and national level both understand and take
actions to mitigate the risk of adverse consequences arising as a result of decarbonisation policy and
measures.
Examining the relationship between Transport Related Social Exclusion (TRSE) and transport
decarbonisation measures is the subject of one of TfN’s priority actions to 2025, further details of
which are included in Chapter 9. The evidence and data generated through this research can be used
by our Partners to help identify where transport decarbonisation policy measures may need to be
altered to avoid exacerbating existing TRSE issues and to maximise the opportunities to reduce TRSE.
Chapter 3 of this Strategy provided a high-level overview of how emissions vary across different
groups in the North, by gender, age and employment type. TfN’s Analytical Framework will allow us
to provide more detailed spatially disaggregated socio-economic data to partners, to help ensure
local decarbonisation measures avoid disproportionately affecting more disadvantaged groups.
When looking at average carbon intensity for specific occupations and education levels, people with
low and middle levels of education (those with education up to A levels) tend to be employed in jobs
with a higher average carbon intensity than more highly educated employees (degree level and
upwards), with many of the former being classed as ‘process plant and machine workers’ with a high
propensity to work in the transport and storage industry12.
These workers may be more exposed to labour market changes as a result of a net-zero transition,
both in terms of direct changes to the transport system (e.g. a future scenario where more rail is
moved by freight), or indirectly through changes in the vehicle manufacturing industry or energy
generation sectors. Labour market changes as a result of the net-zero transition may also provide
opportunities for these groups, particularly in electrification (rail electrification and grid upgrades of
EV infrastructure) and the manufacture of ZEVs and their components (e.g. gigafactories).
The use of cars by lower income groups is often driven by accessibility and affordability challenges:
o The need to travel to work ‘out of hour’ shifts (e.g. cleaners, post office workers,
warehouse workers).
o Due to disabilities that means using shared modes of transport or active modes is
not possible.
o Those who live or work in areas of low public transport accessibility, which can be
exacerbated by the correlation between high access and high house prices.
o Public transport costs for some journeys can be prohibitive and therefore private car
travel offers a cost-effective alternative.
For these groups, demand management measures which increase the cost of car use and decrease
the convenience, may experience increased levels of TRSE. Similarly, the higher purchase price of
ZEVs may mean that policies to increase the speed of uptake may lead to uneven distributional
impacts on lower income groups who are least able to afford them.
Public transport and shared transport modes can be essential for groups who have no access to
private vehicles for financial or accessibility reasons (for example, those living in flats or terraced
housing with no parking facilities). Whilst these groups may benefit from polices to enhance public
transport provision; policies to encourage the uptake of ZEVs have the potential to impact upon
12 HM Treasury, Net-Zero Review: Interim Report (2020)
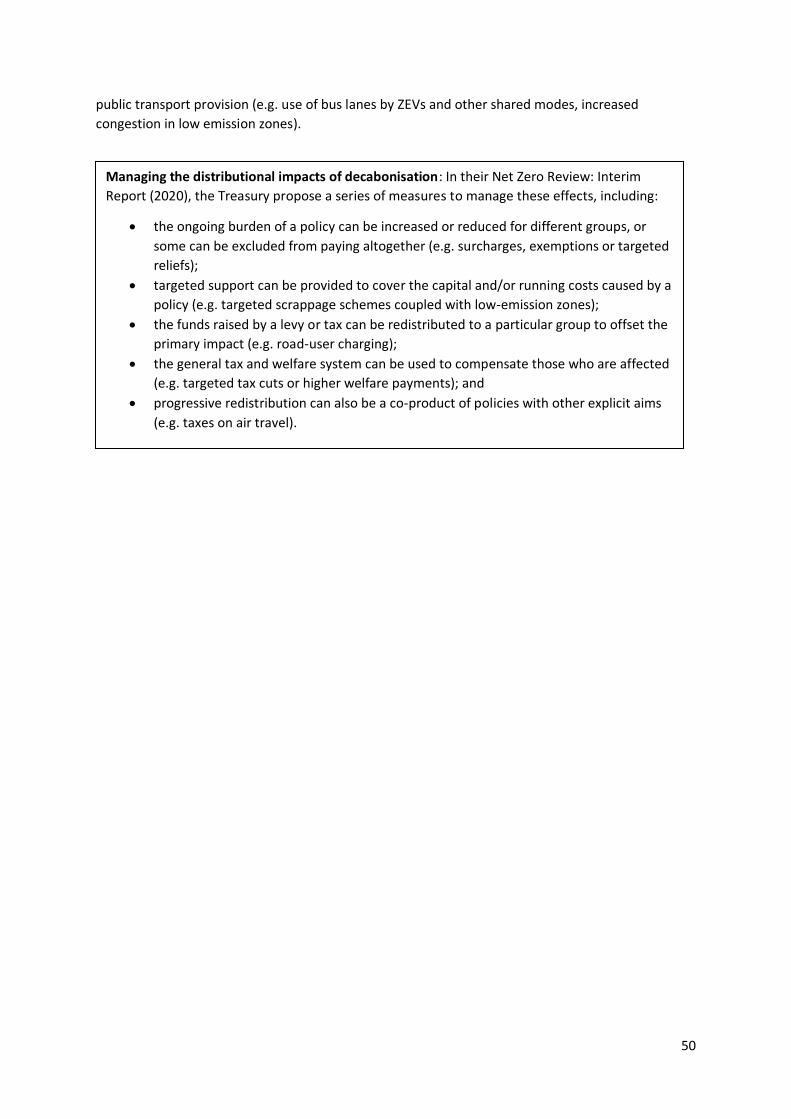
50
public transport provision (e.g. use of bus lanes by ZEVs and other shared modes, increased
congestion in low emission zones).
Managing the distributional impacts of decabonisation: In their Net Zero Review: Interim
Report (2020), the Treasury propose a series of measures to manage these effects, including:
• the ongoing burden of a policy can be increased or reduced for different groups, or
some can be excluded from paying altogether (e.g. surcharges, exemptions or targeted
reliefs);
• targeted support can be provided to cover the capital and/or running costs caused by a
policy (e.g. targeted scrappage schemes coupled with low-emission zones);
• the funds raised by a levy or tax can be redistributed to a particular group to offset the
primary impact (e.g. road-user charging);
• the general tax and welfare system can be used to compensate those who are affected
(e.g. targeted tax cuts or higher welfare payments); and
• progressive redistribution can also be a co-product of policies with other explicit aims
(e.g. taxes on air travel).
46
Chapter 6 - Consideration of embodied carbon
What is embodied carbon? The ‘embodied carbon’ component of a project refers to the emissions of greenhouse gases arising from:
• the sourcing and extraction of the raw materials needed to build the project;
• the energy needed to process those raw materials in construction components (i.e. the manufacturing stage);
• the transporting of those building materials; and
• the construction activities themselves from construction plant, through to worker accommodation and transport.
Embodied carbon is often referred to as supply chain carbon, or construction carbon, and is sometimes considered separately from operational emissions that refer to the emissions of greenhouse gases arising as a result of the operation of a development. For example, the embodied emissions associated with a new road might include consideration of the emissions associated with sourcing and processing raw materials, transport of materials and the construction of the road itself, whilst the operational emissions would include those generated by the vehicles that end up using the scheme throughout its operational life (including maintenance related emissions).
EXAMPLE BOX: The Rail Safety and Standards Board (RSSB) estimates that in the reporting year 2019/2020, the UK rail industry generates approx. 3.5 million ktCO2e in relation to traction energy (i.e. operational emissions) but that its embodied carbon emissions are closer to 5.2 million ktCO2e - 48% higher1.
Every infrastructure development will use embodied carbon; however, many will stimulate behaviours or facilitate technologies that reduce greenhouse gas emissions, from a ‘business as usual’ state, during their operation. For example, a new electrified railway can encourage a reduction in private car vehicle mileage, substantially reducing passenger travel carbon intensity. The amount of time that is needed to recoup the embodied carbon of a project, through the reductions in emissions realised as a result of its operation, is often called the ‘payback period’. Where payback periods are unacceptably long, carbon sequestration may be an option to reduce the overall net balance of embodied carbon within a scheme. Carbon sequestration is a term used to describe actions that absorb and store carbon dioxide from the atmosphere. Carbon sequestration activities that may be incorporated within our major infrastructure projects broadly fall into two categories: natural processes such as tree planting and peatland restoration; and the use of innovative construction materials such as carbon ‘absorbing’ cement and concrete. Whilst sequestration may play a part in reducing net emissions associated with schemes, and maximising sequestration is a worthwhile goal, it is unlikely to offset more than a small proportion of the embodied carbon across a scheme and needs to be considered and utilised in that context. Another term, commonly used, is ‘Whole Life Carbon’. In the context of major transport infrastructure, it is used to describe the emissions associated with project from ‘cradle to grave’. This means its embodied emissions, plus those emissions generated through the operation of the scheme
1 RSSB DECARB: Carbon Measurements (T1197) https://www.rssb.co.uk/en/research-catalogue/CatalogueItem/T1197
47
and finally its ‘end of life’ profile (i.e. those emissions associated with decommissioning and demolition). For the purposes of this Strategy, both embodied carbon and operational emissions have been considered, albeit separately. How TfN is considering embodied carbon The accounting principles for carbon mean that embodied emissions from constructing transport projects do not count as ‘transport emissions’ but as part of industrial emissions.. It is for this reason that the Government has suggested that carbon from the construction of transport schemes is outside of the scope of the Transport Decarbonisation Plan. It is also difficult to robustly calculate the likely embodied carbon footprint of major infrastructure developments at a conceptual level of design or when the scheduled design and construction of the infrastructure is many years or decades in the future. Equally, it can be problematic to forecast the extent to which embodied carbon may be reduced on future schemes through careful design, responsible sourcing of construction materials, and innovative construction techniques. For these reasons, the consideration of embodied carbon is outside of the scope of our decarbonisation trajectory and pathways, however, it is not outside the scope of this strategy. TfN is clear on the significance of embodied carbon in the North’s future transport system and across the projects that make up TfN’s Investment Programme (IP). Alongside our partners, we are committed to developing a carbon reduction culture, permeating every stage of the project development lifecycle. It is inevitable that, as a region, the North will have to ‘spend’ some carbon to develop a truly sustainable multi-modal transport system. Whilst the programme of physical infrastructure projects that make up our IP will be expected to pay back its embodied carbon eventually through the operation of those projects, in the short term, carbon sequestration is expected to play some part in achieving our decarbonisation ambitions.
What we are doing at a strategic level:
TfN has agency to influence the embodied emissions associated with the scale, nature and design of the portfolio of projects within its IP.
We want to better understand the level of emissions likely to be generated by the construction of the schemes included in our IP and also explore how we can start reducing that profile at the earliest point. We’d also like to understand the relative carbon pay-back period of the projects and programmes within our IP.
TfN is collaborating with DecarboN8, a network led by the eight most research-intensive universities in the North working with industry and government to facilitate zero emission transport systems, to explore the embodied emissions associated with the multi-modal corridors proposed within our Strategic Development Corridors (SDCs).
A pilot study was initiated in September 2020, focusing on the Tyne and Wear – South Northumberland sub-corridor within the ‘Connecting Energy Coasts’ and ‘East Coast’ corridors, being a sub-corridor example with a good mix of road and rail schemes. This pilot study is scheduled for
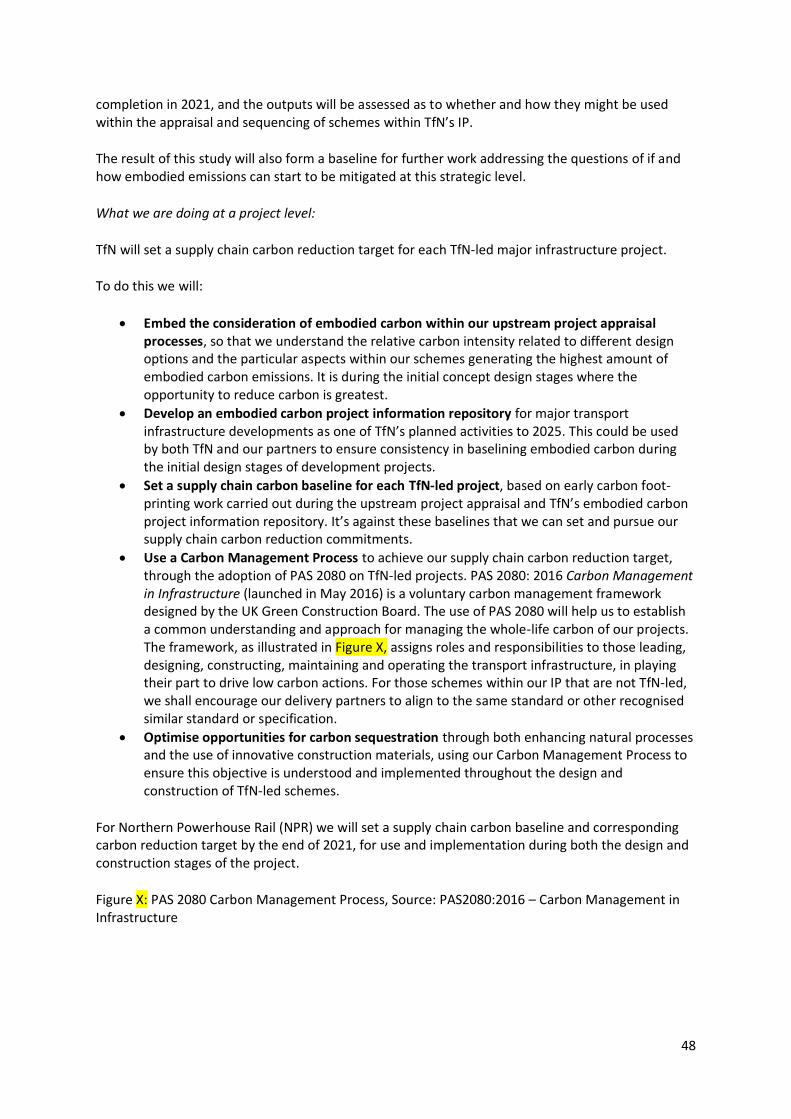
48
completion in 2021, and the outputs will be assessed as to whether and how they might be used within the appraisal and sequencing of schemes within TfN’s IP.
The result of this study will also form a baseline for further work addressing the questions of if and how embodied emissions can start to be mitigated at this strategic level.
What we are doing at a project level:
TfN will set a supply chain carbon reduction target for each TfN-led major infrastructure project.
To do this we will:
• Embed the consideration of embodied carbon within our upstream project appraisal processes, so that we understand the relative carbon intensity related to different design options and the particular aspects within our schemes generating the highest amount of embodied carbon emissions. It is during the initial concept design stages where the opportunity to reduce carbon is greatest.
• Develop an embodied carbon project information repository for major transport infrastructure developments as one of TfN’s planned activities to 2025. This could be used by both TfN and our partners to ensure consistency in baselining embodied carbon during the initial design stages of development projects.
• Set a supply chain carbon baseline for each TfN-led project, based on early carbon foot-printing work carried out during the upstream project appraisal and TfN’s embodied carbon project information repository. It’s against these baselines that we can set and pursue our supply chain carbon reduction commitments.
• Use a Carbon Management Process to achieve our supply chain carbon reduction target, through the adoption of PAS 2080 on TfN-led projects. PAS 2080: 2016 Carbon Management in Infrastructure (launched in May 2016) is a voluntary carbon management framework designed by the UK Green Construction Board. The use of PAS 2080 will help us to establish a common understanding and approach for managing the whole-life carbon of our projects. The framework, as illustrated in Figure X, assigns roles and responsibilities to those leading, designing, constructing, maintaining and operating the transport infrastructure, in playing their part to drive low carbon actions. For those schemes within our IP that are not TfN-led, we shall encourage our delivery partners to align to the same standard or other recognised similar standard or specification.
• Optimise opportunities for carbon sequestration through both enhancing natural processes and the use of innovative construction materials, using our Carbon Management Process to ensure this objective is understood and implemented throughout the design and construction of TfN-led schemes.
For Northern Powerhouse Rail (NPR) we will set a supply chain carbon baseline and corresponding carbon reduction target by the end of 2021, for use and implementation during both the design and construction stages of the project.
Figure X: PAS 2080 Carbon Management Process, Source: PAS2080:2016 – Carbon Management in Infrastructure
49
49
Chapter 7 – Climate change adaptation and resilience
Changes to global climate, as a result of the release of carbon dioxide and other Greenhouse Gases
into the atmosphere, are already happening and are visible through the increased prevalence of
heatwaves, floods, droughts and fires.
Less visible effects, but equally as worrying, include damage to marine ecosystems leading to
fisheries failing, sea level rise, increased risk to water supplies and a rise in global food insecurity, as
well as an unprecedented loss of biodiversity.
Although we can’t be certain of what our future climate will be in the North, it’s important that we
understand the potential changes that may occur within the limits of uncertainty and how these
changes might affect the viability our transport systems and how our transport infrastructure might
exacerbate or reduce the effects of climate change on other people.
Factoring in the effects of climate change
The latest climate predictions (UKCP181) predict progressively hotter, dryer summers and warmer,
wetter winters, with increasing frequency of extreme weather events such as storm events and heat
waves.
The Environment Agency’s ‘Climate Impacts Tool: Understanding the risks and impacts from a
changing climate’ (2019), provides a starting point to help us understand an upper limit on possible
change across three timescales: today’s climate, the 2050s and the 2080s, consistent with a 4oC rise
in global mean temperature by the end of the century. Figure X is based on national England
averages, taken from the Environment Agency Climate Impact Tool. It starts to give us some idea
around the magnitude of changes that we might expect in a 4oC rise scenario.
1 https://www.metoffice.gov.uk/research/approach/collaboration/ukcp/download-data
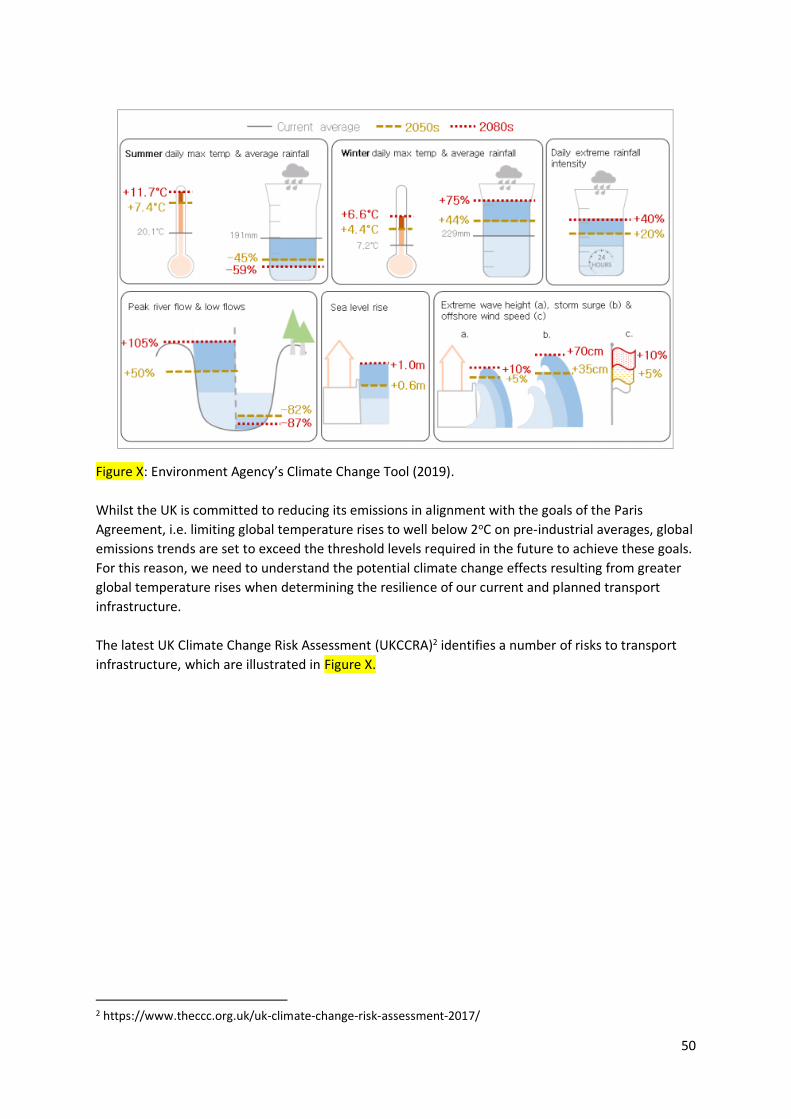
50
Figure X: Environment Agency’s Climate Change Tool (2019).
Whilst the UK is committed to reducing its emissions in alignment with the goals of the Paris
Agreement, i.e. limiting global temperature rises to well below 2oC on pre-industrial averages, global
emissions trends are set to exceed the threshold levels required in the future to achieve these goals.
For this reason, we need to understand the potential climate change effects resulting from greater
global temperature rises when determining the resilience of our current and planned transport
infrastructure.
The latest UK Climate Change Risk Assessment (UKCCRA)2 identifies a number of risks to transport
infrastructure, which are illustrated in Figure X.
2 https://www.theccc.org.uk/uk-climate-change-risk-assessment-2017/
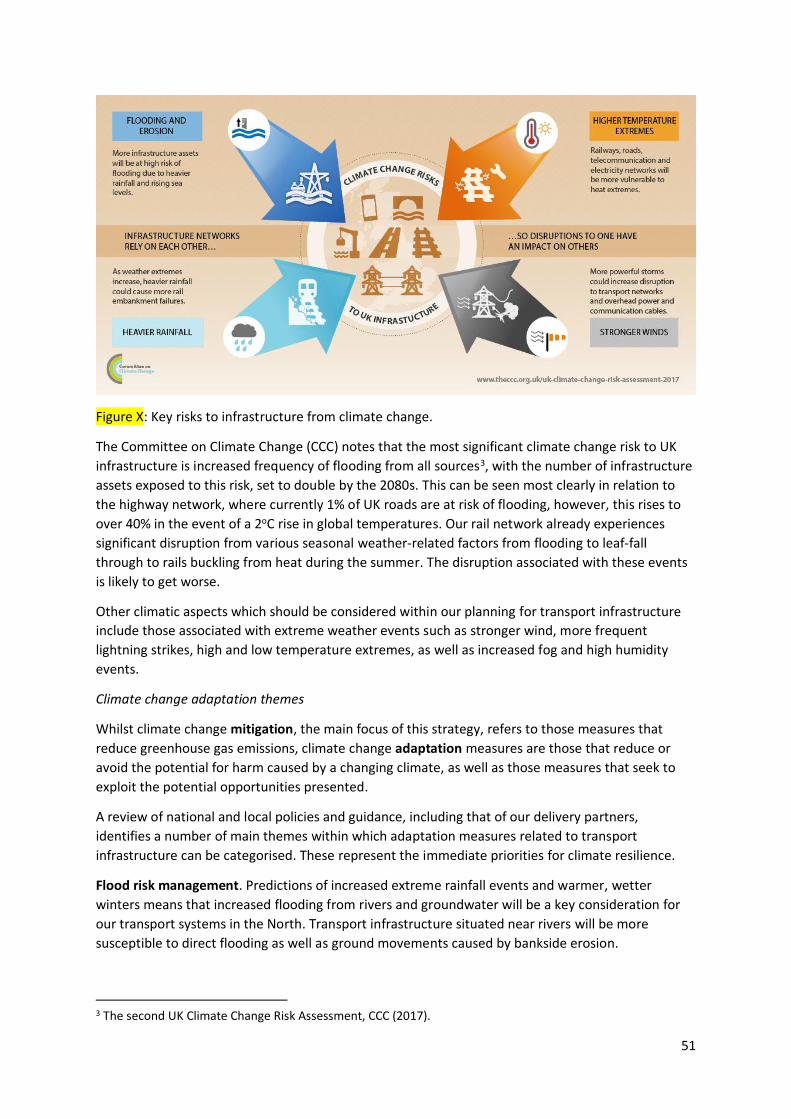
51
Figure X: Key risks to infrastructure from climate change.
The Committee on Climate Change (CCC) notes that the most significant climate change risk to UK
infrastructure is increased frequency of flooding from all sources3, with the number of infrastructure
assets exposed to this risk, set to double by the 2080s. This can be seen most clearly in relation to
the highway network, where currently 1% of UK roads are at risk of flooding, however, this rises to
over 40% in the event of a 2oC rise in global temperatures. Our rail network already experiences
significant disruption from various seasonal weather-related factors from flooding to leaf-fall
through to rails buckling from heat during the summer. The disruption associated with these events
is likely to get worse.
Other climatic aspects which should be considered within our planning for transport infrastructure
include those associated with extreme weather events such as stronger wind, more frequent
lightning strikes, high and low temperature extremes, as well as increased fog and high humidity
events.
Climate change adaptation themes
Whilst climate change mitigation, the main focus of this strategy, refers to those measures that
reduce greenhouse gas emissions, climate change adaptation measures are those that reduce or
avoid the potential for harm caused by a changing climate, as well as those measures that seek to
exploit the potential opportunities presented.
A review of national and local policies and guidance, including that of our delivery partners,
identifies a number of main themes within which adaptation measures related to transport
infrastructure can be categorised. These represent the immediate priorities for climate resilience.
Flood risk management. Predictions of increased extreme rainfall events and warmer, wetter
winters means that increased flooding from rivers and groundwater will be a key consideration for
our transport systems in the North. Transport infrastructure situated near rivers will be more
susceptible to direct flooding as well as ground movements caused by bankside erosion.
3 The second UK Climate Change Risk Assessment, CCC (2017).

52
Storm surges and rising sea levels are likely to increasingly effect transport infrastructure near our
coasts, estuaries and tidal reaches of our rivers.
There is a need to ensure both new and existing transport infrastructure is resilient to floods based
upon current climate projections.
Both the regularity and intensity of flooding can be reduced by identifying problem locations and
regularly monitoring existing drainage systems. Scheme promoters need to understand and mitigate
any increased flood risk on third parties as a result of new transport infrastructure.
Geotechnical change management. For both existing and proposed infrastructure, asset owners
need to identify areas where ground conditions could be affected by increased rainfall and
groundwater levels (e.g. soil saturation or slippage).
Improve service resilience in infrastructure. Scheme promoters will need to understand the links
and interdependencies between stakeholders and assets in other sectors (e.g. telecommunications
and power generation) so we understand the full potential for disruption and the increased costs of
delivering infrastructure that is resilient to that disruption.
Adoption of green and blue infrastructure. Designers should look at opportunities within their
projects to adopt green and blue infrastructure as a way to combat overheating and excess water
run-off.
Heatwave planning and management. The predicted increase in extreme weather events may also
lead to periods of extreme heat, on top of already higher average summer temperatures. The
materials used to build our transport infrastructure and the vehicles that operate on it will need to
be resilient to these weather episodes, not only ensuring continued operation but also maintaining
passenger comfort. There is a need to identify how existing assets can be upgraded as well, such as
employing cooling technologies and alternative insulation for our rail stations and the removal of
jointed track and obsolete fastenings to make our rail tracks more resilient.4
Increasing the resilience of active modes. Focus shouldn’t just be on major transport infrastructure,
but also our active travel infrastructure, and how we can make sure it is resilient and convenient to
use in all types of weather.
Knowledge sharing and employee awareness. Many of our partners, including delivery authorities
such as Network Rail and Highways England have made significant progress in how they build in
climate change adaptation measures to their new developments. TfN will ask all partners to identify
adaptation and resilience ‘champions’ within their organisations to share latest practice and advice
with other partners and internally within their own organisations. Themes relating to effective
longer-term planning and implementation of climate adaptation and resilience measures include:
Targeted investment for resilience measures. There needs to be proactive investment in resilient
materials and adaptation measures. The costs and benefits of adaptation need to be integrated into
asset management, investment strategies, economic appraisals and decision-making. The Climate
Risk Assessment Process provides a process and platform with which to do this.
Policy, indicators and monitoring. Where they haven’t already, transport authorities and delivery
bodies should develop specific policy in response to climate risks and adaptation priorities, along
with mechanisms for ongoing monitoring of risks and progress against objectives.
4 NR South East Route CP6 Weather Resilience and Climate Change Adaptation Plan (2019-24).
53
Continuous improvement. Tracking the development of innovative technologies and approaches to
the development of climate resilient transport infrastructure and systems.
Co-benefits of climate change adaptation
The benefits of developing climate change adaptation measures, particularly nature based
solutions, are often not limited to increased resilience to climate change effects. If planned and
delivered in the right way, potential co-benefits include:
- Ecological enhancements
- Flood and coastal resilience
- Improved water quality
- Improved air quality
- Improved physical and mental human health
- Reduced need for mechanical cooling
- Increased uptake of active travel
- Creation of green jobs
We can achieve nature based solutions through forming partnerships between scheme promoters
and landowners, farmers, environmental groups and local communities5, making space for excess
water in other places, and using tree planting and sustainable drainage systems to store and slow
down runoff from intense rainfall events. These green spaces can deliver co-benefits of providing
valuable habitats for native wildlife, as well as accessible green spaces for promoting wellbeing.
For example, the creation and use of ecologically rich pond and wetland habitat to attenuate and
filter rainwater runoff from major transport infrastructure can provide valuable habitats for native
wildlife, as well as recreational space and educational opportunities for local communities.
How we are increasing the resilience of our projects
Our principal delivery partners, Network Rail, Highways England and HS2, have taken a lead in
planning for the resilience of the transport systems they promote and maintain. TfN’s role, however,
in developing an investment programme for the North’s transport system means that as an
organisation, we need to understand the implications of climate change on that system.
By undertaking a Climate Risk Assessment, we are able to identify and assess the climate change
risks for our major transport infrastructure programmes and for any other projects with elements
that could be affected by the weather and effects of climate change.
Guidance on when to undertake a Climate Risk Assessment and the assumptions to use in terms of
global temperature rise is given within the Supplementary Green Book Guidance ‘Accounting for the
Effects of Climate Change’ (DEFRA, 2020). Where a project, policy or programme is likely to have a
lifespan that goes beyond 2035, the guidance recommends that it should be considered in the
context of at least two future climate scenarios aligned with both a 2oC and 4oC rise in global
temperatures.
5 National Flood and Coastal Erosion Risk Management Strategy, Environment Agency (2020)
54
We will undertake a Climate Risk Assessment for all TfN-led major infrastructure projects. By doing
this we will be able to:
- Re-develop and refine early designs to improve resilience to future climate change
- Incorporate climate scenarios within our appraisal of costs and benefits
- Identify no or low regret adaption actions
- Develop adaptive management processes that allow a project to adapt to changing risk over
time, given the high uncertainty over the future impacts of climate change
- Prioritise green infrastructure solutions which can deliver a wide range of co-benefits
Through our projects, we will also develop a strong collaborative relationship with the Environment
Agency (EA) to stay abreast of major issues in relation to flood risk and geotechnical change, and
discuss mitigation strategies.
For those schemes within our IP that are not TfN-led, we shall encourage our delivery partners to
align to the same or a similar process for identifying climate change risks and opportunities.
Chapter 8 – Stimulating Clean Growth In the North
Financial profit is now not the only driver of growth, as we recognise that positive outcomes for people
and the environment are also essential to achieve sustainable long-term growth. Transport is a key
enable to achieve the Triple Bottom Line.
INSERT DIAGRAM SHOWING TRIPLE BOTTOM LINE
Whilst the ultimate stated aim of transport decarbonisation is to limit and eventually eliminate
greenhouse gas emissions as a result of our travel, the potential opportunities it can provide in terms
of driving economic growth and social value are significant.
TfN has a strategic objective to facilitate transformational economic growth. This underlying theme
drives our Decarbonisation Strategy. Our policy analysis has allowed us to understand ‘what needs to
be true’ in terms of transport decarbonisation policy, to allow the North to benefit from the significant
economic and connectivity outcomes which would result from the schemes within our Investment
Programme, at the same time as achieving our decarbonisation commitments.
At the same time, it’s important that we understand the opportunities for transformational economic
growth that can be driven by the decarbonisation of transport itself. Economic growth that is achieved
at the same time as cutting greenhouse gas emissions is often referred to as ‘clean growth’.
During the preparation of this Strategy, we explored the existing clean growth opportunities and
initiatives already identified by our LEP partners and other business/industrial groupings. We wanted
to understand how TfN could support these opportunities and initiatives, as well as understanding any
opportunities that remain relatively unexplored and which of these exhibits the most potential for the
North.
The key outcomes from this work are presented in this chapter, along with some analysis of where we
feel TfN can play a meaningful role in supporting clean growth opportunities in the North.
Figure X, frames our Decarbonisation Strategy within relevant national and regional strategies which
are aimed at seeting the UK on a sustainable clean growth path, conceptualising the
interdependencies between Northern Local Industrial Strategies (LIS) and national strategies. Our
work included a high-level review of this policy framework focussed around eight key transport
decarbonisation themes.
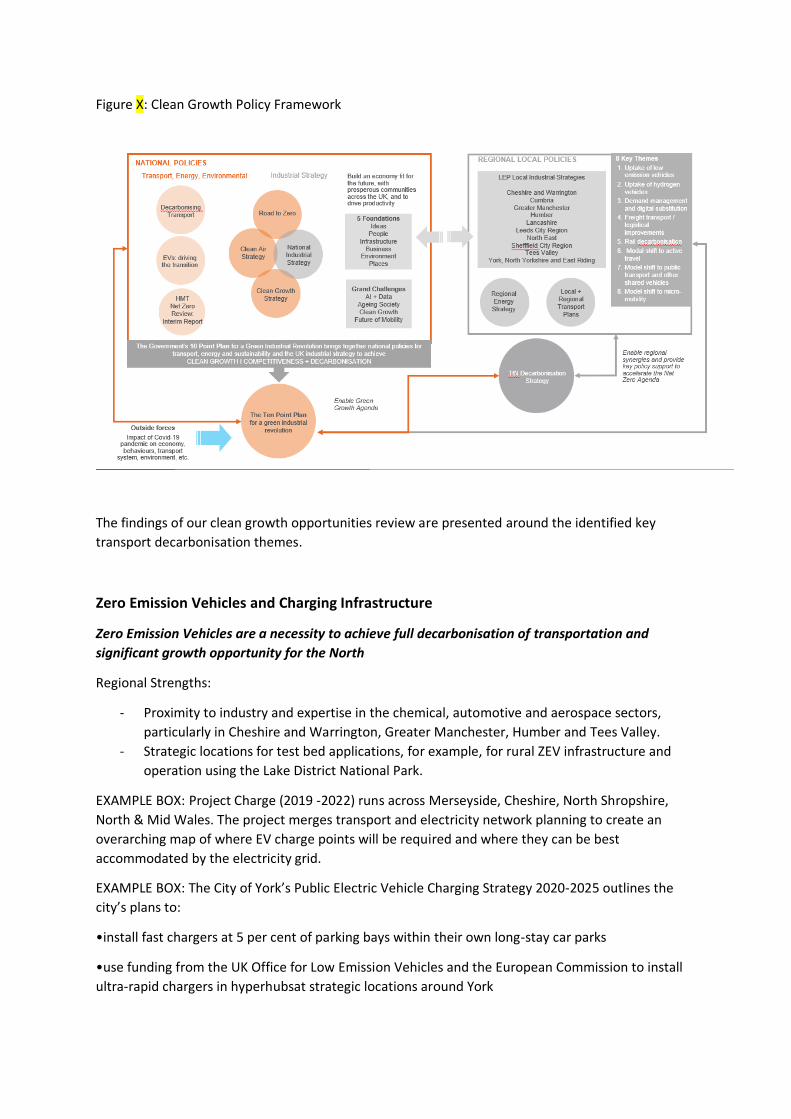
Figure X: Clean Growth Policy Framework
The findings of our clean growth opportunities review are presented around the identified key
transport decarbonisation themes.
Zero Emission Vehicles and Charging Infrastructure
Zero Emission Vehicles are a necessity to achieve full decarbonisation of transportation and
significant growth opportunity for the North
Regional Strengths:
- Proximity to industry and expertise in the chemical, automotive and aerospace sectors,
particularly in Cheshire and Warrington, Greater Manchester, Humber and Tees Valley.
- Strategic locations for test bed applications, for example, for rural ZEV infrastructure and
operation using the Lake District National Park.
EXAMPLE BOX: Project Charge (2019 -2022) runs across Merseyside, Cheshire, North Shropshire,
North & Mid Wales. The project merges transport and electricity network planning to create an
overarching map of where EV charge points will be required and where they can be best
accommodated by the electricity grid.
EXAMPLE BOX: The City of York’s Public Electric Vehicle Charging Strategy 2020-2025 outlines the
city’s plans to:
•install fast chargers at 5 per cent of parking bays within their own long-stay car parks
•use funding from the UK Office for Low Emission Vehicles and the European Commission to install
ultra-rapid chargers in hyperhubsat strategic locations around York
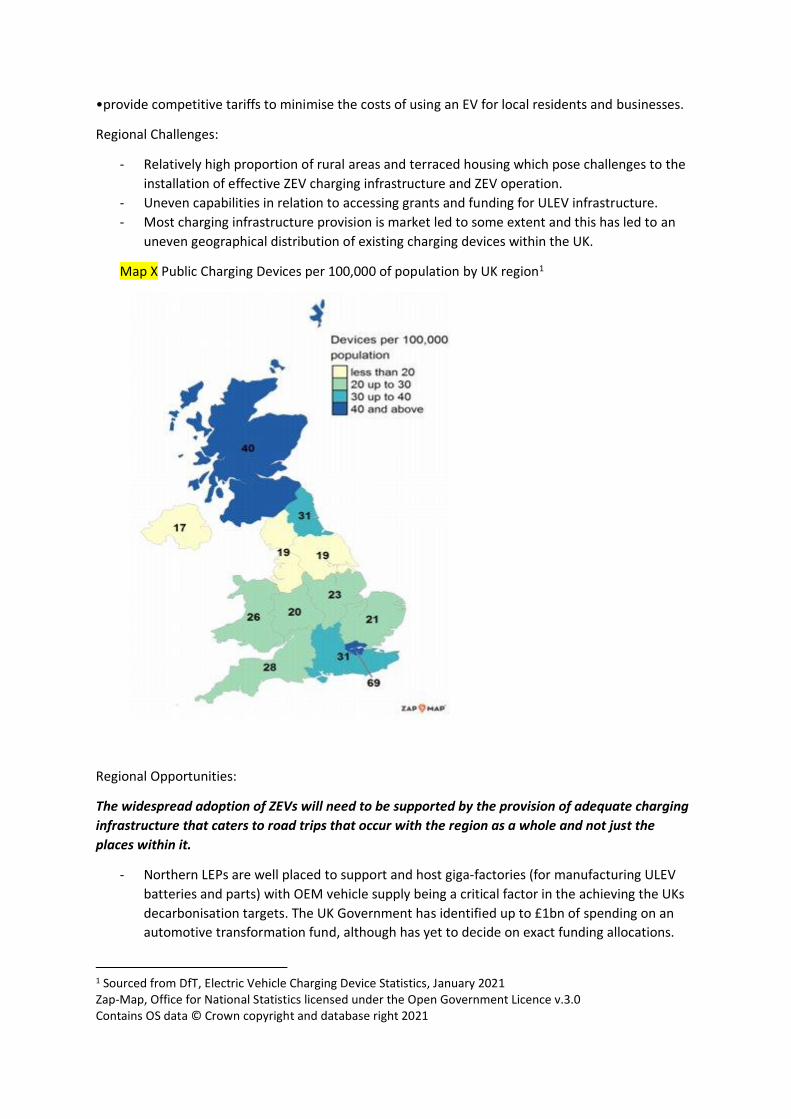
•provide competitive tariffs to minimise the costs of using an EV for local residents and businesses.
Regional Challenges:
- Relatively high proportion of rural areas and terraced housing which pose challenges to the
installation of effective ZEV charging infrastructure and ZEV operation.
- Uneven capabilities in relation to accessing grants and funding for ULEV infrastructure.
- Most charging infrastructure provision is market led to some extent and this has led to an
uneven geographical distribution of existing charging devices within the UK.
Map X Public Charging Devices per 100,000 of population by UK region1
Regional Opportunities:
The widespread adoption of ZEVs will need to be supported by the provision of adequate charging
infrastructure that caters to road trips that occur with the region as a whole and not just the
places within it.
- Northern LEPs are well placed to support and host giga-factories (for manufacturing ULEV
batteries and parts) with OEM vehicle supply being a critical factor in the achieving the UKs
decarbonisation targets. The UK Government has identified up to £1bn of spending on an
automotive transformation fund, although has yet to decide on exact funding allocations.
1 Sourced from DfT, Electric Vehicle Charging Device Statistics, January 2021 Zap-Map, Office for National Statistics licensed under the Open Government Licence v.3.0 Contains OS data © Crown copyright and database right 2021

- Scaling up the supply chain can achieve economies of scale and reduced cost across the ZEV
value chain.
- Testing and trials of innovative ZEV charging technologies focussed on delivering rural and
on-street ZEV charging solutions.
- Exploring the potential of multi-modal mobility hubs, including ZEV charging infrastructure,
to stimulate urban regeneration, both by creating an additional incentive to visit and
support local businesses and by improving access to affordable sustainable mobility.
Potential TfN Activity:
A catalyst for ZEV uptake and charging infrastructure deployment.
- Engage with and support partners to access funding, technical expertise and co-ordination
with the Distribution Network Operators (DNOs). Facilitating cross boundary teams
amongst partners to deliver strong and effective bidding propositions for ZEV funding and
trials.
- Engage with partners to support programmes and campaigns to build awareness in our
communities via strong messaging around the financial and environmental benefits of ZEVs
(relative to the use of equivalent ICE vehicles).
- Develop a coherent, data driven, regional ZEV Charging Infrastructure plan, including an
assessment of provision of charging infrastructure, on-street and in rural and remote areas.
Coupled with this, TfN could look to influence government to alter the competitive bidding
process into a more outcomes-driven allocation based on evidence and data.
CGA1: Develop a regional EV charging Infrastructure Study – laying the foundations for an
outcomes driven approach to the delivery of charging infrastructure in the North, ensuring our
network caters for the full range of journeys being made to, from and within our region.
CGA2: Supporting local partners in the development of local ZEV infrastructure charging plans
and the pursual of funding opportunities, through the provision of data and evidence.
Hydrogen Vehicles and Refuelling Infrastructure
The North has competitive advantage in hydrogen production, but a strong business case for
hydrogen transport applications is yet to emerge.
Regional Strengths:
- Existing clusters of hydrogen producing industry located around Liverpool, Cheshire and
Warrington, the Humber estuary and Tees Valley.
- Existing hydrogen clean growth opportunity partnerships, for example HyNet North West
(supported by Manchester, Liverpool and Cheshire and Warrington LEPs),the North West
Hydrogen Alliance, and Zero Carbon Humber.

- Liverpool City Region, through HyMotion, deploying hydrogen buses and refuelling systems
as well as becoming the first public hydrogen refuelling station in the North West.
EXAMPLE BOX: UK H2Mobility brings together industry (fuel cell technology, energy & gas
utilities, fuel retail, car and train manufacturers, government and Devolved Administrations)
to support the development of hydrogen as a transport fuel and further the commercial roll-
out of hydrogen mobility technology. A roadmap details how the UK can build a hydrogen
refuelling infrastructure to support the introduction of Fuel Cell Electric Vehicles (FCEVs),
with the initial focus on developing infrastructure serving metropolitan areas and the major
routes which link them. Infrastructure development to date has been a public-private
partnership with national and local governments, and fuel cell, industrial gases, energy, and
vehicle manufacturers.
EXAMPLE BOX: The HyNet North West partnership is to create the UK’s first CCUS
infrastructure including a hydrogen pipeline.
EXAMPLE BOX: The Nordic Hydrogen Partnership consists of regional clusters involving
major and small industries, research institutions, and local, regional and national authorities.
The national bodies covering Norway, Sweden, Iceland and Finland act as NHP coordinators.
Most hydrogen installations are meant to serve fuel cell buses, as well as cars. Activities are
based on collaboration across the borders and are backed with strong public and private
support in terms of funding, financial tax exemption schemes and investments.
(www.nordichydrogenpartnership.com)
Regional Challenges:
- Despite a strong focus on hydrogen in the region, the development, testing and uptake of
hydrogen vehicles is not a strong priority, at present, for the region in general.
- Viability of hydrogen as a fuel source is likely to depend on the deployment of Carbon
Capture, Use and Storage (CCUS) in the short and medium term.
- Competition for hydrogen from high-priority hard decarbonise industrial uses and
government strategic priority to utilise hydrogen for domestic heat.
- Current absence of Europe-wide strategy for low-carbon HGV. Investment in infrastructure
will be at risk until established.
- Lack of certainty within supply chain around future supply/demand dynamics.
- Industrialisation of electrolysers, fuel cells and hydrogen tank manufacturing – and linked to
this, the current high production cost of hydrogen which will be important for fuel-intensive
transport uses.
Regional Opportunities:
Increased certainty around future hydrogen transport applications will allow a scale-up of the
supply chain, necessary to support viable deployment of the technology.
- Hydrogen as a fuel source could contribute significantly to the decarbonisation of ports and
shipping.
- Much of the hydrogen production in the region is still based on fossil fuels, supporting our
industrial ports to start the shift to a green hydrogen supply would drive down overall costs
through scale and enable the deep decarbonisation of ‘first mile’ freight transport that
utilise our ports (e.g. shipping and HGVs).
- Job creation in energy-intensive industrial regions (e.g. Humber and Tees Valley) to offset
and exceed any expected job losses due to step changes in the decarbonisation agenda.
- Potential for the development of low carbon hydrogen (blue hydrogen) from gas reforming
combined with Carbon Capture and Storage (CCS) alongside the scaling up of green
hydrogen production.
Potential TfN Activity:
There is no short-term policy that will allow an accelerated deployment of hydrogen in transport,
but taking action to ready the supply chain in priority sectors will build the foundations for the
future.
- Apply a ‘look ahead’ in systems planning and supporting the supply chain by assessing
future infrastructure requirements (e.g. refuelling networks) to expedite and encourage
uptake once the technology becomes ready to enter the mainstream market.
- Encourage collaboration with other regions (e.g. Scotland and Wales) and other sub-national
transport bodies, mirroring the success of initiatives such as the Nordic Hydrogen
Partnership.
- Encourage and support our LEPs to develop a green hydrogen strategy for the North’s
industrial ports. Our ports are ideally placed to scale up the use of clean hydrogen, achieve
scale in CCUS and decarbonise the ‘first mile’ of freight transport from ports.
- Work with Tees Valley to make the region the testbed home for hydrogen mobility,
leveraging the existing capability around Tees Valley Net Zero Innovation Centre and the
Tees Hydrogen Transport Hub.
- Engage with HyNet North West to identify actions to form supply-chain cluster to include
hydrogen transport applications and to pool resources and share knowledge around the
adoption of hydrogen fuels for transport.
CGA3: Undertake or support a pan-northern hydrogen transport refuelling study. Provide
confidence to users about the future path of the technology, in particularly with regards to
priority application, e.g. hard to electrify rail services and long-haul HGVs.
CGA4: Supply chain support for future hydrogen infrastructure solutions for both first and last
mile hydrogen applications. TfN to engage in emerging hydrogen partnerships in the North to
support the development of a viable business case for hydrogen and provide confidence to the
supply chain.
Demand Management, Digitalisation and Modal Shift
Embracing new technologies and providing access to alternative modes of travel is essential to
achieving our decarbonisation objectives, especially in the short term
Regional Strengths:
- Strong support for both MaaS and digital substitution within LEP strategies.
- Strong pipeline of existing proposals to help make the region a world leader in digitalisation.
This includes Greater Manchester’s ambition to become a top five city-region for the digital
economy in Europe, with full fibre broadband and 5G coverage, and, the Borderlands
Inclusive Growth Deal proposal that seeks to complete the roll-out of super-fast broadband
to properties that do not yet have access in Cumbria.
- Strong regional support for modal shift to public transport.
- Significant support for rail investments, including Northern Powerhouse Rail.
- Ambitions in many city regions (e.g. Sheffield and Liverpool) to deliver zero-carbon public
transport networks.
- Existing programmes piloting demand-responsive transport and community-based initiatives
as a solution to the problem of accessibility in rural areas in the Tees Valley.
Regional Challenges:
- Despite some areas experiencing world-class digital connectivity, some areas of the region
still have limited broadband connectivity which needs to be addressed to allow for effective
employment of MaaS systems, improved customer experience on public transport and
digital substitution, in a way that meet the needs of the North’s often dispersed populations,
labour force and economy.
- Continued investment needed to expand 4G mobile data coverage and to support the
transition to 5G.
- The North’s topography and climate, especially in more rural areas, act as a barrier to active
travel uptake.
- Local bus services are often considered unreliable and expensive.
- Some existing industrial employment centres are poorly serviced by public transport and in
some areas there are no direct rail alternatives for passenger or freight movements which
creates reliance on the Strategic Road Network (SRN) for both local and regional journeys.
Regional Opportunities:
Capturing and optimising the economic, social and environmental benefits from digitalisation and
cleaner, greener travel.
- Development and updating of LEP Digital Infrastructure Plans, where needed, to support the
transition towards 5G.
- Proliferation of 5G innovation opportunities / programmes in the Tees Valley.
- Development of a Mobility Hub concept, which integrates public transport services with
shared mobility services and ZEV charging infrastructure. Hubs can act as a focus for
economic growth by creating an additional incentive to visit community and commercial
centres.
EXAMPLE BOX: Plymouth City Council has secured £6M to build 50 mobility hubs. This is to
be established by 2023 and are to include electric vehicle charging infrastructure, an e-car
club, e-bikes and digital information boards. Additionally, an integrated MaaS platform will
be developed to enable travel.
- To become a leader in the development of rural public and active transport solutions.
Exploring how new technologies can transform rural travel and incentivise the use of public
transport and other forms of greener, shared and active mobility, and, how these solutions
can stimulate return-investment in our rural communities.
- Given the aspirations for zero-carbon public transport networks existing across the North’s
city-regions, aggregating orders for ultra-low emission buses from cities across the North
could draw significant investment from the OEM vehicle supply industry into the region.
- Championing the consideration of social and environmental value on an equal basis to
economic return on investment when competing for government funding for active travel
and public transport infrastructure.
Potential TfN Activity:
Creating a narrative for sustainable future travel in the North
- Supporting and encouraging programmes such as the Made Smarter Tees Valley Pilot; 5G
Testbed and Trials Programme and Future Mobility Zones, to make the Tees Valley a leader
for tests and trials using 5G technology in rural areas.
- Supporting and engaging LEPs in the development or updating of Digital Infrastructure
Plans, to deliver strong messaging around the benefits of MaaS and digital substitution and
also robust timelines in relation to the delivery of the enabling technology.
- To influence government for continued investment to expand the North’s 4G mobile data
coverage and support the transition towards 5G as both an economic stimulator and a key
bedrock of an effective, digitally enabled, integrated transport system.
- To facilitate alongside partners, where feasible, the aggregation of large orders of ultra-low
emission buses from across the North’s city regions to attract inward investment and
ensure supply.
- As we move towards the decarbonisation of road vehicles, public perception of road
investment being the environmentally least friendly option may shift, particularly in rural
areas where demand for road investment may increase. There is an opportunity to co-
ordinate, with partners, in the delivery of strong messaging around the benefits of MaaS,
public transport and active travel and also robust timelines in relation to the delivery of
supporting infrastructure and enhanced services. It is essential that the region can provide
this parallel narrative to build back confidence in public transport after the COVID-19
pandemic and create a demand for ‘Liveable Places’.
CGA5: TfN to support a narrative for the North, utilising its Future Travel Scenarios, combining
the advantages of demand management, active travel, micro-mobility and public transport into
the evolving lifestyle choices of its citizens. The objective would be to create a vocal demand for
‘Liveable Places’ across the various geographies of the North.
CGA6: Supporting our local partners with data and evidence to analyse potential locations for
mobility hubs and to access funding sources. The hubs should act as stimulators of urban and
rural economic growth.
Freight Decarbonisation and Ports
Tailored solutions to deliver deep-decarbonisation of freight transport, recognising the
diversity of supply chain and stakeholder needs
Regional Strengths:
- Established freight networks and world leading ports.
- With the UK Government ambition, through its Maritime 2050 Strategy and Clean Maritime
Plan, to lead the way in transitioning to a future of zero emission shipping. The North’s ports
are well placed to support this ambition through the formation of ‘clean maritime’ clusters.
EXAMPLE BOX: The Port of Rotterdam in the Netherlands, one of Europe’s largest port and
energy hub, is positioning itself as a hydrogen leader, working with various partners to make
the port area an international hub for hydrogen production, import, application and
transport to other countries in Europe. For example, the “H-vision” project brings together
industry, the port and R&D partners to investigate the switch to blue hydrogen, which can
be achieved with significant public and private investment in new infrastructure. The
conversion of existing installations to transport hydrogen to the industrial companies and
deliver captured CO2 to empty fields underneath the North Sea. According to the Port, the
focus on large-scale hydrogen infrastructure will strengthen its international competitive
position and attract new businesses that focus on sustainability (source: www.h-
vision.nl/en).
- Three of our ports have been confirmed as freeport locations candidates, including Liverpool
City Region, Teesside and Humber (including Immingham), and are expected to attract
investment in manufacturing and logistics infrastructure through tax incentives and customs
freedoms. This will make them excellent locations for clean and green transport
infrastructure investment. A number of other candidate locations, including, Tyne and Wear
and Barrow/Workington also play a valuable role in overall picture for maritime industry and
freight transfer within the North.
Regional Challenges:
- Low or zero carbon technology in both maritime and freight sectors is at a relatively low
maturity level. Technology selections should ideally be made when the options are mature,
so any investment choices made now (e.g. liquid natural gas as a fuel for shipping) will have
a long-term impact that is hard to re-frame.
- The North’s sizeable freight and logistics sector exacerbates road traffic congestion hot-
points, as well as the emissions associated with ports and airports.
- The need for a coherent regional strategy to enhance the North’s competitive strength and
develop supply chains in relation to the green maritime agenda.
- European cooperation is required to develop compatible solutions for the decarbonisation
of freight, recognising the significant number of cross-border trips (by HGVs, shipping and
aviation).
EXAMPLE BOX: The European Technology Platform ALICE is set-up to develop a
comprehensive strategy for research, innovation and market deployment of logistics and
supply chain management innovation in Europe. In 2019, ALICE published its ‘Roadmap
Towards Zero Emission Logistics in 2050, looking at the radical changes needed to deliver
fully competitive low emissions vehicles, trains, barges, ships and airplanes. (source:
Roadmap Towards Zero Emissions Logistics 2050, ALICE (2019), www.etp-logistics.eu)
Regional Opportunities:
Green and competitive ports need a bold vision that combines a roadmap of lowering GHG
emissions from shipping and pollution in maritime areas, with integration of other sustainable
transport modes
- To lead the way in data collation and democratisation, mapping goods to vehicles in
common formats, allowing the North’s freight operators, both large and small to benefit
from information on efficiency schemes and measures, and the latest technologies.
- TfN’s Investment Programme will provide significant additional rail capacity in the region,
providing an opportunity to move freight transport from road to rail
- Rail freight is one of the most carbon-efficient means of moving goods, however heavy
freight loads typically require overhead electrification (as the zero carbon alternative to
diesel traction). The infrastructure works required to achieve coverage of the regions main
freight corridors represent an opportunity to invest further in the regions rail manufacturing
capability.
- The Government has committed to a £20million investment in the Clean Maritime
Demonstration Programme, and that a hydrogen refuelling port will be launched in Teesside.
- There is potential for our partners (ports, local authorities and delivery authorities) to work
together to deliver effective ‘port to port’ hydrogen or electric refuelling corridors across our
region. Many of these corridors are identified within the Strategic Development Corridors
defined within TfN’s Strategic Transport Plan.
EXAMPLE BOX: The Port of Gothenburg, in Sweden, is collaborating with Volvo Group, Scania
and Stena Line to accelerate the transition to fossil-free fuels in the transport sector and cut
emissions linked to the port by 70% by 2030. The collaboration focuses on the electrification
of sea transport. Gothenburg Port Authority will produce the necessary infrastructure and
access to fossil-free fuels for heavy vehicles, including electric power, biogas, and hydrogen
gas. The freight transporters and Stena Line will have a key role to play by ensuring new
fossil-free trucks and vessels are brought into service by 2030.
Potential TfN Activity:
Providing data and evidence to expedite the development of a decarbonisation pathway for
shipping and freight
- Supporting the sector by assessing future infrastructure requirements for hydrogen or
electric refuelling, to expedite and encourage uptake once the technology becomes ready to
enter the mainstream market. Supporting the formation of partnerships to consider ‘port to
port’ zero carbon freight corridors.
- Using TfN’s analytical framework to build a better understanding of freight and logistics
movements and the effects of efficiency measures and technologies. Making this data
available for to all.
- Supporting the region in becoming of a centre of excellence for zero carbon ports or
shipping in the region.
- Encouraging and supporting our cities to develop Sustainable Urban Logistics Plans
through the provision of data and research and developing a structured approach to sharing
knowledge through our Northern Evidence Hub.
CGA7: Developing and supporting partnerships to consider port-to-port, multi-modal, zero
carbon freight corridors, optimising the economic benefits that our freeports and clean
maritime clusters can generate for our region.
Rail Decarbonisation
Regional Strengths:
- The North possesses strong rail manufacturing capability and the region is well placed to
benefit from a nationwide acceleration of rail electrification programmes, as well as the
potential to lead on innovative new clean transport technologies (e.g. hydrogen-powered
passenger trains).
Regional Challenges:
- Many of the North’s dispersed communities have poor access to rail services and there is a
perception that the existing rail infrastructure needs improvement and better maintenance
before investment in decarbonisation programmes.
Regional Opportunities:
- To increase the North’s access to both UK and international markets in relation to green rail
infrastructure and rolling stock.
Potential TfN Activity:
- Work with government and Network Rail to ensure new rail schemes within our Investment
Programme are electrified, including NPR, providing future market certainty to the supply
chain and allowing development of further skills and capability in this sector within the
North.
- Work with partners, Network Rail and Train Operating Companies (TOCs) to bid for the
testing and trialling of new low emission train technologies in the region. This should serve
as sign of our intent to employ these technologies in the future and attract further
investment from the rail manufacturing sector into our region.
CGA8: Supporting our partners to attract testing and pilots of new low emission train
technologies in the region.
Our Clean Growth Opportunity Summary Matrix, Figure X, allows us to consider the identified
priority Clean Growth Actions relative to each other in relation to their potential to stimulate
economic growth and positive health outcomes.
All identified potential Clean Growth Actions have modest to strong potential to stimulate growth in
either jobs or skills within our region. The strongest actions in this respect are likely to be those in
relation to expediting the effective development of ZEV charging infrastructure and increased
uptake of ZEVs in the region, and in doing so, demonstrating significant regional demand to the
supply chain.
There is also significant economic growth potential in relation to proving a market for hydrogen fuels
for first mile freight journeys, however, this also a greater level of uncertainty around these
outcomes which is related to the relative immaturity of technology in this area.
Stronger, ‘all-round’ performers include actions around supporting demand management and modal
shift, which may see increased health benefits and more potential to simulate growth in a more
equitable way.
All eight of the identified potential Clean Growth Actions are taken forward into Chapter 9, where
TfN’s priority activities to 2025 are considered.
Figure X: TfN Clean Growth Opportunity Matrix

Our work has identified a number of other significant clean growth opportunities for the North.
Transport is not the key driver of these opportunities, but it can play an important enabling function.
Advancing Offshore Wind
Substantial installed offshore wind energy generation can be found off much of the North’s coasts,
with Cumbria being home to the largest offshore windfarm in Europe. The supply chains, research
and development activities and deployment of offshore wind farms are significant benefit to many
of our existing coastal areas.
Whilst offshore wind and the activities that support it are a relatively mature industry in the North,
any opportunities to strengthen the transport infrastructure that supports the industry, should be
explored. For example, the UK Government’s 10 Point Plan committed to investing £160m into
modern ports and manufacturing industries to further boost the UK’s offshore wind energy
generation capacity.
Further to this, some high-value components are still being imported. Transport links will be
important if the region is to attract the appropriate skills base and inward investment to fill these
manufacturing gaps.
The energy generated by offshore wind farms could also be used a source of renewable energy to
power the electrolysis process required to produce green hydrogen, to be used for transport
applications.
Potential TfN Activity
- Preparation of pan-northern hydrogen refuelling network strategy has been proposed as a
potential priority activity for TfN (alongside industry stakeholders) before 2025. Any strategy
should consider the contribution that offshore wind energy could play in the electrolysis
process to produce green hydrogen and understand how the spatial characteristics of a
refuelling network might optimise this potential.
- Supporting coastal LEPs (e.g. Humber and Liverpool) to access government funds which
would unlock increased investments in the North’s port infrastructure, including the
formation of clean maritime clusters.
Investing in Carbon Capture, Usage and Storage (CCUS)
The North already leads the country in CCUS research and development, with the region’s ambitions
being driven by the need to decarbonise the North’s heavy industrial clusters, including those in the
Humber, Tees Valley and Merseyside. The UK Government’s 10 Point Plan pledges significant
investment to support the establishment of SuperPlaces: industrial clusters pioneering hydrogen
production and carbon capture, returning the latter to under the North Sea. Given its location, the
North is perfectly placed to host these clean growth clusters and utilise the hydrogen they produce.
The majority of decarbonisation pathways, including those presented by the Climate Change
Committee, rely on an element of CCUS to achieve their decarbonisation trajectories. It is also true
that the effective and rapid development of CCUS in the North will be an essential component within
the hydrogen supply chain (before green hydrogen production sufficiently develops) if it is to be
chosen as a viable fuel source for zero or low emission HGVs. Without CCUS, it is likely that the
decarbonisation pathways for our HGVs would need to pivot to alternative fuel sources (e.g.
battery electric). Given the North’s potential in relation to the development of CCUS and hydrogen
production/use, this would represent a missed growth opportunity for the region.

The scale of major infrastructure planned through our Investment Programme will also mean that
the region’s ability to scale CCUS activity, particularly in relation to industries producing construction
materials (e.g. steel), is likely to be an important component in mitigating our embodied carbon
emissions.
60
Chapter 9 – TfN’s Priority Decarbonisation Actions
We believe that TfN has an important role to play in achieving transport decarbonisation in the
North.
Demonstrating: Evidence-building, running pilots and collating and sharing best practice.
Facilitating: Working for consensus, ensuring consistency, co-ordinating cross-sectoral partnerships
and teams, as well as representing our partners as a single, strong unified voice in national forums.
Supporting: Developing regional strategy to support local objectives and provide a basis for effective
and co-ordinated influencing of government.
Our policy analysis work has revealed those areas of policy through which the most challenging
emissions reductions must be achieved. These provide a focus for our proposed research, data and
evidence-building activities in the short-term to 2025. Specific activities generated by this analysis
are signposted as ‘Policy Gap Actions’ (PGAs).
Alongside the policy analysis, our exploration of those activities which can provide the greatest
potential for clean, green growth in the North has identified eight ‘Clean Growth Actions’ (CGAs).
Finally, a number of additional activities have been identified as priorities and refined through
engagement with our partners, industry, research networks such as DecarboN8 and other Sub-
national Transport Bodies, and these are highlighted as ‘Stakeholder Driven Action’ (SDAs).
Taken altogether, these represent TfN’s proposed Priority Decarbonisation Actions.
Given the enormity of the decarbonisation challenge and the risks associated with failing to achieve
what is needed, the majority of activities around decarbonisation would justifiably be classed as
‘high priority’. TfN’s proposed Priority Actions , are those activities which we believe need to happen
in the short-term (i.e. up to 2025) and that are most effectively delivered at a pan-Northern level.
They typically:
• recognise the transboundary nature of our surface transport system and tackle those
challenges and emissions that fall between the gaps when employing a county or combined
authority governance approach;
• generate evidence that can be applied usefully across a range of places by our partners (i.e.
are not ‘place specific’);
• reflect preferences expressed by our partners and other stakeholders.
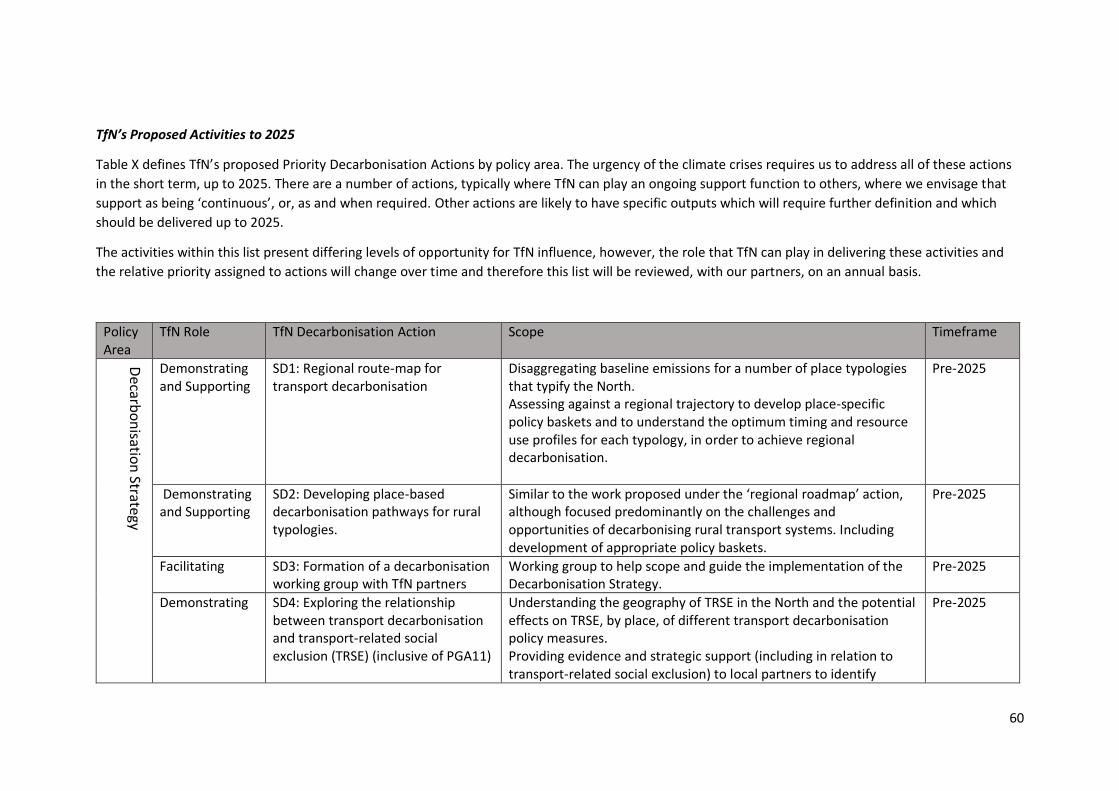
60
TfN’s Proposed Activities to 2025
Table X defines TfN’s proposed Priority Decarbonisation Actions by policy area. The urgency of the climate crises requires us to address all of these actions
in the short term, up to 2025. There are a number of actions, typically where TfN can play an ongoing support function to others, where we envisage that
support as being ‘continuous’, or, as and when required. Other actions are likely to have specific outputs which will require further definition and which
should be delivered up to 2025.
The activities within this list present differing levels of opportunity for TfN influence, however, the role that TfN can play in delivering these activities and
the relative priority assigned to actions will change over time and therefore this list will be reviewed, with our partners, on an annual basis.
Policy Area
TfN Role TfN Decarbonisation Action Scope Timeframe
Decarb
on
isation
Strategy
Demonstrating and Supporting
SD1: Regional route-map for transport decarbonisation
Disaggregating baseline emissions for a number of place typologies that typify the North. Assessing against a regional trajectory to develop place-specific policy baskets and to understand the optimum timing and resource use profiles for each typology, in order to achieve regional decarbonisation.
Pre-2025
Demonstrating and Supporting
SD2: Developing place-based decarbonisation pathways for rural typologies.
Similar to the work proposed under the ‘regional roadmap’ action, although focused predominantly on the challenges and opportunities of decarbonising rural transport systems. Including development of appropriate policy baskets.
Pre-2025
Facilitating SD3: Formation of a decarbonisation working group with TfN partners
Working group to help scope and guide the implementation of the Decarbonisation Strategy.
Pre-2025
Demonstrating SD4: Exploring the relationship between transport decarbonisation and transport-related social exclusion (TRSE) (inclusive of PGA11)
Understanding the geography of TRSE in the North and the potential effects on TRSE, by place, of different transport decarbonisation policy measures. Providing evidence and strategic support (including in relation to transport-related social exclusion) to local partners to identify
Pre-2025

61
locations where cycle hire and e-scooter schemes would deliver maximum environmental benefit alongside wider social, health and economic benefits.
Demonstrating SD5: Research into embodied carbon analysis for strategic transport infrastructure programmes
Partnering with research bodies to investigate the requirements and feasibility of carrying out embodied carbon assessments of strategic multimodal transport infrastructure corridor proposals. We shall use a selection of schemes from TfN’s existing Strategic Development Corridors for this task.
Pre-2025
Demonstrating and Supporting
SD6: Programmatic assessment of Investment Programme (IP) against TfN Decarbonisation Trajectory
Assessment of modelled emissions as a result IP Intervention Sequencing Strategy, against TfN’s Decarbonisation Trajectory to identify any additional decarbonisation policy required, and potential adjustments to IP.
Pre-2025
Electric Veh
icles and
Fuel Efficien
cy
Demonstrating CGA1: Develop a regional ZEV charging strategy (inclusive of PGA1)
Identifying those facets of a low carbon charging system that are best approached at a pan-Northern level, including coverage of the Major Road Network (MRN), consistency and interoperability of technology and payment systems, procurement principles, future proofing and consideration of future grid requirements.
Pre-2025
Supporting CGA2: Supporting local partners in the development of local ZEV Charging Infrastructure
Supporting local partners in the development of local ZEV infrastructure charging plans and the pursual of funding opportunities, through the provision of data and evidence.
Pre-2025
Facilitating and Supporting
PGA14: Increase awareness of fuel-efficient driving styles
Through the policy positions we adopt and our communication and engagement activities, work with partners to increase public awareness of fuel-efficient driving styles and the associated environmental and financial benefits.
Continuous
Hyd
rogen
Demonstrating CGA3: Undertake or support a pan-northern hydrogen transport refuelling study
Understanding the potential of the North’s hydrogen generation/CCS potential to decarbonise transport. Mapping hydrogen network against the Strategic Road Network (SRN)/MRN and rail network (and freight depots) to identify strategic locations for investment in refuelling depots/stations.
Pre-2025

62
Supporting
CGA4: Supply chain support for future hydrogen infrastructure solutions
Engaging with emerging hydrogen partnerships in the North to support the development of a viable business case for hydrogen (for both first and last mile freight applications) and provide confidence to the supply chain.
Continuous
Dem
and
Man
agemen
t
Supporting SD7: Supporting the development of scalable digital solutions for incentivising greener, shared and active mobility in rural areas.
Supporting partners, through provision of evidence and data, in understanding the key requirements of an effective rural MaaS system.
Continuous
Facilitating and Supporting
CGA5: Supporting a Demand Management Narrative for the North
Utilising TfN’s Future Travel Scenarios, combining the advantages of demand management, active travel, micro-mobility and public transport into the evolving lifestyle choices of its citizens. The objective would be to create a vocal demand for ‘Liveable Places’ across the various geographies of the North.
Pre-2025
Demonstrating and Supporting
CGA6: Supporting local partners in the development of Mobility Hubs
Provision of data and evidence to facilitate analysis into potential locations for mobility hubs, in both rural and urban areas, and to access funding sources.
Pre-2025
Demonstrating and Facilitating
PGA10: Consider role of micro-mobility/shared mobility in the first and last mile journeys at train stations
Use our role within the Rail North Partnership to facilitate a consideration of how shared mobility, including cycle hire and e-scooter schemes, can be encouraged for first and last mile journeys at train stations.
Pre-2025
Demonstrating and Facilitating
PGA8: Develop schemes and infrastructure to improve regional public transport network, e.g. Northern Powerhouse Rail
Develop and implement comprehensive plans for the regional public transport network, such as Northern Powerhouse Rail and wider improvements to the rail network.
Continuous (and beyond 2025)
Demonstrating PGA9: Research on the effects of home-working upon productivity and agglomeration.
Develop an evidence base on the extent to which less work-related travel has a detrimental effect on productivity and agglomeration to understand whether home-working can be consistent with TfN’s vision for a transformed Northern economy.
Pre-2025
Freig
ht Demonstrating
and Facilitating SD8: Low carbon urban freight scenarios
Research on appropriate place-based, low carbon, urban freight (last-mile) solutions in the North.
Pre-2025
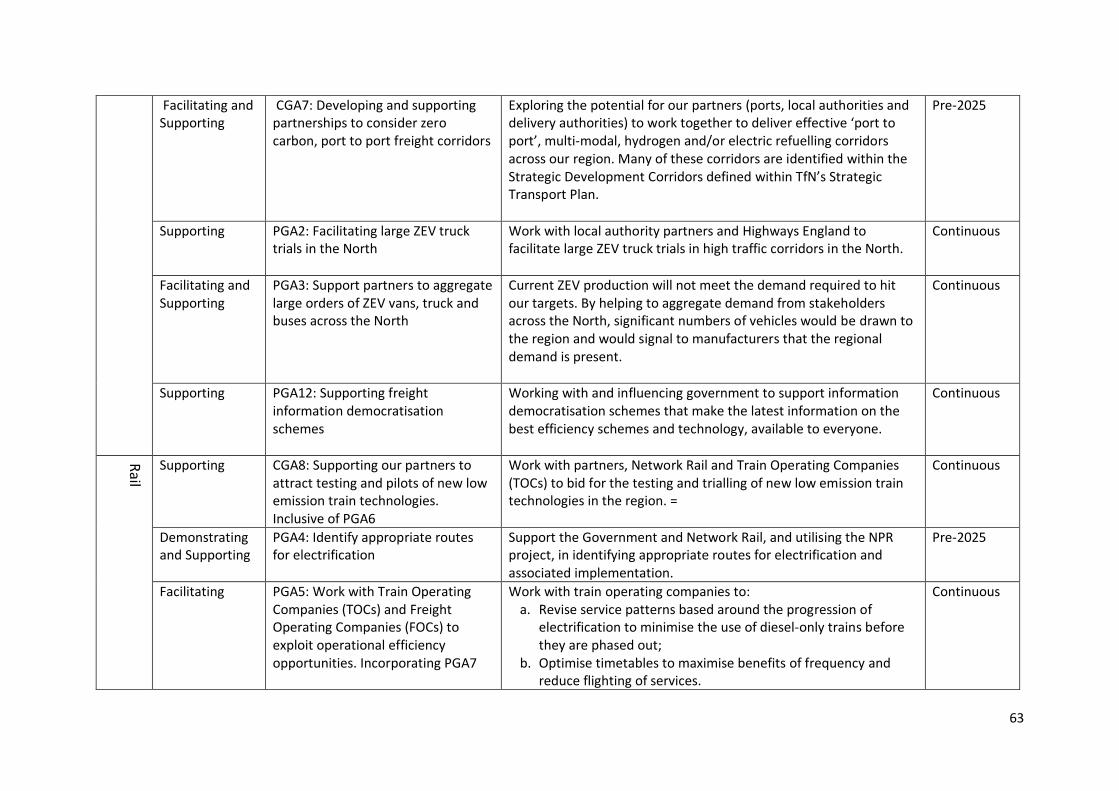
63
Facilitating and Supporting
CGA7: Developing and supporting partnerships to consider zero carbon, port to port freight corridors
Exploring the potential for our partners (ports, local authorities and delivery authorities) to work together to deliver effective ‘port to port’, multi-modal, hydrogen and/or electric refuelling corridors across our region. Many of these corridors are identified within the Strategic Development Corridors defined within TfN’s Strategic Transport Plan.
Pre-2025
Supporting PGA2: Facilitating large ZEV truck trials in the North
Work with local authority partners and Highways England to facilitate large ZEV truck trials in high traffic corridors in the North.
Continuous
Facilitating and Supporting
PGA3: Support partners to aggregate large orders of ZEV vans, truck and buses across the North
Current ZEV production will not meet the demand required to hit our targets. By helping to aggregate demand from stakeholders across the North, significant numbers of vehicles would be drawn to the region and would signal to manufacturers that the regional demand is present.
Continuous
Supporting PGA12: Supporting freight information democratisation schemes
Working with and influencing government to support information democratisation schemes that make the latest information on the best efficiency schemes and technology, available to everyone.
Continuous
Rail
Supporting CGA8: Supporting our partners to attract testing and pilots of new low emission train technologies. Inclusive of PGA6
Work with partners, Network Rail and Train Operating Companies (TOCs) to bid for the testing and trialling of new low emission train technologies in the region. =
Continuous
Demonstrating and Supporting
PGA4: Identify appropriate routes for electrification
Support the Government and Network Rail, and utilising the NPR project, in identifying appropriate routes for electrification and associated implementation.
Pre-2025
Facilitating PGA5: Work with Train Operating Companies (TOCs) and Freight Operating Companies (FOCs) to exploit operational efficiency opportunities. Incorporating PGA7
Work with train operating companies to: a. Revise service patterns based around the progression of
electrification to minimise the use of diesel-only trains before they are phased out;
b. Optimise timetables to maximise benefits of frequency and reduce flighting of services.
Continuous
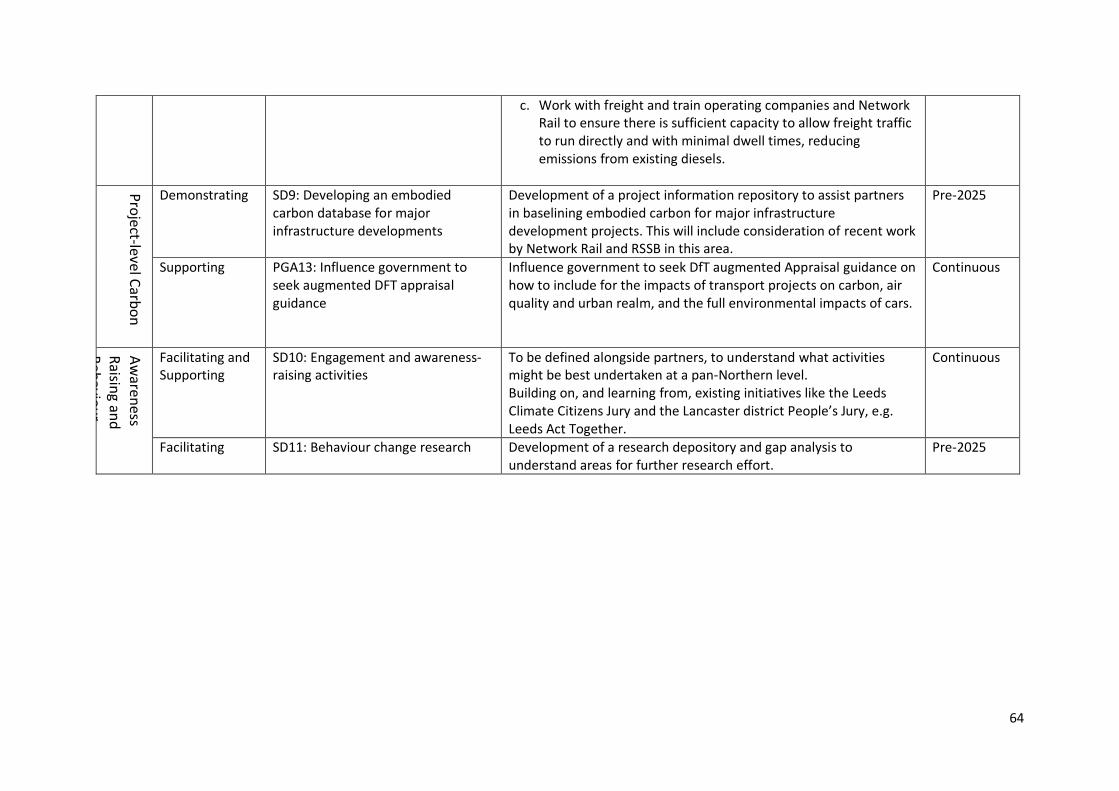
64
c. Work with freight and train operating companies and Network Rail to ensure there is sufficient capacity to allow freight traffic to run directly and with minimal dwell times, reducing emissions from existing diesels.
Pro
ject-level Carb
on
Demonstrating SD9: Developing an embodied carbon database for major infrastructure developments
Development of a project information repository to assist partners in baselining embodied carbon for major infrastructure development projects. This will include consideration of recent work by Network Rail and RSSB in this area.
Pre-2025
Supporting PGA13: Influence government to seek augmented DFT appraisal guidance
Influence government to seek DfT augmented Appraisal guidance on how to include for the impacts of transport projects on carbon, air quality and urban realm, and the full environmental impacts of cars.
Continuous
Aw
areness
Raisin
g and
B
ehavio
ur
Ch
ange
Facilitating and Supporting
SD10: Engagement and awareness-raising activities
To be defined alongside partners, to understand what activities might be best undertaken at a pan-Northern level. Building on, and learning from, existing initiatives like the Leeds Climate Citizens Jury and the Lancaster district People’s Jury, e.g. Leeds Act Together.
Continuous
Facilitating SD11: Behaviour change research Development of a research depository and gap analysis to understand areas for further research effort.
Pre-2025
70
Chapter 10 - Internal assurance, monitoring and evaluation
Internal assurance
Through our internal policy framework, we shall consider the carbon implications of all our projects and programmes at their inception, to ensure we understand the implications and where appropriate, take actions to mitigate the impacts. These processes also ensure that TfN’s activities are informed by the growing evidence base on the impacts of transport interventions in the North of England across a range of domains – including impacts on carbon emissions.
We also need to grasp the opportunities to achieve carbon reductions wherever we can. We expect these opportunities to occur in our development projects and through our policy-making, but also when making corporate decisions around aspects such as our ways of working, procurement activities and staff benefits.
Our internal assurance process will require the owners of TfN projects, programmes and processes to understand TfN’s Decarbonisation Trajectory and assess whether their proposals are supportive of this direction of travel. Figure X in Chapter 2 illustrates how we intend to benchmark our Investment Programme against our Decarbonisation Trajectory, both at a strategic level and also when embarking on the development of the individual business cases of the schemes within it.
Where proposals are in relation to infrastructure development, or the procurement of supply chain services, they will also need to align with TfN’s targets in relation to reducing supply chain and construction carbon.
Monitoring and evaluating our progress
When it comes to decarbonisation, the time for strategising is short and the time for delivering on our commitments is now.
Rigorous monitoring and evaluation processes will ensure that progress towards TfN’s decarbonisation commitments is clearly measured, that reductions in carbon can be attributed to specific causes, and that any unforeseen consequences of this are properly analysed. These processes are vital to shaping and updating our strategies and actions over the coming decades to ensure the maximum benefits are derived, and any negative externalities are minimised.
TfN is currently developing a Monitoring and Evaluation (M&E) Strategy and Framework, which is scheduled for completion in 2021. The M&E Strategy sets out the processes necessary for a rigorous system of M&E within TfN, including how the outputs of monitoring and evaluation should inform the development and appraisal of TfN projects. Alongside this, the M&E Framework sets out the indicators by which TfN will measure progress towards the four objectives set out in the Strategic Transport Plan. Decarbonisation connects to all of
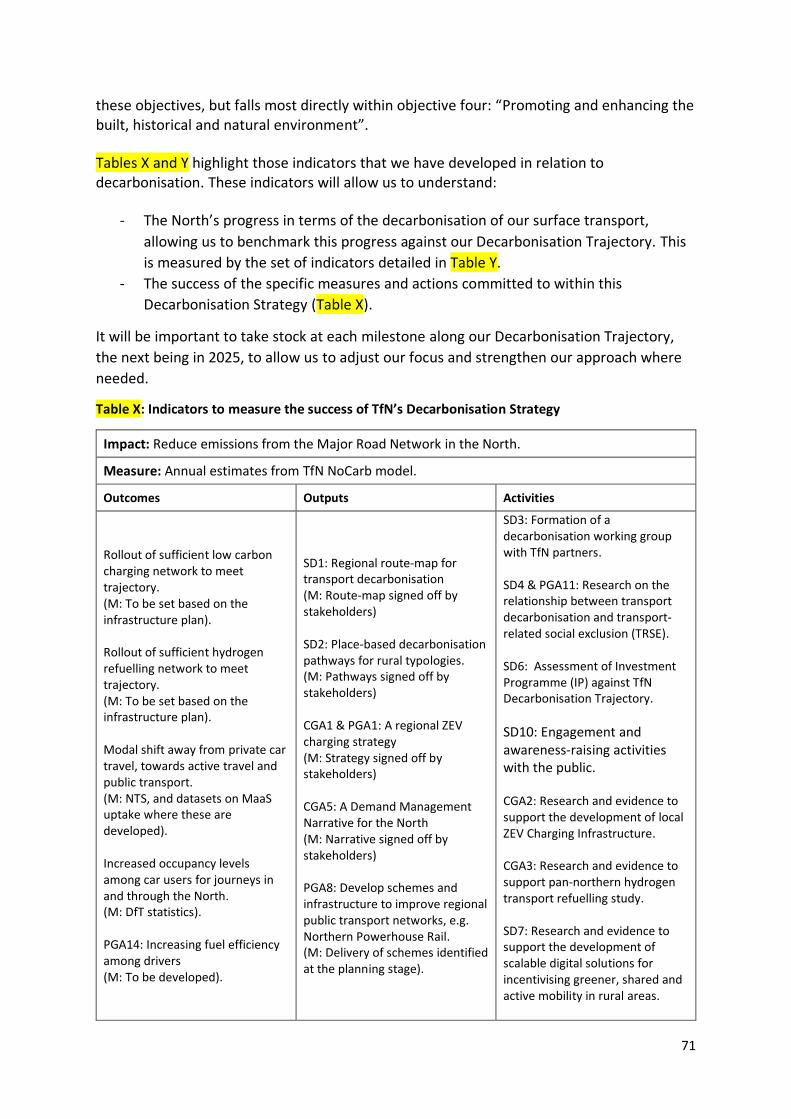
71
these objectives, but falls most directly within objective four: “Promoting and enhancing the built, historical and natural environment”.
Tables X and Y highlight those indicators that we have developed in relation to decarbonisation. These indicators will allow us to understand:
- The North’s progress in terms of the decarbonisation of our surface transport,
allowing us to benchmark this progress against our Decarbonisation Trajectory. This
is measured by the set of indicators detailed in Table Y.
- The success of the specific measures and actions committed to within this
Decarbonisation Strategy (Table X).
It will be important to take stock at each milestone along our Decarbonisation Trajectory,
the next being in 2025, to allow us to adjust our focus and strengthen our approach where
needed.
Table X: Indicators to measure the success of TfN’s Decarbonisation Strategy
Impact: Reduce emissions from the Major Road Network in the North.
Measure: Annual estimates from TfN NoCarb model.
Outcomes Outputs Activities
Rollout of sufficient low carbon charging network to meet trajectory. (M: To be set based on the infrastructure plan). Rollout of sufficient hydrogen refuelling network to meet trajectory. (M: To be set based on the infrastructure plan). Modal shift away from private car travel, towards active travel and public transport. (M: NTS, and datasets on MaaS uptake where these are developed). Increased occupancy levels among car users for journeys in and through the North. (M: DfT statistics). PGA14: Increasing fuel efficiency among drivers (M: To be developed).
SD1: Regional route-map for transport decarbonisation (M: Route-map signed off by stakeholders) SD2: Place-based decarbonisation pathways for rural typologies. (M: Pathways signed off by stakeholders) CGA1 & PGA1: A regional ZEV charging strategy (M: Strategy signed off by stakeholders) CGA5: A Demand Management Narrative for the North (M: Narrative signed off by stakeholders) PGA8: Develop schemes and infrastructure to improve regional public transport networks, e.g. Northern Powerhouse Rail. (M: Delivery of schemes identified at the planning stage).
SD3: Formation of a decarbonisation working group with TfN partners. SD4 & PGA11: Research on the relationship between transport decarbonisation and transport-related social exclusion (TRSE). SD6: Assessment of Investment Programme (IP) against TfN Decarbonisation Trajectory.
SD10: Engagement and awareness-raising activities with the public. CGA2: Research and evidence to support the development of local ZEV Charging Infrastructure. CGA3: Research and evidence to support pan-northern hydrogen transport refuelling study. SD7: Research and evidence to support the development of scalable digital solutions for incentivising greener, shared and active mobility in rural areas.
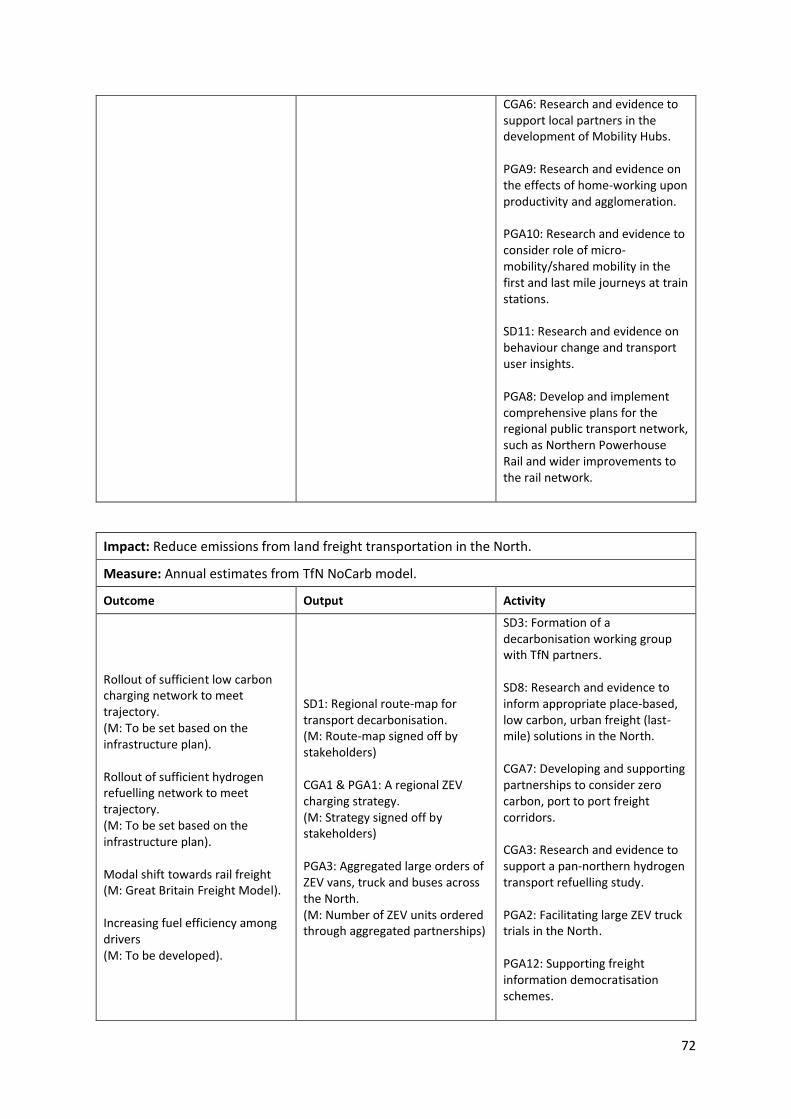
72
CGA6: Research and evidence to support local partners in the development of Mobility Hubs. PGA9: Research and evidence on the effects of home-working upon productivity and agglomeration. PGA10: Research and evidence to consider role of micro-mobility/shared mobility in the first and last mile journeys at train stations. SD11: Research and evidence on behaviour change and transport user insights. PGA8: Develop and implement comprehensive plans for the regional public transport network, such as Northern Powerhouse Rail and wider improvements to the rail network.
Impact: Reduce emissions from land freight transportation in the North.
Measure: Annual estimates from TfN NoCarb model.
Outcome Output Activity
Rollout of sufficient low carbon charging network to meet trajectory. (M: To be set based on the infrastructure plan). Rollout of sufficient hydrogen refuelling network to meet trajectory. (M: To be set based on the infrastructure plan). Modal shift towards rail freight (M: Great Britain Freight Model). Increasing fuel efficiency among drivers (M: To be developed).
SD1: Regional route-map for transport decarbonisation. (M: Route-map signed off by stakeholders) CGA1 & PGA1: A regional ZEV charging strategy. (M: Strategy signed off by stakeholders) PGA3: Aggregated large orders of ZEV vans, truck and buses across the North. (M: Number of ZEV units ordered through aggregated partnerships)
SD3: Formation of a decarbonisation working group with TfN partners. SD8: Research and evidence to inform appropriate place-based, low carbon, urban freight (last-mile) solutions in the North. CGA7: Developing and supporting partnerships to consider zero carbon, port to port freight corridors. CGA3: Research and evidence to support a pan-northern hydrogen transport refuelling study. PGA2: Facilitating large ZEV truck trials in the North. PGA12: Supporting freight information democratisation schemes.
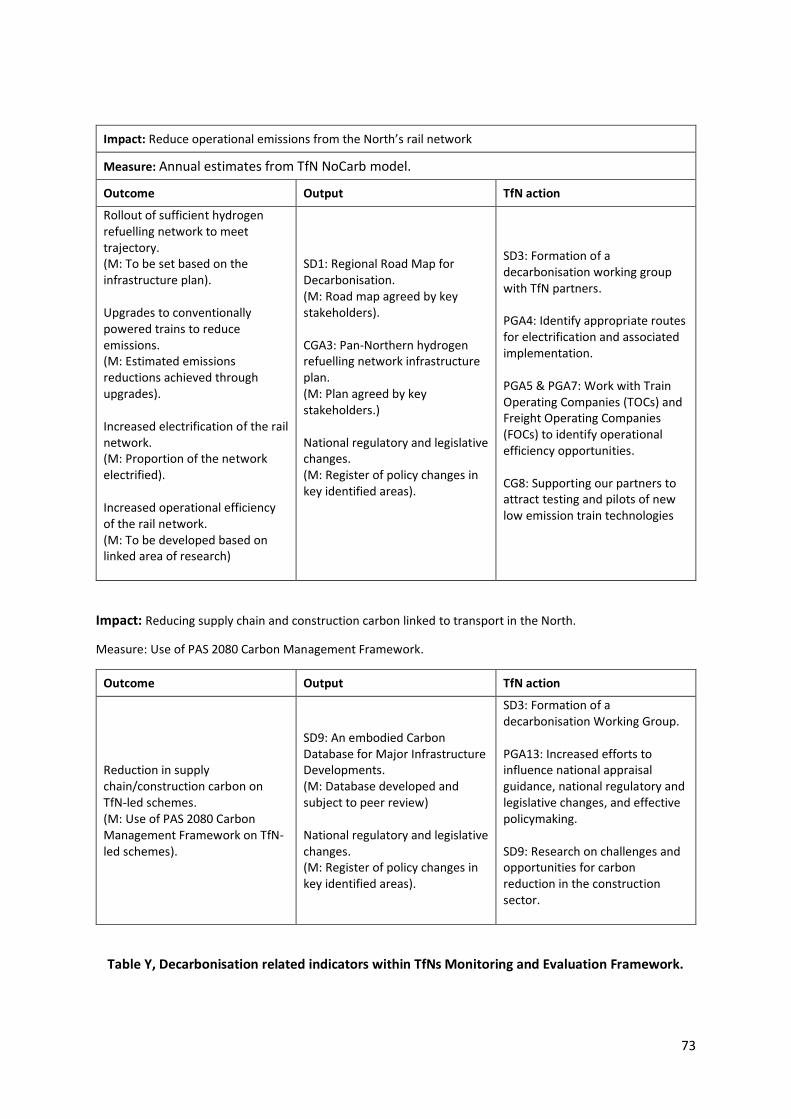
73
Impact: Reduce operational emissions from the North’s rail network
Measure: Annual estimates from TfN NoCarb model.
Outcome Output TfN action
Rollout of sufficient hydrogen refuelling network to meet trajectory. (M: To be set based on the infrastructure plan). Upgrades to conventionally powered trains to reduce emissions. (M: Estimated emissions reductions achieved through upgrades). Increased electrification of the rail network. (M: Proportion of the network electrified). Increased operational efficiency of the rail network. (M: To be developed based on linked area of research)
SD1: Regional Road Map for Decarbonisation. (M: Road map agreed by key stakeholders). CGA3: Pan-Northern hydrogen refuelling network infrastructure plan. (M: Plan agreed by key stakeholders.) National regulatory and legislative changes. (M: Register of policy changes in key identified areas).
SD3: Formation of a decarbonisation working group with TfN partners. PGA4: Identify appropriate routes for electrification and associated implementation. PGA5 & PGA7: Work with Train Operating Companies (TOCs) and Freight Operating Companies (FOCs) to identify operational efficiency opportunities. CG8: Supporting our partners to attract testing and pilots of new low emission train technologies
Impact: Reducing supply chain and construction carbon linked to transport in the North.
Measure: Use of PAS 2080 Carbon Management Framework.
Outcome Output TfN action
Reduction in supply chain/construction carbon on TfN-led schemes. (M: Use of PAS 2080 Carbon Management Framework on TfN-led schemes).
SD9: An embodied Carbon Database for Major Infrastructure Developments. (M: Database developed and subject to peer review) National regulatory and legislative changes. (M: Register of policy changes in key identified areas).
SD3: Formation of a decarbonisation Working Group. PGA13: Increased efforts to influence national appraisal guidance, national regulatory and legislative changes, and effective policymaking. SD9: Research on challenges and opportunities for carbon reduction in the construction sector.
Table Y, Decarbonisation related indicators within TfNs Monitoring and Evaluation Framework.
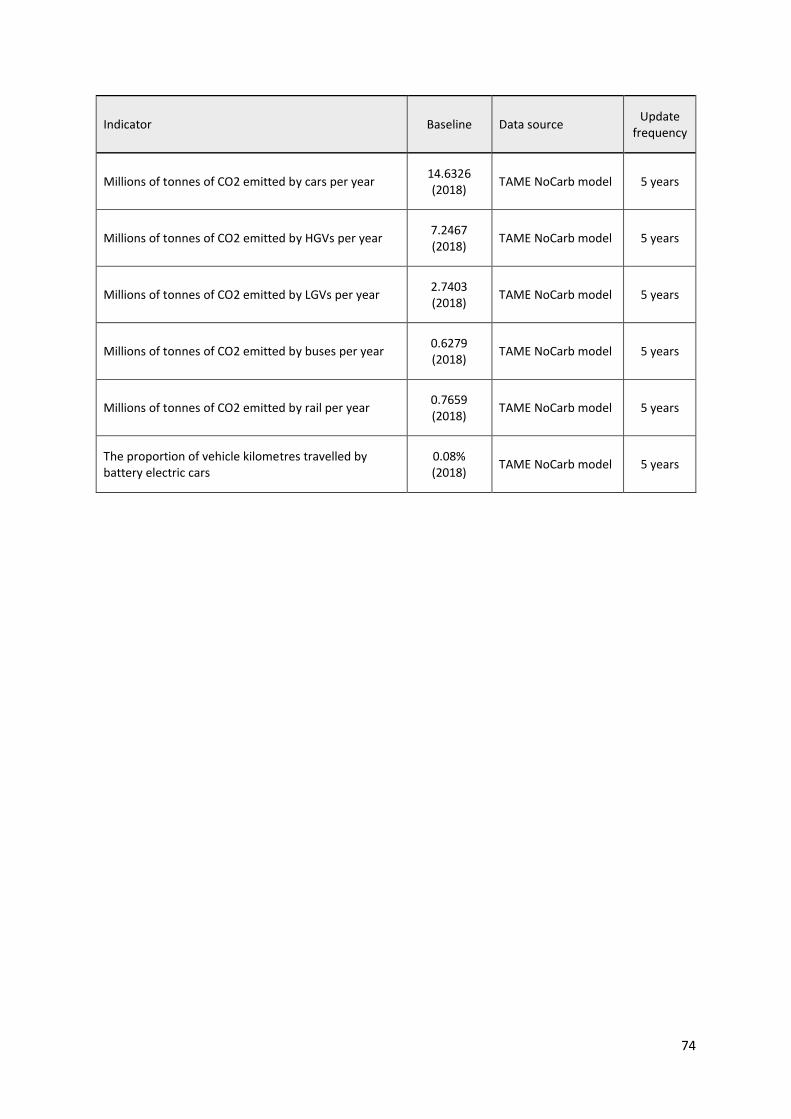
74
Indicator Baseline Data source Update
frequency
Millions of tonnes of CO2 emitted by cars per year 14.6326 (2018)
TAME NoCarb model 5 years
Millions of tonnes of CO2 emitted by HGVs per year 7.2467 (2018)
TAME NoCarb model 5 years
Millions of tonnes of CO2 emitted by LGVs per year 2.7403 (2018)
TAME NoCarb model 5 years
Millions of tonnes of CO2 emitted by buses per year 0.6279 (2018)
TAME NoCarb model 5 years
Millions of tonnes of CO2 emitted by rail per year 0.7659 (2018)
TAME NoCarb model 5 years
The proportion of vehicle kilometres travelled by battery electric cars
0.08% (2018)
TAME NoCarb model 5 years


![TfN Autumn Report[1]](https://static.fdocuments.in/doc/165x107/5695cf8f1a28ab9b028e9b68/tfn-autumn-report1.jpg)