DECARBONATION BEHAVIOR OF Mg-A1-CO3 … 43/43-4-427.pdf · DECARBONATION BEHAVIOR OF Mg-A1-CO3...
6
Clays and Clay Minerals, u 43, No. 4, 427-432, 1995. DECARBONATION BEHAVIOR OF Mg-A1-CO3 HYDROTALCITE-LIKE COMPOUNDS DURING HEAT TREATMENT TOSHIYUKI HmlNO, YASUMASA YAMASHITA,KATSUNORIKOSUGE, AND ATSUMUTSUNASHIMA Materials Processing Department, National Institute for Resources and Environment 16-30nogawa, Tsukuba, 305 Japan Abstract--Historically, the decarbonation of Mg-A1-CO3 hydrotalcite-like compounds (HTlc) has been thought to occur between 400* and 500"C. The present work demonstrates that when HTlcs having the maximum AI content, AU(A1 + Mg) = 0.33, are heated to 5000C, 20-30% of the carbonates remain. The evolution of the remaining carbonates was observed as two maxima, at 600 and 900~ At these tem- peratures, AI ions go into MgO, and spinel (MgA1204) forms. Therefore, the carbonates are released as the A1 ions migrate. At a lower A1 content, AI/(A1 + Mg) = 0.25, CO2 evolution is almost complete at 500"12. This HTlc has no maximum of CO2 evolution above 5000C. Lower charge densities, due to lower A1 contents, lead to lower amounts of remaining carbonate anions. Key Words--Decarbonation, Heat treatment, Hydrotalcite. INTRODUCTION In the literature there is extensive discussion of the properties ofhydrotalcite-like compounds (HTlcs), with the general formula: [M 2+~_x M3+x(OH)2] x+" [An-,J~ m H20]*-. Here, M 2+ and M 3+ are di- and trivalent metal ions that occupy octahedral positions in brucite-like hydroxide layers, and A n- is the interlayer anion. The value ofx Ix = AI/(A1 + Mg)] ranges between 0.20 and 0.33 for the Mg-A1 system (Miyata 1980). HTIcs con- sist of positively charged brucite-like layers alternating with negatively charged inteflayers (Allmann 1968, In- gram and Taylor 1967). The interlayers contain anions and water molecules, and hydrogen bonding exists be- tween them (Miyata 1975, Bish and Brindley 1977). Mg-A1-CO3 HTlc are known to decompose to Mg-AI oxide solid solution upon heating to between 400*- 800~ The resulting oxides readily rehydrate and ad- sorb anions to reconstruct the original HTlc structure. Recently, the reconstruction of calcined and decar- bonated HTlcs in the presence of large anion solutions has been established as a method for synthesizing HTlcs intercalated with large anions, as shown by Chibwe and Jones (1989a, 1989b) and Narita et al (1991). Nev- ertheless, no detailed study on decarbonation behavior of HTlcs has been reported, though some studies have touch on it briefly in Mg-AI-CO3 system. Ross and Kodama (1967) mentioned that nearly all the CO2 was evolved by 600*(2 when the precipitate's composition was near those of manasseite and hydrotalcite (x = 0.25). Miyata (1980) reported about a chemical anal- ysis of outgassed HTlc with x = 0.33. No carbonate was released at 400"C, and 77% of the carbonate was lost at 500"C. In other studies, the weight loss near 400"C is simply attributed to both dehydroxylation and Copyright 1995, The Clay Minerals Society decarbonation (Bish and Brindley 1977; Sato et al 1986a, 1986b). In the present work, we measured the amounts of CO2 evolved from Mg-A1-CO3 HTlcs at various tem- peratures up to 1200"C. EXPERIMENTAL The HTlc was prepared by coprecipitation. An aque- ous solution of MgC12 and AIC13 (Mg 2+ + A13+ -- 0.5 mol/liter, x -- 0.33) was continuously added to an aque- ous solution of Na2CO3 (CO32-/A13+ = 1) at a flow rate of 50 ml/min. The mixture was maintained at 70~ pH was adjusted to 10 by drop-wise addition of an NaOH solution, and the solution was vigorously stirred. The precipitate was washed ultrasonically with distilled water and then centrifuged. This operation was repeated until Cl- was no longer detectable with AgNOa. The washed precipitate was dried at 80~ and stored in a desiccator (Sample 1). Well-crystallized HTlc (Sample 2) was prepared by hydrothermal treatment at 150~ and 500 kPa for 12 hours, with the previously mentioned solution of MgCl2, A1CIa and Na2CO3. Other HTlcs with x = 0.20 and 0.25 were prepared in the same way as Sample 1. The chemical compositions were determined by in- ductively coupled plasma emission spectrochemical analysis (ICP). Surface areas were measured by the BET method with nitrogen. The morphology of samples was observed with a transmission electron microscope (TEM). Simultaneous thermogravimetry differential thermal analysis (TG-DTA) of the samples was carded out under nitrogen gas at a heating rate of 3~ X-ray powder diffraction (XRD) patterns were ob- served with CuKa radiation. Lattice constants were 427
Transcript of DECARBONATION BEHAVIOR OF Mg-A1-CO3 … 43/43-4-427.pdf · DECARBONATION BEHAVIOR OF Mg-A1-CO3...

Clays and Clay Minerals, u 43, No. 4, 427-432, 1995.
DECARBONATION BEHAVIOR OF Mg-A1-CO3 HYDROTALCITE-LIKE COMPOUNDS DURING HEAT TREATMENT
TOSHIYUKI HmlNO, YASUMASA YAMASHITA, KATSUNORI KOSUGE, AND ATSUMU TSUNASHIMA
Materials Processing Department, National Institute for Resources and Environment 16-30nogawa, Tsukuba, 305 Japan
Abstract--Historically, the decarbonation of Mg-A1-CO3 hydrotalcite-like compounds (HTlc) has been thought to occur between 400* and 500"C. The present work demonstrates that when HTlcs having the maximum AI content, AU(A1 + Mg) = 0.33, are heated to 5000C, 20-30% of the carbonates remain. The evolution of the remaining carbonates was observed as two maxima, at 600 and 900~ At these tem- peratures, AI ions go into MgO, and spinel (MgA1204) forms. Therefore, the carbonates are released as the A1 ions migrate.
At a lower A1 content, AI/(A1 + Mg) = 0.25, CO2 evolution is almost complete at 500"12. This HTlc has no maximum of CO2 evolution above 5000C. Lower charge densities, due to lower A1 contents, lead to lower amounts of remaining carbonate anions. Key Words--Decarbonation, Heat treatment, Hydrotalcite.
I N T R O D U C T I O N
In the literature there is extensive discussion of the properties ofhydrotalcite-like compounds (HTlcs), with the general formula: [M 2+ ~_x M3+x(OH)2] x+" [An-,J~ �9 m H20]*-. Here, M 2+ and M 3+ are di- and trivalent metal ions that occupy octahedral positions in brucite-like hydroxide layers, and A n- is the interlayer anion. The value ofx Ix = AI/(A1 + Mg)] ranges between 0.20 and 0.33 for the Mg-A1 system (Miyata 1980). HTIcs con- sist of positively charged brucite-like layers alternating with negatively charged inteflayers (Allmann 1968, In- gram and Taylor 1967). The interlayers contain anions and water molecules, and hydrogen bonding exists be- tween them (Miyata 1975, Bish and Brindley 1977). Mg-A1-CO3 HTlc are known to decompose to Mg-AI oxide solid solution upon heating to between 400*- 800~ The resulting oxides readily rehydrate and ad- sorb anions to reconstruct the original HTlc structure.
Recently, the reconstruction of calcined and decar- bonated HTlcs in the presence of large anion solutions has been established as a method for synthesizing HTlcs intercalated with large anions, as shown by Chibwe and Jones (1989a, 1989b) and Narita et a l (1991). Nev- ertheless, no detailed study on decarbonation behavior of HTlcs has been reported, though some studies have touch on it briefly in Mg-AI-CO3 system. Ross and Kodama (1967) mentioned that nearly all the CO2 was evolved by 600*(2 when the precipitate's composition was near those of manasseite and hydrotalcite (x = 0.25). Miyata (1980) reported about a chemical anal- ysis of outgassed HTlc with x = 0.33. No carbonate was released at 400"C, and 77% of the carbonate was lost at 500"C. In other studies, the weight loss near 400"C is simply attributed to both dehydroxylation and
Copyright �9 1995, The Clay Minerals Society
decarbonation (Bish and Brindley 1977; Sato et al
1986a, 1986b). In the present work, we measured the amounts of
CO2 evolved from Mg-A1-CO3 HTlcs at various tem- peratures up to 1200"C.
EXPERIMENTAL
The HTlc was prepared by coprecipitation. An aque- ous solution of MgC12 and AIC13 (Mg 2+ + A13+ -- 0.5 mol/liter, x -- 0.33) was continuously added to an aque- ous solution of Na2CO3 (CO32-/A13+ = 1) at a flow rate of 50 ml/min. The mixture was maintained at 70~ pH was adjusted to 10 by drop-wise addition of an NaOH solution, and the solution was vigorously stirred. The precipitate was washed ultrasonically with distilled water and then centrifuged. This operation was repeated until Cl- was no longer detectable with AgNOa. The washed precipitate was dried at 80~ and stored in a desiccator (Sample 1).
Well-crystallized HTlc (Sample 2) was prepared by hydrothermal treatment at 150~ and 500 kPa for 12 hours, with the previously mentioned solution of MgCl2, A1CIa and Na2CO3. Other HTlcs with x = 0.20 and 0.25 were prepared in the same way as Sample 1.
The chemical compositions were determined by in- ductively coupled plasma emission spectrochemical analysis (ICP). Surface areas were measured by the BET method with nitrogen. The morphology of samples was observed with a transmission electron microscope (TEM). Simultaneous thermogravimetry differential thermal analysis (TG-DTA) of the samples was carded out under nitrogen gas at a heating rate of 3~ X-ray powder diffraction (XRD) patterns were ob- served with CuKa radiation. Lattice constants were
427

428 Hibino, Yamashita, Kosuge, and Tsunashima Clays and Clay Minerals
Table 1. Structural formulae, doo3 spacings and surface areas for Samples 1 and 2.
Sur f ace a r e a d0o~ s p a c i n g S a m p l e no . S t r u c t u r a l f o r m u l a (rnZ/g) ( n m )
Sample 1 [Mgo.67Alo.3~(OH)2 ] 53 0.765 [(CO3)o.~s .0.64 H20]
Sample 2 [Mgo.6sAlo.32(OH)2] <3 0.764 [(CO3)o,?-0.55 H2OI
determined using silicon as an internal standard. CO2 evolution from the T G experiment (heating rate 30C/ rain) was measured by gas chromatography (GC) with nitrogen carrier gas. Infrared (IR) absorption spectra were obtained in the range of 4600 to 400 wavenum- bers (cm -~) using the KBr pellet technique.
RESULTS
Crystallochemical characteristics of the samples
Table 1 shows the structural formulae, basal spacings (doo3) and specific surface areas of the samples. The ratio of x [AI/(Mg + A1)] for the samples was close to that of the starting aqueous solutions. In each sample, the carbonate content was slightly greater than the amount necessary to compensate for the net positive charge o f the brucite-like layer.
The X R D patterns of samples were completely in- dexed as hydrotalcite. Sample 1 consists of thin, plate- like crystals of 25 to 50 nm in size (Figure la). The hydrothermally treated Sample 2, on the other hand, consists of well crystallized, hexagonal and plate-like crystals of 100 to 300 nm (Figure lb).
Analysis of thermal behavior
The phases at various temperatures were determined by XRD analysis (Figure 2). The structure o f HTlcs was retained up to 350"C, with decreasing basal spacing ((:loo3). The layer structure collapsed to an amorphous phase at 350"C. MgO began to form above 400"C. The value of the MgO lattice constant a decreased with a rise in calcination temperature up to 500"C (Figure 3). In the temperature range o f 500* to 800"C, the lattice constants a for both samples increased gradually, and
Figure i. Transmission electron micrographs. (a): Sample l, (b): Sample 2,
I I , l , I
| I I I I I I I I I I
T
I I I I I I I I I a l I
25 50
V 0
unheated
350'C
900'C
IO00'C
70
2 01 deg, Figure 2. X-ray diffraction patterns of HTlc (Sample 1) heat- ed at various temperatures: (1) HTlc, ('~z) internal standard; Si, (0) Mg-A1 oxide solid solution, (V) spinel.

Vol. 43, No. 4, 1995 Decarbonation Behavior of Hydrotalcite 429
0.422 ~ 1 . . . . . . . . . . . . . . . . . . . . . . . . . . . . . . . . . . . . p l l r~ M~
euo 0,421 (o~13)
0.420 .-0- Sample 1
"~ 0.419 ~ ~ ..e~..Sample 2 ~....~'" ]
0.418 ~
0.417
0.416 ~ -e, ~. t
0.415 , , , , ~ , , 300 400 500 600 700 800 900 1000 1100
Temperature I ~ Figure 3. The relation between lattice constant a of MgO and calcination temperatures.
they increased rapidly above 800~ These results re- veal that AI ions, which have a smaller ionic radius than Mg ions, enter into MgO between 500 ~ and 800~ and are then released to spinel (MgA1204) above 800~ as Miyata (1980) reported. Finally, spinel was detected above 9000C.
TG and DTA curves are shown in Figure 4. The first endothermic peak, due to the dehydration of interlayer water, was observed at 210~ for Sample 1 and at 220~ for Sample 2, accompanied by a shoulder around 175~ The second peak appeared at 320~ for Sample 1, and at 305~ for Sample 2; the third at 375~ for Sample 1 and at 400~ for Sample 2. The second peak is attributed to the dehydroxylation of OH bound with A1 (Miyata 1980, Sato et al 1986), and the third to the dehydroxylation of OH bound with Mg and the main CO2 evolution which is mentioned later. Three weight loss steps were observed in the TG curves for both samples. Each step corresponded to the reaction men- tioned above.
O ...... " " ' " ' ' ' ' i ~ " . , Sample 1 r
I 1 O .\'--~G - ...... s~r~o 2 ,I =
o
.~ 30 ~"- " :" ~"
0 100 200 300 4'00 500 600
Temperature I Figure 4. TG and DTA curves for Samples 1 and 2 under nitrogen.
m
1,0 " 7
o~ _ 0,8 i
~= 0.6
0,4
0,2
0,0 100
80
60
40
Figure 5.
(a)
(b)
--Sample 1(x=0,33)
....... sa 2(x=o, )
HTlc ~ x-.0,25
4 S
,~ t 0 0
~f t ~ le IP
#0
!
200 400 600 800 1000 1200
Tempera ture I Amounts of CO2 evolved from HTIc at various
temperatures (a), and integrated amounts of CO2 evolved up to various temperatures (b). The CO2 evolution from the TG experiment (heating rate 3~ was measured by gas chro- matography with nitrogen carrier gas. Five maxima observed on the CO2 evolution curves for Sample I and 2 are numbered.
Decarbonation behavior upon heating
Five maxima were observed on the CO2 evolution curve for Samples 1 and 2 (Figure 5a). The first and second maxima on each CO2 evolution curve appeared at about 180~ and 280~ respectively. The third max- imum o f C O 2 evolution appeared at 380~ for Sample 1, and at 400~ for Sample 2. These temperatures cor- respond to the third endothermic peak temperatures on the DTA curves. At 500~ after the CO2 evolution of the third maximum, 30% of the carbonates still re- mained in the calcined material of both samples (Fig- ure 5b). The fourth maxima of both samples were ob- served at 600~ The fourth maximum of Sample 2 appeared as a shoulder. At this temperature, Al ions enter into MgO. The fifth maxima were observed for both samples at 900~ at which temperature the oxide solid solution decomposed to MgO and MgAl204).
The third maximum occurred at a higher tempera- ture for Sample 2 than for Sample 1, and the third maximum overlapped the fourth one in the case of Sample 2. However, the decarbonation behaviors for Samples 1 and 2 are nearly the same, although there is the difference of crystallite size between them.

430 Hibino, Yamashita, Kosuge, and Tsunashima Clays and Clay Minerals
0.5 1200
o~. 0.4 Sarnl~ 1
" 0.3 []
"~ 0.2
~ 0.1 200
0 0 0 100 200 300 400 500
Time / min. Figure 6. CO2 evolution curves for HTlcs in the isothermal experiment at 500"C, on the way up to 1200~ at a heating rate of 3~
1000
0oo g,)
0oo ._ ,
~tS
400 ' -
E [.i ~ m
- m
r
m =
In order to observe the differences depending on A1 contents, the decarbonation behavior of the HTlc with x = 0.25 was measured, and shown in Figure 5 together with the results from Samples 1 and 2. It can been seen that it was similar to that o f Sample 1 up to 350~ At the third maximum, the HTlc with x = 0.25 evolved nearly all the CO2. Above 500~ no max imum of CO2 evolution was observed, although the CO2 evolution curves o f Samples 1 and 2 had two additional maxima at 600 and 900~
The amounts o f CO2 released from Samples 1 and 2 at 500~ decreased during a pause in heating at that temperature (Figure 6). After heating at 500~ for 2 hours, however, 20% of the carbonates still remained in the calcined material of both samples. This value agrees with that of Miyata (1980). When samples were heated again above 500~ the fourth and fifth maxima on the CO2 evolution curves were found. This result reveals that the remaining carbonate anions are trapped firmly inside the calcined material.
Infrared examination
The results of Samples 1 and 2 were nearly the same (Figure 7). The absorption bands for carbonate anions in the unheated HTIc are observed at 1360 (v3), 850 (v2) and 690 cm-~ (v4). Another v3 band also exhibits a shoulder near 1400 cm - l . A very weak v~ band is observed at about 1080 cm -~, although this vibration is inactive in the free anion. The asymmetry that is introduced into the simple trigonal structure of CO32- by either mono- or bidentate ligand formation causes the v~ vibration to become infrared active, and the double degenerate v3 vibration to split into two com- ponents. Although the splitting of the v3 band and the appearance of the v~ band are observed, the effect is small. Therefore, we conclude that the symmetry of carbonate anions in the interlayer is close to that of the free anions [1415 (Pa), 880 (v2) and 680 cm -~ (v4)], and that the shift of the v3 vibration from 1415 to 1370
4600 4000 3000 2000 1500 1000 600
Wavenumber I cm[ Figure 7. Infrared absorption spectra for Sample 1 heated at various temperatures in air for 0.5 h. The v3 bands of carbonate are marked.
cm-~ is due to a decrease in the force constant, as a result of hydrogen bonding between the carbonate an- ion and interlayer water.
Three other absorption bands are observed in the unheated HTIc spectra; the absorption band between 3200 and 3700 cm -~ is attributed to stretching vibra- tions of the OH groups of the brucite-like layer, the shoulder at around 3000 cm -1 to hydrogen bonding between water molecules and carbonates in the inter- layer (Miyata 1975, Bish and Brindley 1977), and the band at 1625 cm -~ to the bending vibration of inter- layer water.
When HTlc was heated to 250~ the Va band of carbonates split into two bands at 1330 and 1540 c m - t. These two bands are in excellent agreement with those found for bridged bidentate CO3 complexes. The car- bonates exist as bridged bidentate ligands, between 200 and 400~ at which interlayer water is lost. Above 500~ the temperature at which the third step of CO2 evolution is complete, the two v3 bands shifted to 1415 and 1480 cm -t . The small degree of splitting of the v3 bands (65 cm- t ) indicates that the remaining carbon- ates coordinate weakly with cations.
The changes in HTlcs with lower A1 contents (x = 0.20 and 0.25) were similar to those of Samples 1 and 2. However, the absorption band of the carbonate an-
Vol. 43, No. 4, 1995 Decarbonation Behavior of Hydrotalcite 431
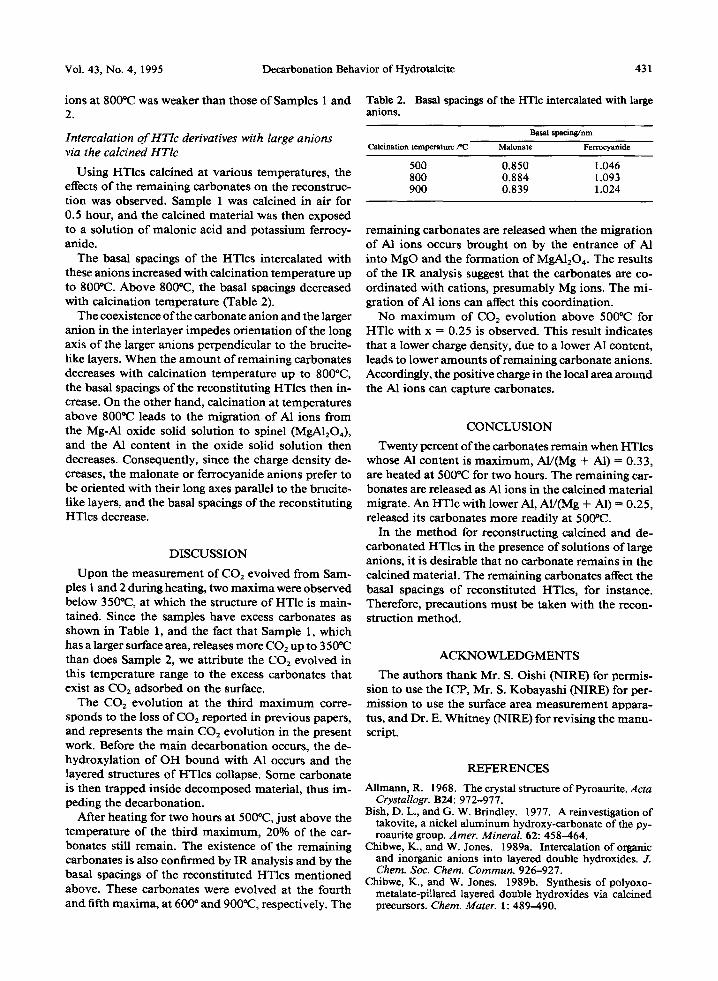
ions at 800"C was weaker than those of Samples 1 and 2.
Intercalation o f HTlc derivatives with large anions via the calcined HTlc
Using HTlcs calcined at various temperatures, the effects of the remaining carbonates on the reconstruc- tion was observed. Sample 1 was calcined in air for 0.5 hour, and the calcined material was then exposed to a solution of maionic acid and potassium ferrocy- anide.
The basal spacings of the HTlcs intercalated with these anions increased with calcination temperature up to 800"C. Above 800"C, the basal spacings decreased with calcination temperature (Table 2).
The coexistence of the carbonate anion and the larger anion in the interlayer impedes orientation of the long axis of the larger anions perpendicular to the brucite- like layers. When the amount of remaining carbonates decreases with calcination temperature up to 800"C, the basal spacings of the reconstituting HTlcs then in- crease. On the other hand, calcination at temperatures above 800~ leads to the migration of A1 ions from the Mg-A1 oxide solid solution to spinel (MgA1204) , and the A1 content in the oxide solid solution then decreases. Consequently, since the charge density de- creases, the malonate or ferrocyanide anions prefer to be oriented with their long axes parallel to the brucite- like layers, and the basal spacings of the reconstituting HTlcs decrease.
DISCUSSION
Upon the measurement of CO2 evolved from Sam- ples I and 2 during heating, two maxima were observed below 350*(2, at which the structure of HTlc is main- rained. Since the samples have excess carbonates as shown in Table 1, and the fact that Sample 1, which has a larger surface area, releases more CO2 up to 3500(2 than does Sample 2, we attribute the CO2 evolved in this temperature range to the excess carbonates that exist as CO2 adsorbed on the surface.
The CO2 evolution at the third maximum corre- sponds to the loss of CO2 reported in previous papers, and represents the main CO2 evolution in the present work. Before the main decarbonation occurs, the de- hydroxylation of OH bound with A1 occurs and the layered structures of HTlcs collapse. Some carbonate is then trapped inside decomposed material, thus im- peding the decarbonation.
After heating for two hours at 500~ just above the temperature of the third maximum, 20% of the car- bonates still remain. The existence of the remaining carbonates is also confirmed by IR analysis and by the basal spacings of the reconstituted HTlcs mentioned above. These carbonates were evolved at the fourth and fifth maxima, at 600* and 900"C, respectively. The
Table 2. Basal spacings of the HTlc intercalated with large anions.
Basal spacm~nm
Caldnafion tem~mture/*C M~on~e Ferrocyani~
500 0.850 1.046 800 0.884 1.093 900 0.839 1.024
remaining carbonates are released when the migration of AI ions occurs brought on by the entrance of AI into MgO and the formation of MgA1204. The results of the IR analysis suggest that the carbonates are co- ordinated with cations, presumably Mg ions. The mi- gration of A1 ions can affect this coordination.
No maximum of CO2 evolution above 500~ for HTlc with x -- 0.25 is observed. This result indicates that a lower charge density, due to a lower AI content, leads to lower amounts of remaining carbonate anions. Accordingly, the positive charge in the local area around the AI ions can capture carbonates.
CONCLUSION
Twenty percent of the carbonates remain when HTlcs whose A1 content is maximum, A1/(Mg + A1) = 0.33, are heated at 500~ for two hours. The remaining car- bonates are released as A1 ions in the calcined material migrate. An HTlc with lower A1, Al/(Mg + AI) = 0.25, released its carbonates more readily at 500~
In the method for reconstructing calcined and de- carbonated HTlcs in the presence of solutions of large anions, it is desirable that no carbonate remains in the calcined material. The remaining carbonates affect the basal spacings of reconstituted HTlcs, for instance. Therefore, precautions must be taken with the recon- struction method.
ACKNOWLEDGMENTS
The authors thank Mr. S. Oishi (NIRE) for permis- sion to use the ICP, Mr. S. Kobayashi (NIRE) for per- mission to use the surface area measurement appara- tus, and Dr. E. Whitney (NIRE) for revising the manu- script.
REFERENCES
Allmann, R. 1968. The crystal structure ofPyroaurite. Acta Crystallogr. B24: 972-977.
Bish, D. L., and G. W. Brindley. 1977. A reinvestigation of takovite, a nickel aluminum hydroxy-carbonate of the py- roaurite group. Amer. Mineral. 62: 458-464.
Chibwe, K., and W. Jones. 1989a. Intercalation of organic and inorganic anions into layered double hydroxides. J. Chem. Soc. Chem. Commun. 926-927.
Chibwe, K., and W. Jones. 1989b. Synthesis of polyoxo- metalate-pillared layered double hydroxides via calcined precursors. Chem. Mater. 1: 489-490.

432 Hibino, Yamashita, Kosuge, and Tsunashima Clays and Clay Minerals
Ingrain, L., and H. F. W. Taylor. 1967. The crystal structures of s6grenite and pyroaurite. Mineral. Mag. 36: 465-479.
Miyata, S. 1975. The syntheses of hydrotalcite-like com- pounds and their structures and physico-chemical proper- ties--I, The systems Mg2+-A1J+-NO3 -, Mg2+-A13+-C] - , Mg2+-A13+-CIO4 -, Ni2+-AI3+-C1- and Zn2+-AI3+-CI -. Clays & Clay Miner. 23: 369-375.
Miyata, S. 1980, Physico-chemical properties of synthetic hydrotaleites in relation to composition. Clays & ClayMin- er. 28: 50-56.
Narita, E., P. Kaviratna, and J. Pinnavaia. 1991. Synthesis of heteropolyoxometalate pillared layered double hydrox- ides via calcined zinc-aluminium oxide precursors. Chem. Lett. 805-808.
Ross, G. J., and H. Kodama. 1967. Properties of a synthetic magnesium-aluminum carbonate hydroxide and its rela- tionship to magnesium-aluminum double hydroxide, man- asseite and hydrotalcitc. Amer. Mineral. 52: 1036-1047.
Sato, T., K. Kato, T. Endo, andM. Shimada. 1986a. Prep- aration and chemical properties of magnesium aluminum oxide solid solutions. React. Solids 2: 253-260.
Sato, T., T. Wakabayashi, and M. Shimada. 1986b. Ad- sorption of various anions by magnesium aluminum oxide (MgonAlo.3Ol.~5). Ind. Eng. Chem. Prod. Res. Dev. 25: 89- 92.
(Received 12 April 1994; accepted 23 November 1994; Ms. 2492)