Cross-functional product information process in a …828311/FULLTEXT01.pdf · Cross-functional...
49
Cross-functional product information process in a de-centralized organization Mikael Marklund [email protected] Master’s Thesis in Business Administration, MBA programme September 2010 Blekinge Institute of Technology School of Management Supervisor: Assistant Professor Philippe Rouchy
Transcript of Cross-functional product information process in a …828311/FULLTEXT01.pdf · Cross-functional...
Cross-functional product information process
in a de-centralized organization
Mikael Marklund
Master’s Thesis in Business Administration, MBA programme
September 2010
Blekinge Institute of Technology School of Management Supervisor: Assistant Professor Philippe Rouchy

2

Abstract Changes in big companies resulting in new organizational structures and cost cutting are pushing more and more of the knowledge and information handling to sub-units in a multi-national structure. For big knowledge-intensive companies that act in the global market place, internal information handling is becoming a challenge. The study and reflections are based on experiences from Ericsson, a knowledge-intensive global telecommunication company. This company delivers complex cross-functional products (solutions) and has a decentralized organization. It faces the cost of managing distributed product information and the challenge to gather relevant information in the sales departments. One can easily characterize the company’s complex and unique product offerings as having multiple dependencies. The solutions are composed by building blocks, i.e. different sub products, delivered by different product units. The different sub products suffer from limitations in how they can be combined into solutions. This study addresses the information gaps in a decentralized organization regarding this specific issue. It focuses on identifying vital information without driving cost and requiring organizational changes.
Stakeholder identification was done from a value chain perspective. The type of information that would give the most profitable solutions was identified during group sessions and individual interviews. An asymmetric compatibility matrix (ACM) was developed to fit the purpose of keeping low maintenance cost and without requiring organizational changes. The ACM was applied and process maturity improvements were evaluated with the use of the Process Enterprise and Maturity Model.
The Ericsson specific study shows that the use of an ACM for product compatibility information makes it possible to define information responsibility that is sustainable over time. Thereby the maintenance cost for this information can be brought down to a minimum. Furthermore, the study shows that the effort of gathering information for the sales organizations to provide customer solutions can be reduced by the use of an ACM offering generic compatibility information. Users of the ACM would be able to re-use its information and focus on customer specific sales and deployment issues rather than re-do what others already have done. Cost of sales as well as business risks would thereby likely decrease, affecting the bottom line positively. Furthermore new business opportunities are assumed to be addressed better since relevant generic information is made available up front. Other positive expected benefits are prevention of network malfunctions and increased customer satisfaction.
From this study it can be concluded that an ACM can be a powerful tool for gathering cross-functional product information in large decentralized organizations at a low cost, without any organizational changes, and with a high process maturity. Further research would be needed if one would consider validating the general applicability of the ACM in other processes.
3

Acknowledgements I would like to express my gratitude for their help and support of the completion of this study to:
Supervisor Philippe Rouchy, assistant professor, for the attention and guidance during the completion of the thesis, and course leader Eva Wittbom, assistant professor, for the overall Master’s Thesis MBA Parttime course.
Fellow students at BTH following the Master of Business Administration, part time program from all over the world who have been active in many interesting discussions on the forum during the ongoing program.
Ericsson, who made this research possible by letting me work on an identified information gap constituting the relevant study for this thesis.
My sister Dr. Birgitta Marklund, for proof reading and for giving me valuable insights in academic methodology during the study.
Finally, but not to the least, my wife Ann for proof reading and for encouragement and support throughout my two years of studies.
Mikael Marklund
Bromma, 2010-09-06
4

Table of contents Abstract.................................................................................................................................3
Acknowledgements ...............................................................................................................4 Table of contents ...................................................................................................................5
List of Figures .......................................................................................................................7 List of Tables ........................................................................................................................8
Acronyms and abbreviations ...............................................................................................9 1 Introduction ..................................................................................................................... 10
1.1 Background ........................................................................................................... 10 1.2 Purpose and problem definition ............................................................................. 10 1.3 Thesis structure...................................................................................................... 11
2 Literature review ............................................................................................................. 12 2.1 Value Chain ........................................................................................................... 12 2.2 Operational change approaches .............................................................................. 13 2.3 Knowledge Management tools ............................................................................... 15 2.4 Process Maturity Models ....................................................................................... 16
2.4.1 Process and Enterprise Maturity Model ................................................... 16 2.4.2 Capability Maturity Model / Capability Maturity Model Integration ........ 17
2.5 Compatibility Matrices .......................................................................................... 18 2.5.1 Symmetric Compatibility Matrix ............................................................. 18 2.5.2 Asymmetric Compatibility Matrix........................................................... 19
3 Ericsson presentation ...................................................................................................... 20 3.1 Industry trends ....................................................................................................... 20 3.2 Product description ................................................................................................ 20 3.3 Organization .......................................................................................................... 21
4 Methodology .................................................................................................................... 23 4.1 Research design ..................................................................................................... 23 4.2 Research design requirements ................................................................................ 23 4.3 Qualitative approach .............................................................................................. 24 4.4 Data collection and analysis ................................................................................... 24 4.5 Definition of conditions to proceed ........................................................................ 25 4.6 Compatibility Matrix process development ............................................................ 25 4.7 Evaluation ............................................................................................................. 26
5 Analysis and result........................................................................................................... 27 5.1 Stakeholders .......................................................................................................... 27 5.2 Data refinement ..................................................................................................... 29
5
5.3 Definition of conditions to proceed ........................................................................ 30 5.4 Compatibility Matrix process development ............................................................ 31 5.5 Evaluation ............................................................................................................. 34
6 Conclusions and Recommendations ................................................................................ 38 6.1 Main conclusions ................................................................................................... 38 6.2 Stakeholders .......................................................................................................... 38 6.3 ACM ..................................................................................................................... 38 6.4 Maintenance .......................................................................................................... 40 6.5 Process maturity .................................................................................................... 40
7 References ........................................................................................................................ 42
APPENDICIES ................................................................................................................... 44 A. Process and Enterprise Maturity Model (Hammer 2007) ......................................... 44 B. Asymmetric Compatibility Matrix structure ............................................................ 48 C. Compatibility matrix quarterly update process, Ericsson ......................................... 49
6

List of Figures Figure 2.1. Value system (simplified)
Figure 2.2. Generic Value Chain
Figure 2.3. Alternative approaches to operational change
Figure 2.4. Symmetric Compatibility Matrix in two dimensions
Figure 2.5. Asymmetrical Compatibility Matrix illustrating three dimensions
Figure 3.1. Ericsson Telecom Network Architecture
Figure 3.2. Ericsson Organization
Figure 5.1. Information flow identifying main stakeholders
Figure 5.2. Initial process maturity level of compatibility information to market regions using PEMM analysis.
Figure 5.3. Initial enterprise maturity level of Ericsson using PEMM analysis.
Figure 5.4. Process maturity level of compatibility information to market regions after introduction of asymmetric compatibility matrix, using PEMM analysis.
Figure 5.5. Process maturity improvements as result of the study and pilot evaluation
Figure A.1. PEMM process maturity elements, levels 1-2
Figure A.2. PEMM process maturity elements, levels 3-4
Figure A.3. PEMM enterprise maturity elements, levels 1-2
Figure A.4. PEMM enterprise maturity elements, levels 3-4
Figure B.1. Asymmetric Compatibility Matrix structure, example
Figure C.1. Compatibility matrix quarterly update process, Ericsson
7

List of Tables Table 4.1. Difference in emphasis in qualitative versus quantitative methods based on
Reichard and Cook (1979) (Ghauri & Grønhaug 2005, p. 110)
8

Acronyms and abbreviations ACM Asymmetric Compatibility Matrix
ACR Account/Commercial Responsible
BPR Business Process Reengineering
BTH Blekinge Tekniska Högskola
CMM Capability Maturity Model
CMMI Capability Maturity Model Integration
CFR Contract Fulfillment Responsible
CSR Customer Solution Responsible
IPTV Internet protocol television
ISP Internet Service Provider
KM Knowledge Management
KPA Key Process Areas
KX Knowledge XchangeTM
HW Hardware
PEMM Process and Enterprise Maturity Model
SCM Symmetric Compatibility Matrix
SW Software
TQM Total Quality Management
9

1 Introduction
1.1 Background
To become or stay competitive, companies constantly need to adapt current operations and cost structures. Their goals, strategies, processes, organizations, etc. cannot be static if they want to reach success and stay successful. Management history is full of organizational examples - Sears, GM, IBM, to mention a few (Hammer 1996) - where the need for change was not addressed properly by the management, resulting in sometimes disastrous consequences for the companies. Today as yesterday, tackling changes in multinational corporations resulting in new organizational structures and cost cutting schemes is still the order of the day. Those changes are more magnified today (for external reasons such as globalization) and impose more and more pressure on the knowledge and information handled to sub-units in the multinational structure. For large knowledge-intensive companies that act in the global market place such as Ericsson, internal information handling is becoming a challenge. Companies delivering complex cross-functional products, and having a decentralized organization, continually face costly challenges of gathering distributed product information. Hence, continuous adjustments are vital.
Complex and unique product offerings, i.e. customer solutions, are composed of different sub products. These sub products are delivered by different product units and may suffer from limitations in how they can be combined into solutions. This information could be vital and cost driving to gather if not done in an efficient way.
1.2 Purpose and problem definition
The purpose of this study was to explore if company internal cross-functional product information was vital and a concern for Ericsson, as an example of a large de-centralized organization. The purpose was further to develop a compatibility matrix in order to evaluate if it addressed cross-functional product information gaps. Additionally, the purpose was to frame the compatibility matrix within a process and evaluate the process maturity. Boundary conditions for the process was that it should not drive overhead costs neither in central administration nor in tool investments, and it should not require any organizational changes.
The problem was to understand if a compatibility matrix is a powerful tool to present internal cross-functional product information, and if the information maintenance can be secured by a process without increased overhead costs or requirements on organizational changes.
Specific questions addressed were:
• Who are the main stakeholders?
• What are the pros and cons of applying the asymmetrical approach rather than the symmetrical?
10
• How should the information be maintained?
• Is it possible to reach a high process maturity with no or limited overhead cost?
1.3 Thesis structure
Following the purpose and problem definition in chapter 1, a theoretical background is given in chapter 2. It gives an introduction to a few generally established approaches to business management and operations e.g. value chain, operational changes, knowledge management tools, process maturity, and compatibility matrices.
Chapter 3 gives a short introduction to Ericsson including industry trends in telecommunication, product complexity of customer specific solutions, and organizational structure.
The methodology used is described in chapter 4. Research design, justification of the qualitative approach taken, and data collection details are included, as well as an introduction to the sequence of events of the process for developing and evaluating the ACM during the study.
Chapter 5 describes in detail the analysis and results in which the development of the ACM and the content ownership definition are central. Furthermore, the process maturity evaluation method and results are included as well.
Finally, chapter 6 includes the main conclusions drawn in the thesis. The four questions asked in relation to the problem definition in chapter 1 are answered and complemented with recommendations for steps to follow.
11

2 Literature review Problems in business environment, especially regarding cost evaluation and organizational issues, can be addressed in different ways. In this section, a few generally established approaches (value chain, operational change, knowledge management tools, process maturity, and compatibility matrix) are discussed and their relevance to this study are outlined.
2.1 Value Chain
One way to consider a firms customer channel in a given market is to map its process to a value chain. A value chain analysis allows us to distinguish between numbers of separate activities identifying distinct values in the chain.
Due to the complexity of product dependencies, firms have constantly to monitor and maintain sustainable competitive advantage in order to continue to attract current and new customers in relation to the running of the organization (not as a separate entity as in the “old school” of management which consider the departmental division of work the pinnacle of rational work process). For that sake, the entire value system needs to be addressed. A simplified value system does not only include the firms’ value chain but also upstream and downstream stakeholders outside the firm that intervene directly in its overall value system (Porter 1985). See figure 2.1.
Figure 2.1. Value system (simplified) (Porter 1985).
The upstream value chain is composed of suppliers and others impacting the company’s performance, e.g. hardware (HW) component suppliers, consultancy firms, competence providing institutions, etc. The downstream value chain is composed of production or business partners, e.g. distributors, subcontractors, retailers, etc. Upstream and downstream partnerships define activities that are within as well as outside the company. Both type of activities (and the mastery of their value for the whole firm) finally determines the attractiveness of the company’s overall products and services to the buyers (Porter 1985).
Porter’s definition of the value chain is composed of nine parts according to figure 2.2. This model is generically applicable and can be used by any company regardless of industry,
Upstream (suppliers, stakeholders, etc.)
Value Chain
Firms
Value Chain
Downstream (distributors, subconstractors, etc.)
Value Chain
12

product, or activity. The definition of Firm is flexible, and can be a legal company or a major part of it (e.g. a business unit).
Figure 2.2. Generic Value Chain (Porter 1985).
The problem addressed in this study was the integration of outbound logistics aspects in serving the marketing and sales as well as the service processes. The issues dealt with in this study did not focus essentially on product quality, but rather on management of technology deliverables e.g. product information. In this sense, sustainable competitive advantage did not lie in a company’s product or services characteristics and their direct added value, but rather in how a company was capable to exploit intangible assets such as differentiators, i.e. the strengths and advantages in comparison with competition, in the value chain activities.
The value chain also served as framework for the stakeholder analysis, which was the foundation for the data collection. See chapter 4.4.
2.2 Operational change approaches
Operational change approaches can be structured in a scale of ‘Pace of Change’ from fast to measured, and a scale of ‘Degree of Change’, from tactical to strategic as in figure 2.3 (Davenport 1993).
13

Figure 2.3. Alternative approaches to operational change (Davenport 1993)
In the upper left corner we find fast and tactical approaches like focused process improvements, e.g. removal of non-value added activities from narrowly defined processes. In the bottom left corner, we find fast and strategic changes that are achieved by focused restructuring, e.g. by outsourcing, acquisitions, etc (Davenport 1993).
Operational changes that can be measured over a longer period are illustrated to the right in figure 2.3. Those can be done by focusing on continuous improvement or those can be of innovative focused character, i.e. tactical or strategic. Both are long term approaches and require operational and behavioral changes (Davenport 1993).
One of the most innovative and profound ways of changing business operations is Business Process Reengineering (BPR) in which unit goals are transformed into process goals (bottom right in figure 2.3). Hammer defines BPR as "... the fundamental rethinking and radical redesign of business processes to achieve dramatic improvements in critical contemporary measures of performance, such as cost, quality, service, and speed." (Hammer & Champy 1993, p. 32). BPR is based on four areas that can be subject for change – strategy, organization, technology, and people – to reach the wanted improvements.
At the tactical end of the scale, we find the improvement method of Total Quality Management (TQM) (Oakland 1989, Feigenbaum 1991) focusing on small but continuous improvements, moderate in scale and less ambitious in the short time frame. Yet another improvement technique, Six Sigma, is also found in the upper right area. It is largely influenced by TQM and focusing on improvement of all the operations within a single business process. (Schroeder, Linderman, Liedtke & Choo 2008, Jakowski 2007).
Addressing the problem of cross-functional product information management in a large decentralized organization could be considered as a strategic operational change. An innovative approach like BPR would however require heavy investments over long time
Focused ProcessImprovement
(Quality, Time, Cost)
ContinuousImprovement
FocusedRestructure
Business ProcessInnovation
Fast Measured
Tactical
Strategic
Pace of ChangeD
egre
e of
Cha
nge
Focused ProcessImprovement
(Quality, Time, Cost)
ContinuousImprovement
FocusedRestructure
Business ProcessInnovation
Fast Measured
Tactical
Strategic
Pace of ChangeD
egre
e of
Cha
nge
14

periods, whereas an tactical improvement approach like TQM with the ambition of continued improvements in small steps would require a considerably smaller investment (Davenport 1993).
2.3 Knowledge Management tools
Enterprise knowledge is a vital asset in knowledge intensive companies, and knowledge management (KM) (Nonaka 1991) is becoming more and more important. In parallel with increasing amount of data, the cost for managing it increases. Changes to knowledge based tools or infrastructure represents major investments for companies. Gathering information from different sources within a big enterprise having different formats and structures, tend to result in large information databases in combination with relational database information. We find a lot of those tools implemented in service based companies such as consulting and technology services. Different companies have implemented different KM tools according to the shape of their clients’ portfolio and the type of technology they are dealing with. In addition to tools and technology, the governance of KM is vital for successful implementation. Without sufficient management attention no major enterprise-wide tool will be successful.
One example of a large source of information is the millions of documents stored in thousands of data bases by Accenture. The system is called Knowledge XchangeTM (KX) (Brody, Dempski, Kaplan, Kurth, Liongosari & Swaminathan 1999) and is accessed by more than 50 thousand people all over the world. The enterprise knowledge system is massive, and the effort to extract relevant information from it can be tedious for a user. The information in the data bases are not linked, and the structures of them differ. A sales person, for example, might have to spend considerable amount of effort to extract and combine the information entities for a certain purpose. To address this problem an overlay system, Pocket Exchange (Brody et al. 1999) is implemented to create relationships between entities, and simple rules between them. Information entities stored in different ways (e.g. spelling differences, naming conventions, etc.) can be combined automatically. This is an example of how enterprises tackle the issue of knowledge base system available to their employees in different capacities for the sake of availability of information for better efficiency. This has resulted in a system that is easily accessible and can be used to answer complex questions quickly and easily.
For the sake of this thesis, a commercially available KM system could be tailored to address the problem of dependencies of information of building blocks constituting Ericsson’s solutions. For example, the company could develop internally a system similar to the one seen in the Accenture example discussed above. There are also commercially available products, e.g. InQuira Information Manager (http://www.inquira.com) and Brain Enterprise Knowledge Platform (http://www.thebrain.com), that could fit the purpose. However, in any of these cases, cost and organizational impact could become issues depending on how crucial this process is.
15

2.4 Process Maturity Models
2.4.1 Process and Enterprise Maturity Model
In order to assess process maturity and enterprise process management capabilities, Hammer (2007) has developed a more hands-on perspective that fits the perspective of this thesis, namely an audit perspective in the Process and Enterprise Maturity Model (PEMM) (Appendix A). The model is applicable for any process in any business.
PEMM is a model building on the tradition of process changes and transformation in organizations. The model is a framework to comprehend, plan, and audit processes. The model defines process maturity with five process enablers and four enterprise capabilities that are needed for business processes to reach good and sustainable performance. The five process enablers are (Hammer 2007):
1. Design – purpose, context, documentation, etc.
2. Performers – skills, knowledge, users’ behavior, etc.
3. Owner – identity, authority, etc.
4. Infrastructure – information system, management system, etc.
5. Metrics – definition, usage, performance, etc.
The model states that all enablers must be well developed for the process to be successful. Furthermore, for successful implementation of the process enablers, companies need to possess the enterprise capabilities to support the required environment. The four company capabilities are (Hammer 2007):
1. Leadership – awareness, behavior, style, etc.
2. Culture – customer focus, responsibilities, team work, attitudes, etc.
3. Expertise – people, methods, etc.
4. Governance – process model, accountability, integration, etc.
The process maturity audit model within PEMM brakes down the enablers into 13 elements, and further the capabilities to yet another 13 elements. These elements can be assessed from defined separate practices identified for four maturity levels. The assessment is based on a number of statements for each element. If the statement is largely true (at least 80% correct), the state is marked green, if it is somewhat true (between 20% and 80% correct, the state is marked yellow, and if it is largely untrue (less than 20% correct) the state is marked red. This audit process assessment reveals what areas can be improved, and what enabler and capability practices need to be addressed (Hammer 2007, Appendix A).
16

PEMM could be a suitable method to assess the maturity of a process aiming for compiling cross-functional product information in a decentralized organization. Its strengths lie primarily in its general applicability and that it is a well established method.
2.4.2 Capability Maturity Model / Capability Maturity Model Integration
A process maturity model that has been widely used during the nineties and early 21 century, is Capability Maturity Model (CMM) (Humphrey 1989). It is a model designed to evaluate and certify software (SW) development process quality, and was maintained by Carnegie Mellon University in USA (http://www.sei.cmu.edu) until 2005. It is from an analytic perspective close to PEMM but applies a more engineering like process.
Five levels are defined in CMM, stating the maturity of a process (Humphrey 1989):
1. Initial (chaotic, ad hoc, individual heroics) - the starting point for use of a new process.
2. Managed - the process is managed according to the metrics described in the Defined stage.
3. Defined - the process is defined/confirmed as a standard business process, and decomposed to levels 0, 1 and 2 (the latter being Work Instructions).
4. Quantitatively managed
5. Optimized - process management includes deliberate process optimization/improvement.
Within these levels, five Key Process Areas (KPA’s) are defined addressing characteristics for each level. The KPA’s are (Humphrey 1989):
1. Goals
2. Commitment
3. Ability
4. Measurement
5. Verification
Closely related to CMM, the Capability Maturity Model Integration (CMMI) (Chrissis, Konrad & Shrum 2006) is a model evaluating the enterprise process maturity, rather than the process maturity itself. CMMI covers three areas:
1. Product and service development (CMMI for Development model)
2. Service establishment, management, and delivery (CMMI for Services model)
17

3. Product and service acquisition (CMMI for Acquisition model)
Compared to PEMM, CMM/CMMI has some weaknesses from this study perspective. CMM, evaluating the process itself is a) not maintained, and b) tailored for SW development processes, lacking a level of generality that would fit Ericsson’s process more closely. On the other hand PEMM is generally applicable. CMMI, evaluating the enterprise process maturity could be a relevant model if a series of transformation would be accomplished on it. However, for the sake of this study, the focus was the process itself, not the enterprise.
2.5 Compatibility Matrices
2.5.1 Symmetric Compatibility Matrix
A symmetric compatibility matrix (SCM) is, when limited to a few dimensions, a straight forward way of describing relations between elements. This could be applicable for the problem at hand. If one considers two dimensions, e.g. the level of dependency between two products, one can use a symmetric compatibility matrix as illustrated in figure 2.4. The crossing point, called ”cell”, could be described as a function f(x2,x3) where x2 and x3 are two products, and f(x2,x3) = 1 or 0 describing if there is a dependency or not.
Figure 2.4. Symmetric Compatibility Matrix in two dimensions
If however the number of dimensions increases with information about dependency details e.g. product variants, verification levels, characteristics, exemptions, and more, the processing of relevant information in an SCM becomes difficult to represent.
Furthermore, each information element in the cell would be based on knowledge from different people in different organizational units. For example, a detail in an interface between two products may be verified by either product development organization, and depending on the product life cycle this could vary over time.
So with multi-dimensional relationships, not only the amount of information becomes extensive, but also the ownership of the information (who has the latest and correct information) is changing over time and is not easily identified.
To compile information, without driving organizational overhead costs, it would be vital to reduce the number of dimensions as well as clearly define who is responsible for providing and maintaining the information.
18

2.5.2 Asymmetric Compatibility Matrix
One way to address the limitations with an SCM could be to apply an asymmetrical compatibility matrix (ACM) as illustrated in figure 2.5. With a limited number of dimensions it would be possible to clearly define ownership of the information in the cells across a decentralized organization. Likely this will also avoid additional overhead costs and investments in new KM tools.
By asymmetrical means that the number of dimensions differ on the matrix’ two axes. One example could be that the content of a cell f(x23,x3) = x3,min, where x3,min = minimum x3 version compatible with x23. Not only could a dimension be added, but a clear ownership of each cell would be defined, catering for minimum effort to compile and maintain the information. Additional dimensions in the ACM as well as in the SCM can be added as metadata to respective cells. More details and an ACM example are provided (Appendix B).
Figure 2.5. Asymmetrical Compatibility Matrix illustrating three dimensions
Whether ACM could be a suitable way to address the problem with cross-functional product information in a decentralized organization at a low cost and with minimal organizational impact, will be further explored in this study.
19

3 Ericsson presentation
3.1 Industry trends
During recent years, telecommunication networks have experienced a major transformation from being composed by a handful of nodes supporting primarily circuit switched telephony services with mobile and fix access, to a situation where current networks easily can consist of more than 50 nodes or subsystems offering various kinds of circuit switched as well as IP based services (voice, data, video, multimedia, messaging, etc.) (Dahlman, Ekström, Furuskär, Karlsson, Meyer, Parkvall, Torsner & Wahlqvist 2005). The networks now also offer multiple access types, e.g. mobile, fixed, data, and multimedia devices.
Vendors, as well as operators are constantly facing mergers and acquisitions resulting in fewer and more dominant market players (Lai 2008). Furthermore new players with non-telecom background, e.g. Apple and Google, are entering the scene as when the media and communication industries are merging (Timsäter 2009; Light Reading Mobile, 2010). Collaboration between network operators e.g. Ericsson, Internet Service Providers (ISPs), publishers, and internet application developers is required to bring end users a range of new services e.g. video sharing, internet protocol television (IPTV), file sharing, chatting, presence, and more (Macphearson & Waterman 2009). “The internet calls for new roles and business opportunities, for both new and established players. The combination of the internet’s creativity and telecom’s scalability and efficiency has enormous potential.” (Ericsson white paper 2009, p. 2).
3.2 Product description
A telecom network can in general terms and on a very high conceptual level be described as a solution structured into layers: Customized Service layers, Connectivity layer including Standard Services and Multi Access Edge, Access layer, Transport layer, and Operation and Business Support layer. See figure 3.1 for an Ericsson illustration of the network structure. Each layer consists of several products realized as network elements, nodes that in some cases are grouped into subsystems or business solutions.
20
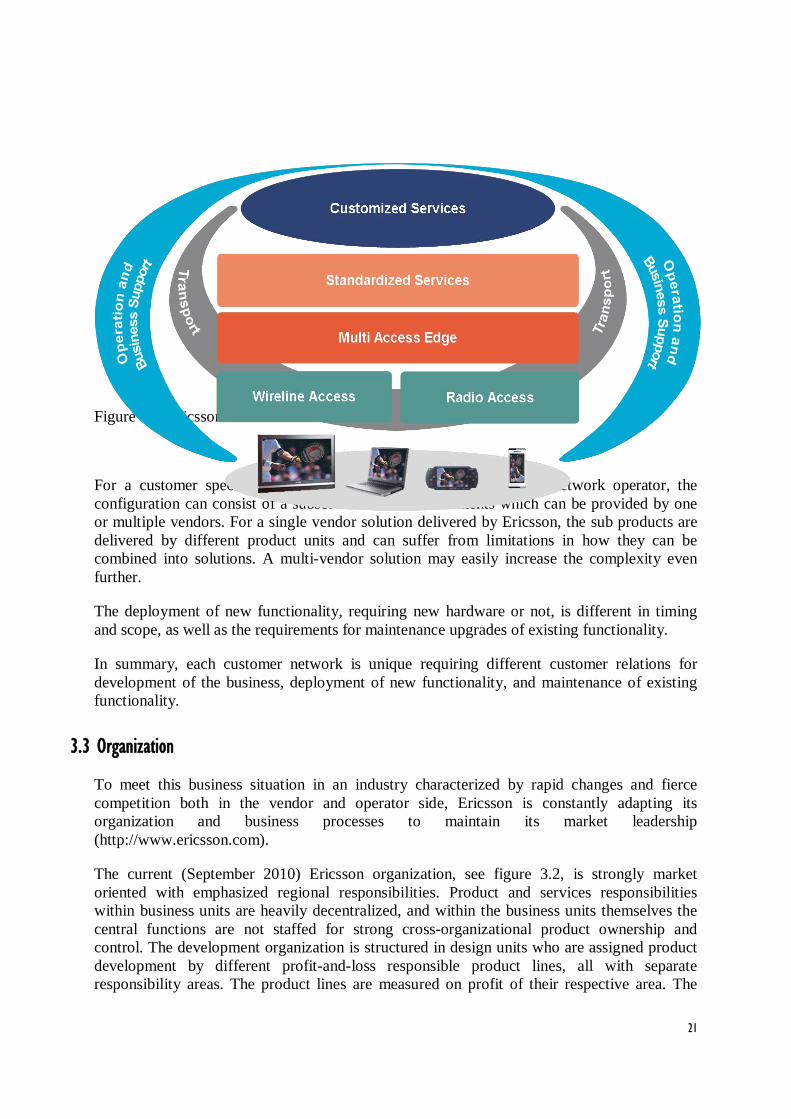
Figure 3.1. Ericsson Telecom Network Architecture
For a customer specific solution, where a customer typically is a network operator, the configuration can consist of a subset of the network elements which can be provided by one or multiple vendors. For a single vendor solution delivered by Ericsson, the sub products are delivered by different product units and can suffer from limitations in how they can be combined into solutions. A multi-vendor solution may easily increase the complexity even further.
The deployment of new functionality, requiring new hardware or not, is different in timing and scope, as well as the requirements for maintenance upgrades of existing functionality.
In summary, each customer network is unique requiring different customer relations for development of the business, deployment of new functionality, and maintenance of existing functionality.
3.3 Organization
To meet this business situation in an industry characterized by rapid changes and fierce competition both in the vendor and operator side, Ericsson is constantly adapting its organization and business processes to maintain its market leadership
(http://www.ericsson.com).
The current (September 2010) Ericsson organization, see figure 3.2, is strongly market oriented with emphasized regional responsibilities. Product and services responsibilities within business units are heavily decentralized, and within the business units themselves the central functions are not staffed for strong cross-organizational product ownership and control. The development organization is structured in design units who are assigned product development by different profit-and-loss responsible product lines, all with separate responsibility areas. The product lines are measured on profit of their respective area. The
21
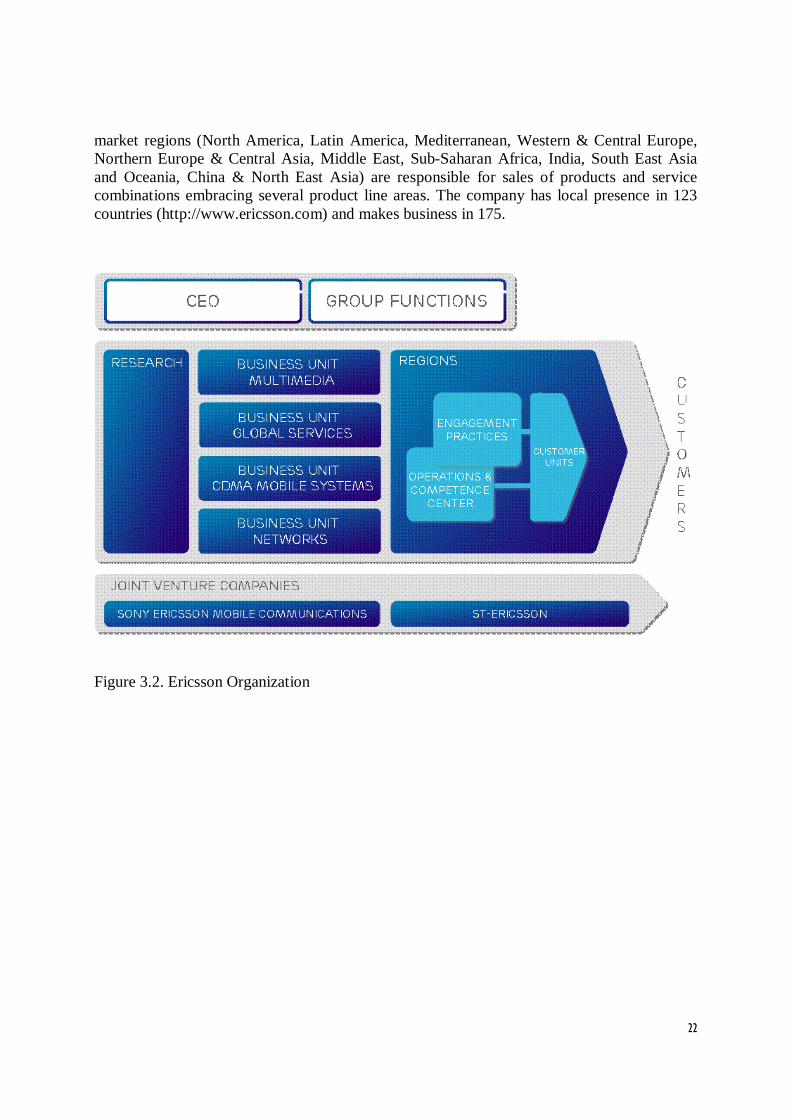
market regions (North America, Latin America, Mediterranean, Western & Central Europe, Northern Europe & Central Asia, Middle East, Sub-Saharan Africa, India, South East Asia and Oceania, China & North East Asia) are responsible for sales of products and service combinations embracing several product line areas. The company has local presence in 123 countries (http://www.ericsson.com) and makes business in 175.
Figure 3.2. Ericsson Organization
22
4 Methodology
4.1 Research design
The overall strategy was to base the research on existing knowledge in Ericsson, and to explore if the company internal cross-functional product information is vital and challenging to gather, and finally to develop a process delivering the vital information and evaluate that as a pilot application.
An exploratory approach (Gauri & Grønhaug 2005) was taken in order to get a better understanding of the problem complexity. It encompassed activities e.g. observation of current situation, gathering information from key stake holders, analysis of responses, and validation thereof.
An applied ACM was developed and tested to see if it could meet the needs of basic compatibility information without adding cost and requiring any organizational changes.
The study followed a work flow with the following main components:
• Identification of stakeholders
• Data collection and analysis
• Definition of conditions to proceed
• Case specific ACM development
• Evaluation
In practice, the phases were overlapping and iterating for continuous refinement of the result.
Within the time frame of this study only a limited evaluation of the pilot was made to quantify the benefits of the application.
4.2 Research design requirements
The telecom company Ericsson (http://www.ericsson.com) was chosen for this study. It is a company that fulfills all aspects of being large, faced by fierce competition (by e.g. Nokia-Siemens, Alcatel-Lucent, and Cisco), having a decentralized organization, delivering unique and complex product combinations (e.g. solutions for mobile core and radio networks tailored for each specific customer requirements), and being a global actor as described in previous chapter.
The boundary conditions, low cost and no requirements on organizational changes, were defined to allow a smooth deployment of a pilot application for further evaluation.
23

4.3 Qualitative approach
A qualitative approach was taken to specify the problem and to gain increased understanding of it during the study. If the problem initially would have been fully understood, structured, and suitable for measurements, a quantitative approach could have been more suitable. “Qualitative research is a mixture of the rational, explorative and intuitive, where the skills and experience of the researcher play an important role in the analysis of data” (Ghauri & Grønhaug 2005, p. 110). The difference in emphasis in qualitative versus quantitative methods based on Reichard and Cook (1979) are are presented in table 4.1 (Ghauri & Grønhaug 2005, p. 110).
Qualitative methods
• Emphasis on understanding • Focus on understanding from
respondent’s/informant’s point of view • Interpretation and rational approach • Observations and measurements in
natural settings • Subjective ‘insider view’ and closeness
to data • Explorative orientation • Process oriented • Holistic Perspective • Generalization by comparison of
properties and contexts of individual organism
Quantitative methods
• Emphasis on testing and verification • Focus on facts and/or reasons for social
events • Logical and critical approach • Controlled measurement • Objective ‘outsider view’ distant from
data • Hypothetical-deductive; focus on
hypothesis testing • Result oriented • Particularistic and analytical • Generalization by population
membership
Table 4.1. Difference in emphasis in qualitative versus quantitative methods based on Reichard and Cook (1979) (Ghauri & Grønhaug 2005, p. 110)
4.4 Data collection and analysis
The identification of stakeholders was based on a generic value chain model (Porter 1985, McDonough 2009) to find those that were currently involved in the knowledge management across the activities and faced by the challenges addressed in this study (see chapter 5.1).
Primary data were gathered from the stakeholders identified, i.e. based on theoretical reasons; the value chain. Thereafter sequential sampling technique (Ghauri & Grønhaug 2005) was applied. New stakeholders (e.g. subject matter experts) were identified during the data collection process and the data collection continued until the main issues were identified. Data collection techniques were discussions in focus groups, individual interviews, and questionnaires. The author conducted meetings with four focus groups of 7 to 15 people involving different kinds of stakeholders: service delivery (3 occasions), sales (1 occasion),
24

system management (1 occasion), and product management (5 occasions). The focus group sessions were used to gain a basic understanding of the problem, and to get feedback from during the process development. To gain a more in depth knowledge, 30 interviews were conducted and questionnaire answers gathered from the ten market regions were analyzed. The interviews were informal and primarily face-to-face, but occasionally (3 times) over the phone. With people having specific experiences of compatibility matrix applications, pros and cons of those were discussed more in detail. The interviews and discussions were based on the two questions, also expressed in the questionnaire:
• What are the major cross-organizational issues from the market facing organization perspective?
• What system level documentation would give the most value contribution for the market facing organizations?
Notes were taken during the group sessions and the individual interviews, and together with the written answers compiled to main problems by combining and refining the answers given. The material was condensed into 33 main issues using the ECRS – Eliminate, Combine, Rearrange, and Simplify – method (http://www.onlinembawiki.com/ecrs), a method frequently applied within the Six Sigma concept (Schroeder et al. 2008, Jakowski 2007). The issues were grouped, which resulted in ten improvement areas (see chapter 5.2 below), and further categorized to funnel out the vital core. After exploring the need for cross-functional information in Ericsson, the focus was to develop and evaluate a process delivering the information within the boundary conditions stated.
4.5 Definition of conditions to proceed
To achieve sufficient management support a formal assignment to produce the process was secured, anchoring of the decision to provide the information was brought up to the senior management level in the company, and a management reference group was established.
The reference group, based on the generic value chain (Porter 1985), was formed with management representation from central Product and Portfolio Management, System Management, Network Solutions, Global Services, and Group Product Management, and was used for guidance and anchoring throughout the study. In total 6 reference group meetings were held during the spring of 2010. Further anchoring was achieved by continuous dialogues with key stakeholders in the process.
4.6 Compatibility Matrix process development
Having defined the information to consider, and having the conditions to proceed in place, the next step was to define the details of the compatibility matrix. In order to evaluate the differences between SCM and ACM, previous experiences in the company were used. Subject matter experts were consulted, and workshops and meetings took place. The aspects of symmetry, scope, level of details, number of dimensions, content provisioning, maintenance,
25

and other process details were explored in parallel with the development of the process and what should become the pilot template.
4.7 Evaluation
A pilot of an ACM was launched with a limited scope. It was published on the Ericsson Product Catalogue to the market facing organizations, and a hits counter in the catalogue was secured to be able to measure the number of occasions the document had been downloaded. The feedback from users was gathered, conclusions were drawn regarding cost and requirements on organizational changes.
The process was evaluated using the PEMM method (Hammer 2007). The process as well as the enterprise maturities were analyzed prior to the formal process establishment, and the process maturity was evaluated a second time after the formal process establishment and the pilot execution.
26
5 Analysis and result
5.1 Stakeholders
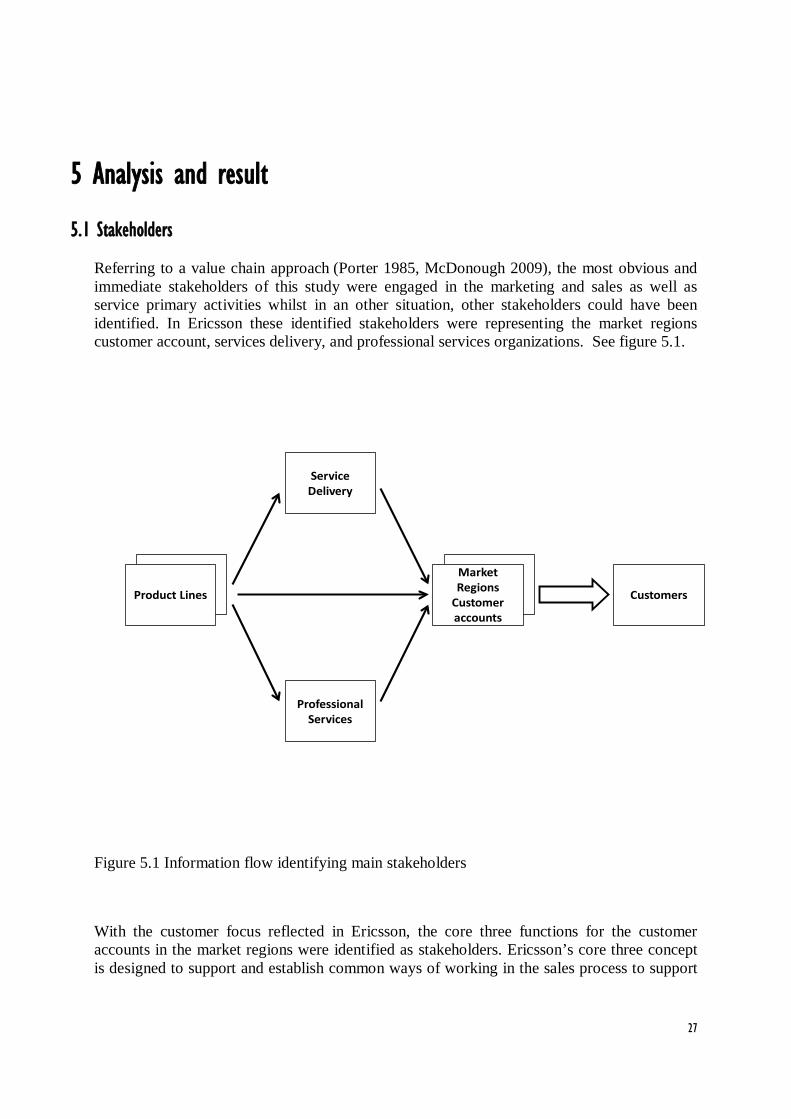
Referring to a value chain approach (Porter 1985, McDonough 2009), the most obvious and immediate stakeholders of this study were engaged in the marketing and sales as well as service primary activities whilst in an other situation, other stakeholders could have been identified. In Ericsson these identified stakeholders were representing the market regions customer account, services delivery, and professional services organizations. See figure 5.1.
ServiceDelivery
ProfessionalServices
CustomersProduct Lines
Market Regions
Customeraccounts
Figure 5.1 Information flow identifying main stakeholders
With the customer focus reflected in Ericsson, the core three functions for the customer accounts in the market regions were identified as stakeholders. Ericsson’s core three concept is designed to support and establish common ways of working in the sales process to support
27

strategic and critical business. The core three roles are: Account/Commercial Responsible (ACR), Customer Solution Responsible (CSR), and Contract Fulfillment Responsible (CFR).
From the services perspective, the product management functions for professional services, and the delivery organizations, were main stakeholders due to their responsibilities and customer interface.
The outbound logistics activities were in this area at Ericsson performed by the product lines. In addition to the upper management that needs to support the activity, the main stakeholders were the strategic product managers possessing the relevant knowledge to transfer to the marketing and sales as well as services activities. They are being responsible for providing product release information.
Other stakeholders identified were in the support activities Firm Infrastructure, e.g. the Ericsson Group process owners, and technology development, e.g. the central system and product management departments.
Additionally, several subject matter experts were identified and gave valuable input during the progress of the study. Of particular importance were their previous experiences of value for the matrix development phase.
The ultimately targeted stakeholders, the external customers, were addressed indirectly via the marketing facing organizations dealing with marketing and sales as well as services.
The stakeholders can be grouped into three parts: process prerequisites and facilitators, input providers, and output receivers. Referring to the generic value chain (Porter 1985) these parts are here represented in the outbound logistic primary activities delivering information towards the marketing and sales as well as services primary activities. This could however apply for other value chain activities as well.
Process prerequisites and facilitators:
• Senior management attention and support of the initiative by allocation of resources in e.g. the outbound logistics is vital for process establishment and maintenance. The ambition level defines the effort required, and ranges from small investment and negligible maintenance to big investment and moderate maintenance. This study was a small investment and will require negligible maintenance effort.
• Process owner and process administrator supplied by one of the support activities to secure document sustainability and continuous process improvements. In the study example the functions were supplied by the technology development support activities. Administrative support for documentation handling etc needs to be secured, with no specific value chain request.
• Alignment with other processes and adherence to company rules should be agreed with representatives for the firm infrastructure support activities.
Input providers:
28

• Input providers in e.g. the outbound logistics activities, providing the information already available, but in a new context to improve the accessibility and readability of the information from the output receivers’ perspective.
Output receivers:
• The output receivers would differ depending on the ACM application and purpose. In the study where the targeted receivers are found in the marketing and sales as well as services primary activities, the obvious stakeholders are the customer near functions e.g. the Ericsson core three team (ACR, CSR, and SFR), the professional services organization, and the service delivery organization.
5.2 Data refinement
Data collection and analysis were initially very open, and based on two questions only. The type of information to include and the ACM approach were not given as input. During the interview sessions, follow-up questions and discussion items varied depending on the interviewees responses. Thus, the data collection gave a very wide spectrum of issues that could be addressed. The data was analyzed, structured, and condensed in two steps; first to 33 main issues (not presented in this thesis) and thereafter categorized resulting in the following 10 improvement areas:
• Upgrade procedures
• Node compatibility dependencies
• Feature alignment
• Multi-vendor dependencies
• Verification co-ordination
• End-to-end ownership
• Market corrections
• Product improvements
• Organizational issues
• Knowledge sharing
Further categorization, leaving multi-vendor dependencies (to serve the purpose of the thesis) and organizational issues (due to the boundary conditions) to the side, washed out two main categories of improvement areas of cross-functional information:
29

• Knowledge reuse - Information needed in the market regions is available and the organizational responsibility is clear, but the mechanisms to share the information are immature.
• Knowledge gap - Information needed in the Market Regions is insufficient and/or the organizational responsibility is unclear.
To address the bulk of the issues raised in the information gathering activity, three types of information - judged by the number of statements given in that direction as well as their boldness - were identified as solving a major part of the information gap:
• For the situation where information is insufficient, the information requested could be provided with a set of system feature documents with a clear ownership assigned.
• For the situation where information is available, one kind of information relates to upgrade sequences defining in what order different products in a solution must be upgraded. The information available today is tedious to compile and lacks editorial “best practice”, i.e. the way knowledge is described may vary between the different authors of the documents.
• For the situation where information is available, one kind of information has to do with compatibility information describing product dependencies, e.g. what product combinations have been designed and verified. As for the upgrade information, the information available today is tedious to compile, and the way the knowledge is described may vary between the different authors of the documents.
The compatibility matrix was the most clearly expressed information gap. Given the characteristics of the data and the advantages of ACM, the ACM was chosen to be tested to provide the compatibility information leaving the other types to be addressed separately.
5.3 Definition of conditions to proceed
Sufficient management support, vital to succeed with the study, was achieved on several organizational levels in the company. An assignment specification signed by the central system management function served as foundation for the formal agreement to produce the process needed. Decision to provide this type of cross-functional information was taken in a steering group on senior management level, and further brought up to next level of steering group in the company for executive management acceptance and support.
Furthermore, continuous dialogues took place with the market regions and the service delivery unit to tune the ambitions and directions to fulfill the needs of the marketing and sales as well as services activities.
The receivers of the information, i.e. the stakeholders identified in the market regions, did not need to be convinced about the value of the document. However, since the document requires continuous updates from several people to be truly useful, it obviously underlines the need of a process owner regarding the information support. He/she would gather and align all content
30

contributions. This document would contain the main benefits for the market regions and main implications for the product lines. The process highlights were described to gain understanding and support from the relevant information providers in the different units concerned.
Main benefits of were:
• Information availability. Compatibility information available in “one click” from the Ericsson product catalogue (rather than having to search for the information in multiple places to compile the information to a best effort level).
• Information reliability. Compatibility information is consistent and up-to-date (with quarterly releases and availability to reach preliminary information of coming document release).
• Project planning efficiency. Improved project planning and fewer risks for malfunctions and missed business opportunities.
• Avoidance of redundancy. Less need for addressing generic issues over and over again, leaving room for more focused customer-specific activities.
Main implications for the Product Lines providing the information were:
• One-time effort to provide the information for a first version of the Compatibility Matrix.
• Repeated updates of the document when the product status changes.
• Quarterly sign-off to guarantee content accuracy.
• One-time effort to create entries in the product catalogue for access to the document from each product release folder.
An overview of the Ericsson compatibility matrix quarterly update process is provided (Appendix C).
5.4 Compatibility Matrix process development
Showing multiple dependencies in engineering is frequently done by presenting information in a two-dimensional SCM. The products included are represented on the two axes of the matrix. Crossing points of columns and rows are called cells and include the dependency information. From previous experiences working with SCM’s in Ericsson, it is known that the maintenance effort is coupled to the scope size and content responsibilities. A major challenge with the SCM is to identify the people responsible for each of that information in the cells back in the organization, tracing also communication channels between them (if they exist). An SCM, with identical axes, can even with a limited scope easily reach a size of more than 100x100 cells. In a matrix with all product releases on both axes, the information
31

responsibility is scattered all over the matrix, and there is no possibility for a reader to understand who is responsible for the different cell contents. Furthermore, examples from Ericsson show that each cell can have information of different types, e.g.
• Not applicable as there are no direct dependencies between the products.
• Designed for compatibility and fully verified by node "XXX".
• Designed for compatibility and partly verified node "XXX".
• Direct product launch implies certain risk. Further study required to determine specific customer needs.
• Designed for compatibility and verification planned for by node "YYY".
• Designed for compatibility by node “ZZZ”, but no verification is planned.
• Designed for compatibility, verification status is unknown.
• Not compatible. The peer node needs to be upgraded to a more recent revision.
• Relations unknown.
• Duplicated relation, see the other place in the matrix.
• Other detailed information provided, e.g. additional verification or feature specific dependencies.
The information is produced and continuously refined anarchically in numerous projects, i.e. in different formats, in different types of documentation, and for different target groups. Since there is no clear ownership defined for the information in each cell, it would require an un-proportional effort to maintain.
Toward a solution: identifying content ownership
With an ACM, however, there is a possibility to identify the information responsibility for each cell. By collapsing all the product releases in the horizontal axis of the matrix to one product per columns, and remaining the detailed release information on the vertical axis for the rows, it is possible to define the information content owners. Information in each row in the ACM can easily be assigned one owner. A consequence of the asymmetry is that instead of providing detailed information about every release combination, only information about lowest verified release level is provided. (A condition is that future product releases are backward compatible.) The information becomes less detailed compared with the symmetric version described above, but is in practice possible to maintain. To understand the compatibility dependencies, the reader has to enter the matrix from two entries for the life cycle status of the products, e.g. if the lowest revision of the product verified has reached end-of-support status. In the cells where the same product is represented in the two axes, the cell
32
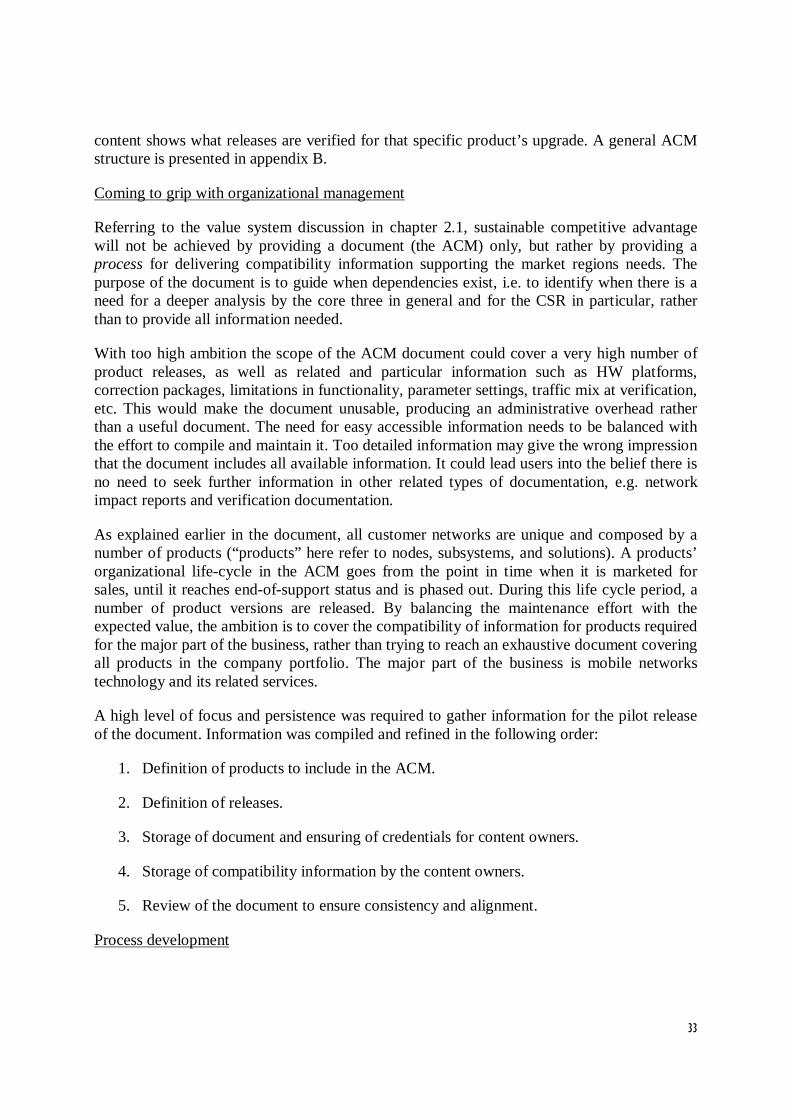
content shows what releases are verified for that specific product’s upgrade. A general ACM structure is presented in appendix B.
Coming to grip with organizational management
Referring to the value system discussion in chapter 2.1, sustainable competitive advantage will not be achieved by providing a document (the ACM) only, but rather by providing a process for delivering compatibility information supporting the market regions needs. The purpose of the document is to guide when dependencies exist, i.e. to identify when there is a need for a deeper analysis by the core three in general and for the CSR in particular, rather than to provide all information needed.
With too high ambition the scope of the ACM document could cover a very high number of product releases, as well as related and particular information such as HW platforms, correction packages, limitations in functionality, parameter settings, traffic mix at verification, etc. This would make the document unusable, producing an administrative overhead rather than a useful document. The need for easy accessible information needs to be balanced with the effort to compile and maintain it. Too detailed information may give the wrong impression that the document includes all available information. It could lead users into the belief there is no need to seek further information in other related types of documentation, e.g. network impact reports and verification documentation.
As explained earlier in the document, all customer networks are unique and composed by a number of products (“products” here refer to nodes, subsystems, and solutions). A products’ organizational life-cycle in the ACM goes from the point in time when it is marketed for sales, until it reaches end-of-support status and is phased out. During this life cycle period, a number of product versions are released. By balancing the maintenance effort with the expected value, the ambition is to cover the compatibility of information for products required for the major part of the business, rather than trying to reach an exhaustive document covering all products in the company portfolio. The major part of the business is mobile networks technology and its related services.
A high level of focus and persistence was required to gather information for the pilot release of the document. Information was compiled and refined in the following order:
1. Definition of products to include in the ACM.
2. Definition of releases.
3. Storage of document and ensuring of credentials for content owners.
4. Storage of compatibility information by the content owners.
5. Review of the document to ensure consistency and alignment.
Process development
33

To establish a platform where from continuous updates can be made according to the TQM (Oakland 1989, Feigenbaum 1991) concept, a process with a limited set of parameters could be defined, e.g.:
• Each information row in the ACM is assigned one content owner.
• Update of coming revisions of the ACM is done aligned with product status changes.
• Releases are synchronized with regular commercial roadmap updates.
• Process owner is defined.
• Document handling is defined.
• Communication of the ACM including publishing it is secured.
• Simple feedback loop to content and process owners is defined.
In the Ericsson study, one additional one-time effort was required to give the information a product identity separate from the included nodes. To be able to publish the document in the Ericsson product catalogue, it needed a product identity. A new ‘end to end networks’ product was designed for system wide documentation. The product identity requirement could have different implications depending on application and company documentation structures. The process of the Ericsson study is partly depicted in Appendix C.
5.5 Evaluation
Prior to implementing any kind of formal description of the process, an evaluation of process and enterprise maturities using the PEMM method (Hammer 2007, Appendix A) was made. The initial maturity level of compatibility information relevant to market regions is shown in figure 5.2, and the Ericsson’s enterprise maturity is shown in figure 5.3. The enterprise maturity analysis showed that the company as such had high process maturity capabilities. In other words (and at the time for the evaluation) the company had the capability but the organization did not support knowledge to the market region in a cost-efficient way. A second analysis (figure 5.4) of the process maturity regarding the compatibility of information relevant to market regions was made after the pilot study and the completion of the formal process description. The enterprise maturity was not evaluated a second time.
34

Figure 5.2. Initial process maturity level of compatibility information to market regions using PEMM analysis.
Figure 5.3. Initial enterprise maturity level of Ericsson using PEMM analysis.
35

Figure 5.4. Process maturity level of compatibility information to market regions after introduction of asymmetric compatibility matrix, using PEMM analysis.
The comparison of the PEMM process maturity prior and post the introduction of the ACM shows significant improvements in 8 of the 13 process enabler elements according to figure 5.5, in which each shift in level is represented by one (1) improvement point. The skills element showed good status prior to the evaluative study. The infrastructure and metrics maturity had a poor initial status and did not improve with the approach taken in the study.
ImprovementPurpose 3Context 2Documentation 4Knowledge 2Skills 0Behavior 3Identity 3Activities 6Authority 7Information Systems 0Human Resource Systems 0Definition 0Users 0
Infrastructure
Metrics
Design
Performers
Owner
Improvement shows total number of level shifts
Figure 5.5. Process maturity improvements as result of the study and pilot evaluation.
The PEMM analysis unveils a) major improvements in the areas of design documentation, owner activities, and owner authority, b) moderate improvements in the areas of design
36

purpose, design context, performers knowledge, performers behavior, and owner identity, and that c) the remaining gaps are predominantly found in the areas of infrastructure information systems, infrastructure human resources systems, metrics definition, and metrics users. In addition to the PEMM analysis, a heuristic analysis provides information about the relevance of the initiative. From a situation with predominantly negative feedback in this area from the market regions, a more positive attitude was detected after the first release of the document. The document was read and scrutinized in detail by the professionals involved, relevant feedback regarding identified inconsistencies were given, and constructive improvements were suggested.
The document hits were counted and a monthly average of 319 hits was registered during the first three months in operation, which gave a measure of how many times the document had been downloaded from the document library. This hit rate places the document in the 99th percentile of all available product documents from this perspective during this period.
Compared to previous experiences in Ericsson with SCM applications, the overhead cost for maintenance of the ACM, is in the order of one tenth of the SCM overhead cost. This is an estimate which cannot be fully verified until the process has been in operation for a longer period of time.
37

6 Conclusions and Recommendations
6.1 Main conclusions
From this study it can be concluded that an ACM can be a powerful tool for gathering cross-functional product information in large decentralized organizations at a low cost without any organizational changes, and with a high process maturity.
In this Ericsson specific study, it can be concluded that one can reduce the effort for the market regions to provide generic information for each customer by the use of ACM for compatibility information. The core three teams would be able to re-use generic information and focus on customer specific sales and deployment issues. From the hits registered during the first three months in operation of the ACM, it can be concluded that the document addresses an information gap. The hit rate can serve as baseline for future measurements. One can assume that sales costs as well as business risks can decrease, affecting overall efficiency positively. Furthermore it can be assumed that new business opportunities can be addressed better since relevant generic information is made available up front. Other positive expected benefits are increased customer satisfaction and prevention of network malfunctions.
The issues dealt with in this study are framed by knowledge-intensity, large de-centralized organizations, complex product solutions, cost focus, and fierce international competition. For companies facing these conditions, the ACM is likely a powerful tool for the gathering and communicating the cross-functional product information.
The four questions phrased in the problem definition context are answered below.
6.2 Stakeholders
On the question “Who are the main stakeholders?” the study concludes and recommends three groups of stakeholders: process prerequisites and facilitators, input providers, and output receivers. The conclusion is described as an application of outbound logistic primary activities information towards the marketing and sales as well as services primary activities, referring to the primary and support activities of the generic value chain (Porter 1985). This could however apply for other value chain activities as well. See chapter 5.1 for further details.
6.3 ACM
On the question “What are the pros and cons of applying the asymmetrical approach rather than the symmetrical?” the study concludes that an ACM can be used as a powerful tool for presenting critical dependency information compared to a traditional SCM. It is suitable for sharing of information that is already available, has a clear ownership, lacks efficient mechanisms to manage, and - needless to say - is identified as an information gap by the targeted users. In the study, the scope was initially limited to include a set of the most required products. It can successively be expanded when needed.
38
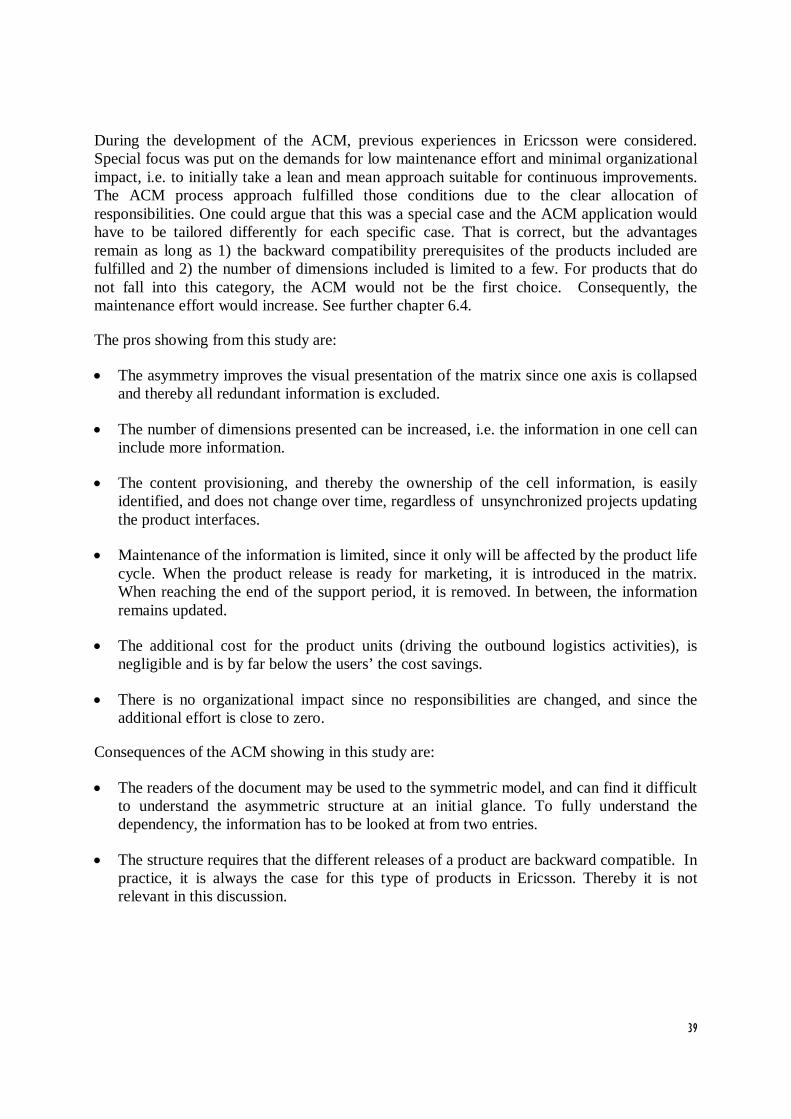
During the development of the ACM, previous experiences in Ericsson were considered. Special focus was put on the demands for low maintenance effort and minimal organizational impact, i.e. to initially take a lean and mean approach suitable for continuous improvements. The ACM process approach fulfilled those conditions due to the clear allocation of responsibilities. One could argue that this was a special case and the ACM application would have to be tailored differently for each specific case. That is correct, but the advantages remain as long as 1) the backward compatibility prerequisites of the products included are fulfilled and 2) the number of dimensions included is limited to a few. For products that do not fall into this category, the ACM would not be the first choice. Consequently, the maintenance effort would increase. See further chapter 6.4.
The pros showing from this study are:
• The asymmetry improves the visual presentation of the matrix since one axis is collapsed and thereby all redundant information is excluded.
• The number of dimensions presented can be increased, i.e. the information in one cell can include more information.
• The content provisioning, and thereby the ownership of the cell information, is easily identified, and does not change over time, regardless of unsynchronized projects updating the product interfaces.
• Maintenance of the information is limited, since it only will be affected by the product life cycle. When the product release is ready for marketing, it is introduced in the matrix. When reaching the end of the support period, it is removed. In between, the information remains updated.
• The additional cost for the product units (driving the outbound logistics activities), is negligible and is by far below the users’ the cost savings.
• There is no organizational impact since no responsibilities are changed, and since the additional effort is close to zero.
Consequences of the ACM showing in this study are:
• The readers of the document may be used to the symmetric model, and can find it difficult to understand the asymmetric structure at an initial glance. To fully understand the dependency, the information has to be looked at from two entries.
• The structure requires that the different releases of a product are backward compatible. In practice, it is always the case for this type of products in Ericsson. Thereby it is not relevant in this discussion.
39

6.4 Maintenance
On the question “How should the information be maintained?” the study stresses the importance of management support and of taking a continuous improvements support.
With Ericsson’s history of managing business process, it is well known that successful process changes comes with dedicated people and crucial support from senior management (as well as information contributors). Strong management attention combined with continuous anchoring of the process refinement with the management reference group cater for a successful output.
Despite that, the importance of value argumentation to all stakeholders should not be under estimated. The value argumentation produced in this case was used in numerous occasions and illustrates the importance of communication during a change management project. A differently structured approach, e.g. Six Sigma (Jacowski 2007, Nave 2002) could have resulted in a change program being more familiar to employees and thereby being more easily pursued.
With the small steps TQM (Oakland 1989, Feigenbaum 1991) approach taken, a basic process description was produced. As the process matures, it will be refined and weaknesses will be identified.
The maintenance effort of the information is minimal with the ACM approach. When the product release is ready for marketing, it is introduced in the matrix. When reaching the end of the support period, it is removed. In between, the information remains updated. The information ownership is also constant over the product life cycle. Scope additions, i.e. bringing in new products in the matrix, would require a moderate one-time effort to gather and compile already existing information. Any identified inconsistency would via a simple mail feedback loop be addressed to the content owner, and an updated version of the information could be made available with no delay. Compared to previous experiences in Ericsson with SCM applications, the overhead cost for maintenance of the ACM is considerably lower. At this stage it is too early to give a firm figure, but current estimate is in the order of one tenth of the SCM overhead cost.
6.5 Process maturity
On the question “Is it possible to reach a high process maturity with no or limited overhead cost?” the study concludes that with a small effort, at a low cost and without organizational changes, the introduction of an ACM combined with a process description, may significantly improve the process maturity measures.
Compatibility information was used to evaluate the ACM and its applicability. This could later on be extended with ACM’s for other types of information. Furthermore the heuristic analysis of the end-user benefits could be complemented with a more formal analysis.
40

PEMM (Hammer 2007), a generally applicable and well established method (Power 2007) for process maturity evaluations, was used for the evaluation. In this case the elements in the infrastructure and metrics enablers show no improvements. The evaluation may, later when the pilot phase is concluded, be re-produced and involve multiple stakeholders. The areas still showing low process maturity can then further be given special focus and addressed with specific improvement activities. To reach a good maturity level in all aspects, continuous improvements will have to take place to address the gaps over time.
41

7 References Brody, A. B., Dempski, K. L., Kaplan J.E., Kurth, S. W., Liongosari, E. S. & Swaminathan, K. S. (1999). Integrating Disparate Knowledge Sources. Center for Strategic Technology Research, Accenture.
Chrissis, M. B., Konrad M. & Shrum, S. (2006). CMMI(R): Guidelines for Process Integration and Product Improvement (2nd Edition). Addison-Wesley.
Cook, T. D. & Reichardt, C. S (1979). Qualitative and Quantitative Methods in Evaluation Research, pp. 7-32. Sage.
Dahlman, E., Ekström, H., Furuskär, A., Karlsson, J., Meyer, M., Parkvall, S., Torsner, J. & Wahlqvist, M. (2005). The long-term evolution of 3G. Ericsson Review, no. 02, pp. 118-125.
Davenport, T. H. (1993). Need Radical Innovation and Continuous Improvement? Integrate Process Reengineering and TQM, Strategy & Leadership, vol. 21, issue 3, pp. 6-12.
Ericsson White Paper (2009). The future role of telecom. http://www.ericsson.com/technology/whitepapers, September.
Feigenbaum, A. V. (1991). Total Quality Control, Revised (40th Anniversary Edition) . Mc-Graw-Hill.
Ghauri, P. & Grønhaug, K. (2005). Research Methods in business Studies. Pearson Education.
Hammer, M. (1996). Beyond Reenginering. HarperCollins Publishers.
Hammer, M. (2007). The Process Audit, Harvard Business Review, vol. 85, issue 4, pp. 111-123.
Hammer, M. & Champy, J. (1993). Reengineering the Corporation: A Manifesto for Business Revolution. HarperCollins Publishers.
Humphrey, W.S. (1989). Managing the Software Process. Addison-Wesley.
Jacowski, T. (2007). Six Sigma vs. Total Quality Management, The Project Management Hut, May 27. http://www.pmhut.com.
Lai, E. (2008). Recession: Will Your Vendors Be Acquired?, Computerworld. http://www.cio.com/article/print/454505
Macphearson, A. & Waterman, D. (2009). Forget Network Neutrality – Collaboration is the New Paradigm, Ericsson Business Review, no. 3, pp. 52-53.
McDonough, M. (2009). The Value Chain Analysis as a PM Tool, Bright Hub, Oct. 6. http://www.brighthub.com.
42

Nave, D. (2007). How To Compare Six Sigma, Lean and the Theory of Constraints, Quality Progress, March, pp. 73-78.
Nonaka, I. (1991). The knowledge creating company, Harvard Business Review, vol. 69, issue 6, pp. 96–104.
Oakland, J. S. (1989). Total Quality Management. Butterworth Heinemann.
Porter, M. E. (1985). Competitive Advantage. Free Press.
Power, B. (2007). Michael Hammer’s Process and Enterprise Maturity Model, BP Trends, July. http://www.bptrends.com.
Reedy, S. (2010). Google Ups the Ante on VoIP, HD Voice, Light Reading Mobile, May 18.
Schroeder, R. G., Linderman, K., Liedtke, C. & Choo, A. S. (2008). Six Sigma: Definition and underlying theory, Journals of Operations Management, issue 26, pp. 536-554.
Timsäter, M. (2009). The battle of the platforms: What does it mean for operators?, Ericsson Business Review, no. 2, pp. 52-53.
Websites:
http://www.ericsson.com
http://www.inquira.com
http://www.onlinembawiki.com/ecrs
http://www.sei.cmu.edu
http://www.thebrain.com
43

APPENDICIES
A. Process and Enterprise Maturity Model (Hammer 2007)
Figure A.1. PEMM process maturity elements, levels 1-2
44

Figure A.2. PEMM process maturity elements, levels 3-4
45

Figure A.3. PEMM enterprise maturity elements, levels 1-2
46

Figure A.4. PEMM enterprise maturity elements, levels 3-4
47

B. Asymmetric Compatibility Matrix structure
Release Content Responsible
Product Release
Prod
uct 1
Prod
uct 2
Prod
uct 3
Prod
uct m
Updated Sign-off CommentsProduct 1
Name 1 Release 1.1 u x x x yy-mm-dd Signature 1Name 2 Release 1.2 u x x x yy-mm-dd Signature 2Name 3 Release 1.3 u x x x yy-mm-dd Signature 3Name 4 Release 1.4 u x x x yy-mm-dd Signature 4Name 5 Release 1.5 u x x x yy-mm-dd Signature 5
Product 2Name 6 Release 2.1 x u x x yy-mm-dd Signature 6Name 7 Release 2.2 x u x x yy-mm-dd Signature 7Name 8 Release 2.3 x u x x yy-mm-dd Signature 8Name 9 Release 2.4 x u x x yy-mm-dd Signature 9Name 10 Release 2.5 x u x x yy-mm-dd Signature 10
Product 3Name 11 Release 3.1 x x u x yy-mm-dd Signature 11Name 12 Release 3.2 x x u x yy-mm-dd Signature 12Name 13 Release 3.3 x x u x yy-mm-dd Signature 13Name 14 Release 3.4 x x u x yy-mm-dd Signature 14Name 15 Release 3.5 x x u x yy-mm-dd Signature 15
Product mName n Release m.1 x x x u yy-mm-dd Signature nName n+1 Release m.2 x x x u yy-mm-dd Signature n+1Name n+2 Release m.3 x x x u yy-mm-dd Signature n+2Name n+3 Release m.4 x x x u yy-mm-dd Signature n+3Name n+4 Release m.5 x x x u yy-mm-dd Signature n+4
x= lowest verified and compatible release version u= lowest version verified for upgrade
Figure B.1. Asymmetric Compatibility Matrix structure, example
48
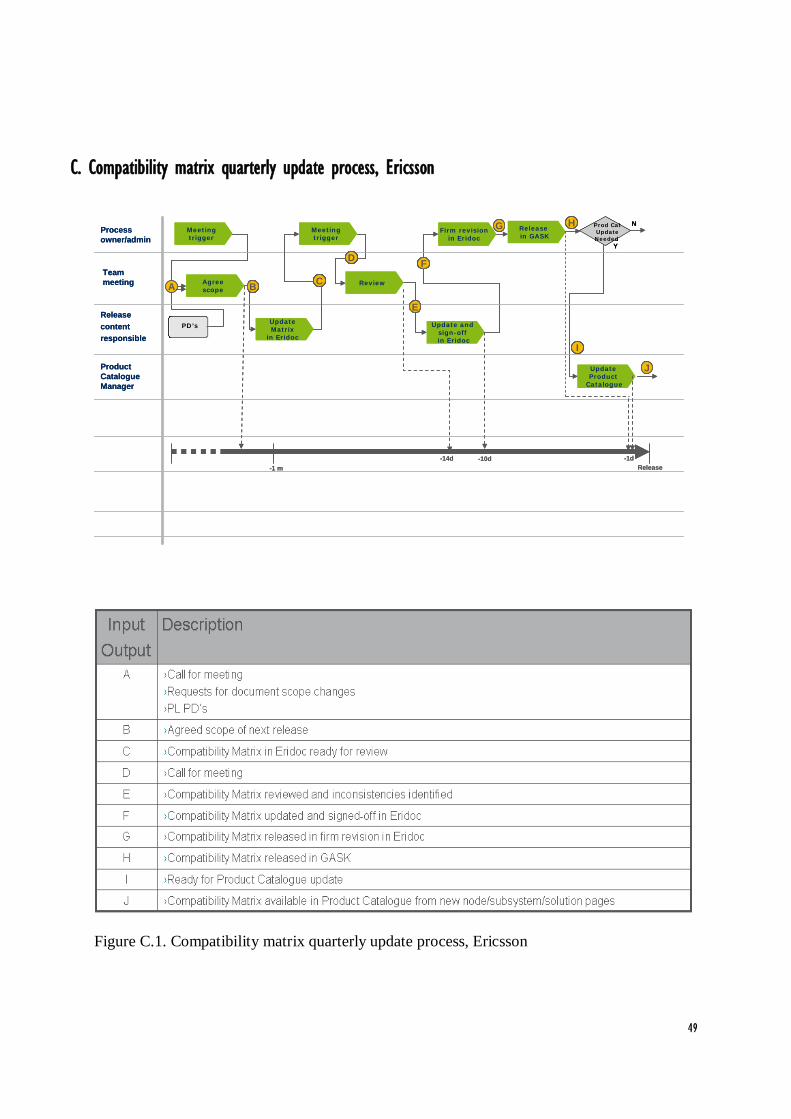
C. Compatibility matrix quarterly update process, Ericsson
Figure C.1. Compatibility matrix quarterly update process, Ericsson
Team meeting
Process owner/admin
ProductCatalogueManager
Prod CatUpdateNeeded
Y
Agreescope
UpdateMatrix
in Eridoc
Release in GASK
Update and sign-off in Eridoc
Firm revision in Eridoc
Review
Meetingtrigger
Meetingtrigger
N
Release-1 m-14d -10d
Update Product
Catalogue
-1d
PD’s
A B C
D
E
F
G H
I
J
B C
D
B C
FD
B C
E
FD
B C
I
E
FD
B C
H
I
E
FD
B C
G H
I
E
FD
B C
J
G H
I
E
FD
B C
Release contentresponsible
Team meeting
Process owner/admin
ProductCatalogueManager
Prod CatUpdateNeeded
Y
Agreescope
UpdateMatrix
in Eridoc
Release in GASK
Update and sign-off in Eridoc
Firm revision in Eridoc
Review
Meetingtrigger
Meetingtrigger
N
Release-1 m-14d -10d
Update Product
Catalogue
-1d
PD’s PD’s
A B C
D
E
F
G H
I
J
B C
D
B C
FD
B C
E
FD
B C
I
E
FD
B C
H
I
E
FD
B C
G H
I
E
FD
B C
J
G H
I
E
FD
B C
Release contentresponsible
49


![loc Culture System applied for intensive broodstock ... · Biofloc Technology - A practical guide book. The Word Aquaculture Society, Baton Rouge, Louisia-na, United States. [4] Marklund,](https://static.fdocuments.in/doc/165x107/5ac500477f8b9aa0518db753/loc-culture-system-applied-for-intensive-broodstock-technology-a-practical.jpg)