FY2020 Consolidated Financial Results (Japanese Accounting ...
Consolidated Financial Results for the Fiscal Year Ended March 31, 2020
[Japanese GAAP]
May 20, 2020
Company name: A&D Company, Ltd. Stock exchange listing: Tokyo Stock Exchange Code number: 7745 URL: https://www.aandd.jp/ Representative: Yasunobu Morishima, President & CEO Contact: Sadao Ito, Director, Managing Executive Officer and Business Management HQ Executive Phone: +81-48-593-1111 Scheduled date of Annual General Meeting of Shareholders: June 25, 2020 Scheduled date of filing annual securities report: June 26, 2020 Scheduled date of commencing dividend payments: June 26, 2020 Availability of supplementary briefing material on annual financial results: Available Schedule of annual financial results briefing session: Not scheduled
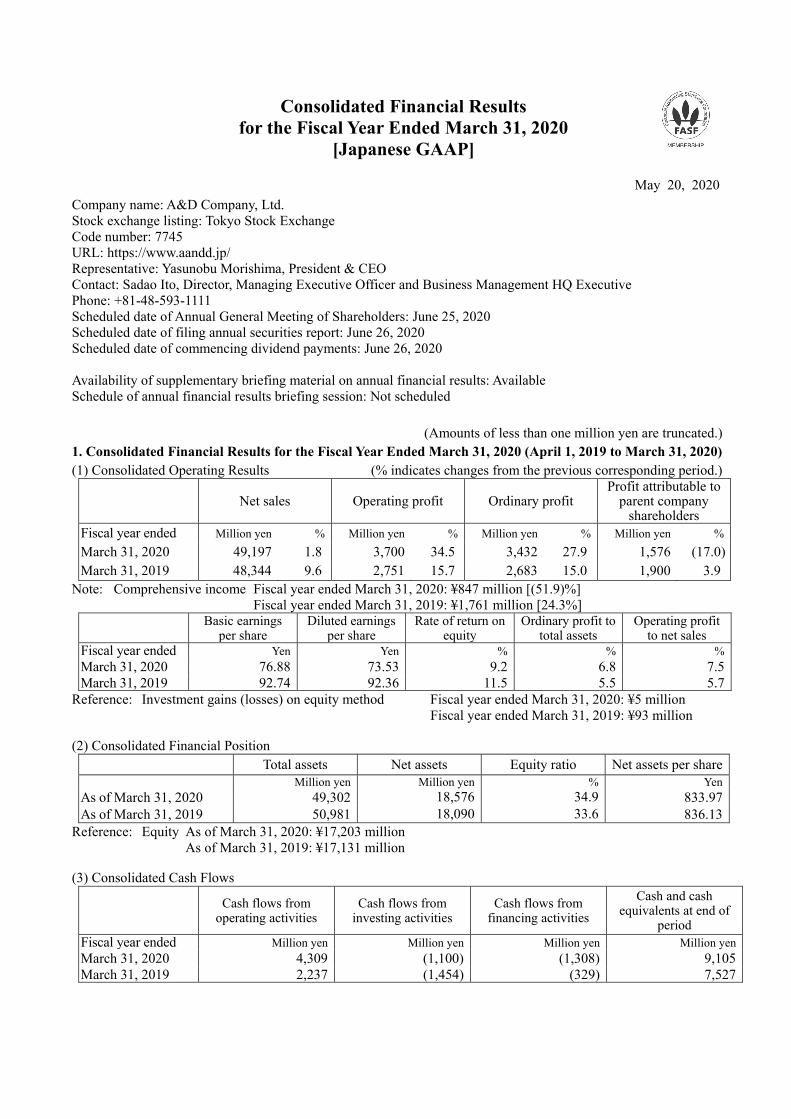
(Amounts of less than one million yen are truncated.) 1. Consolidated Financial Results for the Fiscal Year Ended March 31, 2020 (April 1, 2019 to March 31, 2020) (1) Consolidated Operating Results (% indicates changes from the previous corresponding period.)
Net sales Operating profit Ordinary profit
Profit attributable to parent company
shareholders Fiscal year ended Million yen % Million yen % Million yen % Million yen %
March 31, 2020 49,197 1.8 3,700 34.5 3,432 27.9 1,576 (17.0) March 31, 2019 48,344 9.6 2,751 15.7 2,683 15.0 1,900 3.9
Note: Comprehensive income Fiscal year ended March 31, 2020: ¥847 million [(51.9)%] Fiscal year ended March 31, 2019: ¥1,761 million [24.3%]
Basic earnings per share
Diluted earnings per share
Rate of return on equity
Ordinary profit to total assets
Operating profit to net sales
Fiscal year ended Yen Yen % % % March 31, 2020 76.88 73.53 9.2 6.8 7.5 March 31, 2019 92.74 92.36 11.5 5.5 5.7
Reference: Investment gains (losses) on equity method Fiscal year ended March 31, 2020: ¥5 million Fiscal year ended March 31, 2019: ¥93 million
(2) Consolidated Financial Position Total assets Net assets Equity ratio Net assets per share Million yen Million yen % Yen
As of March 31, 2020 49,302 18,576 34.9 833.97 As of March 31, 2019 50,981 18,090 33.6 836.13
Reference: Equity As of March 31, 2020: ¥17,203 million As of March 31, 2019: ¥17,131 million (3) Consolidated Cash Flows
Cash flows from
operating activities Cash flows from
investing activities Cash flows from
financing activities
Cash and cash equivalents at end of
period Fiscal year ended Million yen Million yen Million yen Million yen March 31, 2020 4,309 (1,100) (1,308) 9,105 March 31, 2019 2,237 (1,454) (329) 7,527
2. Dividends
Annual dividends
Total dividends
Payout ratio
(consolidated)
Dividends to net assets
(consolidated) 1st
quarter-end 2nd
quarter-end 3rd
quarter-end Year-end Total
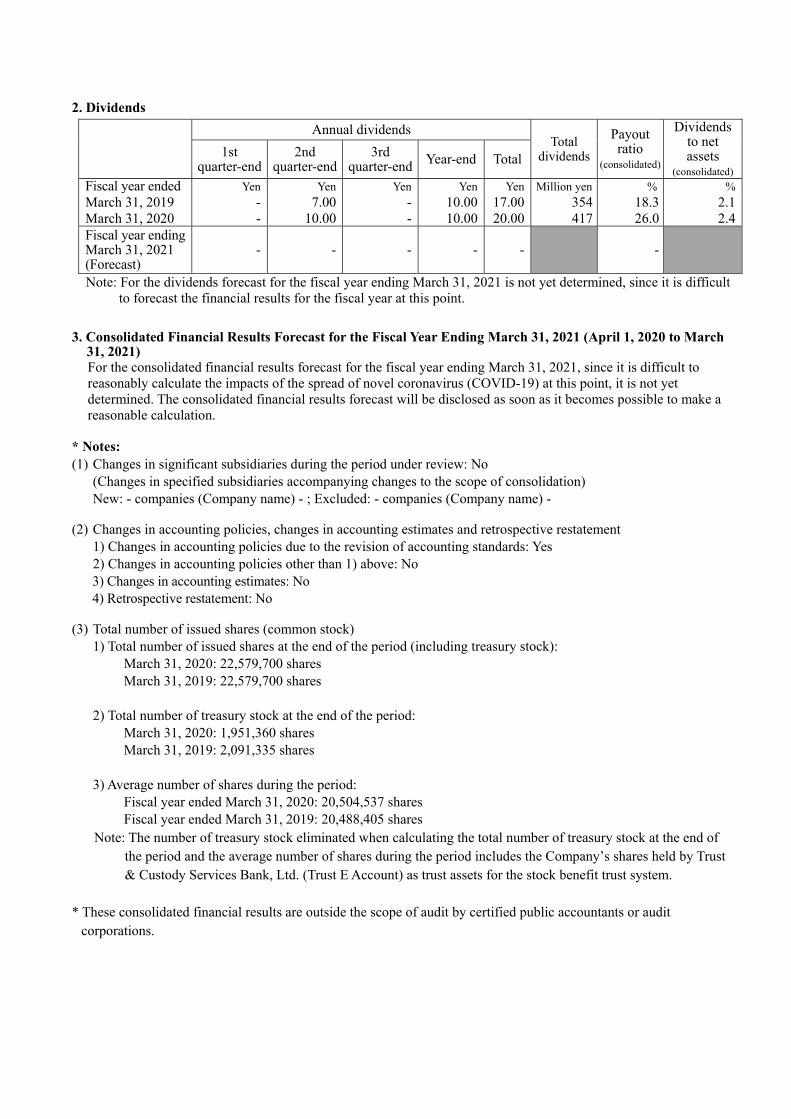
Fiscal year ended Yen Yen Yen Yen Yen Million yen % % March 31, 2019 - 7.00 - 10.00 17.00 354 18.3 2.1 March 31, 2020 - 10.00 - 10.00 20.00 417 26.0 2.4 Fiscal year ending March 31, 2021 (Forecast)
- - - - - -
Note: For the dividends forecast for the fiscal year ending March 31, 2021 is not yet determined, since it is difficult to forecast the financial results for the fiscal year at this point.
3. Consolidated Financial Results Forecast for the Fiscal Year Ending March 31, 2021 (April 1, 2020 to March
31, 2021) For the consolidated financial results forecast for the fiscal year ending March 31, 2021, since it is difficult to reasonably calculate the impacts of the spread of novel coronavirus (COVID-19) at this point, it is not yet determined. The consolidated financial results forecast will be disclosed as soon as it becomes possible to make a reasonable calculation.
* Notes: (1) Changes in significant subsidiaries during the period under review: No
(Changes in specified subsidiaries accompanying changes to the scope of consolidation) New: - companies (Company name) - ; Excluded: - companies (Company name) -
(2) Changes in accounting policies, changes in accounting estimates and retrospective restatement 1) Changes in accounting policies due to the revision of accounting standards: Yes 2) Changes in accounting policies other than 1) above: No 3) Changes in accounting estimates: No 4) Retrospective restatement: No (3) Total number of issued shares (common stock) 1) Total number of issued shares at the end of the period (including treasury stock):
March 31, 2020: 22,579,700 shares March 31, 2019: 22,579,700 shares
2) Total number of treasury stock at the end of the period:
March 31, 2020: 1,951,360 shares March 31, 2019: 2,091,335 shares
3) Average number of shares during the period:
Fiscal year ended March 31, 2020: 20,504,537 shares Fiscal year ended March 31, 2019: 20,488,405 shares
Note: The number of treasury stock eliminated when calculating the total number of treasury stock at the end of the period and the average number of shares during the period includes the Company’s shares held by Trust & Custody Services Bank, Ltd. (Trust E Account) as trust assets for the stock benefit trust system.
* These consolidated financial results are outside the scope of audit by certified public accountants or audit
corporations.

* Explanation of the proper use of financial results forecasts and other notes Forward-looking statements in this document, including financial results forecasts, are based on information available to the Company at the time of publication. Actual business results, etc., may differ significantly due to various factors. For matters regarding financial results forecasts, please refer to “1. Overview of Business Results, etc. (4) Future Outlook” on page 4 of the Appendix to this report.
(Method to obtain supplementary briefing material on annual financial results) Supplementary briefing material on annual financial results will be posted on the Company’s website in the near future.
(Annual financial results briefing session)
Although annual financial results briefing session for institutional investors and analysts was planned to be held, the Company decided to cancel it from the view point of preventing the spread of COVID-19. Video recording of annual financial results briefing will be posted on the Company’s website.
1
Table of Contents 1. Overview of Business Results, etc. ................................................................................................................ 2
(1) Overview of Business Results for the Period Under Review ..................................................................... 2 (2) Overview of Financial Position for the Period Under Review ................................................................... 3 (3) Overview of Cash Flows for the Period Under Review ............................................................................. 3 (4) Future Outlook ........................................................................................................................................... 4
2. Basic Stance Concerning Choice of Accounting Standards ........................................................................... 5 3. Consolidated Financial Statements and Primary Notes .................................................................................... 6
(1) Consolidated Balance Sheets ...................................................................................................................... 6 (2) Consolidated Statements of Income and Comprehensive Income ............................................................. 8 (3) Consolidated Statements of Changes in Net Assets ................................................................................. 10 (4) Consolidated Statements of Cash Flows .................................................................................................. 12 (5) Notes to Consolidated Financial Statements ............................................................................................ 14
(Notes on going concern assumption) ...................................................................................................... 14 (Changes in accounting policies) ............................................................................................................. 14 (Segment information, etc.) ...................................................................................................................... 15 (Per share information) ............................................................................................................................ 19 (Significant subsequent events) ................................................................................................................ 20
4. Others ........................................................................................................................................................... 20
Changes in Officers and Directors ............................................................................................................... 20
2
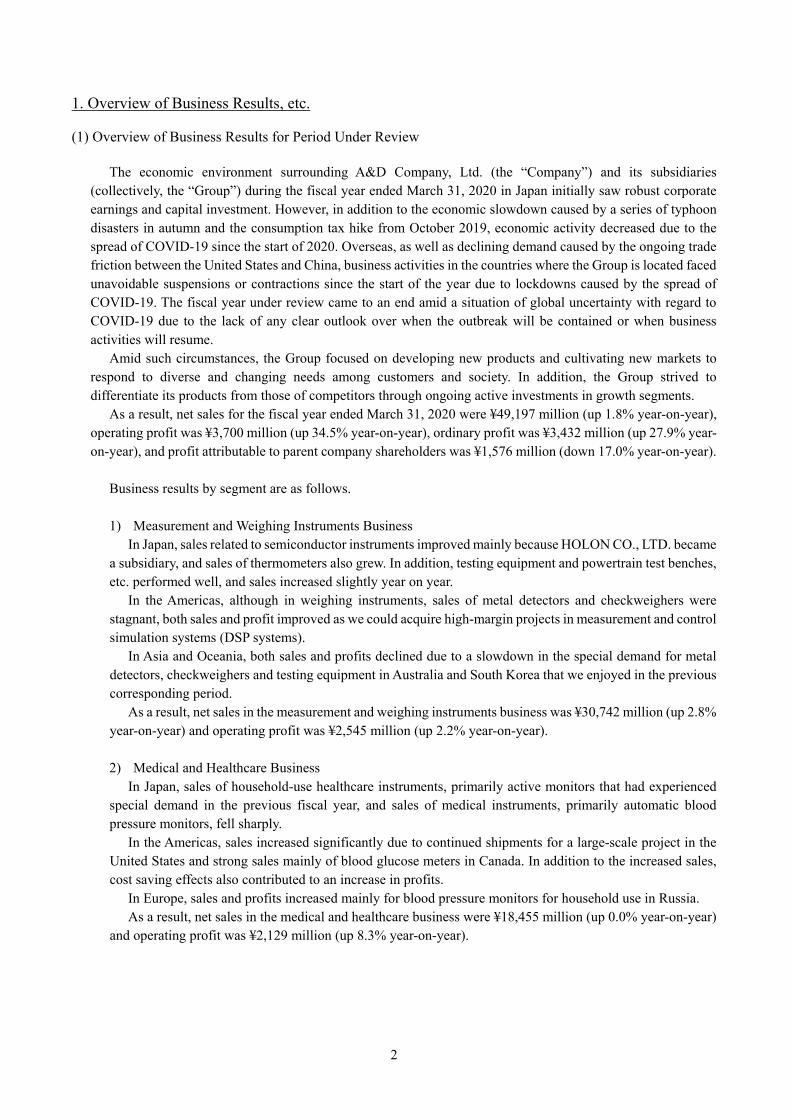
1. Overview of Business Results, etc. (1) Overview of Business Results for Period Under Review
The economic environment surrounding A&D Company, Ltd. (the “Company”) and its subsidiaries (collectively, the “Group”) during the fiscal year ended March 31, 2020 in Japan initially saw robust corporate earnings and capital investment. However, in addition to the economic slowdown caused by a series of typhoon disasters in autumn and the consumption tax hike from October 2019, economic activity decreased due to the spread of COVID-19 since the start of 2020. Overseas, as well as declining demand caused by the ongoing trade friction between the United States and China, business activities in the countries where the Group is located faced unavoidable suspensions or contractions since the start of the year due to lockdowns caused by the spread of COVID-19. The fiscal year under review came to an end amid a situation of global uncertainty with regard to COVID-19 due to the lack of any clear outlook over when the outbreak will be contained or when business activities will resume.
Amid such circumstances, the Group focused on developing new products and cultivating new markets to respond to diverse and changing needs among customers and society. In addition, the Group strived to differentiate its products from those of competitors through ongoing active investments in growth segments.
As a result, net sales for the fiscal year ended March 31, 2020 were ¥49,197 million (up 1.8% year-on-year), operating profit was ¥3,700 million (up 34.5% year-on-year), ordinary profit was ¥3,432 million (up 27.9% year-on-year), and profit attributable to parent company shareholders was ¥1,576 million (down 17.0% year-on-year).
Business results by segment are as follows. 1) Measurement and Weighing Instruments Business
In Japan, sales related to semiconductor instruments improved mainly because HOLON CO., LTD. became a subsidiary, and sales of thermometers also grew. In addition, testing equipment and powertrain test benches, etc. performed well, and sales increased slightly year on year.
In the Americas, although in weighing instruments, sales of metal detectors and checkweighers were stagnant, both sales and profit improved as we could acquire high-margin projects in measurement and control simulation systems (DSP systems).
In Asia and Oceania, both sales and profits declined due to a slowdown in the special demand for metal detectors, checkweighers and testing equipment in Australia and South Korea that we enjoyed in the previous corresponding period.
As a result, net sales in the measurement and weighing instruments business was ¥30,742 million (up 2.8% year-on-year) and operating profit was ¥2,545 million (up 2.2% year-on-year). 2) Medical and Healthcare Business
In Japan, sales of household-use healthcare instruments, primarily active monitors that had experienced special demand in the previous fiscal year, and sales of medical instruments, primarily automatic blood pressure monitors, fell sharply.
In the Americas, sales increased significantly due to continued shipments for a large-scale project in the United States and strong sales mainly of blood glucose meters in Canada. In addition to the increased sales, cost saving effects also contributed to an increase in profits.
In Europe, sales and profits increased mainly for blood pressure monitors for household use in Russia. As a result, net sales in the medical and healthcare business were ¥18,455 million (up 0.0% year-on-year)
and operating profit was ¥2,129 million (up 8.3% year-on-year).
3
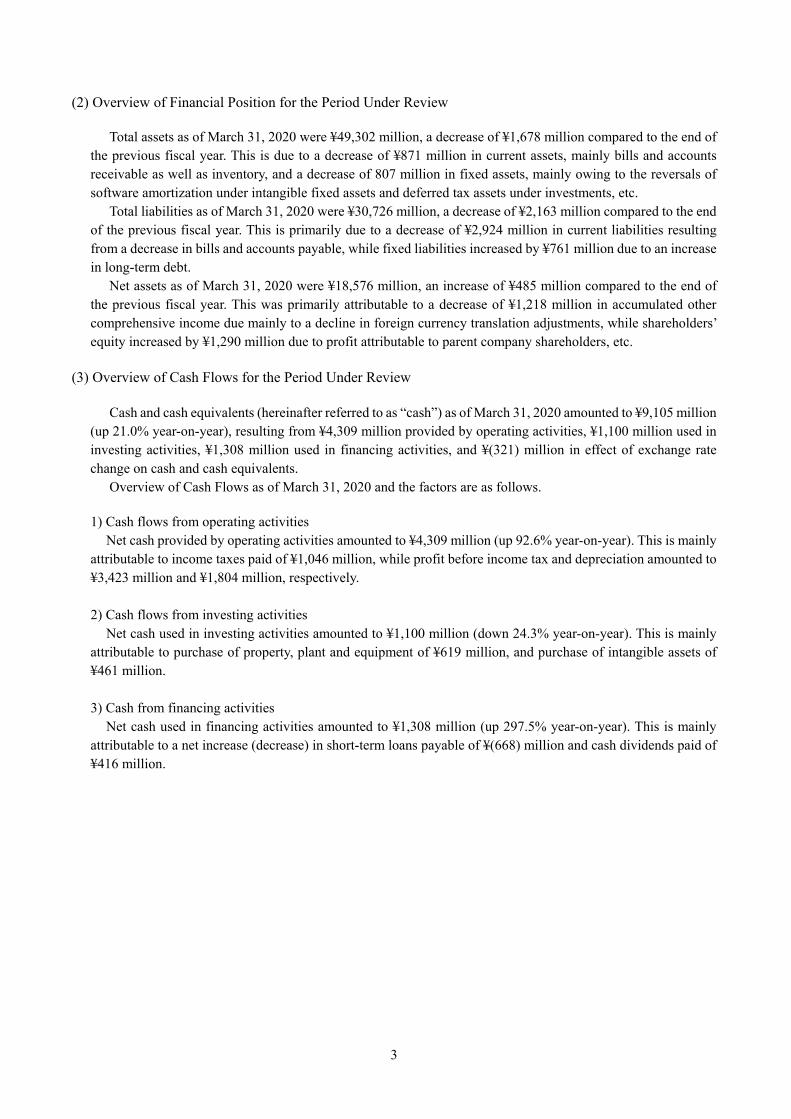
(2) Overview of Financial Position for the Period Under Review
Total assets as of March 31, 2020 were ¥49,302 million, a decrease of ¥1,678 million compared to the end of the previous fiscal year. This is due to a decrease of ¥871 million in current assets, mainly bills and accounts receivable as well as inventory, and a decrease of 807 million in fixed assets, mainly owing to the reversals of software amortization under intangible fixed assets and deferred tax assets under investments, etc.
Total liabilities as of March 31, 2020 were ¥30,726 million, a decrease of ¥2,163 million compared to the end of the previous fiscal year. This is primarily due to a decrease of ¥2,924 million in current liabilities resulting from a decrease in bills and accounts payable, while fixed liabilities increased by ¥761 million due to an increase in long-term debt.
Net assets as of March 31, 2020 were ¥18,576 million, an increase of ¥485 million compared to the end of the previous fiscal year. This was primarily attributable to a decrease of ¥1,218 million in accumulated other comprehensive income due mainly to a decline in foreign currency translation adjustments, while shareholders’ equity increased by ¥1,290 million due to profit attributable to parent company shareholders, etc.
(3) Overview of Cash Flows for the Period Under Review
Cash and cash equivalents (hereinafter referred to as “cash”) as of March 31, 2020 amounted to ¥9,105 million (up 21.0% year-on-year), resulting from ¥4,309 million provided by operating activities, ¥1,100 million used in investing activities, ¥1,308 million used in financing activities, and ¥(321) million in effect of exchange rate change on cash and cash equivalents.
Overview of Cash Flows as of March 31, 2020 and the factors are as follows.
1) Cash flows from operating activities Net cash provided by operating activities amounted to ¥4,309 million (up 92.6% year-on-year). This is mainly
attributable to income taxes paid of ¥1,046 million, while profit before income tax and depreciation amounted to ¥3,423 million and ¥1,804 million, respectively. 2) Cash flows from investing activities
Net cash used in investing activities amounted to ¥1,100 million (down 24.3% year-on-year). This is mainly attributable to purchase of property, plant and equipment of ¥619 million, and purchase of intangible assets of ¥461 million. 3) Cash from financing activities
Net cash used in financing activities amounted to ¥1,308 million (up 297.5% year-on-year). This is mainly attributable to a net increase (decrease) in short-term loans payable of ¥(668) million and cash dividends paid of ¥416 million.
4
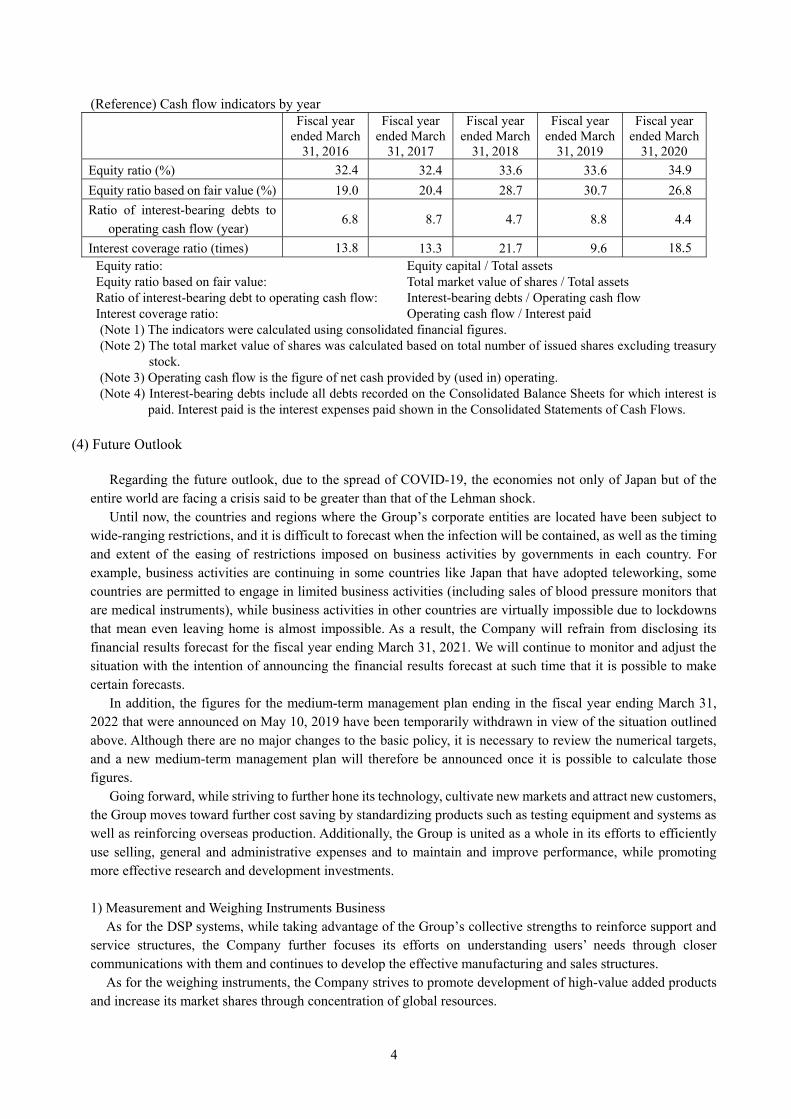
(Reference) Cash flow indicators by year
Fiscal year
ended March 31, 2016
Fiscal year ended March
31, 2017
Fiscal year ended March
31, 2018
Fiscal year ended March
31, 2019
Fiscal year ended March
31, 2020
Equity ratio (%) 32.4 32.4 33.6 33.6 34.9
Equity ratio based on fair value (%) 19.0 20.4 28.7 30.7 26.8
Ratio of interest-bearing debts to
operating cash flow (year) 6.8 8.7 4.7 8.8 4.4
Interest coverage ratio (times) 13.8 13.3 21.7 9.6 18.5 Equity ratio: Equity capital / Total assets Equity ratio based on fair value: Total market value of shares / Total assets Ratio of interest-bearing debt to operating cash flow: Interest-bearing debts / Operating cash flow Interest coverage ratio: Operating cash flow / Interest paid
(Note 1) The indicators were calculated using consolidated financial figures. (Note 2) The total market value of shares was calculated based on total number of issued shares excluding treasury
stock. (Note 3) Operating cash flow is the figure of net cash provided by (used in) operating. (Note 4) Interest-bearing debts include all debts recorded on the Consolidated Balance Sheets for which interest is
paid. Interest paid is the interest expenses paid shown in the Consolidated Statements of Cash Flows. (4) Future Outlook
Regarding the future outlook, due to the spread of COVID-19, the economies not only of Japan but of the entire world are facing a crisis said to be greater than that of the Lehman shock.
Until now, the countries and regions where the Group’s corporate entities are located have been subject to wide-ranging restrictions, and it is difficult to forecast when the infection will be contained, as well as the timing and extent of the easing of restrictions imposed on business activities by governments in each country. For example, business activities are continuing in some countries like Japan that have adopted teleworking, some countries are permitted to engage in limited business activities (including sales of blood pressure monitors that are medical instruments), while business activities in other countries are virtually impossible due to lockdowns that mean even leaving home is almost impossible. As a result, the Company will refrain from disclosing its financial results forecast for the fiscal year ending March 31, 2021. We will continue to monitor and adjust the situation with the intention of announcing the financial results forecast at such time that it is possible to make certain forecasts.
In addition, the figures for the medium-term management plan ending in the fiscal year ending March 31, 2022 that were announced on May 10, 2019 have been temporarily withdrawn in view of the situation outlined above. Although there are no major changes to the basic policy, it is necessary to review the numerical targets, and a new medium-term management plan will therefore be announced once it is possible to calculate those figures.
Going forward, while striving to further hone its technology, cultivate new markets and attract new customers, the Group moves toward further cost saving by standardizing products such as testing equipment and systems as well as reinforcing overseas production. Additionally, the Group is united as a whole in its efforts to efficiently use selling, general and administrative expenses and to maintain and improve performance, while promoting more effective research and development investments. 1) Measurement and Weighing Instruments Business
As for the DSP systems, while taking advantage of the Group’s collective strengths to reinforce support and service structures, the Company further focuses its efforts on understanding users’ needs through closer communications with them and continues to develop the effective manufacturing and sales structures.
As for the weighing instruments, the Company strives to promote development of high-value added products and increase its market shares through concentration of global resources.
5
In the electron beam related business, our sight is set on continuing to improve its operating performance in the semiconductor market by generating synergy effects between the Company and its subsidiary, HOLON CO., LTD. 2) Medical and Healthcare Business
As for the weighing instruments and blood monitors for professional use and healthcare instruments for household use, the Company makes efforts to grasp and respond to users’ needs from the global viewpoint, continuing to offer the products that work hand-in-hand with healthcare management services and expand such product lines.
As for the healthcare instruments, the Company strives to further improve quality and productivity, as well as strengthen its international competitiveness.
2. Basic Stance Concerning Choice of Accounting Standards
Regarding the timing of application of International Financial Reporting Standards (IFRS), the Group continues discussions in consideration of the several situations.
6
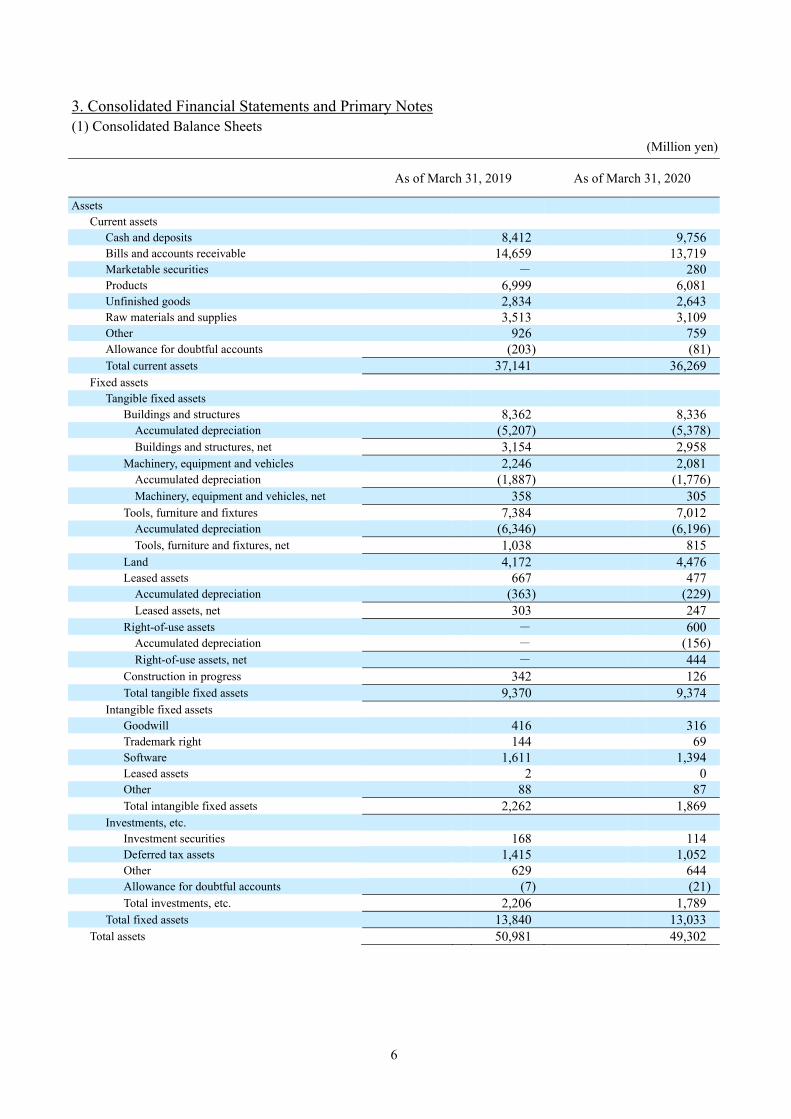
3. Consolidated Financial Statements and Primary Notes (1) Consolidated Balance Sheets
(Million yen)
As of March 31, 2019 As of March 31, 2020
Assets Current assets
Cash and deposits 8,412 9,756 Bills and accounts receivable 14,659 13,719 Marketable securities - 280 Products 6,999 6,081 Unfinished goods 2,834 2,643 Raw materials and supplies 3,513 3,109 Other 926 759 Allowance for doubtful accounts (203) (81) Total current assets 37,141 36,269
Fixed assets Tangible fixed assets
Buildings and structures 8,362 8,336 Accumulated depreciation (5,207) (5,378) Buildings and structures, net 3,154 2,958
Machinery, equipment and vehicles 2,246 2,081 Accumulated depreciation (1,887) (1,776) Machinery, equipment and vehicles, net 358 305
Tools, furniture and fixtures 7,384 7,012 Accumulated depreciation (6,346) (6,196) Tools, furniture and fixtures, net 1,038 815
Land 4,172 4,476 Leased assets 667 477
Accumulated depreciation (363) (229) Leased assets, net 303 247
Right-of-use assets - 600 Accumulated depreciation - (156) Right-of-use assets, net - 444
Construction in progress 342 126 Total tangible fixed assets 9,370 9,374
Intangible fixed assets Goodwill 416 316 Trademark right 144 69 Software 1,611 1,394 Leased assets 2 0 Other 88 87 Total intangible fixed assets 2,262 1,869
Investments, etc. Investment securities 168 114 Deferred tax assets 1,415 1,052 Other 629 644 Allowance for doubtful accounts (7) (21) Total investments, etc. 2,206 1,789
Total fixed assets 13,840 13,033 Total assets 50,981 49,302
7
(Million yen)
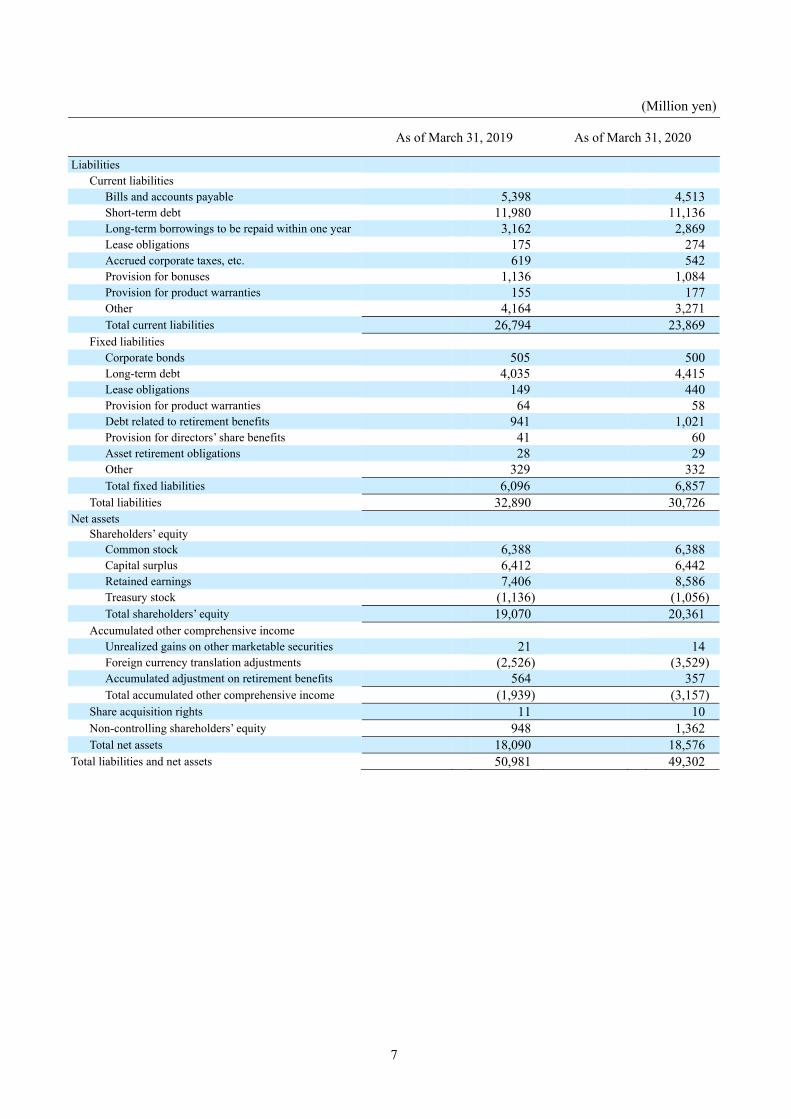
As of March 31, 2019 As of March 31, 2020
Liabilities Current liabilities
Bills and accounts payable 5,398 4,513 Short-term debt 11,980 11,136 Long-term borrowings to be repaid within one year 3,162 2,869 Lease obligations 175 274 Accrued corporate taxes, etc. 619 542 Provision for bonuses 1,136 1,084 Provision for product warranties 155 177 Other 4,164 3,271 Total current liabilities 26,794 23,869
Fixed liabilities Corporate bonds 505 500 Long-term debt 4,035 4,415 Lease obligations 149 440 Provision for product warranties 64 58 Debt related to retirement benefits 941 1,021 Provision for directors’ share benefits 41 60 Asset retirement obligations 28 29 Other 329 332 Total fixed liabilities 6,096 6,857
Total liabilities 32,890 30,726 Net assets
Shareholders’ equity Common stock 6,388 6,388 Capital surplus 6,412 6,442 Retained earnings 7,406 8,586 Treasury stock (1,136) (1,056) Total shareholders’ equity 19,070 20,361
Accumulated other comprehensive income Unrealized gains on other marketable securities 21 14 Foreign currency translation adjustments (2,526) (3,529) Accumulated adjustment on retirement benefits 564 357 Total accumulated other comprehensive income (1,939) (3,157)
Share acquisition rights 11 10 Non-controlling shareholders’ equity 948 1,362 Total net assets 18,090 18,576
Total liabilities and net assets 50,981 49,302
8
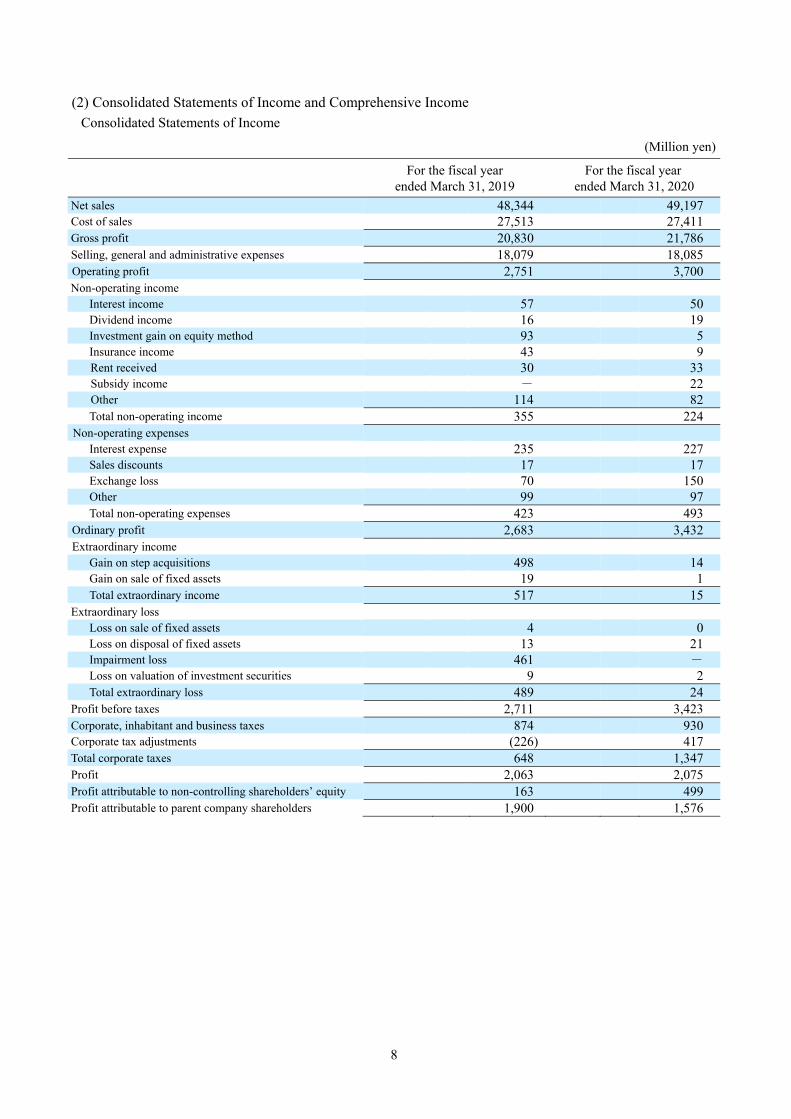
(2) Consolidated Statements of Income and Comprehensive Income Consolidated Statements of Income
(Million yen)
For the fiscal year
ended March 31, 2019 For the fiscal year
ended March 31, 2020
Net sales 48,344 49,197 Cost of sales 27,513 27,411 Gross profit 20,830 21,786 Selling, general and administrative expenses 18,079 18,085 Operating profit 2,751 3,700 Non-operating income
Interest income 57 50 Dividend income 16 19 Investment gain on equity method 93 5 Insurance income 43 9 Rent received 30 33 Subsidy income - 22 Other 114 82 Total non-operating income 355 224
Non-operating expenses Interest expense 235 227 Sales discounts 17 17 Exchange loss 70 150 Other 99 97 Total non-operating expenses 423 493
Ordinary profit 2,683 3,432 Extraordinary income
Gain on step acquisitions 498 14 Gain on sale of fixed assets 19 1 Total extraordinary income 517 15
Extraordinary loss Loss on sale of fixed assets 4 0 Loss on disposal of fixed assets 13 21 Impairment loss 461 - Loss on valuation of investment securities 9 2 Total extraordinary loss 489 24
Profit before taxes 2,711 3,423 Corporate, inhabitant and business taxes 874 930 Corporate tax adjustments (226) 417 Total corporate taxes 648 1,347 Profit 2,063 2,075 Profit attributable to non-controlling shareholders’ equity 163 499 Profit attributable to parent company shareholders 1,900 1,576
9
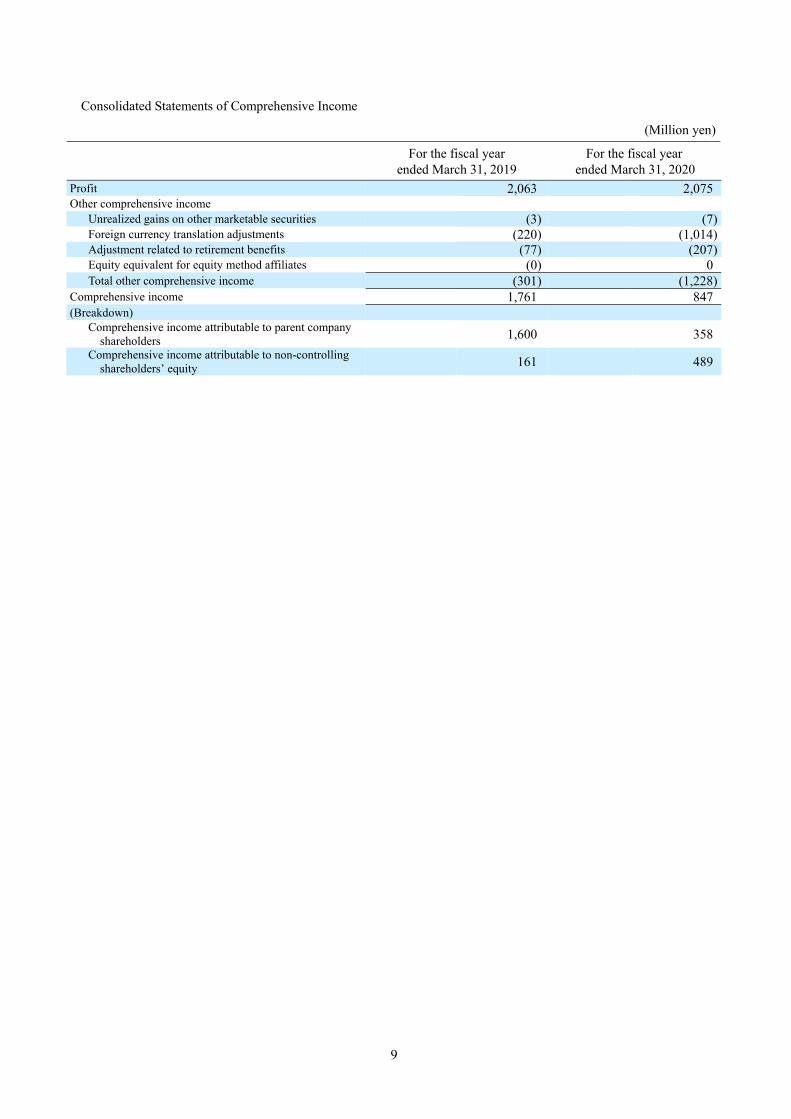
Consolidated Statements of Comprehensive Income
(Million yen)
For the fiscal year
ended March 31, 2019 For the fiscal year
ended March 31, 2020
Profit 2,063 2,075 Other comprehensive income
Unrealized gains on other marketable securities (3) (7) Foreign currency translation adjustments (220) (1,014) Adjustment related to retirement benefits (77) (207) Equity equivalent for equity method affiliates (0) 0 Total other comprehensive income (301) (1,228)
Comprehensive income 1,761 847 (Breakdown)
Comprehensive income attributable to parent company shareholders
1,600 358
Comprehensive income attributable to non-controlling shareholders’ equity
161 489
10
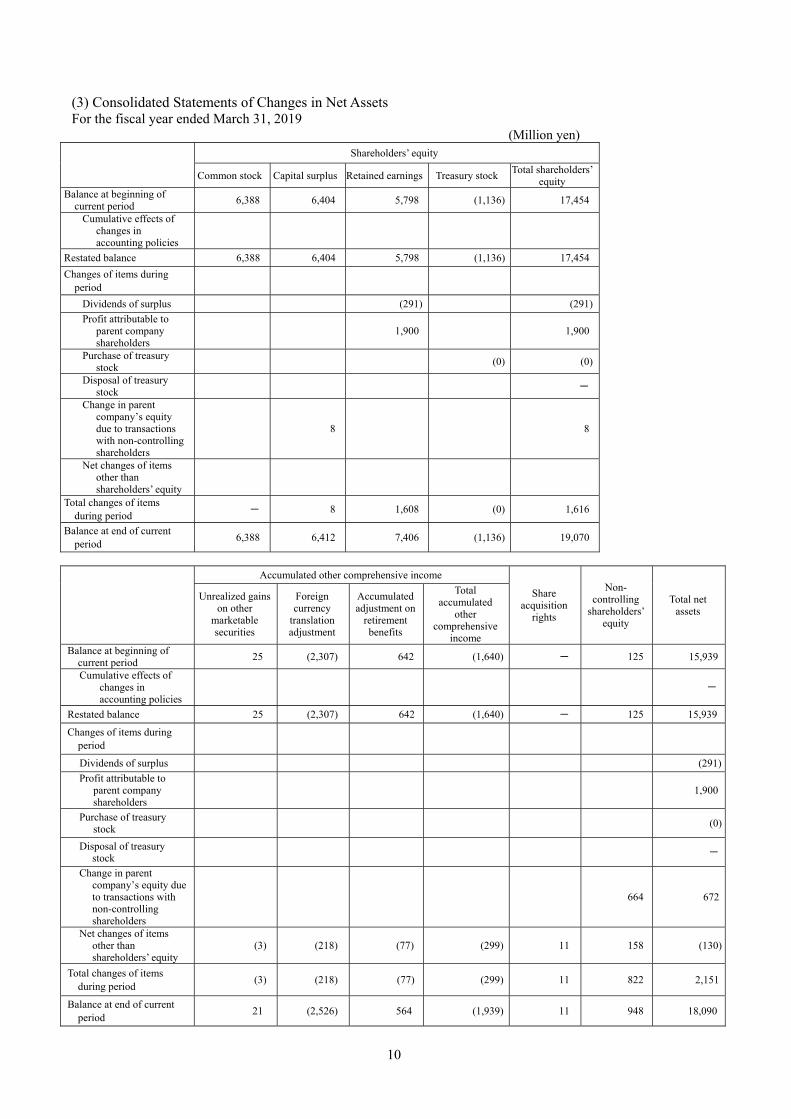
(3) Consolidated Statements of Changes in Net Assets For the fiscal year ended March 31, 2019
(Million yen) Shareholders’ equity
Common stock Capital surplus Retained earnings Treasury stock Total shareholders’
equity Balance at beginning of
current period 6,388 6,404 5,798 (1,136) 17,454
Cumulative effects of changes in accounting policies
Restated balance 6,388 6,404 5,798 (1,136) 17,454
Changes of items during period
Dividends of surplus (291) (291)
Profit attributable to parent company shareholders
1,900 1,900
Purchase of treasury stock
(0) (0)
Disposal of treasury stock
-
Change in parent company’s equity due to transactions with non-controlling shareholders
8 8
Net changes of items other than shareholders’ equity
Total changes of items during period
- 8 1,608 (0) 1,616
Balance at end of current period
6,388 6,412 7,406 (1,136) 19,070
Accumulated other comprehensive income
Share acquisition
rights
Non-controlling
shareholders’ equity
Total net assets
Unrealized gains on other
marketable securities
Foreign currency
translation adjustment
Accumulated adjustment on
retirement benefits
Total accumulated
other comprehensive
income Balance at beginning of
current period 25 (2,307) 642 (1,640) - 125 15,939
Cumulative effects of changes in accounting policies
-
Restated balance 25 (2,307) 642 (1,640) - 125 15,939
Changes of items during period
Dividends of surplus (291)
Profit attributable to parent company shareholders
1,900
Purchase of treasury stock
(0)
Disposal of treasury stock
-
Change in parent company’s equity due to transactions with non-controlling shareholders
664 672
Net changes of items other than shareholders’ equity
(3) (218) (77) (299) 11 158 (130)
Total changes of items during period
(3) (218) (77) (299) 11 822 2,151
Balance at end of current period
21 (2,526) 564 (1,939) 11 948 18,090
11
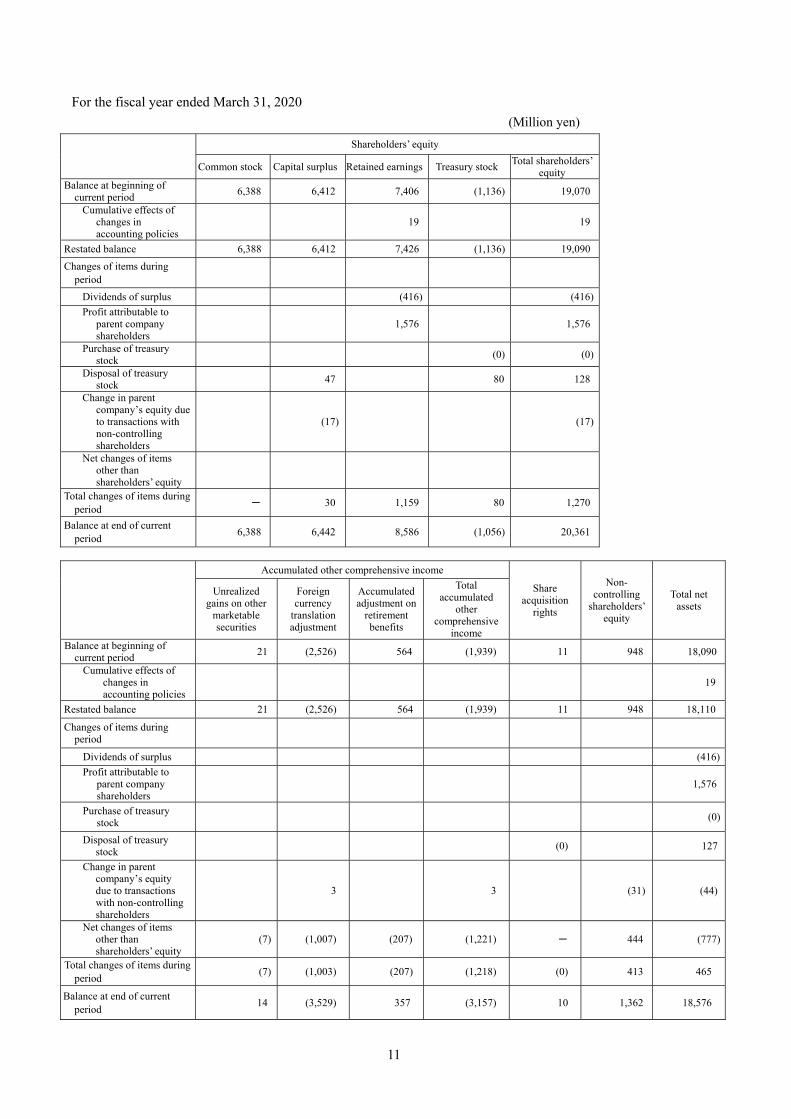
For the fiscal year ended March 31, 2020 (Million yen)
Shareholders’ equity
Common stock Capital surplus Retained earnings Treasury stock Total shareholders’
equity Balance at beginning of
current period 6,388 6,412 7,406 (1,136) 19,070
Cumulative effects of changes in accounting policies
19 19
Restated balance 6,388 6,412 7,426 (1,136) 19,090
Changes of items during period
Dividends of surplus (416) (416)
Profit attributable to parent company shareholders
1,576 1,576
Purchase of treasury stock
(0) (0)
Disposal of treasury stock
47 80 128
Change in parent company’s equity due to transactions with non-controlling shareholders
(17) (17)
Net changes of items other than shareholders’ equity
Total changes of items during period
- 30 1,159 80 1,270
Balance at end of current period
6,388 6,442 8,586 (1,056) 20,361
Accumulated other comprehensive income
Share acquisition
rights
Non-controlling
shareholders’ equity
Total net assets
Unrealized gains on other
marketable securities
Foreign currency
translation adjustment
Accumulated adjustment on
retirement benefits
Total accumulated
other comprehensive
income Balance at beginning of
current period 21 (2,526) 564 (1,939) 11 948 18,090
Cumulative effects of changes in accounting policies
19
Restated balance 21 (2,526) 564 (1,939) 11 948 18,110
Changes of items during period
Dividends of surplus (416)
Profit attributable to parent company shareholders
1,576
Purchase of treasury stock
(0)
Disposal of treasury stock
(0) 127
Change in parent company’s equity due to transactions with non-controlling shareholders
3 3 (31) (44)
Net changes of items other than shareholders’ equity
(7) (1,007) (207) (1,221) - 444 (777)
Total changes of items during period
(7) (1,003) (207) (1,218) (0) 413 465
Balance at end of current period
14 (3,529) 357 (3,157) 10 1,362 18,576
12
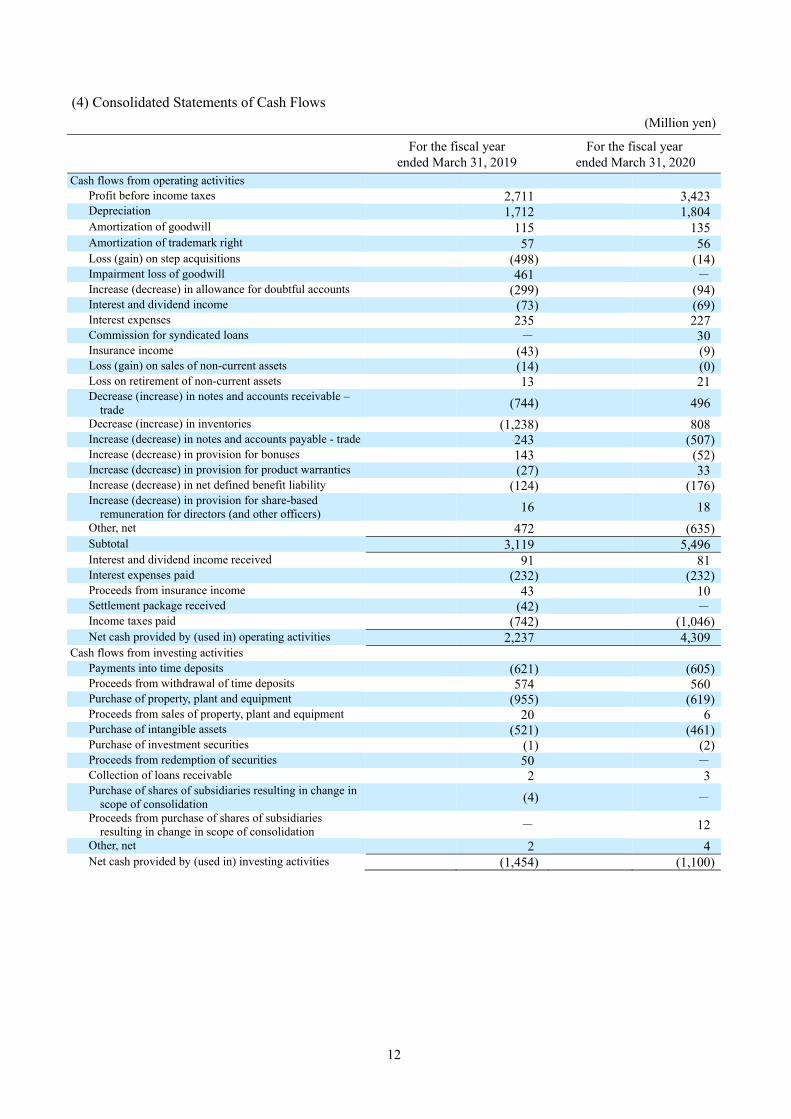
(4) Consolidated Statements of Cash Flows (Million yen)
For the fiscal year
ended March 31, 2019 For the fiscal year
ended March 31, 2020 Cash flows from operating activities
Profit before income taxes 2,711 3,423 Depreciation 1,712 1,804 Amortization of goodwill 115 135 Amortization of trademark right 57 56 Loss (gain) on step acquisitions (498) (14) Impairment loss of goodwill 461 - Increase (decrease) in allowance for doubtful accounts (299) (94) Interest and dividend income (73) (69) Interest expenses 235 227 Commission for syndicated loans - 30 Insurance income (43) (9) Loss (gain) on sales of non-current assets (14) (0) Loss on retirement of non-current assets 13 21 Decrease (increase) in notes and accounts receivable –
trade (744) 496
Decrease (increase) in inventories (1,238) 808 Increase (decrease) in notes and accounts payable - trade 243 (507) Increase (decrease) in provision for bonuses 143 (52) Increase (decrease) in provision for product warranties (27) 33 Increase (decrease) in net defined benefit liability (124) (176) Increase (decrease) in provision for share-based
remuneration for directors (and other officers) 16 18
Other, net 472 (635) Subtotal 3,119 5,496 Interest and dividend income received 91 81 Interest expenses paid (232) (232) Proceeds from insurance income 43 10 Settlement package received (42) - Income taxes paid (742) (1,046) Net cash provided by (used in) operating activities 2,237 4,309
Cash flows from investing activities Payments into time deposits (621) (605) Proceeds from withdrawal of time deposits 574 560 Purchase of property, plant and equipment (955) (619) Proceeds from sales of property, plant and equipment 20 6 Purchase of intangible assets (521) (461) Purchase of investment securities (1) (2) Proceeds from redemption of securities 50 - Collection of loans receivable 2 3 Purchase of shares of subsidiaries resulting in change in
scope of consolidation (4) -
Proceeds from purchase of shares of subsidiaries resulting in change in scope of consolidation
- 12
Other, net 2 4 Net cash provided by (used in) investing activities (1,454) (1,100)
13
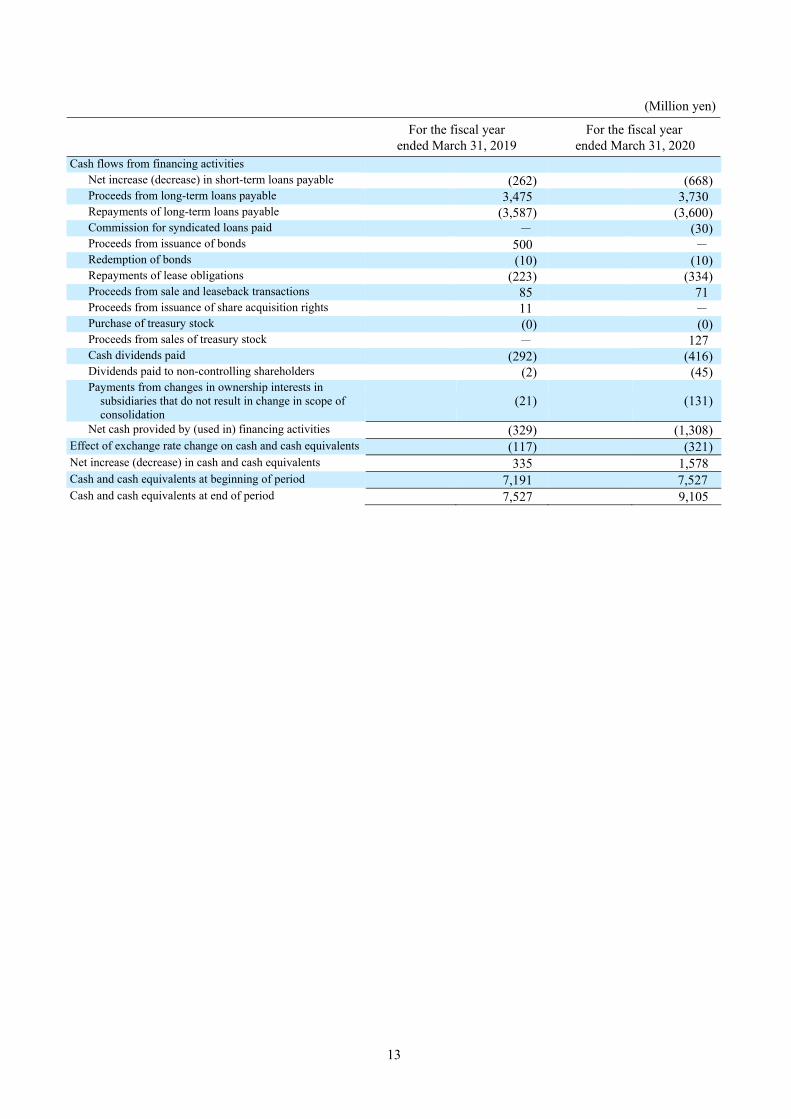
(Million yen)
For the fiscal year
ended March 31, 2019 For the fiscal year
ended March 31, 2020 Cash flows from financing activities
Net increase (decrease) in short-term loans payable (262) (668) Proceeds from long-term loans payable 3,475 3,730 Repayments of long-term loans payable (3,587) (3,600) Commission for syndicated loans paid - (30) Proceeds from issuance of bonds 500 - Redemption of bonds (10) (10) Repayments of lease obligations (223) (334) Proceeds from sale and leaseback transactions 85 71 Proceeds from issuance of share acquisition rights 11 - Purchase of treasury stock (0) (0) Proceeds from sales of treasury stock - 127 Cash dividends paid (292) (416) Dividends paid to non-controlling shareholders (2) (45) Payments from changes in ownership interests in
subsidiaries that do not result in change in scope of consolidation
(21) (131)
Net cash provided by (used in) financing activities (329) (1,308) Effect of exchange rate change on cash and cash equivalents (117) (321) Net increase (decrease) in cash and cash equivalents 335 1,578 Cash and cash equivalents at beginning of period 7,191 7,527 Cash and cash equivalents at end of period 7,527 9,105
14
(5) Notes to Consolidated Financial Statements
(Notes on going concern assumption)
Not applicable.
(Changes in accounting policies)
(Application of IFRS 16 “Leases”)
Subsidiaries applying International Financial Reporting Standards have applied International Financial Reporting
Standards 16 “Leases” (hereinafter referred to as “IFRS 16”) from the beginning of the fiscal year under review.
As a result, with regard to lease transactions as lessee, in principle, for all leases, right-of-use assets and lease
obligations are recognized, and depreciation of the right-of-use assets and interest expenses on the lease
obligations are recorded.
Regarding the application of IFRS 16, a method recognized as a transitional treatment is applied, in which the
cumulative impact of applying this standard is recognized at the date of initial application.
In line with the application of this standard, as of the beginning of the fiscal year under review, right-of-use
assets under tangible fixed assets and the total amount of lease obligations included in current liabilities and fixed
liabilities increased by ¥569 million, respectively.
The impact of this change on the profit and loss of the fiscal year ended March 31, 2020 is immaterial.
(Application of ASC 606 “Revenue from Contracts with Customers”)
Starting from the beginning of the consolidated fiscal year under review, ASC 606 “Revenue from Contracts
with Customers” has been applied to the Company’s subsidiaries that have adopted the US GAAP.
ASC 606 requires such subsidiaries to recognize revenue when promised goods or services are transferred to
customers in an amount reflecting consideration to which they expect to be entitled to in exchange for those goods
or services.
Regarding the application of this accounting standard, the Company adopts a method whereby the cumulative
impact of applying this accounting standard is recognized at the date of initial application, and adjustments are
made to the balance of retained earnings at the beginning of the consolidated fiscal year under review in
accordance with transitional procedures.
In accordance with the application of this standard, the balance of retained earnings at the beginning of the
consolidated fiscal year under review increased by ¥19 million. In addition, in the consolidated fiscal year under
review, net sales, cost of sales, and selling, general and administrative expenses decreased by ¥221 million, ¥181
million, and ¥2 million, respectively, while operating profit, ordinary profit, and profit before income taxes each
decreased by ¥37 million.
The impact on net assets per share, basic earnings per share, and diluted earnings per share of the fiscal year
ended March 31, 2020 is immaterial.
15
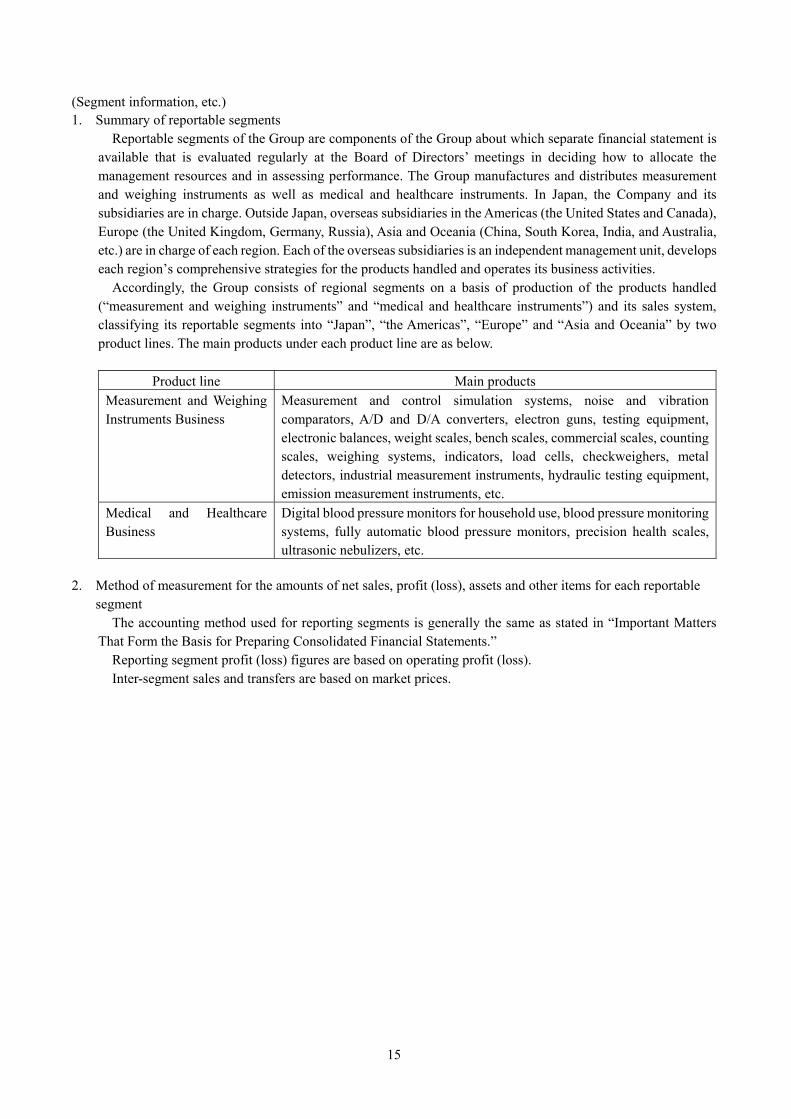
(Segment information, etc.) 1. Summary of reportable segments
Reportable segments of the Group are components of the Group about which separate financial statement is available that is evaluated regularly at the Board of Directors’ meetings in deciding how to allocate the management resources and in assessing performance. The Group manufactures and distributes measurement and weighing instruments as well as medical and healthcare instruments. In Japan, the Company and its subsidiaries are in charge. Outside Japan, overseas subsidiaries in the Americas (the United States and Canada), Europe (the United Kingdom, Germany, Russia), Asia and Oceania (China, South Korea, India, and Australia, etc.) are in charge of each region. Each of the overseas subsidiaries is an independent management unit, develops each region’s comprehensive strategies for the products handled and operates its business activities.
Accordingly, the Group consists of regional segments on a basis of production of the products handled (“measurement and weighing instruments” and “medical and healthcare instruments”) and its sales system, classifying its reportable segments into “Japan”, “the Americas”, “Europe” and “Asia and Oceania” by two product lines. The main products under each product line are as below.
Product line Main products
Measurement and Weighing Instruments Business
Measurement and control simulation systems, noise and vibration comparators, A/D and D/A converters, electron guns, testing equipment, electronic balances, weight scales, bench scales, commercial scales, counting scales, weighing systems, indicators, load cells, checkweighers, metal detectors, industrial measurement instruments, hydraulic testing equipment, emission measurement instruments, etc.
Medical and Healthcare Business
Digital blood pressure monitors for household use, blood pressure monitoring systems, fully automatic blood pressure monitors, precision health scales, ultrasonic nebulizers, etc.
2. Method of measurement for the amounts of net sales, profit (loss), assets and other items for each reportable
segment The accounting method used for reporting segments is generally the same as stated in “Important Matters
That Form the Basis for Preparing Consolidated Financial Statements.” Reporting segment profit (loss) figures are based on operating profit (loss). Inter-segment sales and transfers are based on market prices.
16
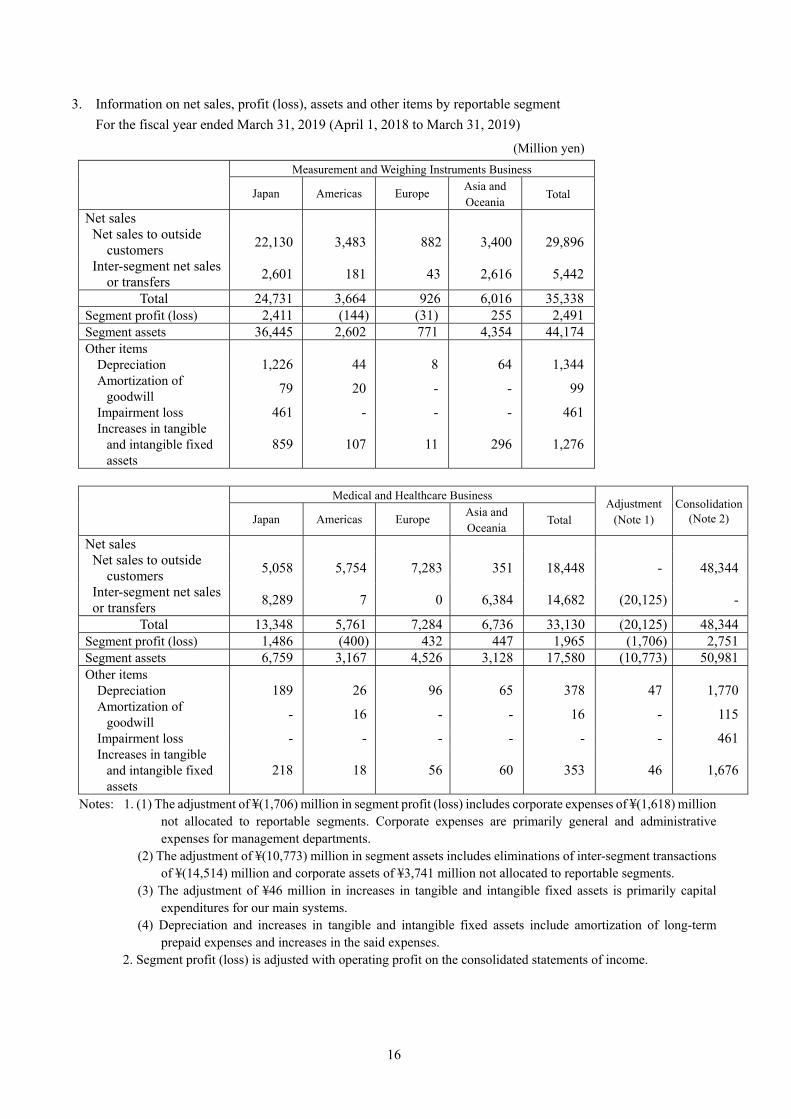
3. Information on net sales, profit (loss), assets and other items by reportable segment
For the fiscal year ended March 31, 2019 (April 1, 2018 to March 31, 2019)
(Million yen)
Measurement and Weighing Instruments Business
Japan Americas Europe Asia and Oceania
Total
Net sales Net sales to outside
customers 22,130 3,483 882 3,400 29,896
Inter-segment net sales or transfers
2,601 181 43 2,616 5,442
Total 24,731 3,664 926 6,016 35,338 Segment profit (loss) 2,411 (144) (31) 255 2,491 Segment assets 36,445 2,602 771 4,354 44,174 Other items
Depreciation 1,226 44 8 64 1,344 Amortization of
goodwill 79 20 - - 99
Impairment loss 461 - - - 461 Increases in tangible
and intangible fixed assets
859
107 11 296 1,276
Medical and Healthcare Business
Adjustment (Note 1)
Consolidation (Note 2) Japan Americas Europe
Asia and Oceania
Total
Net sales Net sales to outside
customers 5,058 5,754 7,283 351 18,448 - 48,344
Inter-segment net sales or transfers
8,289 7 0 6,384 14,682 (20,125) -
Total 13,348 5,761 7,284 6,736 33,130 (20,125) 48,344 Segment profit (loss) 1,486 (400) 432 447 1,965 (1,706) 2,751 Segment assets 6,759 3,167 4,526 3,128 17,580 (10,773) 50,981 Other items
Depreciation 189 26 96 65 378 47 1,770 Amortization of
goodwill - 16 - - 16 - 115
Impairment loss - - - - - - 461 Increases in tangible
and intangible fixed assets
218 18 56 60 353 46 1,676
Notes: 1. (1) The adjustment of ¥(1,706) million in segment profit (loss) includes corporate expenses of ¥(1,618) million not allocated to reportable segments. Corporate expenses are primarily general and administrative expenses for management departments.
(2) The adjustment of ¥(10,773) million in segment assets includes eliminations of inter-segment transactions of ¥(14,514) million and corporate assets of ¥3,741 million not allocated to reportable segments.
(3) The adjustment of ¥46 million in increases in tangible and intangible fixed assets is primarily capital expenditures for our main systems.
(4) Depreciation and increases in tangible and intangible fixed assets include amortization of long-term prepaid expenses and increases in the said expenses.
2. Segment profit (loss) is adjusted with operating profit on the consolidated statements of income.
17
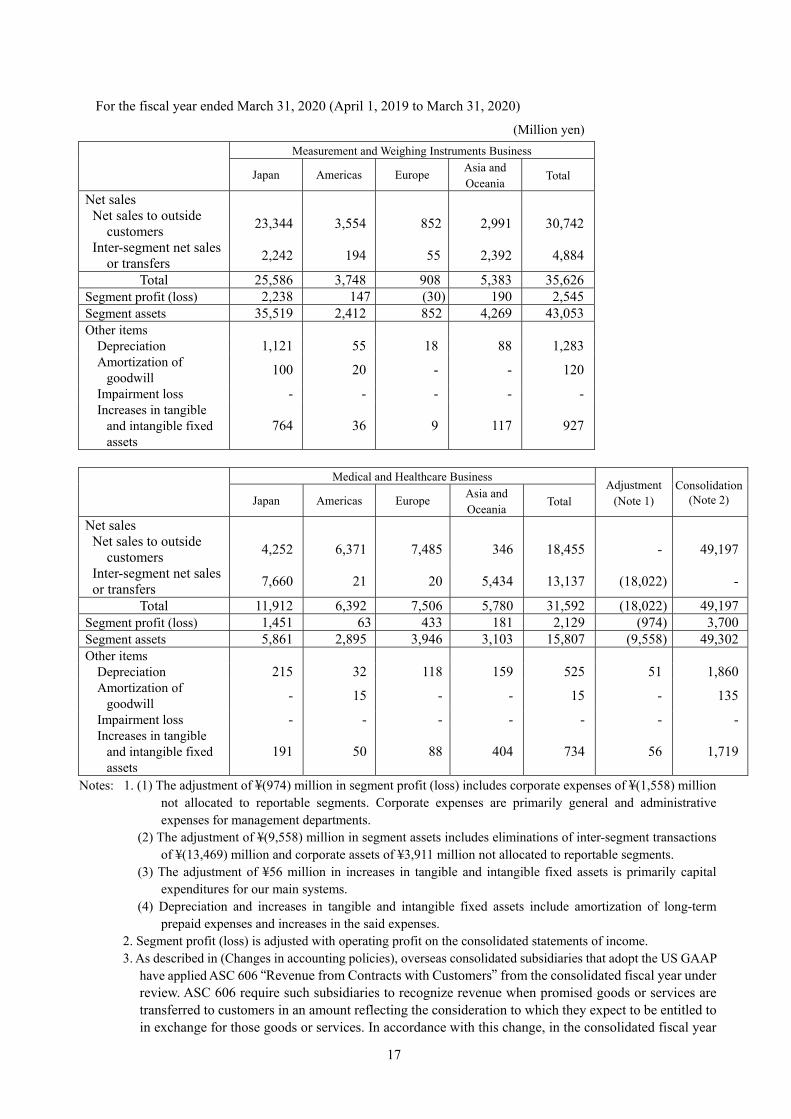
For the fiscal year ended March 31, 2020 (April 1, 2019 to March 31, 2020)
(Million yen)
Measurement and Weighing Instruments Business
Japan Americas Europe Asia and Oceania
Total
Net sales Net sales to outside
customers 23,344 3,554 852 2,991 30,742
Inter-segment net sales or transfers
2,242 194 55 2,392 4,884
Total 25,586 3,748 908 5,383 35,626 Segment profit (loss) 2,238 147 (30) 190 2,545 Segment assets 35,519 2,412 852 4,269 43,053 Other items
Depreciation 1,121 55 18 88 1,283 Amortization of
goodwill 100 20 - - 120
Impairment loss - - - - - Increases in tangible
and intangible fixed assets
764
36 9 117 927
Medical and Healthcare Business
Adjustment (Note 1)
Consolidation (Note 2) Japan Americas Europe
Asia and Oceania
Total
Net sales Net sales to outside
customers 4,252 6,371 7,485 346 18,455 - 49,197
Inter-segment net sales or transfers
7,660 21 20 5,434 13,137 (18,022) -
Total 11,912 6,392 7,506 5,780 31,592 (18,022) 49,197 Segment profit (loss) 1,451 63 433 181 2,129 (974) 3,700 Segment assets 5,861 2,895 3,946 3,103 15,807 (9,558) 49,302 Other items
Depreciation 215 32 118 159 525 51 1,860 Amortization of
goodwill - 15 - - 15 - 135
Impairment loss - - - - - - - Increases in tangible
and intangible fixed assets
191 50 88 404 734 56 1,719
Notes: 1. (1) The adjustment of ¥(974) million in segment profit (loss) includes corporate expenses of ¥(1,558) million not allocated to reportable segments. Corporate expenses are primarily general and administrative expenses for management departments.
(2) The adjustment of ¥(9,558) million in segment assets includes eliminations of inter-segment transactions of ¥(13,469) million and corporate assets of ¥3,911 million not allocated to reportable segments.
(3) The adjustment of ¥56 million in increases in tangible and intangible fixed assets is primarily capital expenditures for our main systems.
(4) Depreciation and increases in tangible and intangible fixed assets include amortization of long-term prepaid expenses and increases in the said expenses.
2. Segment profit (loss) is adjusted with operating profit on the consolidated statements of income. 3. As described in (Changes in accounting policies), overseas consolidated subsidiaries that adopt the US GAAP
have applied ASC 606 “Revenue from Contracts with Customers” from the consolidated fiscal year under review. ASC 606 require such subsidiaries to recognize revenue when promised goods or services are transferred to customers in an amount reflecting the consideration to which they expect to be entitled to in exchange for those goods or services. In accordance with this change, in the consolidated fiscal year

18
under review, net sales and segment profit in the Measurement and Weighing Instruments Business in Americas decreased by ¥161 million and ¥20 million, respectively, and net sales and segment profit in the Medical and Healthcare Business in Americas decreased by ¥60 million and ¥16 million, respectively.
19
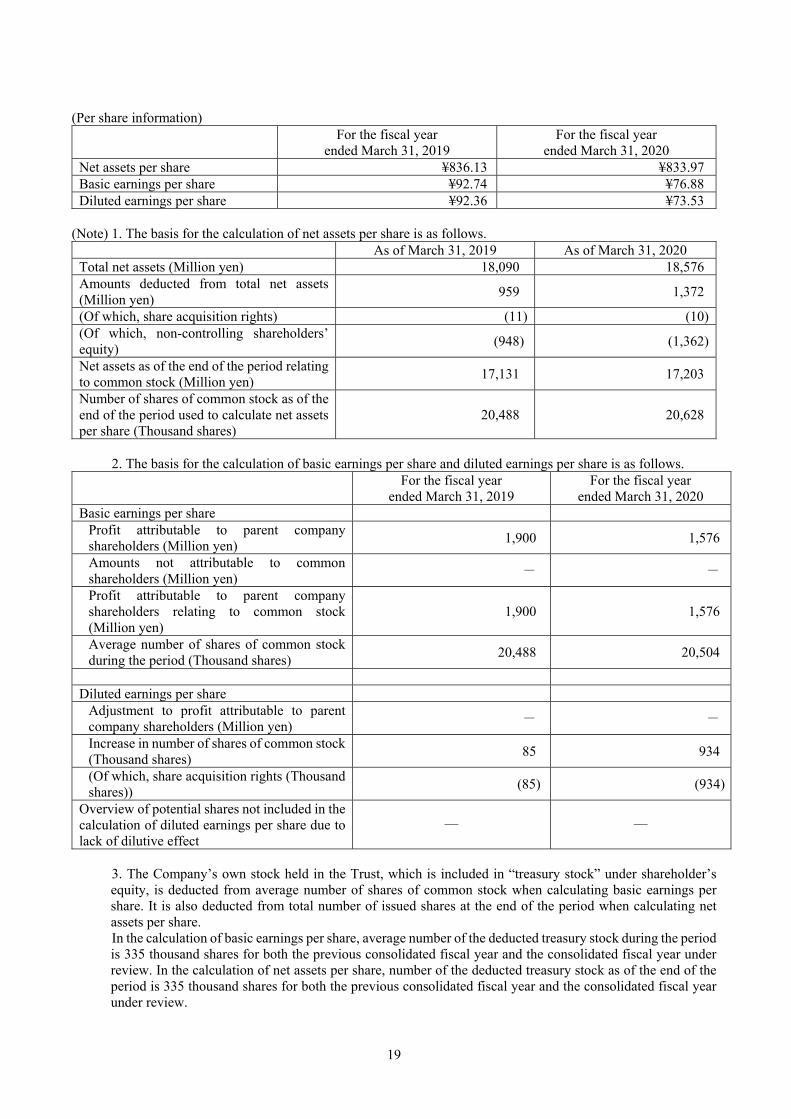
(Per share information)
For the fiscal year ended March 31, 2019
For the fiscal year ended March 31, 2020
Net assets per share ¥836.13 ¥833.97 Basic earnings per share ¥92.74 ¥76.88 Diluted earnings per share ¥92.36 ¥73.53
(Note) 1. The basis for the calculation of net assets per share is as follows.
As of March 31, 2019 As of March 31, 2020 Total net assets (Million yen) 18,090 18,576 Amounts deducted from total net assets (Million yen)
959 1,372
(Of which, share acquisition rights) (11) (10) (Of which, non-controlling shareholders’ equity)
(948) (1,362)
Net assets as of the end of the period relating to common stock (Million yen)
17,131 17,203
Number of shares of common stock as of the end of the period used to calculate net assets per share (Thousand shares)
20,488 20,628
2. The basis for the calculation of basic earnings per share and diluted earnings per share is as follows.
For the fiscal year ended March 31, 2019
For the fiscal year ended March 31, 2020
Basic earnings per share Profit attributable to parent company shareholders (Million yen)
1,900 1,576
Amounts not attributable to common shareholders (Million yen)
- -
Profit attributable to parent company shareholders relating to common stock (Million yen)
1,900 1,576
Average number of shares of common stock during the period (Thousand shares)
20,488 20,504
Diluted earnings per share
Adjustment to profit attributable to parent company shareholders (Million yen)
- -
Increase in number of shares of common stock (Thousand shares)
85 934
(Of which, share acquisition rights (Thousand shares))
(85) (934)
Overview of potential shares not included in the calculation of diluted earnings per share due to lack of dilutive effect
― ―
3. The Company’s own stock held in the Trust, which is included in “treasury stock” under shareholder’s equity, is deducted from average number of shares of common stock when calculating basic earnings per share. It is also deducted from total number of issued shares at the end of the period when calculating net assets per share. In the calculation of basic earnings per share, average number of the deducted treasury stock during the period is 335 thousand shares for both the previous consolidated fiscal year and the consolidated fiscal year under review. In the calculation of net assets per share, number of the deducted treasury stock as of the end of the period is 335 thousand shares for both the previous consolidated fiscal year and the consolidated fiscal year under review.

20
(Significant subsequent events)
Not applicable.
4. Others
Changes in Officers and Directors
(1) Changes in Representatives Not applicable.
(2) Changes in other officers
Once the content of the disclosure is determined, it will be disclosed separately.


![SUMMARY OF FINANCIAL STATEMENTS [IFRS] (CONSOLIDATED) Financial Results … · SUMMARY OF FINANCIAL STATEMENTS [IFRS] (CONSOLIDATED) Financial Results for the Fiscal Year Ended March](https://static.fdocuments.in/doc/165x107/5e92676282566416065a9900/summary-of-financial-statements-ifrs-consolidated-financial-results-summary.jpg)