FY2020 Consolidated Financial Results
49
Copyright 2021 FUJITSU LIMITED Consolidated Financial Results Fujitsu Limited April 28, 2021 FY2020 1
Transcript of FY2020 Consolidated Financial Results

Copyright 2021 FUJITSU LIMITED
Consolidated Financial Results
Fujitsu LimitedApril 28, 2021
FY2020
1

Copyright 2021 FUJITSU LIMITED
Contents
1.Financial Results for FY2020
2.Earnings Forecast for FY2021
2

Copyright 2021 FUJITSU LIMITED
1. Financial Results for FY2020
3

Copyright 2021 FUJITSU LIMITED
FY 2020 Financial Summary1.Financial Results
for FY2020
� Performance• Despite the impact of COVID-19, and despite lower revenue relative to the previous year
because of last year’s strong demand for PCs, due to steady progress in profitability
improvements, we achieved our highest ever operating profit and profit for the year.
� Shareholder Returns• Including both increasing dividends over 5 consecutive years and
purchases of treasury stock, shareholder returns have amounted to
around 60 billion yen
� Financial Status/Capital Efficiency• Free Cash Flow: 236.3 billion yen (+3.3 billion yen vs. previous year)
• Capital efficiency also improved – ROE: 15.1%, EPS: 1,013.8 yen (+28.1%
vs. previous year)
4

Copyright 2021 FUJITSU LIMITED
1.Financial Resultsfor FY2020 Consolidated PL
(Billions of yen)
(%)
Revenue 3,857.7 3,589.7 -268.0 -6.9 -20.2
Operating Profit 211.4 266.3 54.8 25.9 29.3
[Operating Profit Margin] [5.5%] [7.4%] [1.9%] [0.8%]
Financial income (expenses), etc 17.0 25.5 8.4 49.5
Profit for the Year
Before Income Taxes228.5 291.8 63.2 27.7
Profit for the Year
Attributable to Owners of the Parent160.0 202.7 42.6 26.7 25.7
Exchange Rate
U.S. dollar / Yen 109 106 -3 -2.8 1
Euro / Yen 121 124 3 2.5 4
British pound / Yen 138 139 1 0.7 -1
Euro / U.S. dollar 1.11 1.17 0.06 5.4 0.07
Change vs.
Jan forecast
FY2019(Actual)
FY2020(Actual)
Change
5

Copyright 2021 FUJITSU LIMITED
Consolidated PL (YoY)
■Revenue• Revenue fell compared to the previous year, due to the negative impact of COVID-19 and a significant
increase in demand for PCs last year that did not recur this year, resulting in a relative fall in revenue.
■OPPL• Excl. special items and restructuring: Profits increased significantly due to ongoing improvements in
profitability and greater efficiency in expenses
• Special items: Profits increased due to profits from the sale of businesses, as well as business model
transformation expenses recorded last year that did not recur this year.
■Profit for the Period Attributable to Owners of the Parent• Profit increased significantly due to the recording of one-time gains, in addition to the increase in operating
profit excluding special items and restructuring.
1.Financial Resultsfor FY2020
■Financial Income (Expenses), etc.• Profits increased due to profits from the listing of an internal startup company and from the impact of foreign
exchange.
6

Copyright 2021 FUJITSU LIMITED
Financial Results1.Financial Results
for FY2020
(Billions of yen)
Revenue 3,713.8 3,539.4 -174.4 -146.9 -27.4
OPPL 231.3 250.2 18.9 -48.2 67.1 [Operating Profit
Margin] [6.2%] [7.1%] [0.9%] [-1.0%] [1.9%]
Revenue 143.9 50.2 -93.6
OPPL -6.0 -2.9 3.1
Revenue - - -
OPPL -13.7 18.9 32.7
Revenue 3,857.7 3,589.7 -268.0 -146.9 -121.1
OPPL 211.4 266.3 54.8 -48.2 103.0 [Operating
Profit Margin] [5.5%] [7.4%] [1.9%]
*1 Restructured businesses: low profitability countries in Europe,product business in North America,
mobile phone retail store business, device business (semiconductor Mie plant and printed circuit board).
*2 FY2020 sales of business +25.4 billion yen : mobile phone retail store business, Business Model Transformation expenses
( "BMT expenses" ) -6.4 billion yen : restructuring costs for plants in Japan
FY2019 sales of business +9.6 billion yen, BMT expenses -23.4 billion yen : restructuring costs for plants in Japan and business in North America and others.
Total
Impact of
COVID-19
Excl.
Impact of
COVID-19
Excl. restructuring
and special items
Impact of
restructuring *1
Special items *2
FY2019
(Actual)
FY2020
(Actual)Change
7

Copyright 2021 FUJITSU LIMITED
Factors Behind Change in Operating Profit1.Financial Results
for FY2020
211.4[5.5%]
FY2019
・Sales -93.6
・Operating Profit +35.8
Restructuring and special items
Impact of COVID-19・Decrease in sales -146.9・Operating Profit -48.2
Rate of change[-4%]
Improvement Excl. Impact of COVID-19・Sales -27.4・Operating Profit +67.1
・Technology Solutions +52.8・Ubiquitous -12.1・Device +26.4
(Billions of yen)
FY2020
266.3[7.4%]
Decrease in profit
due to decrease in
revenue -4.9
(decrease in revenue -27.4)
Improvement in
gross margin
ratio
+34.3
(+1.0%)
Decrease in OPEX
and others
+37.7
8
Copyright 2021 FUJITSU LIMITED
Revenue by Segments1.Financial Resultsfor FY2020
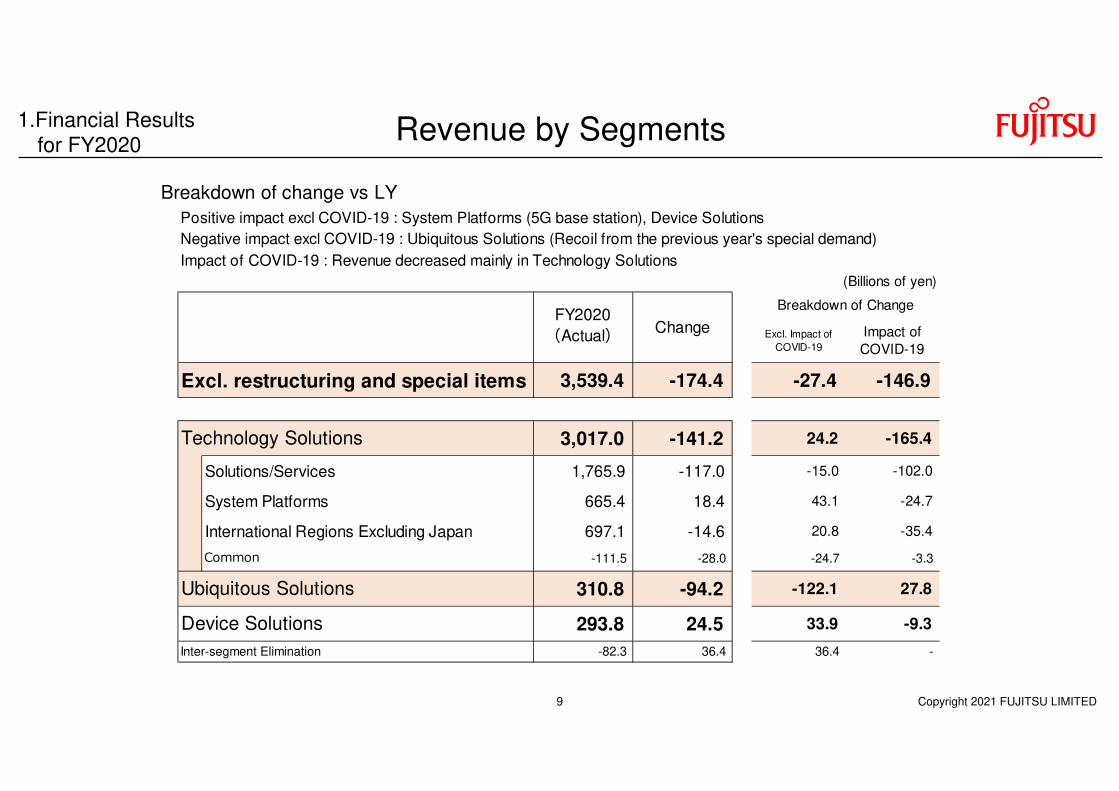
Breakdown of change vs LY
Positive impact excl COVID-19 : System Platforms (5G base station), Device Solutions
Negative impact excl COVID-19 : Ubiquitous Solutions (Recoil from the previous year's special demand)
Impact of COVID-19 : Revenue decreased mainly in Technology Solutions
(Billions of yen)
Excl. Impact of
COVID-19
Impact of
COVID-19
Excl. restructuring and special items 3,539.4 -174.4 -27.4 -146.9
Technology Solutions 3,017.0 -141.2 24.2 -165.4
Solutions/Services 1,765.9 -117.0 -15.0 -102.0
System Platforms 665.4 18.4 43.1 -24.7
International Regions Excluding Japan 697.1 -14.6 20.8 -35.4
Common -111.5 -28.0 -24.7 -3.3
Ubiquitous Solutions 310.8 -94.2 -122.1 27.8
Device Solutions 293.8 24.5 33.9 -9.3
Inter-segment Elimination -82.3 36.4 36.4 -
FY2020
(Actual) Change
Breakdown of Change
9

Copyright 2021 FUJITSU LIMITED
Profitability ImprovementReduction in Operating Expenses
1.Financial Resultsfor FY2020
Gross margin ratio … Improvement by 1.0%
・Solutions/services Improvement in profitability continued from the first half
・System Platforms Improved due to the impact of product mix
・Device Solutions Increased sales led to recovery of fixed costs.
Effect of reduced operating expenses +37.7 billion yen
・General expenses -35.0 billion yen
・R&D expenses 15.0 billion yen
・Others -12.5 billion yen Increase and decrease in one-shot items
Work Life Shift and efficient development of system platforms
and others
Strengthen service businesses, Internal DX, WLS and others
FY2020
Gross margin ratio 30.5%
vs LY 1.0%
(Billions of yen)
FY2020
OPEX 825.6
vs LY -37.7
10

Copyright 2021 FUJITSU LIMITED
Overall orders in Japan (Fujitsu Limited only) 1.Financial Resultsfor FY2020
1Q 2Q 3Q 4Q Total
93% 85% 93% 100% 99%][ 92% 93%][
89% 84% 100% 91% 93%][ 90% 94%][
79% 85% 101% 125% 123%][ 93% 96%][
109% 96% 127% 97% 99%][ 107% 107%][
Total 93% 88% 106% 101% 96%
[Excl. Orders For PC] [98%] [89%] [109%] [101%] [99%]
JAPAN
[Local Government & Healthcare]
Finance&Retail
Public & Social Infrastructure
Private Enterprise
[Manufacturing & Distribution]
[Excl. Orders
For PC ]
[Excl. Orders
For PC ]
FY2020(Actual)
Industries
11

Copyright 2021 FUJITSU LIMITED
1.Financial Resultsfor FY2020 Progress in Business Model Transformation
● Business Reorganization Outside Japan
・European product business: Completed the closure of a factory, the transfer of production to
EMS, and the consolidation of R&D functions.
・Exit from unprofitable countries in Europe: Completed the exit from 23 countries as planned
(Management buyouts, sale of businesses, closures, etc.)
・Business reorganization in North America: Completed the withdrawal from the product business
and the reorganization of the retailing systems business
● Reorganization of Manufacturing Facilities in Japan
・Increasing the efficiency of production systems in the product business: Will complete major
reforms this fiscal year, optimizing our manufacturing organization12

Copyright 2021 FUJITSU LIMITED
1.Financial Resultsfor FY2020 Change vs Jan Forecast
Change vs Jan Forecast
OPPL
Forecast 237.0 billion yen ⇒ Actual 266.3 billion yen +29.3 billion yen
●Excl. restructuring and special items +20.0 billion yen
・Technology Solutions +2.0 billion yen
・Ubiquitous Solutions +9.0 billion yen
・Device Solutions +9.0 billion yen
●Special items
Forecast 10.0 billion yen ⇒ Actual 18.9 billion yen +9.0 billion yen
13

Copyright 2021 FUJITSU LIMITED
Business Segment Information1.Financial Results
for FY2020
(Billions of yen)
Special items/
restructuring
Special items/
restructuring
Excl.
Special items
Special items/
restructuring
Impact of
COVID-19
3,212.9 54.5 3,043.6 26.5 -169.2 -141.2 -28.0 -165.4 -36.3
455.2 50.2 334.6 23.7 -120.6 -94.2 -26.4 27.8 15.6
308.4 39.1 293.8 - -14.6 24.5 -39.1 -9.3 3.8
-118.8 - -82.3 - 36.4 36.4 - - -3.3
3,857.7 143.9 3,589.7 50.2 -268.0 -174.4 -93.6 -146.9 -20.2
187.9 -9.8 188.4 -10.4 0.5 1.1 -0.5 -51.7 10.4
26.7 0.7 48.0 26.4 21.2 -4.5 25.7 7.6 10.0
-3.2 -10.6 29.8 - 33.0 22.3 10.6 -4.0 8.8
211.4 -19.8 266.3 16.0 54.8 18.9 35.8 -48.2 29.3
Change vs.
Jan forecast
FY2019
(Actual)
FY2020
(Actual)Change
Revenue
Technology Solutions
Ubiquitous Solutions
Device Solutions
Inter-segment Elimination
Total
OP
PL
Technology Solutions
Ubiquitous Solutions
Device Solutions
Total
14

Copyright 2021 FUJITSU LIMITED
Business Segment Information1.Financial Results
for FY2020
[Revenue]
Revenue fell significantly due to the impact of COVID-19 and
restructuring.
Impact of COVID-19: -165.4 billion yen
Impact of business restructuring: -28.0 billion yen
Excluding the above effects: +24.2 billion yen
[Operating Profit]
Despite the impact of reduced revenue due to COVID-19, profit
increased significantly due to improvements in profitability and
increased sales volume in Network Products
Impact of COVID-19: -51.7 billion yen
Impact of business restructuring: +2.7 billion yen
Impact of special items: -3.3 billion yen
Excluding the above effects: +52.8 billion yen
Technology Solutions(Billions of yen)
(%)
3,212.9 3,043.6 [-165.4] -169.2 -5.3
187.9 188.4 [-51.7] 0.5 0.3
[5.8%] [6.2%] [0.4%]
Revenue (breakdown) [ ]Figures in brackets indicate the Impact of COVID-19
Japan 2,304.2 2,193.4 -110.8 -4.8
Outside Japan 908.6 850.1 -58.4 -6.4
ChangeTechnology
SolutionsFY2019(Actual)
FY2020(Actual)
Revenue
Operating
profit
[Operating profit
margin]
15

Copyright 2021 FUJITSU LIMITED
Business Segment Information1.Financial Results
for FY2020
[Revenue]
Revenue fell significantly due to the impact of COVID-19.
Even excluding the impact of COVID-19, revenue fell, as
there was a drop in hardware-related business, such as PC
deployment support services.
[Operating Profit]
Cost improvements and expense reduction efforts were able
to overcome the impact of COVID-19, resulting in higher
profits.
Technology Solutions(Solutions/Services)(Billions of yen)
(%)
1,883.0 1,765.9 [-102.0] -117.0 -6.2
179.5 183.5 [-36.4] 4.0 2.2
[9.5%] [10.4%] [0.9%]
[ ]Figures in brackets indicate the Impact of COVID-19
ChangeFY2019(Actual)
FY2020(Actual)
Revenue
Operating
profit
[Operating profit
margin]
Solutions/
Services
16

Copyright 2021 FUJITSU LIMITED
Business Segment Information1.Financial Results
for FY2020
[Revenue]
(System Products)
Fall in revenue due to the significant impact of COVID-19:
-32.0 billion yen
Impact of changes in sales channels due to the closure of a
factory in Europe: +28.0 billion yen
(Network Products)
Revenue rose, primarily in 5G base stations
[Operating Profit]
Profits rose due to the effects of higher revenue in Network
Products, as well as greater efficiency in development
expenses
Technology Solutions (System Platforms)(Billions of yen)
(%)
647.0 665.4 [-24.7] 18.4 2.8
System
Products440.1 420.3 [-32.0] -19.8 -4.5
Network
Products206.8 245.1 [7.2] 38.2 18.5
27.4 41.2 [-3.3] 13.7 49.9
[4.2%] [6.2%] [2.0%]
Revenue (breakdown) [ ]Figures in brackets indicate the Impact of COVID-19
Japan 529.5 537.0 7.5 1.4
Outside Japan 117.5 128.4 10.9 9.3
Change
[Operating profit
margin]
System
PlatformsFY2019(Actual)
FY2020(Actual)
Revenue
Operating
profit
17

Copyright 2021 FUJITSU LIMITED
Business Segment Information1.Financial Results
for FY2020
[Revenue]
Revenue was significantly impacted by the negative effects of
COVID-19 and business restructuring
Impact of business restructuring: -28.0 billion yen
-> Low profitability countries in Europe, the product
business in North America
Impact of COVID-19: -35.4 billion yen
Excluding the above factors: +20.8 billion yen
-> Secured major public sector contracts in Europe,
etc.
[Operating Profit]
Special items: +6.3 billion yen (BM transformation expenses
in North America recorded in the previous year did not recur
this year)
Excluding the above factors: +1.3 billion yen
-> Ongoing improvements in profitability and efficiency in
expenses
Technology Solutions(International Regions Excluding Japan)(Billions of yen)
(%)
766.3 723.7 [-35.4] -42.6 -5.6
3.8 11.6 [-10.2] 7.7 199.3
[0.5%] [1.6%]
[ ]Figures in brackets indicate the Impact of COVID-19
Change
[1.1%]
FY2019(Actual)
FY2020(Actual)
Revenue
Operating
profit
[Operating profit
margin]
International
Regions
Excluding Japan
18
Copyright 2021 FUJITSU LIMITED
Business Segment Information1.Financial Results
for FY2020
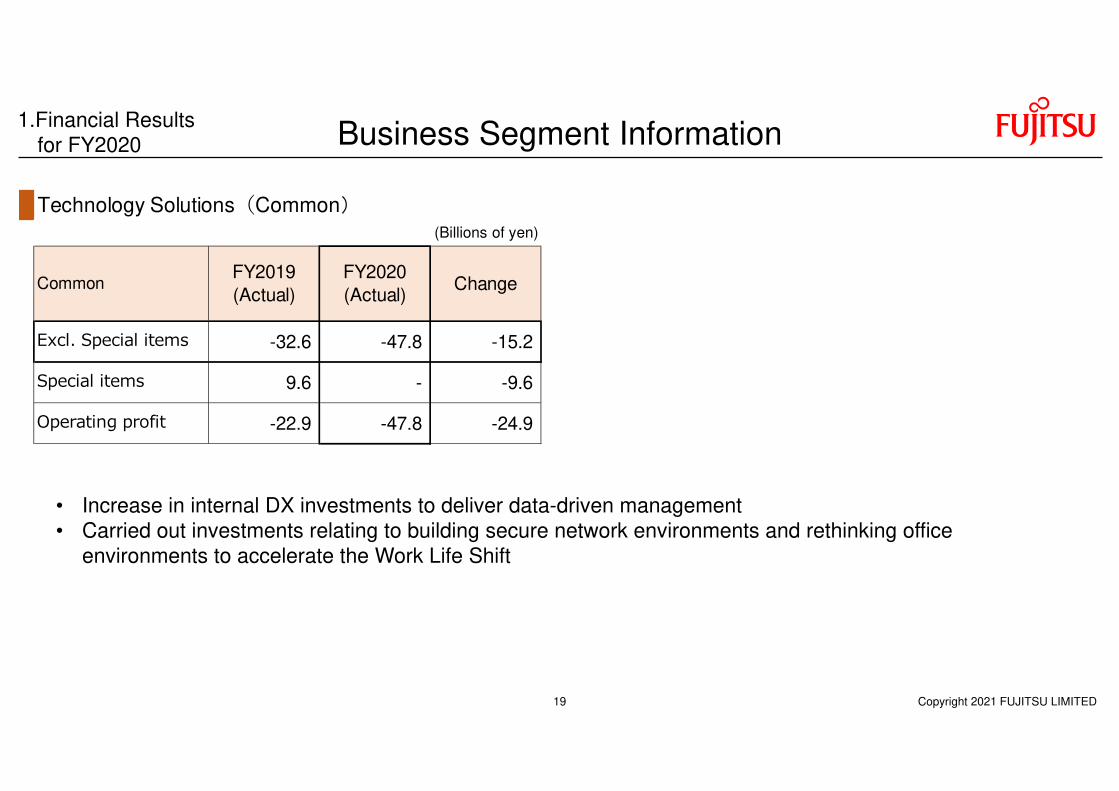
Technology Solutions(Common)(Billions of yen)
Excl. Special items -32.6 -47.8 -15.2
Special items 9.6 - -9.6
Operating profit -22.9 -47.8 -24.9
Common ChangeFY2020
(Actual)
FY2019
(Actual)
• Increase in internal DX investments to deliver data-driven management• Carried out investments relating to building secure network environments and rethinking office
environments to accelerate the Work Life Shift
19

Copyright 2021 FUJITSU LIMITED
1.Financial Resultsfor FY2020
For Stability
For GrowthContributing to customers’
business growth
Contributing to customers’ business stability
Two Business Areas for Value Creation(Technology Solutions)
Revenue (Billions of yen)
composition
ratio(%)
composition
ratio(%)
composition
ratio(%)
Growth Rate 100%
For Growth 987.9 31 988.9 32 1.0 1
Growth Rate 92%
For Stability 2,225.0 69 2,054.7 68 -170.2 -1
Growth Rate 95% [-165.4]
3,212.9 100 3,043.6 100 -169.2 - [ ]Figures in parentheses indicate the Impact of COVID-19
FY2019
(Actual)
FY2020
(Actual)Change
Technology Solutions
■For Growth … Digital(DX、Modernization)The digital domain which encompasses areas of business opportunity for our customers
■For Stability … Traditional IT(Maintenance and operation of systems and sales of hardware products)
The business domain which contributes to the stable operation of customer IT platforms and improves quality
20

Copyright 2021 FUJITSU LIMITED
Business Segment Information1.Financial Results
for FY2020
[Revenue]
Business restructuring: -26.4 billion yen
-> Impact of excluding the mobile phone retail store business
from the consolidated results
Even excluding restructuring and special items, revenue fell
significantly relative to last year, due to the extraordinary
demand last year related to the end of service for Windows 7,
which did not recur this year.
[Operating Profit]
One-time profits relating to the sale of businesses were +25.4
billion yen
Excluding restructuring and special items, profits fell due to
the significant impact of lower revenue.
Ubiquitous Solutions(Billions of yen)
(%)
455.2 334.6 [27.8] -120.6 -26.5
Excl. Special
items26.4 21.6 [7.6] -4.7 -18.0
Special
items0.3 26.3 25.9 -
26.7 48.0 [7.6] 21.2 79.3
[5.9%] [14.4%] [8.5%]
Revenue (breakdown) [ ]Figures in brackets indicate the Impact of COVID-19
Japan 323.4 224.6 -98.8 -30.6
Outside Japan 131.8 109.9 -21.8 -16.6
Change
Revenue
Operating
profit
[Operating profit
margin]
Ubiquitous
SolutionsFY2019(Actual)
FY2020(Actual)
21

Copyright 2021 FUJITSU LIMITED
Business Segment Information1.Financial Results
for FY2020
[Revenue]
Business restructuring: -39.1 billion yen
Excluding special items and restructuring, revenue rose 9.1%,
primarily in electronic components
[Operating Profit]
Impact of special items: +10.0 billion yen
Excluding special items and restructuring: +23.0 billion yen
-> Due to the effects of higher revenue in electronic
components and improved profitability
Device Solutions(Billions of yen)
(%)
308.4 293.8 [-9.3] -14.6 -4.7
-3.2 29.8 [-4.0] 33.0 -
[-1.1%] [10.1%] [11.2%]
Revenue (breakdown) [ ]Figures in brackets indicate the Impact of COVID-19
Japan 112.1 75.8 -36.2 -32.3
Outside Japan 196.3 217.9 21.6 11.0
Revenue
Operating
profit
[Operating profit
margin]
Device
SolutionsFY2019(Actual)
FY2020(Actual)
Change
22

Copyright 2021 FUJITSU LIMITED
Cash Flows1.Financial Results
for FY2020
[Cash flows from operating activities]
• Compared with the previous year: Positive: Higher profits, excluding special items and restructuring, etc.
Negative: Higher tax expenses, etc.
[Cash flows from investing activities]
• In addition to inflows from the reorganization of the mobile phone retail store business and the PC business, among others,
inflows also increased due to the sale of fixed assets.
(Billions of yen)
Ⅰ Cash flows from operating activities 347.2 307.9 -39.3
Ⅱ Cash flows from investing activities -114.2 -71.5 42.6
Ⅰ+Ⅱ Free Cash Flow 233.0 236.3 3.3
Ⅲ Cash flows from financing activities -193.1 -219.6 -26.4
Ⅳ Cash and Cash Equivalents at End of Year 453.0 481.8 28.7
FY2019
(Actual)
FY2020
(Actual)Change
[Cash flows from financing activities]
• Outflows increased due to the public purchase of Fujitsu Frontech stock, among other factors.
23

Copyright 2021 FUJITSU LIMITED
Assets, Liabilities and Equity1.Financial Results
for FY2020
(Billions of yen)Year-end
FY2019
Year-end
FY2020Change
3,187.4 3,190.2 2.7
1,839.0 1,643.3 -195.7
1,348.4 1,546.9 198.4
Total Equity Attributable to Owners of the Parent 1,240.9 1,450.1 209.1
Equity Attributable to Owners of the Parent Ratio (%) 38.9 45.5 6.6
Total Liabilities
Total Assets
Total Equity
9.4%
13.5%15.1%
FY2018
(Actual)
FY2019
(Actual)
FY2020
(Actual)
ROEReturn on Equity Attributable to Owners of the Parent
512.5
791.2
1,013.8
FY2018
(Actual)
FY2019
(Actual)
FY2020
(Actual)
EPS Earnings per share(Basic)
(Yen)
Figures calculated based on the standards after consolidation of shares are shown.
24

Copyright 2021 FUJITSU LIMITED
Returns to Shareholders1.Financial Results
for FY2020
■ Dividend (Per Share) ■ Total return amount (Billions of yen)
FY2018
(Actual)
FY2019
(Actual)
FY2020
(Actual)
FY2018
(Actual)
FY2019
(Actual)
FY2020
(Actual)
End of First Half 70 Yen 80 Yen 100 Yen Dividends 30.5 36.2 39.9
End of Fiscal Year 80 Yen 100 Yen 100 Yen Purchase of treasury stock 22.3 30.1 20.1
Annual 150 Yen 180 Yen 200 Yen Total return amount 52.8 66.3 60.0
Figures calculated based on the standards after consolidation of shares are shown.
25

Copyright 2021 FUJITSU LIMITED
2. Earnings Forecast for FY2021
26

Copyright 2021 FUJITSU LIMITED
2.Earnings Forecastfor FY2021 Financial Forecast
(Billions of yen)
(%)
Revenue3,589.7 3,630.0 40.2 1.1
Operating Profit266.3 275.0 8.6 3.3
[Operating Profit Margin] [7.4%] [7.6%] [0.2%]
Profit for the Year Attributable to
Owners of the Parent202.7 205.0 2.3 1.1
Exchange Rate
U.S. dollar / Yen 106 105 -1 -0.9
Euro / Yen 124 120 -4 -3.2
British pound / Yen 139 140 1 0.7
Ratio of Revenue Outside Japan 32.7% 33.4% 0.7%
FY2021(Forecast)
ChangeFY2020(Actual)
27

Copyright 2021 FUJITSU LIMITED
Business Segment Information2.Earnings Forecastfor FY2021
(Billions of yen)
Revenue 3,043.6 3,200.0 156.3
Excl. special items 195.8 240.0 44.1
% [6.4%] [7.5%] [1.1%]
special items -7.4 - 7.4
OPPL 188.4 240.0 51.5
% [6.2%] [7.5%] [1.3%]
Revenue 334.6 230.0 -104.6
Excl. special items 21.6 5.0 -16.6
% [6.5%] [2.2%] [-4.3%]
special items 26.3 - -26.3
OPPL 48.0 5.0 -43.0
% [14.4%] [2.2%] [-12.2%]
FY2020
(Actual)
FY2021
(Forecast)Change
Technology
Solutions
Ubiquitous
Solutions
・ Revenue: 5% Growth
⊕ Resumption of projects put on hold
⊕ DX business expansion
⊕ Higher revenue in Network Products
・ OPPL
⊕ Impact of increased revenue
in Solutions and Services
⊕ Improvements in profitability
⊖ Executing growth investments
・ Revenue
⊖demand for remote work and the GIGASchool
project will not recur in fiscal 2021
・ OPPL
⊖Decline in profit because of lower revenue
28
Copyright 2021 FUJITSU LIMITED
Business Segment Information2.Earnings Forecastfor FY2021
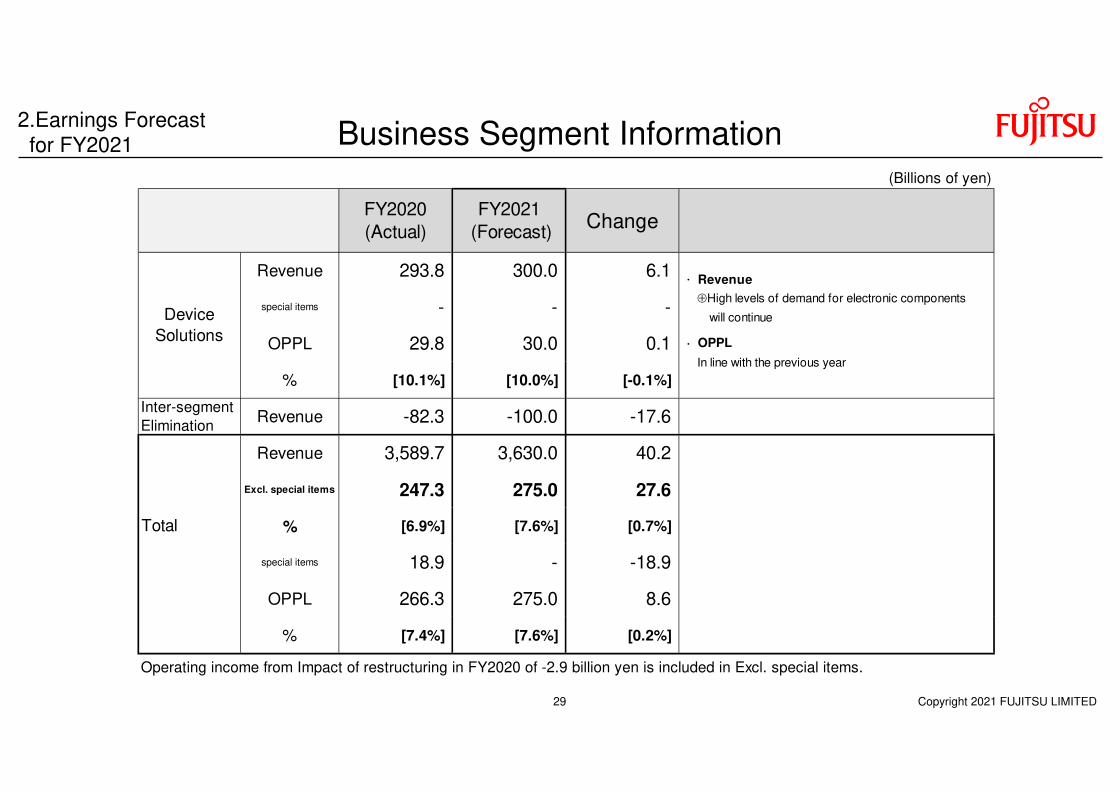
(Billions of yen)
Revenue 293.8 300.0 6.1
special items - - -
OPPL 29.8 30.0 0.1
% [10.1%] [10.0%] [-0.1%]
Revenue -82.3 -100.0 -17.6
Revenue 3,589.7 3,630.0 40.2
Excl. special items 247.3 275.0 27.6
% [6.9%] [7.6%] [0.7%]
special items 18.9 - -18.9
OPPL 266.3 275.0 8.6
% [7.4%] [7.6%] [0.2%]
Operating income from Impact of restructuring in FY2020 of -2.9 billion yen is included in Excl. special items.
Inter-segment
Elimination
Total
Device
Solutions
FY2020
(Actual)
FY2021
(Forecast)Change
・ Revenue
⊕High levels of demand for electronic components
will continue
・ OPPL
In line with the previous year
29

Copyright 2021 FUJITSU LIMITED
Factors Behind Change in Operating ProfitBreakdown of Technology Solutions
188.4[6.2%]
FY2020
(Billions of yen)
FY2021
240.0[7.5%]
Increase in profit due
to increase in
revenue +50.0
(increase in revenue +156.3)
Improvement in
gross margin ratio
+50.0
Investment in growth
OPEX
-50.0
2.Earnings Forecastfor FY2021
・Operating Profit +51.5
・Building out important focus areas
・Continued strengthening of
the Services business
Global Offerings
Cloud-first
DX Business
・Transforming the Services
delivery structure
・Structural transformations
in regions outside Japan
・Limiting unprofitable projects
・Enhancing service delivery
・Internal DX (data-driven management)
・Transforming the ways we work
Expansion of Earnings
Improved Profitability
Growth Investments
30

Copyright 2021 FUJITSU LIMITED
Path to Achieving Technology Solutions Goals2.Earnings Forecastfor FY2021
Operating Profit Margin
3,500.0
Revenue
(Actual) (Actual) (Forecast) (Financial Targets)
OPPL 187.9 188.4 240.0 350.0
FY 2019 2020 2021 2022
3,212.93,043.6
3,200.0
5.8% 6.2%
7.5%
10.0%
(Billions of yen)
Factors Behind Change in Operating Profit(Billions of yen)
FY2020 FY2021⇒FY2021 ⇒FY2022
[-169.2] [156.3] [300.0]
-52.5 +50.0 +60.0
+68.0 +50.0 +50.0
-15.0 -50.0 -
+0.5 +50.0 +110.0 Total
Improvement in gross
margin
Investment in growth
[OPEX]
FY2019⇒FY2020
Impact of changes in sales
[] is the changes in sales
31
Copyright 2021 FUJITSU LIMITED
Cash Flows2.Earnings Forecastfor FY2021
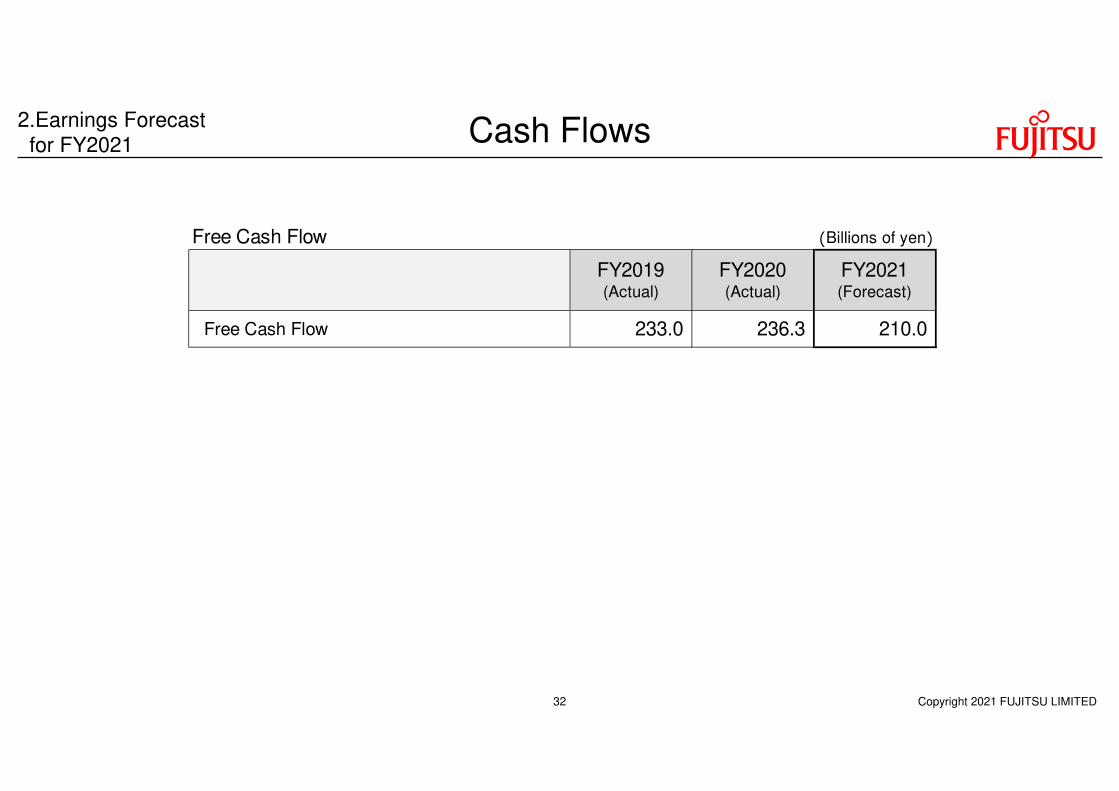
Free Cash Flow (Billions of yen)
Free Cash Flow 233.0 236.3 210.0
FY2020(Actual)
FY2021(Forecast)
FY2019(Actual)
32

(1) Cash flow: Create free cash flow of over 1 trillion yen over the
next five years
(2) Allocation: Cash flow will be optimally allocated to growth
investments and shareholder returns
Over the next
5 years
(FY20-24)
Sharehol
der
Returns
Growth
Investme
nts
(2) Thought Process About Allocation
Financial Foundation
Over 1 Trillion Yen
(1) Stable Generation of
Cash Flow
Free
Cash
Flow
(FCF)
Business
Cash
Flow
Optimization of owned
assets
Executing Strategic Growth Investments
We will actively execute necessary investments to create value that can
be delivered to customers and society, and to accomplish Fujitsu’s own
transformation into a DX company (500-600 billion yen over 5 years)
� Investments for creating value
� Investments for our own transformation
� Stock Buybacks: Surplus funds reserved over long time periods will be
used as capital for flexible stock buybacks (responding while bearing in
mind changes in capital needs)
� Dividends: We will carry out stable dividend payments based on
continued growth in our businesses
� We aim to increase business growth, profitability, and capital
efficiency through optimal allocation of cash flow
� From a capital efficiency perspective, we will focus on earnings per
share (EPS), with the goal of continued growth in EPS going
forward
Delivering Stable Shareholder Returns
We are aiming for stable shareholder returns over the medium-to-long
term that correspond to the stage of growth in our businesses and profits
Note: Business cash flow = FCF – lease payments + growth investments
� Capital Allocation Policy (Material republished from July 2020)
(500-600 billion yen)
2.Earnings Forecastfor FY2021
Capital Allocation Policy
Copyright 2021 FUJITSU LIMITED33

Copyright 2021 FUJITSU LIMITED
� Allocation: Growth Investments – 500-600 billion yen over 5 years
We will actively pursue growth investments in fiscal 2021, leading to business expansion and
improvements in profitability
Major
Investment Areas
� Value Creation: Enhancing our Services business (Global offerings)
Transforming our service delivery structure (Japan Global Gateway)
� Internal
Transformation:
Acquiring high-skill personnel, talent development
Internal DX to implement data-driven management, transforming the ways we work
2.Earnings Forecastfor FY2021
Capital Allocation Policy
(Billions of yen)FY2020 FY22-24 FY20-24
(Actual)(Forecast) vs LY Average (5 Years)
Growth
Investment40.0 100.0 60.0 120.0 500.0
OPEX 15.0 65.0 50.0
FY2021
ESG/Risk management
(Pension and others)
+100.0 billion yen
34

Copyright 2021 FUJITSU LIMITED
In addition to ensuring stable dividends, we will actively conduct share buybacks, keeping capital
efficiency in mind, and expand the overall amount of returns
� Allocation: Shareholder Returns – 400-500 billion yen over 5 years
2.Earnings Forecastfor FY2021
Capital Allocation Policy
Shareholder Returns – 400-500 billion yen over 5 years
(Billions of yen)FY2017 FY2018 FY2019 FY2020 FY22-24
(Actual) (Actual) (Actual) (Actual)(Forecast) vs LY Average
<Dividends per Share> 110 Yen 150 Yen 180 Yen 200 Yen 220 Yen 20 Yen
Dividends 22.6 30.5 36.2 39.9 43.1 3.2 50.0
Share Repurchaces 0.1 22.3 30.1 20.1 50.0 29.9 50.0
Total shareholder returns 22.7 52.8 66.3 60.0 93.1 33.1 100.0
FY2021
35

Copyright 2021 FUJITSU LIMITED
• Dividends: 220 yen/share (110 yen intermediate, 110 yen year-end), an increase of 20 yen, year over year
Total dividend: 43.1 billion yen
• Stock Buybacks: 50 billion yen (buyback period: May 6, 2021 – March 31, 2022)
Total Returns: 93.1 billion yen (+33.1 billion yen compared to the previous year)
� Shareholder Returns for Fiscal 2021 (Reprint)
2.Earnings Forecastfor FY2021
Capital Allocation Policy
36

Copyright 2021 FUJITSU LIMITED
� In fiscal 2020, we achieved our highest ever operating profit and profit for the year [A first step toward achieving our
medium-term targets]
� In fiscal 2021, we aim to expand our businesses and strengthen our earnings capability through active growth investments [Achieving increases in revenue and profits]
We will expand overall shareholder returns by actively conducting stock buybacks, in addition to stable dividends
� Working to expand business, strengthen earnings capability, and improve capital efficiency
through optimal capital allocation
• Business Expansion:Increased revenue in Technology Solutions
3.5 trillion yen (Target timeframe: Fiscal 2022)
• Strengthening Earnings Capability:
Operating profit margin in Technology Solutions
10% (Target timeframe: Fiscal 2022)
+
• Improving Capital Efficiency:
Average annual growth rate of company-wide EPS
12% (Fiscal 2020-24, compared to fiscal 2019)
※ Quantified as a target KPI under the capital allocation policy
Financial Targets
Improvement of Corporate Value2.Earnings Forecastfor FY2021
37

38
Cautionary StatementThese materials may contain forward-looking statements that are based on management’s current information, views and assumptions and involve known and unknown risks and uncertainties that could cause actual results,
performance or events to differ materially from those expressed or implied in such statements. Actual results may differ materially from those projected or implied in the forward-looking statements due to, without limitation, the
following factors listed below.
• General economic and market conditions in key markets (Particularly in Japan, Europe, North America,
Oceania, and Asia, including China)
• Fluctuations in exchange rates or interest rates
• Fluctuations in capital markets
• Intensifying price competition
• Changes in market positioning due to competition in R&D
• Changes in the environment for the procurement of parts and components
• Changes in competitive relationships relating to collaborations, alliances and technical provisions
• Risks related to public regulations, public policy and tax matters
• Risks related to product or services defects
• Potential emergence of unprofitable projects
• Risks related to R&D investments, capital expenditures, business acquisitions, business restructuring, etc.
• Risks related to natural disasters and unforeseen events
• Changes in accounting policies
39

Copyright 2021 FUJITSU LIMITED
Supplementary
40

Copyright 2021 FUJITSU LIMITED
Business Segment Information [Quarterly Breakdown of Results]
(Supplementary)Financial Results
for FY2020(Billions of yen)
1Q 2Q 3Q 4Q 1Q 2Q 3Q 4Q
Revenue 677.1 807.1 770.0 958.5 679.1 698.3 753.5 912.6
OPPL 7.5 56.2 40.9 83.1 12.6 29.6 52.3 93.7
Revenue 388.7 483.4 444.4 566.3 376.8 418.7 427.2 543.1
OPPL 18.0 43.4 38.4 79.5 17.8 36.4 40.9 88.3
Revenue 122.3 166.4 141.0 217.2 151.7 140.0 169.7 203.9
OPPL -6.4 16.3 4.8 12.7 5.0 2.2 11.9 21.9
Revenue 186.2 182.4 203.2 194.3 171.0 163.8 192.4 196.2
OPPL -0.5 3.4 -1.2 2.2 -3.7 2.9 8.6 3.8
Revenue -20.2 -25.2 -18.8 -19.2 -20.5 -24.3 -36.0 -30.7
OPPL -3.5 -6.9 -1.1 -11.3 -6.4 -11.8 -9.2 -20.3
Revenue 102.9 138.4 111.4 102.4 73.8 83.7 84.1 92.8
OPPL 3.5 10.4 8.8 3.9 4.2 4.5 30.9 8.3
Revenue 83.4 85.2 71.5 68.2 68.3 70.3 75.5 79.6
OPPL -7.7 0.9 0.6 2.9 5.3 5.7 10.2 8.4
Revenue -24.7 -40.8 -29.8 -23.4 -18.5 -23.3 -18.8 -21.7
Revenue 838.7 990.0 923.2 1,105.7 802.7 829.0 894.3 1,063.5
OPPL 3.3 67.6 50.4 90.0 22.2 39.9 93.4 110.5 Total
FY2019 (Actual)
Technology
Solutions
Solutions/
Services
System
Platforms
Ubiquitous Solutions
International Regions
Excluding Japan
Device Solutions
Inter-segment
Elimination
Common
FY2020 (Actual)
41

Copyright 2021 FUJITSU LIMITED
Two Business Areas for Value Creation(Technology Solutions)
(Supplementary)Financial Results
for FY2020
For Growth/For Stability: Composition of Businesses
For Growth • SI Development (New / Modernization / Upgrades)
• Cloud Services Related
IaaS / SaaS
Cloud Integration
Applications (Applications run in the cloud)
Software (Software run in the cloud)
• Cybersecurity-Related Services
• Consulting Services
• Advanced Products: HPC, 5G Network-Related
For Stability • System Maintenance and Operations Services
• Conventional (On Premise) Applications
• Application Maintenance Services (On Premise)
• System Platforms
Legacy Processor-Related
Legacy Network-Related
42

Copyright 2021 FUJITSU LIMITED
(Supplementary)Financial Results
for FY2020
Two Business Areas for Value Creation(Technology Solutions)
(Billions of yen)
ForGrowth
ForStability
TotalFor
GrowthFor
StabilityTotal
ForGrowth
ForStability
Total
Growth Rate 100% 92% 95%
Revenue 987.9 2,225.0 3,212.9 988.9 2,054.7 3,043.6 1.0 -170.2 -169.2 composition
ratio [31%] [69%] [100%] [32%] [68%] [100%] [1%] [-1%] [-%]
Growth Rate 96% 92% 94%
Revenue 816.2 1,066.8 1,883.0 785.4 980.5 1,765.9 -30.8 -86.2 -117.0 composition
ratio [43%] [57%] [100%] [44%] [56%] [100%] [1%] [-1%] [-%]
Growth Rate 126% 97% 103%
Revenue 136.5 510.5 647.0 171.4 494.0 665.4 34.9 -16.5 18.4 composition
ratio [21%] [79%] [100%] [26%] [74%] [100%] [5%] [-5%] [-%]
Growth Rate 91% 95% 94%
Revenue 35.2 731.1 766.3 32.1 691.6 723.7 -3.1 -39.5 -42.6 composition
ratio [5%] [95%] [100%] [4%] [96%] [100%] [-1%] [1%] [-%]
Common Revenue - -83.5 -83.5 - -111.5 -111.5 - -28.0 -28.0 composition
ratio [-%] [100%] [100%] [-%] [100%] [100%] [-%] [-%] [-%]
FY2020 (Actual) ChangeFY2019 (Actual)
System
Platforms
International Regions
Excluding Japan
Technology
Solutions
Solutions/
Services
43

Copyright 2021 FUJITSU LIMITED
Business Segment Information [ Revenue Breakdown-In and Outside Japan]
(Supplementary)Financial Results
for FY2020(Billions of yen)
3,212.9 3,043.6 -169.2 -5.3 Japan 2,304.2 2,193.4 -110.8 -4.8 Outside Japan 908.6 850.1 -58.4 -6.4
1,883.0 1,765.9 -117.0 -6.2 Japan 1,838.8 1,725.2 -113.5 -6.2 Outside Japan 44.1 40.7 -3.4 -7.8
647.0 665.4 18.4 2.8 Japan 529.5 537.0 7.5 1.4 Outside Japan 117.5 128.4 10.9 9.3
766.3 723.7 -42.6 -5.6 Japan 1.1 0.4 -0.6 -58.6 Outside Japan 765.2 723.2 -42.0 -5.5
-83.5 -111.5 -28.0 - 455.2 334.6 -120.6 -26.5
Japan 323.4 224.6 -98.8 -30.6 Outside Japan 131.8 109.9 -21.8 -16.6
308.4 293.8 -14.6 -4.7 Japan 112.1 75.8 -36.2 -32.3 Outside Japan 196.3 217.9 21.6 11.0
-118.8 -82.3 36.4 -
3,857.7 3,589.7 -268.0 -6.9 Japan 2,629.2 2,417.6 -211.6 -8.1
Outside Japan 1,228.5 1,172.0 -56.4 -4.6
Ratio of Revenue Outside Japan 31.8% 32.7% 0.9%
Revenue
Common
Device Solutions
Revenue
International Regions
Excluding Japan
Revenue
Solutions/
Services
System
Platforms
Total
Revenue
Revenue
Ubiquitous Solutions
Inter-segment Elimination Revenue
Revenue
Revenue
FY2019(Actual)
Change(%)
Technology Solutions
Revenue
FY2020(Actual)
44

Copyright 2021 FUJITSU LIMITED
Breakdown of International RegionsExcluding Japan
(Supplementary)Financial Results
for FY2020(Billions of yen)
Change
Special items/
restructuring
Excl.
Special
items/restructuring
Revenue 766.3 723.7 -28.0 -14.6 Operating
Profit3.8 11.6 9.1 -1.3
Revenue 356.0 347.8 - -8.1 Operating
Profit4.7 5.3 -1.6 2.2
Revenue 171.6 170.4 - -1.1 Operating
Profit10.8 5.3 -0.6 -4.8
Revenue 66.6 50.7 -12.1 -3.7 Operating
Profit-17.4 -5.4 11.3 0.6
Revenue 86.4 79.8 - -6.5 Operating
Profit2.3 2.6 - 0.2
Revenue 74.5 74.3 - -0.2 Operating
Profit2.0 1.7 - -0.2
Revenue 11.0 0.4 -15.8 5.2 Operating
Profit1.2 1.9 - 0.6
Note: Revenue includes Inter-region revenue.
NWE[Northern & Western
Europe]
Americas
Asia
Others
CEE[Central & Eastern
Europe]
Oceania
International Regions
Excluding Japan
FY2019(Actual)
FY2020(Actual)
45

Copyright 2021 FUJITSU LIMITED
Changes in Financial Indicators
(Billions of yen)
FY2018
(Actual)
FY2019
(Actual)
FY2020
(Actual)
316.2 405.5 316.3
(-100.4) (-46.2) (-165.5)
0.28 0.33 0.22
36.5 38.9 45.5
9.4 13.5 15.1
512.50 791.20 1,013.78
*1 Return on Equity Attributable to Owners of the Parent (%)
*2 Earnings per share(Basic)
D/E Ratio (Times)
Equity Attributable to Owners of the Parent Ratio (%)
ROE(%)
EPS(Yen)
Interest-bearing Loans
(Net Interest-bearing Loans)
*1
*2
(Supplementary)Financial Results
for FY2020
46

Copyright 2021 FUJITSU LIMITED
Business Segment InformationBreakdown of Technology Solutions
(Supplementary)Earnings Forecast
for FY2021
(Billions of yen)
3,043.6 - 3,200.0 - 156.3 156.3 -
Solutions/Services 1,765.9 - 1,980.0 - 214.0 214.0 -
System Platforms 665.4 - 680.0 - 14.5 14.5 -
System Products 420.3 - 410.0 - -10.3 -10.3 -
Network Products 245.1 - 270.0 - 24.8 24.8 -
723.7 - 735.0 - 11.2 11.2 -
Common -111.5 - -195.0 - -83.4 -83.4 -
188.4 -7.4 240.0 - 51.5 44.1 7.4
Solutions/Services 183.5 - 230.0 - 46.4 46.4 -
System Platforms 41.2 -5.0 56.0 - 14.7 9.7 5.0
11.6 -2.3 22.0 - 10.3 8.0 2.3
Common -47.8 - -68.0 - -20.1 -20.1 -
International Regions Excluding
Japan
OP
PL
Technology Solutions
Excl.
Special itemsSpecial items
Revenue
Technology Solutions
FY2020
(Actual)
FY2021
(Forecast)ChangeSpecial items Special items
International Regions Excluding
Japan
47

Copyright 2021 FUJITSU LIMITED
Assumption used for FY2021 Forecasts
1. Exchange Rates(Average)and Impact of Fluctuation
U.S. dollar / Yen 109 106 105 -0.7 Billion yen
Euro / Yen 121 124 120 -0.1 Billion yen
British pound / Yen 138 139 140 0.0 Billion yen
* Impact of 1 yen fluctuation on operating profit (yen appreciation).
FY2019(Actual)
Impact of
Exchange Rate
Fluctuation
(Forecast)*
FY2021(Forecast)
FY2020
(Actual)
(Supplementary)Earnings Forecast
for FY2021
48

Copyright 2021 FUJITSU LIMITED
Assumption used for FY2021 Forecasts (Supplementary)Earnings Forecast
for FY2021
(Billions of yen)
Technology Solutions 53.8 46.6 57.5
Ubiquitous Solutions 0.2 0.2 0.5
Device Solutions 42.4 40.7 42.0
96.4 87.5 100.0
84.5 76.0 85.0
3. R&D Expenses
123.3 113.8 115.0
[3.2%] [3.2%] [3.2%] [As % of Revenue]
R&D Expenses
Capital expenditures and depreciation do not include the impact of adopting IFRS 16
(Leases).
Capital Expenditures
Depreciation
2. Capital Expenditures and Depreciation
(Property, Plant and Equipment)
FY2019(Actual)
FY2020(Actual)
FY2021(Forecast)
49