FY2021 Consolidated Financial Results
40
FY2021 Consolidated Financial Results April 28th, 2021 AISIN CORPORATION
Transcript of FY2021 Consolidated Financial Results

FY2021
Consolidated Financial Results
April 28th, 2021
AISIN CORPORATION

1
• Transformation of corporate
structure in response to CASE
• Restructuring into a corporate
entity with high profitability
Group-wide efforts to drive the two key reforms
Exit from or rebuilding of uncompetitive existing businesses
&
introduction of lean organizational structure
Initiatives to Date

2
Group Action Guidelines
2. Exit from uncompetitive businesses without exception
3. Collaboration is evolving from Separate Management to
Group Management
1. Proactively read the future, and take swift positive action
Formulation of new Corporate Principles
Exit from bed and sewing machine business
Management integration of Aisin Seiki and Aisin AW
Initiatives to Date

3
Business2

4
I. 2023 Targets:
Progress of
Medium-term
Management Plan
1. Medium-Term Management Plan
Management Targets for 2023
2. Powertrain unit sales forecast
Estimated sales of brake products
3. Progress in fixed cost reduction
II. Vision for 2030
“A Decade of Growth
by Changing What’s
Inside”
・ What we want to be in 2030
・ Revolution in business
environment
・ Responding to electrification
・ New business initiatives
・ Orientation of development
and investment
・ Vision Targets
III. Initiatives for Carbon Neutrality by 2050
Today’s Presentation

5
1. Medium-Term Management Plan: Management Targets for 2023
I. 2023 Target: Progress of Medium-term Management Plan
IR Material (April 2019)
Aiming to achieve an operating profit margin of at least 7% in FY2023, after
bottoming out in FY2019.
(Trillions of yen)
Revenue from CASE
OP margin
Revenue from existing products
(FY)
ROE

6
818 905 930
6185
270879990
1200
7% 9%
23%
- 80%
80%
0
2500
2020 2021 2023
Ratio of electrification
Share of
electrification(10,000 units/year)
ICE
・ Steadily capture ICE demand until 2023.
・ Steadily expand sales to the rapidly expanding electrification market
after 2023.
(FY)
2. Powertrain unit sales forecast
I. 2023 Target: Progress of Medium-term Management Plan
* The number of vehicles includes AT, CVT, HV, and eAxle.
7
(billions of yen)
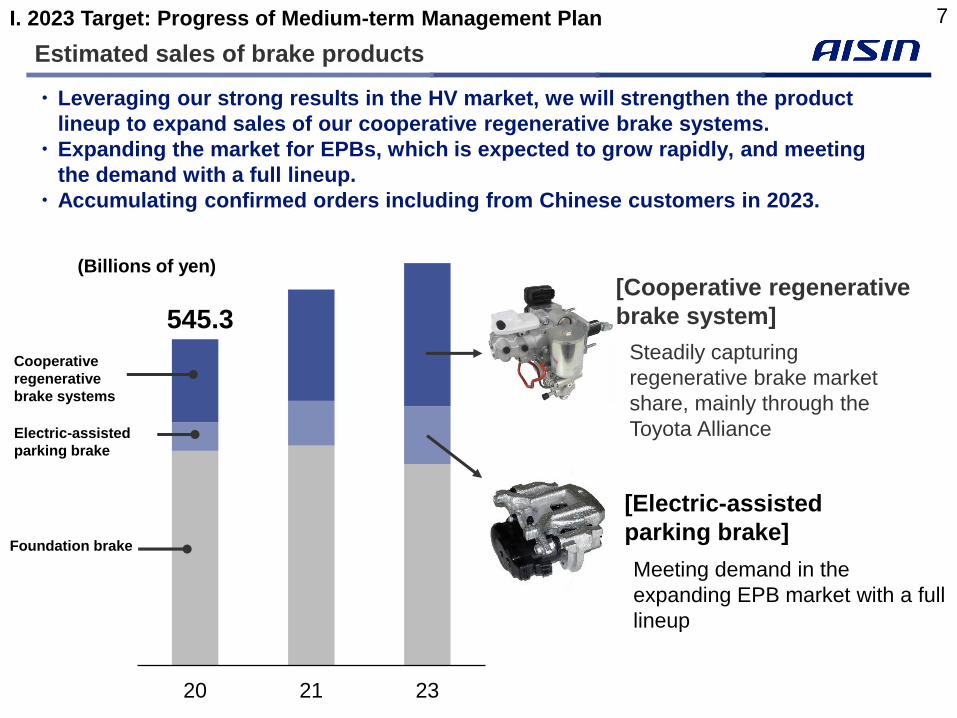
Steadily capturing
regenerative brake market
share, mainly through the
Toyota Alliance
[Cooperative regenerative
brake system]
[Electric-assisted
parking brake]
20 21 23
Foundation brake
Electric-assisted
parking brake
Cooperative
regenerative
brake systems
545.3
Estimated sales of brake products
・ Leveraging our strong results in the HV market, we will strengthen the product
lineup to expand sales of our cooperative regenerative brake systems.
・ Expanding the market for EPBs, which is expected to grow rapidly, and meeting
the demand with a full lineup.
・ Accumulating confirmed orders including from Chinese customers in 2023.
Meeting demand in the
expanding EPB market with a full
lineup
I. 2023 Target: Progress of Medium-term Management Plan
(Billions of yen)

8
FY2020Fixed cost
reduction
(Target)
90
bn yen
FY2020 Results
Bringing forward
structural reforms
30 bn yen
Permanent
30 bn yen
Temporary
35 bn yen
Profit
measures
65
bn yen
By FY2023
Ongoing
effects of
structural
reforms
30 bn yen
Permanent
profit measures
30 bn yen
By FY2023
Over
30 bn yen
・ Creation of synergy effects
(System integration, business
consolidation/elimination)
・ Promotion of DX
・ Reorganization of
subsidiaries
・ Optimization of equipment
investment
・ Productivity improvement
through initiatives to
increase job satisfaction
Promoting further efficiency improvement, including the effects of integration,
by FY 2023
95 bn yen
Progress in fixed cost reduction
I. 2023 Target: Progress of Medium-term Management Plan

9
Target
Company
Efficiency of
Administration
Consolidation of
Companies
Theme ThemeCompletion/
Projected
FY 2021
and beyond(Projects to be
considered)
Completion/
Projected
FY 2021
and beyond(Projects to be
considered)
Japan 23 2 1 1 9 5 4
North
America 21 2 2 - 4 2 2
China 14 1 1 - 7 4 3
Australasia 20 6 5 1 4 2 2
Europe 6 - - - 10 9 1
Other 12 1 1 - 5 4 1
Total 96 12 10 2 39 26 13
I. 2023 Target: Progress of Medium-term Management Plan
Promoting the consolidation and elimination of unnecessary functions of
subsidiaries in the Group and globally.
Target setting completed for 70% of the 51 themes covered.
[Case Study] Reorganization of Subsidiaries
10
0%
2%
4%
6%
8%
10%
12%
0
1
2
3
4
5
2016 2017 2018 2019 2020 2021 2023
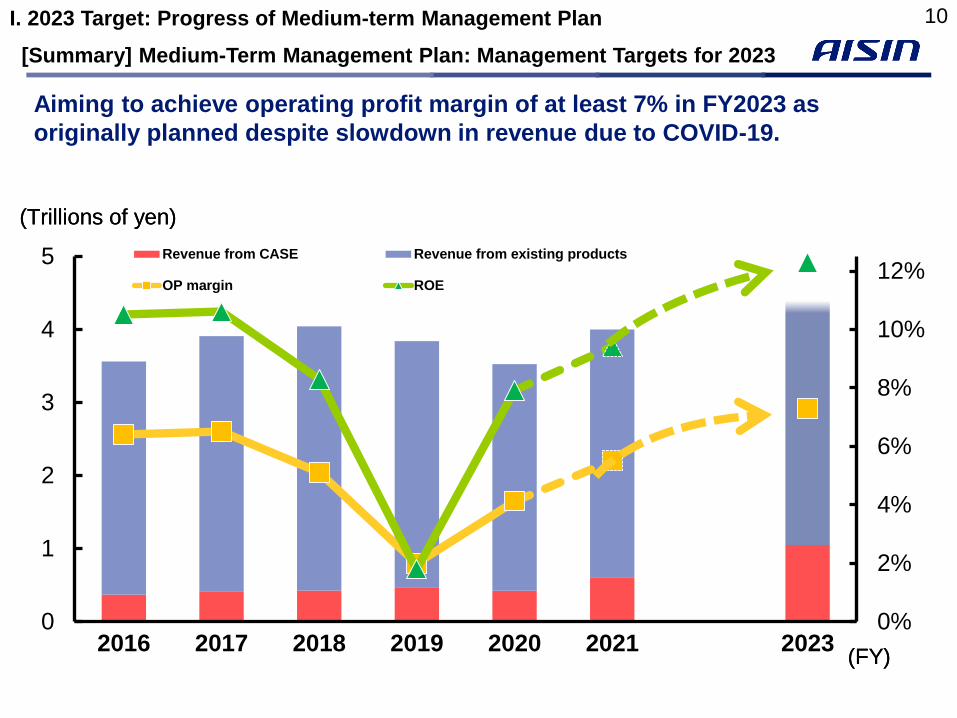
Revenue from CASE Revenue from existing products
OP margin ROE
[Summary] Medium-Term Management Plan: Management Targets for 2023
(Trillions of yen)
(FY)
(Trillions of yen)
(FY)
I. 2023 Target: Progress of Medium-term Management Plan
Aiming to achieve operating profit margin of at least 7% in FY2023 as
originally planned despite slowdown in revenue due to COVID-19.

11
I. 2023 Targets:
Progress of
Medium-term
Management Plan
1. Medium-Term Management Plan
Management Targets for 2023
2. Power training unit sales forecast
Estimated sales of brake products
3. Progress in fixed cost reduction
II. Vision for 2030
“A Decade of Growth
by Changing What’s
Inside”
・ What we want to be in 2030
・ Revolution in business
environment
・ Responding to electrification
・ New business initiatives
・ Orientation of development
and investment
・ Vision Targets
III. Initiatives for Carbon Neutrality by 2050
Today’s Presentation

12
Focusing on the next 50 years as “Aisin’s Compass”New Corporate Principles formulated (January 2021)
Initiatives to Date(1) Transformation of corporate structure in
response to CASE
(2) Restructuring into a corporate entity with high
profitability
Enhanced Vision: Formulated New Group Corporate Principles as New Aisin
II. Vision for 2030
Vision for 2030
Me
rge
r
with
AW
Clarifying the value to each stakeholder
Inspiring “Movement,” Creating Tomorrow
MissionWhy we exist
VisionHow we see the future
(in pursuit of our mission)
ValueWhat we strive to give
・To our colleagues
・To our customers
・To the future
We will deliver beauty to our future earth, bringing
freedom and happiness to “movement.”
We will act on our dreams and aspirations, show
concrete solutions to environmental and social
challenges, focusing on the evolution of “movement” by
way of clean power as the core and create a safe and
comfortable future for everyone.
To our colleagues,
growth and
happiness
To our customers,
inspiration and
trust
To the future, a
sustainable
environment
13
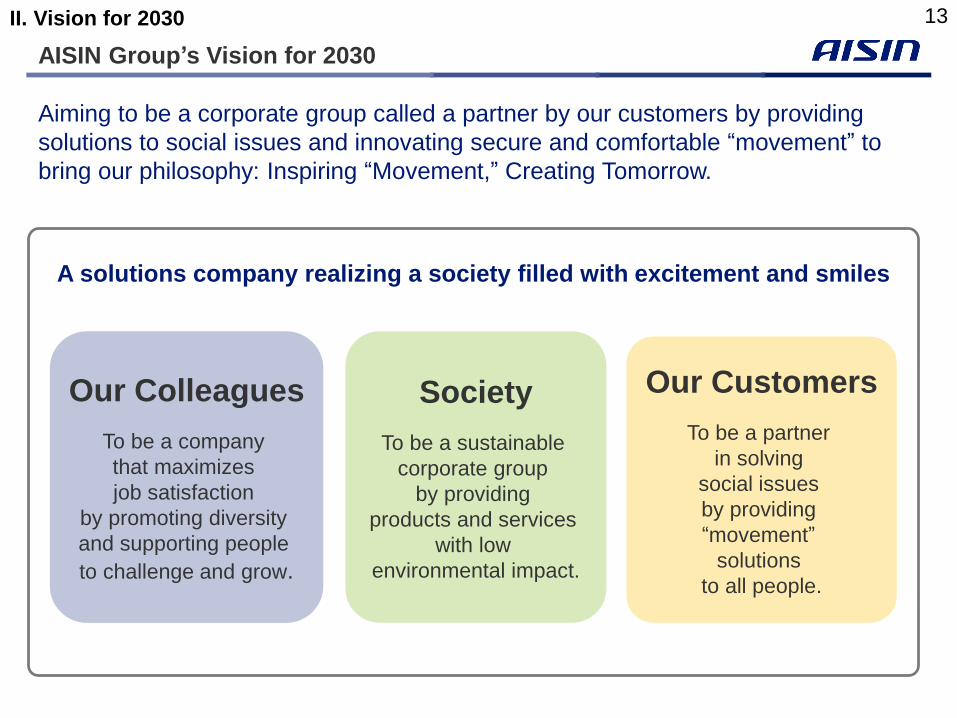
Aiming to be a corporate group called a partner by our customers by providing
solutions to social issues and innovating secure and comfortable “movement” to
bring our philosophy: Inspiring “Movement,” Creating Tomorrow.
Our Colleagues
To be a company
that maximizes
job satisfaction
by promoting diversity
and supporting people
to challenge and grow.
A solutions company realizing a society filled with excitement and smiles
Our Customers
To be a partner
in solving
social issues
by providing
“movement”
solutions
to all people.
Society
To be a sustainable
corporate group
by providing
products and services
with low
environmental impact.
AISIN Group’s Vision for 2030
II. Vision for 2030

14
Setting goals for each stakeholder
Reduction rate of CO2 emissions
during manufacturing
(vs. 2013)
SDGs: Priority Issue KPIs Revenue ratio of
solution-oriented products
More than
60%
17%
Reduction of
35% or greater
4.0 pointsor more
3.4 points
2020 2030
Example: Job satisfaction index
±0%
*Employee awareness survey
(out of 5 points)
Production of electrified
products to achieve
virtually zero CO2 emissions
2020 2030
100
50
[%]
0
+50
0
[%]
▲50
5
4
[points]
3
SocietyOur
Customers
Our
Colleagues
Target ItemsII. Vision for 2030
2020 2030
0
OP margin ROIC
8%
4.1%13%
5.1%
Revenue
¥3.5
trillion
*NOPAT (Net Operating Profit After Taxes) /
(Inventories + Fixed assets)
2020 20302020 20302020 2030
Shifting to ROIC management that emphasizes investment efficiency in group management, DX, etc.
as we accelerate investment to solve social issues and achieve growth and happiness for our associates.
10
5
0
20
10
0
[%]
15
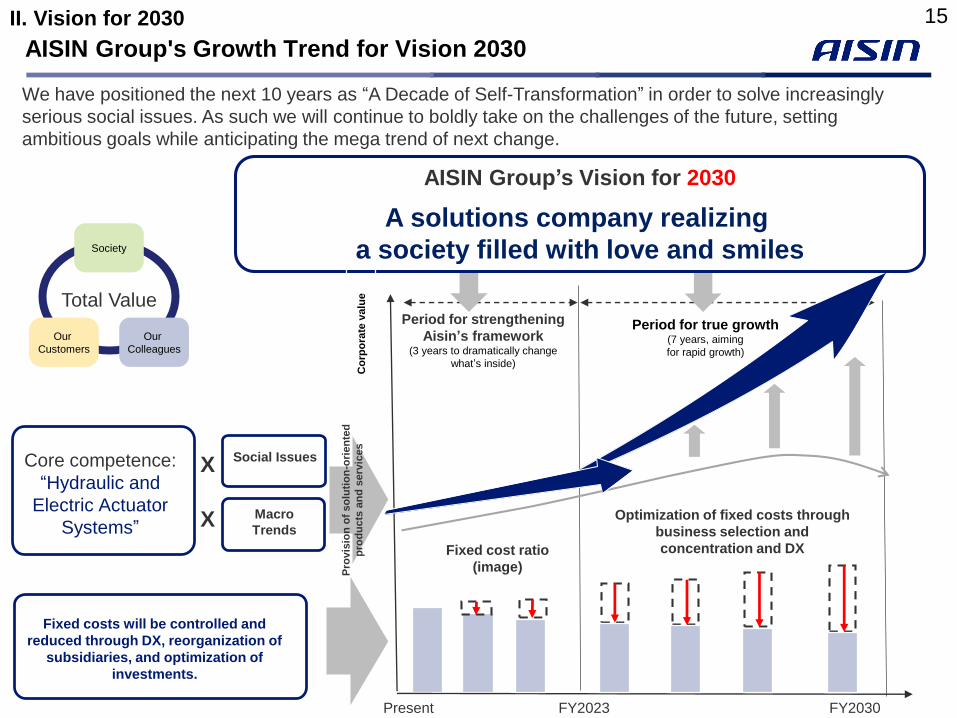
Period for strengthening
Aisin’s framework(3 years to dramatically change
what’s inside)
Period for true growth(7 years, aiming
for rapid growth)
FY2023 FY2030Present
We have positioned the next 10 years as “A Decade of Self-Transformation” in order to solve increasingly
serious social issues. As such we will continue to boldly take on the challenges of the future, setting
ambitious goals while anticipating the mega trend of next change.
AISIN Group's Growth Trend for Vision 2030
AISIN Group’s Vision for 2030
Social Issues
A solutions company realizing
a society filled with love and smilesSociety
Our
Customers
Our
Colleagues
Total Value
Core competence:
“Hydraulic and
Electric Actuator
Systems”Fixed cost ratio
(image)
Fixed costs will be controlled and
reduced through DX, reorganization of
subsidiaries, and optimization of
investments.
Macro
Trends
X
X
Co
rpo
rate
valu
e
Pro
vis
ion
of
so
luti
on
-ori
en
ted
pro
du
cts
an
d s
erv
ices
II. Vision for 2030
Optimization of fixed costs through
business selection and
concentration and DX

16
Enhancing solution-based products that contribute to the resolution of social issues
II. Vision for 2030
Mobility platform that contributes to solving problems
by providing services
Energy Management Systems
that contribute to decarbonization
of the region
New and next-generation products
that solve customer issuesIntegrated Control
and Vehicle Dynamicsthat contribute to safe and comfortable transportation
Entry systems that contribute to
free movement
Provision of safe travel
and transportation
Reduction of
traffic accidents
Clean Energy
Driving the shift
Automated parking system
Power sliding door
Shared shuttle bus service
Electric-assisted
parking brake
Driver
Monitoring
ENE-FARM
typeS
Preventing global
warming
Cooperative
regenerative
brake systems
e-AxleHV
transmissions
Man
ufa
ctu
rin
gB
us
ine
ss
Cre
ati
on
Present Future
16
Logistics support

17
Composition Ratio of Solution-oriented Products in each Business Territory
II. Vision for 2030
[Powertrain]
FY2020
FY2030
9% 60%
39%
[Body] 24%50%
[New Business]
[CSS]
Electrification products
[Energy solutions]
FY2030
FY2020 FY2030
60%
Cooperative regenerative brake systems,
EPB, automated parking, etc.
FY2020
Entry systems that contribute to free movement
Integrated Control and Vehicle Dynamicsthat contribute to safe and comfortable transportation
Mobility platform that contributes to solving problems by providing services
Energy Management Systems that contribute to decarbonization of the region
New and next-generation products that solve customer issues
[Brake + Vehicle Safety]
FY2030
FY2020 FY2030
FY2030
FY2020 FY2030
FY2020
100%
100%
100%
Solution-
oriented products
*Connected and Sharing Solutions
17
Existing
products

18
Revolution in Aisin’s Business Structure
More than 60%
40%
% (Comp.)
Aiming for growth that exceeds the market evolution, “A decade of
changing what’s inside” for sustainable growth
3,525.7 bn
17%
83%
II. Vision for 2030
¥5 trillion
Solution-oriented
products
Existing products
18
FY2020 FY2030

19
Lineup of electrified products
Expanding sales of products in related fields where the market is growing along with
electrification
II. Vision for 2030 ~ Electrification Strategy
HV damper
Cooperative
regenerative
brake
systems
e-Four
HV transmissions
eAxle
Cooling water valve
Thermal
Management
System
Ele
ctr
ic d
rive
tra
in
Regenerative
brakes
HV damperElectric Pump
Forecasting the growth rate of the
electrification market
6 times
in 10 years
FY2020 FY2030
19

20
818 905 930
6185
270879
990
1200
7% 9%
23%
- 80%
80%
0
2500
2020 2021 2023 2030
More than 60%
Unit Sales of Powertrains
Ratio of electrification
Share of
electrification
(FY)
(10,000 units/year)
ICE
・ While steadily responding to ICE until around 2023, prepare for the
rapidly expanding electrification market.
・ The ratio of electrified vehicles will increase to 60% or more in 2030.
* The number of vehicles includes AT, CVT, HV, and eAxle.
II. Vision for 2030 ~ Electrification Strategy 20

21
0
50
100
150
200
250
0~
25
26~
50
51~
75
76~
100
101~
125
126~
150
151~
175
176~
200
201~
225
226~
250
251~
275
276~
300
301~
325
326~
350
351~
375
376~
999
内製 外製
(10,000 units/year)
eAxle Market Trends and Targets
[kW]
Small size
High output
External production
ratio: 20%
External production
ratio: 65%
~25 ~100 ~175 ~250 ~325 ~99925 years of IHS data
External production
ratio: 59%
System output
(kW)
Vehicle weight
(kg)
50
100
150
200
250
01000 2000 40003000
[Aisin’s product lineup]
eAxle
II. Vision for 2030 ~ Electrification Strategy
High efficiency
High performance
《High Output Market》High efficiency and high added value
through the use of reduction gear technology
《Compact Car Market》Miniaturization technology
cultivated in AT
Customers’ needs for modules will expand in the compact car and
high output markets
21
Internal
production
External
production

22
How to Market Compact Cars (mini and A-segment)
II. Vision for 2030 ~ Electrification Strategy
• High output secured by permanent magnet
synchronous motor
• Downsizing by 3-axis gear train
(3) [For mini and A-segment vehicles] (Under development)
(1) [Ultra-compact EV]
(2) [For A-segment] (Under development)
Development of a unit for mini and A-segment cars by utilizing the
miniaturization design technology cultivated in AT
Toyota Motor Corporation “C+pod” installed
Production started in 2020
Ultra-compact unit aimed
at the world’s smallest
size that can be installed
in the mini class
《Body Size x Output Torque》
• Small-capacity and light-weight type
aimed at the Japanese, European
and Asian markets
• Small-diameter, high-efficiency
motor for either front or rear
mounting
22
Estimated trend
Body S
ize [
L]
Output Torque (Nm)
17-18 yrs.
19-20 yrs.
21-22 yrs.
23-24 yrs.
Aisin

23Targeting the D/E-Segments and Commercial Vehicle Markets
~ Product Lineup Supporting High Efficiency and High Driving Force
Developing and expanding sales of high-efficiency, high-performance units for
SUVs, luxury, and commercial vehicles
Integrated eAxle for
commercial frame vehicles
Rear eAxle for luxury
vehicles
II. Vision for 2030 ~ Electrification Strategy
Contributing to the electrification of
commercial vehicles with eAxle that
is compatible with rigid-axle
vehicles
Additional gearshift function efficiently
utilizes the power of the motor from
high-speed to low-speed and maximum
torque
23

24
With China Roadmap 2.0 and the inauguration of the Biden administration in the U.S., there is a great opportunity for
HEVs.
1-Motor: Expanding sales by promoting its superiority to the growing large SUV market. 2 confirmed, 2 inquiries.
2-Motor: Expanding sales based on the results for Toyota. 5 confirmed, 8 inquiries.
Steadily capturing the growing HV market for the time being
until full-scale EV market penetration by refining existing technologies
0
System output
(kW)
2000
100
200
Vehicle weight
(kg)
FF
300
1000
eAxle
2-Motor
1-Motor
Addressing HVsII. Vision for 2030 ~ Electrification Strategy 24

25
Proposing a cooling system for EV/HEV with electric pumps at its core for
higher efficiency
(Billions of yen)
Cooling Modules
668
0
1000
2020 2030
66.8
Valve
Pump
Thermal Management System
II. Vision for 2030 ~ Electrification Strategy
BatteryA/C
H/P Ch
ille
r
Valve
Valve
Electric water pump
Valve
Valve
eAxle/
Inverter
Electric oil pump
Ele
ctr
ic
heate
r
Motor
Inverter
Electric oil pump
Electric water pump
Sales target for thermal management system products
25
100
FY2020 FY2030

26
[Body] Shifting to high value-added system products
[Vehicle Safety] Capturing growth fields such as automated parking and DMS
Exit from unprofitable products
OP
ma
rgin
Items A B C D E F G H I ...
Not high growth potential
Low-profitability products
System products
High growth potential
Resource intensive
System products
・Power sliding door
・Power back door
・Sunroof
・Entry systems
…
II. Vision for 2030
Body and Vehicle Safety Business
Full-scale mass
production of
automatic driving-
related products
FY2020 FY2030
Automated driving-related
(automated parking, AEB, DMS)
Existing
(electric column and chassis)
FY2020 FY2030
Existing
26
システム商品
System
products

27
Tier 2
Tier 1
Vehicle / Electronics P / FCar
manufacturer
Control
Mo
tor
T/A
Control
Mo
tor
Mech
an
ical
Mo
tor
Mech
an
ical
Control
Mo
tor
Mech
an
ical
Driving Stopping Turning
Control
Mech
an
ical
Electric drive
(HV、eAxle)Brake
Front
steering
Rear
steering
Opening /
Closing
systems
Comfort
Inve
rter
Mobility
Companies
Tier 0.5
Mo
tor
AD/ADAS
MaaS, Sharing, etc.
Location-based services (LBS)
Control
Body
Integrated control
Vehicle dynamics Body
Based on hydraulic and electric actuator
systems, we aim to evolve into a Tier 0.5
system supplier by realizing integrated control
that contributes to the safe and comfortable
movement of all people.
Becoming a partner for vehicle dynamics systems that support Driving,
Turning, Stopping, and Comfort
II. Vision for 2030
Integrated Control and Vehicle Dynamics
Explained on the next page
27

28
Initiatives for Mobility Service Platform
Convenience Store Delivery App
(Efficient Logistics)Choisoko
(Mobility support)
Using data to increase the attractiveness
and to improve the quality of automotive parts
Collecting data
with high-precision location information
Mobility Service Platform
Location-based services (LBS)
Vehicle behavior analysis
technology
Location information analysis
technologyImage data analysis technology
Content creation through data analysis
Powertrain Unit Driver Monitoring In-vehicle
CamerasBrake systemEntry system
Image dataBehavior data
Car navigation
system
Smartphone
navigation
Tools for service utilization (APIs, software development kits)
Municipality Transportation companies Retailers Logistics
Building a platform based on advanced location information technology cultivated
through car navigation system. Developing and providing services to solve various
social issues in collaboration with external parties.Collaborating with more
than 50 partners,
including 16 IT
companies, 7 logistics
companies, and 20
municipalities.
II. Vision for 2030 ~ CSS Business
Development and provision of services using the platform
28

29II. Vision for 2030 ~ New Business
[The world’s smallest*1 ultra-fine water particles]
Medical treatment
Culture and
Growth
Industrial use
■Long-lasting moisturization of skin
■Possibility of clinical application for atopic dermatitis, etc.Beauty
Cleanliness and
Hygiene
Special polymer
membrane cartridges
Generation and release of moisture without water supply
*1 In comparison with humidification technologies that produce water particles. (Researched by Aisin as of April 12, 2021)
The 120th Annual Meeting of the Japanese
Dermatological Association
(June 10-13, 2021) Products to be exhibited
* Comparing the amount of keratin moisture after applying AIR
and steam particles to the skin for 20 minutes each.
1.4~1.5 nm
Moisture
Exp
an
sio
n t
o m
ult
iple
are
as
Water molecules Water particles
0.38 nm
Converted to the world’s
smallest water particles*1
*1
Initial Following 1H 2H 3H 4H 5H 6H
Steam particles
1,000 nm(nanometer) or more
Began using ultra-fine water particles from our proprietary special
polymer membrane cartridges in various fields, including beauty care.
29
Steam particles

30
Femtosecond Laser Compact Mobility Technology
Application of Core Technologies to Industrial Equipment
Small Precision Gear Pump (ESC)
Precision Hydraulic Control (AT-control)
Motion Reduction Technology
(Active damping treatment)
ESC module Componentry (Gear Pump)
X
High Pressure Cleaning Tools
for Machining Centers
without change
AT
Valve Body
Applying core technologies cultivated in automotive parts to equipment at
manufacturing sitesSales start
in FY2021
Electric PumpECU
II. Vision for 2030 ~ New Business
Industrial Equipment
Applying Hydraulic Control
X
=
Unshakable AGV
[Automated conveyance robots]
30

31
R&D and Investment Orientation
II. Vision for 2030
Development expenses and investments shifted to solution-based products
Investment efficiency is followed by ROIC
Develo
pm
en
t exp
en
se
Inve
stm
ent
FY2020 FY2030
FY2020 FY2030
24%
55%
Solution-oriented product ratio
31

32
16年 17年 18年 19年 20年 30年
Reforming the Die-casting business, which has long been unprofitable.
Changing business structure to pursue quality with an awareness of ROIC
(1) No investment in increased capacity
(2) Regular investment will be halved over 10 years
[DC Investment Amount]
30% reduction in the number of lines, mainly low-
profit small DCs
Productivity improvement and CO2 reduction through
technological innovation
Appropriate Level of Investment in DC Business
II. Vision for 2030
0
vs. Historical
Average
70% reduction
Increased
capacity
investment
Regular investment
(Type and maintenance
investment)
(Billions of yen)
100
200
300
Investment Level
(Historical Average)
32
FY2016 FY2017 FY2018 FY2019 FY2020 FY2030
30
20
10
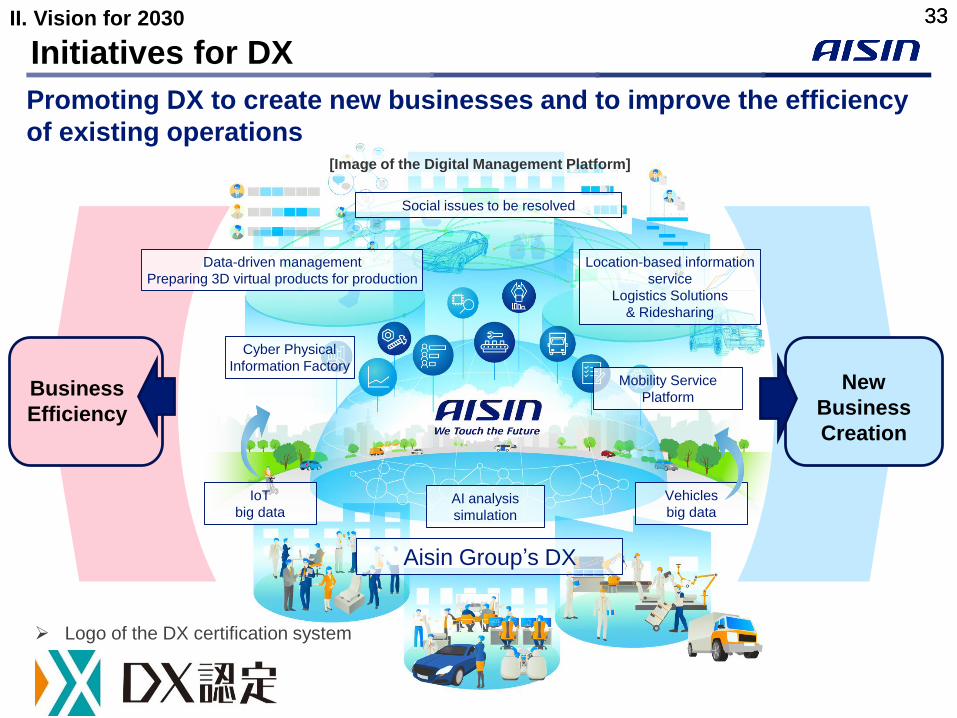
33II. Vision for 2030
[Image of the Digital Management Platform]
Aisin Group’s DX
Social issues to be resolved
Data-driven management
Preparing 3D virtual products for production
Location-based information
service
Logistics Solutions
& Ridesharing
Cyber Physical
Information FactoryMobility Service
Platform
AI analysis
simulation
IoT
big data
Vehicles
big data
Logo of the DX certification system
New
Business
Creation
Business
Efficiency
Promoting DX to create new businesses and to improve the efficiency
of existing operations
Initiatives for DX
33

34
Improving Business Efficiency through DX
■Priority Measures
(1) Management Resources Protection
Standardization and streamlining of
operations
(2) Design and preparation
Shorter product development period
through digitization
(3) Production and logistics
Improvement of quality and productivity
at manufacturing sites with IoT
Reduce development period by 30%
Reduce production cost by 30%
More than 25% increase in
efficiency of Administration
Physical Factory
Cyber Factory
DATA LAYER
(3D Design/IoT)
Smart Device Applications
3D Model
Processing
verification
Operations analysis
(simulation)
All-members-
participation
Cross-
organizational
II. Vision for 2030
By FY2025
By FY2025
By FY2030
Use of DX to fundamentally change operations and to improve efficiency
34

35
Reduction rate of CO2 emissions
during manufacturing
(vs. 2013)
SDGs: Priority Issue KPIs Revenue ratio of
solution-oriented products
17%
2020 2030
Example: Job satisfaction
index
±0%
*Employee awareness survey
(out of 5 points)
2020 2030
100
50
[%]
0
+50
0
[%]
▲50
5
4
[points]
SocietyOur
Customers
Our
Colleagues
Target ItemsII. Vision for 2030
2020 2030
0
OP margin ROIC
8%
4.1%
13%
5.1%
Revenue
¥3.5
trillion
*NOPAT (Net Operating Profit After Taxes) /
(Inventories + Fixed assets)
2020 20302020 20302020 2030
Shifting to ROIC management that emphasizes investment efficiency in group management, DX, etc.
as we accelerate investment to solve social issues and achieve growth and happiness for our associates.
10
5
0
20
10
0
[%]
35
4.0 pointsor more
3.4 points
Reduction of
35% or greater More than
60%Production of electrified
products to achieve
virtually zero CO2 emissions

36
I. 2023 Targets:
Progress of Medium-
term Management
Plan
1. Medium-Term Management Plan
Management Targets for 2023
2. Power training unit sales forecast
Estimated sales of brake products
3. Progress in fixed cost reduction
II. Vision for 2030
“A Decade of Growth by
Changing What’s Inside”
・ What we want to be in 2030
・ Revolution in business
territory
・ Responding to electrification
・ New business initiatives
・ Orientation of development
and investment
・ Vision Targets
III. Initiatives for Carbon Neutrality by 2050
Today’s Presentation36

37
Goals (milestones) for FY2030
■Reducing CO2 emissions from product manufacturing through use and disposal toward a low-carbon society
KPIFY2019
Results
FY2020
Targets
FY2030
Targets
Life cycle CO2 emissions reduction rate 17,330,000 t-CO2 /
year
Improvement of
accuracy of measuring
results for the purpose
of setting targets
Reduction of 25%
or more[Compared to 2013]
Production CO2 emissions reduction
rate (total)2,819,000
t-CO2 / year
2,738,000
t-CO2 / year
Reduction of 35%
or more[Compared to 2013]
(2,474,000 t-CO2 / year)
Sales ratio of electrification products that
contribute to reducing CO2 emissions 10% 13% 50% or higher
■To expand products toward substantially zero GHG emissions in 2050
Contribution amount of CO2 reduction by
energy-related products (sales) 480,000
t-CO2 / year
530,000
t-CO2 / year
2,300,000
t-CO2 / year
■To promote energy-related development toward a carbon-free recycling society
*1 Target values are under consideration in response to the
latest government policy
Man
ufa
ctu
rin
gP
rod
ucts
CO2 Reduction Targets for Production and Products (announced in October 2020)
III. Carbon neutral by 2050
*1
*2 Sales ratio of electrification products included in total sales of
related fields (power training and running safety)
*2
37

38
Toward a 35% Reduction in Production CO2 by 2030
CO
2e
mis
sio
ns
(mill
ion
to
ns/y
ea
r)
-35% or over[SDGs Target]
FY2013
(Base-year)
FY2019
(Result)FY2025 FY2030
AsIs
-25%
Scope2
Scope1
Energy-
saving
activities
Energy-
saving
activities
Casting (iron/alx)
247.4 281.9
185160
Renewable energy
・ Promoting the reduction of production CO2 emissions, and make all electrified products “Production CO2-free
Products” by 2030.
・ By promoting sales of clean energy-related products, the contribution amount to CO2 reduction in society will
be increased to the equivalent of the Aisin Group’s total production CO2 emissions.
Production
of CO2-free
Products
Contributing to
CO2 reduction
through clean
energy-related
products
Plan for
production
CO2
reduction
(Scope1+2)
Selling a cumulative total of 2 million
clean energy products by FY2030,
contributing to CO2 reduction
(equivalent to 2.3 million tons of CO2
reduction contribution)
*Comparison of thermal power generation of each product (ENE・FARM: our survey, COREMO: Hokkaido Gas’s catalog values)
(Reference) Ministry of the Environment, Survey on CO2 Emissions, Households with 4 members
(3.84 t -CO2/household/year)
CO2 emissions
reduction
from products
ENE-FARM typeS COREMO
1.5 t -CO2/unit/year 1.5 t -CO2/unit/year
-230[Energy Conservation Activities] Solar Power
Generation at Aisin Tohoku
・Start production of electric
pumps in the expanded area
・About 30% of the expansion
will be powered by renewable
energy
All electrification
productseAxle/
HEV
transmissions
Electrification
drivetrain unit
GHP
1.7 t -CO2/unit/year
III. Carbon neutral by 2050 38

39
【Note on future predictions 】Excluding matters related to past and current facts, the business results forecasts and forward-
looking estimates, strategies and targets disclosed by the Company are estimates regarding the
future. These estimates are formulated from plans, expectations and judgments made based on
information that the Company can obtain at the present time, and certain assumptions deemed
reasonable. Accordingly, actual results may vary from the disclosed business results forecasts,
etc., due to variable factors with uncertainties, including the economic situation.
AISIN CORPORATION and its employees assume no responsibility whatsoever regarding any
losses incurred due to the use of information on our documents.