Consolidated Financial Results(Comprehensive) For FY2020
17
Tadano Ltd. Consolidated Financial Results(Comprehensive) For FY 2020 (April 1, 2020 through March 31, 2021) May 12, 2021 Notes: 1) Tadano Ltd. provides this comprehensive financial results report in order to supplement the previously released quantitative report with qualitative information concerning business results for the period under review. Unless otherwise stated, no amendments have been made to the quantitative information herein. 1 < Notes > Forward-looking statements contained in this report are based on information available as of the date this report was prepared. A variety of factors may cause actual results to differ from projections. Presentation of demand and share: Abbreviation in this report: “TC” refers to Truck Cranes, “RT” to Rough Terrain Cranes, “AT” to All Terrain Cranes The acquisition of the Demag Mobile Cranes business (Hereafter “Demag”) was completed on July 31, 2019. In this report, FY 2019 information for Demag is treated as follows: • FY2019 Consolidated Financial Statements: B/S as of 31 st December and P/L from August to December are included. *Adjustments are made retroactively due to PPA. PPA(“Purchase Price Allocation”) is a process to appraise assets and liabilities at fair value and allocate purchase price. • Demand: Crawler crane demand figures are not included. • Share: Sales unit figures for Demag products for January - December are included. • Figures showing demand based on Tadano research are rounded to the nearest ten units. • Figures showing share are rounded to the nearest whole share. • Mobile Cranes produced in Russia and produced in China for the Chinese market are excluded from demand.
Transcript of Consolidated Financial Results(Comprehensive) For FY2020

Tadano Ltd.
Consolidated Financial Results(Comprehensive) For FY 2020
(April 1, 2020 through March 31, 2021)
May 12, 2021
Notes:
1) Tadano Ltd. provides this comprehensive financial results report in order to supplement the previously released quantitative report with qualitative information concerning business results for the period under review. Unless otherwise stated, no amendments have been made to the quantitative information herein.
1
< Notes >
Forward-looking statements contained in this report are based on information available as of the date this report was prepared. A variety of factors may cause actual results to differ from projections.
Presentation of demand and share:
Abbreviation in this report: “TC” refers to Truck Cranes, “RT” to Rough Terrain Cranes, “AT” to All Terrain Cranes
The acquisition of the Demag Mobile Cranes business (Hereafter “Demag”) was completed on July 31, 2019. In this report, FY 2019 information for Demag is treated as follows:
• FY2019 Consolidated Financial Statements: B/S as of 31st December and P/L from August to December are included. *Adjustments are made retroactively due to PPA. PPA(“Purchase Price Allocation”) is a process to appraise assets and liabilities at fair value and allocate purchase price.
• Demand: Crawler crane demand figures are not included.
• Share: Sales unit figures for Demag products for January - December are included.
• Figures showing demand based on Tadano research are rounded to the nearest ten units.
• Figures showing share are rounded to the nearest whole share.
• Mobile Cranes produced in Russia and produced in China for the Chinese market are excluded from demand.

2
Despite consolidation of Demag business, net sales decreased by about 18%. Profits declined substantially due to changes in product sales composition. First operating loss recorded for the first time in ten years since FY2010.
(Unit: millions of yen)
FY2019 FY2020
Amount Percentage Amount Percentage
Net Sales 227,949 100% 186,040 100% -18.4%
Operating income 13,949 6.1% -4,196 -2.3% -
Ordinary income 13,791 6.1% -4,683 -2.5% -
Net income attributableto owners of the parent
6,433 2.8% -12,987 -7.0% -
Capital investment
Depreciation
* Figures for capital investments include leased assets.
USD
EUR
5,6664,527
12,902
¥121.81
PercentChange
¥106.82¥122.07¥109.05
5,695
Key Points of FY 2020 Financial Results
3
Cost of sales ratio deteriorated due to changes in product sales composition. SG&A expenses decreased as a result of cost-cutting efforts. Provision of allowance for losses related to violations of emission regulations and
expenses related to reorganization of European Operations were recorded as extraordinary losses. (Unit: millions of yen)
FY2019 FY2020
Amount Percentage Amount Percentage
Net sales 227,949 100% 186,040 100% -41,909
Cost of sales 172,007 75.5% 150,944 81.1% -21,062
Gross profit on installment sales -69 -0.0% 55 0.0% 124
Gross profit 55,872 24.5% 35,150 18.9% -20,722
41,923 18.4% 39,347 21.1% -2,575
Operating income 13,949 6.1% -4,196 -2.3% -18,146
Non-operating income and loss -158 -0.1% -486 -0.3% -328
Ordinary income 13,791 6.1% -4,683 -2.5% -18,474
Extraordinary income and loss -1,753 -0.8% -7,674 -4.1% -5,921
Income before income taxes 12,038 5.3% -12,358 -6.6% -24,396
Corporate taxes 5,683 2.5% 599 0.3% -5,084
-78 -0.0% 29 0.0% 108
6,433 2.8% -12,987 -7.0% -19,420
Increase/Decrease
Net income attributable tononcontrolling interestsNet income attributable to owners of the parent
Selling, general, andadministrative expenses
Income Statement

13,949 -22,000
1,200 -300
8,600 -2,258-3,387 -4,196
-9,000
-6,000
-3,000
0
3,000
6,000
9,000
12,000
15,000
FY2019 Volume Sales Prices Foreign
Exchange
Expenses Other Demag
Business
FY2020
( Millions of yen )
4
Breakdown of Operating IncomeLegacy Tadano 2,882Demag business -7,079
Breakdown of Operating IncomeLegacy Tadano 17,642Demag business - 3,692* Including retroactive adjustment of -1,673 million yen due to PPA
Despite expense reductions, operating income decreased by ¥18.1 billiondue to decrease in sales volume and consolidation of Demag business.
Major Factors Leading to Change in Operating Income
5
Balance Sheet
Both accounts receivable and inventories decreased. Preparations for prolonged Coronavirus disruption. (Cash deposits and Interest-
bearing debt increased)
Cash deposits 57,075 103,110 46,034
Accounts receivable 63,267 48,774 -14,492
Inventories 97,434 82,010 -15,424
Other current assets 9,415 5,254 -4,160
Total current assets 227,192 239,149 11,956
68,433 68,046 -386
1,675 1,692 17
13,958 15,031 1,072
Total fixed assets 84,067 84,770 703
Total assets 311,260 323,920 12,659
FY2020Year-end
FY2019Year-end
Increase/Decrease
Investment andother assets
Intangible fixed assets
Tangible fixed assets
(Unit: millions of yen)
Accounts payable 40,745 32,043 -8,702
Interest-bearing debt 63,035 94,586 31,551
Other liabilities 49,320 51,885 2,564
Total liabilities 153,102 178,515 25,413
Total equity 158,158 145,404 -12,754
311,260 323,920 12,659
FY2020Year-end
FY2019Year-end
Increase/Decrease
Total liabilities and equity
FY2019 FY2020
Receivable turnover 88.1 days 95.7 days
Inventory turnover 135.6 days 160.9 days
Equity ratio 50.5% 44.5%Net D/E Ratio 0.04 -0.06ROA 4.9% -1.3%ROE 4.1% -8.6%
(based on Operating Income)

6
(Unit: millions of yen)
Income before income taxes 12,038 -12,358 -24,396
Depreciation 4,527 5,695 1,167
Accounts receivable -5,196 14,317 19,514
Inventories -4,026 15,539 19,565
Accounts payable -6,762 -7,980 -1,218
Other -3,561 5,235 8,797
Total -2,982 20,448 23,430
Cash flow frominvesting activities
Total -31,543 -3,731 27,811
Cash flow fromfinancing activities
Total 25,954 29,039 3,084
-8,755 45,997 54,753
Cash flow fromoperating activities
Increase(decrease) in Cash and Cash Equivalents
FY2019 FY2020Increase/Decrease
As a result of efforts to reduce accounts receivable and inventories, cash flow from operating activities increased.
Cash Flow
7
Mobile Crane and Truck Loader Crane sales decreased, Aerial Work Platform sales increased.
0
50,000
100,000
150,000
200,000
250,000
FY11 FY12 FY13 FY14 FY15 FY16 FY17 FY18 FY19 FY20
Net Sales by Product
Mobile Cranes Truck Loader Cranes Aerial Work Platforms Other
(Unit: millions of yen)
Amount Percentage
Breakdown of Mobile Crane Sales Inside and Outside Japan
Japan 47,833 39,615 -8,217 -17.2%
Outside Japan 102,984 69,815 -33,169 -32.2%
Total 150,818 109,430 -41,387 -27.4%
FY2020Increase/Decrease
150,818 109,430 -41,387 -27.4%
FY2019
Total
Other
227,949 186,040 -41,909 -18.4%
Mobile Cranes
36,982 38,593 1,611 4.4%
4.0%
22,162 19,314 -2,848 -12.9%
17,986 18,701 715
Truck LoaderCranes
Aerial WorkPlatforms
Net Sales by Product
( Millions of yen )

8
Net sales increased in Europe due to consolidation of Demag business, but net sales decreased in all other regions.
(Unit: millions of yen)
Amount Percentage
Europe 24,363 27,631 3,267 13.4%
North America 54,163 35,001 -19,162 -35.4%
Latin America 6,735 3,092 -3,643 -54.1%
Asia 14,401 11,013 -3,387 -23.5%
Middle East 10,312 5,898 -4,414 -42.8%
Other 13,444 10,126 -3,318 -24.7%
123,421 92,763 -30,658 -24.8%
Japan 104,527 93,277 -11,250 -10.8%
Total 227,949 186,040 -41,909 -18.4%
Outside JapanSales Ratio
54.1% 49.9%
Increase/DecreaseFY2019 FY2020
Subtotal(total outside Japan sales)
0%
10%
20%
30%
40%
50%
60%
70%
0
20,000
40,000
60,000
80,000
100,000
120,000
140,000
FY11 FY12 FY13 FY14 FY15 FY16 FY17 FY18 FY19 FY20
Net Sales by Destination
Europe North AmericaLatin America AsiaMiddle East OtherOutside Japan Sales ratio
Net Sales by Destination
The graph above excludes Japan."Other" is comprised of Oceania, Africa and the CIS.
( Millions of yen )
9
0
2,000
4,000
6,000
8,000
10,000
12,000
14,000
CY01 CY02 CY03 CY04 CY05 CY06 CY07 CY08 CY09 CY10 CY11 CY12 CY13 CY14 CY15 CY16 CY17 CY18 CY19 CY20
(Units)
欧州北⽶⽇本
Trends in Global Demand for Mobile Cranes (Calendar-year Basis)
Colored lines: yearly demand trends with lowest levels in each market normalizedto the value of 1 (Base Years: 2010[North America, Europe], 2009[Japan])
* Figures are based on Tadano research ( Figures showing demand are rounded to the nearest ten units ).* Mobile Cranes produced in Russia are excluded.* Starting from 2010 the graph includes Chinese construction cranes produced for export.* Mobile cranes produced in China for the Chinese market are excluded. * Demand trends in Chinese Market for Mobile Cranes produced in China are as follows:CY12: 22,000 units, CY13: 17,000 units, CY14: 14,000 units, CY15: 9,000 units, CY16: 9,000 units, CY17: 20,000 units, CY18: 32,000 units, CY19: 42,000 units, CY20: 54,000 units

10
AC 300-6
20
740
170
700
90
110
70
1,380
230
160
190
60
550
110
120
200
150
130
50
320
1,210
0 500 1,000 1,500 2,000
Japan
Other
Asia
Europe
(Units)
Jan-Dec 2020 Demand by Model SegmentTC RT AT
Jan-Dec2019
Jan-Dec2020
Percentchange
Jan-Dec2019
Jan-Dec2020
Europe 1,650 1,390 -15.8% 19% 13%
NorthAmerica
1,650 980 -40.6% 35% 31%
LatinAmerica
270 200 -25.9% 25% 11%
Asia 1,290 1,020 -20.9% 13% 9%
MiddleEast
650 480 -26.2% 20% 20%
Other 1,240 1,170 -5.6% 16% 10%
Subtotal(total salesoutside Japan)
6,750 5,240 -22.4%
Japan 1,870 1,520 -18.7% 55% 54%
Total 8,620 6,760 -21.6% 29% 24%
ShareDemand (Units)
Mobile Cranes (Calendar-year Basis)
Demand decreased in all regions, with total decrease of about 22%. Total share decreased by 5 percentage points (29%→24%).
LatinAmerica
NorthAmerica
Middle East
*TC: Truck Cranes, RT: Rough Terrain Cranes, AT: All Terrain Cranes
11
GR-1000N
0
500
1,000
1,500
2,000
2,500
3,000
FY11 FY12 FY13 FY14 FY15 FY16 FY17 FY18 FY19 FY20
(Units) Demand Trends in Japan (FY basis) AT RT
0
10,000
20,000
30,000
40,000
50,000
60,000
FY11 FY12 FY13 FY14 FY15 FY16 FY17 FY18 FY19 FY20
Net Sales of Mobile Cranes in Japan( Millions of Yen )
(Unit: millions of yen)
AmountPercentchange
Japan 47,833 39,615 -8,217 -17.2%
FY2019 FY2020Increase / Decrease
Japanese Market
Share of unit sales 53%→53%. Tonnage share increased by 1 percentage point (55%→56%).
*Japan Market share shown on fiscal year basis.
*AT: All Terrain Cranes, RT: Rough Terrain Cranes

(Unit: millions of yen)
AmountPercentchange
Europe 24,363 27,631 3,267 13.4%
FY2019 FY2020Increase / Decrease
12
*Products other than mobile cranes are also included.
CC 3800-1
0
500
1,000
1,500
2,000
CY11 CY12 CY13 CY14 CY15 CY16 CY17 CY18 CY19 CY20
(Units) Demand Trends in EuropeAT RT TC
0
5,000
10,000
15,000
20,000
25,000
30,000
FY11 FY12 FY13 FY14 FY15 FY16 FY17 FY18 FY19 FY20
Net Sales in Europe( Millions of yen )
European Market
Net sales increased due to consolidation of Demag business. Market share decreased by 6 percentage points (19%→13%).
*AT: All Terrain Cranes, RT: Rough Terrain Cranes, TC: Truck Cranes
(Unit: millions of yen)
AmountPercentchange
North America 54,163 35,001 -19,162 -35.4%
FY2019 FY2020Increase / Decrease
13
* Products other than mobile cranes are also included.
GR-1000XLL-4
0
1,000
2,000
3,000
CY11 CY12 CY13 CY14 CY15 CY16 CY17 CY18 CY19 CY20
(Units) Demand Trends in North America AT RT TC
0
10,000
20,000
30,000
40,000
50,000
60,000
FY11 FY12 FY13 FY14 FY15 FY16 FY17 FY18 FY19 FY20
Net Sales in North America( Millions of yen )
North American Market
Demand, mainly for RTs, declined substantially. Market share decreased by 4 percentage points (35%→31%).
* AT: All Terrain Cranes, RT: Rough Terrain Cranes, TC: Truck Cranes

(Unit: millions of yen)
AmountPercentchange
Latin America 6,735 3,092 -3,643 -54.1%
Asia 14,401 11,013 -3,387 -23.5%
Middle East 10,312 5,898 -4,414 -42.8%
Other 13,444 10,126 -3,318 -24.7%
Total 44,894 30,131 -14,763 -32.9%
FY2019 FY2020Increase / Decrease
14
* Products other than mobile cranes are also included.
GT-600EL
0
1,000
2,000
3,000
4,000
5,000
CY11 CY12 CY13 CY14 CY15 CY16 CY17 CY18 CY19 CY20
(Units) Demand Trends in Strategic MarketsAT RT TC
0
10,000
20,000
30,000
40,000
50,000
60,000
FY11 FY12 FY13 FY14 FY15 FY16 FY17 FY18 FY19 FY20
Net Sales in Strategic Markets( Millions of yen )
Strategic Markets
Sales decreased in all regions due to decrease in demand for Mobile Cranes.
* AT: All Terrain Cranes, RT: Rough Terrain Cranes, TC: Truck Cranes* “Strategic Markets” are designated by Tadano as a market segment
including all countries except Japan, Europe, and North America
Structure of the World Crane Industry (Manufacturers of Hydraulic Cranes and Crawler Cranes)
Locatelli(Italy)
Autogru Rigo (Italy)
Marchetti(Italy)
Tadano Demag (Germany)
TEREX(U.S.)
Franna (Australia)
Sumitomo Heavy Industries
Sumitomo Heavy Industries Construction Cranes
Link-Belt (U.S.)
Kobelco Construction
Machinery
TADANO
Tadano Faun (Germany)
MANITOWOC (U.S.)
GROVE(U.S.)
1999
1990
2000
2002
1986
2018
Zoomlion
Liaoning Fuwa Heavy Industry
Machinery
XCMGTai’an Taishan Heavy Industry
Changjiang
Anhui Liugong Crane
Sennebogen(Germany)
Shuttlelift(U.S.)
2007
Tadano Mantis(U.S.)
2008
2002
LIEBHERR (Germany)
2015
KATO Works
Escorts (India)
TadanoEscorts (India)
2019
Hitachi Construction
Machinery
Sany
Prepared by Tadano based on materials from the Japan Construction Equipment Manufacturers Association.
Investment/joint ventureAcquisition (numerals indicate fiscal year of acquisition)
Partnership (numerals indicate fiscal year of partnership)
15
16
⾞両搭載型クレーン
(Unit: millions of yen)
AmountPercentchange
Japan 20,292 17,920 -2,371 -11.7%
Outside Japan 1,870 1,393 -476 -25.5%
Total 22,162 19,314 -2,848 -12.9%
FY2019 FY2020Increase / Decrease
0
5,000
10,000
15,000
20,000
FY11 FY12 FY13 FY14 FY15 FY16 FY17 FY18 FY19 FY20
(Units) Demand Trends in Japan (FY basis)
0
5,000
10,000
15,000
20,000
25,000
FY11 FY12 FY13 FY14 FY15 FY16 FY17 FY18 FY19 FY20
Net Sales of Truck Loader Cranes
Outside Japan Japan
( Millions of yen )
Truck Loader Cranes
Market share in Japan 48%→48%. Sales in Japan decreased by about 12% due to decrease in demand.
ZX360/300series
17
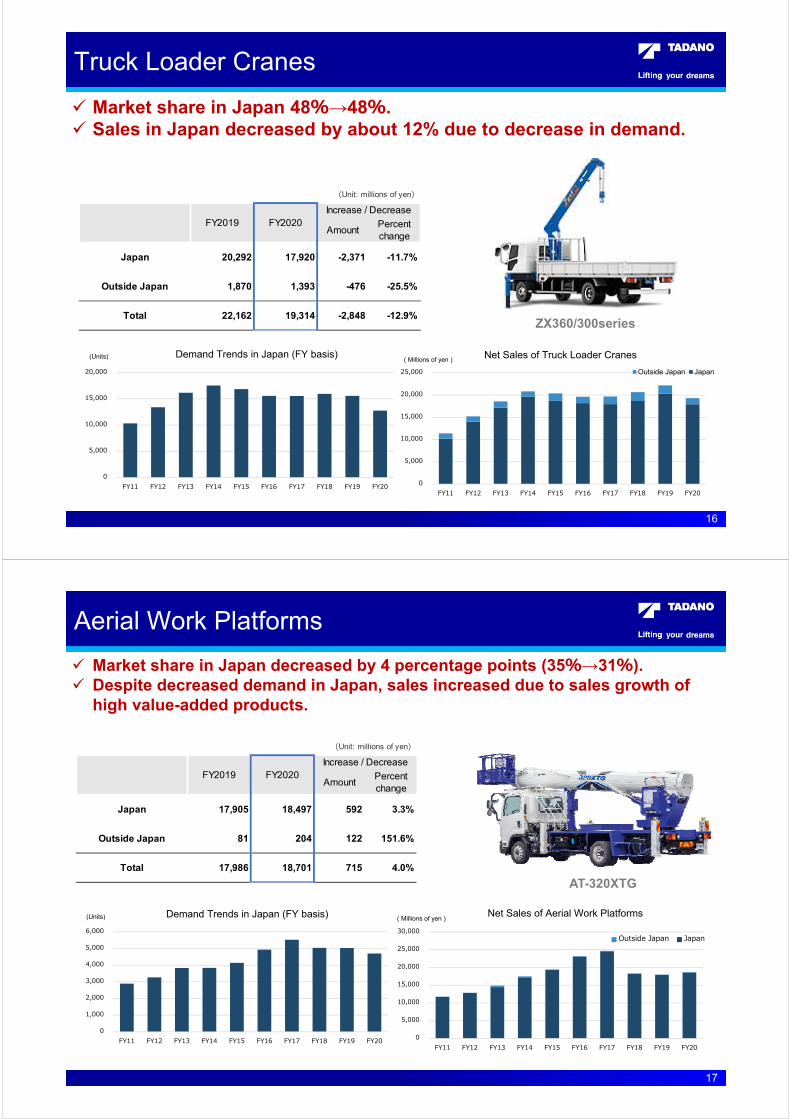
AT-320XTG
⾼所作業⾞(Unit: millions of yen)
AmountPercentchange
Japan 17,905 18,497 592 3.3%
Outside Japan 81 204 122 151.6%
Total 17,986 18,701 715 4.0%
FY2019 FY2020Increase / Decrease
0
1,000
2,000
3,000
4,000
5,000
6,000
FY11 FY12 FY13 FY14 FY15 FY16 FY17 FY18 FY19 FY20
(Units) Demand Trends in Japan (FY basis)
0
5,000
10,000
15,000
20,000
25,000
30,000
FY11 FY12 FY13 FY14 FY15 FY16 FY17 FY18 FY19 FY20
Net Sales of Aerial Work Platforms
Outside Japan Japan
( Millions of yen )
Aerial Work Platforms
Market share in Japan decreased by 4 percentage points (35%→31%). Despite decreased demand in Japan, sales increased due to sales growth of
high value-added products.

18
Hydraulic gate-shaped lifters︓TB-1000
その他(Unit: millions of yen)
AmountPercentchange
Used cranesOther products
11,821 10,649 -1,171 -9.9%
PartsRepairs
25,161 27,944 2,782 11.1%
Total 36,982 38,593 1,611 4.4%
FY2019 FY2020Increase / Decrease
0
2,000
4,000
6,000
8,000
10,000
12,000
14,000
FY11 FY12 FY13 FY14 FY15 FY16 FY17 FY18 FY19 FY20
Net Sales of Used Cranes and Other ProductsOutside Japan Japan
( Millions of yen )
0
5,000
10,000
15,000
20,000
25,000
30,000
FY11 FY12 FY13 FY14 FY15 FY16 FY17 FY18 FY19 FY20
Net Sales of Parts and RepairsOutside Japan Japan
( Millions of yen )
Other Business
Net sales from other businesses, such as parts, repairs, and other products increased.
19

20
(Unit: millions of yen)
FY2020 FY2021
Amount Percentage Amount Percentage
Net Sales 186,040 100% 215,000 100% 15.6%
Operating income -4,196 -2.3% 4,200 2.0% -
Ordinary income -4,683 -2.5% 3,400 1.6% -
Net income attributableto owners of the parent
-12,987 -7.0% 10,500 4.9% -
Capital investment
Depreciation
* Figures for capital investments include leased assets.
USD ¥105.00EUR ¥125.00
Mid-year ¥0.00 Mid-year ¥3.00
Year-end ¥3.00 Year-end ¥4.00
Full-year ¥3.00 Full-year ¥7.00
Dividends per share
5,695 5,900
¥106.82
5,666 6,500
¥121.81
PercentChange
*We estimate the recording of extraordinary income in FY 2021 of approximately ¥10 billionresulting from, among other factors, gains on debt forgiveness related to the reorganizationof European Operations.
FY 2021 Business Performance Forecast
-4,196
10,800 0
-600 -900
-904 4,200
-6,000
-3,000
0
3,000
6,000
9,000
FY2020 Volume Sales Prices Foreign
Exchange
Expenses Other FY2021
Forecast
( Millions of yen )
21
Operating income will increase by ¥8.3 billion due to increase in sales, etc.
FY 2021 Forecast ( Major Factors Leading to Change in Operating Income )

22
(Unit: millions of yen)
Amount Percentage
Breakdown of Mobile Crane Sales Inside and Outside Japan
Japan 39,615 37,700 -1,915 -4.8%
Outside Japan 69,815 101,300 31,485 45.1%
Total 109,430 139,000 29,570 27.0%
Mobile Cranes
-1.6%-31419,00019,314
109,430 139,000 29,570 27.0%
FY2021Forecast
FY2020Increase/Decrease
18,701 16,700 -2,001 -10.7%
4.4%1,707
15.6%28,960215,000186,040Total
Other 38,593 40,300
Truck LoaderCranes
Aerial WorkPlatforms
0
50,000
100,000
150,000
200,000
250,000
FY11 FY12 FY13 FY14 FY15 FY16 FY17 FY18 FY19 FY20 FY21
Net Sales by Product
Mobile Cranes Truck Loader Cranes Aerial Work Platforms Other
(Millions of yen)
Forecast
FY 2021 Forecast (Net Sales by Product)
23
(Unit: millions of yen)
Amount
Europe 27,631 33,300 5,669 20.5%
North America 35,001 46,100 11,099 31.7%
Latin America 3,092 3,600 508 16.4%
Asia 11,013 14,500 3,487 31.7%
Middle East 5,898 10,200 4,302 72.9%
Other 10,126 18,000 7,874 77.8%
92,763 125,700 32,937 35.5%
Japan 93,277 89,300 -3,977 -4.3%
Total 186,040 215,000 28,960 15.6%
Outside JapanSales ratio 49.9% 58.5%
Increase/DecreaseFY2020
FY2021Forecast
Subtotal(total outside Japan sales)
Percentage
0%
10%
20%
30%
40%
50%
60%
70%
0
20,000
40,000
60,000
80,000
100,000
120,000
140,000
FY11 FY12 FY13 FY14 FY15 FY16 FY17 FY18 FY19 FY20 FY21
予想
Net Sales by Destination
Europe North AmericaLatin America AsiaMiddle East OtherOutside Japan Sales ratio
(Millions of yen)
FY 2021 Forecast (Net Sales by Destination)
The graph above excludes Japan."Other" is comprised of Oceania, Africa and the CIS.
Forecast

24
First Activities of The Tadano Forest ofLearning Project
Tadano began the first activities of the Tadano Forest of Learning Project,launched through a “Forest Matching” collaboration with Kagawa Prefecture, Japan. Many participants, including Tadano Group employees and their families, joined in to participate in environmental conservation activities for future forestation. A lecture was also held in cooperation with the Environmental Policy Division of Kagawa Prefecture to help participants to deepen their awareness of the importance of forests.
Environmental conservation activity
Live streaming of Kozai Plant
First Online Factory ToursTadano traditionally holds a factory tour at Shido Plant for local school children in Japan every year during their summer vacation. This year, the tour was held as an online event for the first time. This time, the event coincided with the local spring vacation and was live-streamed from high-tech Kozai Plant, which began full production in August 2019. Tadano’s tour guides showed the crane assembly line, interviewed employees, and held quiz sessions about the cranes, all in order to build interest among the young, online audience in regard to construction equipment and factory production.
Since 2020, the Tadano Forest of Learning Project has made use of forest land owned by SanukiCity in Kagawa Prefecture, Japan. The aim of the project is to create a cooperative forest space where visitors can learn about the importance of environmental conservation, while also engaging in mutual exchange.
Highlights: ESG and SDG Endeavors
Notes: ・ESG = Environment, Social, Governance・SDGs = Sustainable Development Goals
(a collection of 17 global goals, unanimously approved by the United Nations, forachieving a better and more sustainable future for the environment and society)
25
“GENBADE-Support” smartphone app for Truck Loader Crane users
Illustrative image with Tadano crane data incorporated in a BIM Model
Notes:・BIM = Building Information Modeling ・BIMobject®︓an online BIM object library, offered globally by BIMobject AB, a company based in
Sweden. BIM users may download the data for free after registering an account.
Provision of BIM DataTadano has published BIM files for a selection of mobile cranes in the Tadano Group lineup. The files, available for download from the BIMobject®
Platform, make construction planning with Tadano Group mobile cranes even easier for companies for using BIM.
Release of “GENBADE-Support” Smartphone App for Truck Loader Crane Users
The “GENBADE-Support” App supports Truck Loader Crane users by providing detailed information via error codes and voice messages, searchable information for jobsite utilization, crane operation instructions, and searchable maps for locating Tadano’s designated service contractors. In addition, the “HELLO SERVICE 24” call center provides emergency support at night or during holidays.
Highlights: Expansion of Solution Services
Notes:・“GENBADE” means “on the jobsite” in Japanese・”GENBADE-Support” is available only in Japan

26
Super Large-Sized AR-7000N All Terrain Crane Released for Japanese Market
The AR-7000N boasts the largest lifting capacity of all 7-axle all terrain cranes in the Japanese market. It maintains the same level of compactness as its predecessor 550-ton model, yet features improved lifting performance. Tadano expects increasing demand for this new model, which will see diverse industry applications, including in the area of maintenance of aging infrastructure.
GR-1300XL-4 Rough Terrain Crane Released for North American Market
The GR-1300XL-4 is a compact, two-axle RT, which, at 130 US tons, boasts the largest lifting capacity and largest work radius in class. It is the perfect machine
for such applications as lifting work at oil refineries, assist jobs at wind power construction sites, and much more. With the addition of this
new model to our North America-directed, large-sized rough terrain crane lineup,
Tadano aims to gain even furthermarket share.
Highlights: New Products
27
In the specification featuring remote controlled operations, the hand-held controller has a large, color screen for increased visibility – just as featured in the most recent truck loader crane offerings in the Japanese Market.
An Aerial Work Platform for Electric and Telecom Work: the Updated AT-121TTE
The AT-121TTE has been updated ahead ofexpectations for increasing demand in public works related to early proliferation of 5G telecommunication projects in Japan.It features improved convenience and comfort in its operations by offering the largest work radius for electric- and telecom-related AWP applications, increased efficiency, and smooth retractability.
TM-ZT 1000HRS Truck Loader CraneNewly Equipped with Safety System
The TM-ZT1000, the largest model made at the Tadano Thailand Plant, has been equipped with a new, standard safety system, which supports the operator in safe crane operation.
Highlights: New Products

28
Crawler Cranes to Meet Various Customer NeedsAs renewable energy demand increases, lattice boom crawler cranes produced at Tadano Demag GmbH are being utilized worldwide in an expanding scope of applications, including wind power-related construction. Following the DemagMobile Crane Business acquisition, Tadano has already begun delivering large-sized crawler cranes in the Japanese market. With the addition of lattice boom crawler cranes to our product lineup, Tadano is now able to meet an expanding range of customer needs.
A CC 8800-1 in operation at a large plant construction site
A CC 3800-1 erecting a wind turbine
Highlights: Demag Mobile Crane Business Synergy Initiatives
29
New AC 450-7 7-Axle All Terrain Crane
The new AC 450-7 all terrain crane features a longest-in-class 80 meter boom. Additionally, it features the compactness of a 6-axle all terrain crane with powerful performance comparable to that of an 8-axle machine.
GTC-1800EX Telescopic Boom Crawler Crane Released
With a 156-ton lifting capacity, the GTC-1800EX is the largest telescopic boom crawler crane in the Tadano Group lineup. The base crane, with dimensions of 3 meters wide and 3 meters high, is optimized for transport. This is also the first crane made at Tadano Demag GmbH to be released under the Tadano Brand.
The AC 450-7 officially will be released around summer of 2021, and it will be introduced to the Japanese Market sometime during or after 2022.
Highlights: Demag Mobile Crane Business Synergy Initiatives

30
Effects of Coronavirus Disruptionand Future Outlook
Mobile Crane demand by region (Compared to same period of previous fiscal year)
2021
Jan-Mar Apr-Jun Jul-Sep Oct-Dec Jan-Mar
Japan -7% -24% -39% +13% -24%Middle East -12% -28% -42% -4% -14%
NorthAmerica -16% -47% -47% -46% -25%Europe -9% -23% -7% -24% -15%
LatinAmerica -15% -34% -44% -12% +24%
Asia -1% -26% -43% -21% -15%Other -16% +5% -22% -1% +47%
Region2020
31
Fiscal Year 1Q Fiscal Year 2Q Fiscal Year 3Q Fiscal Year 4Q
Note: The table above excludes China and Crawler Cranes
Effects of Coronavirus Disruption(Demand)

Region Immediate Future Outlook
JapanCrane utilization rates are strong due to large-scale construction, but some projects have been postponed due to COVID-19. Sales opportunities are tending to increase as a whole.
USACrane utilization rates are rising due to the Biden administration’s $1.9 trillion American Rescue Plan, as well as the recovery of oil prices; signs are pointing to a recovery in market sentiment.
EuropeDemand seems to be recovering due to the EU’s €1.8 trillion economic stimulus. COVID-19 infections vary highly on a country-by-country basis, and recovery is also progressing unevenly.
AsiaStill no signs of demand recovery due in large part to accelerating COVID-19 infections in Indonesia and the Philippines, countries where infrastructure projects were expected to spark demand.
MiddleEast
Vaccinations have started in multiple countries. Demand recovery is expected to continue based on disclosures of large-scale projects related to resource development that has been enabled by recovery in oil prices.
OtherIn Australia, crane utilization rates are strong due to economic policies and increasing prices for natural resource exports.
32
Future Outlook (By Region)
【Immediate Future Outlook by Region】