Conditional autoregressive models for geographically sparse … · 2014-11-02 · Conditional...
45
Conditional autoregressive models for geographically sparse outcomes Dr Arul Earnest PhD,MSc, DLSHTM Department of Statistics, Data Science and Epidemiology, School of Health Sciences. Swinburne University of Technology
Transcript of Conditional autoregressive models for geographically sparse … · 2014-11-02 · Conditional...

Conditional autoregressive models for geographically sparse outcomes
Dr Arul Earnest PhD,MSc, DLSHTM Department of Statistics, Data Science and Epidemiology,
School of Health Sciences. Swinburne University of Technology
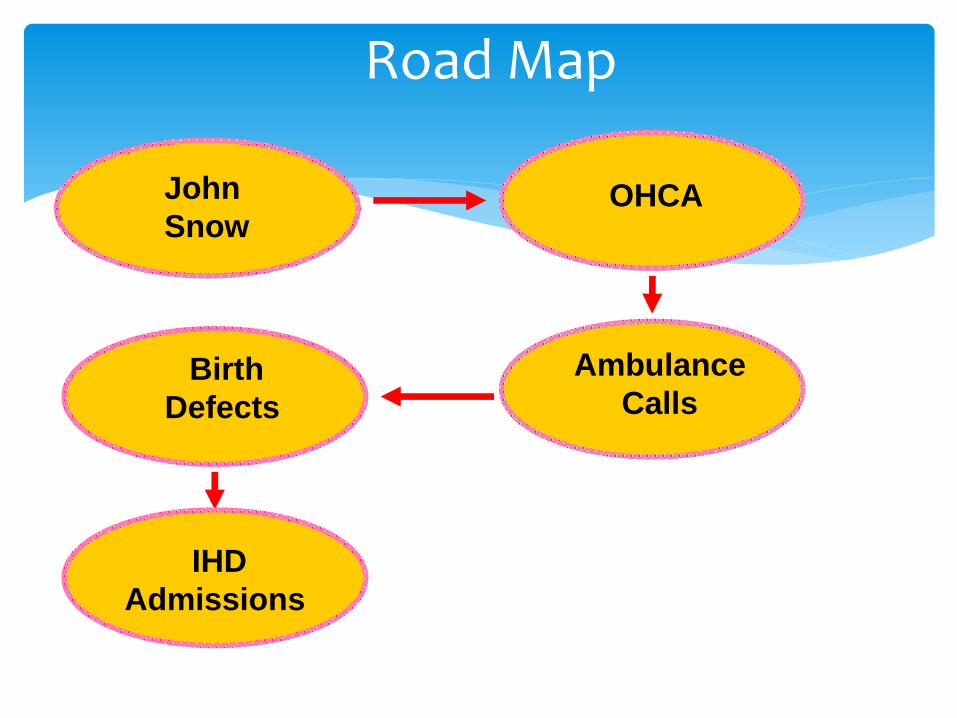
Road Map
John
SnowOHCA
Ambulance
CallsBirth
Defects
IHD
Admissions

Considered father of epidemiology
Traced the source of a cholera outbreak in Soho, England in 1854.
John Snow

How the outbreak looked like…

Painstakingly mapped by hand
Notice the cluster of cases along broad street
How did he do it?

Modern day models are more
sophisticated…
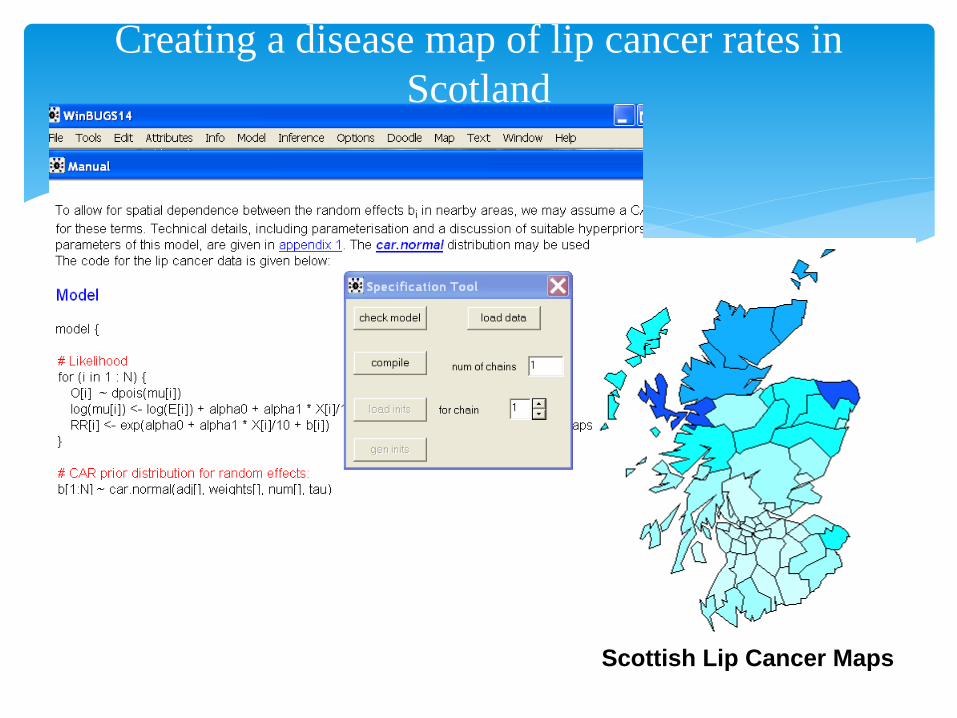
Creating a disease map of lip cancer rates in
Scotland
Scottish Lip Cancer Maps

Case Study 1- Heart Attacks in Singapore
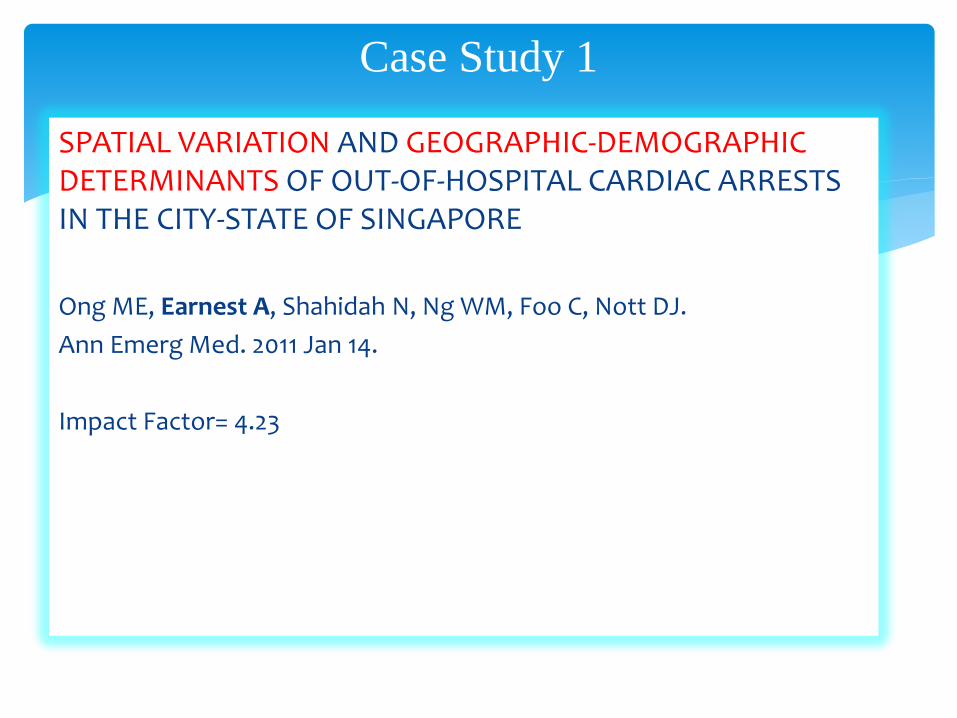
SPATIAL VARIATION AND GEOGRAPHIC-DEMOGRAPHIC DETERMINANTS OF OUT-OF-HOSPITAL CARDIAC ARRESTS IN THE CITY-STATE OF SINGAPORE
Ong ME, Earnest A, Shahidah N, Ng WM, Foo C, Nott DJ.
Ann Emerg Med. 2011 Jan 14.
Impact Factor= 4.23
Case Study 1
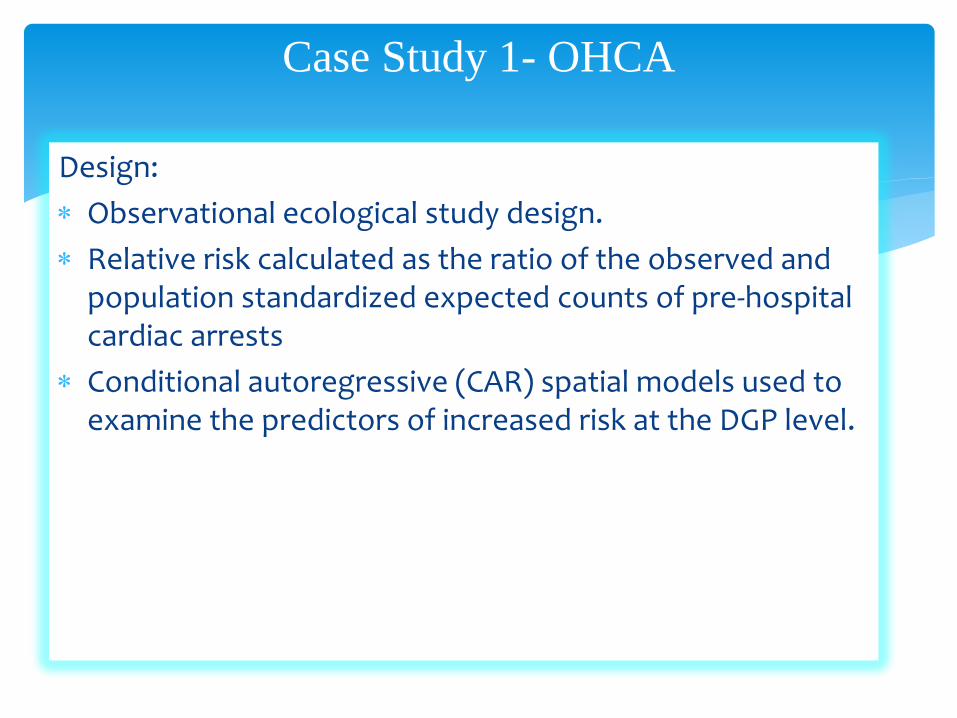
Design:
Observational ecological study design.
Relative risk calculated as the ratio of the observed and population standardized expected counts of pre-hospital cardiac arrests
Conditional autoregressive (CAR) spatial models used to examine the predictors of increased risk at the DGP level.
Case Study 1- OHCA

If you use John Snow’s method of mapping…
Case Study 1- OHCA
Which part of Singapore has the highest risk of
cardiac arrest? Make a guess
A
B
C
Based on the address of collapse, each case was assigned to a DGP based on the Urban Redevelopment Authority Master Plan 2003.Incomplete street addresses were mapped using an online street directory and map of Singapore.
Here’s what we really did…
We calculated the total observed (Oi) cardiac arrests in each DGP by summing up the cases. The expected counts of cardiac arrests were calculated as, Ei=(Popi/Totalpop)*Totalcardiac, where Popi refers to total population in the ith DGP, and “Totalpop” and “Totalcardiac” refer to the overall number in the population and number of cardiac arrests during the study period.
Here’s what we really did…
DGP-specific crude relative risk estimates were calculated as the ratio of the observed and expected counts for each area. The CAR model was then used to smooth these crude relative risks.
Here’s what we really did…

used a Poisson model that incorporated both a spatially structured random effect term as well as a spatially unstructured random term. This model is commonly known as a CAR convolution prior. The expected counts of cardiac arrest were included in the model, as were other covariates.
And then, we ….

# Poisson likelihood for observed counts
O[i]~dpois(mu[i])
log(mu[i])<- log(E[i])+bspat[i]+bind[i]
RR[i]<-exp(bspat[i]+bind[i])
# CAR prior distribution for spatial correlated random effects:
bspat[1:N]~car.normal(adj[],weights[],num[],vspat)
# Normal prior distribution for uncorrelated random effects
for(i in 1:N)
{
bind[i]~dnorm(alpha,vind)
WinBUGs code
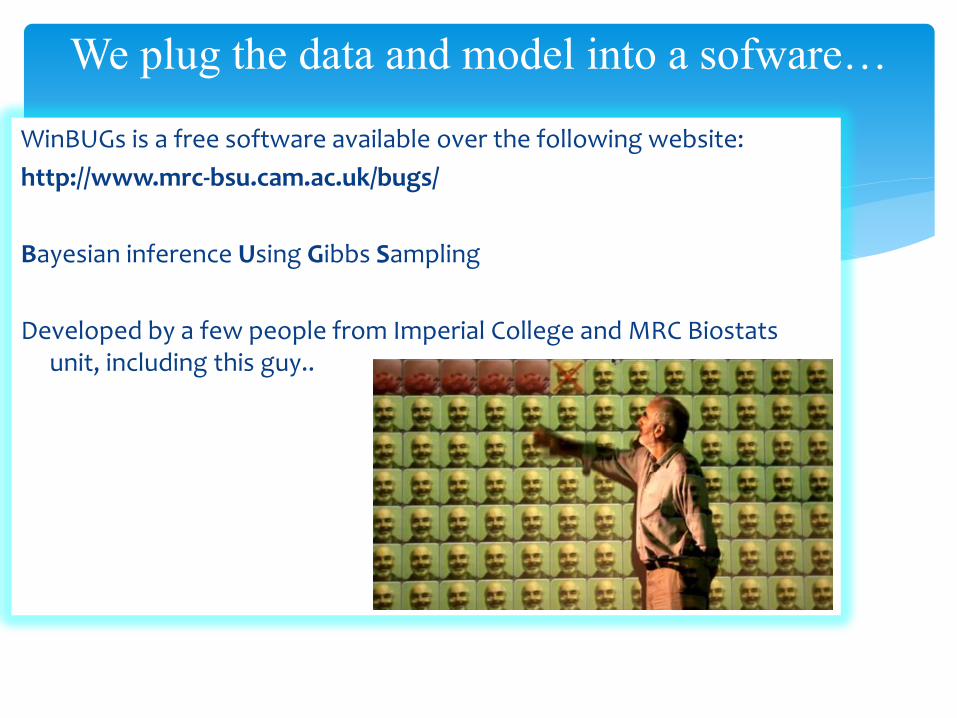
WinBUGs is a free software available over the following website:
http://www.mrc-bsu.cam.ac.uk/bugs/
Bayesian inference Using Gibbs Sampling
Developed by a few people from Imperial College and MRC Biostats unit, including this guy..
We plug the data and model into a sofware…
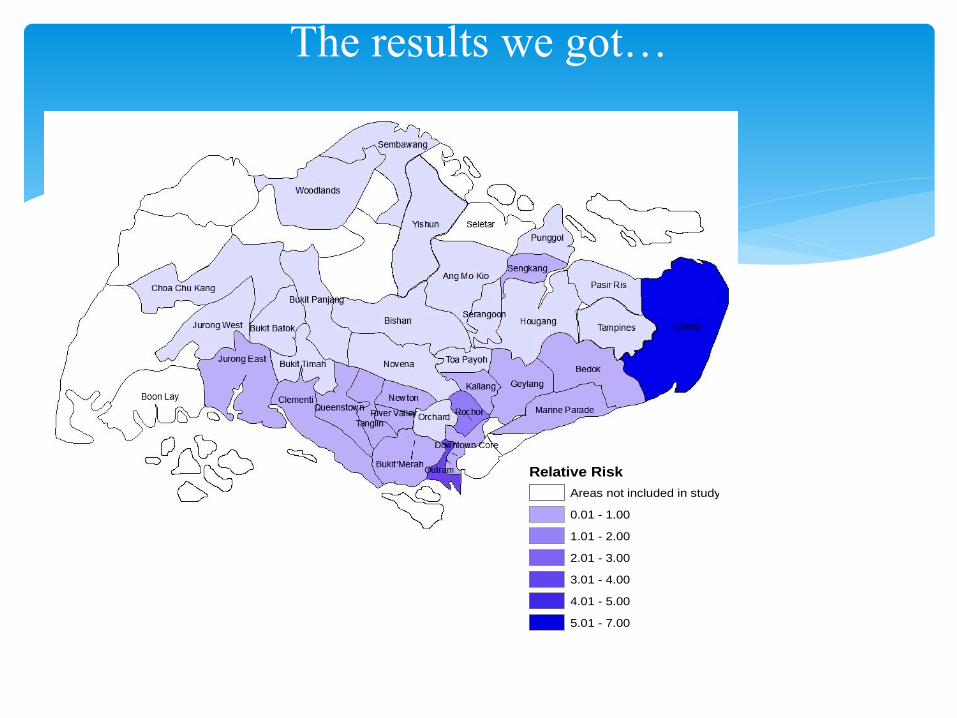
The results we got…
Smooth Relative risks
Relative Risk
Areas not included in study
0.01 - 1.00
1.01 - 2.00
2.01 - 3.00
3.01 - 4.00
4.01 - 5.00
5.01 - 7.00
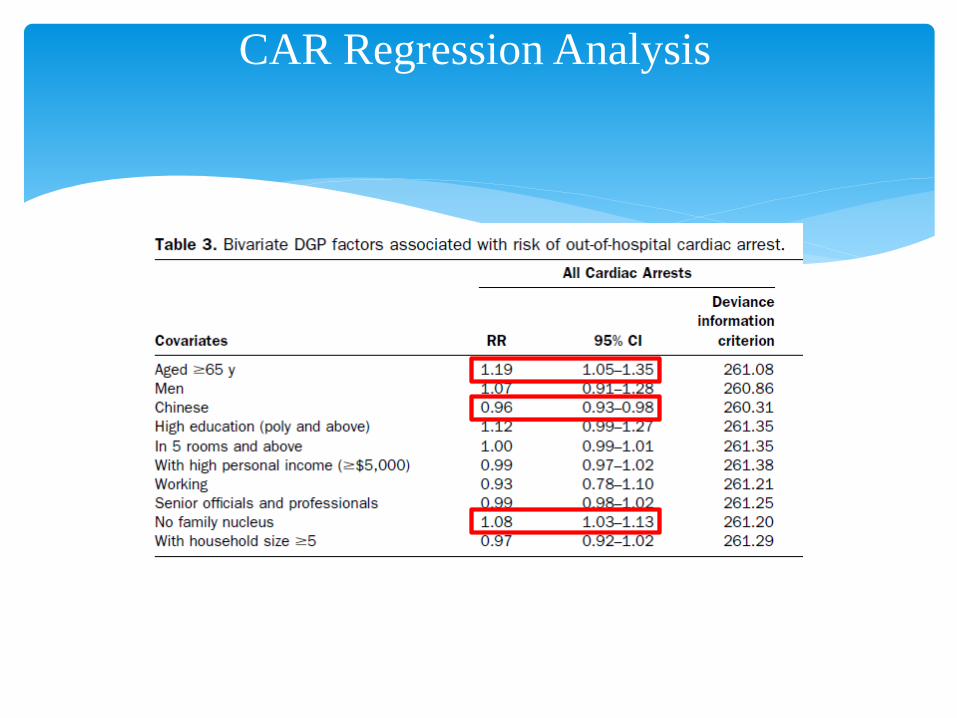
CAR Regression Analysis

1. Spatial variation in OHCA in Singapore
2. This spatial variation in risk not explained by areal-measures of socio-economic status
3. Rather, it is driven by racial, family and age structure of the area we live in
4. Results are being used for health services planning. i.e. these findings will help policy-makers in terms of planning health education programs, ambulance deployment and identifying locations for AEDs.
Conclusion


Geographical variation in ambulance calls in Singapore is explained by socio-economic status
Earnest A, Tan SB, Shahidah N, Ong ME. Acad Emerg Med.
2012 Feb;19(2):180-8.
Case Study 2
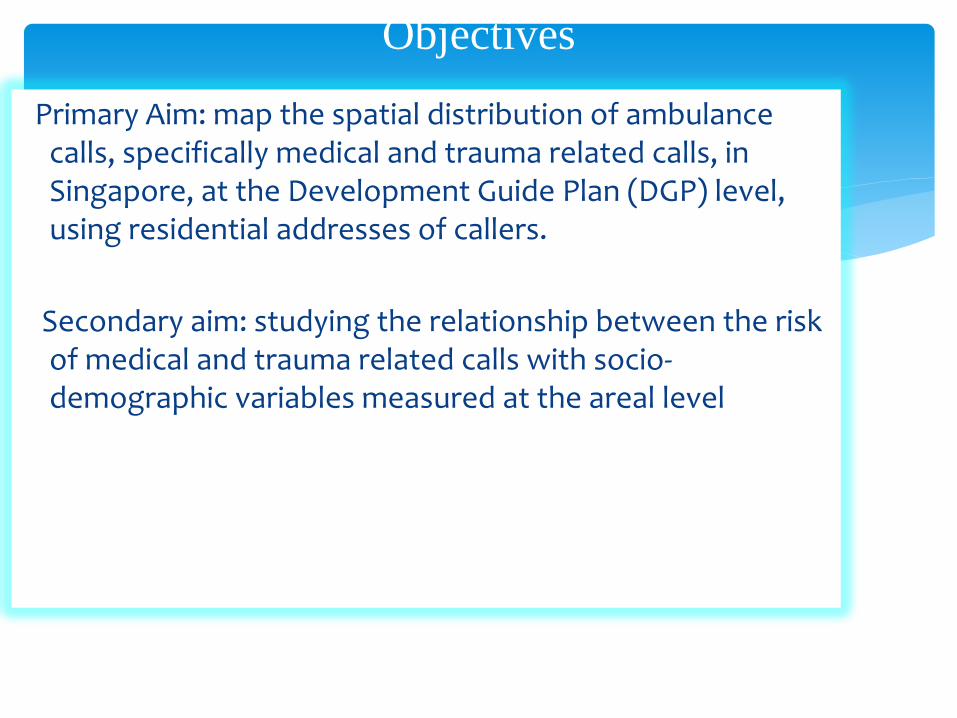
Primary Aim: map the spatial distribution of ambulance calls, specifically medical and trauma related calls, in Singapore, at the Development Guide Plan (DGP) level, using residential addresses of callers.
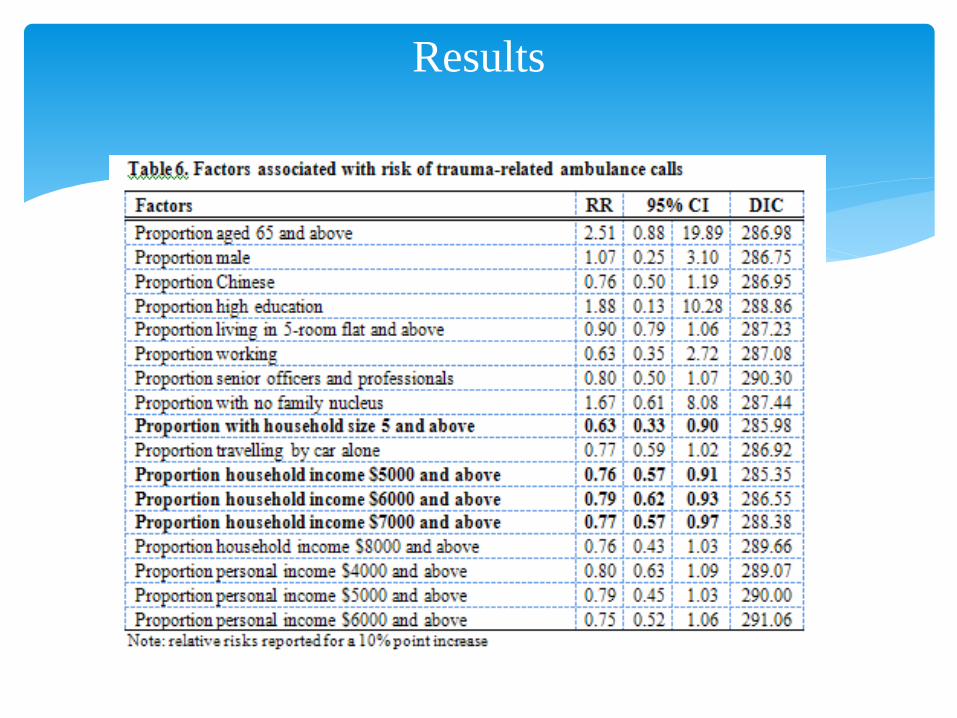
Secondary aim: studying the relationship between the risk of medical and trauma related calls with socio-demographic variables measured at the areal level
Objectives

Data from 2 sources:
1) Cardiac Arrest and Resuscitation Epidemiology (CARE) study database
2)Singapore Census 2000
Based on their residential address from where the call was made, each case was assigned to a DGP based on the Urban Redevelopment Authority (URA) Master Plan 2003
Methods

Some more info on the Bayesian model:
1) Neighbourhood structure based on Queen method of assignment
Methods
Earnest A, Morgan G, Mengersen K,
Ryan L, Summerhayes R, Beard J.
Evaluating the effect of neighbourhood
weight matrices on smoothing properties
of Conditional Autoregressive (CAR)
models.
Int J Health Geogr. 2007 Nov 29;6:54.
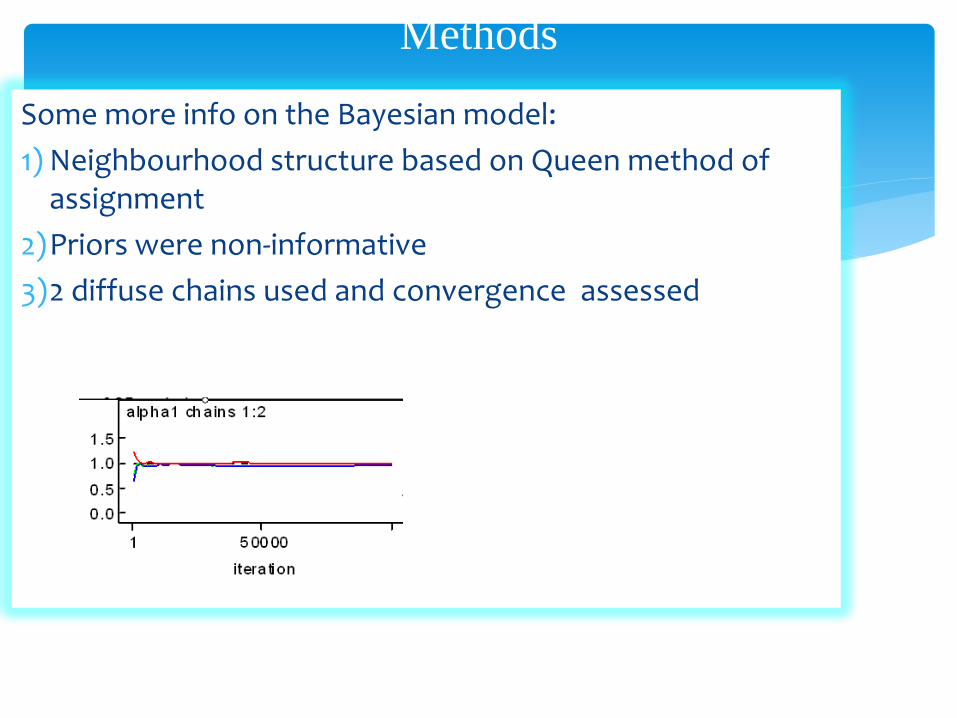
Some more info on the Bayesian model:
1) Neighbourhood structure based on Queen method of assignment
2)Priors were non-informative
3)2 diffuse chains used and convergence assessed
Methods
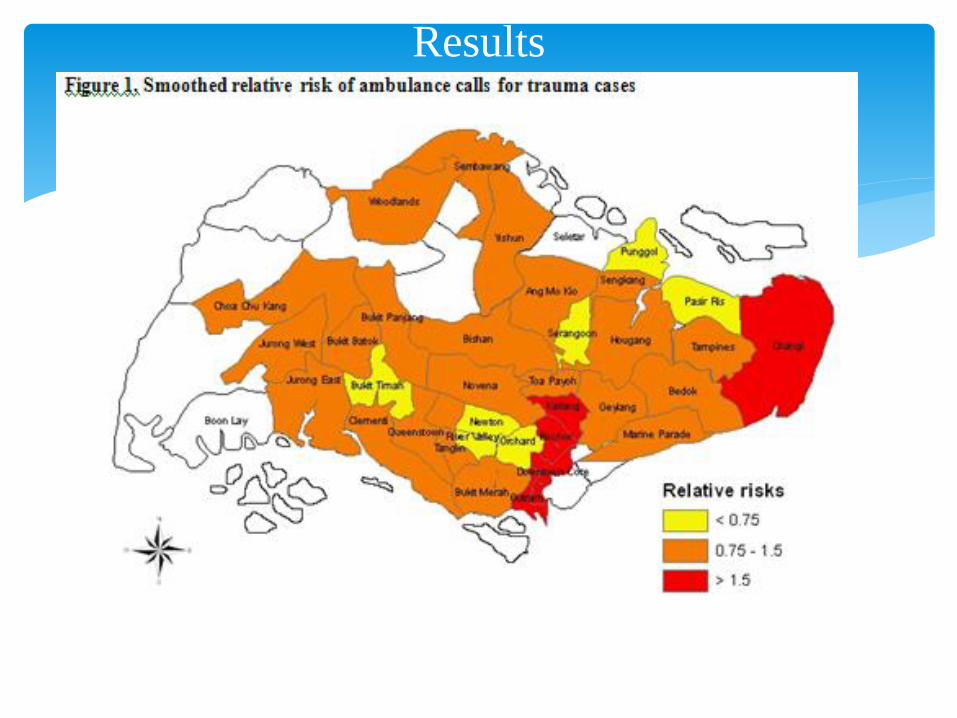
Results
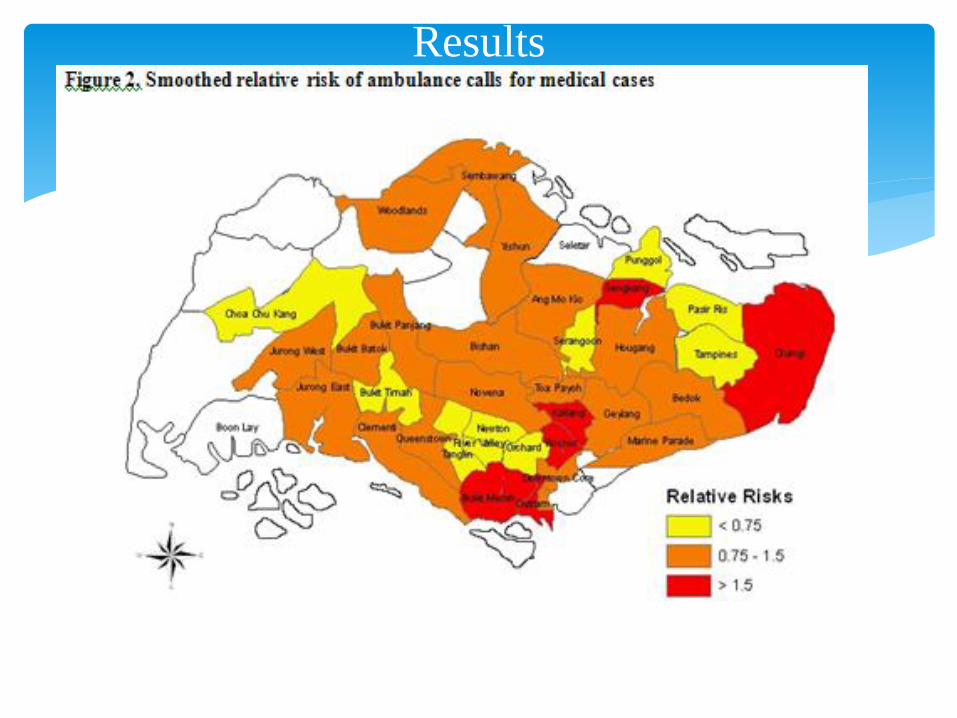
Results

Results
Results
Ambulance calls in Singapore demonstrate a clear spatial gradient
Risk of making such calls decreases for areas with an increased socio-economic status
Results can help policy makers target specific populations at risk with focused campaigns as well as more effective ambulance deployment.
Conclusion
Sometimes, we can have events that are rare (sparse) like birth defects
Case Study 3- Birth Defects in Australia
e.g. good
Statistician?
, and the CAR model does not really work well
in this situation, as it borrows strength from
neighbours, which themselves are sparse.
Need a more innovative solution….

Borrow strength from a related outcome
Earnest A, Beard JR, Morgan G, Lincoln D, Summerhayes R, Donoghue D, Dunn T, Muscatello D, Mengersen K. Small area estimation of sparse disease counts using shared component models-application to birth defect registry data in New South Wales, Australia. Health Place. 2010 Jul;16(4):684-93. Epub 2010 Feb 25.
Solution
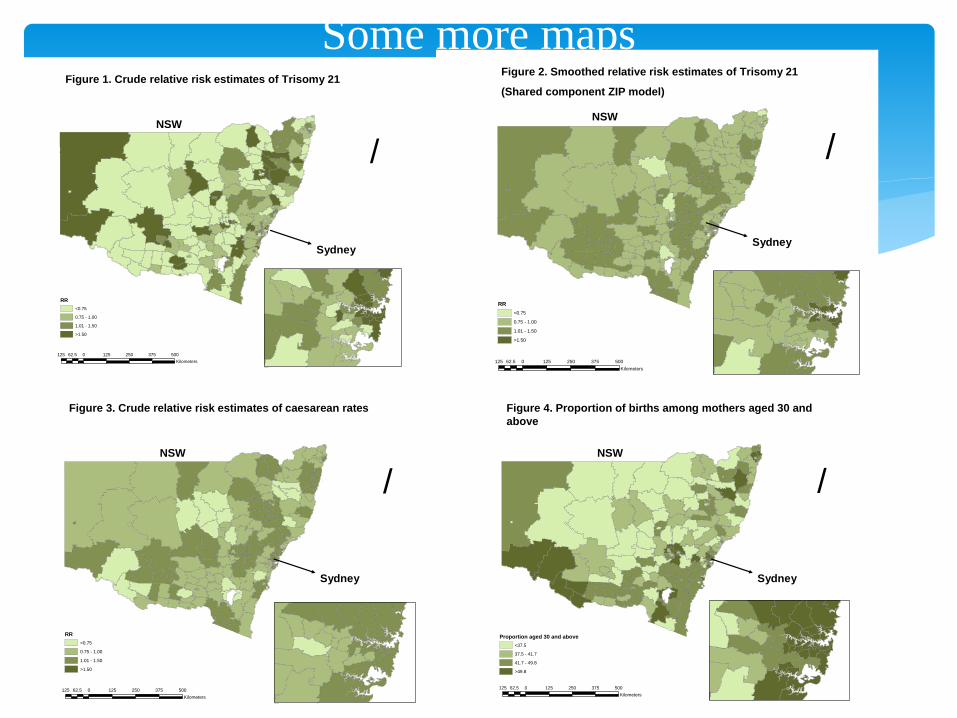
Some more maps
/
125 0 125 250 375 50062.5
Kilometers
RR
<0.75
0.75 - 1.00
1.01 - 1.50
>1.50
Figure 1. Crude relative risk estimates of Trisomy 21
Sydney
NSW
/
125 0 125 250 375 50062.5
Kilometers
RR
<0.75
0.75 - 1.00
1.01 - 1.50
>1.50
Figure 2. Smoothed relative risk estimates of Trisomy 21
(Shared component ZIP model)
NSW
Sydney
/
125 0 125 250 375 50062.5
Kilometers
RR
<0.75
0.75 - 1.00
1.01 - 1.50
>1.50
Figure 3. Crude relative risk estimates of caesarean rates
NSW
Sydney
/
125 0 125 250 375 50062.5
Kilometers
Proportion aged 30 and above
<37.5
37.5 - 41.7
41.7 - 49.8
>49.8
Figure 4. Proportion of births among mothers aged 30 and
above
NSW
Sydney
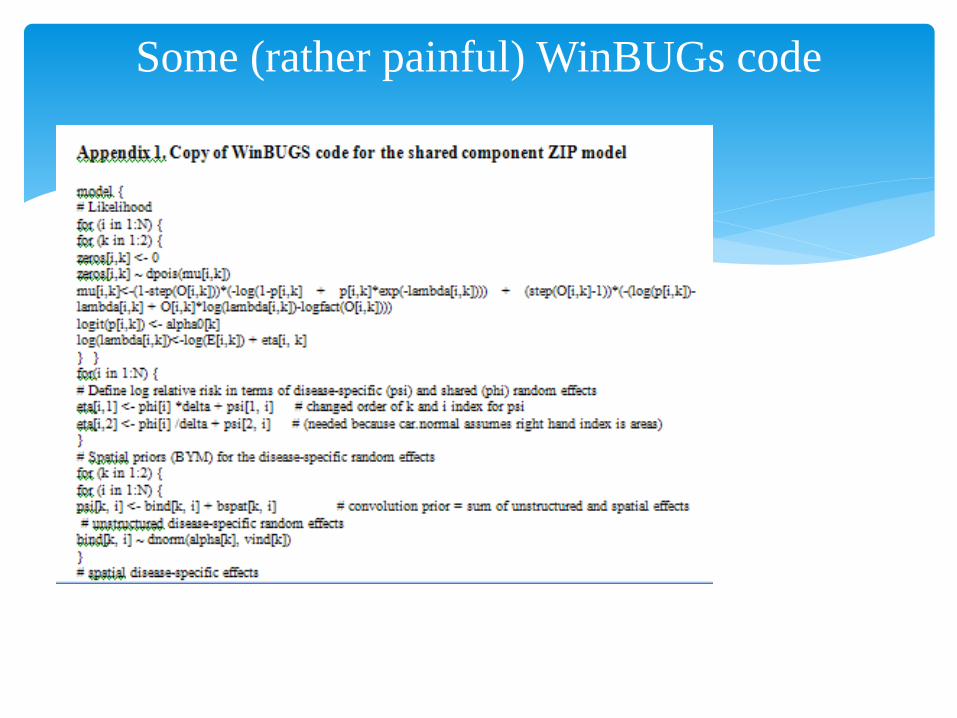
Some (rather painful) WinBUGs code

Case Study 4- IHD Admissions in NSW

Beard JR, Earnest A, Morgan G, Chan H, Summerhayes R, Dunn TM, Tomaska NA, Ryan L. Socioeconomic disadvantage and acute coronary events: a spatiotemporal analysis. Epidemiology. 2008 May;19(3):485-92.
Impact Factor: 4.0
IHD and IRSD
Relationship between socioeconomic factors and acute coronary events
Outcomes: deaths from acute myocardial infarction, hospital admissions for acute coronary syndrome and related revascularization procedures
Socio-economic measure: IRSD
Aim

Bernardinelli spatiotemporal model: where both the area-specific intercepts and temporal trends were modeled as random effects
Bayesian Model
)(~ ikik PoiO
2
21 **)log()log( kikiiiikik ttvuE

Results
Map of IRSD
Map of AMI mortality,
after adjusting for
spatio-temporal effects

Results

Strong association between socioeconomic disadvantage and mortality from acute MI. This relationship appears to operate both by increasing the risk of developing disease and by reducing the chance of receiving optimal care.
Found substantial spatial variation in acute MI mortality, hospital admissions for acute coronary syndrome,and related hospital procedures.
Conclusion

Areas with high levels of socioeconomic disadvantage showed higher rates of both hospital admissions and mortality.
After accounting for increased admission rates, these same areas showed lower rates of interventions such as angiography and interventional an- giography, although rates of coronary artery bypass grafts (a more established intervention) were not associated with socioeconomic disadvantage.
Conclusion
Bayesian CAR model can incorporate spatial correlation in data
Free software exist
Computational advances mean faster time to run MCMC chains
Uses non-informative priors (appeals to the many frequentists among us)
Final Conclusions