
Condenser Technology
282
Condenser Technology Seminar and Conference Technical Report
-
Upload
leonardo-diaz -
Category
Documents
-
view
1.050 -
download
19
Transcript of Condenser Technology
Condenser Technology
Seminar and Conference
Technical Report


EPRI Project Manager J. Stallings
EPRI • 3412 Hillview Avenue, Palo Alto, California 94304 • PO Box 10412, Palo Alto, California 94303 • USA 800.313.3774 • 650.855.2121 • [email protected] • www.epri.com
Condenser Technology Seminar and Conference
1004116
Proceedings, September 2002

DISCLAIMER OF WARRANTIES AND LIMITATION OF LIABILITIES
THIS DOCUMENT WAS PREPARED BY THE ORGANIZATION(S) NAMED BELOW AS AN ACCOUNT OF WORK SPONSORED OR COSPONSORED BY THE ELECTRIC POWER RESEARCH INSTITUTE, INC. (EPRI). NEITHER EPRI, ANY MEMBER OF EPRI, ANY COSPONSOR, THE ORGANIZATION(S) BELOW, NOR ANY PERSON ACTING ON BEHALF OF ANY OF THEM:
(A) MAKES ANY WARRANTY OR REPRESENTATION WHATSOEVER, EXPRESS OR IMPLIED, (I) WITH RESPECT TO THE USE OF ANY INFORMATION, APPARATUS, METHOD, PROCESS, OR SIMILAR ITEM DISCLOSED IN THIS DOCUMENT, INCLUDING MERCHANTABILITY AND FITNESS FOR A PARTICULAR PURPOSE, OR (II) THAT SUCH USE DOES NOT INFRINGE ON OR INTERFERE WITH PRIVATELY OWNED RIGHTS, INCLUDING ANY PARTY'S INTELLECTUAL PROPERTY, OR (III) THAT THIS DOCUMENT IS SUITABLE TO ANY PARTICULAR USER'S CIRCUMSTANCE; OR
(B) ASSUMES RESPONSIBILITY FOR ANY DAMAGES OR OTHER LIABILITY WHATSOEVER (INCLUDING ANY CONSEQUENTIAL DAMAGES, EVEN IF EPRI OR ANY EPRI REPRESENTATIVE HAS BEEN ADVISED OF THE POSSIBILITY OF SUCH DAMAGES) RESULTING FROM YOUR SELECTION OR USE OF THIS DOCUMENT OR ANY INFORMATION, APPARATUS, METHOD, PROCESS, OR SIMILAR ITEM DISCLOSED IN THIS DOCUMENT.
ORGANIZATION(S) THAT PREPARED THIS DOCUMENT
John Tsou Consulting Services
ORDERING INFORMATION
Requests for copies of this report should be directed to EPRI Orders and Conferences, 1355 Willow Way, Suite 278, Concord, CA 94520, (800) 313-3774, press 2 or internally x5379, (925) 609-9169, (925) 609-1310 (fax).
Electric Power Research Institute and EPRI are registered service marks of the Electric Power Research Institute, Inc. EPRI. ELECTRIFY THE WORLD is a service mark of the Electric Power Research Institute, Inc.
Copyright © 2002 Electric Power Research Institute, Inc. All rights reserved.
iii
CITATIONS
This report was prepared by
John Tsou Consulting Services 56 Williams Lane Foster City, CA 94404
Principal Investigator J. Tsou
This report describes research sponsored by EPRI.
The report is a corporate document that should be cited in the literature in the following manner:
Condenser Technology: Seminar and Conference, EPRI, Palo Alto, CA: 2002. 1004116.


v
REPORT SUMMARY
Steam surface condensers and associated systems cause significant loss of availability and heat rate degradation in both nuclear and fossil-fired power plants. Nineteen papers, presented at a 2002 Conference, discussed industrial experience and case histories of condenser problems and solutions.
Background Power plant efficiency and availability depend greatly on condenser performance. However, improvements in operation and maintenance practices, materials, and design may correct most of these losses. To address these problems and identify solutions, EPRI has brought together utility representatives, consultants, and manufacturers in seven conferences on condenser technology since 1981. Subsequent to the last EPRI conference on condenser technology, which was held in September 1999 (EPRI report TR-106781), EPRI, utility members, equipment manufacturers, and others have done significant work to improve system reliability, performance, and life extension of this equipment and associated systems. The current report on CD is the proceedings of the eighth EPRI-sponsored conference on condenser technology.
Objectives To review and document condenser and associated system problems, solutions, and improvements.
Approach Participants, including utility engineers, manufactures, and consultants attended a conference on condenser issues from September 10-11, 2002, in San Antonio, Texas. During six formal sessions, 18 technical presentations covered condenser problems and solutions. Two panel discussion sessions provided a forum for exchanging information in a less formal environment. At the exhibition, vendors displayed the latest materials, equipment, and services. Participants could also attend an optional seminar held before the conference.
Key Points This CD contains papers on condenser design, material, maintenance, performance, fouling control, and alternative cooling technology. To assist utility personnel in reducing operation and maintenance cost, the report documents the latest experience on condenser problems and solutions. Presentations covered the following topics:
• Improvements in condenser design and upgrade
• Case histories of corrosion resistant tube materials

vi
• The impact of air in-leakage and fouling on performance
• Case histories of fouling control technology
• Alternative cooling technology
• A condenser performance testing procedure
Keywords Condensers Maintenance Fouling Corrosion Failure Analysis Performance

vii
ABSTRACT
A conference on condenser issues was held from September 10-11, 2002, in San Antonio, Texas. Participants included utility engineers, manufactures, and consultants. During six formal sessions, 18 technical presentations covered condenser problems and solutions.
• Three papers discussed the improvements in condenser design and upgrade.
• Two papers documented case histories of corrosion resistant tube materials.
• Four papers documented condenser maintenance technologies.
• Four papers discussed the impact on performance of air in-leakage and fouling.
• Three papers described case histories in fouling control technology.
• Two papers were related to alternative cooling technology.
• One paper documented a condenser performance testing procedure.
Two panel discussion sessions provided a forum for exchanging information in a less formal environment. At the exhibition, vendors displayed the latest materials, equipment, and services.

ix
CONTENTS
SESSION 1: DESIGN TECHNOLOGY ................................................................................... 1-1
Power Uprate: The Engineering Evaluation of the Condenser and Cooling Tower ............. 1-3 D. C. Burns, R. L. Stevens, J. M. Burns, Burns Engineering Services Inc.
CFD Analysis Predicts Condenser Performance after Large Power Uprate of the Quad-Cities and Dresden Stations ....................................................................................1-17
N. Rhodes, C. D. Hardy, Heat Exchanger Systems Inc. J. M. Burns, Burns Engineering Services Inc. T. B. Madden, Stone & Webster Inc.
Surface Condensers, Steam Dump, & Design Reliability Considerations ..........................1-29 David H. Cooley, ALSTOM Power
SESSION 2: MATERIALS TECHNOLOGY ............................................................................ 2-1
Thin-Wall Titanium Condenser Tubing: The Next Plateau .................................................. 2-3 Dennis J. Schumerth, Valtimet, Inc.
The Performance of Superferritic Stainless Steels in High Chloride Waters ......................2-17 John C. Tverberg, Edward R. Blessman, Trent Tube
A Main Condenser Success Story .....................................................................................2-29 Jim Mitchell, Plastocor, Inc.
SESSION 3: MAINTENANCE TECHNOLOGY....................................................................... 3-1
Six Case Histories of High Reliability Coatings and Condenser Corrosion Problems.......... 3-3 Michael J. Horn, James E. Mitchell, Plastocor, Inc.
The Use of 100% Solids Epoxy Coatings for Full Length Condenser Tube Linings ...........3-15 A. Wesley Langeland, Duromar, Inc. Richard Kreiselmaier, Plastocor-international SA Bruce Woodruff, Progress Energy
Heat Exchanger Tube Side Maintenance – Repair vs. Replacement.................................3-19 Bruce W Schafer, Framatome ANP, Inc.
Condenser Application and Maintenance Guide................................................................3-35 Sharon R. Parker, Contractor Alan Grunsky, EPRI
x
SESSION 4: PERFORMANCE IMPROVEMENT.................................................................... 4-1
A Condenser Success Story............................................................................................... 4-3 Dave Leissner, Mirant Richard Putman, Conco Consulting Corp.
On Understanding Condenser Pressure Saturation at Low Air Ingress..............................4-17 Joseph W. Harpster, Intek, Inc.
Experiences With Steam Cycle Air Ingress at Alliant Energy Fossil Plants: Case Studies Documenting the Effects of Air In-Leakage on Steam Plant Operations................4-27
Wesley A. Kaufman, P.E., Alliant Energy – IP&L
The Measurement of Condenser Losses Due to Fouling and Those Due to Air Ingress ....4-43 Richard E. Putman, Conco Consulting Corp. Joseph W. Harpster, Intek Inc
SESSION 5: FOULING CONTROL ........................................................................................ 5-1
SIDTEC Condenser Cleaning for Cooling Water Systems.................................................. 5-3 R. Jones, S. D. Jones, R. Post, GE Betz J. F. Echols, SIDTEC Services, Inc.
On-Line Automatic Tube Cleaning System and On-Line Self Flushing Debris Filter ..........5-19 Kaveh Someah, Brackett Green WSA, Inc
Mechanical Tube Cleaning: A Brief Tutorial.......................................................................5-29 George Saxon, Jr., Conco Systems, Inc.
SESSION 6: ALTERNATIVE COOLING TECHNOLOGY....................................................... 6-1
Wet And Dry Cooling---Cost/Performance Tradeoffs .......................................................... 6-3 John S. Maulbetsch, Maulbetsch Consulting Kent D. Zammit, EPRI Matthew Layton and Joseph O’Hagan, California Energy Commission
The Impact of Air Cooled Condensers on Plant Design and Operations............................6-19 Richard E. Putman, Conco Consulting Corp. Dirk Jaresch, J & W GmbH
Experience Evaluating Condenser Performance and Tube Fouling with the ASME Performance Test Code on Steam Surface Condensers PTC 12.2 -1998 .........................6-35
Dale C. Karg, Santee Cooper John M. Burns, Burns Engineering Services Inc. Michael C. Catapano, Powerfect Inc.

1-1
1 SESSION 1: DESIGN TECHNOLOGY
• Power Uprate: The Engineering Evaluation of the Condenser and Cooling Tower Daniel C. Burns, Robert L. Stevens, John M. Burns Burns Engineering Services Inc.
• CFD Analysis Predicts Condenser Performance After Large Power Uprate of the Quad Cities and Dresden Stations N. Rhodes, C. D. Hardy, Heat Exchanger Systems Inc. J. M. Burns, Burns Engineering Services Inc. T. B. Madden, Stone & Webster Inc.
• Surface Condensers, Steam Dump, & Design Reliability Considerations David H. Cooley ALSTOM Power


Session 1: Design Technology
1-3
POWER UPRATE: THE ENGINEERING EVALUATION OF THE
CONDENSER AND COOLING TOWER
Daniel C. Burns Robert L. Stevens
John M. Burns
Burns Engineering Services Inc. PO Box 272
Topsfield, MA 01983-0272
Abstract
Today many nuclear and fossil based utilities have either completed or intend to appreciably increase the generation of their existing power plants. Power uprate and other associated terms such as repowering, modernization, refurbishment or upgrade, are often used to describe this type of project. Modernization of existing nuclear & coal facilities has been found to be a cost effective way to maximize asset value, especially when compared to installing new generation. The power uprate strategically supports the deregulated market based competitive initiative of increasing production value while lowering costs.
The power cycle equipment often has an extra margin or can be redesigned to allow operation at the higher power level. However, the power uprate produces an increase in the heat duty to the existing condenser and any closed-cycle cooling tower. Uprates have produced as much as a 35% increase in the turbine exhaust steam flow above the original design basis of the condenser. Often uprate projects have been executed with only minimal consideration of the essential detailed engineering of the impacts on the cooling system and related components. Important effects of the uprate on the condenser include excessive turbine backpressures during peak operation, high condensate temperatures, as well as exhaust pressure levels that preclude attaining the station generation that was the economic justification for going forward with the uprate. Other significant cooling system performance effects after an uprate include the capability of the steam jet air ejector or vacuum pump to remove the extra load of non-condensable gases. There will also be an increased potential for condenser tube vibration failures.
In addition, after a power uprate the cooling towers will experience higher approaches to the ambient wet bulb temperatures and warmer water returns to the condenser, hotter station blowdown to the environment, and an increase in evaporation that results in higher make-up flows. Within the paper, an overview of all these far reaching effects of the power uprate on the existing condenser and cooling tower will be presented. Simplified but accurate methods for estimating their increased impacts will be described. The paper will touch on the use of modular bundle replacement condensers and cooling tower augmentation to reduce the uprate impacts in extreme applications.

Session 1: Design Technology
1-4
The paper will provide utilities with a broad variety of quantitative cooling system evaluations and contribute to the realistic assessment of the financial benefits of adopting large power uprates for their existing nuclear or fossil plants.
Introduction
In today’s climate of deregulation, there are attractive financial incentives for power uprates. Power uprates increase the plant generation by an upgrade of existing equipment. Generally, the mechanical equipment in the power cycle has an inherent added capacity for reliable operation at increased power levels or may require modifications to accommodate these added requirements. As a result, the capital & opportunity costs associated with a power uprate may be minimal, while the extra revenues of the station can be appreciable, particularly during peak demand periods.
Taking advantage of the power uprate strategy, many nuclear and fossil based utilities have either completed or plan within the immediate future to increase the generation of many of their existing power plants. But it is not fully appreciated that waste heat is a natural consequence of the thermodynamic cycle and so all power uprates produce an increase in the heat duty to the existing condenser and cooling tower. Indeed, the Second Law of Thermodynamics suggests the typical Rankine-Regenerative-Reheat cycle, that is the technical basis of many steam plants, produces almost two units of heat rejected for every added unit of work. As an indication of the increase in power versus total cooling system heat rejection, a typical fossil or nuclear power plant operates in a thermal efficiency range of 32% to 42% [5]. The thermal efficiency for nuclear plants is at the lower end of this range. This natural consequence of the uprate is sometimes overlooked in the feasibility study of the cooling system compatibility. Uprate plans can be initiated with only minimal consideration of the impacts of the extra heat and steam flow on the cooling system components; particularly on the condenser and cooling tower.
Important effects of the uprate on the condenser include excessive turbine backpressures during peak operation, high condensate temperatures, exhaust pressure levels that preclude attaining the generation which was the justification of the uprate business case, performance effects on the steam jet air ejector or vacuum pump non-condensable removal equipment. Not to mention the increased potential for outages caused by tube impingement & vibration failures, especially during the winter. Further, after a power uprate, any stations with cooling towers will experience hotter blowdown to the environment and more evaporation that will require higher make-up flows. Incrementally higher approaches to wet bulb temperatures will also cause warmer water returns to the condenser and additionally raise the condenser pressure.
For power uprates that seek a large increase in generation, this paper will indicate why simple estimates to quantify the effects of the extra steam on the condenser performance often are not adequate. This paper will outline the quantitative estimates of the uprate performance that can be made of the condenser and cooling towers to accurately determine if revision to the uprate generational expectations will be required. This paper will also discuss condenser and cooling tower performance enhancements that can improve the accommodation of a plant to a large power uprate. This paper does not address the many other effects on the station that must be considered during a power uprate that are not directly related to the main cooling system.

Session 1: Design Technology
1-5
Evaluating Existing Cooling System Thermal Performance
Power uprates are applied to older fossil and nuclear plants. Normally, peak summertime operation is the major basis for the associated business case evaluation. Though there are exceptions, the condenser usually has some tubes plugged and is also not generally performing at its design level of apparent cleanliness. Similarly, the cooling tower is often not operating at a 100% design capability and the circulating water pump capacity will likely have slightly degraded over the years. These effects independently reduce the cost effectiveness of the planned power uprate on the expected generation.
All installed cooling systems have a finite capability. Unless the anticipated power increase is low enough so that its impact on the cooling system is very small, the first step is to quantitatively baseline the current performance levels of the condenser and cooling tower. This presumes that the condenser pressures at the summer, peak load condition are currently well below the turbine backpressure limits. An example of a smaller uprate that would likely have a negligible effect might be one under 2% of the present generating capacity. Many plants have accurate cooling system instrumentation to monitor cooling system performance parameters in order to maximize generation and obtain the best heat rate for every specific climate and cooling water inlet condition [1]. Good records of existing performance must be employed as the engineering basis for examining the system’s ability to accept more heat and steam flow. The impact of the uprate on the system performance can then be quantitatively evaluated to determine potential pinch points that may cause significant reductions in gross generation from the expected uprate levels. Subsequently, any need to consider system modifications can be definitively addressed.
Baselining the existing unit performance from the design basis is critical. The main parameters are cooling water flow, the apparent cleanliness of the condenser, and a recent capability of the cooling tower along with the incidence of entering wet bulbs and inlet water temperatures to the condenser. If accurate performance information on that equipment is not available, it is recommended it be obtained. The data is required for any accurate uprate projection going forward.
Predictions of the potential level of uprate achievable during peak demand periods should be assessed. The cooling system performance can be determined from a review of historical station generation derate incidences, available shift data and reasonably accurate operation or test data developed from the elements of codes such as ASME PTC 12.2 [2] and ASME PTC 23 [3]. Tests of the circulating water (CW) pumps or other CW flow measurements are also required to determine existing pump capability.
The existing turbine backpressure limits (or the expected limit should it be redesigned), the incremental turbine characteristic curve, the opportunity cost of the added revenues and the annual statistical hours of incidence are all needed to fully evaluate the annual extra power, heat rate, revenues and potentials for unit derating. With the increased heat and steam flow from the planned power uprate, the baseline performance of the condenser & cooling tower and the maximum weather/inlet water conditions expected at the site, an estimate of the performance signature of the cooling system after the uprate can commence.

Session 1: Design Technology
1-6
The Heat Exchange Institute Condenser Algorithm
Condensers are designed to achieve a certain performance by determining the surface area, and number of tubes from a variety of conditions such as the quantity of cooling water, steam flow, space and tubing parameters. These then define the performance estimated by an industry algorithm from the Heat Exchange Institute [4]. The latter is a tool used to determine the basic design requirements. The HEI estimate is reasonably accurate and importantly puts all manufacturers on the same technical basis during the design phase of a project. In effect, it levels the playing field for the Owners allowing them a simple gauge to measure performance. After the numbers of tubes are established, the condenser designer develops the detailed tube bundle pattern, layer by layer based on the space available under the turbine and a host of design rules and requirements. The manufacturer does not use HEI directly for the many estimates, but instead relies on empirical test data & correlations that have been developed over the years.
Avoiding excessive steam side velocities, excessive condensate inundation and steam pressure losses from packing tubes too closely together are paramount design considerations. The designer will use steam lanes and spacing in a distinct pattern to mitigate higher velocities. Because the steam is saturated, pressure drops in a condenser tube bundle are always accompanied by a loss in steam saturation temperature. If the pressure drop is more than anticipated by the design rules, the temperature loss reduces the effective potential difference between the steam and the cooling water temperatures. Since all of the steam is condensed, any extra temperature reduction within the tube bundle causes a backpressure rise that exactly compensates for the loss. This is a direct penalty to the condenser performance and the target design backpressure will not be achieved because in effect the overall tube spacing in the bundle is tight.
In most situations, the HEI method provides a reasonably accurate estimate of the performance of a specific condenser design during its operation. This method supplies a simple, quick empirical method of evaluation and has been successfully used since 1932. Though the basic method has not changed much since then, the correction factors and the heat transfer data has continually been refined throughout the years to help improve its correlation accuracy.
But one underlying engineering premise must be fully understood when the HEI method is applied to determine the performance. As inferred in the paragraph above, the calculation of the HEI heat transfer coefficient fundamentally assumes the tube bundle reflects a pattern of tubes that were properly located for that design condition. If for instance, the tubes were clustered so tightly that steam would not be able to easily enter the bundle, the actual performance would fall very short of the HEI prediction. As a second example, if a tube pattern were constricted so that the steam did not flow uniformly over all tubes as it moved toward the air cooler section, the estimated HEI performance would not be realized. And if the tubes of a certain tube bundle were positioned too close together such that the steam velocities became very high producing higher than expected steam pressure losses and perhaps significant accumulated condensate rain over the tubes, the HEI heat transfer coefficient again would not be achieved.
Similarly, the HEI method cannot be applied to variations in the steamside conditions that are characteristically different than the design conditions because the HEI calculation focuses only on changes in the waterside heat transfer conditions. Since the waterside resistances generally

Session 1: Design Technology
1-7
dominate the overall heat transfer, this is a reasonable engineering assumption that allows simplifications and at the same time provides accurate predictions of the performance of a given design. Unfortunately though, the HEI method does not accurately forecast the performance of the condenser when steam flows and velocities increase appreciably.
Thus, it should be recognized that the existing condenser design that is being used in the power uprate has a tube bundle pattern that was tailored for a maximum quantity of steam. If the uprate steam flow is much greater than the design basis, HEI will produce a very optimistic prediction of the condenser backpressure.
Alternative Evaluation of Condenser Performance
To estimate the condenser performance at appreciable power uprate levels, an adaptation of the well-known thermal resistance technique can be used. The resistance method is more scientifically based than the HEI algorithm and includes a separate value for the steamside resistance at the original, design condition. The condenser steamside resistance change that reflects the added steam flow of the uprate can be estimated from the Nusselt equation with corrections for bundle steam pressure losses and condensate inundation.
The evaluation procedure for power uprates with their increases in steam flow into an existing condenser design is an adaptation from Section 5 of the ASME Performance Test Code [2]. The technique extends the ASME procedures to reflect condensate inundation and incorporates additional factors for the natural steam-side, two-phase pressure loss effects. The overall coefficient of heat transfer is estimated from the individual resistances and then used along with the CW flow, temperature rise, shell surface area and average inlet water temperature to establish the final condenser pressure. This evaluation procedure has continually evolved from a simplistic model of the resistance method to more complex models that incorporate condensate inundation & steam pressure losses.
The major aspects of the detailed computational basis can be found in ASME PTC 12.2, which is also summarized in a 1994 condenser paper [1]. As an outline, the original design point of the condenser includes the cleanliness and with that information and the overall heat transfer coefficient of that design, the fouling resistance (in Units Hr-Ft2-F/BTU) can be quantified. By more precisely determining the waterside resistance from the Rabas-Cane correlation, the designer’s original, overall shell side resistance can then be extracted from the computation. The shell side resistance is then incrementally adjusted for the increased steam flow associated with the power uprate, condensate inundation and the increased steam pressure losses. Summing and inverting all the additional resistances associated with the power uprate, produces the overall condenser uprate heat transfer coefficient. This modified heat transfer coefficient is utilized to determine the increased condenser pressure during the peak uprate conditions or other situations of interest.
As had been indicated earlier, compared to the original design basis, the extra steam associated with a power uprate can be significant. The turbine exhaust pressure upon which any operating pressure limits and generation are based is exactly at the turbine exhaust, not at the condenser tube bundle. Steam flows at high velocities from the annulus of down exhaust turbines, turn and flow over numerous bracing, heaters, extraction lines, the general structure of the exhaust steam
Session 1: Design Technology
1-8
space and the upper section of the condenser. The disturbances in flow pattern cause a pressure loss that is higher than the design and this must be also included in the evaluation of the performance at power uprate. Since the most important point is during peak conditions and this is usually associated with summer, high absolute pressures, the Mach number of the flow is in the incompressible range.
Therefore, incompressible formula can be used to estimate this loss. With the computed condenser tube bundle pressure at uprate conditions, the expected turbine exhaust pressure can now be estimated for the uprate, compared to any operational limits and from the incremental turbine characteristic, the generation benefits including added revenues.
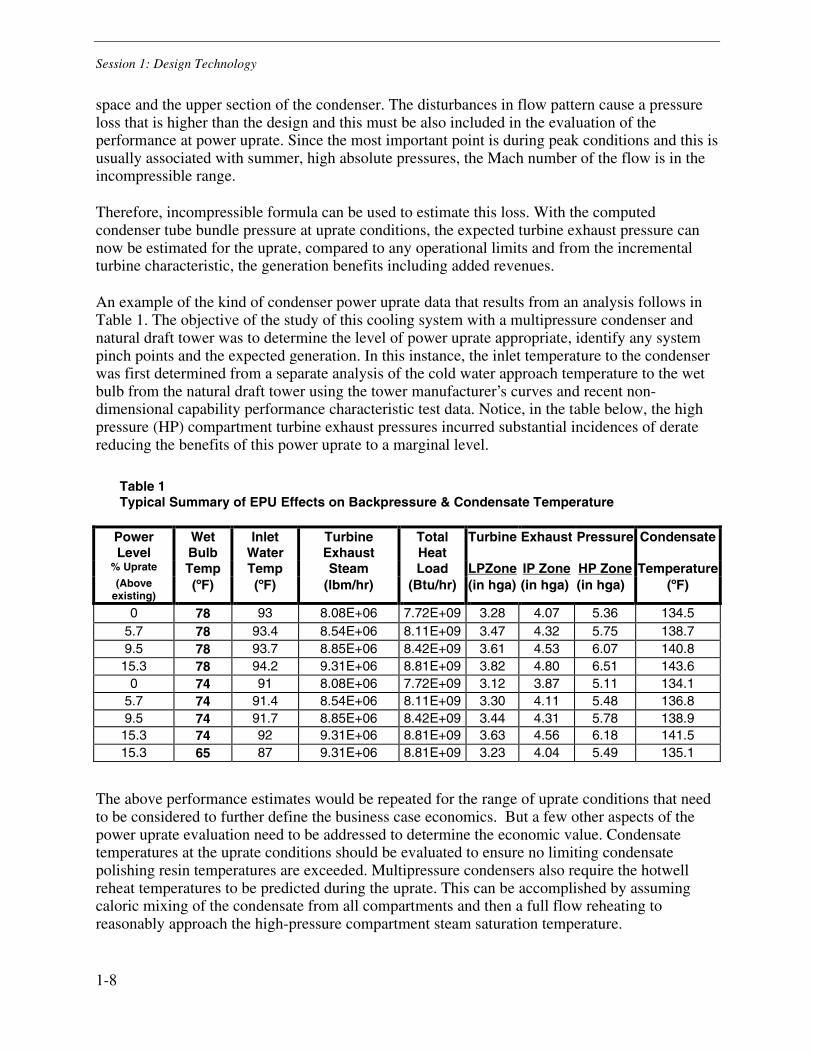
An example of the kind of condenser power uprate data that results from an analysis follows in Table 1. The objective of the study of this cooling system with a multipressure condenser and natural draft tower was to determine the level of power uprate appropriate, identify any system pinch points and the expected generation. In this instance, the inlet temperature to the condenser was first determined from a separate analysis of the cold water approach temperature to the wet bulb from the natural draft tower using the tower manufacturer’s curves and recent non-dimensional capability performance characteristic test data. Notice, in the table below, the high pressure (HP) compartment turbine exhaust pressures incurred substantial incidences of derate reducing the benefits of this power uprate to a marginal level.
Table 1 Typical Summary of EPU Effects on Backpressure & Condensate Temperature
Power Level
Wet Bulb
Inlet Water
Turbine Exhaust
Total Heat
Turbine Exhaust
Pressure
Condensate
% Uprate Temp Temp Steam Load LPZone IP Zone HP Zone Temperature(Above
existing) (ºF) (ºF) (lbm/hr) (Btu/hr) (in hga) (in hga) (in hga) (ºF)
0 78 93 8.08E+06 7.72E+09 3.28 4.07 5.36 134.5 5.7 78 93.4 8.54E+06 8.11E+09 3.47 4.32 5.75 138.7 9.5 78 93.7 8.85E+06 8.42E+09 3.61 4.53 6.07 140.8 15.3 78 94.2 9.31E+06 8.81E+09 3.82 4.80 6.51 143.6
0 74 91 8.08E+06 7.72E+09 3.12 3.87 5.11 134.1 5.7 74 91.4 8.54E+06 8.11E+09 3.30 4.11 5.48 136.8 9.5 74 91.7 8.85E+06 8.42E+09 3.44 4.31 5.78 138.9 15.3 74 92 9.31E+06 8.81E+09 3.63 4.56 6.18 141.5 15.3 65 87 9.31E+06 8.81E+09 3.23 4.04 5.49 135.1
The above performance estimates would be repeated for the range of uprate conditions that need to be considered to further define the business case economics. But a few other aspects of the power uprate evaluation need to be addressed to determine the economic value. Condensate temperatures at the uprate conditions should be evaluated to ensure no limiting condensate polishing resin temperatures are exceeded. Multipressure condensers also require the hotwell reheat temperatures to be predicted during the uprate. This can be accomplished by assuming caloric mixing of the condensate from all compartments and then a full flow reheating to reasonably approach the high-pressure compartment steam saturation temperature.

Session 1: Design Technology
1-9
In extreme cases, the capacity of existing drain trays to handle the extra condensate should be investigated. The condenser non-condensable gases and/or air inleakage after an uprate should be essentially unchanged except in the case of a Boiling Water Reactor (BWR) facility. The production of non-condensable radiological gases increases in proportion to the associated uprate level of a BWR facility. The effect of this increase in non-condensables may require further evaluation. The overall duty of any steam jet or vacuum pump air removal equipment is increased while at the same time the condensate temperature used to condense the steam in a steam jet intercondenser also increases. Similarly, the condensate that seals the vacuum pump may also see a significant temperature increase that can limit or reduce vacuum pump performance.
When an even more accurate estimate of the condenser’s thermal performance for a significant level of power uprate is necessary, a special computational fluid dynamic (CFD) analysis of a condenser can provide the solution. This method has been available since the ‘70’s but computer core space, matrix solution speeds, input-output limitations and virtual modeling inflexibility restricted its use and effectiveness to only long-term research projects. Now with the revolutionary improvement in computer storage, graphics and processing speed, this technology has enjoyed a wider and more practical application with condensers. The equations of motion of the steam, the condensing heat transfer and mass transfer based on the conservation of mass, momentum and energy are applied separately to each of thousands of small elements that simulate a virtual model of the condenser. Then, the composite interaction and response is determined by iteration to satisfy the boundary conditions of the cooling water flows, cooling inlet and outlet temperatures, overall heat loads, etc.
One example of a recent CFD application was to a more than 60,000 tube, three-pressure condenser in a nuclear plant that would be operating at a power uprate of over 25% more than the design of the original condenser tube bundle. In this case, a model of over 350,000 elemental three-dimensional volumes was developed that duplicated one of the two symmetrical tube bundles and the corresponding local steam space geometry. After the model geometry was verified by comparisons of the model to detailed condenser design drawings and the tube bundle patterns, computer runs that captured key operating conditions involving appreciable steam side effects were performed to validate the model. Verification encompassed the unique absence of any tube vibration history in the operation of this condenser for over 20 years. Then, confident predictions were made of the power uprate turbine exhaust pressures at peak conditions in the summer to estimate the response of the steam turbine and its generation at this evaluation point.
Tube Vibration
Condenser support plate spans are selected during their design to avoid tube vibration. Besides the design flow velocity, the span selected by the designer is basically dependent on the lowest condenser pressure, the tube material, its diameter and wall thickness. The higher flow rates associated with a power uprate increase the potential for damaging flow-induced vibration. Since a power uprate has the potential for causing tube vibration, it is prudent to determine the location and length of anti-vibration stakes. These stakes are typically inserted perpendicular to the bundle at the center of a support bay span to arrest any tube vibration. The uprate impact must be quantitatively considered in order to determine if, how long and where anti-vibration stakes need to be located in a condenser tube bundle.
Session 1: Design Technology
1-10
Condensers have experienced damaging tube vibration since the mid-1960’s. The damage is either from mid-span collision, fretting or fatigue failure at the point of support. Heat exchanger manufacturers generally accept the fluid-elastic, flow induced vibration mechanism as the root cause. One numerical tool that allows this evaluation is the Connors Criteria. It can be applied to separate stable and unstable fluid-elastic vibrations and is graphically evident on the plotted results of those calculations. Note that this type of fluid-elastic vibration of condenser tubing has been observed during simulations in controlled laboratory conditions many decades ago.
An adaptation of the Connor’s fluid-elastic method to condensers allows an estimate of the potential for damaging tube vibration during a power uprate. This quantitative method of estimating the onset of damaging condenser tube vibration captures the major aspects of the actual physics of the fluid-elastic aerodynamics. It requires an extensive calculation effort accompanied by a significant amount of detailed condenser design and tube bundle data. During full uprate load operation at the station’s historically low backpressure, it is necessary to estimate the axial and circumferential steam flows around the entire tube bundle. In order to approximate the steam velocity throughout the bundle, it is essential to also determine the condensation of that steam as it enters and travels through the bundle toward the air cooler. The velocity estimate requires measuring the detailed bundle pattern geometry on a large scale drawing of the tube sheet to establish flow areas at several planes on the periphery and in the interior of the bundle. The condensation heat transfer and the steam flow are estimated through sections of the longitudinal and radial portions of the bundle in order to define the local steam velocities across the tubing. Finally, based on the mechanical properties of the tubing and the existing support plate spacing, the unit weight, damping and natural frequency is estimated. These characteristics are compared to determine if, when and how deep into the bundle damaging fluid-elastic tube vibration is likely during a power uprate. The resulting information establishes the length and location of the anti-vibration stakes required to avoid tube vibration. The lengths, numbers and locations can be used as the basis of a subsequent condenser tube staking specification.
An example of the results of tube vibration estimates for a power uprate condition follows. The inlet temperature to the condenser was first determined as the lowest historical temperature that had occurred in the history of the plant. An estimate of the condenser backpressure at the power uprate condition was made first on the basis of that lowest inlet water temperature, the CW pump flows, the uprate heat duty and the apparent condenser cleanliness. The pressure will be found to be higher than the existing power level condenser pressure because of the increased duty and the possible impact of the performance of any cooling tower during an uprate.
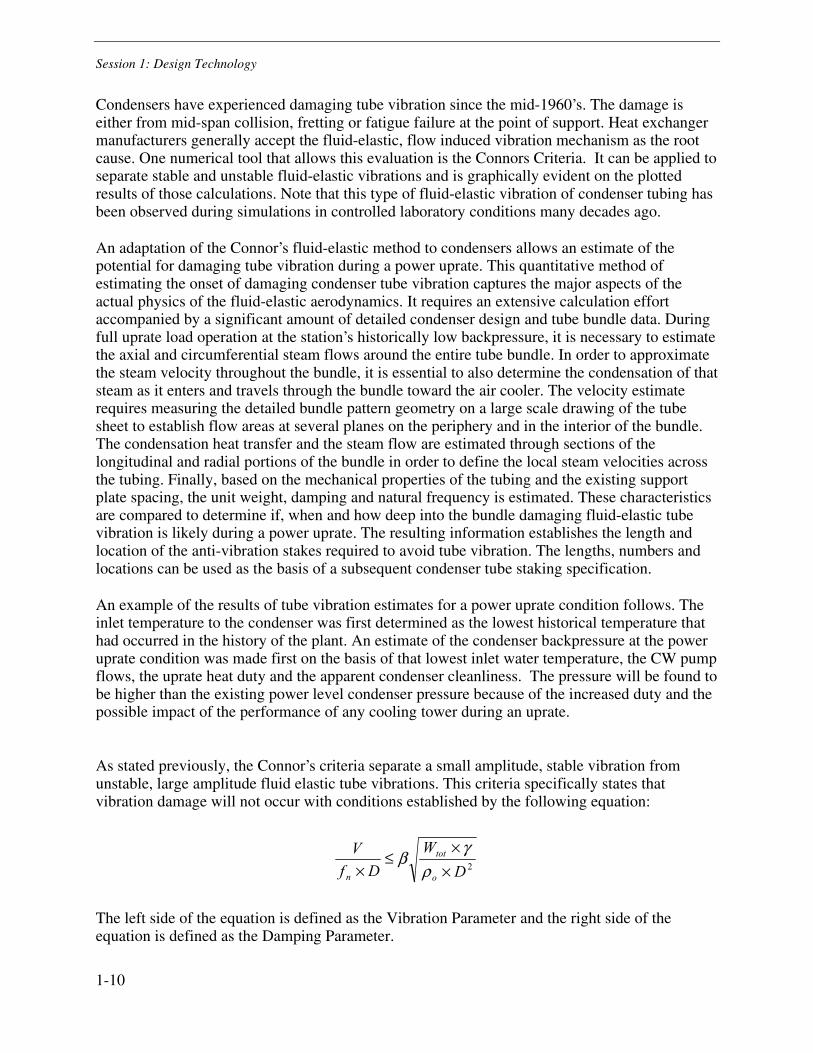
As stated previously, the Connor’s criteria separate a small amplitude, stable vibration from unstable, large amplitude fluid elastic tube vibrations. This criteria specifically states that vibration damage will not occur with conditions established by the following equation:
2D
W
Df
V
o
tot
n ××
≤× ρ
γβ
The left side of the equation is defined as the Vibration Parameter and the right side of the equation is defined as the Damping Parameter.
Session 1: Design Technology
1-11
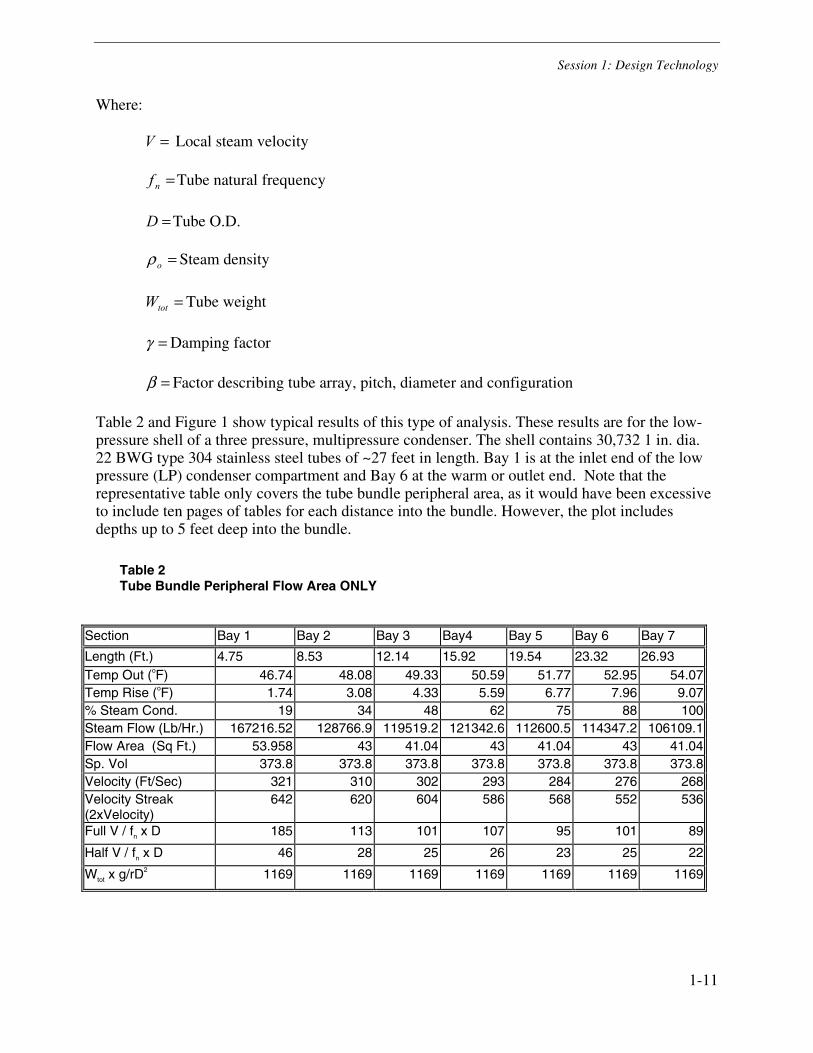
Where:
=V Local steam velocity
=nf Tube natural frequency
=D Tube O.D.
=oρ Steam density
=totW Tube weight
=γ Damping factor
=β Factor describing tube array, pitch, diameter and configuration
Table 2 and Figure 1 show typical results of this type of analysis. These results are for the low-pressure shell of a three pressure, multipressure condenser. The shell contains 30,732 1 in. dia. 22 BWG type 304 stainless steel tubes of ~27 feet in length. Bay 1 is at the inlet end of the low pressure (LP) condenser compartment and Bay 6 at the warm or outlet end. Note that the representative table only covers the tube bundle peripheral area, as it would have been excessive to include ten pages of tables for each distance into the bundle. However, the plot includes depths up to 5 feet deep into the bundle.
Table 2 Tube Bundle Peripheral Flow Area ONLY
Section Bay 1 Bay 2 Bay 3 Bay4 Bay 5 Bay 6 Bay 7
Length (Ft.) 4.75 8.53 12.14 15.92 19.54 23.32 26.93 Temp Out (oF) 46.74 48.08 49.33 50.59 51.77 52.95 54.07Temp Rise (oF) 1.74 3.08 4.33 5.59 6.77 7.96 9.07% Steam Cond. 19 34 48 62 75 88 100Steam Flow (Lb/Hr.) 167216.52 128766.9 119519.2 121342.6 112600.5 114347.2 106109.1Flow Area (Sq Ft.) 53.958 43 41.04 43 41.04 43 41.04Sp. Vol 373.8 373.8 373.8 373.8 373.8 373.8 373.8Velocity (Ft/Sec) 321 310 302 293 284 276 268Velocity Streak (2xVelocity)
642 620 604 586 568 552 536
Full V / fn x D 185 113 101 107 95 101 89
Half V / fn x D 46 28 25 26 23 25 22
Wtot x g/rD2 1169 1169 1169 1169 1169 1169 1169

Session 1: Design Technology
1-12
Figure 1 Critical Velocity versus Damping Parameter
The results shown in the plot indicated that the peripheral tubes in all the condenser bays were prone to damaging fluid elastic vibration. In Bay 1, the extreme cold end of the condenser, such damage is possible down to a depth of almost 5 feet. This analysis is a useful tool when considering the potential of tube vibration damage resulting from the increased steam flow required for a power uprate.
It should be appreciated that the Heat Exchange Institute has published an algorithm within their standard that determines the condenser tube support spacing that avoids severe vibration. It is a rule-of-thumb procedure based on an empirical static load deflection concept. The HEI method does not reflect the actual physical mechanism of the tube vibration as a fluid-elastic whirling vibration. In practice, that calculation has been found to provide a conservative estimate of the required support plate spacing for new condensers. And because the HEI method does not address the actual physics, it cannot effectively be used to determine the length or location of
Session 1: Design Technology
1-13
anti-vibration stakes for an existing condenser that has to be redesigned to accommodate the higher condensing steam flows of a power uprate.
Cooling Tower Evaluations
Many power stations, particularly the larger generators and nuclear plants, use closed-cycle cooling systems that are served by wet cooling towers. A power uprate at such a plant will cause a direct increase in the evaporation and higher return water temperatures to the condenser. Often, the additional makeup flows are required to offset evaporation increases. These may be limited by environmental regulations.
In order to estimate the increased water required for the makeup, it is first necessary to know the number of cycles of concentration of the circulating water. During warm weather conditions characterized by high wet bulb temperatures, it has been empirically determined that the evaporation component of a wet cooling tower is no more than 80% of the total heat duty [5]. This rule of thumb applies equally well to mechanical or natural draft towers, as well as cross or counter-flow designs. Since each pound of evaporating water releases about 1000 BTU’s, an approximation of the added evaporation as a result of the power uprate can be assessed. Of course, more exact estimates of the evaporation can be made. For the power uprate condition, these may be accomplished by determining the quantity of moisture picked up by the cooling air as its state changes from the entering air temperatures to the usual saturated exit air condition. The added cooling tower blowdown is estimated by dividing the extra evaporation by one less than the number of concentrations that currently are employed. Added plant cooling tower makeup is the total of these two elements. Note, that in general, drift losses are minimal and do not need to be seriously evaluated in the estimate of additional makeup flows.
The change in performance of the cooling tower due to a power uprate can be estimated from the existing manufacturer’s performance curves by using the uprate cooling range and reading the curves to evaluate the increase in approach to the wet bulb temperature. That provides the inlet water temperature to the condenser. It is important that these curves be adjusted to be compatible with the results of any recent performance tests, otherwise a significant understatement could result. The actual CW pump flow measured by an appropriate method should be used to modify the curves. To make the corrections to the existing cooling tower performance based on test results and or changes in the CW flow from design, new curves must be drawn accounting for the current performance non-dimensionally with the actual CW flow and the fill characteristic vs. the water to air ratio. The detailed method to apply these adjustments are beyond the scope of the paper but can be derived from the information shown in References [3,5].
Cooling System Upgrades
Finally, it should be noted that if the existing cooling system equipment performance is found to be marginal such that a station power uprate would have limited benefits, it may be cost effective to consider incorporating a modification to the cooling system in the uprate plans. Below is a brief list that identifies some of the typical modifications that can be considered:

Session 1: Design Technology
1-14
• Upgrade Cooling Tower Fill
• Upgrade Cooling Tower Fans or Airflow pattern
• Upgrade CW Pump Performance
• Install a modern Condenser Tube Ball Cleaning System
• Improve Condenser Performance
• Lag Unlagged Heaters and Extraction Lines
• Replace Condenser with Modular Tube Bundles.
• Retube Condenser with optimum Tube Material & Gauge
• Install a Helper Cooling Tower
The cost(s) associated with each enhancement option must be carefully weighed against the potential to increase plant performance and its corresponding economic benefit. Obviously, these types of modifications represent a major change in the uprate project scope and costs, but may be the only way to permanently change a pig’s ear into a silk purse.
Conclusions
The power uprate constitutes a method of cost-effectively increasing the generation of existing nuclear and fossil power plants. Significantly more waste heat will accompany the power uprate and must be accommodated by the existing cooling system. When considering these projects, it is important to review the current condenser and cooling tower performance capability to determine the degree to which that equipment will be compatible with the uprate during peak demand conditions. The paper describes the method of investigating and quantifying the current performance of the cooling system & its components. Then, using these baseline performance estimates one can extrapolate the uprate capability. Of the equipment involved, the condenser is often the most sensitive limiting the benefits of a future uprate.
It was concluded that the HEI condenser performance predictions do not accurately take into account the steamside effects from the added turbine exhaust steam flow that accompanies a substantial uprate. The HEI method often seriously underestimates the resulting backpressures. The paper recommends applying an extension of the resistance heat transfer method to provide a more reasonable estimate of the backpressure and condensate temperatures since it accounts for steamside effects.
Other uprate impacts discussed include the increased potential for damaging condenser tube vibration especially during winter operation at low operating backpressures. The vibration usually causes failure at the midspan or due to wear/fretting at the supports. The Connors technical criteria was introduced in order to determine the location(s) and depth into the tube bundle for installation of anti-vibration stakes to prevent damaging fluid-elastic vibration.

Session 1: Design Technology
1-15
The paper also determined that a power uprate study must address the post uprate capability of the cooling tower. The tower will produce higher condenser return temperatures, adding to the turbine exhaust pressure. A power uprate will require increased cooling tower evaporation, blowdown and makeup. These may be subject to heightened environmental regulations. The paper recommends and discusses applicable methods to estimate the power uprate effects on the cooling tower performance.
Finally, the paper indicates that if the current cooling system equipment performance is marginal allowing only a limited station power uprate, it may be cost effective to consider incorporating system improvements. For each improvement option, a detailed feasibility and cost study is necessary including the cost of the uprate modification and the present value of the annual increased station revenues. Some of these modifications are listed in the paper and may include upgrade of cooling tower fill, a tube ball cleaning system, higher capability CW pumps, modular condenser replacement, a helper tower, or other modifications to the CWS equipment.
Taking into account all the power uprate impacts on the system performance including the addition of any cooling system modifications will appreciably contribute to the success of the overall project.
References
1. Burns, J.M.; Almquist, C.; Hernandez, E.; Tsou, J.; "Accurate Condenser Performance Monitoring Guidelines Provided by New ASME Condenser Test Code", EPRI Heat Rate Improvement Conference, May 1994.
2. ASME PTC 12.2, Performance Test Code on Steam Surface Condensers, 1998.
3. ASME PTC 23, Performance Test Code on Atmospheric Water Cooling Equipment, 1986 or 2002.
4. Heat Exchange Institute, “Standards for Steam Surface Condensers”, Ninth Edition, 1995.
5. Burns, J.M. and Brocard, D.; "Cooling Towers," Section 4.8. Handbook of Energy Systems Engineering: Reference Text, J. Wiley & Sons, N.Y., 1985.


Session 1: Design Technology
1-17
CFD ANALYSIS PREDICTS CONDENSER PERFORMANCE AFTER LARGE POWER UPRATE OF THE QUAD-CITIES AND DRESDEN STATIONS
N. Rhodes Consulting Engineer
New York
C. D. Hardy Heat Exchanger Systems Inc.
Weymouth, Massachusetts
J. M. Burns Burns Engineering Services Inc.
Topsfield, Massachusetts
T. B. Madden Stone & Webster Inc.
Cherry Hill, New Jersey
Abstract
This paper presents the results of work carried out to study the Extended Power Uprate (EPU) operating conditions for Exelon’s Dresden Nuclear Power Station Units 2 and 3 and Quad-Cities Nuclear Power Station Units 1 and 2 condensers. The study involved the development of a three-dimensional condenser simulation model based on computational fluid dynamics (CFD) techniques. Subsequently, that model was applied to predict the turbine exhaust pressures for the cumulative 36% increase in design condenser steam flow that was associated with EPU conditions.
The CFD model reflected the major design details of the condenser including the tube bundle pattern of this single pass, three pressure multipressure configuration that contains an intermediate waterbox . To validate the accuracy of the model, the condenser performance was first evaluated at current conditions using the existing steam mass flow, cooling water flow rate and temperature for several conditions measured at the plant. Comparisons of the CFD simulation to actual observations verified that the model results closely predicted the performance and physical response of the condenser.
Following this verification, the model was then applied to ensure the business case that justified the costs of the plant uprate would be realized. Specifically, the EPU 36% increased design steam flow condition was combined with summer water temperatures and simulated by the CFD model to be reasonably certain the turbine exhaust pressures would not exceed manufacturers limits and at the same time, that the target EPU plant generation of 912 MW would occur.

Session 1: Design Technology
1-18
Introduction
This paper describes work carried out to study the Extended Power Uprate (EPU) operating conditions for Exelon’s Dresden Nuclear Power Station Units 2 and 3 and Quad-Cities Nuclear Power Station Units 1 and 2 condensers. The ultimate objective of the condenser performance study was to ensure the business case that justified the costs of the plant uprate to 912 MW would be realized during warm summer conditions. In comparison to the design basis of the existing tube bundles, EPU operation would cause 36% more steam flow to be condensed. Because of the appreciable condenser steam-side heat transfer, condensate and flow effects that would be associated with this level of extra condenser steam flow, it was determined that the typical HEI (3) condenser performance algorithm would not be applicable since HEI only addresses water-side tube bundle effects. This engineering study involved the development of a three-dimensional condenser simulation model based on computational fluid dynamics (CFD) techniques. Subsequently, that model was applied to predict the turbine exhaust pressures for the appreciable 36% increase in design condenser steam flow.
The CFD method separates a condenser steam space into small connected discrete volumes called cells that can be characterized mathematically. After the geometry is modelled and the three dimensional cell mesh created, all the equations that apply are simultaneously solved to each of the volumes to describe the detailed physics that is occurring at that cell. These equations capture the fluid motions of the steam, the condensing heat transfer and mass transfer based on the conservation of mass, momentum and energy, and account for parameters such as gas concentration, heat transfer resistances, transport properties and condensate inundation. The interactions and gross response of all these small volumes are then solved iteratively to estimate the conditions and compatibilities at the boundaries of the model, i.e., the cooling water flows and inlet temperature, , overall heat loads, turbine exhausts and non-condensible-vapor off-take. The techniques used in this particular program have been refined and applied specifically to steam condensers since the initial general purpose CFD method was first utilized for condensers by the CEGB in the early 1980’s.
This CFD model reflected the major design details of the condenser including the tube bundle pattern of this single pass, three pressure multipressure configuration that contains an intermediate waterbox . To validate the accuracy of the model and technique, the condenser performance was first evaluated at current conditions using the existing steam mass flow, cooling water flow rate and temperature for several conditions measured at the plant. Comparisons of the CFD simulation to actual observations verified that the model results closely predicted the performance and physical response of the condenser. Following the verification, the model was applied for the EPU conditions.
Following EPU, the Dresden and Quad-Cities condensers will be required to condense approximately 8 million lbm/hr, thus stretching the condenser capability to accommodate turbine exhaust steam flow by over 35%. The use of a sophisticated three-dimensional model as applied in this study assists in predicting the increased effects of steam side pressure drop associated with higher steam velocities and the effect of additional condensation which increases condensate inundation.

Session 1: Design Technology
1-19
Physical Situation
The Dresden and Quad-Cities condensers are identical in design. The main surface condenser unit consists of two tandem tube bundles with an intermediate waterbox within a single, rectangular shaped shell that is oriented parallel to the turbine shaft. It is a three pressure multi-pressure, single-pass, vertically divided design that was originally designed by Ingersoll-Rand in the late ‘60’s and early ‘70’s to serve a 715 MW General Electric Company turbine generator. The condenser design parameters are listed in Table 1 and the tube bundle configuration is shown in Figure 1. Nine main support plates in each of the three pressure zones extend from the top to the bottom of the tube bundle, perpendicular to the tubes and are welded to the shell. There are two support/partition plates, one in each bundle, that run from the top of the condenser to a water seal below the tube bundles, and are uninterrupted running across the condenser. These partition plates divide the condenser into the three separate pressure compartments. The lowest pressure compartment is at the circulating water inlet end of the condenser, the highest pressure is at the outlet end and the middle compartment is the intermediate pressure compartment.
The cooling water passes through the low pressure section, partially through the intermediate vacuum section and then it enters an intermediate waterbox. The tubes are continued through the intermediate pressure section, into the high pressure section and out of the condenser.
In cross-section, the condenser is symmetrical about its vertical centre-line and so only one half of the condenser has been modeled. Figure 1 shows this half-section with the position of the tube bundle superimposed. Figure 2 illustrates the complex geometry of the internal structure. This figure shows a perspective detail of the intermediate pressure section, including the waterbox, tube support plates and the dividing plates between the other pressure sections as well as the plates which control the movement of the uncondensed steam/air mixture towards the air offtake section in the low pressure compartment.
The condenser contains a total of 61,464 tubes divided into two tube bundles. (Note that all quantities are referred to the whole condenser and not the half-section modeled). Figure 1 shows the distribution of the tubes in one bundle. It can be seen that the upper half of the tube-nest is characterized by “rays” of tubes aligned almost vertically, with two triangular sections on either side of the lower part of the upper section. Although not shown, the outer edge of these latter sections have horizontal lanes, created by the removal of one row of tubes in every four rows. These extend for about ten to twelve tube rows.
In the lower part of the tube nest the outer parts all have steam lanes similar to those described above. The horizontal lanes in this region extend from the outer perimeter to the fully-tubed sections on either side of the centre-line of the tube nest.
Non-condensable gases are removed at the cooling water inlet end. Air removal is by way of a series of apertures in the tube support plates which direct the non-condensables to the cooling water inlet end. The air-cooling section is bounded by a divided horizontal tray below the upper half of the tube bundle, and sloping trays below. The shorter sloping tray within this section corresponds with apertures in the tube support plates which alternate above and below these plates along the length of the condenser. These direct the non-condensable gases and uncondensed steam through the small tube bundles within the air cooling section as it flows

Session 1: Design Technology
1-20
towards the outlet. A second divided horizontal tray is located below the air-cooling section between the two sections of the lower bundle.
The design data which has been used in the study is given in the following table:
Table 1 Condenser Parameters
Design Variable Value No. of Tubes 61,464 Tube Length 40ft 4.75in Total Surface Area [ft2] 650,000 Tube Outside Diameter [in] 1.0 Tube Wall Thickness 22 BWG
Tube Material ASTM 304 SS
The computational model for the flow of steam through the condenser includes heat and mass transfer, the effect of inundation (the reduced heat transfer due to the increase in water film thickness over the tubes caused by condensate falling from tubes higher in the nest) and frictional pressure drop on all surfaces, such as baffles,, support plates, and the tube nest. These parameters are calculated in each grid cell using the locally predicted variables. Thus, in contrast with the normal design process where a constant heat transfer coefficient is assumed, the heat transfer coefficient varies throughout the condenser and is influenced by the local conditions. The condensation and friction processes are represented as a series of momentum, mass and scalar sink terms in the appropriate equations as described in References 1 and 2.
The condenser model utilizes a general-purpose Computational Fluid Dynamics (CFD) program, the CFX code developed by AEA Technology, in conjunction with a highly developed model of the heat and mass transfer processes. The finest distribution of cells is in the cross section of the condenser. In the present study a grid of 61 by 117 cells divide the condenser in the horizontal, x-direction, and the vertical, y-direction, respectively. Longitudinally, there are two divisions between each support plate, resulting in 50 cells in the z-direction. Thus, the condenser model utilizes a grid of 356,850 cells.
To complete the model, the following boundary conditions were applied:
• Turbine Exhaust: Steam/Air inflow from the turbine is defined as a mass flow rate of steam and a steam/air concentration into the condenser. The velocity is not uniform, but varies with position at the inlet. The variation in velocity reflects the Hertzog Hood design and was included in the modelling.
• Cooling Water Temperature and Flow Rate: The cooling water inlet temperature and mass flow rate are set at the specified conditions.
• Air Offtake: The air offtake is defined as a constant pressure boundary. It is important to note that the air removal equipment, in this case steam-jet air ejectors, are not modelled explicitly.

Session 1: Design Technology
1-21
Table 2 presents the condenser parameters used for the base case, Case 1 and the EPU case, Case 2. Note that where applicable the values are halved for the model as only one half of the unit is simulated.
Table 2 Operating Parameters
Case 1 Case 2
Average CW inlet temp (F) 34.5 90 Circulating water flow (gpm) 364,000 473,000 Main steam heat load (BTU/hr) 5.68464E+09 6.78422E+09 Main steam flow (lbm/hr) 6,324,000 8,125,755 Main steam enthalpy (BTU/lb) 934.4 944.3 Cold Hood Condenser Duty (BTU/hr) 1.91064E+09 2.33745E+09 Intermediate Hood condenser duty (BTU/hr) 1.85642E+09 2.28755E+09 Hot Hood condenser duty (BTU/hr) 1.82798E+09 2.24935E+09 Cold Hood Condenser steam flow (lbm/hr) 2,108,834 2,708,585 Intermediate Hood condenser steam flow (lbm/hr) 2,108,558 2,708,585 Hot Hood condenser steam flow (lbm/hr) 2,108,325 2,708,585 Cold Hood enthalpy (BTU/lb) 929.3 936.4 Intermediate Hood enthalpy (BTU/lb) 929.4 943.1 Hot Hood enthalpy (BTU/lb) 929.5 953.4 Air inleakage (lbm/hr) 90 (actual) 211.1 Hydrogen carryover (lbm/hr) 20.9 37 Oxygen carryover (lbm/hr) 153.8 295 Tubes plugged 450 3,518 Tube cleanliness 100% 80%
Presentation of Results
Typical flow visualization plots showing velocity vectors and steam concentration are given in Figures 3 and 4. The velocity vectors show the magnitude and direction of the steam/air flow. These are made at a two-dimensional x-y plane within the low pressure vacuum section.
Figure 3 shows the velocity distribution over the whole section. The main features which can be seen are:
• The variation of velocity across the top of the tube nest in the upper part of the figure. It is interesting to note that this maldistribution of flow persists down to the top of the tube nest, and some flow recirculation is noticeable due to the outward sloping shell.

Session 1: Design Technology
1-22
• The frictional resistance of the upper tube nest causes part of the flow to divert around the top of the nest and flow down both sides of the bundle in the outer and central lanes.
• Where the horizontal drain tray protrudes outside the bundle, at the top of the air-cooling section, the flow accelerates slightly.
• The flow down the central lane continues around and underneath the bundle and causes the flow on the outer lane to be unsymmetrical. The steam enters the lower bundle on the outer side about half-way up the lowest section, the flow stagnating in the outer lane in this region.
• The velocities within the tubed regions are generally lower due to condensation and frictional resistance.
Figure 4 shows the steam/air concentration at this plane. In the upper part of the bundle, low concentration regions can be seen on either side. In the lower bundle, similar features can be seen on the right-hand side below the air-cooling tray and the lowest rain tray. These correspond with low velocity regions of the flow, and there is little pressure gradient to drive the flow towards the air-cooling section, in contrast with the left side, where the flow continues through the denser inner tubed region. Note that the steam/air concentration is assumed to be uniform at the inlet and is determined from the respective steam and non-condensable flow rates. As condensation proceeds, the relative concentration of air increases as can be seen in the figure.
Case 1: Model Verification and Validation
All CFD models should undergo a verification and validation test to establish their level of accuracy. In this case, its verification determined that the computer model accurately represented the tube bundle, flow conditions and geometry of the condenser. That task involved a comparison of the model to numerous design drawings and to the plant CW flow and temperature data. Next, the validation process settled the extent to which the model and its simulation reflected the real world from the perspective of its intended use (performance during operation). The model was subsequently used to predict the Case 1 winter full load conditions and by a visual and numerical examination of the steam flow patterns and velocities at those low backpressures, estimate if the CFD model would have predicted condenser tube vibration which had been experienced under certain conditions.
Two different types of validation tests were applied. The first in this instance was a prediction of representative, existing full load operation at winter conditions that cause a low condensing pressure. The results of this estimate compared well against the plant operating data as Table 3 attests. Therein, the average compartment condenser pressures during winter full load operation at the turbine-condenser flange of the Quad-Cities condenser are compared with measured data.
Table 3 Comparison of Measured and Predicted Condenser Pressure for Case 1
cold hood intermediate hood hot hood measured 1.11 1.3 1.53 predicted 1.12 1.4 1.71

Session 1: Design Technology
1-23
The predicted pressures are averaged across each inlet section at the turbine-condenser flange. It can be seen that the predictions are in reasonably close agreement with the data, although there is a tendency to slightly over-predict the pressures at the high vacuum pressure inlet, the difference being 0.18 in Hg.
Because of the high steam velocities that occur during low pressure winter operation, tube vibration can occur to condensers with tube support spans that are too long. Tube vibration damage had frequently been experienced by many condensers fabricated with the relatively long support spans that were the norm for the time frame of the design of Quad-Cities and Dresden. But no tube vibration damage had been observed at Quad-Cities until the early ‘90’s despite over 20 years of operation. Thus, to establish the validity of the model, advantage of that fact was utilized in an examination of the detailed steam velocity levels of the low pressure compartment in the simulation of Quad-Cities winter operation.
That study provided a unique and powerful indicator of the validity of this model because the CFD method simulates (also) the condenser steam-side effects and parameters during operation and these are the ones that were to be significantly altered by EPU. The CFD validity was established after the winter full load condenser pressure level was predicted. Then the (non) lack of appreciable tube vibration was determined from applying the Connors Criteria to the detailed CFD steam velocity results at various cross sectional tube bundle planes in the low pressure compartment. All steam velocities tested were essentially below the Connors threshold.
Figure 3 illustrates the predicted velocity of the steam around the tube nest. The velocity vectors indicate the magnitude and direction and are plotted for each grid cell. Numerical data from he model was provided as u- and v-component velocities within and around the tube nest to facilitate the Connors analysis.
A further performance run was conducted for summer conditions at the existing full load prior to carrying out the EPU case. As well as providing additional validation of the model, the results provide a basis for comparison with the EPU case which is also for a summer condition. The plant-measured conditions for this run were as follows:
Table 4 Full Load Conditions for Summer Case
Inlet CW temperature (F) 90 Main Steam Flow (lbm/hr) 6,600,000 Main Steam Heat Load (BTU/hr) 5.67E+09 Tubes plugged 3193 Equivalent HEI Cleanliness 0.76
Table 5 Comparison of Measured and Predicted Condenser Pressure for 90F inlet temperature
cold hood intermediate hood hot hood Measured 3.07 3.7 4.53 predicted 3.2 3.69 4.58
The results in Table 5 show reasonably good agreement with measurements.

Session 1: Design Technology
1-24
Case 2: Power Uprate Conditions
The predicted pressures at the EPU conditions are presented in Table 6.
Table 6 Turbine exhaust inlet pressures for EPU conditions
Offtake pressure cold hood intermediate hood hot hood steam/air ratio at outlet
3 4.22 4.806 6.06 5.37 1.79 3.78 4.44 5.63 10.1
The offtake pressure for this simulation was set at values of 1.79 and 3.0 in Hg.. At this condition, the steam/air ratio at offtake was predicted to be 10.1 and 5.37 respectively, which is to be compared with the value of 5.5 obtained for the full load case at 90 F inlet temperature. If the SJAE’s could not handle this ratio then the condenser pressure would adjust itself until a reasonable operating ratio was achieved. Consideration therefore may need to be given as to the consequences on the air offtake equipment of higher flow rates.
Finally, it should be borne in mind that the exceptional detail of the CFD model was designed to simulate the physics of the condensation heat transfer and compressible fluid flow that occurs within the tube bundles of an actual condenser. The CFD model faithfully duplicated the geometry of the space between the tube bundles and turbine–condenser flange. Though it included a representative turbine steam velocity profile as well as the two large heaters, the extensive structural bracing, supports and extraction lines were not incorporated. Hence, other than the minimal effects of wall friction, the CFD model did not capture the exhaust steam pressure loss between the end of the turbine skirt and the condenser tube bundles. Instead, past engineering experience was used to approximate that pressure loss. For the LP condenser zone, it is estimated that a 0.15 in Hg loss between the CFD model result and the turbine flange would occur during the EPU Case conditions. Then based on the comparative steam specific volumes, that pressure loss value should be modified to 0.13 and 0.10 in Hg to respectively represent the IP and HP condenser zones. These pressure drops should be directly added to the CFD model tube bundle results in order to estimate the expected EPU turbine exhaust pressure conditions.
Conclusions
This paper describes the application of CFD-based condenser model to predict the three-dimensional flow and heat transfer behaviour in the Dresden and Quad-Cities condensers. The method was utilized because the costs of the EPU were to be justified by confirming that 912MW of generation could be obtained during warm summer conditions while turbine exhaust pressure limits would not be exceeded. For this target condition, the condenser design steam flow will increase 36% after EPU and this exacerbated steam side condition is not captured by the HEI condenser performance algorithm. Validation of the model accuracy was first demonstrated by comparing its predicted performance during existing operation and its prediction that was compatible with the physical reality that there would be no extensive tube vibration at this condenser despite its many years of cold weather, full load operation at low turbine backpressures. Following the model development and validation phase, the model was then applied to EPU conditions.

Session 1: Design Technology
1-25
Mainly, the results of this CFD study established that during summer full load EPU conditions 912 MW will be obtained and turbine exhaust pressures will be slightly below the manufacturer’s limits. The comparison of the CFD model results vs. plant operating data shows that it accurately predicted the exhaust pressure measured at the plant and had provided a reliable early confirmation of the expectation of producing 912MW.
In addition, the results of the study provided an insight into the flow behaviour within the condenser. With regard to the flow, the asymmetrical behaviour in the lower part of the bundle, caused by a combination of the flow maldistribution, the expansion in the side of the shell and the upper horizontal rain tray gave rise to poorer performance in the right part of the tube bundle.
Future applications of the model could include a determination of how to operate the circulating water system to avoid vibration induced tube failures, specification of optimal staking locations, and to develop modifications to improve performance.
References
1. Al-Sanea S, Rhodes N, Tatchell DG & Wilkinson T S “A computer model for Detailed calculations of the Flow in Power Station Condensers.” Proc. “Condensers: Theory and Practice”, IChemE Symposium, Series No. 75 pp78-80 (1983)
2. Al-Sanea S A, Rhodes N and Wilkinson T S (1985) "Mathematical Modelling of Two-Phase Condenser Flows" Presented at 2nd International conference on Multi-Phase Flow, London
3. Heat Exchange Institute Standards for Steam Surface Condensers, Ninth ed., 1995.

Session 1: Design Technology
1-26
Figure 1 Condenser Cross Section
Figure 2 Perspective view showing intermediate waterbox and detail of internal structure

Session 1: Design Technology
1-27
Figure 3 Velocity Vectors at the mid-plane of the LP Section
.
Figure 4 Steam Concentration Contours


Session 1: Design Technology
1-29
SURFACE CONDENSERS, STEAM DUMP, & DESIGN RELIABILITY CONSIDERATIONS
David H. Cooley Alstom Power
Fossil power plants typically used steam dump for up to 10% - 20% load on start up (one start every year to year and a half) and under turbine trip conditions that normally had a fast decay from 110% load in 30 min. to 1 hour. The typical fossil power plant had a steam dome that contained a feedwater heater and extraction piping. The height of the steam dome was, more often than not, set by these requirements and/or keeping the waterboxes under a mezzanine floor. Thus steam domes usually had an average height of 12 to 16 feet with some large MW plants reaching 30 feet.
These type of designs provided the volume necessary to dissipate the energy of the steam dump, slow velocities to acceptable levels and locate the dump tubes far enough from the tube bundles to prevent localized high velocities or direct impingement on the tubes. There were few growing pains in the late 1960’s and early 1970’s that were primarily centered around proper draining of steam dump lines coming to the condenser and the philosophical question of proper location of dump tubes within the condenser to protect the turbine. After these were resolved, the industry proceeded with virtually no problems associated with this service.
In the mid 1980’s the industry evolved from fossil power plants to combined cycle power plants. Combined cycle power plants brought new modes of operation that include multiple starts per year, multiple HRSG’s and hence multiple steam dump lines of varying pressure, steam dump flows up to 180% - 200% of design flow and steam dump systems that can operate continuously for hours if not days or weeks.
This change in the type of power plant coupled with the privatization of the Utility industry changed the financial basis for power plants and hence the system designers considerations on space and components. These system design considerations have included elimination of diverter dampers thus requiring continuous steam dump, thinner wall tubing, relocation of the dump valves closer to the condenser, introduction of enthalpy control systems for desuperheating, and less available space for the condenser.
The combined cycle power plants have quickly grown in size and complexity in the last 10 years. Plants of 600MW total combined output have become commonplace. Plant designs are ever evolving and single shaft units where the gas and steam turbine are on the same shaft are just recently being brought on line. Hence, plant start up requirements have been continuously evolving and therefore the requirements on the condenser have changed considerably. Yet the plant designers have typically been unable provided the condenser designer with the information related to the start up requirements and operation modes that could affect the condenser design.
The net result is that the industry has recently been experiencing condenser failures that have been associated with steam dump operation. These failures have included fatigued tubes and eroded tubes. When these failures occur at initial by-pass operation, the start up is delayed.

Session 1: Design Technology
1-30
Repairs may be costly and time consuming and other equipment in the plant may have been affected. Thus the successful operation of the condenser in the steam dump mode is critical to a successful plant start up and long term operation and as such deserves the proper attention in the design phase.
Steam dump operation has generally not had the focus necessary for the industry to understand that this mode of operation is severe. In combined cycle power plants it is often the criteria that drives the condenser design. When steam dump flows exceed approximately 120% - 140% of normal design flows the steam flow areas within the condenser are often dictated by the steam dump mode of operation
Steam entering the condenser from the turbine has already been expanded to the saturation conditions. It is delivered to the condenser over a large area at relatively benign velocities and with velocity vectors directed toward the condenser tube bundles. Steam dump generally enters the condenser from the dump tube superheated about 300°F, over a relatively small area at sonic velocity and with velocity vectors generally perpendicular to the normal steam flow direction.
The condenser is required to accept this flow and desuperheat it to saturation conditions, reduce the velocities to acceptable levels and provide proper distribution over the length of the tube bundle. At the same time the turbine and condenser structure and tube bundles must be protected from overheating, erosion and localized damaging high velocities.
There are many different types of steam dump devices (i.e. perforated dump tubes, reverse conical dispursors, multiple expansion device, etc) used distribute the steam within the condenser. With any of these steam dump devices the reliability of the condenser operation under steam dump can be assured with the following three criteria:
• Plant designers must provide the condenser designer with the start up scenarios. With multiple HRSG’S different steam dumps can be operating at different times and often partial operation can produce distribution velocities in the condenser that may be unacceptable to the condenser designer.
• Steam delivered to the condenser must be dry at all points of operation (25°F to 75°F superheat). Erosion of condenser parts and tubes can happen in minutes depending upon the wetness of the steam.
• Plant designers must provide space for adequate volume in the steam dome and distance from the condenser tube bundles to allow for effective energy dispersion and velocity reduction of the dump steam prior to entry into the tube bundle. This prevents localized high velocities and/or heating that can cause tube fatigue failures or overstressing.
Many plants have multiple combustion turbines and multiple HRSG’s. The start up and operational scenarios are many. The condenser can see multiple combinations of steam dump flows over the entire range of cooling water temperatures. Consequently a condenser designed for 2.00 in. HgA can typically see pressures ranging from 0.8 in. HgA to 5.00 in. HgA. This is a 5.8 fold variation of the specific volume causing a comparable variation in velocities over the range of operation.

Session 1: Design Technology
1-31
Placement and/or interconnection of steam dump piping can often mean the difference between damaging localized high velocities and safe operation at off design situations. This is particularly important in side exhaust arrangements where interconnection of all steam dump sources outside the condenser to allow equal flows to both condenser shells at all times is essential to preventing cross flow through the turbine and potential turbine damage.
Down flow and axial exhaust turbine suppliers may also have limitations on the position of dumping devices relative to the last stage blades. It is important that these requirements reach the condenser supplier in the initial design stage.
To ensure the most reliable steam dump system it is incumbent upon the plant designer to provide the condenser designer the operating scenarios expected. Otherwise the condenser designer cannot check the range of conditions and off design operational problems could arise.
The condenser is a robust carbon steel encasement of a comparatively delicate tube bundle. The tubes are the essential heart of the condenser and are subject to failure from waterside corrosion, mechanical damage, vibration fatigue and erosion. Erosion on the steam side is a direct result of wet steam at high velocity. Tube walls can be eroded through in a manner of minutes and high water densities can promote buffeting thus producing fatigue failures.
Impingement shielding can be installed in a condenser to mitigate the effects of wet steam but cannot ensure that erosion damage will be eliminated. They are at best wearing parts that will require replacement in time and may deflect the erosion to an adjoining area. Impingement shields by their nature can interfere with the normal steam flow and produce extra pressure drop between the condenser and the tube bundle affecting turbine output negatively. The only true and correct solution is to maintain dry and safely distributed steam to the condenser at all modes of steam dump operation.
With a standard bypass arrangement consisting of a steam dump valve, attemperator, either within the valve or separate and a perforated dump tube the sources of water in steam dump lines have been attributed to:
• Draining the steam lines that are prior to the dump valve through the dump valve and not through a drain pot in the steam dump line.
• Turning on the desuperheating water flow prior to establishing steam flow.
• Locating attemporation devices too close to the condenser.
• No drain provisions in the dump tube in the condenser.
• Undrained loops in the steam dump piping to and in the condenser.
• Desuperheating systems that do not provide monitoring of downstream conditions.
Draining steam lines through the dump valve is particularly dangerous from an erosion standpoint on start up when steam flows are low and the temperatures are relatively low. At the low pressures existing within the condenser there is virtually always sufficient pressure within the steam dump tube to produce sonic velocity across the orifices. The water exiting the steam

Session 1: Design Technology
1-32
dump device is easily accelerated to damaging velocities. Installing drain pots on the main steam line prior to the dump valve will eliminate this problem.
Establishing desuperheating water flow prior to establishing steam flow can be devastating to the condenser. If the desuperheating water flow is low only minor erosion may occur. If the desuperheating water flow overwhelms the drain capacity of the dump tube major damage in the condenser can occur as the excess water is expelled by the steam flow at near sonic velocities first as solid streams then as droplets. Under certain conditions physical damage to the steam dump tubes is also possible. Interlocking the desuperheating water valve with the steam dump valve so that the desuperheating valve cannot open until the steam dump valve has opened can eliminate this potential problem. It would also be advisable to program in a small time delay of up to 3 - 5 seconds to ensure that the steam dump flow has been established prior to desuperheating water flow.
The trend has been to move attemporation devices and/or valves closer to the condenser to save plant costs. Attemportation is a time related function that is dependent upon droplet size and the amount of remaining superheat. Thus complete evaporation and hence dry steam do not occur until some distance down the pipe from the device. The general rule is that 90% evaporation occurs at the distance calculated from 0.1 times the velocity in the pipe and 100% evaporation is obtained at 0.3 times the velocity in the pipe. The actual distance to be used in design is dependent upon the type of attemporation device and the actual operating conditions.
If complete mixing has not occurred by the time the condenser connection is reached erosion of the dump tube holes and possibly condenser parts and/or tubes is possible. A guarantee should be obtained from the attemporation device manufacturer, which may be included in the steam dump valve, for the longest distance for complete mixing under all conditions of operation. Then if the attemporation device is located at least this distance from the condenser connection, to ensure 100% evaporation, this potential problem can be eliminated.
Unheated parts of any system handling steam are subject to continuous condensation. Thus water build up is insidious and must be foremost in the systems designers’ mind. Water retention in the dump piping and/or the dump tube both outside and within the condenser is easily rectified by ensuring the subject is part of the agenda for every design review and that low points are designed out and adequate drains are designed in.
The trend today in desuperheating control systems is to install an enthalpy based digital control system (DCS). The traditional method that has been proven successful and reliable over the years was a temperature feedback system. The temperature feedback system by nature is based on the temperature conditions down stream of the desuperheating device and the condensate valve is adjusted to maintain the set temperature. Once set for the design temperature that provides the appropriate superheat (i.e. typically 25°F to 75°F) at full load conditions, at all lower load conditions the steam will always be dry. If there is an upset in the operation of the desuperheating system it can be detected immediately since the downstream temperature is being monitored.
One type of enthalpy based DCS takes as its inputs condensate temperature, condensate flow, dump steam flow and dump steam enthalpy. Using these inputs and an algorithm the DCS

Session 1: Design Technology
1-33
calculates the amount of condensate flow required to desuperheat the incoming dump steam flow and then adjusts the condensate control valve until the condensate flow readings match.
The dump steam enthalpy is typically provided by a separate DCS that takes input from temperature and pressure sensors in the main steam dump piping. This reading should be relatively accurate. The same holds true for the condensate temperature, which again comes from a direct temperature reading in the condensate line. The condensate flow is typically monitored using an orifice type flow meter that should have a high degree of accuracy.
The only input value that is usually not directly known is the dump steam flow. This is typically obtained from the output of the steam dump valve position indicator and the valve flow coefficient (Cv) curve the valve manufacturer supplies for the valve. Thus the steam dump flow input is subject to the accuracy of the valve Cv curve and the setting of the valve positioner. Without a fairly accurate value for the actual steam flow the calculations this type of enthalpy based control system could provide output conditions with excessive superheat or excessive moisture.
With the use of this type of enthalpy based control system the conditions downstream in the steam dump tube are never really known only assumed. This inability to know the actual conditions in the dump tube means that the plant operators never know if the system is operating properly or if there is an upset. Thus these types of systems should have at least a temperature sensor downstream to monitor the conditions and assure proper operation. Which begs the question “Why change from the proven temperature feedback system?” All steam dump control systems regardless of type should monitor the down stream conditions to preclude damage to the condenser.
Regardless of the type of desuperheating control system used, dry steam at start up and low flows is directly related to the ability of the desuperheating condensate control valve to effectively control the flow at the low end of the range. Particular attention to valve trim is critical to allowing proper full range operation and preventing excessive temperature or moisture in the steam dump lines.
Probably the largest single factor to reduce the reliability of condensers with steam dump has been the continual pressure of the plant designers to lower the overall plant height to benefit from the attendant cost reductions. This results in reducing the steam dome height on down exhaust condensers and the volume necessary to dissipate the thermal and kinetic energy to safe levels. Down exhaust condensers are where the majority of problems have occurred. There have also been several technical papers written over the years on the subject of providing the appropriate steam dome height. The Electric Power Research Institute has even promulgated guidelines in this area. Yet economics may overshadow reliability.
The appropriate steam dome height for properly handling the steam dump is combination of the physical number and sizes of steam dump lines, the actual steam dump flows and the placement of the steam dump tubes within the steam dome. Dump tubes must be far enough away from the tubes and condenser internal structures to prevent damage from the sonic core and expansion cone of the steam jets. There must be sufficient distance and volume to prevent localized high velocities and provide time for the condenser desuperheating sprays to reduce the temperature.

Session 1: Design Technology
1-34
For the reasons stated above the location of the steam dump tube within the steam dome is one of the most important factors in providing a reliable design. To assure proper operation the plant designers must rout steam dump piping to the condenser entrance points as requested by the condenser designer with the reliability of the condenser in mind not, as is often the case, for least cost and/or plant design convenience.
In the preliminary plant design stages it is difficult to determine the appropriate steam dome height. The following guideline will allow adequate space for most cases. Figure A depicts a typical down exhaust condenser with two dump tubes in the steam dome.
• To prevent erosion of the side walls no dump tubes should be located closer than 6 feet to the edge of the steam dome. This is depicted as Min. Dist. on Figure 1.
• The height above the top of the tube sheet to the first dump tube horizontal centerline is determined by multiplying the Max. Dist. by .4 and adding 24”. The Max. Dist. is the distance from the dump tube vertical centerline to the farthest condenser side wall. If the dump tube is on the condenser centerline this dimension is one half the shell width. If not on the condenser centerline this dimension is always greater than one half the shell width.
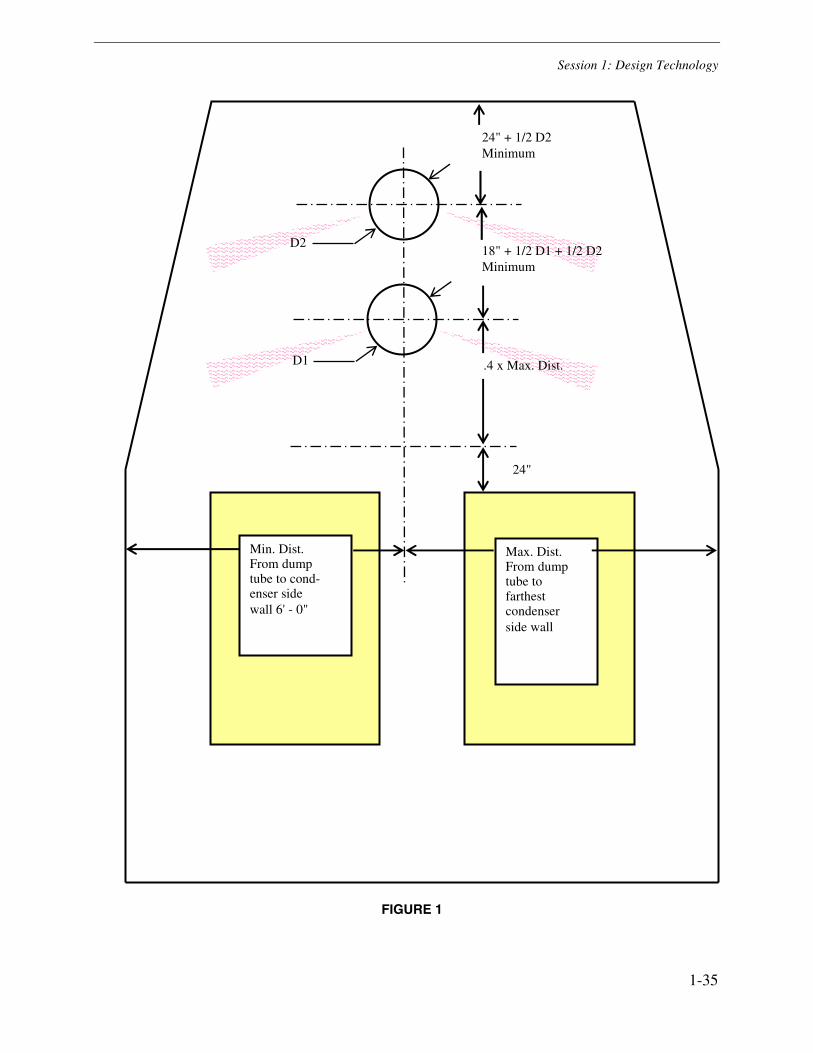
Session 1: Design Technology
1-35
24"
D2
D1
Max. Dist.From dump tube to farthest condenser side wall
Min. Dist. From dump tube to cond- enser side wall 6' - 0"
24" + 1/2 D2Minimum
18" + 1/2 D1 + 1/2 D2 Minimum
.4 x Max. Dist.
FIGURE 1

Session 1: Design Technology
1-36
• If there is more than one dump tube and they are arranged one above the other than the minimum distance between their horizontal centerlines is one half the diameter of each plus 18”.
• If there is more than one dump tube and they are arranged side by side the distance between the vertical centerlines is six(6) feet minimum.
• The distance between the highest dump tube and the top of the steam dome is one half the diameter of the highest dump tube plus 24”.
The same guideline can be used for axial or side exhaust condenser arrangements by turning the diagram 90° and referencing the Min. Dist. and Max. Dist. dimensions to the top and bottom of the steam dome rather than to the condenser side walls.
The above safe practice guidelines are based on perforated dump tubes. Other types of steam dump distribution systems could have different requirements for the necessary steam dome volume to safely distribute the steam dump.
By applying these requirements for combining steam dump and condensers I am hopeful that history will again repeat itself, this time in a positive manner and steam dump problems will again become a part of the past.
References:
1. EPRI “Symposium on State-of-the-Art Condenser Technology”, June 1983 in total and in particular “Space Allotment for Surface Condensers” by Bow, W.J. (Foster Wheeler) included therein.
2. Heat Exchange Institute, Inc. “Standards for Steam Surface Condensers” Ninth Edition, by Heat Exchange Institute 1995.

2-1
2 SESSION 2: MATERIALS TECHNOLOGY
• Thin-Wall Titanium Condenser Tubing: The Next Plateau Dennis J. Schumerth Valtimet, Inc.
• The Performance of Superferritic Stainless Steels in High Chloride Waters John C. Tverberg, P.E., and Edward R. Blessman, P.E. Trent Tube
• A Main Condenser Success Story Jim Mitchell Plastocor, Inc.


Session 2: Materials Technology
2-3
THIN-WALL TITANIUM CONDENSER TUBING THE NEXT PLATEAU
Dennis J. Schumerth Valtimet, Inc.
Tustin, CA
Abstract
Commercially pure (cp.) titanium and its alloys provide excellent resistance to general and localized corrosion attack under most oxidizing, neutral and inhibited reducing conditions in aqueous environments. Titanium is also notable for its outstanding resistance to chlorides and other halides generally present in most process streams. In addition, titanium resists other malicious phenomenon including steam and particle erosion, crevice corrosion, galvanic attack and MIC. Given this general corrosion immunity, designers have increasingly applied thin-wall condenser tubing in pursuit of cost savings and performance enhancement.
Typically, these thin-wall applications have, over the past several years, been limited to 25 BWG or 0.020"/0.5mm walls or heavier. The "industry" has, out of necessity, moved to address the special nuances of the 25 BWG including design, procurement, handling, fabrication and testing parameters with increasing success. It would appear however, that designers, operators and pundits alike require further education and refinement on the specific operational characteristics when integrated into the powerplant environment.
Considerable work has been recently completed investigating even thinner wall titanium tubing. This paper will address the essential data elements of this expanded research focusing specifically on Grade 2 titanium in 27 BWG or 0.016"/0.4mm. Since a significant portfolio of 27 BWG installations is rapidly taking shape, it is prudent to examine key ingredients that would warrant consideration of this "next-plateau" gauge material. Indeed, work is currently underway exploring the technology required to fabricate condenser tubes as thin as 30 BWG /0.013"/0.3 mm.
In summary, the paper will present and summarize substantive evidence suitable for comparison against previously acquired empirical data and prior art.
Background
Previous work, completed during the mid 90's and published in 1999 (1, 2, 6, 7), suggested the properties of thin-wall titanium could provide attractive options to the designer/user in terms of habitat suitability, long-term reliability and performance and economic savings.
Empirical and actual testing was used at that time to compare the prevailing wisdom of heavier wall tubing usage vs. the newly introduced thin-wall.

Session 2: Materials Technology
2-4
Actual testing involving fatigue properties, both from internal pressure and external excitation, demonstrated highly admirable characteristics. Buckling strength or longitudinal compression tests were evaluated employing Euler's equations and found to be well within acceptable limits (1,6). Other key issues including mechanical expansion and resultant pullout strengths were compared against heavier wall tubing. The results suggested a rolled and welded joint should be employed when considering tube walls less than 22 BWG/0.028./0.7mm. This procedure is highly recommended for both solid and clad tubesheets. Support plate spacing was evaluated employing steam-loading calculations applied to design base, bundle out of service and turbine bypass conditions.
Data is now available which can directly compare the previous papers' investigations and findings (l) against more mature, practical and demonstrable findings. In addition, the installation experience at the time of the paper's presentation, which was limited to several installations in Japan and Europe plus a host of desalination units, was considered inadequate.
Pull-out Loads
One of the most important elements of this paper's investigation is a comparison and confirmation of the suitability, or lack thereof, of tube-to-tubesheet loads in a commercially repeatable environment using the 27 BWG tubing. Previous testing, completed in 1999 (Figure 1), confirmed that pullout loads, employing a mechanically expanded joint alone, were not sufficient to support the necessary safety factors required by the designer. However, when tube welding was added to supplement the rolled-only joint, acceptable pullout loads resulted. The tube parameters identified in the below Table 1 were used to develop the Figure 1 results.

Session 2: Materials Technology
2-5
TABLE 1
Tube Material Titanium Gr. 2 B-338
Tubesheet Material Titanium Gr. 2 B-265 Tube Size 1"/25.4mm
Drill-Out Hole 1.1"/28mm Tubesheet Hole Plain - No Serrations
Joint Configuration Mech Exp or Exp & Weld
Additional pullout testing was recently completed which, when evaluated, could be directly compared against results reported in the previous work. In this case, this new testing was completed using the three, expansion/weld processes identified in Table 2 and tube/tubesheet parameters noted in Table 3.
Figure 1
Tube Pull-Out Loads Tests - 1999
0
1000
2000
3000
4000
5000
6000
7000
30 BWG 27 BWG 25 BWG 22 BWG
Pul
l-out
Loa
ds (l
bs.)
Rolled Only Roll & Weld

Session 2: Materials Technology
2-6
TABLE 2
TEST NO PROCESS
1 MECHANICAL EXPANSION 2 MECH EXP + ID GROOVE ASSISTANCE 3 MECH EXP + TIG WLD. (NO ID GROOVE)
TABLE 3
Tube Material Titanium Gr. 2 B-338
Tubesheet Material Titanium Gr. 2 B-265 Tube Size - OD & BWG .866"/22mm x .016'/0.4mm
Drill-Out Hole .875"/22.225mm Tubesheet Hole See Table 2
Joint Configuration See Table 2
Figure 2
Tube Pull-Out Load Test - 2001
6
8
10
12
14
16
18
0 500 1000 1500 2000 2500 3000 3500 4000
Pull-Out Loads (lbs.)
% W
all R
educ
tion
Mech Exp Exp + ID Groove Exp + Weld

Session 2: Materials Technology
2-7
It is clear, upon examination of the new data scatter in Figure 2(3), that pullout loads are comparable to the results demonstrated in the previous 1999 work. This data similarity is not surprising and suggests practical and achievable results in a manufacturing environment.
Tube-to-Tubesheet Expansion
Five-roll, mechanical expansion of the 27 BWG/0.016"/0.4mm thin wall titanium tube should range from 7 to 12% wall reduction. The following classic formula should be used when calculating the per-cent wall reduction.
% Wall Reduction = D - (DE -2T)
2T
where D = Hole Diameter DE = Inner Tube Dia. after Expansion
T = Tube Wall
1. Nominal tube expansion should not exceed the tube OD by 3%.
2. Five (5) roll expanders are recommended where the OD/T ratio is greater than 25 (8).
where OD = Nominal tube OD
T = Wall thickness
Expansion beyond the upper limit may actually reduce pullout loads and potentially, induce tube cracking or incipient failure of the mechanical joint. In fact, historical results employing heavier wall tubing suggest the percent expansion need not be as high as the thin-wall counterparts - less than 10%.
Tubesheet & Support Plates
Particular care must be paid to the fit and finish of the drilled tubesheet plate holes. When considering thin wall titanium, this author suggests tubesheets be drilled to TEMA Close Fit Tolerance. This operation prevents excessive tube-to-tubehole clearance, which may induce undesirable tube deformation during the rolling operation.
ID groove assistance employing multiple serrations or concentric rings clearly enhances pullout strength. Serrations to a depth of 0.004"/.1mm or less are typical. Others prefer ID surface enhancement or controlled roughness (< 50 microns Rz) to achieve the desired results. What is ultimately used to enhance pullout and sealing should be left to the discretion of the designer based on actual testing and results.
Support plates should be drilled to HEI standards and deburred or chamfered on both sides of the plate. Indeed, wire brush operations may not suffice in terms of complete removal of chip material left behind after drill bit exit. This "both sides" operation is strongly suggested to

Session 2: Materials Technology
2-8
eliminate or at least minimize any scratches or "exit wounds" that could be imparted to the tube OD. It is presumptuous to assume that support plate orientation during cage assembly will segregate all one-sided drilled plates in the direction of tube entry. Hoping the tube bullet will break any burr on the un-chamfered side is a bold assumption indeed and could result in unanticipated problems associated with subsequent base line E-C or other post-assembly testing.
Tube-to-Tubesheet Welding
Tube-to-tubesheet welding, employing a TIG process with shielding gas, is strongly recommended when using thin-wall tubing (under 22 BWG/0.028"/0.7mm) and solid titanium tubesheets. It is imperative when employed in a clad or bi-metallic tubesheet arrangement. Be advised that titanium can only be welded to titanium - no other commercially available material is metallurigically compatible.
Increasing the tube protrusion beyond the face of the tubesheet and reduced weld-bead heat input to the tube-tubesheet interface may prove successful in enhancing the nugget configuration and quality. However, these operations may influence weld speed resulting in increased tube-to-tubesheet weld time. Understand the thinner the tube wall, the more the tubesheet will become an ever-larger heat sink. In addition, the more the tube wall is reduced, the higher degree of difficulty in repairing the weld.
Vibration
Operational nuances, not normally encountered with more traditional designs, may come into play more often when evaluating the use of thin wall titanium. These phenomenon are deserving of special consideration by the designers and would include, but not limited to, the following.
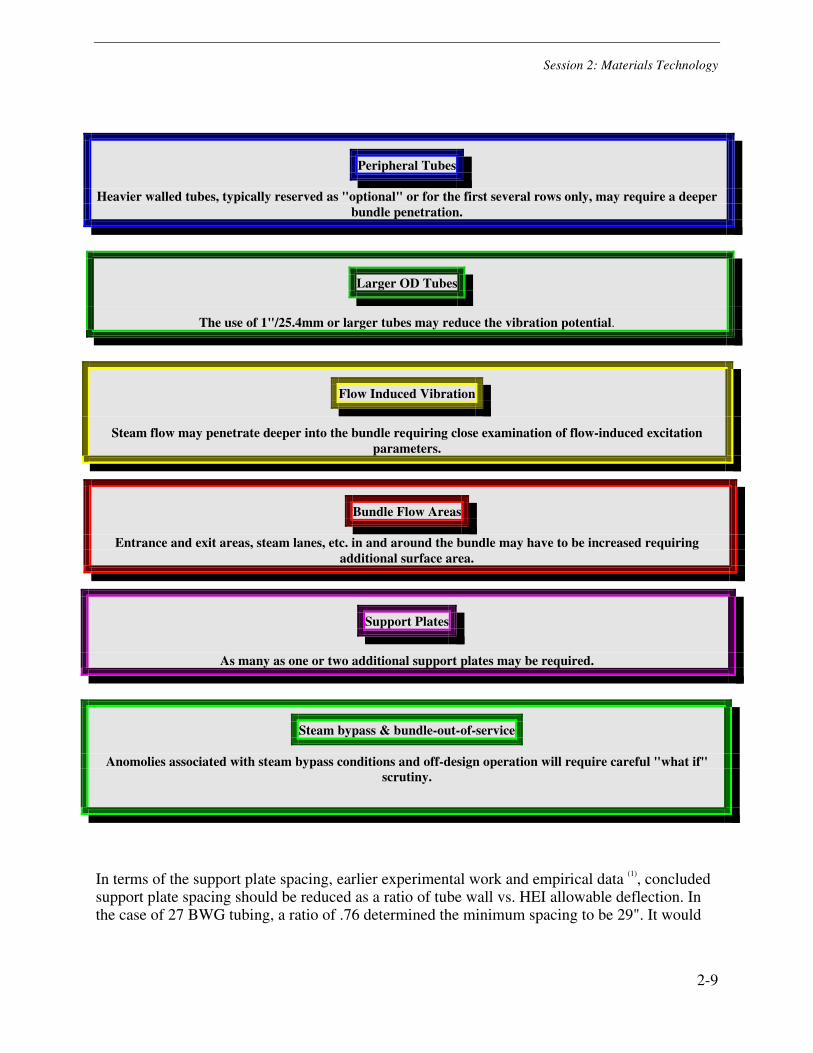
Session 2: Materials Technology
2-9
Peripheral Tubes
Heavier walled tubes, typically reserved as "optional" or for the first several rows only, may require a deeper bundle penetration.
Larger OD Tubes
The use of 1"/25.4mm or larger tubes may reduce the vibration potential.
Flow Induced Vibration
Steam flow may penetrate deeper into the bundle requiring close examination of flow-induced excitation parameters.
Bundle Flow Areas
Entrance and exit areas, steam lanes, etc. in and around the bundle may have to be increased requiring additional surface area.
Support Plates
As many as one or two additional support plates may be required.
Steam bypass & bundle-out-of-service
Anomolies associated with steam bypass conditions and off-design operation will require careful "what if" scrutiny.
In terms of the support plate spacing, earlier experimental work and empirical data (1), concluded support plate spacing should be reduced as a ratio of tube wall vs. HEI allowable deflection. In the case of 27 BWG tubing, a ratio of .76 determined the minimum spacing to be 29". It would

Session 2: Materials Technology
2-10
now appear that support plate spacing for 27 BWG tubing should fall into a range closer to the 24".
Handling and Logistics
To date, there is no evidence that suggests any greater degree of difficulty in handling the 27 BWG tubing vs. the heavier walled cousins. However, it is recommended that tube boxes be placed in close proximity and elevation to the bundle entry area to prevent the possibility of kinking or bending which can result from excessive tube movement. Care must be exercised to prevent any denting during the fabrication process, as this stress riser could eventually become an incipient point of high cycle fatigue failure.
Protection of the exposed tubing in high velocity and peripheral areas of the bundle must also be addressed. Dummy tubes, impingement rods and other measures must offer complete protection for the tubing from mechanical impact damage.
Tube Manufacturing
Tubing produced by the supply mills to the standards of ASTM B-338 must adhere to the highest levels of quality but result in acceptable levels of mill productivity and yield. All this must take place before the condenser fabricators are convinced that the material is suitable for use in a surface condenser. Grade 2, 27 BWG titanium tubing has been successfully produced for a number of years. Yet in terms of productivity, yields have been less than desirable. However, over the past several years, full production runs of the strip material supplied from numerous sources have proved highly successful setting the standard for commercial use.
Figure 3
Session 2: Materials Technology
2-11
Of particular significance are the low E-C (Electromagnetic or more commonly, Eddy Current Testing) & UT (Ultrasonic Testing) rejection rates for the final product. Coupled with precise control of the diameter, nugget geometry and weld-undercut discipline, users can be assured that the product will perform in a manner meeting the requirements of ASTM B-338-01a.
Cleaning
In support of actual, in-service conditions, where fouling will most certainly take place, Conco Systems of Verona Pennsylvania performed tests on sample titanium tubes manufactured to ASTM B-338 Gr. 2.
Three tests were performed on the sample material (0.9450"/24mm outside diameter (OD) x 27 BWG/0.016"AVW/0.4 mm wall thickness).
• Visual Inspection
• E-C Examination
• Hydrostatic Test
The tests were conducted using various Conco tube cleaning tools including type(s) C3S, C4S and C3X.
A visual inspection was performed comparing an as-received sample section vs. a sample section that had various tube cleaning tools "shot" or driven through. Each section was examined after the test and compared against each other. No noticeable visual or dimensional differences were discernable up to a 10X magnification.
An as-received sample was again examined using a Zetec MIZ-27 Analyzer. Only minor drift signal anomalies were recorded probably associated with the tube weld. The signals were considered insignificant. The same sample was again "shot" with the three (3) tube cleaning tools identified above. The results noted no rejectable or signals of consequence. In fact, the signals first recorded during the parent-tube test, actually reduced in magnitude after the samples were cleaned.
Finally, a third sample was hydrostatically tested to a pressure of 2100 PSI. No failures occurred noting only expected minor plastic OD deformation in the range of 0.015". In point of fact, surface condenser tubes would never experience such high pressure. Even the use of individual tube hydro testing, which operates in the range of 645 PSI, (ASME UG-27 max working pressure calculation), falls well below either the 2100 PSI or a burst pressure of a 27 BWG titanium tube (.016"/0.4mm) calculated at 3191 PSI/220 Bars.
Condenser tube fouling is real and a fact of life within an operating powerplant surface condenser. It is apparent, after reviewing the test conditions and results, that this proven type of cleaning system has no effect on the mechanical properties of the tube. If this axiom is true for scraper cleaning systems, other, more benign cleaning methods including sponge balls, brushes, water lances, etc. can be utilized with little or no apprehension.

Session 2: Materials Technology
2-12
Other Considerations
An HEI Ninth Edition Supplement, soon to be released, will address, among other issues, new criteria to be applied for steam bypass conditions. Clearly, additional work is needed by this august group beyond even this Supplement to address issues specific to combined cycle applications. Notable and unfortunate as of this writing is the absence of any HEI Standards information relating to metal resistance and/or correction factors for tubing less than 25 BWG. Designers must therefore, address the heat transfer characteristics of 27 BWG tubing independently. The thermal conductivity of titanium is readily available (8) (150 BTU/hr ft² - F/in) and the metal resistance can be easily developed from existing data in Figure 4.(8) should alternate rating methods be employed. Designers will find that reducing wall thickness improves the heat transfer characteristics of titanium when compared to other materials.
Reducing the wall thickness of the tubing reduces the weight of the tubing. It is noteworthy that the weight of a 27 BWG titanium tube ranges between 55 & 60% (depending on diameter) when compared to its 22 BWG counterpart.
These weight reductions and resultant uplift considerations require a more robust analysis of the foundation loads, bolting, expansion joints and other condenser components that would be impacted by the weight reduction. In addition, larger flow areas associated with thinner walled tubes can influence circulating water flow and pump NPSH considerations.
Certain conditions may preclude the complete removal of existing condenser tubes or, plant logistics make removal commercially impractical. In addition, a straight retube may prove more costly, present dissimilar material constraints and modules do not provide the required payback.
Sleeving existing condenser tubes with ultra thin wall titanium is currently under test and consideration. The thin wall is hydraulically expanded full length into the parent tube with the tube ends mechanically anchored in each tubesheet. Should additional embellishment be considered beyond just the sleeve replacement, a multi-part epoxy coating can be applied to add corrosion resistance while enhancing the tube pullout load characteristics.
Installation History
The Japanese Titanium Society reported in earlier work, (3,6,7) successful installations of 27 BWG Gr. 2 titanium in both desalination and powerplant applications. These installations have been in service for over 15 years with no documented problems. Table 4 identifies more recent vintage installations primarily in France and in the UK.
It is noteworthy however, that condenser manufactures in the US are now evaluating the use of this gauge material

Session 2: Materials Technology
2-13
TABLE 4 27 BWG/.016"/0.4mm INSTALLATION LIST (Partial)
YEAR OD KM DESTINATION
1981 17 5 FRANCE
1999
1999
1999
1999
2001
2001
2001
2001
2002
12.7
16
22
24
20
24
21
24
21
6
12
926
253
7
144
288
294
137
FRANCE
FRANCE
SPAIN
GB
FRANCE
MALAYSIA
VIETNAM
GB
PORTUGAL
Conclusion
Given continuing, industry-wide pressure to reduce costs, improve performance and significantly contribute to improved online availability and capability, a transition to less costly, high performance materials is inevitable. In the case of surface condensers employing 27 BWG or 0.016"/0.4mm tubes, the opportunity exists to examine, evaluate and realize the potential merits of reduced or thin wall tubing.
Notable in the work just presented, and a key element in this paper's investigation, is a clear confirmation of acceptable pull out loads. Welded-only tube joints, and/or welded joints employing I.D. enhancement, clearly demonstrate the repeatable practicality of achieving an acceptable tube joint within a shop manufacturing environment.
Mechanical expansion techniques, tubesheet and support plate fit & finish, tube-to-tubesheet welding and other processes appear to be successfully practiced in today's environment. They are clearly, not future technical folly but proven technology that exists today.
Efforts to address the nuances of combined cycle steam exhaust and bypass conditions will require additional work by professional societies and the manufacturers alike. Current techniques are frankly, not adequate to predict certain dangerous operating conditions.
Tube mill production runs of strip material supplied from numerous sources have produced successful yield and production goals setting the quality standard for commercial use. Handling, at both the supplier and fabricator levels, does not appear to present logistical issues nor invoke any specialized or precautionary steps.
An analysis of cleaning techniques has confirmed the future suitability of both the tube and the cleaning systems.

Session 2: Materials Technology
2-14
Recall the object of this paper, which was to evaluate additional, recently acquired data to compare, validate and expand on prior work. This author believes that practical confirmation of this work has indeed, been documented and achieved. Confirming the validity of prior art while expanding directly into newly developed technology and practical issues provides merit for future examination of thin wall titanium condenser tubing.
TUBE
O.D
IN/mm
BWG
WALL
THICKNESS
IN/mm
FACTOR
(FM)
Metal
Factor
(RM)
1/25.4
1/25.4
1/25.4
1/25.4
0.875/22.225
0.875/22.225
0.875/22.225
0.875/22.225
0.75/19.05
0.75/19.05
0.75/19.05
0.75/19.05
25
26
27
30
25
26
27
30
25
26
27
30
0.020/0.508
0.0180.457
0.016/0.406
0.013/0.330
0.020/0.508
0.018/0.457
0.016/0.406
0.013/0.330
0.020/0.508
0.018/0.457
0.016/0.406
0.013/0.330
0.95
0.96
0.97
0.99
0.95
0.96
0.97
0.99
0.95
0.96
0.97
0.99
1.3607
1.2222
1.0853
0.9867
1.3576
1.2232
1.0878
0.8787
1.3702
1.2293
1.0908
0.881
Notes: • Supplement to TIMET Tube Book Table 9 Metal Correction Factor (Fm) • Based on 0.875" O.D. @ 7 ft/sec C@ 700 F • Material = Gr. 2 Titanium • RM (Metal Resistance ) = 1 x 10 -4
BTU/hr ft2 0 F • FM (Factor) Titanium Gauge Correction Factor
DMc 3/31/00
Figure 4 TITANIUM METAL RESISTANCE METAL CORRECTION FACTORS SUPPLEMENT TO TIMET TUBE BOOK TABLE 10 - 1996 REV

Session 2: Materials Technology
2-15
References
1. Schumerth, - "Thin-Wall Titanium Condenser Tubing Explore the Opportunities." PWR - IJPGC ASME 2000
2. Schumerth, McCue - "Titanium Surface Condensers & Heat Exchangers - A Practical Guide and Application." PWR-Vol 33 IJPGC Volume 2 ASME 1998
3. HEI - Heat Exchange Institute
4. HEI Standards - Ninth Edition
5. ASME Boiler & Pressure Vessel Code Section UG-27
6. Japan Titanium Society - 1984 - Multiple Authors - et al. "Get More Advantages By Applying Titanium Tubing Not Only For Power Plants But Also For Desalination Plants."
7. Japan Titanium Society - Multiple Authors - et al. Thinner Wall Welded Titanium Tubes For Seawater Desalination Plant.
8. CONCO Systems - January, 2002 - Thin Wall Titanium Tube Testing
9. TIMET Codeweld ® Tube Book - 1984 (plus subsequent revisions)


Session 2: Materials Technology
2-17
The Performance of Superferritic Stainless Steels in High Chloride Waters
John C. Tverberg, P.E. and
Edward R. Blessman, P.E.
Trent Tube East Troy, Wisconsin
Abstract
Superferritic stainless steels were developed 25 years ago as a low cost alternative to titanium and the high molybdenum austenitic nickel alloys for use in brackish and seawater. These alloys have a ferritic structure with very high chromium and molybdenum content. The result is a material with better corrosion resistance than the austenitic or duplex stainless steels, and approximately the same as unalloyed titanium, thus they are applicable in almost all water conditions. Their modulus of elasticity is the highest for the common engineering alloys. As a result these alloys have seen wide scale use in condenser applications where vibration is a problem and limited use in feedwater heaters and balance of plant heat exchangers. They have better thermal conductivity than the superaustenitic and duplex stainless steels and only slightly less than titanium. Their high hardness provides excellent sand and inlet end erosion resistance.
Introduction
Superferritic stainless steels are a rather recent development. For years engineers have had interest in ferritic stainless steels because of their advantages over competing materials. Ferritic stainless steels have excellent resistance to chloride pitting and crevice corrosion, they are resistant to chloride stress corrosion cracking and they have excellent resistance to organic acids and caustic environments. But they had one major problem: the normal carbon and nitrogen caused low ductility and reduced toughness. It wasn’t until the mid sixties that several new technology developments allowed the production of stainless steel with low interstitial carbon and nitrogen. These were electron beam melting (EBM), electroslag remelting (ESR), argon-oxygen-decarburization (AOD) and vacuum-oxygen-decarburization (VOD).
Superferritics were developed in three phases. The first phase used high purity melting techniques, vacuum induction furnaces and electron beam melting. The second phase involved adding nickel to the alloys to improve the manufacturability; and the third phase used stabilizing elements titanium and niobium (columbium) together with AOD refining to allow commercial production.
The first superferritic, E-Brite 26-1, was introduced in 1970 by C. D. Schwartz, I. A. Franson and R. J. Hodges of Allied Vacuum Metals1. It is based on the composition of Type 446 ferritic stainless steel which contains 23 – 27% Cr. E-Brite 26-1 has an interstitial C+N content of ≤ 200 ppm attained only by a combination of vacuum induction melting followed by EBM or ESR.

Session 2: Materials Technology
2-18
This results in an improvement in the ductile to brittle transition from +120° C (250° F), for Type 446 stainless to -60° C (-80° F) for E-Brite 26-1. This alloy possesses outstanding corrosion resistance, especially to chlorides and strong caustic environments.
The success of E-Brite 26-1 prompted the development of a number of other alloys. The first was 29Cr-4Mo by M. A. Streicher2 at duPont who filed for patent several months after E-Brite 26-1 was introduced. In 1974 Climax Molybdenum introduced 18-23 and several months later Deutsche Edelstahlwerke introduced 28Cr-2Mo. Despite the outstanding performance of these alloys in chloride environments, they were not commercially practical because of the need for double vacuum processing.
Work was undertaken at a number of steel mills to stabilize the alloys with titanium and/or niobium and to use AOD refining to obtain the low carbon levels. R. Oppenheim and J. Lennartz4 of Deutsche Edelstahlwerke are thought to be the first with 28Cr-2Mo in 1974. In the meantime Streicher developed 29Cr-4Mo-2Ni which was still produced by vacuum melting. This alloy led to the development of Monit® , 26Cr-4Mo-4Ni, by Nyby-Uddeholm5 in Sweden, SEA-CURE® Stainless, 27-4-2, by K. E. Pinnow6 of Crucible Research in the United States and 29-4C by Allegheny Ludlum also in the United States. These alloys will be designated by their UNS Numbers hereafter in this paper. Refer to Table I for the cross reference to the common Trademarked names.
The Superferritics were introduced to the power market in 1979 for use in main steam condensers. The first Superaustenitic condenser tubes, AL-6X, were installed in 1975 and the first Superferritic condenser installation, 29-4C, was in 1974. Since then nearly 60,000,000 feet of Superferritic condenser tubing has been installed. Figure 1 illustrates the cumulative quantities of both superaustenitic and superferritic stainless steels that have been installed. Last year the superferritic stainless steels surpassed the total installed footage of superaustenitic stainless steel. Since 1998 82% of all high performance stainless steel tubing installations have been superferritic, and the majority of that is UNS S44660.
This surge in condenser usage is a result of a combination of outstanding chloride induced corrosion resistance, excellent sand erosion resistance and droplet impingement resistance, excellent heat transfer properties, outstanding mechanical properties in conjunction with over 20 years of successful operation history, ready availability and attractive pricing.
Composition and Metallurgy
Superferritic stainless steels are characterized by high chromium, high molybdenum and are stabilized with titanium and/or niobium. Compositions of the most common superferritics are given in Table II.
The addition of nickel is an important development. Nickel lowers the ductile-brittle transition (DBT) temperature so the alloy is ductile over a wider temperature range. Nickel additions together with low interstitial carbon and nitrogen allow the DBT to be reduced to -120° F (-84° C) for UNS S44660. Nickel also improves the corrosion resistance to reducing acids.
Session 2: Materials Technology
2-19
If the carbon and nitrogen are high in the iron-chromium alloys, then formation of an austenite loop in the high chromium alloys may form. This means martensite forms during cooling from heat treating temperatures. Martensite is hard, brittle and has limited ductility. By keeping the C+N ≤ 0.06% martensite formation can be prevented and the alloys retain a single phase ferritic structure. The grains are uniform and equiaxed with no grain boundary precipitates.
Chloride Corrosion Resistance
Stainless steels derive their corrosion resistance from a very thin, in the range of 10 to 30 atoms thick, surface passive layer consisting of Cr2O3 and Fe2O3 in which the chromium to iron ratio is greater than 1.0. As long as this passive layer remains intact stainless steel is resistant to corrosion attack. Chloride ion is the major corrodant of stainless steel. Pitting and crevice corrosion are the two most common corrosion mechanisms involving chloride ion, followed by chloride stress corrosion cracking in the low nickel austenitic stainless steels. Low pH makes this corrosion attack worse. For power station condenser applications, chlorides are the most common corrodant.
Monnartz7 discovered the synergistic effect between molybdenum and chromium in extending the corrosion resistance of stainless steel to acid chlorides. The superferritic alloys require more chromium and less molybdenum to accomplish this as compared to the superaustenitic stainless steels. The most common method of testing the stainless steels is the use of ASTM G 48, which uses ferric chloride and usually at pH less than one. The crevice corrosion test, Practice D, is the more aggressive, especially at temperatures over 40° C (100° F). Since crevice corrosion is temperature dependent, a convenient way to rank alloys is the critical crevice corrosion temperature (CCCT), the temperature above which crevice corrosion takes place.
A convenient method of estimating relative corrosion resistance is to use the pitting resistance equivalent number (PREN) developed by Rockel8 and defined as
PREN = %Cr + 3.3(%Mo) + 16(%N).
Kovach and Redmond9 combined the PREN with the CCCT and created a chart which allows a comparison of the relative resistance of any composition of stainless steel to the temperature at which crevice corrosion starts. Figure 2 is a modification of the original chart.
A ranking of the relative chloride resistance of selected stainless steels is presented in Table III. In this table the alloys will be resistant to crevice corrosion at temperatures and chloride contents below those stated. This table indicates that a superferritic with essentially the same PREN will have a critical crevice corrosion temperature higher than an equivalent superaustenitic stainless steel.
Pitting corrosion is not as severe as crevice corrosion and the critical pitting temperature is not as clearly defined. In most cases starts approximately 40° C (100° F) above the critical crevice corrosion temperature. Figure 3 illustrates the effect of pH, chloride content and alloy composition on the pitting resistance of austenitic stainless steels with various molybdenum contents. The superferritic stainless steels are included on this chart, but will lie between the 6% and 9% Mo lines.

Session 2: Materials Technology
2-20
The other problem with stainless steel and chloride service is stress corrosion cracking. Again, there is a threshold temperature, below which the alloy will not crack, above which it will. In general, this threshold temperature increases with molybdenum content. For S30403 stainless steel the threshold temperature is at room temperature, 20° C (70° F), S31603 stainless 50° C (125° F), N08367 225° C (450° F), and S44660 225° + C (450° +F).
Microbiologically Induced Corrosion (MIC)
Superferritic stainless steels are resistant to MIC caused by sulfuric and sulfurous producing bacteria. This is critical in some condenser locations. Of particular interest, especially to power stations along the Ohio, Tennessee and southern Mississippi Rivers, is the resistance to permanganate in the presence of chloride. This combination of chemicals is generated when condensers containing colonies of manganese fixing bacteria, usually gallionella, are present and the system is chlorinated to destroy the colonies. The chlorine or hypochlorous acid reacts with the manganese dioxide deposits, the metabolic by-product from the bacteria, to produce hydrochloric acid. A more complete dissertation on this reaction is given elsewhere10. The superferritic stainless steels are resistant to the action of the hydrochloric acid.
Erosion and Steam Impingement Resistance
Both the superferritic and superaustenitic stainless steels have outstanding resistance to steam side droplet impingement, cavitation, turbulence and high velocity flow. These alloys resist both mechanical damage and the tendency for flow to accelerate corrosion. Their high mechanical strength is the major factor in resisting mechanical damage due to flow. The durability of these alloys is further enhanced by their ability to be significantly work hardened. Under the local strain of impingement or flow the surface of these already strong materials will work harden to even higher levels. Resistance to flow accelerated corrosion is largely determined by the nature of the passive layer on the surface of the material. Alloys such as these high performance stainless steels form thin hard passive films. This results in excellent resistance to accelerated corrosion due to flow in these alloys. Table IV compares the different classes of alloys for these parameters.
Mechanical and Physical Properties
Superferritic stainless steels are characterized by high strength, the highest modulus of elasticity of any common heat exchanger material, good elongation, high hardness, good thermal conductivity and excellent fatigue endurance. The coefficient of thermal expansion is close to that of carbon steel, so the expansion and contraction of the tubes in the condenser will be nearly the same as the carbon steel shell, resulting in minimal deflection of the tube sheets. A comparison of the different alloy types is presented in Table V. The comfortable spread between the yield strength and ultimate tensile strength combined with high ductility makes these alloys very easy to work. The high strength not only imparts resistance to damage during operation, but also reduces the risk of installation related damage.
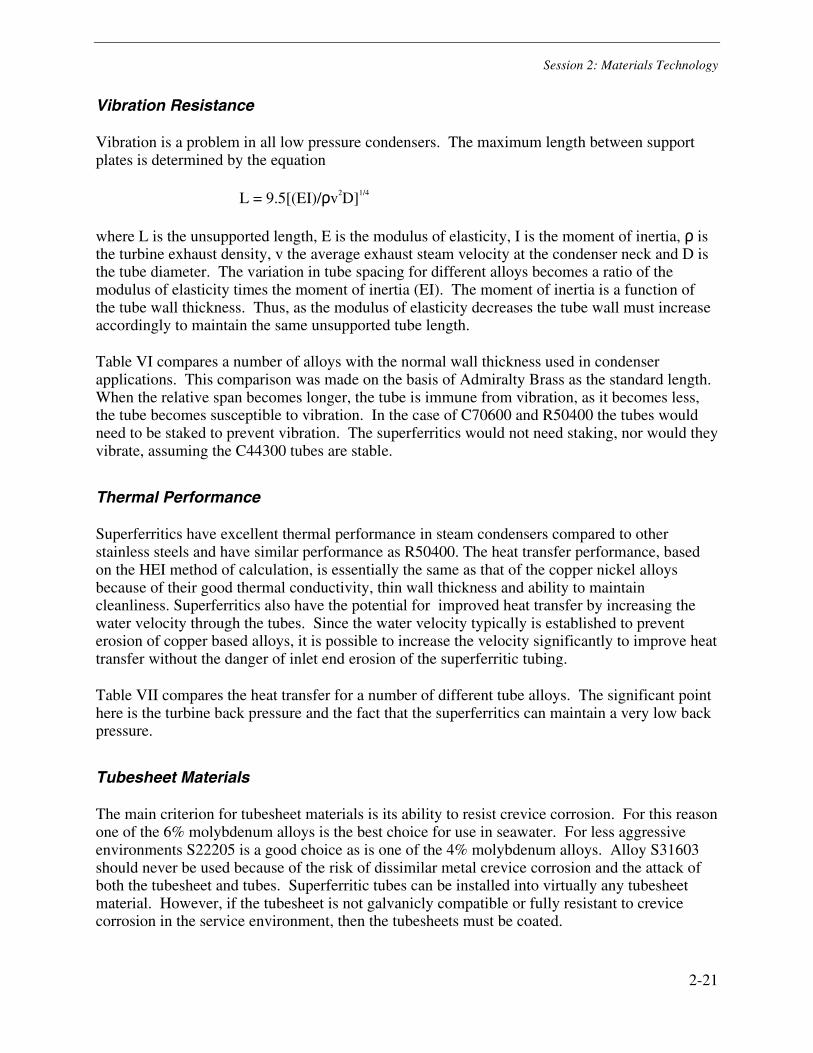
Session 2: Materials Technology
2-21
Vibration Resistance
Vibration is a problem in all low pressure condensers. The maximum length between support plates is determined by the equation
L = 9.5[(EI)/ρv2D]1/4
where L is the unsupported length, E is the modulus of elasticity, I is the moment of inertia, ρ is the turbine exhaust density, v the average exhaust steam velocity at the condenser neck and D is the tube diameter. The variation in tube spacing for different alloys becomes a ratio of the modulus of elasticity times the moment of inertia (EI). The moment of inertia is a function of the tube wall thickness. Thus, as the modulus of elasticity decreases the tube wall must increase accordingly to maintain the same unsupported tube length.
Table VI compares a number of alloys with the normal wall thickness used in condenser applications. This comparison was made on the basis of Admiralty Brass as the standard length. When the relative span becomes longer, the tube is immune from vibration, as it becomes less, the tube becomes susceptible to vibration. In the case of C70600 and R50400 the tubes would need to be staked to prevent vibration. The superferritics would not need staking, nor would they vibrate, assuming the C44300 tubes are stable.
Thermal Performance
Superferritics have excellent thermal performance in steam condensers compared to other stainless steels and have similar performance as R50400. The heat transfer performance, based on the HEI method of calculation, is essentially the same as that of the copper nickel alloys because of their good thermal conductivity, thin wall thickness and ability to maintain cleanliness. Superferritics also have the potential for improved heat transfer by increasing the water velocity through the tubes. Since the water velocity typically is established to prevent erosion of copper based alloys, it is possible to increase the velocity significantly to improve heat transfer without the danger of inlet end erosion of the superferritic tubing.
Table VII compares the heat transfer for a number of different tube alloys. The significant point here is the turbine back pressure and the fact that the superferritics can maintain a very low back pressure.
Tubesheet Materials
The main criterion for tubesheet materials is its ability to resist crevice corrosion. For this reason one of the 6% molybdenum alloys is the best choice for use in seawater. For less aggressive environments S22205 is a good choice as is one of the 4% molybdenum alloys. Alloy S31603 should never be used because of the risk of dissimilar metal crevice corrosion and the attack of both the tubesheet and tubes. Superferritic tubes can be installed into virtually any tubesheet material. However, if the tubesheet is not galvanicly compatible or fully resistant to crevice corrosion in the service environment, then the tubesheets must be coated.

Session 2: Materials Technology
2-22
Eddy Current Testing
Superferritic stainless steels can be eddy current tested in the condenser, however they require full magnetic saturation. Therefore testing must incorporate an electromagnet or a permanent magnet. In theory this material should be able to be tested using Flux Leakage methods. So far no one has been able to demonstrate that they can achieve the necessary sensitivity with Flux Leakage. Many testing service providers have successfully eddy current tested these alloys. However, because of the added difficulties in testing and interpretation it is suggested that testing vendors be required to demonstrate their proficiency.
Alloy Limitations
Superferritic stainless steels have these limitations:
1. They are sensitive to hydrogen embrittlement. If the condenser is operated with a cathodic protection system, the voltage must never exceed 0.80 volts. If embrittlement does occur, the reaction is easily reversible by heating to 100° F (40°C) or allowing the tubes to sit in air for 24 hours.
2. They are sensitive to 885° F (475° C) embrittlement. This starts at about 600° F (315° C) and is cumulative. However, they can be operated at 550° F (300° C) indefinitely without danger of embrittlement.
3. Superferritic stainless steels are subject to embrittlement if they are operated at temperatures below -40° F (-40° C). This better not be a problem with a steam condenser.
Summary
Superferritic stainless steels are rather new, lower cost addition to the heat transfer engineering world, but in their brief service time they have made a definite impact. Their excellent corrosion resistance, especially with respect to acid chlorides and MIC attack, have made them attractive alternatives for steam condenser service. The modulus of elasticity, the highest of all common engineering alloys, provides excellent vibration resistance. Their thermal expansion coefficient is close to that of carbon steel so bending stress on the tubesheet is minimized. Most important, their good thermal conductivity and ability to maintain cleanliness means they can maintain a low turbine back pressure.
References
1. C.D.Schwartz, I.A.Franson, R.J.Hodges, Chemical Engineering, 77, April 20, 1970, Pages 164-167
2. M.A.Streicher, Corrosion, 30, (3), 1974, 77-91
3. M.Semchyshen, A.P.Bond & H.J.Dundas, Toward Improved Ductility and Toughness, symposium sponsored by Climax Molybdenum, Kyoto, Japan, Oct. 25-26, 1971, 239-255

Session 2: Materials Technology
2-23
4. R. Oppenheim, G. Lennartz, H.Laddach, TEW-Techn. Ber., 2 (1), 1976, 3-13
5. N. Pessall & J.I. Nurminen, Development of Ferritic Stainless Steels for Use in Desalination Plants, Corrosion, 30, (11), 1974, 381
6. K.E. Pinnow, Progress in the Development of High Chromium Ferritic Stainless Steels Produced by AOD Refining, Stainless Steel 77, London, England, September 1977
7. P. Monnartz, Metallurgia, 8, 1911, 161-176 and 193 - 201
8. M. Rockel, Use of Highly Alloyed Stainless Steels and Nickel Alloys in The Chemical Industry, ACHEMA Conf., Frankfurt, Germany, 1978
9. C.W.Kovach and J.D. Redmond, Corrrelations Between The Critical Device Temperature, PRE-Number, and Long Term Crevice Corrosion Data for Stainless Steels, Corrosion 95, Nat. Assoc. of Corrosion Engineers, Paper 267
10. John Tverberg, Kenneth Pinnow and Lawrence Redmerski, The Role of Manganese Fixing Bacteria on the Corrosion of Stainless Steel, Paper 151, National Association of Corrosion Engineers, Corrosion 90, April 23-27, 1990
Table 1 Superferritic Stainless Steels by Name and UNS Number
Common Alloy Name UNS Number Type 446 Stainless S44600
E-Brite 26-1 S44627 18-2 Stainless S44400
29-4 S44700 29-4-2 S44800 Monit S44635
AL 29-4C S44735 SEA-CURE Stainless S44660
Table 2 ASTM Chemical Composition of Superferritic Alloys
UNS Number
C Cr Mo Ni Max
Si Max
N Max
Ti/Nb Max
S44600 0.012 23.0-30.0 -- -- 0.75 0.10-0.25 -- S44627 0.010 25-27.5 0.75-1.50 0.5 0.40 0.015 0.05-0.20 Nb S44400 0.025 17.5-19.5 1.75-2.50 1.00 1.00 0.035 0.80 S44700 0.010 28.0-30.0 3.5-4.2 0.15 0.20 0.020 -- S44800 0.010 28.0-30.0 3.5-4.2 2.0-2.5 0.20 0.020 -- S44635 0.025 24.5-26.0 3.5-4.5 3.5-4.5 0.75 0.035 0.80 S44735 0.030 28.0-30.0 3.60-4.20 1.00 1.00 0.045 1.00 S44660 0.030 25.0-28.0 3.0-4.0 1.0-3.50 1.00 0.040 1.00

Session 2: Materials Technology
2-24
Table 3 Maximum Chloride Resistance at Temperature for Various Stainless Steels
Alloy UNS Number PREN CCCT Max Chloride Type 439 S43035 18 < -2° C (28° F) 100
Type 304L S30403 19 < -2° C (28° F) 100 Type 316L S31603 24 < -2° C (28° F) 500 Type 317L S31703 28 2° C (36° F) 1000
Type 317LM S31725 32 16° C (61° F) 2500 Type 317LMN S31726 33 20° C (68° F) 5000
Type 2205 S32205 34 24° C (75° F) 7500 AL-6XN® N08367 45 45°C (113° F) 18000
SEA-CURE® S44660 46 52° C (125° F) 20000+
Table 4 Relative Resistance to Flow, Erosion and Impingement
Alloy Type Max. Flow in Sea Water, ft/sec
Cavitation and Turbulence
Steam Side Droplet Impingement
Copper Alloys 7 Poor Poor
Copper-Nickel 11 Marginal Marginal 300 Series Stainless >125 Good Good
Superferritics >150 Very Good Very Good Titanium 120 Good Acceptable
Table 5 Comparative Properties of Alloys in Sea Water
Property 90-10 Cu-Ni C70600
70-30 Cu-Ni C71500
AL-6XN® N08367
SEA-CURE® S44660
Ti Grade 2 R50400
Ult. St. ksi 40 52 100 85 50
Yld. St. , ksi 15 18 45 65 40 Elong. % 25 30 20 20 Hard. HB 20 22 100 104 92
Mod. Of Elas. Psi 18.0x10⁶ 22.0x10⁶ 28.2x10⁶ 31.5x10⁶ 14.9x10⁶ Density,lb/ci 0.32 0.323 0.29 0.278 0.16 Thermal Exp. 9.5 8.2 8.7 5.38 5.20
Thermal Cond. 26 17 7.5 10.3 12.5 Fatigue Strength, ksi 20 25 33 35 16
Corrosion in Still Seawater @ 65° mpy
2.1 0.67 <0.001 <0.001 <0.001
Max Flow in Seawater fps
8 10 >150 >125 120
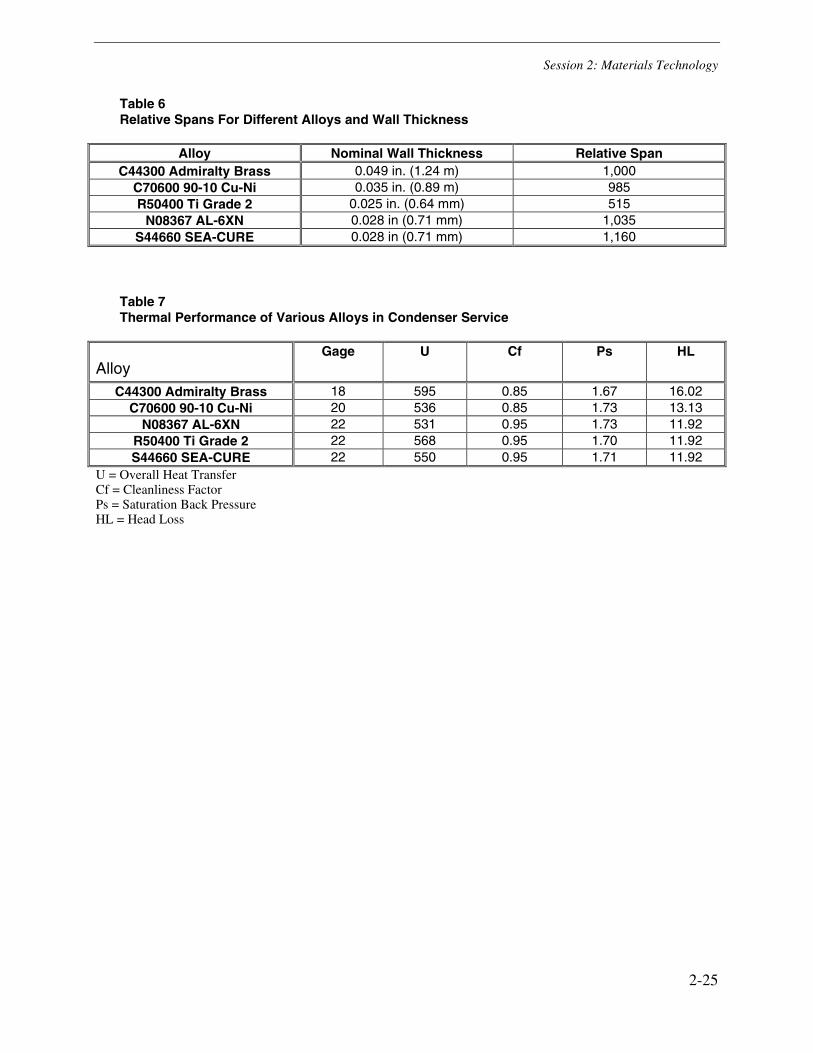
Session 2: Materials Technology
2-25
Table 6 Relative Spans For Different Alloys and Wall Thickness
Alloy Nominal Wall Thickness Relative Span C44300 Admiralty Brass 0.049 in. (1.24 m) 1,000
C70600 90-10 Cu-Ni 0.035 in. (0.89 m) 985 R50400 Ti Grade 2 0.025 in. (0.64 mm) 515
N08367 AL-6XN 0.028 in (0.71 mm) 1,035 S44660 SEA-CURE 0.028 in (0.71 mm) 1,160
Table 7 Thermal Performance of Various Alloys in Condenser Service
Alloy Gage U Cf Ps HL
C44300 Admiralty Brass 18 595 0.85 1.67 16.02 C70600 90-10 Cu-Ni 20 536 0.85 1.73 13.13
N08367 AL-6XN 22 531 0.95 1.73 11.92 R50400 Ti Grade 2 22 568 0.95 1.70 11.92 S44660 SEA-CURE 22 550 0.95 1.71 11.92
U = Overall Heat Transfer Cf = Cleanliness Factor Ps = Saturation Back Pressure HL = Head Loss

Session 2: Materials Technology
2-26
Figure 1 Installation History of High Performance Stainless Steel Condenser Tubing
0
20,000,000
40,000,000
60,000,000
80,000,000
100,000,000
120,000,000
1972 1976 1980 1984 1988 1992 1996 2000
Cum
ulat
ive
Foot
age
SuperFerritic SuperAustenitic Total

Session 2: Materials Technology
2-27
Figure 2 Critical Crevice Corrosion Temperature as a Function of PRE-Number showing the variation according to alloy classification
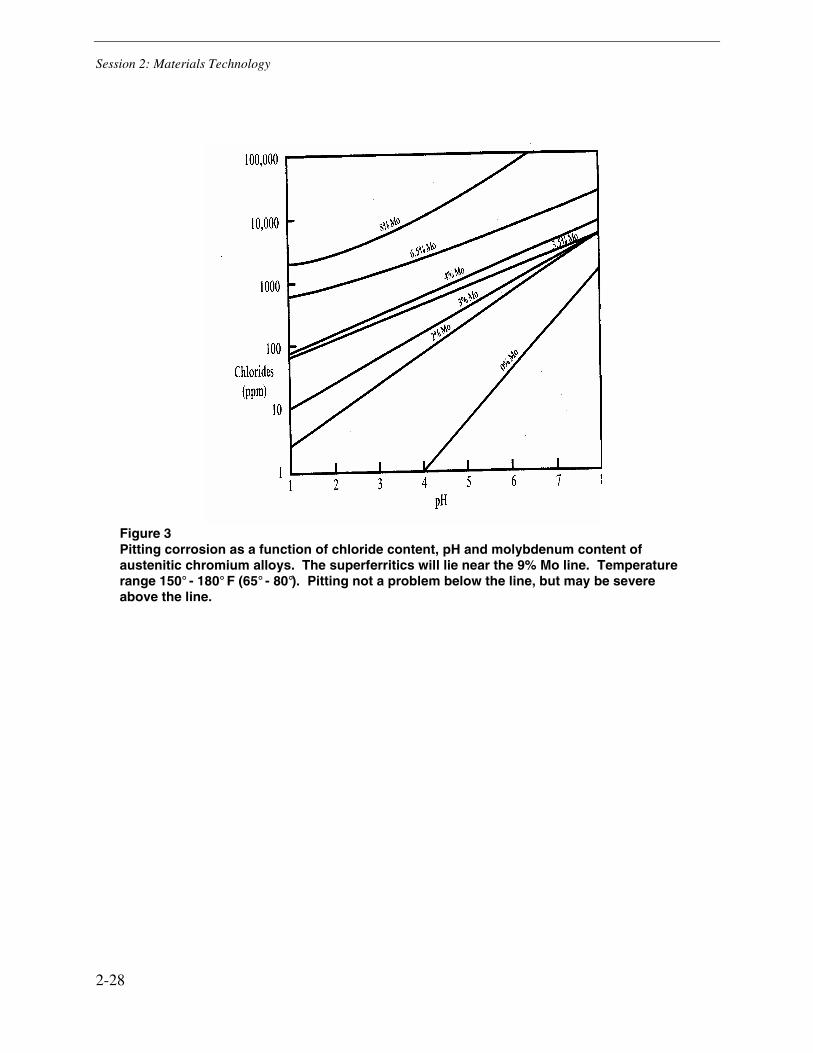
Session 2: Materials Technology
2-28
Figure 3 Pitting corrosion as a function of chloride content, pH and molybdenum content of austenitic chromium alloys. The superferritics will lie near the 9% Mo line. Temperature range 150° - 180° F (65° - 80°). Pitting not a problem below the line, but may be severe above the line.

Session 2: Materials Technology
2-29
A MAIN CONDENSER SUCCESS STORY
Jim Mitchell, Plastocor, Inc. Bernard Sloan, Dominion Virginia Power
Surry Power Station is a two-unit, three-loop pressurized Westinghouse reactor located on the James River in southeast Virginia. Both 850 Mw units are owned and operated by Dominion Virginia Power.
The station has implemented an extensive Secondary Plant Piping Replacement Program due to flow-accelerated corrosion (FAC). Along with the pipe replacement program came a request from Dominion Upper Management to resolve FAC issues.
The objectives of the replacement program include:
• Increase plant personnel safety
• Reduce material costs associated with replacement piping
• Reduce manpower costs projected over the next five years to complete the piping replacement.
FAC was also affecting the station’s secondary side chemistry values for iron transport. Iron removed from the secondary plant piping typically ended up in the steam generators. The plant was well aware that the iron values were well in excess of industry median values of 3.3 ppb. Once the iron reaches the steam generators, it has to be removed via sludge lancing to prevent crevice corrosion in the tube-to-tubesheet joint interface.
In order to reduce iron transport, the pH of the Secondary Plant water chemistry had to be increased. This increase in pH would induce a scaling/protective coating on the pipe ID, helping to protect the piping from FAC. An amine additive was used to raise the pH.
Limiting the ability to raise pH, was the Condensate Polishing System used to purify and control feedwater makeup. If the amine were increased solely to induce a more alkaline state, it would result in an increase in condensate polisher vessel run times (resin regeneration frequency). This increases: manpower costs, equipment wear (i.e. chemical pumps, valves, controls, etc.) and resin requirements.
The Secondary Plant utilizes demineralized water for condensate makeup. Condensate contamination generally occurs via sodium and chloride intrusion from tube-leaks and tube-to-tubesheet joint leakage in the Main Steam Surface Condenser. Thus, the Condensate Polishers primary function is to protect the Steam Generators from impurities coming from the main condenser.
The Surry Main Condensers were originally installed with 90-10 CuNi tubes. Because of issues relating to copper carryover and tube reliability, Unit #2 was retubed in October 1979 and Unit

Session 2: Materials Technology
2-30
#1 was retubed in March 1981 with titanium tubes. The titanium tubing was roller expanded into the existing aluminum bronze tubesheets. The waterboxes were rubber lined.
The James River supplies brackish cooling and service water to the plant, with sodium levels as high as 5,000 ppm. These high levels presented a serious corrosion concern for the plant. Combining titanium with aluminum bronze in brackish water created the potential for galvanic corrosion. The plant investigated various means for protecting the tubesheets (anode) from the more noble titanium tubes (cathode). Impressed current cathodic protection and protective coatings were identified as possible solutions.
The plant decided to use protective coatings. The first project was to epoxy-coat four (4) inlet tubesheets on Unit 1 to prevent erosion-corrosion of the tubesheets and galvanic corrosion of the tube-to-tubesheet joints. The four (4) outlet tubesheets were left un-coated. The coating had the abrasion resistance and chemical properties sufficient to withstand the cooling water environment. The condenser tubesheet coating project was designed to have a single supplier responsible for materials and application. It was anticipated this would best insure conformance to the coating application specification.
After significant run-time, in-leakage of the cooling water to the steam-side of the condenser was experienced. This was due to outside diameter steam impingement on the peripheral condenser tubes. These tubes were permanently plugged. In-leakage was also experienced due to tube-to-tubesheet joint failure. This was attributed to failures of the tubesheet coating. In subsequent outages, repairs to the tubesheet coating were made. The repairs became more extensive over time. Figure 1 shows the spot failures of the coating.
Figure 1

Session 2: Materials Technology
2-31
A tubesheet coating that is failing creates a potentially more adverse corrosion environment. With small areas of the tubesheet exposed or with sections of the coating having lost adhesion, the cooling water came into direct contact with the tubesheet. This created a more concentrated corrosion environment. An example of this selective corrosion is shown in Figure 2 where up to ½” of aluminum bronze tubesheet metal was lost. (The Figure 2 photo is NOT taken from the Surry condenser but from another nuclear unit with the same metallurgy) It illustrates the potential corrosion damage that can occur from a failing tubesheet coating. Even if impressed current cathodic protection had been used as a back up to the coating for corrosion protection, cathodic shielding of the tubesheet by the delaminating coating could impede the effectiveness of the cathodic protection system.
Figure 2
Surry’s decision was to remove the coating and replace it with an ultra high-reliabilty tubesheet epoxy cladding that had gained a near flawless track record. In March 1992, four inlet tubesheets on Unit #1 were re-coated with the Plastocor Tubesheet Cladding System. The 100% solids epoxy materials were applied in a thick film (200 mils).
This coating system was applied thickly in an over-engineered manor to convey the required reliability to prevent spot failures. The system is installed on a turnkey basis with one vendor responsible for all materials, equipment, supervision, and labor. This approach assures the quality and timeliness of the installation. A five-year labor and material “zero defect” warranty was also provided. References to substantiate successful completion of project performance came from Virginia Power Fossil Installations and nuclear condenser installations outside of Virginia Power.
Figure 3 shows the thick-film nature of the cladding. Figure 4 shows a schematic of the thick-film cladding’s ability to rebuild the tubesheet by replacing lost metal with epoxy.

Session 2: Materials Technology
2-32
Figure 3
Figure 4
The condenser has a total of 71,328, 7/8 inch, 22 BWG titanium tubes. With a project of this size, it is imperative that the turnkey package, supplied by the contractor, is complete and includes:
Equipment:
• oil free compressor(s) with aftercooler(s)
• desiccant wheel dehumidification units with in-line booster heaters
• dust collection units

Session 2: Materials Technology
2-33
Equipment: (cont.)
• ultra high-pressure water jetting unit to remove existing coating and decontaminate the tubesheet and tube-ends
• abrasive blast equipment
• three sizes of protective abrasive blasting plugs
• three sizes of form plugs to keep coating from occluding tubes
• storage/equipment trailer
• small hand and specialty tools
• lighting
• ducting, air hose, etc.
• QC equipment
Manpower:
• full-time supervision
• technicians trained to the contractor’s Application Qualification Program
• application experience in nuclear stations
• ability to gain unescorted personnel access to nuclear plants
• thorough knowledge of the application procedure by all technicians to insure quality control at each step in the application process
• no sub-contractors used for surface preparation and application
Materials:
• 100% solid epoxy materials that are over-engineered for circulating water systems
• suitable abrasive for cleaning and profiling
• ASTM testing program to demonstrate properties of the coating materials
Application Procedures:
• identifying temperature and humidity limitations
• specifying required abrasive blast cleanliness and profile requirements
• hold points for inspection
• step-by-step procedure for application
• mixing instructions for materials
Session 2: Materials Technology
2-34
• specifying overcoat windows for multiple layers materials
Safety:
• compliance with OSHA and plant requirements
• confined space access
• respiratory protection program
• working on scaffolding
• all required PPE
• all required FME
The tubesheet cladding project was completed, on-schedule and at the firm price quoted. Several unit-refueling outages provided the time for evaluation of the inlet tubesheet cladding. Its durability was evident and reductions in sodium and chloride levels on the secondary steam side of the condenser were achieved. It was decided that the four outlet tubesheets on Unit #1 would be clad in May 2000. As a result of these efforts, and the effectiveness of the tubesheet cladding, the main condenser leak rate dropped from approximately 20-30 gal/day and 2-3 ppb sodium, to .2 gal/day with sodium values dropping to .05 ppb..
Based on the success of Unit #1, the same plan of action was detailed for Unit #2. In February 1995, four inlet tubesheets were clad. The four outlet tubesheets were clad in May 1999. During the last Unit #2 refueling outage in March 2002, an extensive project to reduce main condenser in-leakage to near zero gal/day was initiated. During this outage, a thorough steam side internal inspection was conducted. The purpose of this inspection was to identify to identify steam impingement areas, mechanical damage from miscellaneous debris, steam erosion of periphery tubes, tubes at steam dumps and tube failures at support plates. An eddy current inspection program was instituted for examination of 20 % of the 71,328 titanium tubes, with emphasis on high-steam impingement areas. A condenser shell side hydrostatic test was conducted to identify any remaining leakage by filling the condenser with water and dye solution. Tube leaks were identified by black light and permanently plugged. Condensate sodium levels have dropped dramatically to .098 ppb sodium.
Although the effects of FAC have been lessened as evidenced by lower iron values, additional modifications are needed so that increased pH levels can be achieved. The station is presently evaluating how to both bypass the Condensate Polishers to allow even further PH increases on the steam side for piping protection, while maintaining the Condensate Polishers in a ready standby state, to compensate for a condenser tube leak.

3-1
3 SESSION 3: MAINTENANCE TECHNOLOGY
• Six Case Histories of High Reliability Coatings and Condenser Corrosion Problems Michael J. Horn, James E. Mitchell Plastocor, Inc.
• The Use of 100% Solids Epoxy Coatings for Full Length Condenser Tube Linings A. Wesley Langeland, Duromar, Inc. Richard Kreiselmaier, Plastocor-international SA Bruce Woodruff, Progress Energy
• Heat Exchanger Tube Side Maintenance – Repair vs. Replacement Bruce W Schafer Framatome ANP, Inc
• Condenser Application and Maintenance Guide Sharon R. Parker, Contractor Alan Grunsky, Project Manager EPRI

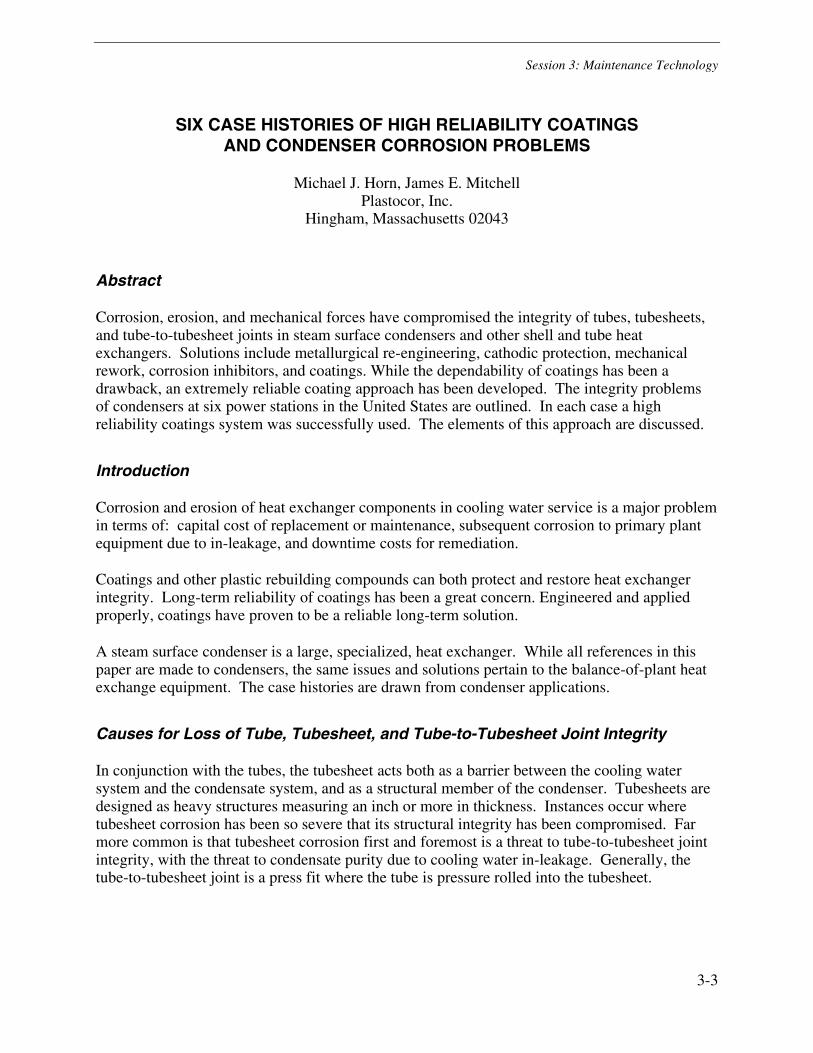
Session 3: Maintenance Technology
3-3
SIX CASE HISTORIES OF HIGH RELIABILITY COATINGS AND CONDENSER CORROSION PROBLEMS
Michael J. Horn, James E. Mitchell Plastocor, Inc.
Hingham, Massachusetts 02043
Abstract
Corrosion, erosion, and mechanical forces have compromised the integrity of tubes, tubesheets, and tube-to-tubesheet joints in steam surface condensers and other shell and tube heat exchangers. Solutions include metallurgical re-engineering, cathodic protection, mechanical rework, corrosion inhibitors, and coatings. While the dependability of coatings has been a drawback, an extremely reliable coating approach has been developed. The integrity problems of condensers at six power stations in the United States are outlined. In each case a high reliability coatings system was successfully used. The elements of this approach are discussed.
Introduction
Corrosion and erosion of heat exchanger components in cooling water service is a major problem in terms of: capital cost of replacement or maintenance, subsequent corrosion to primary plant equipment due to in-leakage, and downtime costs for remediation.
Coatings and other plastic rebuilding compounds can both protect and restore heat exchanger integrity. Long-term reliability of coatings has been a great concern. Engineered and applied properly, coatings have proven to be a reliable long-term solution.
A steam surface condenser is a large, specialized, heat exchanger. While all references in this paper are made to condensers, the same issues and solutions pertain to the balance-of-plant heat exchange equipment. The case histories are drawn from condenser applications.
Causes for Loss of Tube, Tubesheet, and Tube-to-Tubesheet Joint Integrity
In conjunction with the tubes, the tubesheet acts both as a barrier between the cooling water system and the condensate system, and as a structural member of the condenser. Tubesheets are designed as heavy structures measuring an inch or more in thickness. Instances occur where tubesheet corrosion has been so severe that its structural integrity has been compromised. Far more common is that tubesheet corrosion first and foremost is a threat to tube-to-tubesheet joint integrity, with the threat to condensate purity due to cooling water in-leakage. Generally, the tube-to-tubesheet joint is a press fit where the tube is pressure rolled into the tubesheet.

Session 3: Maintenance Technology
3-4
In comparison, tube problems are the more common source of cooling water intrusion. However, only one mode of tube failure is addressed here. And that is the selective degradation of tubes at their inlet-end, usually termed: inlet-end erosion.
Compromise to tube, tubesheet, and tube-to-tubesheet joint integrity may occur via a variety of mechanisms including:
General Erosion/Corrosion
While tube and tubesheet materials are designed to resist general corrosion, most do so by forming a protective oxide layer. In service, cooling water turbulence in conjunction with entrained solids can wipe this oxide layer away exposing the metal to subsequent cycles of erosion/corrosion damage. General erosion/corrosion is usually an issue with tubes, particularly at the inlet, and not the thicker tubesheets. This usually occurs with soft copper alloy tubing where the cooling water has a high amount of suspended solids. Here the cooling water flow selectively erode/corrodes the inlet tube ends where turbulence exists. Typically, the cooling water flow smoothes out significantly after six to eight inches and the problem diminishes.
Galvanic Attack and Dealloying
A galvanic cell is created when dissimilar metals are placed in an electrolyte. The less noble material becomes anodic and corrodes in the presence of the more noble (cathodic) material. While the most active galvanic cells can be found with salt or brackish cooling water, significant conductivity may occur in fresh water condensers especially those employing cooling towers in a closed loop system. The trend towards upgrading to more corrosion resistant tubing (more noble) such as stainless steel and titanium without changing or matching the tubesheets has led to many instances of severe galvanic attack to the tubesheets. This attack may result in complete metal loss or selective loss of a tubesheet alloy component. Selective loss is termed dealloying and is further described by the constituent being attacked (i.e.. dezincification. dealuminumification). Since condenser tubes are comparatively light structures, they are designed to be as noble or more noble than the tubesheet. Hence, galvanic attack generally affects the tubesheet and the tube-to-tubesheet joint.
General or Chemical Corrosion
The conductivity (ion content) or general oxidizing characteristics of cooling water is affected by its chemical content due to pollution, mine runoff, concentration due to the use of closed loop cooling systems and other factors.
Microbiologically Induced Corrosion (MIC)
Various microbiological organisms are corrosive. Generally these organisms must establish a colony whereby corrosive metabolic by-products of that colony become concentrated and attack the host metal. Generally a MIC habitat requires a foothold where water velocities are reduced. Usually, the tube-to-tubesheet joint provides such a foothold. Pits, crevices, scaling, corrosion

Session 3: Maintenance Technology
3-5
deposits or other imperfections may also provide refuge. MIC generally occurs only with non-copper bearing metals and generally appears like perforations or "worm holing" of the tubesheet at the tube joint.
Crevice Corrosion
Depending on the metal, various additional corrosion mechanisms can occur in a crevice, or other imperfection in the surface. These mechanisms (including MIC above) cause the crevice to selectively get bigger and deeper. One common place for a crevice to occur is right at the tube joint where galvanic attack initiated the crevice and is continuing to cause it. Such a growing crevice may become a leak path as it undermines joint strength and integrity.
Mechanical Inadequacy
The mechanical strength of the tube-to-tubesheet joint may itself be substandard. Either under or over rolling or other factors can leave the joint weak. When subjected to the thermal and mechanical stresses of the condenser during operation, the tube can dislodge (even slightly), breaking the joint strength and resulting in leakage.
Coatings as a Corrective Measure
A variety of corrective and remediation measures exist including tube/tubesheet replacement, installation of cathodic protection, re-rolling of the tube ends, water treatments, and coatings. Only coatings are addressed here.
Coatings have failed to perform because of: misapplication, physical damage in service, workmen damage, cracking due to flexing or movement of tubesheets/waterboxes, or just the long term inability of the coating to withstand the environment. In any event, it is commonly feared that a flaw in a tubesheet coating may subject that area to selective galvanic attack (in the presence of more noble tubing) with potentially catastrophic results.
A High Reliability Tubesheet Coating System
A coating system for tubesheets and tube-ends has been developed which has demonstrated the high reliability required for long-term protection using high performance epoxy.
For tubesheets this process ( trademark: Plastocor) is essentially differentiated from conventional coating approaches because of its thick-film nature. Precisely applied as a 200 mill molded epoxy overlay to the tubesheet, the Plastocor process is more appropriately termed a "cladding" (Figure 1). The first application was performed in 1963.
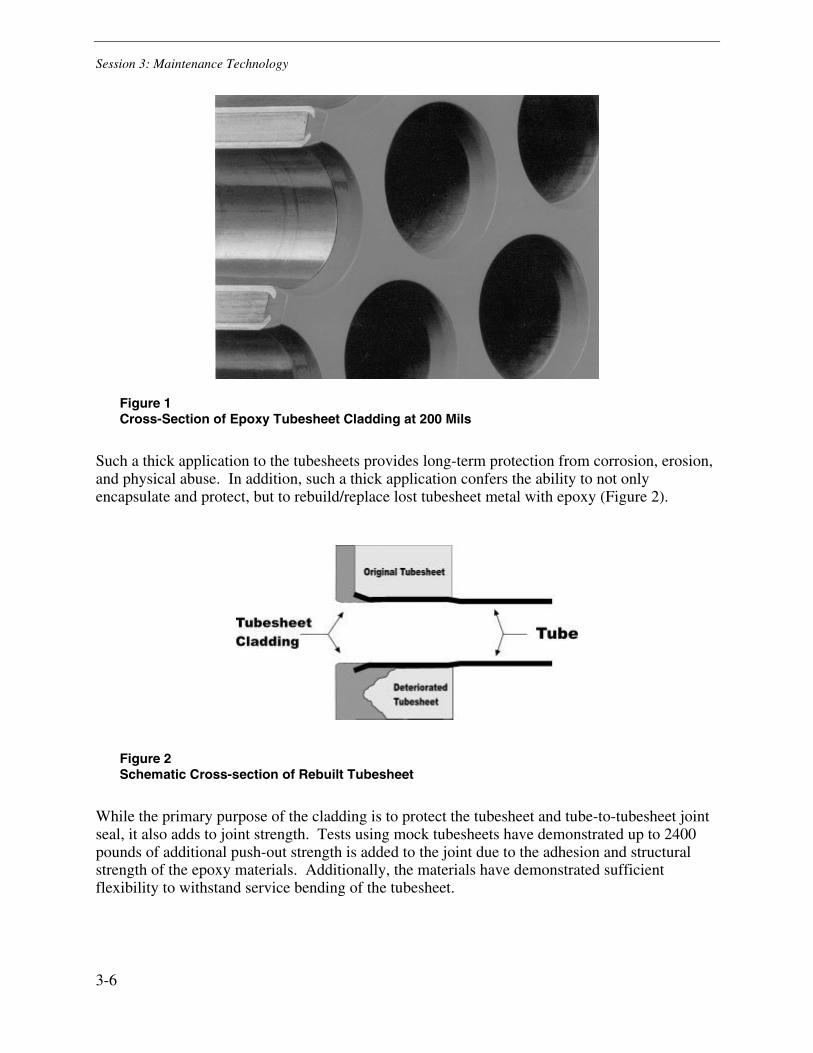
Session 3: Maintenance Technology
3-6
Figure 1 Cross-Section of Epoxy Tubesheet Cladding at 200 Mils
Such a thick application to the tubesheets provides long-term protection from corrosion, erosion, and physical abuse. In addition, such a thick application confers the ability to not only encapsulate and protect, but to rebuild/replace lost tubesheet metal with epoxy (Figure 2).
Figure 2 Schematic Cross-section of Rebuilt Tubesheet
While the primary purpose of the cladding is to protect the tubesheet and tube-to-tubesheet joint seal, it also adds to joint strength. Tests using mock tubesheets have demonstrated up to 2400 pounds of additional push-out strength is added to the joint due to the adhesion and structural strength of the epoxy materials. Additionally, the materials have demonstrated sufficient flexibility to withstand service bending of the tubesheet.

Session 3: Maintenance Technology
3-7
The Tube-End ID Coating
For the tube-ends, the coating is necessarily applied thinly so as not to encroach on the tube ID. The inlet coating is applied in addition to the tubesheet cladding so as to be anchored by the cladding. Three coats are applied to the tube ID. Each coat is applied slightly deeper than the first so as to achieve a feathered termination (Figure 3). Total thickness is six to nine mils.
Figure 3 Cross-section of Tube with Three Inlet Coats (exaggerated)
Elements of the High Reliability Approach
Epoxy Coating Materials
Over the past four decades, major advances in polymer chemistry have been made with respect to coating technology. A variety of generic types of materials are readily available. Phenolics, polyesters, vinylesters, urethanes, polyureas, fluoroelastomers, furans and epoxies have all had major impacts on the coating industry. But the workhorse of them all continues to be the epoxy. Epoxy technology has not stood still. Improvements in the resins, curing agents, modifiers, fillers, chemically functional surface treatments, and other additives have resulted in dramatic improvement in both the apply ability and serviceability of the materials.
In today's era of increased awareness of environmental issues, epoxies are finding new applications in low or no VOC coatings, waterborne systems, and in materials that can meet the new restrictions for hazardous waste. All of this while still maintaining its overall basic strengths of rugged durability, outstanding adhesion, excellent chemical and temperature resistance, and ease of application and repair which have made it such a useful polymer through the years.

Session 3: Maintenance Technology
3-8
Methods of Application
Included in the development of the application specification is consideration of all aspects from surface cleaning techniques, environmental control (humidity and temperature), material qualification, mixing, application, intercoat windows, curing, and final testing. Hold points and acceptance criteria are detailed. Central to the tubesheet coating system is the use of specialized plugs which prevent the encroachment of the epoxies into the tube-ends, and which facilitates the precise molding and buildup on the tubesheet surface. The inlet coating is applied by custom-made high-speed rollers, which spin the materials onto the tube interior.
Application Labor
Experienced personnel generally apply the system on a turnkey basis. System procedures include built-in quality control checks to insure the uniformity of the application. Turnkey application not only serves to preserve consistent quality of materials, equipment, and workmanship but also provides the benefits of single source responsibility. The training and work history of the technicians is tracked.
Case Histories
The Plastocor System was introduced in the United States in 1984. One thousand (1000) tubesheets, four hundred (400) waterboxes, seven (7) million tube-ends and thousands of feet of piping have been successfully coated.
Case One: Severe Galvanic Attack of Carbon Steel Tubesheets
Materials of Construction
The condenser is constructed with 1" thick carbon steel tubesheets and 7/8" OD, 22 BWG, 304 stainless tubes. The waterboxes were uncoated carbon steel.
Cooling Water and Flow Configuration
The plant employs a closed loop cooling water system. Make-up water is drawn from a nearby fresh water river.
Operating History
After ten years of operation, this 850 MW unit was experiencing severe loss of tubesheet material due to general corrosion and galvanic attack. No cathodic protection had been in operation. While the inlet tubesheets had areas where crevices up to 1/4" deep were discovered in the carbon steel, the outlet tubesheets suffered more severe loss. On the outlet end the 304 stainless steel tubes protruded up to 1 1/2" from the sheet. Mud and other debris collected between these protruding tubes creating a stagnant condition. The river mud was slightly acidic,

Session 3: Maintenance Technology
3-9
thereby enhancing the galvanic cell between the dissimilar metals. The resulting corrosion caused wholesale loss of tubesheet ligament up to 1/2 " deep. The worst sections were over the lower third of the sheet, which often remained submerged during unscheduled outages when the condenser was not completely drained. In addition, crevices around the tubes were found to be up to 1/4" deep. The combined result was that, in spots, up to 3/4" of the 1" tubesheet was lost. The most severe metal loss was experienced on the final outlet tubesheet where the water temperature is greatest in this triple pass design.
Solutions Considered
Given the severity of the metal loss, there was great concern over the integrity of the tubesheet and the tube joints. It was decided that a coating must be applied that could rebuild the lost metal and restore joint integrity as well as prevent any further corrosion. The Plastocor tubesheet system was chosen. At the time of the coating installation, the waterboxes were also coated with 30 mils of epoxy. An impressed current cathodic protection system was installed as backup.
Service Experience
The Plastocor cladding was installed in November of 1984. Tube-to-tubesheet joint cooling water in-leakage has not been observed. At last inspection the tubesheet cladding and waterbox coating was found to be in excellent condition. It should be noted that the severity of tubesheet corrosion was not completely realized until the cladding project was underway. Concern was raised that the cladding could truly rebuild the tubesheets and represent a permanent fix. Capital contingencies were made to replace the condenser if required. The service experience of the cladding has been such that this contingency has been removed.
Maintenance Experience
At one point high pressure water was used to clean the tubes and in one area of one bundle the lance operators allowed the water jets to dwell upon the tubesheet cladding and small divots approximately 1/8" deep were created in the cladding. The damage did not extend to the tubesheet metal and a repair has been scheduled as a precaution. As a result a maintenance guideline has been issued so that operators of high-pressure water lances not allow the jets to dwell on the cladding and that pressures above 5,000 not be employed.
Case Two: Tube-to-Tubesheet Joint Leakage
Materials of Construction
The condenser is constructed with 1" thick Muntz Metal tubesheets and 1-1/4" OD, 20 BWG, 90-10 CuNi tubes. The waterboxes are uncoated.

Session 3: Maintenance Technology
3-10
Cooling Water and Flow Configuration
Fresh well water makeup on a closed loop system in the Southeast.
Operating History
After four years of operation, this 330 Mw unit experienced lost capacity during peak summer load and increased demineralization costs due to poor condensate quality. An increase in low-pressure turbine blade copper fouling was also noticed. There was no significant corrosion of the tubesheets and the tubes were found not to have pitted so the cause of the contamination was determined to be tube-to-tubesheet joint leakage.
Solutions Considered
Re-rolling the tubes was considered but determined to pose a greater risk than benefit as the possibility of over-rolling existed. The Plastocor Tubesheet Cladding System was chosen as it both sealed and fortified the tube-to-tubesheet joint.
Service Experience
The tubesheets were coated in November of 2000. At last inspection, the tubesheets were found to be in excellent condition. Condensate quality was returned to normal and demineralization costs were dramatically reduced. Copper deposits on the low-pressure turbine blades was eliminated.
Maintenance Experience
No maintenance of the coating has been required.
Case Three: Inlet-End Erosion and Tube-to-Tubesheet Joint Leakage
Materials of Construction
The condenser is constructed with 1" thick Muntz Metal tubesheets and 1" OD, 20 BWG, 90-10 CuNi tubes.
Cooling Water and Flow Configuration
A once thru, two-pass unit using fresh river water located in the Southeast.

Session 3: Maintenance Technology
3-11
Operating History
After fourty-four years of operation this 100 MW unit began to experience tube failures due to inlet-end erosion.
Solutions Considered
Re-tubing and a tubesheet cladding with an inlet coating were considered as alternatives. The coating was chosen because the unit was frequently experiencing new tube-leaks (load reduction), and the lead-time for retubing was unacceptable. In addition to the tubesheet cladding, the first ten inches of the inlet tube-ends were lined by extending the Plastocor epoxy down the tube at a thickness of 10 mils in order to prevent inlet end erosion.
Service Experience
The cladding and inlet coating were applied in November of 2001. No tube-to-tubesheet joint leakage has been observed. Re-tubing of the unit has been postponed indefinitely.
Maintenance Experience
No maintenance issues have been reported.
Case Four: Inlet-End Tube Erosion Resulting Tube Joint Inleakage
Materials of Construction
The condenser is constructed with 1" thick Muntz Metal tubesheets and 1" OD, 18 BWG, admiralty brass tubes. The waterboxes are carbon steel and are epoxy lined.
Cooling Water and Flow Configuration
The plant employs a once through cooling water system using brackish water in the Southeast with high-entrained solids content.
Operating History
After ten years in service this 550 MW unit began to experience condensate contamination. The inlet tube ends were severely eroded by the entrained solids in the cooling water.
Solutions Considered
Retubing was considered the primary option but financial and time constraints forced the evaluation of alternative repairs. Both metal inserts and tube coatings were evaluated. Concern

Session 3: Maintenance Technology
3-12
with step erosion and tube ID restriction resulted in the selection of the coating option. At this point both inserts and coatings were perceived as short-term solutions, which would be sufficient to patch the unit until a retubing could be scheduled.
Service Experience
The cladding and inlet coating were applied in November of 1987. At last inspection the tubesheet cladding and inlet coating was found to be in excellent condition. No tube-to-tubesheet joint leakage has been observed. As a result the retubing has been indefinitely postponed.
Maintenance Experience
No maintenance of the coating has been required.
Case Five: Crevice Corrosion, Galvanic, and Microbiological Attack of Stainless Steel Tubesheets
Materials of Construction
The condenser is constructed with 1" thick, 316L stainless tubesheets and 1 1/8" OD, 22 BWG, 294C tubes. The waterboxes are flake glass polyester lined carbon steel.
Cooling Water and Flow Configuration
The plant employs a once through cooling water system using salt water in the Mid Atlantic region.
Operating History
After eight years of commercial operation this 882 MW unit was experiencing failure of the admiralty tubing. In 1982 the condenser was rebuilt using 316L stainless tubesheets and 294C tubes. After two months of service the tubesheets were found to be suffering from crevice corrosion and slight galvanic attack. Cathodic protection was installed to control the corrosion. Subsequently it was determined that microbiological attack was also at play. By 1988 the corrosion had thoroughly penetrated the tube joints so that over 1/2" of the joint had been compromised. Furthermore, the corrosion, which had started with the tubesheet, was now affecting the tubes such that they were being perforated from the outside in. However, little joint in leakage was noticed. It was feared that further degradation of the joint would lead to failures.

Session 3: Maintenance Technology
3-13
Solutions Considered
Replacing the condenser was considered. The Plastocor cladding was chosen in conjunction with the inlet coating with the expectation that it would seal the tubesheet and encapsulate the perforated tube ends.
Operating Experience
The Cladding was installed in May of 1994. In 2001 the unit experienced a series of operational anomalies including loss of cooling water (black-trip) and water-hammer. The tubesheet cladding was damaged by these events and completely replaced in February of 2002.
Maintenance Experience
Prior to re-coating replacement, no special maintenance was required.
Case Six: Galvanic Attack to Aluminum Bronze Tubesheets
Materials of Construction
The condenser is constructed with 1-1/4" aluminum bronze tubesheets and 7/8" OD, 22 BWG, titanium tubes. The waterboxes are rubber-lined carbon steel.
Cooling Water and Flow Configuration
The plant employs a once-through cooling water system using brackish river water.
Operating History
This 850 MW nuclear unit was first put in service in 1972 with 90-10 CuNi tubes. For a variety of reasons including removal of copper carry over to the steam generator and other corrosion issues the tubes were replaced with titanium in 1980. In concert with the retubing a protective thin-film coating was applied to the tubesheets because of feared galvanic interaction. After several years the tubesheet coating began to deteriorate. In 1991 it was decided to recoat the unit.
Solutions Considered
An impressed current system and various coating options were evaluated. The Plastocor cladding was selected because of its proven ultra-high reliability within the utility system and the nuclear industry at large.

Session 3: Maintenance Technology
3-14
Operation Experience
The work was done in March of 1992. At last inspection the tubesheet cladding is in excellent condition.
Maintenance Experience
Workman damage associated with on-line maintenance has necessitated spot repairs of the cladding.
Conclusions
Coatings and rebuilding compounds have been found to be useful in protecting cooling water heat exchange systems from erosion and corrosion. Properly engineered and applied, coating systems may serve to restore the integrity of heat exchange equipment as well as protect them from further degradation.
Proper engineering should entail the evaluation and specification of four key elements:
1) Performance properties of the coatings
2) Application methodology and quality control
3) Qualifications and experience of the applicator
4) Thickness of the coating system
Often, the most under-emphasized of these elements is coating thickness. Properly applied, thicker coatings will withstand service abuses longer than thinner coatings. Thick coating systems in excess of 120 mils have been found to be extremely durable and are better classified as "cladding" systems. Long-term performance in excess of twenty-five years has been experienced for such cladding systems.
The six case histories presented here detail the usefulness of this approach in solving most corrosion and erosion problems besetting steam surface condensers and other heat exchange equipment.

Session 3: Maintenance Technology
3-15
THE USE OF 100% SOLIDS EPOXY COATINGS FOR FULL LENGTH CONDENSER TUBE LININGS
A. Wesley Langeland Duromar, Inc.
Richard Kreiselmaier Plastocor-international SA
Bruce Woodruff Progress Energy
Abstract
In an effort to control erosion, corrosion and fouling, the application of coating systems to the inside of main steam condenser tubes has been the subject of some research over the past twenty years. Recently, more interest has been generated as utilities try to extend the life or refurbish older units where re-tubing may not be a cost effective option. Polymeric coatings, primarily solvent based phenolics, epoxy phenolics, and polyesters, have been used to coat heat exchanger tubes for years. Only recently, with the development of a new patented application system by Plastocor-International, has the potential for the use of 100% solids epoxy systems become a possibility.
Introduction
The interest in coating main steam condenser tubes dates back to work by the Japanese in the late 1970’s, and possibly even before this. It was followed by research by the Italian utility ENEL, who were looking for a solution to the fouling and corrosion problems on many of their coastal and harbor units. Working with ENEL, an Italian researcher, Mario Pujsco, developed equipment for applying a coating into the tubes by sending a spray lance down the tube and then extracting it while spraying on a polymeric coating.
The early coatings used were epoxy phenolics and vinylesters, based on their application on heat exchangers in the chemical industry. Because of equipment limitations, these systems were heavily solvented in order to reduce the coating viscosity to a level which would enable the material to be pumped down a long, thin hose and still be atomized at the nozzle. This lead to the typical problems associated with solvent entrapment, poor film development, and non uniform thickness. However, these coatings worked well enough to convince ENEL to coat several of their seaside units.
Most of the early coating work centered on concerns over heat transfer. Coatings were evaluated on the basis of effect on the overall heat transfer rate. Late in the 1980’s, work done by Yusuf Mussalli, and sponsored by the Empire State Electric Energy Research Corporation, indicated,

Session 3: Maintenance Technology
3-16
“…that tube coatings, if properly applied, do not reduce heat transfer appreciably in condenser tubes.” 1 This was followed up with additional work conducted at New England Powers Manchester Street Station by Mussalli, Hager, & Tsou and sponsored by the Electric Power Research Institute in 1989, which concluded essentially the same thing.2 Later, work in 1993 conducted by Tsou and Woodruff at Florida Power and sponsored again by EPRI, centered on the evaluation of generically different types of coating and there projected life from an economic standpoint.3 The results from this later work indicated the need for further work with respect to coating development, equipment refinement and tube cleaning techniques. This paper presents the progress which has been made in these three areas from a material standpoint.
Application Equipment
The newly developed and patented equipment for the application of coatings to the inside of small diameter tubes and pipes overcomes several of the original application problems.
Most notable is the means of controlling the retraction speed of the spray lance in order to apply a uniform thickness of the material throughout the entire length of the tube. Beyond this, spray equipment, fittings and special hoses, which can operate at higher pressures, temperatures and operating speeds, have been developed. This allows for the use of higher viscosity coatings while maintaining optimal atomization levels. In order to reduce application times, a high level of automatization has been added. This also adds to the reliability and reduces the chance for operator error.
Surface Preparation
One of the most critical parameters to the long term performance of any coating is surface preparation. This has been a particular burdensome problem when trying to clean old condenser tubes. If too much pressure is used, a substantial risk of blowing holes in the tube inlet exists. If the pressure is turned down, you run the risk of having no cleaning in the middle of the tube. A variety of techniques have been employed to try and alleviate this concern, such as blasting from both ends. This, however, greatly extends the time it takes to prepare the tubes, while still overcoming problems with non-uniform cleaning.
The solution came from the reverse engineering of a technique used to eliminate cyclonic spiraling in coal dust at burner injection points. This patented procedure effectively cleans a tube uniformly over a distance of sixty feet, while removing no more material at the inlet than at the outlet of the tube.
Design Criteria for a Main Steam Condenser Tube Coating
Because of the nature of utility power stations and the time which is available during outages for maintenance work, working conditions as well as coating design parameters need to be considered. For example, since most application work will require several weeks of time, in all likelihood, other work will be taking place simultaneously. This means that solvent based or flammable coating systems would be hazardous to work being carried out on the turbine deck or in the condenser hotwell. In addition, coatings which lend themselves to easy application in a

Session 3: Maintenance Technology
3-17
shop environment or where elevated temperature curing is possible, would be impractical for use on an existing condenser.
The major parameters used in the design of a coating for use on main steam condenser tubes are listed below:
1. Resistance to the cooling medium, in most cases water and seawater
2. Resistance to condenser operating temperatures
3. Resistance to cathodic protection systems and galvanic corrosion
4. Resistance to erosion
5. Resistance to flexing and vibration, brittleness
6. Resistance to heat transfer
7. Resistance to fouling both biological and sedimentary
8. Resistance to film imperfections, thereby reducing the number of coats
9. Adhesion to the tube material and tubesheet
10. Cure times and temperatures.
11. Overcoat times
12. Disposal hazards
Beyond the operational concerns, these additional criteria are required for use with the patented Plastocor tube lining equipment:
1. Long potlife
2. Low viscosity
3. Ease of atomization, surface tension
4. Low health risks
In order to meet as many of the above criteria as possible, a modified version of a 100% solids, amido-amine cured epoxy was selected. The base material had been used for over ten years as a manually applied coating for the inlet and outlet sections of condenser tubes to prevent erosion from entrained solids in the cooling water.
Beyond the chemistry, a variety of conductive filler media was evaluated in an effort to improve conductivity. The result was that in order to appreciably effect thermal conductivity in a thin film coating, we needed to have almost 50% of the conductive media in the final film. A coating
Session 3: Maintenance Technology
3-18
having a consistency of a thin putty was required in order to achieve this level. For this reason, we selected a silicon oxide filler, which gave us good overall erosion resistance in a thin film and had a thermal conductivity of approximately 0.20 Btu-ft/ft2/Hr/F (ASTM E-228).
Application & Results
In April of 2001, approximately 7000, 90-10, 1 ¼ inch, Cu-Ni tubes were coated at a saltwater cooled Florida utility at an average thickness of four (4) mils. Because of time and budget constraints, only the upper sections of these condensers were coated as they were experiencing the most problems. Operating results were not ideal as the first 3-6 feet of the inlet coating and 6-9 feet of the out ends experienced blistering of the coating similar to what had been reported by Nagata and Sato.4 Although chlorides were checked for, it is believed that after testing, additional chlorides entered the unit via the dehumidified air passing over seawater which entered the outlet boxes at high tide. This blistering could also be aggravated by the cathodic protection systems which could not be turned down because of the remaining 17,000 uncoated tubes.
One month later in May of 2001, approximately 12,000, 1 inch, carbon steel tubes were coated at a freshwater cooled European nuclear unit fitted with an online ball cleaning system. Operating results after a year on this unit have thus far been good, with no reports of coating de-lamination or inlet wear because of sponge balls.
Conclusion and Future Work
Although the present results from an operational standpoint, have been less than perfect, it clearly points to the future potential of this alternative to re-tubing, especially when the long term operation of the unit is in question. Ongoing development work is continuing, in an effort to obtain higher temperature, more surface tolerant coatings with better thermal conductivity and fouling resistance.
1 Yusuf G. Mussalli, C.R.B. Hoerger and F. Roma. “Heat Transfer Resistances of Condenser Tube Coatings and Liners.” ASME-WAM, Anaheim, CA. December 1986.
2 Michael Hager, Yusuf Mussalli and John Tsou. “Tube Coatings for Condensers and Heat Exchangers.”
3 J.L. Tsou and B.N. Wooruff. “Condenser Tube Protective Coating as an Alternative to Retubing.”
4 Koji Nagata and Shiro Sato. “Experiences of APF Condenser Tubes.” Condenser Biofouling Control Symposium “The State-of-the-Art,” Orlando, FL. June 1985.

Session 3: Maintenance Technology
3-19
HEAT EXCHANGER TUBE SIDE MAINTENANCE – REPAIR vs. REPLACEMENT
Bruce W Schafer Framatome ANP, Inc. 155 Mill Ridge Road
Lynchburg, VA 24502 (434) 832-3360
Abstract
The traditional method of repairing degraded tubes in shell-and-tube heat exchangers is to remove the effected tubes from service by plugging. Since heat exchangers are designed with excess heat transfer capability, approximately 10% of tubes can be plugged before performance is affected. When the number of plugged tubes becomes excessive, heat exchanger efficiency is lost, resulting in reduced power output, high system pressure drop, further heat exchanger damage, or abnormal loads placed on other plant heat exchangers.
As an option to component retubing or replacement, repair methods, including tube sleeving and tube expansion, have proven to be an effective method to repair defective tubes and keep the existing heat exchanger in service. For the sleeving process, a new tube section is installed inside the existing tube to bridge across the degraded area. Tube expansion is used to close off a gap between the tube and the tubesheet or end plate (to eliminate a leak path) or between the tube and tube support (to minimize vibration). While not all heat exchangers can be returned to their original design condition by performing tube repairs, in some instances it may be possible to get many more years of useful life out of a heat exchanger at a fraction the cost of replacement.
This paper presents options which the Plant Maintenance Engineer should consider in making the repair versus replacement decision. This includes the repair options (sleeving and tube expansion), other conditions within the heat exchanger, and the effect of tube repair on heat exchanger performance.
Introduction
Traditionally, when maintenance is performed on shell-and-tube heat exchangers, the only options considered when tube defects are found are to plug tubes and, when the number of plugs became too great, replace the heat exchanger. The decision to replace the heat exchanger was based on a number of factors. These included: the number of tubes plugged, the number of forced outages due to tube damage (and the cost associated with replacing lost power and repairing the damaged tubes), the impact that the plugged heat exchanger is having on the plant (due to lost flow or heat transfer surface area), the rate at which tube plugging is occurring, the availability of funds to replace the heat exchanger, and the expected life of the unit (how much longer will the unit operate before retirement).

Session 3: Maintenance Technology
3-20
From a sampling of industry data, tube failures have been shown to cause between 31% to 87% (depending on the data source) of the events related to feedwater heaters (1). Since so many of the failures were related to the tubing, the replacement of an entire heat exchanger due to damage in one area is an expensive as well as a schedule and manpower intensive option.
The typical means for major heat exchanger repair included complete replacement, rebundling, and retubing, as described below.
• For the replacement option, the entire heat exchanger shell and tube bundle are replaced with a new unit.
• For rebundling, the shell is temporarily removed from the heat exchanger and the old tube bundle, including, at a minimum, tubes, tube supports, and tubesheet, are removed. A new tube bundle is inserted and the shell is welded back in place.
• For retubing, either the shell (u-tube design) or tube side access cover (straight tubes) is removed from the heat exchanger and the old tubes are removed from the bundle. New tubes are then inserted and re-attached to the tubesheet (typically by either mechanical expansion, welding, or both). In many instances, the existing shell side hardware is used as-is, although some modifications may be made. Retubing is typically performed on straight tube heat exchangers, such as condensers and coolers.
Since the 1970’s, tube sleeving has been used to allow damaged tubes to remain in service. The sleeves are installed by various means (roll, explosive, or hydraulic expansion, explosively welded, or press-fit or epoxied in place) over the defective area of the tube. Through the use of sleeving, which is a low-cost option to retubing, rebundling, or replacement, the useful life of a heat exchanger can be economically extended. The decision to perform sleeving also can be made with short notice as opposed to replacement (2-6 weeks compared with 18 months), possibly allowing repairs to be performed the same outage that the damage is noted.
Tube expansion also can be performed to minimize or eliminate leakage within heat exchangers. In the tubesheet, tubes can be re-expanded to strengthen the original tube-to-tubesheet joint, reducing or eliminating leakage and prolonging the life of the heat exchanger. Expansions also can be made deep within the tube to expand the tube into tube support plates and end plates. These expansion can reduce tube-to-plate clearance for vibration control or, at end plates, to minimize steam flow from the high to low pressure side of the plate.
Repair vs. Replace – Factors To Consider
There are numerous factors to consider when deciding whether to repair the tubes in a heat exchanger or to perform a larger repair scope and rebundle or replace the component. The following factors should be considered when making the repair vs. replace decision.
• The budget available for repair or replacement needs to be determined. Typically, the cost of performing a substantial heat exchanger repair (consisting of plug removal, tube inspection, tube expansion, and sleeving) is less than 10% of the cost of replacing the unit. Because of the lower cost, the payback time on the repair option is much shorter than for replacement. If the heat exchanger is critical to plant operation (either from a safety, efficiency, or power
Session 3: Maintenance Technology
3-21
production standpoint) or is resulting in costly forced outages, it may be possible to justify a repair to the unit in the near-term and a scheduled replacement when a longer outage can be planned. If there are a large number of tube plugs to remove, or if they are difficult to remove (explosive or welded), then the cost to repair the heat exchanger will increase, and the scheduled time needed on-site may not fit within the outage window. If it appears that tube repair may be possible, it may be worthwhile to plug tubes, using removable plugs, until a certain quantity of tubes are removed from service. At that point the plugs would be removed and sleeves installed, thereby minimizing the overall maintenance cost.
• The location and quantity of the tube defects need to be examined to decide if tube repair is an option. Tube repair may be appropriate if the damage is limited to a certain area of the tube, which would allow the use of a short repair sleeve. If the damage is over a significant portion of the tube, it is possible to install a longer sleeve (up to the full length of the tube) to ensure that all tube defects are repaired. However, if the u-bend region of the tube is damaged then tube repair is not possible. Also, it would not be possible to install a sleeve if a large portion of the tube had damage but there was inadequate clearance for a long sleeve at the tube end.
• One of the more important items to consider when deciding whether a heat exchanger can be repaired is the condition of the remainder of the heat exchanger. The condition of the shell side components, such as the impingement plates, tube supports, end plates, and other structural members, should be in good shape if a long term repair is being planned. An evaluation also should be made of the shell thickness in areas that are prone to shell erosion/corrosion. If the tube repair is only a short-term fix, to allow component operation until a replacement heat exchanger can be installed, the condition of the shell side is not as critical.
• The life expectancy of the power plant needs to be factored into the decision to repair or replace a heat exchanger. If the only problem with the heat exchanger is in one section of the tube, and the expected run time on the unit is relatively short, it would be advantageous to repair rather than replace the heat exchanger since it will be very difficult to pay back the cost for replacement over the remaining plant life.
• The outage time required to repair a heat exchanger, even when tube and shell side inspections are performed, is typically much less than for replacement. In addition, very few, if any, plant modifications need to be made to make the repairs. This allows other work to be performed in the vicinity of the heat exchanger. Along with the shorter outage duration, the site support required for repair is much less. Usually, there are no shell or head modifications required since all work can usually be performed through the manways and pass partition plates. Less repair equipment is required, resulting in less space being needed in the area of the heat exchanger for setup and storage. In addition, the time required to prepare for tube repair is much less than for replacement (2-6 weeks compared with 18 months), allowing a decision on repair to be made just before, or even during, an outage.

Session 3: Maintenance Technology
3-22
• At nuclear plants, the added cost for the disposal of radioactively contaminated heat exchangers must be taken into account. Before disposal, there is the cost of surveying the heat exchangers for release and, if contamination is found, they must either be decontaminated or disposed of as radioactive waste. Tube repairs can eliminate these costs.
• If the heat exchanger is being replaced to eliminate detrimental materials in the cooling system (i.e. copper in the condensate/feedwater system) then tube sleeving will not be beneficial. The only practical solution would be to retube/rebundle/replace to change out the tube material.
Heat Exchanger Repair Options
There have always been options available to either repair or replace heat exchanger tubes in the event that tube leakage or degradation is present. The initial option, after the problem tubes have been located (either through non-destructive examinations, such as eddy current testing, visual inspections, or leak tests) is to plug the tube. Depending on the type of service and operating pressures of the heat exchanger, various types of plugs are employed. These include tapered fiber and metal pin plugs, rubber compression plugs, two piece ring and pin plugs, two piece serrated ring and pin plugs (installed with a hydraulic cylinder), welded plugs, and explosively welded plugs. In addition to the tube end plug, there also may be a stabilizer rod or cable that is inserted into the tube to minimize future tube vibration damage.
At the beginning of the life of a heat exchanger, inserting a few plugs into damaged tubes has little effect on the performance of the heat exchanger. However, if heat exchanger problems continue, and the number of plugs increases significantly, it is possible that the heat exchanger will eventually reach a point that it will not handle the full load that is placed on it. This is due to a combination of loss of heat transfer area and the increased pressure drop. In addition, as the number of plugged tubes increases, abnormal temperature conditions (either hot or cold spots) may be set up in the heat exchanger. These conditions can result in an acceleration of tube damage, creating a faster demise of the heat exchanger.
Once the number of plugs reaches a unacceptable level, the heat exchanger will need to be repaired, replaced, or bypassed. However, bypassing the unit is usually not recommended, at least for a long time period, since it will result in a loss of efficiency and heat transfer area. Also, the heat load from the bypassed heat exchanger will be transferred to another heat exchanger in the string, resulting in greater than normal operating flow rates and higher degradation in that heater.
The following sections show the options that can be used to replace or repair the entire heat exchanger or just the tubes.
Retubing
If the unit has straight tubes, good access, and the remaining components (shell, tube supports, internal structural pieces) of the heat exchanger are in good shape, the tubes can be replaced. The old tubes are removed from the unit and new ones, typically manufactured from an improved material, are inserted, and then expanded, into place. Insertion of the new tubes is

Session 3: Maintenance Technology
3-23
shown in Figure 1. In addition to performing retubing to replace damaged tubes, retubing has been performed to eliminate detrimental materials (such as copper from condenser tubes) to minimize damage to other equipment within the plant (nuclear steam generators or fossil boilers).
Figure 1 Condenser Retubing
Rebundling
Some heat exchangers are designed to be rebundled rather than replaced. For these units the entire tube bundle, including tubes, tubesheet, and tube supports are replaced, as shown in Figure 2. The original shell and any other internal structural pieces would be reused (although any necessary internal repairs could be made when the shell was removed). The new tube bundle can be manufactured to ensure that original design problems with the existing unit are corrected. However, the same basic design must be maintained since the new bundle must fit within the existing heat exchanger shell. Rebundling costs about 15-25% more than retubing (1).
Figure 2 Heat Exchanger Rebundling

Session 3: Maintenance Technology
3-24
Replacement
A third and typically widely used option is to replace the entire heat exchanger, as shown in Figure 3. Full replacement allows alternate tube materials, changes in heat transfer area, and structural changes to be employed, including added clearances in areas where erosion or other problems may be occurring, to ensure that the current heat exchanger problems do not re-occur in the future. However, the cost associated with a full replacement is the greatest of the three options, about 5% more than for rebundling (1). In addition, there are no guarantees that the new heat exchanger design will not have new, unanticipated problems.
Figure 3 Heat Exchanger Replacement
Sleeving
An alternate approach to retubing, rebundling, or replacement of a heat exchanger is to install sleeves over the defective portions of the tubes The sleeve consists of a smaller diameter piece of tubing that is inserted into the parent tube and positioned over the tube defects. After insertion, each end of the sleeve is expanded into the parent tube material. These expansions serve the dual function of structurally anchoring the sleeve into the tube and providing a leak limiting path, allowing the sleeve to become the new pressure boundary for the tube. This means that a sleeved tube can have a 100% through-wall indication and still remain in-service, since the sleeve is now the new structural and pressure boundary. The installation of the sleeve into the tube will allow the majority of the tube’s heat transfer area and flow to be maintained.
If heat exchanger repair by sleeving is a possibility then a strategy needs to be used to prepare for future repair. It may be cost effective to plug a quantity of tubes, per the non-destructive examination results, each outage using a removable plug. When the quantity of plugged tubes reaches a certain level the plugs can be removed and sleeves installed. Using this approach will

Session 3: Maintenance Technology
3-25
minimize the cost and time during each inspection outage while allowing the maximum tube repair later in the heat exchanger’s life.
There are three types of sleeves that are installed into heat exchanger tubes. These are full length, partial length structural, and partial length barrier sleeves. The three types are discussed below. Figure 4 shows the sleeve layout.
Figure 4 Heat Exchanger Sleeve Designs
Full Length Sleeve
These sleeves are installed from one end of the tube to the other in straight tubed heat exchangers. After insertion, the full length of the sleeve is expanded into the parent tube. This step serves the dual purpose of maintaining heat transfer as high as possible (typically 75%-90%) while minimizing flow pressure drop through the tube. After the full length expansion step, shown in Figure 5, the sleeve ends are trimmed flush with the existing tube ends and the sleeve is roll expanded into the tubesheet.
The full length sleeve is typically used in a condenser or cooling water heat exchanger when the tubes have multiple defects along their length. Full length sleeving is an attractive option when a relatively small percentage of the tubes require repair. Through sleeving, the majority of the tube heat transfer area can be left in service, resulting in a heat exchanger that is close to its as-designed condition.

Session 3: Maintenance Technology
3-26
Full length sleeving is comparable in many ways to retubing in the methods employed to install the sleeves. However, since removal of the existing tube is not required, and the typical number of tubes that will be full length sleeved are below the number that would be retubed, the cost for material and manhours are much less than for retubing, making sleeving a cost-effective option to return and keep tubes in service.
Figure 5 Full Length Sleeve Expansion
Partial Length Structural Sleeve
This type of sleeve is used to repair shorter defects in the tube. The sleeve can be installed anywhere along the straight length of the tube. Various methods are used to expand the sleeve in place. These include roll expansion (both in the tubesheet and in the freespan portion of the tube), hydraulic expansion in the freespan portion of the tube, and full length expansion. These expansion types are discussed below. The installation of a hydraulically expanded sleeve is shown in Figure 6.
• If one end of the sleeve is in the tubesheet, a torque-controlled roll expansion will be made. This expansion is similar to the original tube-to-tubesheet roll. Freespan roll expansions are made to either a torque controlled setting or to a diameter controlled hardstop setting. Usually, freespan roll expansions are only used when the sleeve length is relatively short, since it can be difficult to insert a roll expander deep into the tube. Both the tubesheet and freespan roll expansion parameters are set so that they can provide both the structural and leakage requirements for the sleeve.
• For sleeves installed deep within the tube, a hydraulic expansion device is used to connect the sleeve to the tube. The expander consists of multiple plastic bladders that are filled with high pressure water. As the water pressure increases, the bladders expanded against the inside of the sleeve, pushing the sleeve into the tube. The expansion process, which is computer controlled, continues until either a preset volume of water or a preset pressure is reached. At this point the sleeve is properly expanded and the bladders are depressurized.

Session 3: Maintenance Technology
3-27
Hydraulic expansions can be made anywhere along the tube length since the expander is connected to flexible high pressure tubing and is not restricted by tube end access. The expansion parameters are qualified to meet the proper structural and leakage requirements for the sleeve.
• Full length expansions are not usually used for structural or leak limiting purposes but instead are used to improve heat transfer and flow through the sleeve and to close the annulus between the sleeve and tube. The full length expansion is made by placing a tool, with seals on each end, into the sleeve. The inside of the sleeve is filled and then pressurized with water to a preset pressure setting, expanding the sleeve into tight contact with the tube. After the full length expansion is made, the ends of the sleeve are typically either roll or hydraulically expanded to form the structural and leak limiting sleeve-to-tube joint.
Many times, the partial length structural sleeves are used to repair indications at one particular area of the tube, such as wear damage at tube support locations, cracking in roll transitions, or pitting indications at one discreet location along the tube length. Longer versions of these sleeves also have been used to repair an entire damaged section of a heat exchanger, such as a desuperheater or drain cooler section of a feedwater heater. Because of the wide variety of uses, the sleeve length can range from as short as 1 foot to over 12 feet in length.
Qualification testing is performed on the structural sleeves to ensure that they can withstand the design temperature and pressure conditions imposed on them. The test results must show that the sleeve will be the new pressure boundary even with a 100% through-wall indication in the parent tube. Sleeves of this type, using mechanical expansions (roll and hydraulic), have reliably been in-service for more than 15 years.
Figure 6 Partial Length – Hydraulically Expanded Structural Sleeve Installation

Session 3: Maintenance Technology
3-28
Partial Length Barrier Sleeve
These sleeves, also known as shields, are used at the ends of the tubes to act as a barrier to tube end erosion. These sleeves are usually very thing, are not designed to act as a pressure boundary or structural repair, and are installed in areas of high turbulence. The materials for these sleeves are compatible with the existing tube material and may include plastic inserts. The sleeves are either roll or hydraulic expanded or pressed or epoxied in place. If tube end erosion is occurring, or is expected to occur, the use of these tube end sleeves will protect and prolong the life of the parent tube, although over time tube erosion may begin to occur at the end of the sleeve. Many heat exchanger tube ends have been protected with shields, significantly prolonging the life of the tubes.
Items to Consider for Tube Repair
Prior to choosing to perform tube sleeving, the following factors should be considered.
• The length, location, and quantity of tube defects that would require sleeving need to be determined. If the defects are in one or a few short areas then either a single or a couple of partial length sleeves could be used. However, if the defects are spaced throughout the length of the tube, then the only option would be a full length sleeve. The parent tube in the area where the sleeve will be expanded is to be defect free. This will insure the highest sleeve-to-tube joint integrity. Also, the tube support designations must be clearly identified to insure that the sleeve is installed at the correct location along the tube length. This is especially true in areas where there may be skipped baffles and the tube only touches every other support plate.
• The condition of the remainder of the tube away from the sleevable defects needs to be known. If there are u-bend defects that may require plugging then the tube should not be sleeved. Sleeving is an option if the remainder of the tube is in good shape.
• The space available at the tube end to insert a sleeve and its installation tooling needs to be known, as shown in Figure 7. If a short, partial length sleeve is being used, the amount of space required is not as critical, although there can still be access issues around the tubesheet periphery for hemi-head channel covers and at pass partition plates. However, if a full length sleeve is required, there will need to be a significant amount of clearance from the tubesheet face.

Session 3: Maintenance Technology
3-29
Figure 7 Required Clearance for Sleeve Installation
• Inspection records need to be reviewed to determine if there are any tube inside diameter (ID) restrictions that would block the sleeve from being inserted to the target location. The size of the eddy current probe used for the inspection, plus any other hardware that has been inserted into the tube, can be used to help determine the tube ID access issues.
• The post-sleeving tube inspection requirements need to be considered. Typically, the ability to inspect the tube beyond a sleeve is not a significant issue. While the presence of the sleeve reduces the inside diameter of the tube, which will result in the need for a smaller inspection probe, the probe will remain large enough to detect pluggable tube indications (usually greater than 40%), however small indications may go undetected.
• As part of the post-sleeve inspection, the sleeve and its attachment to the tube should be examined. There is no need to inspect the section of the parent tube between the sleeve expansions since this is no longer part of the pressure boundary.
• If tube cleaning is to be performed in the heat exchanger, then the type of sleeve to be installed needs to be evaluated. If on-line cleaning is performed, the sleeve size cannot restrict the passage of the balls or brushes. For off-line cleaning, the projectiles need to pass through the sleeve without becoming stuck. Many sleeves that are installed in tubes that require cleaning are full length expanded to ensure the best results for the cleaning equipment.
If it appears that tube sleeving is possible, then information will be needed to ensure that the heat exchanger is properly repaired. The following information is used when planning for sleeving.
• Tube sleeving will need to be coordinated with eddy current inspection and plug removal.
• If it is expected that sleeving may be performed, then it is important that the proper sleeve material be purchased in advance of the job.
• The sleeve material needs to be compatible with the heat exchanger parent tubing and with the water chemistry within the heat exchanger. The galvanic corrosion potential between the sleeve and tube needs to be determined. Also, effects of crevice corrosion between the

Session 3: Maintenance Technology
3-30
sleeve and tube, in the heat exchanger water chemistry, need to be considered to determine if sleeving is a viable repair option.
• The sleeve dimensions need to fit the heat exchanger operating and design conditions plus any restrictions within the tube ID. The sleeve outside diameter (OD) is to be designed to fit into the tube but must be long enough to limit the amount of sleeve expansion. The sleeve wall thickness needs to be sized for the heat exchanger operating parameters, including any ASME Code minimum wall thickness calculations, if needed. The sleeve length must be long enough to span the expected tube defects but needs to be sized to fit any tube end clearance restrictions.
• Before installing sleeves into heat exchanger tubes, testing needs to be performed to set the installation parameters. Depending on the type of sleeve being used, these tests may include setting the rolling torque, hydraulic expansion constants, and full length expansion pressure. In addition, depending on the application for the sleeve, there may be a need to do qualification testing, which would consist of hydrostatic leak and pressure tests and temperature and pressure cycling. These tests would verify that the expansion parameters were set correctly for the sleeve application.
• If a large quantity of sleeves are being installed, it may be necessary to calculate the heat transfer and flow loss due to sleeving. These calculations will give a sleeve-to-plug ratio that can be used to determine the expected improvement in heat exchanger performance after sleeving is complete (and tubes have been returned to service, if applicable).
• The sleeve may need to be full-length expanded based on the heat exchanger operating environment. However, the production rates for sleeve installation are lower when full length expansions are performed. While full length expansion is typically not needed in many applications, such as most feedwater heaters, it should be considered for the following.
– if tube ID cleaning needs to routinely be performed
– if a long sleeve is being inserted that would severely restrict the tube’s heat transfer or flow
– if the tube-to-sleeve crevice needs to be eliminated in a hostile water chemistry environment
– if there are large eddy current probe fill factor restrictions
Heat Exchanger Tube Expansion Repair
In addition to sleeving, it is possible to expand the tube to improve the heat exchanger performance. These tube repairs can minimize further tube damage and maximize the useful life of the heat exchanger. Two methods of tube expansion can be performed. One is to expand deep within the tube to close off a leak path between the tube and the end plate. The other is to re-expand the tube into the tubesheet to minimize tube-to-shell side leakage.
Tube-to-End Plate Expansion
In some heat exchangers, typically feedwater heaters, there are internal plates which separate one zone of the heat exchanger from another (usually condensing [steam] from drain cooler [liquid]).
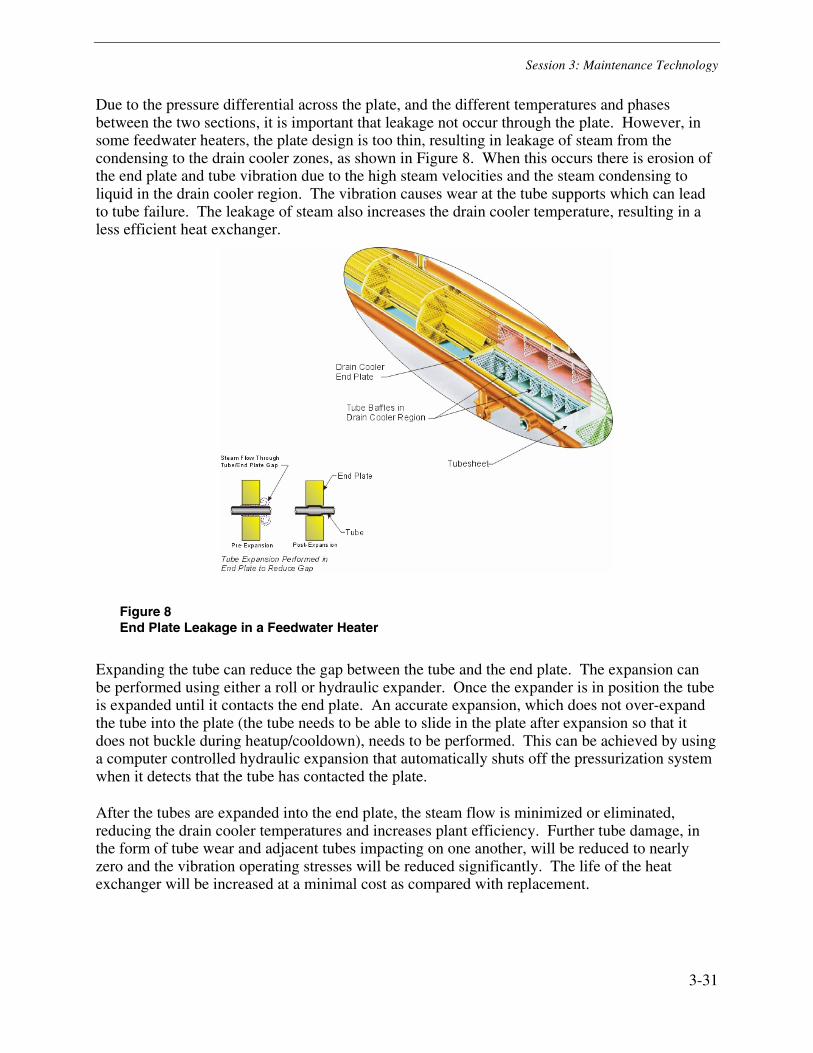
Session 3: Maintenance Technology
3-31
Due to the pressure differential across the plate, and the different temperatures and phases between the two sections, it is important that leakage not occur through the plate. However, in some feedwater heaters, the plate design is too thin, resulting in leakage of steam from the condensing to the drain cooler zones, as shown in Figure 8. When this occurs there is erosion of the end plate and tube vibration due to the high steam velocities and the steam condensing to liquid in the drain cooler region. The vibration causes wear at the tube supports which can lead to tube failure. The leakage of steam also increases the drain cooler temperature, resulting in a less efficient heat exchanger.
Figure 8 End Plate Leakage in a Feedwater Heater
Expanding the tube can reduce the gap between the tube and the end plate. The expansion can be performed using either a roll or hydraulic expander. Once the expander is in position the tube is expanded until it contacts the end plate. An accurate expansion, which does not over-expand the tube into the plate (the tube needs to be able to slide in the plate after expansion so that it does not buckle during heatup/cooldown), needs to be performed. This can be achieved by using a computer controlled hydraulic expansion that automatically shuts off the pressurization system when it detects that the tube has contacted the plate.
After the tubes are expanded into the end plate, the steam flow is minimized or eliminated, reducing the drain cooler temperatures and increases plant efficiency. Further tube damage, in the form of tube wear and adjacent tubes impacting on one another, will be reduced to nearly zero and the vibration operating stresses will be reduced significantly. The life of the heat exchanger will be increased at a minimal cost as compared with replacement.

Session 3: Maintenance Technology
3-32
Tube-to-Tubesheet Expansion
In some heat exchanger designs, with a certain combination of materials, leaks develop between the tube and tubesheet. In many low pressure units, the tube is only expanded into the tubesheet, with no subsequent weld. Many of the leaks that occur in these units are the result of a fabrication error and can be corrected by re-expanding the joint to the correct expansion size. However, leakage occasionally occurs in high pressure heat exchangers, typically feedwater heaters, even when the tubes have been welded to the tubesheet. The two prime causes of this leakage are in areas where the original tube-to-tubesheet weld has either cracked or eroded due to flow (in the case of soft materials, such as carbon steel) or where there is a crack in a tube-to-tubesheet expansion transition.
• For the first case it may be possible to re-expand the tube using a qualified roll expansion process. The expansion would increase the contact pressure between the tube and tubesheet, increasing the resistance to flow and decreasing or eliminating leakage. This process could be performed on existing leaking tubes or preventatively on all tubes in the tubesheet.
• If cracking is occurring at the original tube expansion transition it may be possible to re-expand the tube deeper in the tubesheet (unless the cracking is occurring very close to the shell side of the tubesheet). The tube would be expanded using a qualified roll expansion process, to place the tube into tight contact with the tubesheet. This expansion would increase the contact pressure between the tube and tubesheet, increasing the resistance to flow and decreasing or eliminating leakage. This process could be performed either on existing leaking tubes or preventatively on all tubes in the tubesheet.
Re-expanding tubes that either may be leaking or that could develop leaks in the future could significantly extend the life of an otherwise good heat exchanger. By re-expanding the tubes, forced outages can be avoided and damage from the high pressure water spraying on adjacent tubes and on the shell will be eliminated. The cost to perform tube re-expansions will be minimal when compared with the cost of replacement heat exchangers and the cost of forced outages.
Items to Consider for Tube Expansion Repair
The following factors should be considered to determine if tube expansion is possible.
• The portion of the tube to be expanded needs to be determined.
– If leakage is occurring through the end plate, the expander will need to be long enough to reach the end plate location. The tube should be expanded using a process, such as hydraulic expansion, that will not lock the tube into the end plate. This expansion will not only reduce leakage through the plate but also will minimize future tube vibration due to the tight fit between the tube and plate.
– If leakage is occurring within the tubesheet, due to either weld or tube cracking, a re-expansion process may be used. This process, typically a roll expansion, will re-expand the tube into the tubesheet to limit or eliminate leakage from the tube to the shell side of the heat exchanger.
Session 3: Maintenance Technology
3-33
• The condition of the remainder of the tube needs to be known. If there are cracks along the entire tube length then re-expanding the tube alone will not result in an improvement in heat exchanger performance.
• The space available at the tube end to insert the expansion tooling needs to be known. Usually either a roll or hydraulic expander will be used for this process. Unless a roll expansion is being performed at the end plate, the usual repair tooling is relatively short, although there can still be access issues around the tubesheet periphery for hemi-head channel covers and at pass partition plates.
• For tube end plate expansions, the eddy current inspection records need to be reviewed to determine if there are any tube inside diameter restrictions that would block the expander from being inserted to the end plate location. The size of the eddy current probe used for the inspection, plus any other hardware that has been inserted into the tube, can be used to help determine the tube ID access issues. The potential for any tube end restrictions, that might limit tooling insertion into the tube, also need to be known so that tooling can be prepared to eliminate the restriction.
If it appears that tube expansion is possible, then information will be needed to ensure that the heat exchanger is properly repaired. The following information is used when planning for tube expansion.
• Tube expansion will need to be coordinated with eddy current inspection and plug removal.
• The tube expander design (diameter and length) needs to be based on the requirements for the expansion. Before performing tube expansions into heat exchanger tubes, testing needs to be performed to set the tooling operating parameters. Depending on the type of expansion, these tests may include setting the rolling torque for tubesheet re-expansions or setting the hydraulic expansion constants for end plate expansions. In addition, for the tube-into-tubesheet re-expansion process, qualification testing should be performed. This would consist of hydrostatic leak and pressure tests and temperature and pressure cycling. These tests would verify that the expansion parameters were set correctly for the tube re-expansions.
Conclusions
The costs associated with heat exchanger replacement can be significant. These costs include the new heat exchanger or tube bundle, the manpower required to remove the old and install the new heat exchanger components, plant modifications to allow for the removal of the heat exchanger, and the amount of outage time associated with replacement. In addition, the replacement of a heat exchanger can adversely affect other work going on in the their vicinity. Because of the cost and time involved, and if the damage is confined to only the tubing (which is typically the case), repair of the heat exchanger, through either sleeving or tube expansion, should be considered. If the tube damage is confined to one general area, there is a good possibility that the expense of a replacement can be avoided. In addition, the time required to prepare for tube repair is much less than for replacement (2-6 weeks compared with 18 months), allowing a decision on repair to be made just before, or even into, an outage.
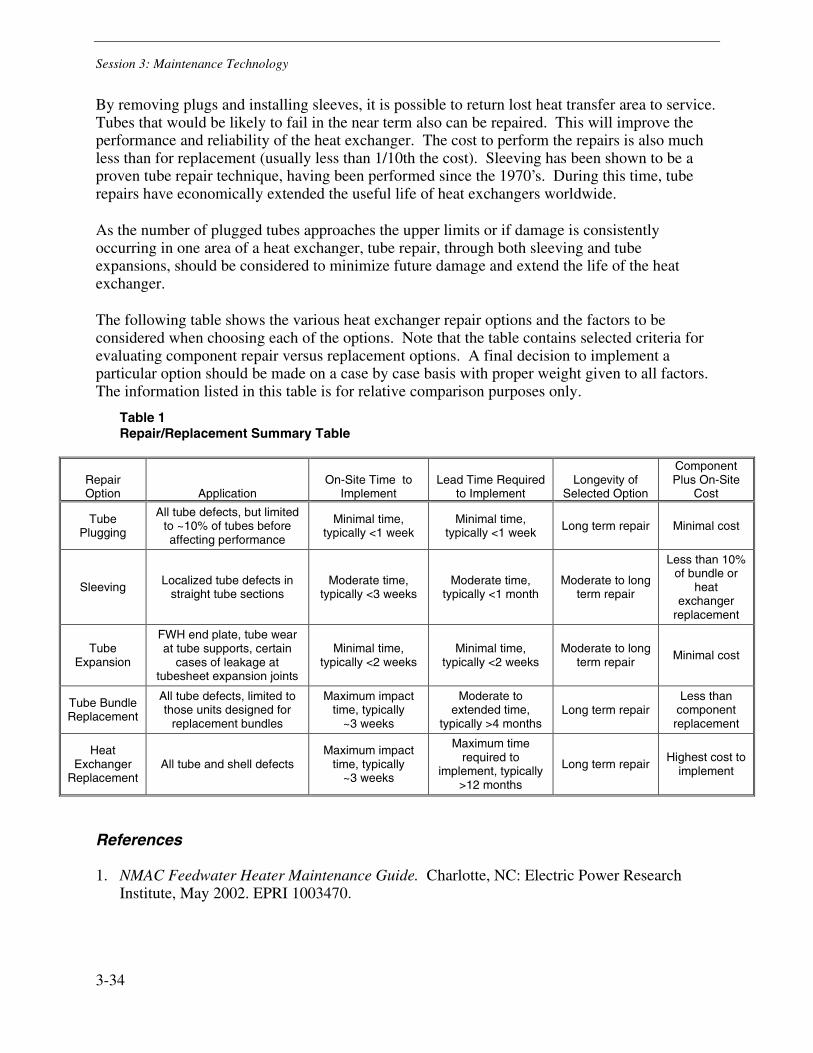
Session 3: Maintenance Technology
3-34
By removing plugs and installing sleeves, it is possible to return lost heat transfer area to service. Tubes that would be likely to fail in the near term also can be repaired. This will improve the performance and reliability of the heat exchanger. The cost to perform the repairs is also much less than for replacement (usually less than 1/10th the cost). Sleeving has been shown to be a proven tube repair technique, having been performed since the 1970’s. During this time, tube repairs have economically extended the useful life of heat exchangers worldwide.
As the number of plugged tubes approaches the upper limits or if damage is consistently occurring in one area of a heat exchanger, tube repair, through both sleeving and tube expansions, should be considered to minimize future damage and extend the life of the heat exchanger.
The following table shows the various heat exchanger repair options and the factors to be considered when choosing each of the options. Note that the table contains selected criteria for evaluating component repair versus replacement options. A final decision to implement a particular option should be made on a case by case basis with proper weight given to all factors. The information listed in this table is for relative comparison purposes only.
Table 1 Repair/Replacement Summary Table
Repair Option
Application
On-Site Time to
Implement
Lead Time Required
to Implement
Longevity of
Selected Option
Component Plus On-Site
Cost
Tube Plugging
All tube defects, but limited to ~10% of tubes before affecting performance
Minimal time, typically <1 week
Minimal time, typically <1 week Long term repair Minimal cost
Sleeving Localized tube defects in straight tube sections
Moderate time, typically <3 weeks
Moderate time, typically <1 month
Moderate to long term repair
Less than 10% of bundle or
heat exchanger
replacement
Tube Expansion
FWH end plate, tube wear at tube supports, certain
cases of leakage at tubesheet expansion joints
Minimal time, typically <2 weeks
Minimal time, typically <2 weeks
Moderate to long term repair Minimal cost
Tube Bundle Replacement
All tube defects, limited to those units designed for
replacement bundles
Maximum impact time, typically
~3 weeks
Moderate to extended time,
typically >4 months Long term repair
Less than component
replacement
Heat Exchanger
Replacement All tube and shell defects
Maximum impact time, typically
~3 weeks
Maximum time required to
implement, typically >12 months
Long term repair Highest cost to
implement
References
1. NMAC Feedwater Heater Maintenance Guide. Charlotte, NC: Electric Power Research Institute, May 2002. EPRI 1003470.

Session 3: Maintenance Technology
3-35
Condenser Application and Maintenance Guide
Sharon R. Parker, Contractor
Alan Grunsky, Project Manager EPRI
Filename.1
Photo
Condenser Application and Maintenance Guide1003088
Sharon R. Parker, Contractor
Alan Grunsky, Project Manager
704-547-6056

Session 3: Maintenance Technology
3-36
Input on the 2000 EPRI NMAC survey and the 8/2000 NMAC Site Coordinators meeting requested a new Condenser Guide. The intent of the guide was to:
• Be a comprehensive guide for the Maintenance Engineer at a Nuclear plant.
• Replace an existing EPRI NMAC guide, ABC’s of Condenser Technology, published in 1994.
• Emphasize the Reliability, Performance and Maintenance Practices for the Condenser.
• Be applicable for the Nuclear and Fossil units.
Condenser Application and Maintenance Guide Overview
Condenser Application and Maintenance GuideOverview - cont.
• Technical Advisory Group members represented CP&L, Dominion, Duke, Entergy, Exelon, PSE&G and TVA utilities.
• Vendors represented Conco, Expansion Seal Technologies, Framatome, Heat Exchanger Institute (HEI) and Plastocor.
• A survey was sent to the Nuclear and Fossil plants for Condenser Design, Materials, Cleaning Practices, Water Treatment, Cathodic Protection, etc. The results are tabulated in an appendix in the guide.

Session 3: Maintenance Technology
3-37
Condenser Application and Maintenance Guide Contents
• Introduction - Background (Why Guide Is Needed), Approach, Guide Organization (Layout of Guide) and the Use of Pop-outs (O&M Cost, Technical and Human Performance).
• Tutorial - Condenser Operation, Rankine Cycle, Condenser Secondary Functions, Condenser Types (# Compartments, # Passes, Transverse Versus Axial Flow, Parallel or Series Design), Components (Shell, Hotwell, Waterbox, Tubesheet, Tubes and Air Removal Equipment).
Condenser Application and Maintenance Guide Contents - cont.
• Troubleshooting - Increased Condenser Pressure, Air Binding Problems and Air Removal Equipment Problems.
• Performance - Heat Transfer, Condensing Duty, Heat Transfer Coefficient, HEI Testing Method, ASME Testing Method, Turbine Blade Effects, Performance Monitoring, Software Tools (HEW-CA) and Instrumentation.
• Fouling - Macrofouling, Macrofouling Control Technologies, Microfouling, Microfouling Chemical Treatment, Fouling Monitor and Targeted Chlorination with Fixed Nozzles.

Session 3: Maintenance Technology
3-38
Condenser Application and Maintenance Guide Contents - cont.
• Cleaning - Mechanical On-Line and Off-Line Cleaning Systems and Chemical Cleaning.
• Air/Water In-Leakage - Air In-Leakage Effects, Air In-Leakage Detection Methods, Correcting Air In-Leakage, Water In-Leakage Effects, Water In-Leakage Detection Methods and Correcting Water In-Leakage.
• Failure Modes - Industry Failure Data, Failure Mechanisms and General Corrosion Prevention Practices.
Condenser Application and Maintenance Guide Contents - cont.
• Condition Based Maintenance - Records, Periodic Inspections, Preventive Maintenance and Non-Destructive Examination.
• Maintenance Repairs - Plugging Tubes, Tube Inserts, Tube Sleeves, Tube End Coatings, Full Length Tube Liners, Full Length Tube Coatings, Re-Expanding Tubesheet Joints, Tubesheet Coating, Tube Staking for Vibration, Waterbox Repairs, Tubesheet Repairs, Tube Pulling and Miscellaneous Repairs.
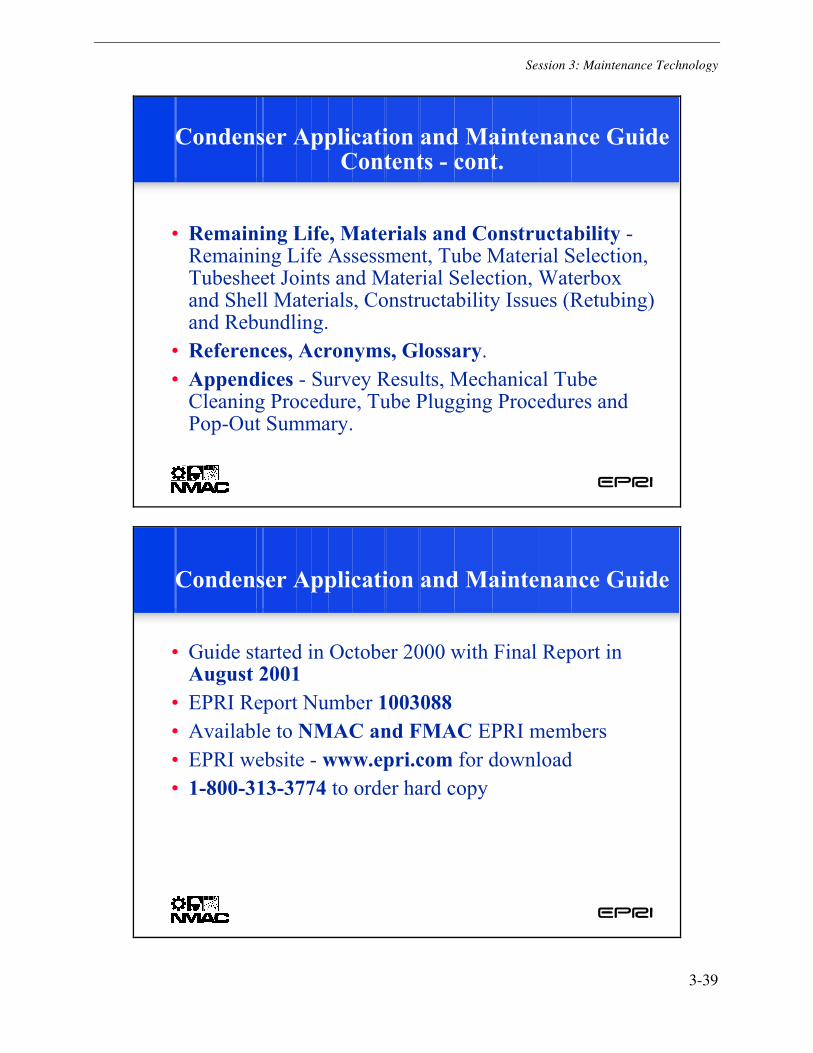
Session 3: Maintenance Technology
3-39
Condenser Application and Maintenance Guide Contents - cont.
• Remaining Life, Materials and Constructability -Remaining Life Assessment, Tube Material Selection, Tubesheet Joints and Material Selection, Waterbox and Shell Materials, Constructability Issues (Retubing) and Rebundling.
• References, Acronyms, Glossary.• Appendices - Survey Results, Mechanical Tube
Cleaning Procedure, Tube Plugging Procedures and Pop-Out Summary.
Condenser Application and Maintenance Guide
• Guide started in October 2000 with Final Report in August 2001
• EPRI Report Number 1003088 • Available to NMAC and FMAC EPRI members• EPRI website - www.epri.com for download • 1-800-313-3774 to order hard copy


4-1
4 SESSION 4: PERFORMANCE IMPROVEMENT
• A Condenser Success Story Dave Leissner, Mirant Richard Putman, Conco Consulting Corp.
• On Understanding Condenser Pressure Saturation at Low Air Ingress Joseph W. Harpster, Ph.D. Intek, Inc.
• Experiences With Steam Cycle Air Ingress at Alliant Energy Fossil Plants: Case Studies Documenting the Effects of Air In-Leakage on Steam Plant Operations Wesley A. Kaufman, P.E. Alliant Energy – IP&L
• The Measurement of Condenser Losses Due to Fouling and Those Due to Air Ingress Richard E. Putman, Conco Consulting Corp. Dr. Joseph W. Harpster, Intek Inc


Session 4: Performance Improvement
4-3
A CONDENSER SUCCESS STORY
Dave Leissner Mirant
Chalk Point Generating Station Aquasco, Md
Richard Putman Conco Consulting Corp.
Verona, PA [email protected]
Abstract
The largest single factor that can affect turbine cycle efficiency within a generation station is the heat transfer of the condenser. Depending on turbine design, poor condenser performance can cost as much as 7% in extra fuel being consumed. Thus, maintaining condenser performance can be of benefit not only economically to the plant but also to the environment. The factors affecting condenser heat transfer are; tube-sheet macro fouling, tube deposits, air in-leakage and air removal pump condition. This paper is a comprehensive look at Chalk Point’s Unit #2 condenser performance during the year 2000 and the corrective actions taken in 2001 to improve unit backpressure by 2.5 in.Hg.
This condenser began the year 2000 with the actual backpressure at design conditions. This paper details how, over the next twelve months, condenser performance deteriorated to the point where the actual backpressure had risen to 2.5 in.Hg. above design. Because the unit was forced to run on one circulating water pump for a period of eight weeks, factors such as tube-sheet macro fouling, tube fouling deposits and silting was accelerated. The demand for MWs during the summer, meant that the unit had to operate during the entire bio-fouling season without cleaning the condenser water boxes. In addition to the fouling problems, air in-leakage began to increase in September 2000 and its effect soon became as significant as the performance loss due to fouling. The air in-leakage was caused by a failure of the cross over expansion joint in the Low Pressure turbine combined with the rupture of the steam seal supply line to the gland seals. These sources of air in-leakage were discovered only one month prior to the overhaul through leak tests conducted with helium injection. Compounding the effect of the air in-leakage was the fact that one air removal pump was due for a complete overhaul and the other pump was in need of repair.

Session 4: Performance Improvement
4-4
Introduction
The Chalk Point Generating Station is owned and operated by MIRANT. It is located on Eagle Harbor Road in Aquasco, Maryland at the confluence of the Patuxent River and Swanson Creek in the southeastern corner of Prince George’s County. The ambient air temperature varies from –15 F to 107 F. The site is approximately 15 ft above sea level.
Chalk Point Units 1 and 2 are identical B&W supercritical, once-through, double reheat, regenerative cycle boilers and were converted to balanced draft design. Each unit is rated for 355 MWs. The furnace is of the open, water-cooled, dry bottom type. These units are designed to burn pulverized coal through the front and rear wall burners. The boilers are designed for a maximum rating of 2,500,000 LB/hr main steam flow at superheated outlet conditions of 1000 F and 3,575 pig. At this rating, the reheat outlet conditions are 1050 F at 1020 pig and 1000 F at 315 pig for the first and second reheat stages, respectively. The condensers were built by Worthington and are designed to condense 1,450,000 Lbs./Hr. of steam with a heat rejection of 1,435,000 BTU/Hr. At circulating water inlet temperatures of 59 degrees F the design Back-pressure with a cleanliness factor of 85% is 1.11 “ Hg. The circulating water system consists of two half capacity Worthington pumps rated at 125,000 GPM driven by GE motors rated at 600 HP. The circulating water system is counter-flow to the river with the discharge canal extending over one mile upstream of the inlet structure to the condenser. The intake structure is downstream of the discharge canal and brackish water from the Patuxent River is directed by the inlet canal to the intake structure, which houses the pumps and inlet screens. The river water temperatures vary from 32 degrees in the winter to 90 degrees F in the summer. The condenser tubes were originally made of Aluminum Bronze material and were replaced with Titanium tubes in 1987-88. There are four waterboxes to each condenser and each box is once through. These units are also equipped with an Amertap online cleaning system.
Units 1 and 2 are each equipped with two Worthington reciprocating piston vacuum pumps which are connected together by a common header leading to each of the air removal sections of the condenser. The discharges from each of the air removal pumps are tied together and exit through a common silencer before exiting the building into the atmosphere. The unit is designed to run with only one vacuum pump in service. However, due to the air leakage caused by two Low Pressure turbines and their gland seals, (even when the seals are in good condition), both air removal pumps remain in service for efficient operation of the condenser.
Condenser performance monitoring on these units is accomplished using data obtained from the Process Information system and additional testing conducted by vendors and plant personnel.
Initial Conditions June 2000
Unit #2 was on an extended outage during the spring of 2000. It was in March that all of the condenser maintenance activities were performed such as bullet cleaning of the condenser tubes and any air leakage repairs. This unit did not return to service until June and due to low circulating water flow while the unit was off-line, much of the tube cleaning benefit was not realized due to silt build up in the tubes. The importance of maintaining the proper circulating

Session 4: Performance Improvement
4-5
water velocities through the condenser will be discussed later in this paper. The following were the initial conditions of the condenser when the unit returned to service:
ACTUAL DESIGN LOAD 355 MWS 355 MWS CW INLET TEMP. 77.5 F 59 F CW TEMP. RISE 14.9 F 14.0 F BACKPRESSURE 2.6” HG 2.2” HG @ 77.5 F HOTWELL O2 PPB * 2.8 PPB <5 PPB *Notice that condenser air in-leakage was not a problem in June 2000.
Condenser Air Leakage
Hotwell Dissolved Oxygen
A very important part of condenser monitoring is the ability to determine the effectiveness of the air removal capabilities of the condenser and the amount of air leakage that the condenser may be experiencing. A necessary part of this monitoring is the dissolved oxygen analyzer that determines the oxygen content of the condensate leaving the Hotwell. Chalk Point is fortunate enough to have an on-line analyzer that is connected to the Plant Information system.
Below is a graph of the gradual increase in Hotwell dissolved oxygen beginning in Sept. 2000:
E2 HW O2
020406080
100120140160180200
9/10
/00
9/24
/00
10/8
/00
10/2
2/00
11/5
/00
11/1
9/00
12/3
/00
12/1
7/00
12/3
1/00
1/14
/01
1/28
/01
2/11
/01
DATE
PPB

Session 4: Performance Improvement
4-6
Air Removal Pump Testing
It was noticed that the level of Oxygen was increasing in the condensate from the hotwell. As a result, tests were performed on the air removal pumps in order to determine their condition. The test of the air removal pump involves shutting each pump off while the load remains constant and recording the following:
• Unit Backpressure
• Circulating Water Inlet Temperature
• Hotwell Temperature
• Hotwell Oxygen Content
• Air Removal Pump Motor Amps (Taken while both pumps are in service)
Fortunately, because of the many tests that have been conducted a baseline has been established for this unit during these tests. With a tight condenser and when air removal pumps are in good condition, when a pump is removed from service, the average increase in Hotwell O2 is 5 PPB with a negligible increase in back-pressure and a one degree increase in hotwell temperature.
The following graphs indicate the vacuum response from a typical air removal pump test :

Session 4: Performance Improvement
4-7
From the graphs above and the graphs on the following page, one would begin to make the conclusion that the B pump is removing more non-condensable gas than the A pump. Another tool that can be used to determine air removal pump condition is the trending of the motor amps of the pumps. It has been our experience that as a one pump begins to deteriorate, the amps on the motor decrease while the amps on the motor of the good pump increase. Trending of the air removal pump motor amps, along with the air removal pump testing, has been an accurate method of determining air removal pump condition.
The graphs below indicate typical hotwell temperature and dissolved oxygen response when air removal pumps are taken off:
E 2 P R IM A R Y VA Ca p u m p o ff b p u m p o ff
2 8 .8
2 8 .9
2 9
2 9 .1
2 9 .21 15 29 43 57 71 85 99 113
127
141
155
HG
"
E2 SECONDARY VACa pum p off b pum p o ff
28 .8
28 .9
29
29 .1
29 .2
29 .3
1 15 29 43 57 71 85 99 113
127
141
155
HG
"

Session 4: Performance Improvement
4-8
E 2 P R IM A R Y H W T E M Pa p u m p o f f b p u m p o f f
8 08 18 28 38 48 58 68 78 88 99 09 19 2
1 15 29 43 57 71 85 99 113
127
141
155
F
E 1 S E C O N D A R Y H W T E M Pa p u m p o ff b p u m p o ff
8 08 18 28 38 48 58 68 78 88 99 09 19 2
1 15 29 43 57 71 85 99 113
127
141
155
F
E 2 HW O 2a p u m p o ff b p u m p o ff
89
1 01 11 21 31 41 51 61 71 81 92 0
1 15 29 43 57 71 85 99 113
127
141
155
ppb

Session 4: Performance Improvement
4-9
Helium Leak Testing
These units are periodically tested for air leakage using the conventional method of filling the hotwell to the expansion joint with water. Filling the condenser with water to the expansion joint is a very quick and easy method of finding air leakage below the expansion joint. During these tests it is common to locate approximately a dozen small areas of air leakage. This supercritical cycling unit runs approximately 100 days between boiler leaks, so that the opportunity to perform this test occurs approximately four times a year when the unit is brought off-line. Unfortunately however, this type of test does not identify any leaks that may exist on the turbine deck. The best method of identifying leaks on the turbine deck is by use of helium injection. The air leakage check during a short outage in the Fall failed to indicate any major leaks below the expansion joints, therefore it was decided to contact Conco to perform a helium leak check to help us locate and eliminate any air leakage on the turbine deck. Helium leak testing was performed by Conco services in February of 2001. The following list indicates the location and severity of leaks identified by the Helium leak test: (This test was conducted just prior to the Spring overhaul.)
Turbine Deck
Secondary Low Pressure Cross-Over expansion Joint --- 60,000 divisions
Secondary Low Pressure West Gland Seal Packing --- 36,000 divisions
Secondary Low Pressure West Gland Seal Packing --- 36,000 divisions
Mezzanine Level
Secondary Condenser South Expansion Joint --- 18,000 divisions (Helium may be carrying over to Cross-Over expansion joint)
Secondary Condenser North Expansion Joint --- 1,800 divisions
Basement
No leaks
Note: The term “divisions” refers to the level of response as indicated by the Helium leak detector.
The helium testing confirmed the theory that the air leakage had to be coming from above the expansion joints and located the leaks on the turbine deck. The major leaks of the cross-over expansion joint and the steam seals on the low pressure turbine were definitely large enough to cause problems with the heat transfer to the condenser tubes due to air leakage. The response times of these leaks was almost instantaneous, it took less than 20 seconds for the helium to arrive at the sample point just downstream of the silencer, which is located approximately 150 feet away from the air removal pumps.
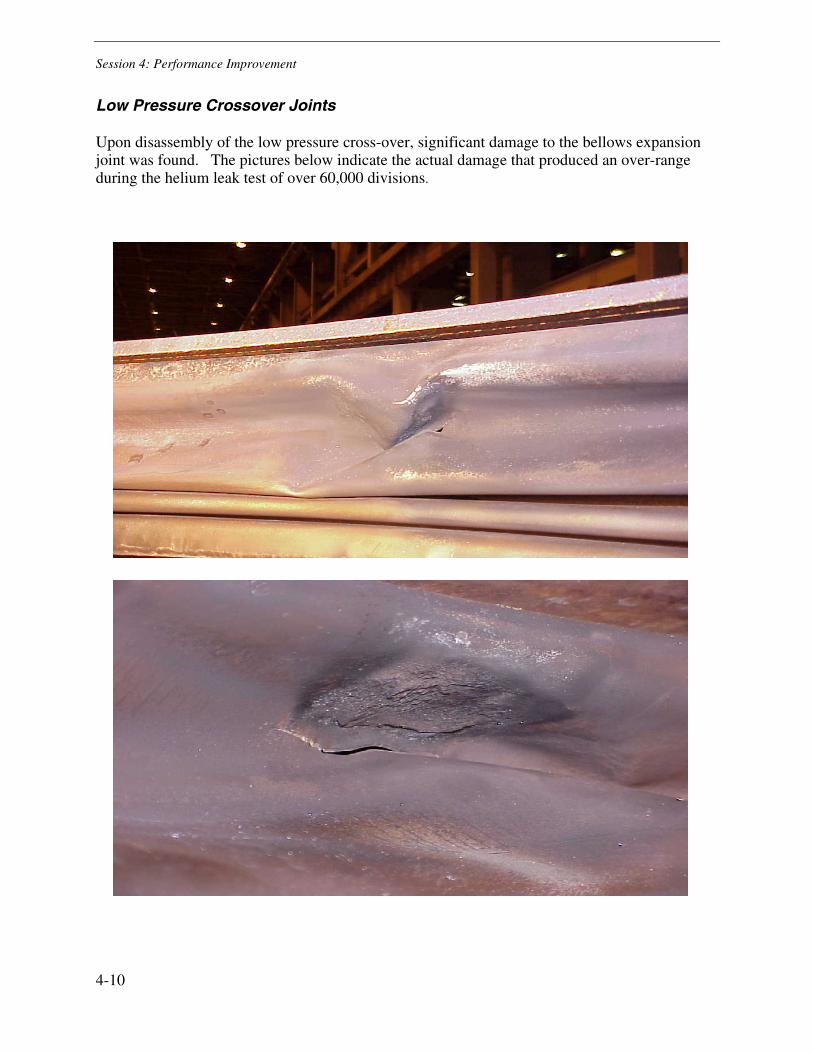
Session 4: Performance Improvement
4-10
Low Pressure Crossover Joints
Upon disassembly of the low pressure cross-over, significant damage to the bellows expansion joint was found. The pictures below indicate the actual damage that produced an over-range during the helium leak test of over 60,000 divisions.
Session 4: Performance Improvement
4-11
Steam Seal Piping
As the dissolved oxygen began to increase in the hotwell, it was determined to be a serious problem when the concentration exceeded 20 PPB, (parts per billion). The first assumption that was made was that the steam seals on the low pressure turbine were beginning to deteriorate. As a result of this assumption the pressure on the steam seal header was increased to compensate for any additional clearance in the steam seals. However, when the pressure to the steam seals was increased, there was no decrease in the dissolved oxygen in the hotwell. Since increasing the steam seal pressure had no effect, it was theorized that the steam seal piping inside the LP turbine may be leaking. This condition had occurred in cycling units #3 and #4, but had never occurred in our base loaded units.
It was suggested at this time to increase the suction created by the steam packing exhauster in order to determine any response in the dissolved oxygen. During this test as the steam packing exhauster vacuum was being increased, the additional load on the exhauster motor caused it to trip. Much to everyone’s surprise, the back-pressure on the condenser decreased along with the dissolved oxygen content of the hotwell. This led us to believe that there was a serious problem with the steam seal lines, causing us to place a high priority on the inspection of this piping during the overhaul. The leakage rate of 16,000 divisions obtained during the helium testing confirmed a significant problem in the steam seal area. Upon inspection, the steam seal piping was found to be ruptured in several places; this not only allowed air to leak into the condenser, but the steam leak also added to the heat load of the condenser. Unfortunately, no pictures taken of the damaged area of the steam seal piping.
Biofouling
Low Circulating Water Flow Causes Silt Build-Up
Although the condenser was cleaned using metal cleaners, the unit was not immediately returned to service due to the extended work performed during the overhaul. During this time, the circulating water system needed to be placed into service to support the auxiliary equipment in the plant. It was decided that in order to save on plant station service, that only one circulating water pump would be run on the condenser being placed into service. As a consequence, the tube water velocity fell to just 3.4 ft/sec, which is only half of its designed value. This condition led to accelerated silt build-up within the tubes. The following graphs indicate the length of time that each condenser was being operated with only one pump in service.

Session 4: Performance Improvement
4-12
Continuous Summer Operation
After returning to service from the overhaul, the condenser remained in service until October with no opportunity to clean the waterboxes of macro-fouling. The pictures below are an indication of the amount of debris and accumulation of growth that units 1 and 2 see every summer. Since being forced to reduce and replace the chlorine injection with non-chlorinated circulating water treatment, the amount of macro-fouling due to garvia has increased dramatically. The injection rates of the sodium hypochlorite are currently being increased and under study in order to reduce the amount of garvia growth. As illustrated in the picture, when we are not fighting garvia, leaves become a serious concern in the fall.
E2 CIRCULATING W ATER
01020304050607080
3/27/0
0
3/29/0
0
3/31/0
04/2
/004/4
/004/6
/004/8
/00
4/10/0
0
4/12/0
0
4/14/0
0
4/16/0
0
4/18/0
0
4/20/0
0
4/22/0
0
4/24/0
0
4/26/0
0
4/28/0
0
4/30/0
0
DAYS
PUM
P A
MPS
A PMPB PMP

Session 4: Performance Improvement
4-13
Bullet Cleaning
Each year unit 1 and 2 condensers are cleaned using mechanical scrappers that are specifically designed for the unit’s tube ID and wall thickness. This activity is performed by Conco services and is usually completed on a straight time basis in four to five days. There have been occasions, however, when the cleanings needed to be completed in a single weekend and during

Session 4: Performance Improvement
4-14
those times all 25,000 tubes were shot in less than 24 hours. Conco is our service provider of choice due to their familiarity of our plant and their excellent track record.
The selection of tube cleaner design depends on the mineral analysis of the deposit. During the cleaning process, tube deposit samples are taken and an ultimate analysis of the sample is performed. Also, the total deposit weight is tracked and is used as a basis to determine if more frequent cleanings of the condenser are required. When chlorine was used to control biological growth, manganese was a large component of the tube deposit and due to the hardness of the deposit, a stiff cleaner had to be used. However, a majority of our deposit is now silicon and iron and as a result of this relatively soft deposit, we now use a cleaner with flexible blades.
During this last cleaning of unit #2 a video of the cleaning process was taken from inside the tube with a specially designed camera. One of the surprising findings of the video was that the garvia attached to the inside surface of the tube was not removed by a 300 psig water flush. (A small portion of this video will be shown during the presentation of this paper)
Final Results
Condenser Air Leakage
The air leakage rate on Unit #2 continues to be under control and the air removal pumps appear to be sufficient for removing non-condensable as evidenced by the following graph:
The chart below indicates the condenser performance before and after the overhaul. It should be noted that in February prior to the overhaul that the performance delta from design was +2.7 Hg.
E 2 H W O 2
0
5
1 0
1 5
2 0
2 5
6/11/0
1
6/18/0
1
6/25/0
17/2
/017/9
/01
7/16/0
1
7/23/0
1
D A T E
PPB

Session 4: Performance Improvement
4-15
The following table summarizes the results comparing June of 2000 to June of 2001:
DESIGN JUNE 2000
JUNE 2001 UNITS
LOAD 355 355 355 MWS CW INLET TEMP 59 77.5 81.0 DEG F CW OUTLET TEMP 14 14.9 14.0 DEG F BACKPRESSURE 1.25 2.6 2.6 IN HG BP DELTA FROM DESIGN
.6 @ 77.5 F .2 @ 81.0 F * IN HG
HOTWELL O2 <5 2.8 3.4 Ppb * Notice that the backpressure benefit from the cleaning is being maintained in 2001 because both circulating water pumps remained on when the unit returned to service !
The result of this 2.7” Hg back-pressure improvement, according to the back-pressure curves on the turbine, is a reduction of unit heat rate by approximately 7%. This efficiency improvement has already realized a fuel savings this year of $840,000 and a NOx emission savings of $125,000. In fact, even though the circulating water temperatures are 30 degrees higher now in July than what they were in February, the unit’s heat rate remains 5% better.
Conclusions
The condition of the condenser is a major factor in determining unit heat rate and often generation capacity. As a result, condenser performance has a tremendous impact on unit operation economics. The performance monitoring of the condenser and routine removal of tube fouling can significantly improve condenser heat transfer and greatly improve the efficiency of the low pressure turbine. However, a decline in condenser performance may not be due to fouling alone but also to either air ingress and/or the inability of the air removal system to maintain the concentration of non-condensibles in the shell side of the condenser at an acceptable level. Air ingress can occur in unexpected places while reduced performance of the vacuum
E 2 C O N D E N S E R
0 .0 01 .0 02 .0 03 .0 04 .0 05 .0 0
Jan-0
0
Feb-00
Mar-00
Apr-00
May-00
Jun-0
0Ju
l-00
Aug-00
Sep-00
Oct-00
Nov-00
Dec-00
Jan-0
1
Feb-01
Mar-01
Apr-01
May-01
Jun-0
1
D A T E
IN H
G
0 .0 00 .5 01 .0 01 .5 02 .0 02 .5 03 .0 0
B A C K P R E S S U R ED E L T A F R O M D E S IG N

Session 4: Performance Improvement
4-16
pumps can also be a factor. It has been shown that the condition of the latter can often be determined from the results of quite simple tests.
Acknowledgements
We wish to thank the management of the Chalk Point Generating station for permission to present this paper and would like to acknowledge the thoughtful suggestions contributed by members of the staff of Conco Systems, Inc.

Session 4: Performance Improvement
4-17
ON UNDERSTANDING CONDENSER PRESSURE SATURATION AT LOW AIR INGRESS
Joseph W. Harpster, Ph.D. President
Intek, Inc. 751 Intek Way
Westerville, OH 43082 T: 614-895-0301, F: 614-895-0319
Abstract
When plotting condenser back pressure versus air in-leakage, it is often observed that there is a low end region of pressure saturation. In describing this condenser behavior, argument is varied. Common to most beliefs however, is that air ingress flow rate at the point where back pressure begins to rise, is related to exhauster capacity.
Until recently there has not been a suitable condenser model to permit precise understanding of the mechanisms responsible for this observation. This paper reviews this model and derives a simple analytical explanation of this otherwise complex condenser phenomenon.
Session 4: Performance Improvement
4-18
Introduction
A purpose of the condenser is to convert turbine exhaust steam to condensate at a sufficiently low design pressure permitting an optimum amount of steam energy to be extracted by the turbine. Higher back pressure at the turbine exhaust results in a load reduction, or an increase in steam flow to maintain load; a higher heat rate is realized in either case. At lower than optimum pressure, the exhaust steam can become choked in the turbine exhaust annulus with no net increase in load, causing hotwell condensate to become subcooled, again increasing the heat rate. It is reasonably observed that an increase in turbine back pressure of only 0.1 "HgA will cause a change in plant heat rate of 0.2%.
One cause of increased back pressure on the turbine is Air In-Leakage (AIL). The amount of this increase, referred to as excess back pressure, or correctable back pressure, over that of design, or condenser pressure saturation value, is a function of the amount of air ingress. Further, there exists a threshold value of AIL, Ao, below which there is no excess back pressure and above which condenser pressure rises as shown in Figure 1. It has been generally acknowledged that this excess back pressure results from AIL being higher than exhauster capacity at a suction pressure nearly equal to the condenser design pressure, PD. Lacking in explaining this noted cause-and-effect relationship is a comprehensive understanding of the air/steam mixture dynamics responsible for the observation.
A condenser model with analytical description was introduced by the author(1,2) in June and July of 2001, presenting a new and unique understanding of condenser behavior. The model and associated theory has been useful in understanding condenser performance parameters and development of patented and patent pending condenser design features that eliminate air binding(3), reduce dissolved noncondensable gases in condensate(4) and improve condenser performance, problem solving and operations.
Although the condenser excess pressure region was previously described(2) as a function of high AIL, there was no analytical presentation of the dynamics of air/steam mixtures in the low AIL pressure saturation region. This paper analyzes the latter region, extending it into the excess back pressure region for completeness.
Model Basics
Air entering the condenser shell mixes with steam close to the leak source and is quickly scavenged to the center of the tube bundle where it enters a small shrouded region of tubes in the Air Removal Section (ARS). The air is then removed from the condenser through the vent line by the exhauster as shown in Figure 2. The time taken for the air to reach the ARS, at low in-leakage rates is generally less than one second and is dictated by the average tube bundle steam velocity.
Air entering the bottom of the ARS is concentrated within the confines of the shroud which lowers the heat transfer coefficient of ARS tubes in agreement with laboratory experiments conducted by Henderson and Marchello(5). These tubes represent about 1% of all tubes in the

Session 4: Performance Improvement
4-19
bundle. The result of the lower heat transfer rate is that tube temperatures in the ARS are lower than those outside the ARS. This lower temperature decreases the condensate surface temperature located on these tubes which lowers the local water vapor pressure. The difference between the higher steam saturation pressure outside the ARS and the lower water vapor pressure in the ARS allows for a partial pressure of air to exist within the ARS space. The total pressure in the ARS is about the same as the condenser pressure saturation value, particularly near the inlet to the ARS. The temperature difference between ARS vapors, particularly near the vent line entrance, and the condenser saturation temperature (steam temperature) is defined as ARS subcooling. This subcooling is a feature of condenser design allowing the density of water vapor leaving the ARS to be reduced, conserving condensate and enhancing the air removal capacity of exhausters.
At higher AIL rates, subcooling in the ARS increases and reaches a limit when the ARS tubes’ outlet circulating water temperature is reduced to the temperature of the inlet circulating water temperature. In this case there is essentially no longer any condensation taking place on the ARS tubes, particularly at the upper most row. Outside the ARS air has been scavenged into the central core of the condenser expanding the subcooled region to tubes outside the ARS. Because the region is subcooled, it no longer contains significant amounts of turbine exhaust steam but, instead, lower temperature water vapor. This region, labeled with an “S” in Figure 2, has been designated a “stagnant” zone, devoid of rushing steam. All the tubes in this stagnant zone have been essentially removed from the steam condensing process. The loss of these tubes requires an increase in the logarithmic mean temperature difference to remove the heat of condensation from the steam load over the remaining number of tubes and condensation surface area. As a result, the saturation pressure of the condenser must rise. A 10 percent loss of tubes to a stagnant zone is not much different from removing 10 percent of the tubes from the condenser, providing the circulating water velocity remains the same. A factor η, representing the fraction of remaining active tubes in the condenser has been defined by Harpster.(1, 6) It is useful in distinguishing the difference between heat transfer coefficient degradation caused by air and separately by tube fouling.
An additional basis for analysis has been the consistent result from many plants that the water vapor to air mass ratio, as measured with RheoVac® instruments(7) located in the condenser vent line, is about 3 at the AIL threshold value noted for the onset of excess condenser back pressure. The meaning here is that if AIL is increased above the threshold value, condenser tubes outside but near the ARS entrance become increasingly surrounded by air, lowering the water vapor temperature and forming a stagnant zone, which grows in size.
The resulting increased pressure within the condenser increases the density of air in the stagnant zone and the ARS to the point that the exhauster, having a somewhat fixed volumetric flow rate, can remove air in equilibrium with the AIL rate. When this occurs, there is air mass flow balance and the stagnant zone size becomes stable.
Computations
Table 1 provides the results of theoretical computations on a condenser of the form depicted in Figure 2. For simplicity, it has attached, an exhauster having a capacity, EC = 2000 ACFM. The

Session 4: Performance Improvement
4-20
exhauster removes a mass flow rate of water vapor, .
m wv, and air, .
m a, in accordance with their respective densities ρwv and ρa. The hotwell and steam temperature, THW and Ts respectively, are equal (no hotwell subcooling) having a value of 108°F under conditions of no, or low, AIL. The low AIL saturation pressure, Ps, is equal to the design pressure, PD, shown in Figure 1 having a value of 2.45 "HgA as indicated in Table 1.
Table 1 Pressure Saturation and Excess Back Pressure Dependence on ARS and Stagnant Zone Subcooling
% Tubes Lost
Ts (°F)
Ps ("HgA)
Twv (°F)
pwv ("HgA)
pa ("HgA)
ρwv (lb/ft3)
ρa (lb/ft3)
.m wv (lb/min)
.m a (lb/min)
AIL (SCFM)
.m wv/
.m a
PEX ("HgA)
0 108 2.45 108.0 2.450 0 .00357 0 7.14 0 0 ∞ 0 0 108 2.45 107.5 2.415 .035 .00352 .00008 7.04 0.166 2.22 42.41 0 0 108 2.45 107.0 2.380 .070 .00347 .00016 6.94 0.328 4.38 21.16 0 0 108 2.45 106.0 2.310 .140 .00338 .00033 6.76 0.658 8.79 10.27 0 0 108 2.45 105.0 2.244 .206 .00329 .00049 6.58 0.972 12.98 6.400 0 0 108 2.45 104.0 2.180 .270 .00320 .00064 6.40 1.274 17.01 5.024 0 0 108 2.45 103.0 2.115 .335 .00311 .00079 6.22 1.584 21.15 3.927 0 0 108 2.45 102.0 2.053 .397 .00302 .00094 6.04 1.878 25.07 3.216 0 2 108.46 2.48 101.0 1.993 .491 .00294 .00116 5.87 2.324 31.03 2.527 0.03 4 108.96 2.52 100.0 1.933 .587 .00285 .00139 5.71 2.783 37.15 2.051 0.07 6 109.45 2.56 98.9 1.870 .690 .00277 .00164 5.54 3.280 43.79 1.690 0.11 11.1 110.83 2.66 96.3 1.728 .932 .00258 .00224 5.16 4.470 59.74 1.150 0.21 22.2 114.45 2.95 91.0 1.453 1.497 .00218 .00361 4.36 7.220 96.40 0.604 0.50 33.3 119.25 3.38 85.0 1.213 2.163 .00184 .00528 3.68 10.560 141 0.348 0.93 Conditions: Exhauster Capacity EC = 2000 ACFM, THW = Ts = 108°F, Psat = 2.45 "HgA
The analysis can proceed, independent of steam load or number of tubes that make up the tube bundle, until tubes start to become removed from the condensation process as a result of a stagnant zone being initiated outside the ARS. At that point, Ts must be determined from individual tube steam load derived from the percent of tubes lost and a newly computed ∆Tlm and TTD determined from circulating water temperature rise in tubes located in the active tube region. The method is presented elsewhere.(1)
The first column is an arbitrary selection of the number of tubes lost in the stagnant zone. The next column is the selected or calculated steam temperature followed by the associated saturation pressure or total condenser pressure. The fourth column is estimated vapor temperature values caused by subcooling in the ARS or stagnant zone that will eventually result in a calculated value of AIL, column 11.
With subcooling being Ts - Twv, the lower temperature of Twv determines pwv from steam tables. Subtracting pwv from Ps provides pa, column 6. The density of water vapor, ρwv, also found from

Session 4: Performance Improvement
4-21
steam tables, corresponds to Twv. The density of air is found from the ideal gas law for gas mixtures given by:
ρa = pa ρwv / 0.622pwv (1)
The mass flow rates of water vapor and air within the ARS or stagnant zone are determined from the relationships:
.
m wv = ρwv × EC (2)
and
.
m a = ρa × EC (3)
The total mass flow rate of gases being removed from the condenser is the sum of equations (2) and (3).
The amount of AIL in SCFM units is determined by dividing .
m a by the standard density of air (0.0749 lb/ft³) at atmospheric pressure and standard temperature. The mass ratio of water vapor to air is determined either by the corresponding density ratio or the mass flow rate ratio.
The amount of subcooling is taken in one degree steps until the mass ratio of 3.2 is reached. From that point on, the percent of tubes lost due to a stagnant zone was selected and the necessary AIL rate to produce this loss was determined.
Results
Figure 3 presents the computational results of the theoretical model showing that an AIL threshold value of 25 SCFM is expected for an exhauster having a total volumetric capacity of 2000 ACFM at the condenser design pressure PD = 2.45 "HgA. Above 25 SCFM, the condenser will experience excess back pressure.
Figure 4 shows the total pressure and partial pressures of water vapor and air as a function of AIL that can exist in the stagnant zone or the ARS as measured in the vent line. In the design pressure saturation region, below 25 SCFM, it should be noted that pwv and pa exactly exchange, with pwv having a negative slope and pa having a positive slope of equal value as AIL increases. While pa continues to rise above the threshold value of AIL at the same slope, the water vapor slope decreases, allowing condenser pressure to rise.
Also shown is the water vapor to air mass ratio versus AIL. These values are directly measured by the RheoVac instrument representing the value obtained at the vent line entrance. The theoretical values are shown by the solid line, representing a best fit to data of Table 1. The large open circles represent actual data obtained in an operating condenser (JEA Northside Plant, Unit #3). The model used for the analysis was a reconfiguration of the actual condenser, arranged for analytical simplicity.

Session 4: Performance Improvement
4-22
The total condenser pressure vs AIL theoretical curve also shows actual plant data for comparison. The theoretical data points from Table 1 are represented by a best fit solid line and again, the large open circles represent measured plant data.
Conclusions
It is believed that the condenser pressure saturation level for AIL values below a threshold value has been described comprehensively for the first time. The method employed utilizes a new condenser model first presented last year by Harpster(1,2). The work reported here represents another suitable result, supporting the validity of the model for its acceptance as being useful in understanding condenser performance and to serve as a tool toward improving condenser design.
Many condenser design improvements have been identified(3,4) and are patented or patent pending. It is now understood that subcooled regions of the condenser, one of which was described herein, are responsible for all dissolved oxygen (DO) and other dissolved gases in hotwell condensate, unless there exists a direct AIL into the condensate suction line or contaminated condensate return draining directly into the hotwell. Removal of high DO condensate at the source is part of these improvements.
Acknowledgments
The author wants to thank Mr. Fred Maner of JEA and the management of JEA for establishing a cooperative research program whereby JEA benefits from utilization of an Intek supplied RheoVac SENTRY condenser diagnostics system on Unit Number 3 and Intek is permitted to perform tests in support of research goals. The work provided here and elsewhere would not have been possible without this cooperative program.
Nomenclature
.
m a mass flow rate of air (lbs/min)
.
m wv mass flow rate of water vapor (lbs/min)
pa air partial pressure "HgA
pwv steam (wter vapor) partial pressure "HgA
Ps condenser steam pressure "HgA
Ao threshold air in-leak value
AIL air In-leakage, SCFM ft3/min | STP
ρa density of air lbs/ft3
ρwv density of water vapor lbs/ft3
EC exhauster capacity, ACFM ft3/min | operating
PD condenser design pressure or

Session 4: Performance Improvement
4-23
pressure saturation value "HgA
Ts steam temperature F
∆Tlm logarithmic mean temperature difference, F
TTD terminal temperature difference F
Twv water vapor temperature F
References
1. Harpster, J.W. “An Impact on Plant Performance from Advanced Instrumentation” presented at the 44th Annual ISA POWID Industry Symposium; Orlando, FL (July 7-13, 2001). [conference paper]
2. Harpster, J.W. “On Understanding the Behavior of Non-condensables in the Shell Side of Steam Surface Condensers” presented at the ASME International Joint Power Generation Conference; New Orleans, LA (June 4-7, 2001). [conference paper]
3. Harpster, J.W. “Reducing Dissolved Oxygen Under Conditions of High Air Ingress” presented at the ASME International Joint Power Generation Conference; Phoenix, AZ (June 24_26, 2002). [conference paper]
4. Harpster, J.W. “Increased Availability from Improved Condenser Design” presented at the Tenth International Conference on Nuclear Engineering; Arlington, VA (April 14-18, 2002). [conference paper]
5. Henderson, C.L. and Marchello, J.M. "Film Condensation in the Presence of a Non-Condensable Gas" Journal of Heat Transfer, Vol. 91, pp. 447-450, August 1969. [publication]
6. Harpster, J.W. “Advancements on a Comprehensive Theory of Condensers” presented at the 45th Annual ISA POWID Industry Symposium; San Diego, CA (June 3-6, 2002). [conference paper]
7. Harpster, J.W., Harpster, B.K. and Maner, F. “Turbine Exhaust Excess Back Pressure Reduction” presented at the FOMIS 38 th Semiannual Conference - Optimizing Station Performance; Clearwater Beach, FL (June 7-10, 1999). [conference paper]

Session 4: Performance Improvement
4-24
Figure 1 Condenser Pressure vs. Air In-Leakage
Figure 2 A Typical Small, Simple Condenser
100Ao
DP
PEX
2
4
0
Pres
sur e
("H
gA)
Air In-Leakage (SCFM)
S
ARS
FeedWaterHeater
AIL
ToExhauster
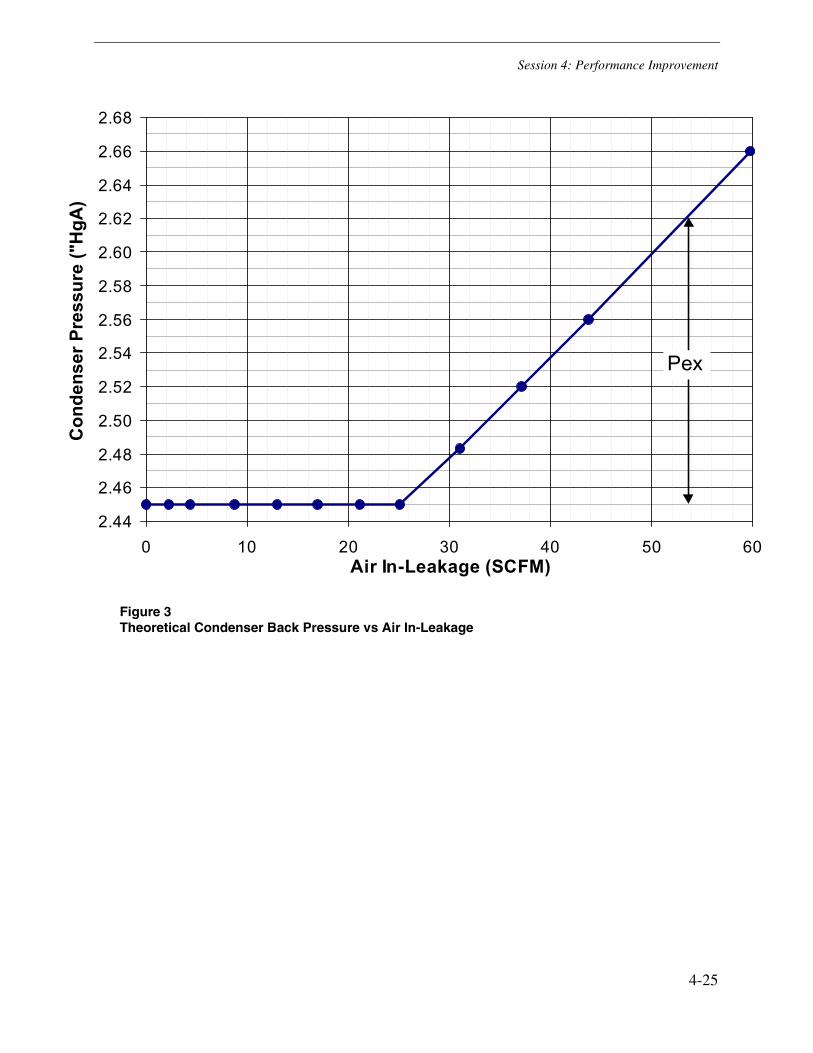
Session 4: Performance Improvement
4-25
Figure 3 Theoretical Condenser Back Pressure vs Air In-Leakage
2.44
2.46
2.48
2.50
2.52
2.54
2.56
2.58
2.60
2.62
2.64
2.66
2.68
0 10 20 30 40 50 60Air In-Leakage (SCFM)
Con
dens
er P
ress
ure
("H
gA)
Pex

Session 4: Performance Improvement
4-26
Figure 4 Pressures and Mass Ratio vs AIL
0.0
0.2
0.4
0.6
0.8
1.0
1.2
1.4
1.6
1.8
2.0
2.2
2.4
2.6
2.8
3.0
3.2
3.4
3.6
3.8
4.0
0 10 20 30 40 50 60 70 80 90 100 110 120 130 140Air In-Leakage (SCFM)
Pres
sure
("H
gA)
0
2
4
6
8
10
12
14
16
18
20
22
24
26
28
30
32
34
36
38
40
Wat
er V
apor
to A
ir M
ass
Rat
io
o
o
o
o
o = Condenser Measurement From RheoVac and Plant Instruments
ooo
o
Condenser Pressure, PS
Water Vapor Partial Pressure, pwv
Air Partial Pressure, pa
ρρρρwv/ρρρρa
Session 4: Performance Improvement
4-27
EXPERIENCES WITH STEAM CYCLE AIR INGRESS AT ALLIANT ENERGY FOSSIL PLANTS:
CASE STUDIES DOCUMENTING THE EFFECTS OF AIR IN-LEAKAGE ON STEAM PLANT OPERATIONS
Wesley A. Kaufman, P.E. Alliant Energy – IP&L
P.O. Box 351 Cedar Rapids, IA 52406-0351
Abstract
A variety of performance and operational problems result from air ingress to components operating under a vacuum. This paper will describe experiences with identifying, locating and correcting a variety of excessive air in-leakage incidents for condensers, turbines, and condensate heaters.
The methods for discovering the source of in-leakage will be described along with their ability to correctly identify the source of air in-leakage. Methods used at Alliant Energy include tracer gas detection (helium and SF6), ultrasonic devices, infrared thermography, visual/streamers and performance monitoring.
Several case studies have been accumulated over the past decade and will be presented to document the effects, potential and actual costs associated with excessive air in-leakage. These examples include:
• Turbine/condenser expansion joint failure
• Corroded thermowell on extraction steam line
• Tube cleaning to confirm air in-leakage
• Turbine inner shell casing leakage
• Loss of seal water on air evactor
• Vacuum relief valve/diaphragm leaking
Additionally, several temporary maintenance actions will be provided to minimize tramp air online.
Session 4: Performance Improvement
4-28
Effects of Air In-Leakage on Condenser Performance
Air is an effective insulator. The accumulation of air in the condenser decreases the effective heat transfer surface by blanketing the condenser tubes and reducing the heat rejection capability of the condensing steam. Air binding will also exist in areas of stagnant or reduced flow or if there is insufficient air removal capacity. Air binding is generally not recognized by plant operators, unless problems with the air removal system are known to exist.
The symptoms for excessive air leaks to the steam condenser are
• increased exhaust steam temperature,
• increased condenser terminal temperature difference,
• increased condenser absolute pressure, and
• high levels of dissolved oxygen in condensate.
For a properly operating condenser, some air in-leakage is normal through turbine shaft seals, packing, and startup vents from feedwater heaters. When a significant leak appears, it is easier to diagnose when the performance parameters of the condenser make an abrupt change. An example may be after an outage, trip, or other transient operation.
The effects of air in-leakage are similar to other condenser related problems, such as obstructed tube sheets or dirty condenser tubes. Because of the size of the vacuum boundary of the condenser, which can include low pressure heaters, air ejection system, steam line drains, steam traps, vents, extraction steam lines; it is usually easier to eliminate other variables as the source of performance degradation.
Detecting Air In-Leakage Sources
Tracer Gases
Once air in-leakage is deemed to be higher than normal or excessive, cycle isolation becomes the primary goal. If large surface area components or systems can be eliminated from the search, it becomes easier to narrow the list of suspect areas for testing. Tracer gas techniques using sulfur hexafluoride (SF6) or helium are best used to check large areas or plant sections. These systems have evolved from cart-mounted units to smaller, more manageable and reliable units. Alliant Energy has achieved positive results with these two types of tracer gas systems. We have used an SAIC (now part of Conco) SF6 system and a Varian helium detection system. Both systems have their merits, but the major criteria for successful tracer gas testing is ease of use of the test system.
The need for pure hydrogen for the SF6 system was offset by that system’s capability to provide time stamped, hard copy output using a strip chart recorder. The SF6 gas dispensing system we used was also easier to transport around plant equipment. The helium test kit is easier to setup

Session 4: Performance Improvement
4-29
and calibrate, more compact and reliable, but the helium dispensing unit is heavier and bulky. The output display for the helium monitoring system requires test personnel to constantly monitor the LCD display and manually log responses- time of day and results.
The best situation occurs when the source of leakage can be isolated to a single component or area using a tracer gas. However, some areas contain multiple small air leaks, numerous individual joints, and connections may not be accessible. Locating specific leaks in such circumstances can be difficult. For instance, leaks that draw air through conduits created by insulation and piping configurations become mysterious, non-repeatable and nebulous (see Case Study IV). If insulation can be removed to expose physical joints, bolt holes, flanges, etc., the chances for positively locating leaks dramatically increases.
For truly large leaks, the amount of air movement may also make detection by tracer gas difficult. Excess tracer gas will migrate towards the leak, causing tracer gas to accumulate in the condenser or at the point of measurement. The background levels of tracer gas increase over the course of testing and reduce the effective sensitivity of the measuring instrument as the environment becomes saturated.
Ultrasonic Listening Devices
Once an area of leakage is identified, ultrasonic detection is the second level of inspection. Ultrasonic leak detection is based on amplification of high frequency noise generated by turbulent flow. Most pressurized leaks can be easily located using an ultrasonic listening device. Vacuum leaks tend to be harder to find using ultrasonic inspection techniques, since sound waves travel “line of sight.” The sound level, measured in decibels (dB), will be higher on the low pressure side of a leak, which is inside the condenser. On the high pressure, atmospheric side of the leak, air is moving at a slower bulk velocity as it converges at the suction point of the leak.
Blocking techniques are usually required. Blocking is a term that describes shielding the suspect area under investigation as much as possible from background noise. Nearly any cloth can be used to insulate areas from neighboring steam leaks, bearings, motor noise, etc. Once a leak is identified, ultrasonic devices are the easiest tool for verifying proper corrective maintenance has been performed.
A drawback for ultrasonic detection is sound saturation over extended distances due to reflections. In such cases, a telescoping extension can be made for the ultrasonic device to extend the reach and capability of the machine and focus the sound sensitive microphone. At Alliant Energy, we built a simple probe using 1” and 7/8” PVC pipe with stiff Tygon tubing taped at one end. At the other end of the pipe, a piece of tubing was taped to form a transition piece to convey the measured sound to the acoustic amplifier of the ultrasonic probe. All parts were acquired at a local hardware store for under $14.

Session 4: Performance Improvement
4-30
Infrared Thermography
Infrared thermography has not been beneficial to this author in locating vacuum leaks. Typically, the mass flow of ambient air moving toward a leak does not have sufficient mass to cool the surface temperature of the steel pressure boundary. Also, the ambient temperatures in turbine rooms connected openly to boiler areas can be higher than the saturation temperature within the condenser, negating any possibility of cooling at the point of the leak.
Visual Indications
At some point, over time, excessive leakage will cause tracings of dust/dirt on equipment surfaces which provides a visual indication of the leak location. Narrowing down the location can be done by covering large areas with cloth, gasket material or paint until the measured leakage drops significantly. The bolted waterbox flanges at one of our facilities has been coated with an epoxy paint to create an additional seal.
For very large leaks, a very light, strong streamer of material can be tied to a pole and used in a manner similar to that used by operators tracking down high pressure steam leaks. Silk has been used since it is very strong, light and less susceptible to melting/burning than polyester blends. Due to the tight quarters between the turbine-generator pedestal and condenser, the pole should be light and stiff. Bamboo sticks are preferred, being lighter than metal stock and also non-conductive.
Care should be taken to ensure that the streamer is tightly attached to the extension. If the material is drawn in through a penetration, the net effect of its retrieval is to further open the crevice by cleaning the accumulation of dirt/oil that may have formed. This will be seen as a further increase in DO levels or a decrease in condenser vacuum. The additional effect of contaminated bulk material on the condensate pumps and piping cannot be assumed to be beneficial.
Temporary Modification/Correction
For small diameter leaks at low temperature, almost any pliable material will have a positive effect on reducing air in-leakage. To verify leaks, duct tape is suitable as a temporary packing unless the size of the hole exceeds the open area between the fiber reinforcement of the tape. For larger leaks, the use of rags, leather or gasket material can be taped in place or condenser vacuum may be sufficient to hold them in place. If the unit cannot be shutdown for repair, there are numerous room temperature vulcanized (RTV) sealants that will adhere to surfaces and maintain an improved seal for days to months. Additional torquing of bolts has generally been frowned upon due to the risk of bolt, flange or gasket failure.
Case Studies: Effects of Condenser Air In-Leakage
The following case studies show how different technologies were applied to locate air in-leakage under several different plant configurations.
Session 4: Performance Improvement
4-31
Case Study I: Turbine/Condenser Expansion Joint Failure
Location/Unit: Kapp Unit 2 – 200MW Westinghouse, Single Reheat
Background: Mississippi River is ultimate heat sink, once through cooling, admiralty condenser tubes. Unit was experiencing secondary symptoms of high air in-leakage, running with high dissolved oxygen over an extended period of time. This was increasing their boiler tube failure rate, requiring high chemical usage, and resulting in condenser operation above 2.4 in.HgA after condenser tube cleaning.
Testing: Air in-leakage tests using SF6 and Helium showed very little indications around valves, fittings, pump shafts. Low pressure turbine shaft areas showed tracer gas response at the high pressure turbine end and higher, but inconsistent responses at generator end of the low pressure rotor- swinging two orders of magnitude. Visual inspection showed an accumulation of dirt on the vertical wall of the condenser neck and air movement. Tracer gas technique was not able to determine if shaft seal was the source. During a maintenance outage, a visual inspection of the turbine expansion joint was performed inside the condenser and no cracks or breakage was reported. An ultrasonic test was done to assist in locating the gas response. Due to the tight location between the concrete turbine pedestal and condenser- 8inches- a telescoping stethoscope was constructed from plastic tubing and duct tape. Ultrasonic readings were recorded along the dogbone at 1-foot intervals, detecting a noticeable sound level increase 8ft from the edge. A bamboo stick was used with a strip of silk to determine if the leak was significant. The cloth was drawn in to the leak/condenser and difficult to remove. A larger cloth was used and drawn completely off the bamboo rod.
Results: Backpressure immediately dropped from 3.26 in.HgA to 2.48 in.HgA (see Figure 1). Dissolved oxygen dropped from 40 to 29 ppm, and continued to decrease. Review of construction prints revealed the presence of a steam shield running around the interior of the expansion joint, which was mistaken for the actual joint (Figure 2). Removal of the steam shield revealed 12-inch long crack in the expansion joint material. Reduction in backpressure resulted in a 563 Btu/kwh reduction in station heat rate. Coal procurement was reduced by approximately 42,000 tons/year of coal, for a savings of $675,000 annually.
Case Study II: Corroded Thermowell on Extraction Steam Line
Location/Unit: Sixth Street Unit 7 – 20MW GE, Automatic Extraction
Background: At low loads, both circulating water pumps were required to hold condenser vacuum below 4.0 in.HgA. Station has Fisher ProVOX DCS, but limited data historian capabilities. Operator experience was that backpressure had increased over a short period of time, and vacuum was difficult to achieve on startup. Normal operation was requiring more and more circulating water to maintain vacuum.
Testing: First thing was to review available hourly log data to determine how long problem had been present. Unit responds to export steam demands and dispatch, so steady state data was not available for all operating loads. To verify pump capability, the pumps were switched one at a

Session 4: Performance Improvement
4-32
time with no effect on backpressure. Conclusion was that both pumps were supplying similar flows, could not determine whether performance was degraded, but pumps did not appear to be the problem. Tracer gas measuring system was not available, so ultrasonic gun was used to listen for leaks. Prior to leak-checking, one of the operators remarked that the TTD on 11th stage heater was high, over 10ºF, when it was usually less than 3ºF. Listening ultrasonically around the 11th stage heater, the extraction line at the last elbow before heater shell flange was very noisy. Closer inspection revealed the noise was coming from an empty thermowell on the extraction line. To check whether the thermowell was the source of the disturbance, it was covered with a glove and strong suction was present. Experimenting with the ultrasound device and the thermowell showed that covering the thermowell greatly reduced the sound level. It also caused the control room operators to experience temperature and pressure swings at the exhaust hood.
Results: Although this turbine is small in capacity, it is dispatched as must run due to export steam demands. Covering the thermowell reduced the condenser vacuum from 4.12 in.HgA to 0.97 in.HgA, and reduced the 11th stage heater TTD from 13ºF to 0ºF. Generator output increased from 9.7 to 11 MW. Due to the warmer condensate temperature, heat rate dropped 1,558 Btu/kw-hr for a savings to the company of over $225,000 annually.
Main Steam Before After Units Pressure 652 653 psig
Temperature 758 759 degF Enthalpy 1380.9 1381.4 btu/lb
Flow 260 259 kpph Extraction
Pressure 223 224 psig Temperature 597 592 degF
Enthalpy 1318.0 1315.2 btu/lb Flow 191 192 kpph
Condensate Temperature 144 177 degF
Enthalpy 112.0 145.0 Btu/lb Flow 69 67 kpph
Backpressure 4.12 0.97 in.HgA Generator 9.72 11.00 MW
GTHR 10,244 8,686 Btu/kw-hr
Case Study III: Tube Cleaning to Confirm Air In-Leakage
Location/Unit: Sixth Street Unit 4 – 20MW GE, Automatic Extraction
Background: Unit output has been decreasing over time, becoming hard to maintain LP exhaust hood temperatures at low condensing section loads. Condenser tubes were mechanically cleaned with no appreciable affect on condenser backpressure or operation. Scheduled overhauls deferred by financial constraints and economy of size.

Session 4: Performance Improvement
4-33
Testing: First thing was to review available log data to determine how long high backpressure problem had been present. Unit responds to export steam and electric dispatch demands, so steady state data was not available for all operating loads. Tracer gas testing was performed on the unit in 1997 and showed three leaks, two of which were corrected. The third leak was the low pressure end turbine shaft. Review of previous outage report (1994) indicated some variances with water seal clearance, and excessive wear of water seal impellar. At the time, it was deemed that the impellar was still suitable for operation. By 1996, a flow meter at the discharge of the steam jet air ejector had been bypassed due to excessive flow. A twin unit was scheduled for condenser tube cleaning, and this unit was also cleaned hoping to reduce operational problems. Further air leakage tracer gas and ultrasonic inspections in 2000 uncovered a ½ inch hole in a drain header to the condenser, similar in size to the leak experienced on Unit 7. Sealing this hole had very little effect on condenser backpressure or turbine cycle performance, although the effect was positive.
Results: Cleaning the condenser tubes removed an average 110 grams of deposit per tube, consisting of calcium (85%) and silicon (15%). The effect on unit operation was mixed- temperature rise of cooling water and condenser backpressure are reduced, but heat rate increased. By process of elimination, air in-leakage was determined to be the problem. This is supported by the small effect of sealing the drain header hole. Also, it is possible that leakage exists in the low pressure extraction steam line, since the 11th stage line is under vacuum. At low condensing section steam flows, the unit experiences high hood temperatures. It is possible that windage from air in-leakage is increasing friction in the last stages of the turbine. A major turbine overhaul has been economically deferred from 2002 budget.
11/13/1999 3/29/2000 Before After Main Steam Cleaning Cleaning Units
Pressure 660 661 psig Temperature 750 760 degF
Enthalpy 1375.8 1381.5 btu/lb Flow 178 187 kpph
Extraction Pressure 216 217 psig
Temperature 554 534 degF Enthalpy 1295.4 1284.4 btu/lb
Flow 106 111 kpph Condensate Temperature 183 182 degF
Enthalpy 151.4 150.1 Btu/lb Flow 72 76 kpph
CW Inlet 61 61 degF CW Outlet 73 68
Vacuum 2.29 1.46 in. HgA Generator 8.3 8.3 MW
GTHR 11,717 12,554 Btu/kw-hr

Session 4: Performance Improvement
4-34
Case Study IV: Turbine Inner Shell Casing Leakage
Location/Unit: Sutherland Unit 3 – 80MW Allis Chalmers, Single Reheat
Background: Following startup after major turbine overhaul, operations noted high exhaust flow from steam jet air ejectors, above 12 inwc and less than 3 inwc prior to outage.
Testing: Tracer gas inspection was performed on the unit with SF6 system. Some minor leaks were detected, but none large enough to account for the high air flow rate at the discharge of the steam jet air ejector. A large, non-repeatable response was recorded along the side of the double flow low pressure turbine. The relief diaphragms and shaft seals were checked repeatedly. The response on the strip chart was never the same. The response was never quick, but often of low magnitude. The response was generally a gradual increase in recorded tracer gas concentration with a slow decay rate, similar to detecting a saturated gas condition within the condenser or around the measuring device.
It was finally noted that the highest response level occurred when the tracer gas was blown into gaps in the insulation skirting around the low pressure turbine. While the unit was online, the skirting was removed to expose the turbine pedestal and all instrument penetrations around the lower turbine shell. The gradual response continued, and the tracer gas response was again most pronounced when gas was blown under the center insulation skirt that band the center of the low pressure turbine. When the insulation topping the LP shell was removed, two bolted manways were exposed. At this point, the ultrasonic gun was used to listen around the hatches and definite responses were present. To verify that leaks were present, duct tape was used to cover the bolt holes and both noise levels and SJAE flow decreased. With tape on 1/3 of the bolts and around the flange, SJAE flow dropped to 3.3 inwc. Due to the high temperature, the duct was removed and high temperature RTV was used in conjunction with the ultrasonic device until no sound was detected.
Results: Air inleakage in to the outer shell of the turbine entered the lowest pressure heater extraction steam line, causing the heater to become air bound. Isolating the extraction steam line improved operation of the heater, but did not effect the volume of air leakage. Sealing the air leaks on the manway improved both heater operation and condenser efficiency.
Sutherland Unit 3 6-Aug-97 As-found As-left Parameter 6:30 10:30 Units SJAE Exhaust +12.7 0.9 in.H2O Cond From 3E LPH 140 168 OF Condenser Pressure 1.98 2.09 in.HgA M.S. Flow 607 598 kpph Generator Output 78 79 MWgross
Heat Rate 9,086 8,844 Btu/kwhr -242 Btu/kwhr Annual Fuel Savings $120,395

Session 4: Performance Improvement
4-35
Case Study V: Loss of Vacuum Pump Seal Water
Location/Unit: Burlington Unit 1 – 200MW GE, Single Reheat
Background: Operators have noted that the Nash vacuum pumps on the condenser did not appear to be working. Unit has two vacuum pumps, one small and one large, that were both required to maintain vacuum on condenser. Pumps scheduled for replacement, engineering requested performance test to determine appropriate sizing.
Testing: To measure each pumps capability, they were run individually. Pump A was stopped in order to test pump B. Prior to restarting pump A, pump was primed (refilled). After starting pump A, condenser backpressure dropped significantly.
Results: Centrifugal vacuum pumps was void of working fluid. Properly filling pump resulted in decrease of backpressure by 0.75 inHg (Figure 8).
Case Study VI: Leaking Rupture Disk on Low Pressure Heater
Location/Unit: Ottumwa Unit 1 – 675 MW GE, Single Reheat
Background: FWH 102 (2nd lowest pressure condensate heater) terminal temperature difference was high, from 25 ºF to +40 ºF. Operators have noted the flash evaporator rupture disk has leaked in the past. Online performance monitor showed this heater’s Target TTD should be less than 20 ºF.
Testing: Performance monitoring software was activated in July, 2001. Shift supervisors and control room operators have been reviewing display screens and parameter values for point verification. Shift supervisor noted deviation of feedwater heater 102 TTD, and checked extraction line and vessel for integrity. Suspecting the rupture disk was leaking, covered the disk with plastic sheeting.
Results: Within thirty minutes of placing the plastic sheeting, TTD dropped from 41ºF to 13ºF. Condensate outlet temperature increased 25ºF and extraction flow to heater increased from 70 kpph to 130 kpph (see Figure 9). Dissolved oxygen in the condensate system also dropped dramatically
Summary
• The most effective tools for locating air inleakage are
– tracer gases for large, broad areas, and
– ultrasonic devices for localized areas of concern.
• Identification of air in-leakage problems is difficult to monitor and quantify, but effects can usually be reduced online due to the low temperature.

Session 4: Performance Improvement
4-36
• As cycle isolation improves, even small air leaks can have a major effect on unit performance.
• The key to a successful air in-leakage reduction effort is persistence.
References
Information on Varian HeliTest system available at www.varianinc.com
Information on FluoroTracer monitor available at www.concosystems.com
Information on UltraProbe ultrasonic test kits available at www.uesystems.com
Information on FLIR thermography equipment available at www.flir.com
Acknowledgements
The author would like to acknowledge the assistance of the following individuals:
Phong Nguyen, Thermal Performance Engineer, for assisting with condenser leak investigation at the M.L.Kapp Generating Station and his air removal investigation at the Burlington Generating Station; and
Kevin Brehm, Shift Supervisor, Ottumwa Generating Station, for investigation and documentation of the flash evaporator rupture disk failure.

Session 4: Performance Improvement
4-37
Figure 1 Kapp Station, Unit 2. Effect of temporarily covering expansion joint tear with cloth.
Figure 2 Expansion joint side view showing steel liner on inside of condenser and mounting detail.

Session 4: Performance Improvement
4-38
Figure 3 Sixth Street Unit 7. As Found conditions for broken thermowell on 11th stage extraction line.
Figure 4 Sixth Street Unit 7. As-left conditions showing effect of plugging broken thermowell.
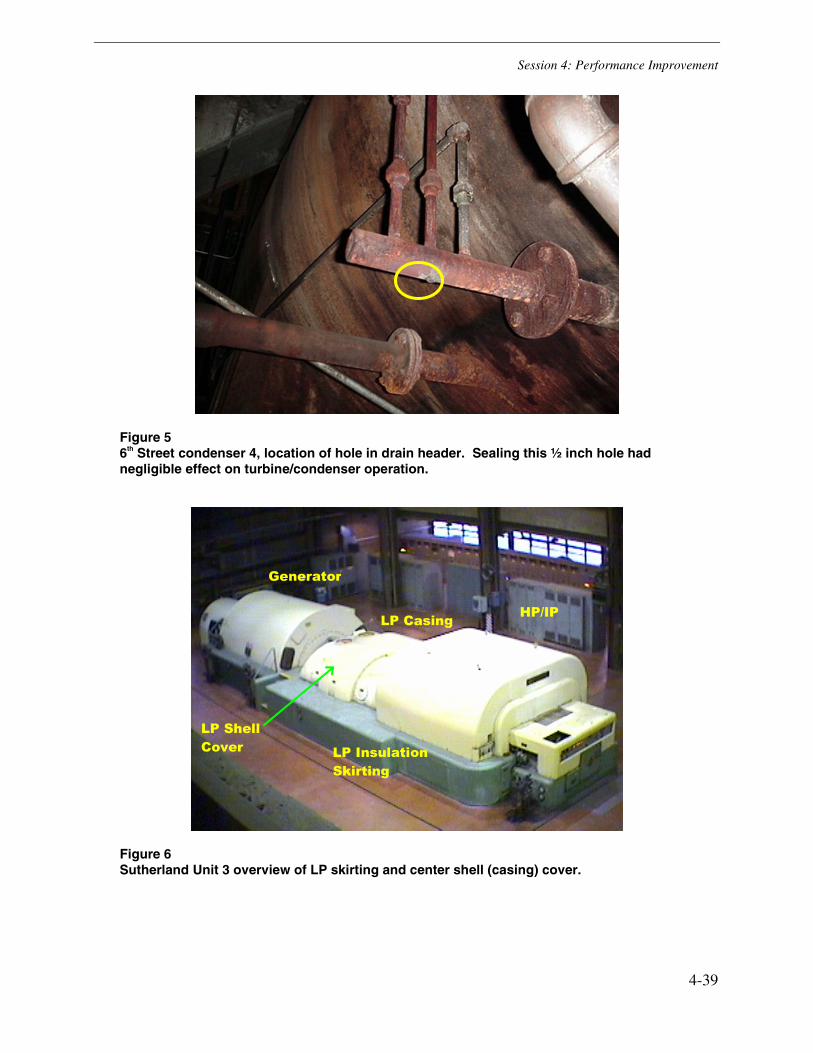
Session 4: Performance Improvement
4-39
Figure 5 6th Street condenser 4, location of hole in drain header. Sealing this ½ inch hole had negligible effect on turbine/condenser operation.
Figure 6 Sutherland Unit 3 overview of LP skirting and center shell (casing) cover.
Generator
HP/IP LP Casing
LP Insulation Skirting
LP Shell Cover

Session 4: Performance Improvement
4-40
Figure 7 Sutherland Unit 3 with center shell cover removed and blanket insulation pulled away. High temperature RTV gasket material (dark) contrasts with insulating blanket and casing.
Figure 8 Burlington Station Unit 1 – Loss of priming seal water in centrifugal vacuum pump.
Burlington Generating Station
10,000
10,250
10,500
10,750
11,000
12:00 12:30 13:00 13:30 14:00 14:30
Btu/
kwhr
1.5
2.0
2.5
3.0
3.5
Net Unit Heat Rate Condenser Backpressure

Session 4: Performance Improvement
4-41
Figure 9 Ottumwa Station, Unit 1. Temporary correction of bad flash evaporator rupture disk under vacuum. Rupture disk covered with plastic sheet.


Session 4: Performance Improvement
4-43
THE MEASUREMENT OF CONDENSER LOSSES DUE TO FOULING AND THOSE DUE TO AIR INGRESS
Richard E. Putman Dr. Joseph W. Harpster Technical Director President Conco Consulting Corp. Intek Inc Verona, PA, 15147 Westerville, OH, 43082
Abstract
The performance of a steam surface condenser is negatively affected not only by tube fouling but also by the presence of excessive amounts of air within the shell side of the condenser. However, because they have similar effects, it has been the custom to lump their costs together. Clearly, if the contribution of each to operating cost could be estimated with some confidence, then maintenance decisions would become focused on whether it is more important to clean the condenser or to remove the source of an air inleakage.
There are two general methods for distinguishing between these two sources of condenser performance degradation: (a) measure the resistance due to fouling and subtract this from the total increase in tube thermal resistance to obtain the increase due to air ingress and (b) estimate the change in tube thermal resistance due to air ingress and subtract this from the total increase in thermal resistance to obtain the increase due to fouling.
For both methods, the frame of reference is an estimate of the total apparent increase in single-tube heat transfer coefficient resulting from these two effects. This can be obtained by calculating the present single-tube heat transfer coefficient using the standard Fourier equation, and comparing it with the single-tube U-coefficient for a clean condenser operating under the same load and cooling water conditions. In both cases, the condenser Performance Factor needs to be applied
One approach to measurement method (a) is outlined in the new ASME Power Test Code PTC.12.2-1998. A variation of this method is embodied in an EPRI/Bridger Scientific report in which the flow through one of the tubes in each pair is also measured.
Measurement method (b) involves calibrating the degradation in performance due to air ingress by injecting known quantities of air or nitrogen and also noting the reading of the flow meter measuring the air removal rate. Subsequently the flow meter can be used to infer the degradation due to air ingress based on the change in air removal rate. Interference with the precision of these methods from “air binding” and “zones of stagnation” are also discussed.
Session 4: Performance Improvement
4-44
Introduction
Tube fouling as well as the presence of excessive amounts of air within the shell side of the condenser both negatively affect the performance of a steam surface condenser. The thermal resistance due to fouling reduces the overall tube heat transfer coefficient. Similarly, the presence of air either reduces the shell side film heat transfer coefficient or, by completely blanketing tubes, reduces the heat transfer area. Unfortunately, because they have similar effects, their cost, measured as the increase in duty over that of a clean condenser, have had to be lumped together. Clearly, if the contribution of each to operating cost could be estimated with some confidence, maintenance decisions would become focused on whether it is more important to clean the condenser or to remove the source of an air inleakage, or both.
To distinguish between the two sources of condenser performance degradation there are two general methods: (a) measure the resistance due to fouling and subtract this from the total increase in tube thermal resistance to obtain the increase due to air ingress and (b) estimate the change in tube thermal resistance due to air ingress and subtract this from the total increase in thermal resistance to obtain the increase due to fouling. Unfortunately, the task has been hampered until recently by a lack of suitable instrumentation. The equipment associated with these two methods, and now available, will be described; as well as the way the data is processed in order to quantify separately the effect of each of these causes of condenser performance degradation.
Condenser Performance Monitoring
Approaches (a) and (b) both require that the current increase in the single-tube thermal resistance due to the combined effects of fouling and air ingress be known. This may be obtained by first calculating the clean single-tube heat transfer coefficient Uref, which is a function of the sum of the wall thermal resistance and the water and steam side film resistances, these being based on the current operating conditions of cooling water inlet and outlet temperatures, tube water velocity and back pressure. This becomes the reference. The principles involved were included in both recent editions of the ASME Power Test Codes for Condensers(1,2).
To obtain the equivalent single-tube value for the fouled conditions, the current value of the effective heat transfer coefficient Uref is calculated using the well-known Fourier equation, as outlined below, this then being modified by the value of the Performance Factor(3) that corresponds to the present value of generated power. The increase in single-tube thermal resistance may then be obtained by subtracting the fouled value from the clean value.
Clean Single-tube Heat Transfer Coefficient - Uref
The thermal resistance to heat transfer of a clean tube consists of three major components:
i. Tube wall resistance
ii Water side film resistance
iii. Shell-side film resistance

Session 4: Performance Improvement
4-45
Note that both (i) and (ii) are referred to the outer tube surface.
i. Tube Wall Resistance
The thermal resistance of the tube wall (Rw) is calculated using the Kern(4) relationship:
=
i
o
m
ow
d
d
k
dR ln
24 (1)
ii. Water-side Film Resistance
The value of the water side film thermal resistance (Rt) is calculated using the Rabas-Cane correlation(5):
=
i
oi
p
td
d
v
d
Ck .R
835.0
165.0
462.0538.0835.0
373.0
04503570ρ
µ (2)
iii. Shell-side Film Resistance
The Nusselt factor (hf) is the condensate film heat transfer coefficient calculated from the properties of water at the saturation temperature that corresponds to the compartmental backpressure, the Nusselt equation being:
25.023
725.0
∆
=T) ( D
g kh
of
f
fµ
λρ (3)
The shell side thermal resistance is1/hf.
Overall Heat Transfer Coefficient - Uref
The overall heat transfer coefficient for a clean tube Rref can be calculated from the values of resistances Rw and Rt and Nusselt factor hf as follows:
ftw
refhRR
U/1
1
++= (4)
Effective Condenser Heat Transfer Coefficient - Ueff
A steam surface condenser used in the Rankine Cycle is essentially a cross-flow heat exchanger. The effective heat transfer coefficient (Ueff) is computed from present steam and water temperatures and cooling water flow rate and, by rearranging the well-known Fourier equation for heat transfer, can be calculated from:

Session 4: Performance Improvement
4-46
A*LMTD
QUeff = (5)
in which
−−−=
outv
inv
inout
TT
TT
TTLMTD
ln
To calculate an accurate value of Ueff requires knowledge of cooling water flow rate, representative values of the inlet and outlet water temperatures, together with the compartmental backpressure. For multi-compartment condensers, especially those operating at different back pressures, this set of information is required for each compartment.
Performance Factor - PF
The design data sheet for a condenser designed in accordance with the Standards published by the Heat Exchange Institute(6) contains information from which the HEI tube bundle heat transfer coefficient UHEI may be calculated. It also contains information to calculate the value of the effective heat transfer coefficient Ueff as well as the design cleanliness factor CFdes, this being:
HEI
effdes
U
UCF
*100= (6)
Thus the design cleanliness factor may be thought of as discounting the design HEI tube bundle U-coefficient so as to reflect the operating conditions that will be experienced in practice.
When the thermal resistance method is used to calculate the single-tube heat transfer coefficient, Tsou(3) recommends that the term performance factor be used in place of cleanliness factor. Thus, Performance Factor may be calculated from:
ref
eff
U
UPF 100= (7)
A condenser designed with a cleanliness factor of 85% based on the Heat Exchange Institute method(6) will have an equivalent performance factor of about 74% when the thermal resistance method is used as the reference value. It should also be noted that the performance factor has been found by Putman and Karg(7) to vary linearly with load, or:
PF = a0 + a1 MW (8)
This must be taken into account when evaluating the condenser performance at partial load. A typical plot of Performance Factor vs. load is shown in Figure 1.0 and it is necessary to establish the relationship between Performance Factor (PF) and load when the condenser is clean. To develop equation (8), the unit is run for an hour at steady state at various loads over the normal
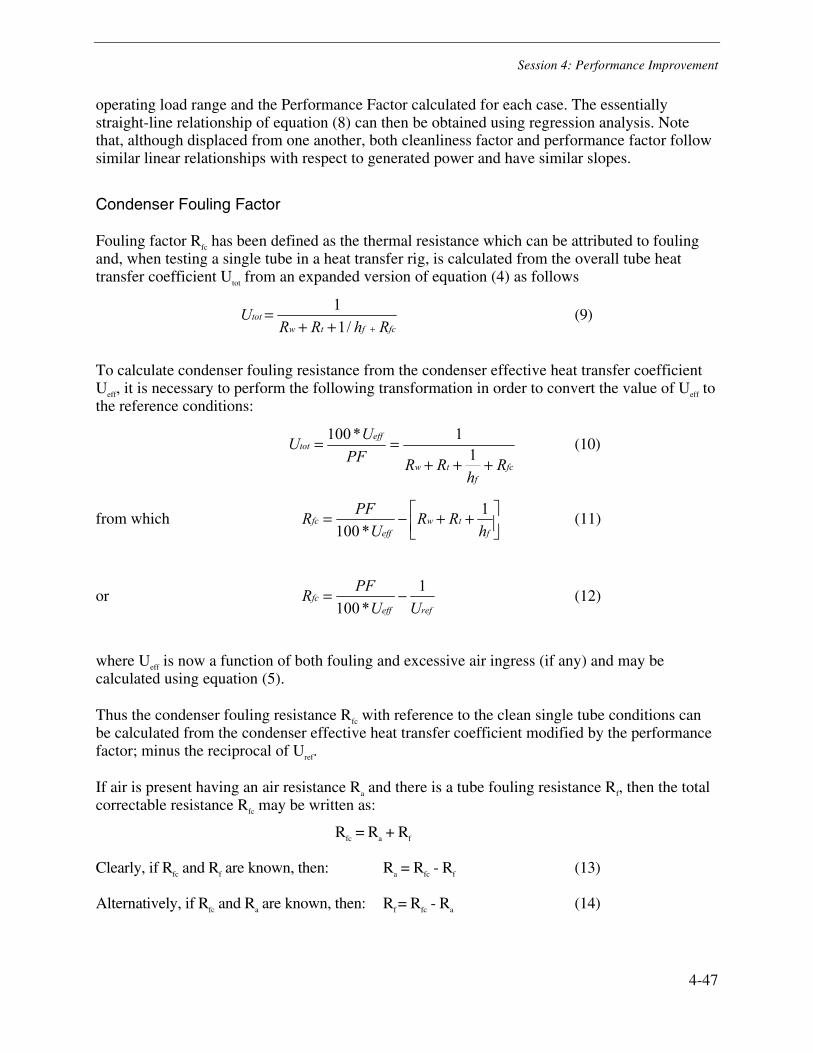
Session 4: Performance Improvement
4-47
operating load range and the Performance Factor calculated for each case. The essentially straight-line relationship of equation (8) can then be obtained using regression analysis. Note that, although displaced from one another, both cleanliness factor and performance factor follow similar linear relationships with respect to generated power and have similar slopes.
Condenser Fouling Factor
Fouling factor Rfc has been defined as the thermal resistance which can be attributed to fouling and, when testing a single tube in a heat transfer rig, is calculated from the overall tube heat transfer coefficient Utot from an expanded version of equation (4) as follows
fcftw
totRhRR
U+++
=/1
1
To calculate condenser fouling resistance from the condenser effective heat transfer coefficient Ueff, it is necessary to perform the following transformation in order to convert the value of Ueff to the reference conditions:
fcf
tw
efftot
Rh
RRPF
UU
+++==
11*100
from which
++−=
ftw
efffc
hRR
U
PFR
1
*100 (11)
or refeff
fcUU
PFR
1
*100−= (12)
where Ueff is now a function of both fouling and excessive air ingress (if any) and may be calculated using equation (5).
Thus the condenser fouling resistance Rfc with reference to the clean single tube conditions can be calculated from the condenser effective heat transfer coefficient modified by the performance factor; minus the reciprocal of Uref.
If air is present having an air resistance Ra and there is a tube fouling resistance Rf, then the total correctable resistance Rfc may be written as:
Rfc = Ra + Rf
Clearly, if Rfc and Rf are known, then: Ra = Rfc - Rf (13) Alternatively, if Rfc and Ra are known, then: Rf = Rfc - Ra (14)
(10)
(9)
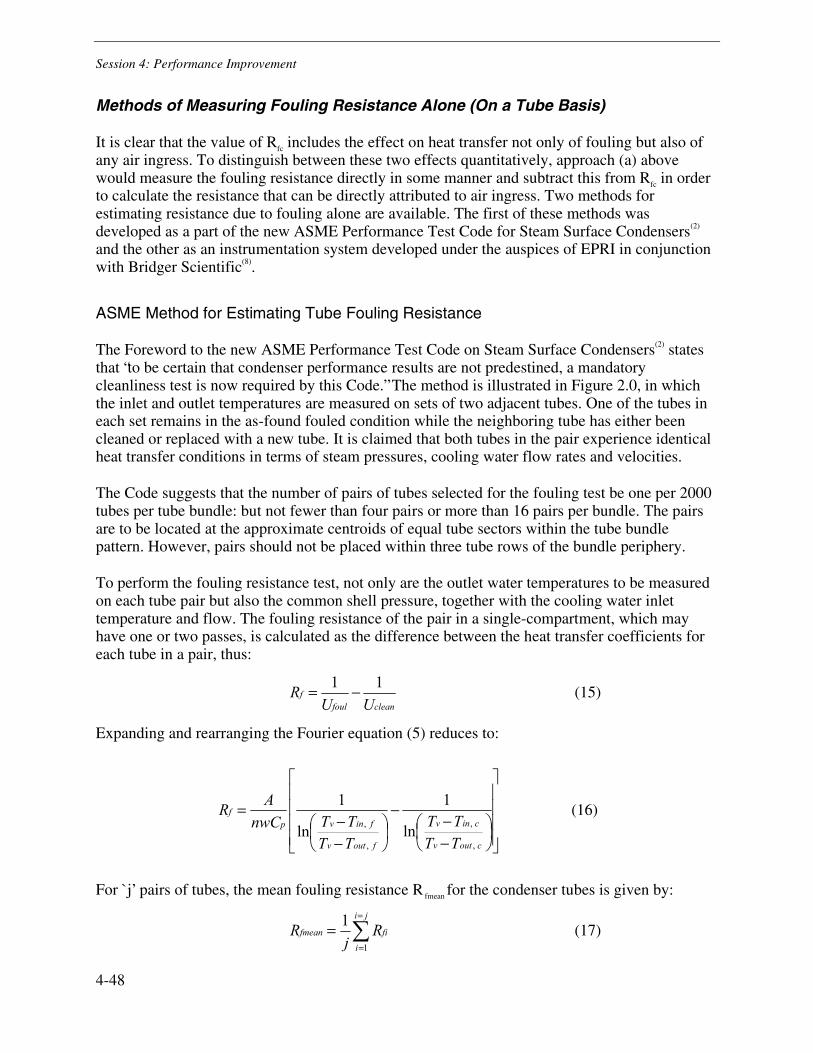
Session 4: Performance Improvement
4-48
Methods of Measuring Fouling Resistance Alone (On a Tube Basis)
It is clear that the value of Rfc includes the effect on heat transfer not only of fouling but also of any air ingress. To distinguish between these two effects quantitatively, approach (a) above would measure the fouling resistance directly in some manner and subtract this from Rfc in order to calculate the resistance that can be directly attributed to air ingress. Two methods for estimating resistance due to fouling alone are available. The first of these methods was developed as a part of the new ASME Performance Test Code for Steam Surface Condensers(2) and the other as an instrumentation system developed under the auspices of EPRI in conjunction with Bridger Scientific(8).
ASME Method for Estimating Tube Fouling Resistance
The Foreword to the new ASME Performance Test Code on Steam Surface Condensers(2) states that “to be certain that condenser performance results are not predestined, a mandatory cleanliness test is now required by this Code.” The method is illustrated in Figure 2.0, in which the inlet and outlet temperatures are measured on sets of two adjacent tubes. One of the tubes in each set remains in the as-found fouled condition while the neighboring tube has either been cleaned or replaced with a new tube. It is claimed that both tubes in the pair experience identical heat transfer conditions in terms of steam pressures, cooling water flow rates and velocities.
The Code suggests that the number of pairs of tubes selected for the fouling test be one per 2000 tubes per tube bundle: but not fewer than four pairs or more than 16 pairs per bundle. The pairs are to be located at the approximate centroids of equal tube sectors within the tube bundle pattern. However, pairs should not be placed within three tube rows of the bundle periphery.
To perform the fouling resistance test, not only are the outlet water temperatures to be measured on each tube pair but also the common shell pressure, together with the cooling water inlet temperature and flow. The fouling resistance of the pair in a single-compartment, which may have one or two passes, is calculated as the difference between the heat transfer coefficients for each tube in a pair, thus:
cleanfoulf
UUR
11 −= (15)
Expanding and rearranging the Fourier equation (5) reduces to:
−−
−
−−
=
coutv
cinv
foutv
finvpf
TT
TT
TT
TTnwC
AR
,
,
,
,ln
1
ln
1 (16)
For `j’ pairs of tubes, the mean fouling resistance Rfmean for the condenser tubes is given by:
∑=
=
=ji
i
fifmean Rj
R1
1 (17)
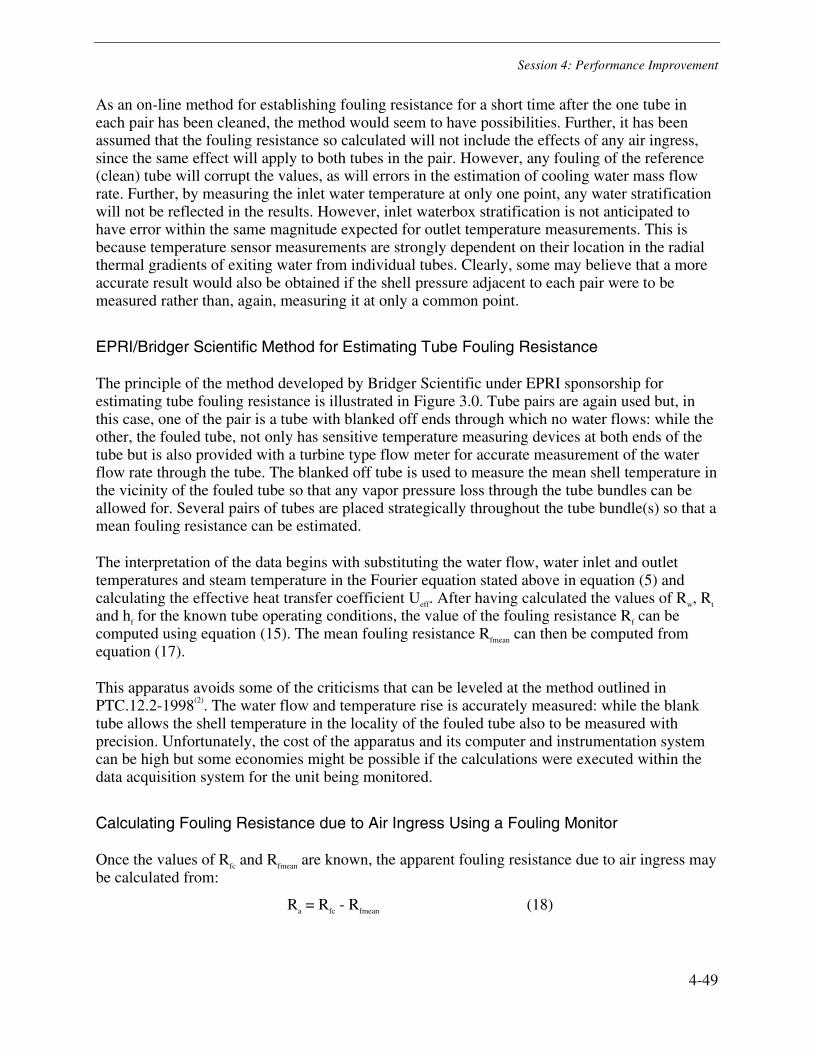
Session 4: Performance Improvement
4-49
As an on-line method for establishing fouling resistance for a short time after the one tube in each pair has been cleaned, the method would seem to have possibilities. Further, it has been assumed that the fouling resistance so calculated will not include the effects of any air ingress, since the same effect will apply to both tubes in the pair. However, any fouling of the reference (clean) tube will corrupt the values, as will errors in the estimation of cooling water mass flow rate. Further, by measuring the inlet water temperature at only one point, any water stratification will not be reflected in the results. However, inlet waterbox stratification is not anticipated to have error within the same magnitude expected for outlet temperature measurements. This is because temperature sensor measurements are strongly dependent on their location in the radial thermal gradients of exiting water from individual tubes. Clearly, some may believe that a more accurate result would also be obtained if the shell pressure adjacent to each pair were to be measured rather than, again, measuring it at only a common point.
EPRI/Bridger Scientific Method for Estimating Tube Fouling Resistance
The principle of the method developed by Bridger Scientific under EPRI sponsorship for estimating tube fouling resistance is illustrated in Figure 3.0. Tube pairs are again used but, in this case, one of the pair is a tube with blanked off ends through which no water flows: while the other, the fouled tube, not only has sensitive temperature measuring devices at both ends of the tube but is also provided with a turbine type flow meter for accurate measurement of the water flow rate through the tube. The blanked off tube is used to measure the mean shell temperature in the vicinity of the fouled tube so that any vapor pressure loss through the tube bundles can be allowed for. Several pairs of tubes are placed strategically throughout the tube bundle(s) so that a mean fouling resistance can be estimated.
The interpretation of the data begins with substituting the water flow, water inlet and outlet temperatures and steam temperature in the Fourier equation stated above in equation (5) and calculating the effective heat transfer coefficient Ueff. After having calculated the values of Rw, Rt and hf for the known tube operating conditions, the value of the fouling resistance Rf can be computed using equation (15). The mean fouling resistance Rfmean can then be computed from equation (17).
This apparatus avoids some of the criticisms that can be leveled at the method outlined in PTC.12.2-1998(2). The water flow and temperature rise is accurately measured: while the blank tube allows the shell temperature in the locality of the fouled tube also to be measured with precision. Unfortunately, the cost of the apparatus and its computer and instrumentation system can be high but some economies might be possible if the calculations were executed within the data acquisition system for the unit being monitored.
Calculating Fouling Resistance due to Air Ingress Using a Fouling Monitor
Once the values of Rfc and Rfmean are known, the apparent fouling resistance due to air ingress may be calculated from:
Ra = Rfc - Rfmean (18)

Session 4: Performance Improvement
4-50
The Measurement of Thermal Resistance Due to Air Ingress
It has been shown, using a model and theory by Harpster,(10, 11) that air does not get trapped on tubes throughout the condenser but forms a steam rich region and an air rich region within the tube bundles. Referring to figure 4.0, the first of these regions is referred to as the “Steam Wind” (SW) region and the second is referred to as the “Stagnant” (S) region (10). It was also shown, by Henderson, that if the mass ratio of steam vapor to air on a condensing tube is greater than 300 the heat transfer coefficient is greater than 90% of its Ufoul condition. If this ratio falls below 3, then the heat transfer coefficient will fall below 10% of its Ufoul value. In operating condensers, the mass ratio can vary, practically, between 50,000 to 0.2 depending on location in the tube bundle.(11)
In a normal operating condenser having an exhauster removing air in equilibrium with the in-leakage, sufficient to prevent condenser excess back pressure, the fraction of tubes essentially unaffected by this air is greater than 96%. Further, air inleakage nearly 6 times the above pump capacity value, sufficient to cause an additional 0.9"HgA in the measured condenser pressure, will still have nearly 50% of its tubes, located in the outer regions of the tube bundle unaffected in their measured heat transfer coefficient because the mass ratio in this region is greater than 1,000. These results are provided in the referenced literature.(11)
Another perturbing feature about condensers explained by Harpster(12, 13) is air binding. This phenomena results from condenser design that promotes steam flow completely surrounding a tube bundle subsection and having no escape for scavenged air. Although these problems can be overcome by design (patent pending) unawareness of their affects can give rise to a lack of comfort regarding utilization of recorded data.
For these reasons, measurements using tube pairs should consider the above model result, regardless of the array pattern recommended by the ASME test code. Figure 4 shows what might be expected in a typical single shell, single pass condenser. The tube bundle consists of three subsections separated by a vertical crevice between Subsection I and II where the air removal section (ARS) vent line is placed. Another separation is caused by a horizontal condensate tray above Subsection III. The condensate tray provides drainage of the condensate from the above subsections to the sides of the tube bundle, from which condensate is allowed to fall into the hotwell. These trays prevent inundation of tubes in the lower part of Subsection III.
The anticipated air bound (AB) regions, which, out of necessity grow in size and then collapse, are shown in the tube bundle subsections at their most likely locations considering the bundle configuration. Also shown is the "S" region having a high concentration of air. This "S" region near the ARS is variable in size with air in-leakage and can be changed by admitting more or less air (or an inert noncondensable gas like N2) at fixed flow rates into the condenser. Between each adjustment, about 20 minutes is needed to establish equilibrium. A typical relationship between the apparent increase in fouling resistance due to air ingress and the air removal rate is shown in Figure 5.0.
Suggested tube pair areas to measure the effects of tube fouling without the impact of air are shown as rectangular areas containing an "X" and labeled with "SW" indicating these areas are in the "Steam Wind" region of the tube bundle.
Session 4: Performance Improvement
4-51
Suggested tube pair areas for measuring the combined heat transfer coefficient of air and fouling or just fouling are shown as square areas with an "X". These areas for a tight condenser i.e., for air in-leakage below the excess back pressure threshold pairs, will measure the effect of tube fouling only. With the addition of noncondensables, the stagnant zone will expand into these areas and the pairs will record the effects of increased air concentration on the heat transfer coefficient of these tubes.
Baselining and Controlling Air Inleakage
Following installation of the tube pairs the amount of background air in-leakage, water vapor to air mass ratio and exhauster capacity for noncondensables must be measured. These are easily determined using a Multi-Sensor Probe (MSP) measurement system, shown in Figure 6.0. This system permits simultaneous measurement of air and water vapor flowing from the condenser in each vent line penetrating the shell. Typically, there are more than one shell and these may have the same or different pressures. Each vent line must be measured independently for air in-leakage, since the amount of noncondensables are generally different in each line.
The total amount of background air should be well below the exhauster capacity and the condenser pressure at the pressure saturation valve. If not, a leak search should be made and leaks repaired before starting tests. Under this condition all tube pairs should be measured as a baseline. It is expected that all pairs should have the same determined Ufoul values. If not these values will serve as a bases for determining changes in measured heat transfer coefficients Ufoul,air upon introduction of air.
Air may be introduced into the condenser at any convenient location. It should be recognized that this air will be scavenged by the steam to the closest ARS section. If uniform effects are desired the air should be introduced on the turbine floor near the LP turbine exhaust annulus.
A convenient means to introduce air, or other gas, is to pass it through a rotameter adjusted for atmospheric pressure at its inlet. If air is used, a control valve in the line between the top of the rotameter and the shell is all that is needed. The plant air being drawn in through the bottom opening of the rotameter should be free of steam and large amounts of dust or dirt to prevent error in readings.
Estimating Tube Fouling Resistance from Air Removal Rate
Once the condenser has been calibrated to provide an estimate of the apparent increase in combined fouling resistance due to air ingress Ra, the current value of Ra may be obtained from the plot shown in Figure 5, the thermal resistance due to tube fouling then being estimated from:
Rf = Rfc - Ra (19)

Session 4: Performance Improvement
4-52
Distribution of Condenser Losses
Using a Newton-Raphson model of the condenser/turbogenerator subsystem, Putman and Saxon(9) showed how total condenser losses in MBTU/h (Loss) can be calculated from the present condenser duty minus the condenser duty calculated if the condenser were clean and operating under the same cooling water inlet temperature and flow conditions and the same generated power. If the fuel cost is $Cost ($/MBTU), then the distribution of these losses between fouling and air ingress can be accomplished as follows:
$ Cost of Fouling: fc
ff
R
RLossCostLoss *$= (20)
$ Cost of Air Ingress: fc
aa
R
RLossCostLoss *$= (21)
Conclusions
Tube fouling and air ingress have a similar effect on condenser performance degradation. However, methods for distinguishing between these two causes of performance degradation have been restricted by the absence of suitable instrumentation. Three methods for quantifying the contribution of these two sources of performance degradation are outlined as well as how they can be converted to the equivalent economic loss.

Session 4: Performance Improvement
4-53
Nomenclature
a0, a1 = Constants in equation (8) A = Total tube surface area for compartment ft2
Cp = Specific heat of water BTU/(lb.°F) CF = Cleanliness factor % di = Inside diameter of condenser tubes inches do = Outside diameter of condenser tubes inches Do = Outside diameter of condenser tubes feet g = Acceleration due to gravity
= 417*10E+06 (ft-lb mass) / (h.h.lb force) hf = Nusselt condensing film conductance BTU/(ft2.h.°F) k = Thermal conductivity of cooling water BTU/(h.ft2.°F) kf = Thermal conductivity of condensate film BTU/(h.ft2.°F) km = Thermal conductivity of tube material BTU/(h.ft2.°F) LMTD = Log mean temperature difference °F MW = Generated power MW n = Number of passes in compartment Q = Heat transfer rate to cooling water BTU/h PF = Performance Factor % Ra = Thermal resistance attributed to air ingress °F/(BTU/(ft2.h)) Rf = Thermal resistance due to fouling for tube pairs °F/(BTU/(ft2.h)) Rfc = Increase in thermal resistance due to both fouling and air
ingress °F/(BTU/(ft2.h)) Rfmean = Mean fouled thermal resistance of tube pairs °F/(BTU/(ft2.h)) Rt = Thermal resistance of cooling water film °F/(BTU/(ft2.h)) Rw = Thermal resistance of tube wall °F/(BTU/(ft2.h)) Tin = Cooling water inlet temperature °F Tout = Cooling water outlet temperature °F Tv = Vapor saturation temperature °F Uclean = Heat transfer coefficient calculated from clean tube pairs BTU/(ft2.h.°F) Ueff = Overall condenser effective heat transfer coefficient BTU//(ft2.h.°F) Ufoul = Heat transfer coefficient calculated from fouled tube pairs BTU/(ft2.h.°F) UHEI = Heat transfer coefficient based on HEI tube bundle value BTU//(ft2.h.°F) Uref = Reference heat transfer coefficient based on
sum of clean-tube thermal resistances BTU/(ft2.h.°F) v = Cooling water velocity ft/s w = Mass cooling water flow through compartment water boxes lb/h ∆T = Temperature gradient across condensate film °F λ = Latent heat of condensate BTU/lb µ = Viscosity of cooling water lb/(h.ft) µf = Viscosity at condensate film temperature lb/(h.ft) ρ = Density of cooling water lb/ft3 ρf = Density of condensate film lb/ft3

Session 4: Performance Improvement
4-54
References
1. Code on Steam Condensing Apparatus, ASME PTC 12.2-1983, 1983, publ. ASME, New York, NY.
2. Performance Test Code on Steam Surface Condensers, ASME PTC.12.2-1998, 1998, pub. ASME, New York.
3. Tsou, John L., New methods for Analyzing Condenser Performance, Proceedings 1994 EPRI Heat rate Improvement Conference, Baltimore, MD, May 1994.
4. Kern Donald Q., Process Heat Transfer, 1990 Edition, publ. McGraw Hill, New York.
5. Rabas, T.J. and Cane, D., An Update of Intube Forced Convection Heat Transfer Coefficients of Water, Desalination, Vol.44, 1983, pp.109-119, publ. Elsevier, Holland.
6. Standards for Steam Surface Condensers, 9th. Edition, 1995, Heat Exchange Institute, Cleveland, OH.
7. Putman, Richard E. and Karg, Dale C., Monitoring Condenser Cleanliness Factor in Cycling Plants, Proc. IJPGC, 1999, San Francisco, July 26-29, 1999, publ. ASME, New York.
8. Instrumentation of the On-Line Condenser Fouling Monitor, EPRI Technical Report TR-109232.
9. Putman, R. E., and G. E. Saxon, Jr. “A Newton-Raphson Method for Calculating Condenser Performance Based on ASME Single Tube Heat Transfer Data,” Proceedings, EPRI Heat Rate Improvement Conference, Dallas, TX, 1996, May 22–24, pp. 17-1 to 17-24.
10. Harpster, J.W. “An Impact on Plant Performance from Advanced Instrumentation” 44 th Annual ISA POWID Industry Symposium, Orlando, FL (July 7-13, 2001).
11. Harpster, J.W. “On Understanding the Behavior of Non-condensables in the Shell Side of Steam Surface Condensers” ASME, 2001 International Joint Power Generation Conference, New Orleans, LA (June 4-7, 2001).
12. Harpster, J.W. “Increased Availability from Improved Condenser Design” ASME, 2002 Tenth International Conference on Nuclear Engineering, Arlington, VA (April 14-18, 2002).
13. Harpster, J.W. "Reducing Dissolved Oxygen Under Conditions of High Air Ingress" ASME, 2002 International Joint Power Generation Conference, Phoenix, AZ (June 24-26, 2002).

Session 4: Performance Improvement
4-55
GENERATED POWER - MW
CLE
AN
LIO
NE
SS
FA
CTO
R -
PE
RC
EN
T
HEI CLEANLINESS FACTOR
ASME PERFORMANCE FACTOR
CHEI = 58.759 + 0.046093 * mw
ASMECF = 43.739 + 0.04745 * MW
WINYAH UNIT #1FIGURE 1.0
CLEANLINESS FACTORS vs. LOAD
Figure 1 Cleanliness Factors vs. Load, Winyah Unit #1
T1
T2f
T2c
ASME METHOD OF ESTIMATING TUBE FOULING RESISTANCEFIGURTE 2.0
COOLING WATER
IN
COOLING WATEROUT
FOULED TUBE
CLEAN TUBE
Ts
Figure 2 ASME Method of Estimating Tube Fouling Resistance

Session 4: Performance Improvement
4-56
T1f
Ts
T 2f
EPRI/BRIDGER METHOD OF ESTIMATING TUBE FOULING RESISTANCEFIGURTE 3.0
COOLING WATERIN
COOLING WATEROUT
FOULED TUBE
PLUGGED TUBEF
IN-LINEFLOWMETER
Figure 3 EPRI/Bridger Method of Estimating Tube Fouling Resistance
S
SW
SW
SW
AB
ABAB
SW
SW
SW
Vent Line
Hotwell
Section IISection I
Section III
CondensateTray
Suggested Tube Pair Areas
Figure 4 Typical Single Shell Single Pass Condenser Configuration

Session 4: Performance Improvement
4-57
AIR INLEAKAGE - SCFM
EQ
UIV
ALE
NT
FOU
LIN
G R
ES
ISTA
NC
E D
UE
TO
AIR
Deg
. F/B
T U/( s
q.ft .
h)
Figure 5 Typical Relationship Between Air Inleakage and Apparent Increase in Tube Thermal Resistance
Figure 6 Multi-Sensor Probe and Output Measurement Data (Courtesy of Intek, Inc.)


5-1
5 SESSION 5: FOULING CONTROL
• SIDTEC Condenser Cleaning for Cooling Water Systems R. Jones, GE Betz J. F. Echols, SIDTEC Services, Inc. S. D. Jones, GE Betz R. Post, GE Betz
• On-Line Automatic Tube Cleaning System and On-Line Self Flushing Debris Filter Kaveh Someah Brackett Green WSA, Inc
• Mechanical Tube Cleaning: A Brief Tutorial George Saxon, Jr. Conco Systems, Inc.


Session 5: Fouling Control
5-3
SIDTEC Condenser Cleaning for Cooling Water Systems
R. Jones, GE Betz, Trevose, PA
J. F. Echols, SIDTEC Services, Inc., Houston, TX
S. D. Jones, GE Betz, Trevose, PA
R. Post, GE Betz, Trevose, PA
Keywords
condenser, tube cleaning, heat rate, performance, oxidizing biocides
Summary
An alternative to on-line sponge ball cleaning systems was commercialized in 1992. The alternative product named SIDTEC is a non-intrusive, on-line mechanical tube cleaning system to maintain steam condenser cleanliness in the absence of oxidizing biocides, gaining over one hundred unit-years of experience. This paper examines the impact of condenser fouling and a couple of case histories for plants using the SIDTEC Condenser Maintenance Program.
Introduction
Power plant regenerative steam system’s heat sink utilize large volumes of water at relatively low pressures to condense steam. The main condenser’s effectiveness is greatly dependent upon the available surface area for heat transfer and that surface’s ability to conduct heat. A significant consideration to the heat transfer surface’s ability to conduct heat is the cleanliness of that surface, commonly referred to as the condenser cleanliness factor. As the condenser’s cleanliness factor is degraded, the efficiency of the steam generation cycle is reduced because the heat sink has become less effective. This results in an additional energy requirement to maintain the same heat cycle. In extreme situations, the heat cycle will become condenser limited. A condenser-limited cycle is one in which the output of the system must be reduced because the condenser is providing excessive backpressure (Figure 1). In this case, increased energy input could result in the forced shutdown of the system due to insufficient condenser vacuum.
Whether condenser tube fouling is causing a cycle to be less than 100% efficient or it is forcing the cycle to be condenser limited, the end result is an increased cost of operation. Reduced efficiency will cause increased fuel costs. Furthermore, a condenser-limited cycle will cause both an increase in fuel costs and a reduction in power production.
Condenser tube fouling can occur as a result of microbiological growth and/or inorganic fouling. Inorganic fouling may be present in the form of settled suspended solids, such as mud and silt, or

Session 5: Fouling Control
5-4
scales formed from inorganic salts and/or silica. The most prevalent means of mitigating such fouling to date is through the use of chemicals; biocides, dispersants, and / or scale inhibitors. In the presence of a variety of conditions, fouling will occur in the absence of a successful mitigation program. After fouling has occurred and is no longer acceptable, remedial action is required. Removal of the foulant can be through either chemical or mechanical means.
Most inorganic scale formation takes place under the cycled conditions of cooling water tower systems and cooling ponds. Organic fouling, caused by microorganisms, microbial slime, macro-organisms, and deposition of suspended solids, may be found in most all systems from cooling towers to large once through condenser cooling systems. In large once through condenser cooling water systems, the most common and most widely used biocides have been oxidizers, chlorine chemistry or bromine chemistry. Silt and mud accumulation on the condenser heat exchanger tubes of these large once through systems have long been problems with which most have learned to live. In these cases, units are allowed to operate at a reduced efficiency until such time that an off-line mechanical cleaning could be performed.
Without any outside influences, oxidizing biocides, chlorine and bromine have limitations associated with their use as effective biocides. These limitations include their deleterious effect on copper bearing alloys (commonly used condenser heat exchanger metallurgy), toxicity to non-target organisms at effective use concentrations, and the inability to penetrate and/or remove microbial slime and inorganic material. Additionally, there is usually an excessive maintenance requirement to the feed equipment of oxidizing biocides due to corrosion and deposition caused by the chemicals themselves. In the past these limitations alone have caused users of oxidizing biocides to seek better solutions to eliminate their dependence on oxidizers.
In more recent years, outside influences such as regulatory agencies and conservation committees have further increased the need for alternatives to oxidizing biocides. Limitations on the total pounds and/or concentration of primary pollutants such as oxidizing biocides and copper have gotten tighter as facility discharge permits are renewed. The expectation is that the trend will continue to be downward. Since oxidizing biocides tend to increase the corrosion rates of copper and copper bearing metals, tighter copper discharge limits will certainly also effect the application of oxidizing biocide programs. Such limitations have forced some oxidizing biocide programs to be designed with less than effective concentrations, duration, and/or frequencies. In some cases, dechlorination practices through the use of chemical reducing agents, such as sulfur dioxide, sodium sulfite, or ammonium bisulfite1, must be employed prior to discharge of the main condenser circulating water to the environment.
Given these limitations, other alternatives to oxidizing biocides have been developed and employed over the years. One of these alternatives, mechanical-cleaning systems may be employed either on-line or off-line.
Reliance on off-line mechanical cleaning to maintain condenser cleanliness has the obvious disadvantage of having to take place off-line. Brushes and scrapers, used on the heat exchanger surfaces, remove microbes, microbial slime, mud, silt, mineral scale, and any other type of insulating matter on the heat transfer surfaces. Brushes have proven to have limited effectiveness depending upon the nature of the deposit while scrapers tend to give the maximum effectiveness often to a fault, as removal of tube metal is not uncommon. Regardless of the off-

Session 5: Fouling Control
5-5
line cleaning systems efficacy, the fact remains that off-line cleanings means loss production days. Additionally, performance is allowed to degrade between cleanings.
On-Line Mechanical Tube Cleaning
Prior to the emergence of SIDTEC® , on-line mechanical cleaning was synonymous with the sponge ball. In these systems, sponge balls are passed through the condenser and collected using a set of collection grates located within the discharge piping of the Unit’s main condenser. The limitations of the on-line sponge ball type cleaning systems are as follows:
• High initial capital cost for equipment and installation
• Extended outage required for installation
• Intrusive equipment requiring shut down to perform preventative and corrective maintenance
• Collection grates increase main circulating water system pressure, impeding system flow potentially causing a negative impact on system performance
• Possible poor distribution of sponge balls depending upon waterbox configuration and sponge ball condition
• Impingement of sponge balls on collection grates and subsequent passing of the same through the grates causing cleaner loss with economic and environmental considerations
Installation of the on-line sponge ball mechanical cleaning systems has been wide spread, with mixed results. The limitations of the sponge ball systems were considered during the development of SIDTEC with the emphasis on cleaning effectiveness and reliability.
Cleaning effectiveness is directly related to the device used for cleaning. The SIDTEC Rocket tube cleaner is composed of two components, the body and the cleaning element (see Figure 2). The body is made of common polymers and provides buoyancy and the proper orientation within the tube. The buoyancy of the body is a design parameter, dependent upon the condenser inlet conditions and the requirements for optimum collection efficiency. The cleaning element, commonly referred to as the skirt, is a flexible disk that makes contact with the full circumference of the tube's inner diameter. The skirt parameters are optimized depending upon the nature of the foulant to be removed. This optimization is accomplished by modifying the skirt’s diameter, thickness, and rigidity.
The skirt is designed such that the outer edge contacts the inner diameter of the condenser tube. The contact area creates a squeegee effect at the point of contact while the tube cleaner moves down the tube. The squeegee effect makes the cleaner closely approximate an off-line scraper without the potential for metal loss. It is this excellent cleaning quality of the SIDTEC tube cleaner which allows it to effectively replace oxidizing and other biocides, as well as, eliminate the need for frequent off-line mechanical cleanings. The SIDTEC tube cleaner effectively removes microbiological growth. Additionally, the SIDTEC tube cleaner effectively removes settled suspended solids such as mud and silt. Given time and the correct number of passes, aggressive type cleaning elements can also remove mineral scales and even silicate-type deposits.

Session 5: Fouling Control
5-6
After the cleaning element design, installation and operation of the injection /collection system was evaluated. The design of the SIDTEC cleaning element lends itself to a recovery concept utilizing skimmer and boom. The development and testing of the cleaning element as well as the collection technology occurred in the late 1980’s.
In 1992, SIDTEC became commercialized, offered as a service, requiring no capital investment at time of installation. In most cases, all parts of the system were external to the plant and the plant's conduits. For multiple plants on a common discharge, a single collection system was utilized for all units. In most cases, penetrations and/or distribution headers, if required, were installed via hot tapping or during scheduled mini-outages. Because all equipment was external and accessible, installation and operation had no impact on the existing dynamics of the current system and/or system design.
CASE HISTORIES
The case histories presented represent SIDTEC On-Line Condenser cleaning programs that provide excellent cleanliness factors without the use of oxidizing biocides.
TXU Experience
The first commercial installation of SIDTEC was at Texas Utilities’ (TU) Martin Lake Steam Electric Station, in East Texas. The station has three each 750 Mw coal-fired supercritical units. Each unit has an associated condenser with condenser tubes composed of 304 stainless steel. Main condenser circulating cooling water is supplied to the plant from a fresh water-cooling pond. For many years oxidizing biocides were used at the plant with limited success. Standard chlorination practices were consistently unable to maintain an acceptable level of condenser cleanliness. During the summer months, elevated lake water temperatures and increased system biofouling had a significant negative impact on the performance of all units at Martin Lake. A manganese type deposit further complicated the fouling mechanism. The oxidizing biocide, required to attempt to control the biofilm growth, further exacerbated the manganese deposition.3
In April of 1992, SIDTEC was installed at the Martin Lake plant while the units remained in operation. While it is well understood that the condenser cleanliness factor can have a tremendous impact on a unit’s performance, it is also well understood that other factors at a steam generating power plant can also have a great impact on unit performance. As inlet circulating water temperature decreases, the impact of the condenser’s cleanliness factor on the unit’s performance declines. A sophisticated plant monitoring station was installed at Martin Lake to insure that all of the required performance monitoring criteria could be accurately collected and properly analyzed. Additionally, on-line video borescope inspections were performed to correlate the data collected with visual observation of the tubes' waterside surfaces. After on-line cleaning was started, unit performance improved dramatically and visual inspections verified that cleaner tube surfaces were obtained.
Since 1992, SIDTEC has been the sole method used to maintain condenser cleanliness at TU’s Martin Lake facility. Unit performance has been significantly improved since converting from oxidizing biocides to SIDTEC. Following the success of the program at Martin Lake, the

Session 5: Fouling Control
5-7
SIDTEC technology is in use at three other TXU coal-fired power plants. At TXU Unit performance was improved while the requirement for oxidizing biocides were eliminated.
PECO Energy Experience
PECO Energy’s Peach Bottom Atomic Power Station, PBAPS, is a nuclear generating station with two each 1200 Mw nuclear powered electric generating units. Main circulating condenser cooling water is supplied from the Susquehanna River. The condenser’s on each Unit have titanium heat exchanger tubes. Tubes constructed of titanium have higher design cleanliness factor requirements than those constructed of yellow metals and stainless steels. Additionally, titanium, much like stainless steel, has no natural biocidal effect due to the toxicity of its corrosion products. Yellow metal corrosion by products do tend to exhibit such a biocidal effect. Hence, achieving and maintaining cleanliness on titanium heat exchange surfaces is much more difficult than attaining the same on yellow metal surfaces.
In previous years, PBAPS would perform an off-line condenser cleaning on each condenser during that unit's corresponding outage. Between outages, sodium hypochlorite, an oxidizing biocide, was added to the condenser cooling water in an attempt to maintain condenser cleanliness at an acceptable level. Chlorine was added to each of three condensers, per unit, in succession. The concentration added to any one condenser was such that the station’s NPDES discharge limit was not exceeded. The Susquehanna River at PBAPS often has high suspended solids, or mud and silt. Additionally, the river periodically has high concentrations of manganese. Chlorination of the circulating water oxidizes the manganese and causes it to deposit on the condenser tubes as a manganese oxide. Initially the deposits are soft and sticky. Over time, chlorination causes the manganese deposit to form a thin tenacious manganese stain. Both the initial deposit and the stain are very insulating, as is the deposited mud and silt.
While chlorine applications at Peach Bottom had some success, the condenser cleanliness trend between outages, twenty-four month period, was absolutely downward. The degrading cleanliness trend was evident in lost production. During outages, inspections revealed that while biofilm contributed to the downward performance trend, a large portion of the deposits on the tubes was inorganic. Much of the deposit consisted of mud, silt, and manganese. Chlorine was consumed, by the organic constituent of these deposits, making it less effective on any biofilm mixed in the matrix. Furthermore, chlorination was a major contributor to the manganese deposition.
In an effort to stop the downward performance trend, Peach Bottom turned to on-line condenser cleaning. Both SIDTEC and sponge ball systems were investigated by the station’s engineering and chemistry departments. SIDTEC was chosen because it had no impact on outage scope and it could be installed with the units on-line. Additionally, the capital and engineering cost required was minimal to that required for three condensers and six conduits with sponge ball injection and collection equipment. Additionally, consideration was given to the superior cleaning ability of the SIDTEC rocket tube cleaner. This superior cleaning ability was demonstrated at a fossil plant on the West Coast of Florida verses plastic plugs during an off-line demonstration.3

Session 5: Fouling Control
5-8
SIDTEC was installed at PBAPS initially only on Unit 3. On-line cleaning started with a modified chlorination practice, which reduce the rate of sodium hypochlorite injection. After the evaluation period, the chlorination on PBAPS Unit 3 condenser was eliminated and replaced by weekly on-line cleanings. After successfully demonstrating that improved condenser cleanliness could be maintained in the absence of chlorination, the decision was made to utilize the existing SIDTEC system to replace chlorination on PBAPS Unit 2 condensers. In 1997, following the Unit 2 outage, chlorination was suspended on Unit 2 and SIDTEC replaced the same.
To date, chlorination is no longer utilized for either Unit’s main condenser. Condenser performance is consistently maintained above that achieved during chlorination. The improvement is attributed to the ability of on-line cleaning to effectively remove biofilm and silt and manganese type deposits. Additionally, manganese deposition is no longer exacerbated by the presence of an oxidizer. Off-line condenser cleanings and the associated cost have also been removed from Peach Bottom’s outage scopes and budgets.
Mississippi Power Co. Experience
Mississippi Power’s Plant Daniel is a coal-fired power plant located on the Pascagoula River. The plant has two each 500 Mw units. The units' were initially designed to utilize once through cooling on their twin shell, dual pass condensers. The condenser tubes were initially constructed of admiralty brass and no chemical biofouling treatment program was required nor employed. The units were designed and installed with a sponge ball cleaning system, however it has been abandoned-in-place due to high operational and maintenance cost. In late 1995, the Unit 1 condenser at Plant Daniel was replaced with a titanium condenser due to degradation of the original admiralty brass metallurgy. While the tube metallurgy was changed, no biofouling treatment provisions were made and no chemical biocides were applied to the system. Initial testing performed during January of 1996, while the condenser was relatively new and still extremely clean, indicated that the retrofitted condenser exceeded design performance specifications for the unit’s turbine.
By May of 1996, condenser performance had significantly degraded and heavy biofouling was found in the condenser tubes. An off-line condenser cleaning was performed and the unit’s performance was restored. A team was formed at the plant to evaluate a means of eliminating this problem.
The possible remedies consisted of either chemical biocides or mechanical cleanings. Mechanical cleanings were chosen. The mechanical options were off-line cleanings (using brushes and/or plugs) and SIDTEC. While off line cleanings using plugs had demonstrated that it could be effective, it had the drawback of taking place off line. During the peak generating seasons, when biofouling would be most prevalent, this presented a real problem. The plant would have to lose generation to clean the condensers during times of high demand for power. Such an option would cause a substantial loss in revenue due to lost generation while the unit was being cleaned. SIDTEC offered a more viable alternative; a mechanical cleaning that could effectively take place without removing the unit from service.
Figures 3 and 4 show the results from the first cleaning of the Unit 1 low-pressure (LP) and high-pressure (HP) condenser over the time period of June 1- July 13, 1998. Unit 1 has 7/8" 18 and

Session 5: Fouling Control
5-9
24 BWG titanium tubes. The data presented is the terminal temperature difference (TTD) and a calculated cleanliness factor based on the HEI method. The intervals of cleaner injection are marked on the graphs by horizontal bars. To better display the impact of the on-line cleaning, load points in a narrow band around the daily “full load” were extracted. This eliminates any zero samples and data points representing lower loads. There is also a gap in the data between 7/2 and 7/6, due to instrumentation problems over a holiday. The graphs of TTD and %Cl show the stepwise change in each of these key condenser performance indicators with each application.
Following the successful application in Unit 1, the first cleaning in Unit 2 occurred between August 12 -14, 1998. Unit 2 also has a twin shell, multi-pressure condenser with 1” 19 BWG 90/10 CuNi tubes. The on-line, condenser cleaning occurred over two days, circulating Rocket tube cleaners through the unit’s existing sponge ball injection ports. During the circulation period, 143,000 passes gave an average of 10.6 passes per tube. Figures 5 and 6 show the condenser performance improvement for the LP and HP condensers.
SIDTEC is the current means of alleviating biofouling on the Plant Daniel Unit 1 condenser. Even on the titanium surface, which is more susceptible to biofouling and heat exchange related problems; SIDTEC is a viable option for biofouling control at Plant Daniel.
Progress Energy Experience
Brunswick is a two-Unit 867 NPR Mw BWR with a once-through cooling water system off the Cape Fear River in North Carolina. In the spring of 1996, during a scheduled refueling outage for Unit 2, the plant installed a foul release coating to the inlet circulating water piping in conjunction with the long term goal of eliminating gaseous chlorine from the site. For the first several months, condenser performance remained adequate while the sponge ball system was operational. As is the case in many BWR’s, malfunctions and routine maintenance of the ball system is problematical due to the radiation exposure for personnel in the area around the condenser. As shown in Figure 7, condenser performance began to degrade throughout the fall as shown by the terminal temperature difference (TTD) increase from a range of 12° -16° F. to a range of 37° - 44° F. In December, condenser backpressure was nearing 3.8” HgA or two inches above design, and inlet water temperature was nearing a yearly low.
The CCW system for this plant has four CCW pumps with four conduits to four waterboxes with an interconnection between the conduits. The maximum CCW flow with four pumps is 1,390 cfs. State restrictions on water withdrawal limit CCW flow to 900 cfs for nine months during the year. During three summer months, flow is allowed to increase to 1150 and 1210 cfs for the two units. In December, chlorination was resumed and flow increased using the fourth CCW pump. This technique improved conditions, reducing condenser backpressure almost 1.5 ” HgA. However, with inlet water temperature due to increase through the spring, the plant made plans to clean the condenser off-line in April to prepare for the summer.
The BetzDearborn team met with plant personnel in January 1997, to discuss using SIDTEC® Rocket™ tube cleaners to restore condenser performance in lieu of an off-line cleaning. Rockets would be injected into the CCW system using the existing sponge ball system ports and recovered in the discharge using the SIDTEC skimming technology.

Session 5: Fouling Control
5-10
Installation of the recovery equipment began on February 25. Figure 8 shows the general arrangement of the skimming boom in the canal. Installation of the recovery system was completed in eight days. The rudimentary system comprised of modified oil spill control boom, a SIDSKIM tube cleaner recovery unit, a self-priming centrifugal pump, lay-flat discharge hose, and a de-watering/storage hopper.
During the condenser cleaning, the inventory of tube cleaners would be manually hauled through security and into the basement to the ball collectors. Each unit has two ball collectors, one each for the “A” and “B” side of the condenser. An average “shot” or load for the ball collector was 3,000 cleaners. Within one to two hours, the entire inventory of 20,000 to 30,000 tube cleaners could be loaded into the ball collector and shot through the condenser.
The time between injection and the discharge flume was about five minutes. Approximately one-third of the cleaners were manually recovered in the concrete flume. The remainder would pass over the weir into the discharge canal to be recovered by the SIDSKIM and pumped back to the de-water/storage hopper. Generally, one cycle would be completed in the morning and one in the afternoon.
On March 5, the first tube cleaners were injected to the B-N and B-S side of the condenser. Figure 9 shows the almost instantaneous response of the condenser to the first load of 3,000.
Referring back to figure 7, the improvement in heat transfer on the “B” side was so rapid, the “A” side TTD was reduced 2-3° F. without any cleaners being circulated through that side. Figure 10 table shows the improvement over the initial three-day circulation period. Gross generation increased approximately 10 Mw.
Hundreds of tube cleaners were seen with material removed from the tube surface packed between the cleaning element and the tube cleaner body. Samples of the material were collected from the tube cleaner bodies and analyzed (See Figure 10).
This analysis is consistent with a silt/biofouling matrix deposit.
The second day of injecting tube cleaners started on the “A” side of the condenser. After three loads, a ball diverter valve became clogged with the remnants of deteriorated sponge balls and prevented further circulation. After plant personnel were able to clean out the valves, Unit 2 was completed on April 9.
Unit 1 was known not to be as fouled as Unit 2. Injection of tube cleaners through Unit 1 took place on March 24-26. Figure 11 shows the TTD and inlet water temperature from January through April 1997.
During the cleaning, far fewer cleaners were recovered with material remaining on the tube cleaner. Instead of the black organic matter found in Unit 2, Unit 1’s material was more reddish-orange, indicative of a higher silt content with less organic matter. During the cleaning, the initial results showed a 2-3º F. reduction in TTD. However, after plotting data over a longer period of time, the data resolution showed an improvement in the 1° F range.

Session 5: Fouling Control
5-11
In conclusion, demonstrable performance improvement was obtained by cleaning a heavily fouled condenser. The BetzDearborn team was able to assemble the equipment and install a functioning on-line tube cleaning system within six weeks of the first meeting, four weeks from a purchase order. Condenser backpressure was reduced from almost 2.6” HgA to less than 1.9” HgA. Net generation increased upwards of 10 Mw.
Conclusion
Oxidizing biocides are the most commonly used biocides in once through cooling applications. However, oxidizing biocides have both environmental and efficacy concerns, especially when applied on the more exotic metallurgies being incorporated into today's condenser designs. The advent of these metallurgies, which are more susceptible to condenser waterside fouling, accompanied by the lowering of oxidizer concentrations on NPDES permits can place many plants designed with once through main circulating water systems in a precarious situation.
Additionally, oxidizing biocides can contribute to waterside deposition when applied in waters that contain manganese. Furthermore, oxidizing biocides have no effect on inorganic muds and silts, which inevitably exist on condenser tubes as a minor or sometimes major portion of the waterside deposition. Hence, while oxidizing biocides do provide some efficacy in the elimination of biofilms in once through systems they are by no means perfect for such applications.
In the past oxidizing biocides have been the solution of choice because the effects of the chemicals on the environment are known and the residuals are easily consumed. Available options were evaluated on a case by case basis as being cost prohibitive; having their own efficacy concerns, or offers greater environmental concerns. The futures optimal solution must be to control the fouling to the maximum extent possible, without oxidizing biocides maintaining maximum plant performance with the minimization or elimination of off-line mechanical condenser cleaning.
BetzDearborn SIDTEC On-Line Mechanical Condenser Maintenance Program offers a viable alternative to both biocides and off line cleanings. The program, as demonstrated by the case histories, provides increased condenser cleanliness over the application of oxidizing biocides. It also eliminates the requirement for corrective off line mechanical cleanings. By doing this, SIDTEC provides better condenser performance resulting in an improved unit heat rate and increased unit production. Improved heat rates translate to reduced fuel costs. Additionally, SIDTEC impacts budgets by eliminating frequent off-line cleanings and their associated cost. SIDTEC can be installed with the Unit on-line without impacting production.
References
1. Betz Handbook of Industrial Water Conditioning. Trevose, PA: Betz Laboratories, Inc., 1991, pp 203.
2. Echols, J.F. and Larry Morris. "A New Approach to On-Line Mechanical Tube Cleaning." in Condenser Technology Conference Proceedings. J. Tsou, Chairperson. EPRI. St. Petersburg, Florida. September, 1993.

Session 5: Fouling Control
5-12
3. Echols, J.F. and Jones, R. "Five Years Operating Experience with the SIDTECOn-Line Mechanical Condenser Tube Cleaning System." in 58th Annual International Water Conference Proceedings. J. Schubert, Chairperson. Engineer's Society of Western Pennsylvania. November 1997.
0204060
80100120140160
180200
Hea
t Rat
e Im
pact
Back Pressure
Aux Pow er
LP Turbine Eff
Excess Air
HP Turbine Eff
IP Turbine Eff
Makeup %
Unburned Carbon
Feedw ater Inlet T
Coal Moisture
Flue Gas Temp
Steam Temp
Reheat Temp
Figure 1 Relative Impact of Condenser Fouling on Heat Rate (Btu/kW-Hr)

Session 5: Fouling Control
5-13
Figure 2 SIDTEC Rocket tube cleaner
Figure 3 Unit 1 HP Condenser Performance, June 1 - July 13, 1998
7.1 8.2
9.7
80%
92% 87%
(2.0)
-
2.0
4.0
6.0
8.0
10.0
06/
01/
98
06/
05/
98
06/
08/
98
06/
10/
98
06/
11/
98
06/
16/
98
06/
17/
98
06/
29/
98
07/
01/
98
07/
02/
98
07/
09/
98
Term
inal
Tem
pera
ture
Diff
eren
ce
(TTD
)
70%
80%
90%
100%
110%
120%
130%
140%
Con
dens
er C
lean
lines
s (%
Cl)
HP TTD
HP %Cl
Cleanings

Session 5: Fouling Control
5-14
Figure 4 Unit 1 LP Condenser Performance, June 1 - July 13, 1998
Figure 5 Unit 2 HP Condenser Performance, August 12 -14, 1998
3.8
5.6
7.2
113% 156% 128%
(4.0)
(2.0)
-
2.0
4.0
6.0
8.0
06/0
1/98
06/0
5/98
06/0
8/98
06/1
0/98
06/1
1/98
06/1
6/98
06/1
7/98
06/2
9/98
07/0
1/98
07/0
2/98
07/0
9/98
Term
inal
Tem
pera
ture
Diff
eren
ce
(TTD
)
90%
110%
130%
150%
170%
190%
210%
230%
250%
Con
dens
er C
lean
lines
s (%
Cl)
LP TTD
LP %Cl
Cleanings

Session 5: Fouling Control
5-15
Figure 6 Unit 2 LP Condenser Performance, August 12 -14, 1998
-10
0
10
20
30
40
50
10/2
4/96
11/7
/96
11/2
1/96
12/5
/96
12/1
9/96
1/2/
97
1/16
/97
1/30
/97
2/13
/97
2/27
/97
3/13
/97
3/27
/97
4/10
/97
4/24
/97
Term
inal
Tem
pera
ture
Diff
eren
ce (D
eg F
)
40.0
50.0
60.0
70.0
80.0
90.0
100.0
110.0
120.0
130.0
140.0
Inle
t Wat
er T
emp
(Deg
F)
A-N
A-SB-N
B-S
CW T
Clean "B" Boxes
Clean "A" Boxes
Figure 7 Terminal Temperature Difference, Oct ‘96 - April ’97
8.3
10.7
16.0 95%
78%
58% 6.0
8.0
10.0
12.0
14.0
16.0
18.0
8/1
2 0
:34
8/1
2 7
:14
8/1
2 1
3:54
8/1
2 2
0:34
8/1
3 3
:14
8/1
3 9
:54
8/1
3 1
6:34
8/1
3 2
3:14
8/1
4 5
:54
8/1
4 1
2:34
8/1
4 1
9:14Te
rmin
al T
empe
ratu
re D
iffer
ence
(T
TD)
40%
50%
60%
70%
80%
90%
100%
110%
120%
Con
dens
er C
lean
lines
s (%
Cl)
LP TTD
LP %CL
Clnr Circ

Session 5: Fouling Control
5-16
Figure 8 Boom arrangement in discharge canal
790
795
800
805
810
10:003/3/97
22:003/3/97
10:003/4/97
22:003/4/97
10:003/5/97
22:003/5/97
10:003/6/97
22:003/6/97
Gro
ss G
ener
atio
n (M
w)
1.50
1.75
2.00
2.25
2.50
2.75
3.00
Con
dens
er B
ackp
ress
ure
("H
gA)
MwBP
Begin Cleaning
Figure 9 Initial response of condenser to on-line tube cleaning

Session 5: Fouling Control
5-17
Performance Improvement Start Back Pressure Inlet Water Terminal Temperature Difference (°F.) 3/5 (”HgA) Temp (°F.) B-N B-S A-N A-S 08:45 2.56 60.6 33.1 28.4 17.9 19.3 14:45 2.13 61.6 19.4 21.1 15.0 16.8 3/7 12:50 1.90 60.6 15.5 18.3 14.0 12.9 Primary Composition Loss on ignition 29% Silicon, SiO2 22% Sodium Chloride, NaCl 10% Phosphate, P2O5 1% Iron, Fe2O3 17% Manganese, MnO2 4% Sulfate, SO3 1% Aluminum, Al2O3 12% Magnesium, MgO 3% Calcium, CaO 1% This analysis is consistent with a silt/biofouling matrix deposit.
Figure 10 Performance Improvement and Deposit Analysis
0
5
10
15
20
25
30
1/24/97 2/7/97 2/21/97 3/7/97 3/21/97 4/4/97 4/18/97
Term
inal
Tem
pera
ture
Diff
eren
ce (d
eg F
)
40
50
60
70
80
90
100
110
Inle
t Wat
er T
empe
ratu
re (d
eg F
)
A-NA-SB-NB-SCW T
Clean 3/24 - 3/27
Add 4th CCW Pump
Figure 11 Condenser performance, CP&L Brunswick Unit 1 Jan-April, 1997

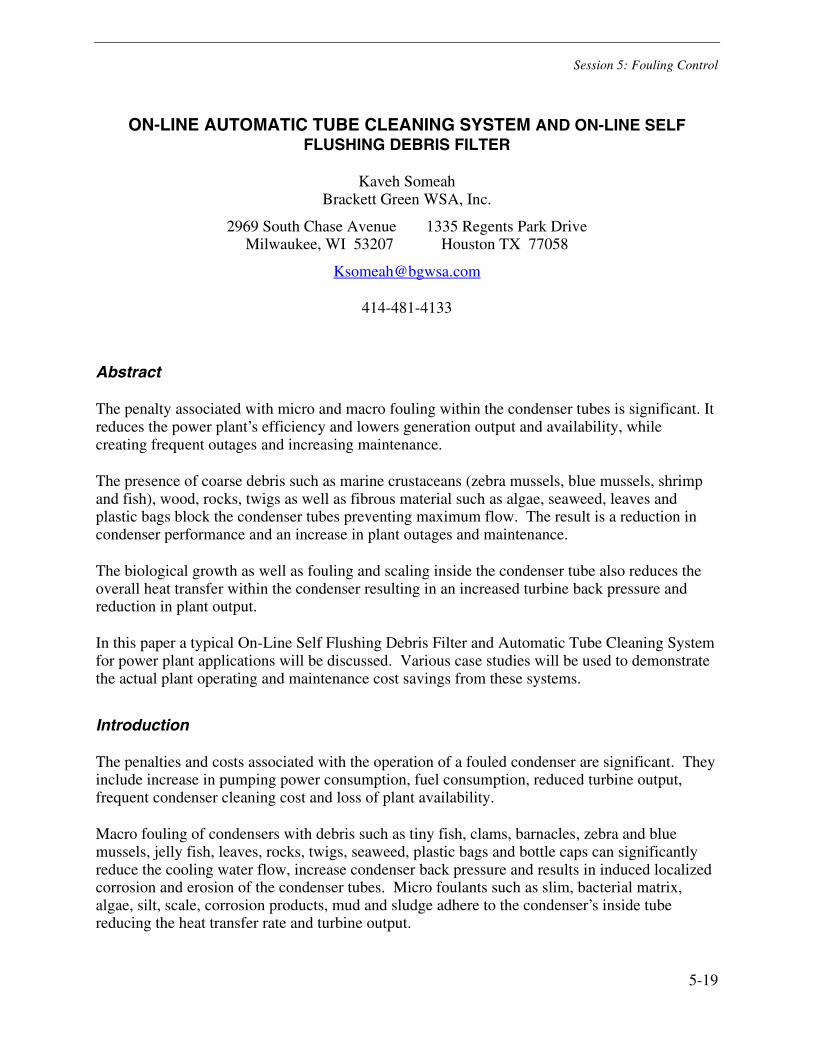
Session 5: Fouling Control
5-19
ON-LINE AUTOMATIC TUBE CLEANING SYSTEM AND ON-LINE SELF FLUSHING DEBRIS FILTER
Kaveh Someah Brackett Green WSA, Inc.
2969 South Chase Avenue 1335 Regents Park Drive Milwaukee, WI 53207 Houston TX 77058
414-481-4133
Abstract
The penalty associated with micro and macro fouling within the condenser tubes is significant. It reduces the power plant’s efficiency and lowers generation output and availability, while creating frequent outages and increasing maintenance.
The presence of coarse debris such as marine crustaceans (zebra mussels, blue mussels, shrimp and fish), wood, rocks, twigs as well as fibrous material such as algae, seaweed, leaves and plastic bags block the condenser tubes preventing maximum flow. The result is a reduction in condenser performance and an increase in plant outages and maintenance.
The biological growth as well as fouling and scaling inside the condenser tube also reduces the overall heat transfer within the condenser resulting in an increased turbine back pressure and reduction in plant output.
In this paper a typical On-Line Self Flushing Debris Filter and Automatic Tube Cleaning System for power plant applications will be discussed. Various case studies will be used to demonstrate the actual plant operating and maintenance cost savings from these systems.
Introduction
The penalties and costs associated with the operation of a fouled condenser are significant. They include increase in pumping power consumption, fuel consumption, reduced turbine output, frequent condenser cleaning cost and loss of plant availability.
Macro fouling of condensers with debris such as tiny fish, clams, barnacles, zebra and blue mussels, jelly fish, leaves, rocks, twigs, seaweed, plastic bags and bottle caps can significantly reduce the cooling water flow, increase condenser back pressure and results in induced localized corrosion and erosion of the condenser tubes. Micro foulants such as slim, bacterial matrix, algae, silt, scale, corrosion products, mud and sludge adhere to the condenser’s inside tube reducing the heat transfer rate and turbine output.
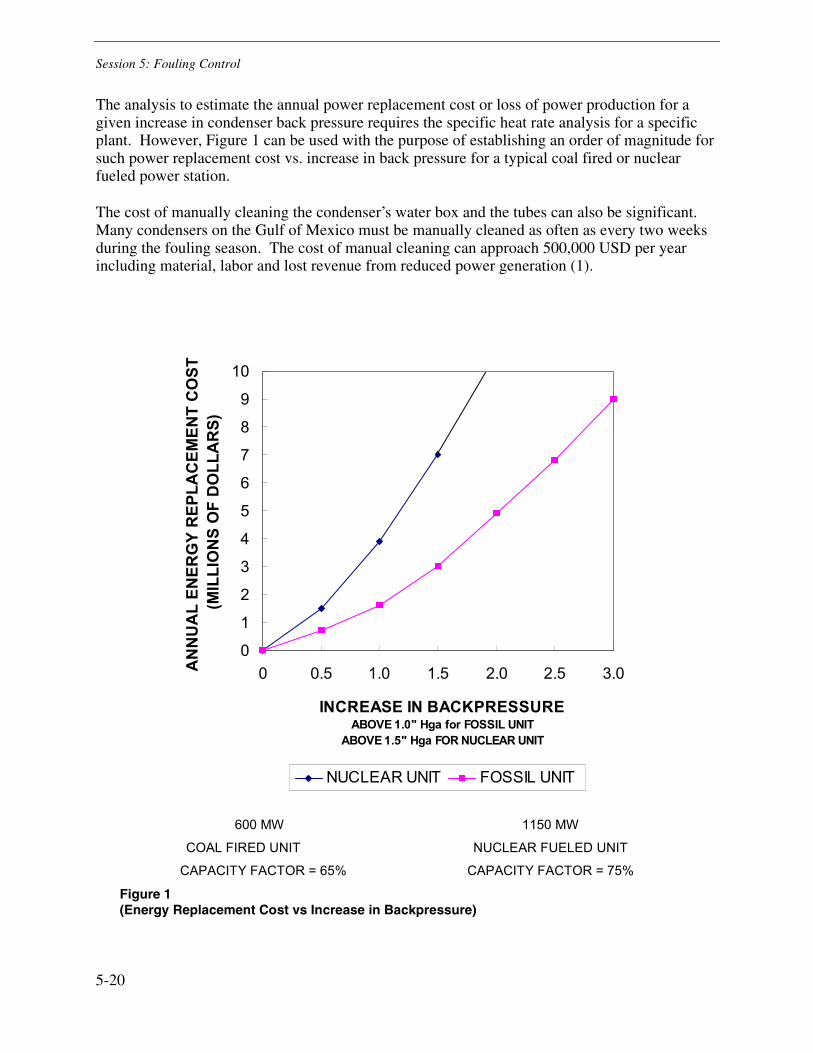
Session 5: Fouling Control
5-20
The analysis to estimate the annual power replacement cost or loss of power production for a given increase in condenser back pressure requires the specific heat rate analysis for a specific plant. However, Figure 1 can be used with the purpose of establishing an order of magnitude for such power replacement cost vs. increase in back pressure for a typical coal fired or nuclear fueled power station.
The cost of manually cleaning the condenser’s water box and the tubes can also be significant. Many condensers on the Gulf of Mexico must be manually cleaned as often as every two weeks during the fouling season. The cost of manual cleaning can approach 500,000 USD per year including material, labor and lost revenue from reduced power generation (1).
600 MW 1150 MW
COAL FIRED UNIT NUCLEAR FUELED UNIT
CAPACITY FACTOR = 65% CAPACITY FACTOR = 75%
Figure 1 (Energy Replacement Cost vs Increase in Backpressure)
0
1
2
3
4
5
6
7
8
9
10
0 0.5 1.0 1.5 2.0 2.5 3.0
INCREASE IN BACKPRESSUREABOVE 1.0" Hga for FOSSIL UNIT
ABOVE 1.5" Hga FOR NUCLEAR UNIT
AN
NU
AL
ENER
GY
REP
LAC
EMEN
T C
OST
(M
ILLI
ON
S O
F D
OLL
AR
S)
NUCLEAR UNIT FOSSIL UNIT
Session 5: Fouling Control
5-21
Various methods for debris removal and off-line and on-line cleaning systems are available and are used by various plants. The off-line cleaning systems often employ the use of hydro blasting techniques, scrapers, cutters, vibrators, water lances, chemical cleaning, nylon or metallic bristle brushes, etc. All the mentioned methods are manually applied and require periodic extended and costly plant shutdowns. Furthermore, since the condenser operates for long periods of time between each manual cleaning cycle, the fouling initiates and the tubes remain in fouled condition, reducing the condenser’s performance and adversely affecting the plant’s heat rate.
A typical installation for an On-Line Automatic Tube Cleaning System and On-Line Automatic Self Flushing Debris Filter with respect to the condenser and the cooling water inlet and outlet flow is shown in Figure 2.
Figure 2 (A Self Flushing Debris Filter & Automatic Tube Cleaning System)
On-Line Self Flushing Debris Filter
Bar screens, trash rakes and travelling band screens is the first line of defense against the incoming debris with the cooling water intake flow. However debris which passes through or is carried over by screens as well as debris growth such as zebra or blue muscle and fish within the cooling water tunnel between the screen and the condenser often accumulate within the condenser water box or inside the condenser tubes.
Installing an On-Line Automatic Self-Flushing Debris Filter at the condenser inlet nozzle or within the cooling water inlet pipe can eliminate the debris accumulation within the condenser (See item 6, Figure 2). Several types of filters are available, including the turbulence, multi chamber, backwash, hydro cyclone, volute and the pressure relief type. The latest and the most effective technology used over the last twenty years have been the pressure relief type.

Session 5: Fouling Control
5-22
The “pressure relief backwash type filter” uses the water from the clean side to relieve, remove and discharge the accumulated debris from the filter system.
The basic structure for a typical debris filter of this type is shown in figure 3.
Figure 3 (Typical Components of a Pressure Relief Backwash Type Filter)
The filtering screen element is housed within a filter body with the same diameter as the cooling water supply line (See item 1, Figure 3). The filter screen could be in the shape of a cone, half circle, dome or a flat screen depending on the manufacturer. The filter screen opening size is designed to trap the debris and retain it within the screen area only allowing water without any debris to pass through to the condenser. A typical cone and a half circle type debris filter is shown in Figure 4.
Figure 4 (A Cone and Half Circle Type Debris Filter)

Session 5: Fouling Control
5-23
The differential pressure across the screen element is continuously monitored (See item 9, Figure 3). Once it reaches the preset value; the rotor drive motor is actuated (See item 6, Figure 3) while the debris discharge valve is opened (See item 3, Figure 3). The rotor begins to operate at a low speed while covering a segment (See item 2, 3 & 4, Figure 3) of the screen and the collected debris. The lower pressure in the debris discharge pipe and rotor housing causes a reverse flow of a small portion of the filter water through the filter screen element. This flow reversal results in backwashing and removing the debris from the filter screen and directing it to the debris discharge pipe that is often connected to the condenser cooling water return line (See item 5, Figure 3).
Figure 5 demonstrates the complete debris accumulation, cleaning and removal cycle.
Figure 5 (Debris Filter Prior and After a Cleaning Cycle)
As reported by PSI Energy, the plant operates four (4) turbine driven boiler feed pumps for Unit 1 and Unit 2, each unit rated at 500 MW. The main condenser is equipped with backwashing capability, however cleaning the auxiliary condensers requires shutting down the boiler feed pump and opening and cleaning the condensers. During such a cleaning cycle the generating capability of the plant was limited. According to the plant from 1993 to 1996, it was necessary to perform such cleanings on average of 120 times per year. The annual plant power generation loss due to auxiliary condenser shut downs from 1993 to 1996 has been over 2,000 MW hr per year (2).
The Cayuga Station installed the On-Line Automatic Self-Flushing Debris Filter in 1995 and 1996. Since the installation, the condenser tubes have remained clean and free from debris and the pressure drop through the condenser has remained steady.
The condition of the tube sheets and tubes for two separate water boxes prior and after the installation of debris filter is shown in Figure 6. The installation of the debris filters at the inlet to the condenser is shown in Figure 7.
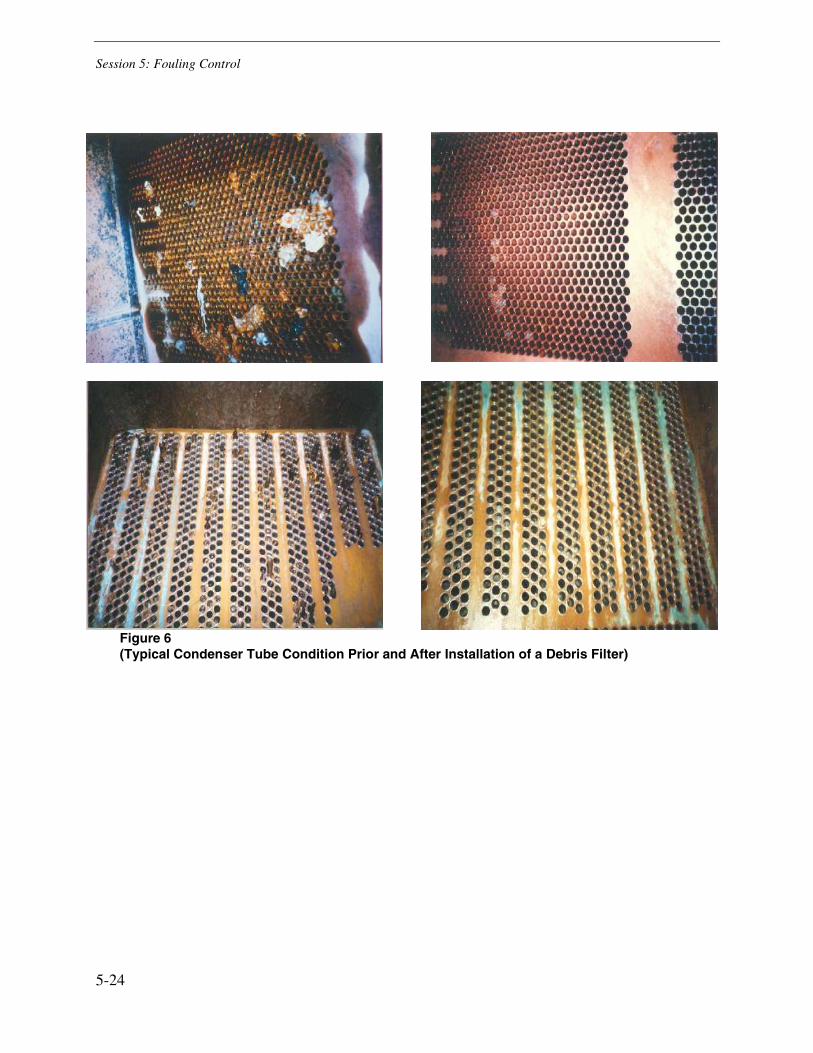
Session 5: Fouling Control
5-24
Figure 6 (Typical Condenser Tube Condition Prior and After Installation of a Debris Filter)

Session 5: Fouling Control
5-25
Figure 7 (Typical Installation of Debris Filters at the Inlet to the Condenser)
On-Line Automatic Tube Cleaning System
The on-line tube cleaning system is used to clean the condenser tubes from micro foulant, scale and other deposits continuously while the plant remains on line and in it’s full production. Slightly oversized special elastomer balls (Figure 8) are periodically or continuously injected into the condenser cooling water inlet.
Figure 8 (Various Size and Types of Elastomeric Cleaning Balls)
The balls are injected in such a way to provide uniform distribution inside the water box. Since the balls are slightly larger than the tube ID, they wipe away any deposits which may form on the tubes. After the balls leave the condenser tubes they are captured by means of a special strainer that is installed in the cooling water return line (See item 2, Figure 2). The captured balls are directed toward a collector (See item 4, Figure 2) by means of a small open-recessed impeller

Session 5: Fouling Control
5-26
pump (See item 3, Figure 2). The pump and the collector is used to pump the balls back into the cooling water supply line creating a closed loop ball circulation.
A major component of this cleaning system is the ball strainer which houses screens that are mounted on a shaft that can be turned to a backwash position to clean it from any accumulated debris.
The pressure drop across the strainer screen is continuously monitored by a pressure differential transmitter. Once the transmitter reaches its set point position, the control panel directs the ball collector to close and remove the balls from circulation. After the balls are collected, the screen is automatically opened by means of its motorized actuators and the screens are cleaned against the incoming cooling water. After the backwashing is completed, the screens close again automatically and the balls are released into the circulation again. Figure 9 shows the strainer screen in the closed (normal operating) and open (backwash) position.
Figure 9 (Strainer in Closed (Operating) and Open (Backwash) mode)
A Typical ball re-circulation system and the control panel are shown in Figure 10.
Figure 10 (Typical Ball Recirculation Pumpskid / Collector and Control Panel)
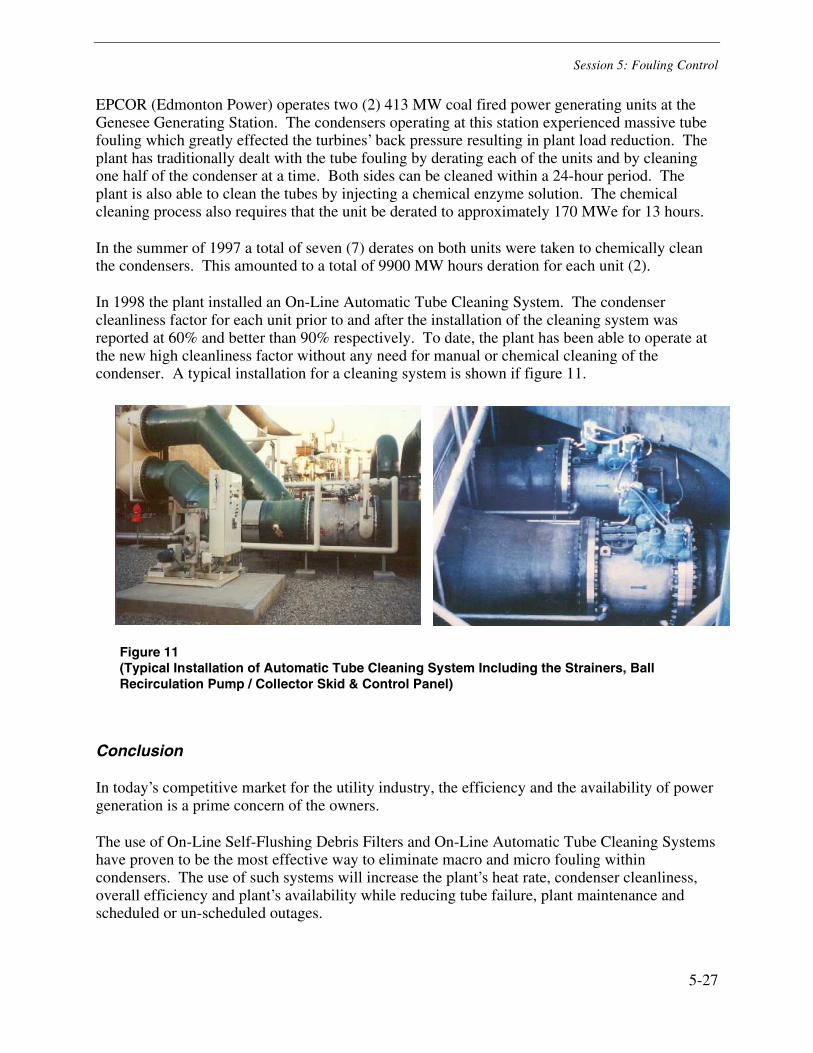
Session 5: Fouling Control
5-27
EPCOR (Edmonton Power) operates two (2) 413 MW coal fired power generating units at the Genesee Generating Station. The condensers operating at this station experienced massive tube fouling which greatly effected the turbines’ back pressure resulting in plant load reduction. The plant has traditionally dealt with the tube fouling by derating each of the units and by cleaning one half of the condenser at a time. Both sides can be cleaned within a 24-hour period. The plant is also able to clean the tubes by injecting a chemical enzyme solution. The chemical cleaning process also requires that the unit be derated to approximately 170 MWe for 13 hours.
In the summer of 1997 a total of seven (7) derates on both units were taken to chemically clean the condensers. This amounted to a total of 9900 MW hours deration for each unit (2).
In 1998 the plant installed an On-Line Automatic Tube Cleaning System. The condenser cleanliness factor for each unit prior to and after the installation of the cleaning system was reported at 60% and better than 90% respectively. To date, the plant has been able to operate at the new high cleanliness factor without any need for manual or chemical cleaning of the condenser. A typical installation for a cleaning system is shown if figure 11.
Figure 11 (Typical Installation of Automatic Tube Cleaning System Including the Strainers, Ball Recirculation Pump / Collector Skid & Control Panel)
Conclusion
In today’s competitive market for the utility industry, the efficiency and the availability of power generation is a prime concern of the owners.
The use of On-Line Self-Flushing Debris Filters and On-Line Automatic Tube Cleaning Systems have proven to be the most effective way to eliminate macro and micro fouling within condensers. The use of such systems will increase the plant’s heat rate, condenser cleanliness, overall efficiency and plant’s availability while reducing tube failure, plant maintenance and scheduled or un-scheduled outages.

Session 5: Fouling Control
5-28
References
1. Mussalli, Y.G., Bell, R.J. Impagliazzo, A.M., “High Reliability Condenser Design Study.” Presented in EPRI Report CS 3200, Palo Alto, Calif.: Electric Power Research Institute, July 1983.
2. Someah, K., Stauber, J., Miller, J., Whitten, D., Peterson, L. “On-Line Automatic Tube Cleaning System & On-Line Self Flushing Debris Filter” presented in Condenser Technology Conference Palo Alto, Calif.: Electric Power Research Institute, September 1999.

Session 5: Fouling Control
5-29
Mechanical Tube Cleaning: A Brief Tutorial
George Saxon, Jr. Conco Systems, Inc.
Conco Systems
Mechanical Tube CleaningA Brief Tutorial
George Saxon, Jr.Conco Systems, Inc.
EPRI Condenser Technology Conference
September 11-12, 2002

Session 5: Fouling Control
5-30
Conco Systems
The Tutorial Includes
Introduction to mechanical tube cleaningDiagnostic techniquesTube cleaning variablesDeposit characteristicsVarious types of mechanical tube cleanersCase(s)
Conco Systems
Plant Cleaning Preferences
1%Other methods
5%Chemical Cleaning
14%Sponge rubber balls
14%High-pressure water
22%Brushes
44%Metal cleaners
PlantPreference
Cleaning Method

Session 5: Fouling Control
5-31
Conco Systems
Mechanical Tube CleaningMinimizes unit downtime – normal crew can clean
5,000 tubes during a 10-hour shiftEffective on all types of deposits:
– Fouling deposits– Corrosion products– Physical obstructions– Tube surface roughness
Best cleaning procedure can be developed off-linethrough heat transfer testing of fouled tube samples
Conco Systems
Mechanical Tube Cleaning (cont.)
Deposit sampling capabilityUniform cleaning of each tube Extend tube life and tube plugging criteriaRetards pitting and improves tube surface conditionAchieves expected performance improvementsImproves Eddy Current resultsCan be performed quickly 10-20 ft./sec.Safe to use

Session 5: Fouling Control
5-32
Conco Systems
Innovative Cleaner Designs
Hex cleaner – Removed 7,000 lbs. of deposit and increased
capacity by 25 MW saving $4.3 million.
Calcite cleaner – Removed 80 tons of scale and returned
condenser performance to best level in years saving $2.6 million.
Conco Systems
Hex Cleaner Calcite Remover
Innovative Tube Cleaners

Session 5: Fouling Control
5-33
Conco Systems
Metal Brush
Conco Systems
U-Tube Cleaner

Session 5: Fouling Control
5-34
Conco Systems
Performance Indicators
Back pressure deviationCleanliness factor Inlet and outlet cooling water temperature differentialHeat rateMegawatt output
Conco Systems
Diagnostic Techniques
Deposit SamplingHeat Transfer TestingFouling MonitorPerformance Analysis on the PCBorescopic Examination

Session 5: Fouling Control
5-35
Conco Systems
Whole-Tube Deposit Samples Deposit Density
0.14491.79
0.40074.95
2.045225.26
2.944836.37
7.573893.54
7.737495.56
7.985198.62
8.9956111.10
10.2118126.12
10.5170129.89
17.5945217.30
Densitygm./sq.ft.
Dry Weightgm.
Conco Systems
Results of Elemental Analysis
Not ListedLoss on ignition
Not ListedElements <0.01%
0.1-1.0Chlorine
1-5Calcium
0.1-1.0Nickel
0.1-1.0Sulfur
5-10Silicon
0.1-1.0Titanium
0.1-1.0Phosphorus
5-10Iron
0.1-1.0Potassium
0.1-1.0Aluminum
10-20Manganese
%Element

Session 5: Fouling Control
5-36
Conco Systems
Tube Cleaning Variables
Cooling Water SystemTube MaterialDeposit Type(s)CorrosionTube Quantity and SizeScheduleTube Cleaning System
Conco Systems
Cooling Water SystemCooling Water Type– fresh water– brackish water– sea water
Cooling System– once through or closed cycle– multiple pass
Water ChemistryObstructions and Debris

Session 5: Fouling Control
5-37
Conco Systems
Copper Alloy Tubing
Tubing– Admiralty Brass– Aluminum Brass– Copper-Nickel
Corrosion Characteristics– Crevice corrosion, pitting– Dealloying-dezincification or
denickelification– Erosion-corrosion
• Inlet end• Down tube
– Ammonia corrosion, stress cracking corrosion
Conco Systems
Stainless Steel Tubing
Tubing– 304– 316– AL6XN– Seacure– AL 29-4-C
Corrosion Characteristics– Crevice corrosion, under-
deposit corrosion, pitting– Microbiological influenced
corrosion (MIC)– Chloride pitting

Session 5: Fouling Control
5-38
Conco Systems
Titanium Tubing
Corrosion resistantStill must be kept clean
Conco Systems
Deposit Types
Particulate FoulingCrystallization FoulingBiofoulingMacrofoulingCorrosion Product
Silt and mudScale, manganese and ironSlime and organismsShells, clams, musselsCuO2

Session 5: Fouling Control
5-39
Conco Systems
Ranking Thermal Impact of Deposit Types
MicrobiologicalManganeseIronSiliconCalcium CarbonateCalcium Phosphate
Conco Systems
Tube Quantity and Size
Quantity– How many
waterboxes?– How many tubes?– Main Section?– Air Removal Section?
Size– Outer Diameter (O.D.)– Gauge (BWG) or (I.D.)– Length– Other considerations
• Coatings• Inserts

Session 5: Fouling Control
5-40
Conco Systems
Schedule
Unit SizeAvailabilityOff-line or reduced loadTime requirement for cleaning
Conco Systems
Tube Condition
Condition Resolution
Deposits
Obstructions
Corrosion
Pitting
SurfaceRoughness

Session 5: Fouling Control
5-41
Conco Systems
The Tube Cleaning System
Performance improvementMost effective deposit removalCorrosion protectionRemove obstructionsClean each and every tube, maintain consistency throughoutSmooth tube surfaceEase of use
Conco Systems
Various Types of CleanersC4S C3SHexC4SSH-BrushXL BrushType “P”Type CB “Cal buster”U-tube Cleaner
All purpose tube cleaner Hard depositsThin tenacious depositsAL6x and SeacureLight silt and mudLight silt and mudFor the lightest depositsThick scaleFeedwater heaters

Session 5: Fouling Control
5-42
Conco Systems
Tube Cleaners
Conco Systems
Water Gun Mobile Pump System
Water Gun and Pump System

Session 5: Fouling Control
5-43
Conco Systems
Tube Cleaner in Action
Conco Systems
Tube Cleaning
Select the most effective tube cleaner.Insert the tube cleaners into each tube.Utilizing the water gun and pump system the cleaners are “shot” through the tubes.

Session 5: Fouling Control
5-44
Conco Systems
Inside the Waterbox
Confined SpaceLightingPlankingScaffolding
Conco Systems
Post Cleaning
Inspect the condenser with high intensity lightRod all obstructed tubesPlug designated tubesSign-off

Session 5: Fouling Control
5-45
Conco Systems
Cleaning Heavy Deposits From Heat Exchangers with a HydroDrill
Conco Systems
Expectations
Most effective deposit removalImmediate improvement in performanceImmediate improvement in heat rateReduced outage timeIncreased unit availabilityExtended tube life
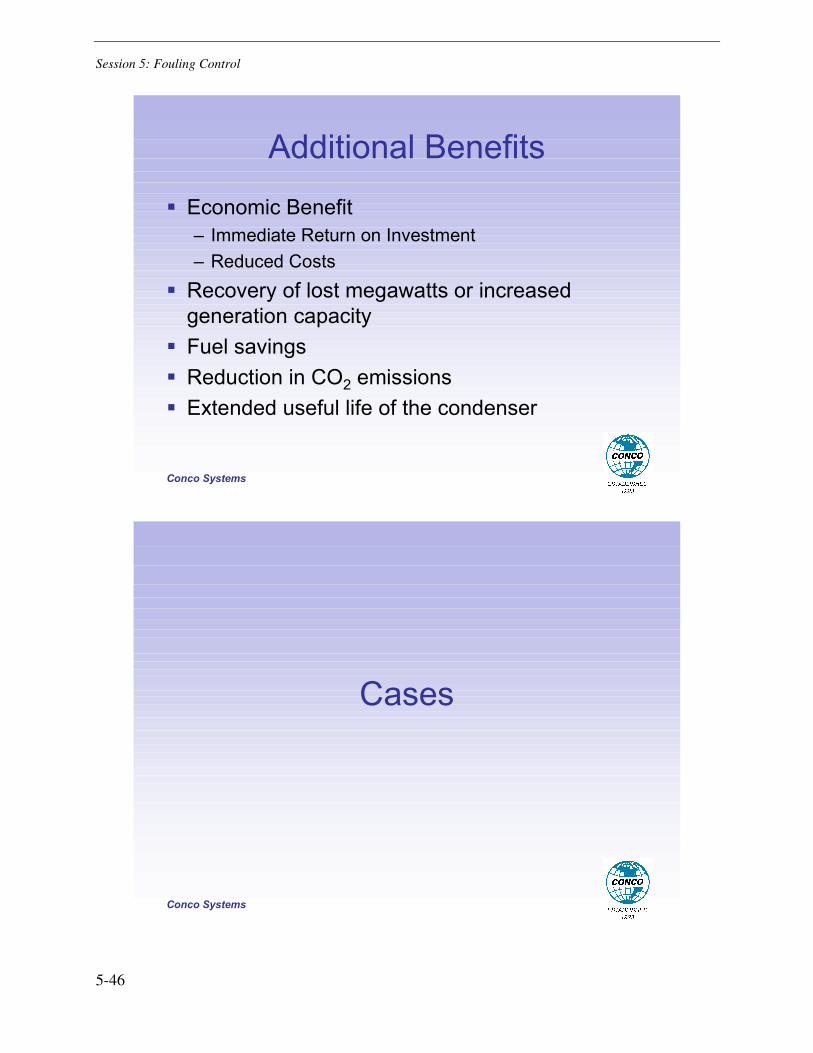
Session 5: Fouling Control
5-46
Conco Systems
Additional Benefits
Economic Benefit– Immediate Return on Investment– Reduced Costs
Recovery of lost megawatts or increased generation capacityFuel savingsReduction in CO2 emissionsExtended useful life of the condenser
Conco Systems
Cases
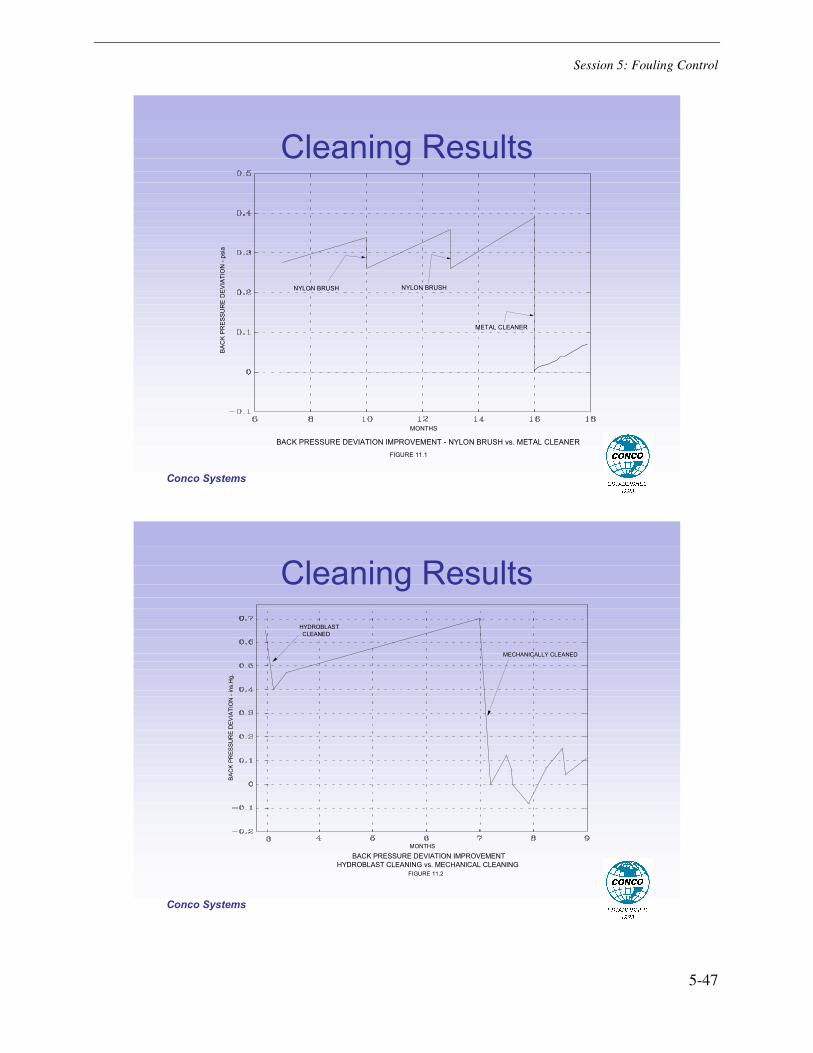
Session 5: Fouling Control
5-47
Conco Systems
Cleaning Results
BACK PRESSURE DEVIATION IMPROVEMENT - NYLON BRUSH vs. METAL CLEANERFIGURE 11.1
BAC
K PR
ESSU
RE
DEV
IATI
ON
- ps
ia
NYLON BRUSH
METAL CLEANER
NYLON BRUSH
MONTHS
Conco Systems
Cleaning Results
BAC
K PR
ESSU
RE
DEV
IATI
ON
- in
s.H
g.
MONTHS
HYDROBLASTCLEANED
MECHANICALLY CLEANED
BACK PRESSURE DEVIATION IMPROVEMENT
FIGURE 11.2HYDROBLAST CLEANING vs. MECHANICAL CLEANING

Session 5: Fouling Control
5-48
Conco Systems
Cleaning Results
YEAR
BAC
K P
RES
SU
RE
- ins
.Hg.
PARTIAL RETUBE
MECHANICAL CLEANING
DESIGN BACK PRESSURE
PARTIAL RETUBING vs. MECHANICAL CLEANINGFIGURE 11.6
CASE STUDY 4: IMPROVEMENT IN BACK PRESSURE DEVIATION RESULTING FROM
Conco Systems
Potential Savingsfrom Improving Back Pressure
Pressure Deviation (inches Hg)
(Excess Back Pressure)
Turbine Rating(MWatts)
100 400 600 1,000
0.1 $31,250 $125,000 $187,500 $312,500
0.2 62,500 250,000 375,000 625,000
0.3 91,750 375,000 562,500 937,500
0.4 125,000 500,000 750,000 1,250,000
0.5 156,250 625,000 937,500 1,562,500
Source: “Bulletin #940-2”, INTEK, Inc. 1999 and “Operation and Maintenance of Steam Surface Condensers”, Fossil Plant News, Electric
Power Research Institute, Spring 1988

Session 5: Fouling Control
5-49
Conco Systems
Cost of Mechanical Cleaning625 MW Unit
Description Costs
Labor $19,542Tube Cleaners 14,276
Equipment 2,860Expense 3,442
Total $40,120
Note: No Capital Investment is Required
Conco Systems
ROI Evaluation
Cash Flows NPV ROI System Out In CFout-CFin NPV/CFout
Conco $40,120 $562,500 +$522,380 +1,305 %
Assumptions: recover .3 inches Hg
return on 600 MW is approximately the same as 625 MW
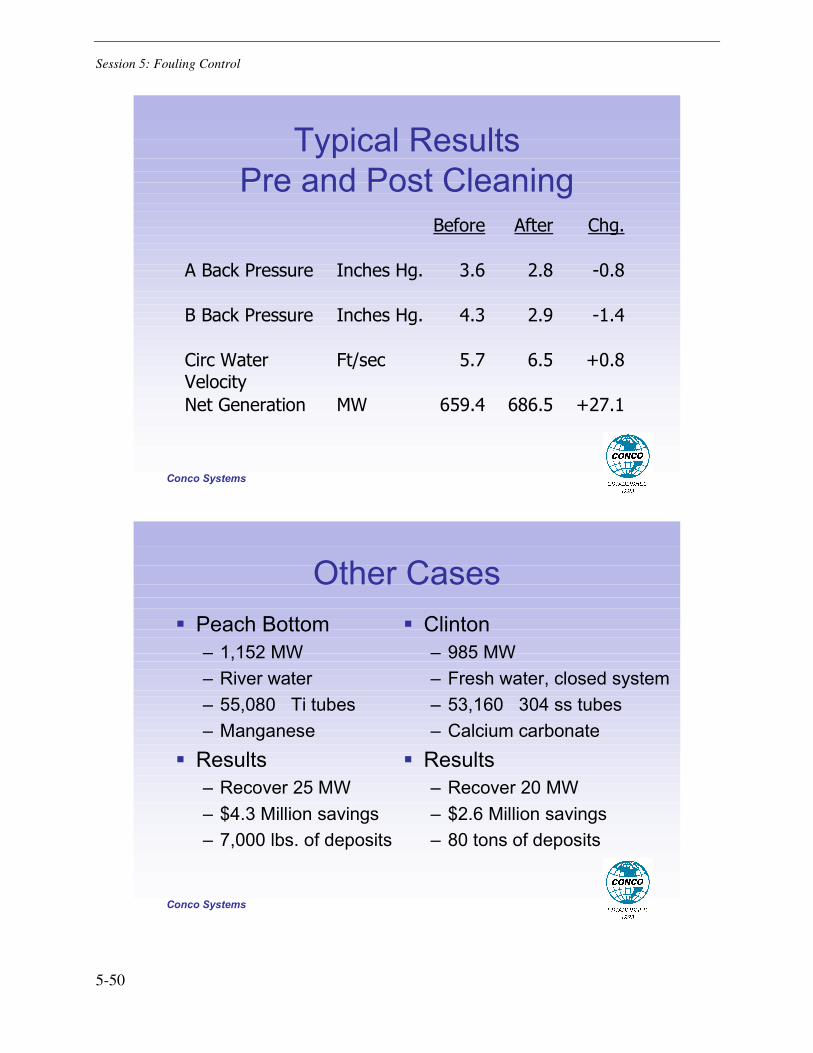
Session 5: Fouling Control
5-50
Conco Systems
Typical Results Pre and Post Cleaning
Before After Chg.
A Back Pressure Inches Hg. 3.6 2.8 -0.8
B Back Pressure Inches Hg. 4.3 2.9 -1.4
Circ Water Velocity
Ft/sec 5.7 6.5 +0.8
Net Generation MW 659.4 686.5 +27.1
Conco Systems
Other CasesPeach Bottom– 1,152 MW– River water– 55,080 Ti tubes– Manganese
Results– Recover 25 MW– $4.3 Million savings– 7,000 lbs. of deposits
Clinton– 985 MW– Fresh water, closed system– 53,160 304 ss tubes– Calcium carbonate
Results– Recover 20 MW– $2.6 Million savings– 80 tons of deposits

Session 5: Fouling Control
5-51
Conco Systems
Key Points
Incorporation of effective tube cleaning practices is essential in today’s competitive market.Cleaning is also performed for corrosion protection, increasing availability and reliability.Increased MW output provides immediate ROI, increasing profitability.Select the most effective tube cleaning method based on your site specific variables.
Conco Systems
Contact Information
George Saxon, Jr.Vice President, Sales and Marketing
Conco Systems, Inc.530 Jones StreetVerona, PA 15147 USA
Tel: (412) 828-1166Fax: (412) 826-8255E-mail: [email protected]


6-1
6 SESSION 6: ALTERNATIVE COOLING TECHNOLOGY
• Wet And Dry Cooling---Cost/Performance Tradeoffs John S. Maulbetsch, Maulbetsch Consulting Kent D. Zammit, EPRI Matthew Layton and Joseph O’Hagan, California Energy Commission
• The Impact of Air Cooled Condensers on Plant Design and Operations Richard E. Putman, Conco Consulting Corp. Dirk Jaresch, J & W GmbH
• Experience Evaluating Condenser Performance and Tube Fouling with the ASME Performance Test Code on Steam Surface Condensers PTC 12.2 – 1998 Dale C. Karg, Santee Cooper John M. Burns, Burns Engineering Services Inc. Michael C. Catapano, Powerfect Inc.

Session 6: Alternative Cooling Technology
6-3
Wet And Dry Cooling---Cost/Performance Tradeoffs
John S. Maulbetsch1, Kent D. Zammit2, Matthew Layton3 and Joseph O’Hagan3
Abstract
The allocation of water resources has become an increasingly contentious issue in many areas. As a result, power generation facilities are more frequently considering dry cooling for plant steam condensation. Air-cooled condensers, with attendant water savings have been installed and operated successfully at many plants in the U. S. and abroad. Many more are planned for use at plants currently in design or construction.
However, the reduction in water use comes at a price. The capital cost of the equipment is normally higher than that for comparable wet cooling systems. The plant efficiency is frequently reduced through the use of dry cooling, as is the plant capacity, particularly during the hottest days of the year.
This paper presents a methodology for selecting optimized designs for both wet and dry systems and for comparing the performance and costs of the optimized systems. The cost and performance differences are shown to be functions of plant and turbine heat rate characteristics, site meteorology and cooling system design choices. Example comparisons are given for new, gas-fired combined-cycle plants in the 500 MW size range operating at sites representative of conditions in California.
A breakdown of the many elements of the capital and operating costs is provided to assist in understanding the effect of important, but highly site-specific, costs on the general cost comparisons.
A brief discussion of the environmental trade-offs between wet and dry systems is also given.
Introduction
This paper presents the results of a study to define, explain and document the performance, economic and environmental tradeoffs between wet and dry cooling systems. While much of the information may be more widely applicable, the focus of the analysis and the case study characteristics are specific to conditions in California.
1 Maulbetsch Consulting, Menlo Park, California 94025 2 EPRI, Palo Alto, California 94304 3 California Energy Commission, Sacramento, California 95814

Session 6: Alternative Cooling Technology
6-4
Approach
The systems considered are closed-cycle wet cooling using mechanical draft wet cooling towers and surface condensers and direct dry systems using mechanical draft air-cooled condensers. The approach was a case study method where comparisons of the two systems were carried out at four sites characteristic of the range of conditions in California.
The chosen sites were a high desert site characterized by conditions at Blythe, California, a northern mountain site characterized by conditions at Burney, California, a Central Valley site characterized by conditions at McKittrick, California and a Bay Area/Delta Region site characterized by conditions at Pittsburg, California.
Plant/steam conditions at each site are as follows:
• Plant type: gas-fired combined cycle; 500 MW in 2 x 1 configuration
• Steam flow: 1,000,000 lb/hr
• Steam quality: 95%
• Back pressure: 2.5 in. Hga (Tsat = 109°F)
Water Use and Conservation
The impetus for dry cooling is the increasing interest in water supply and conservation in California and across the country. Electric power generation utilizes water in many ways and in varying amounts depending on the type of generating plant and the type of cooling system employed. Table 1 summarizes some nominal values of water use for various plant types with alternative choices of systems for steam cycle cooling.
Table 1 Water Requirements for Power Generation (in Gallons per MWh of Plant Output)
Plant Type
Steam Condensing
Auxiliary Cooling and Hotel Load
Total
Stand-alone steam plant 720 30 750
Simple-cycle gas turbine 0 150 150
Combined-cycle plant
(2/3 CT + 1/3 steam)
240
(1/3 x 720)
110
(2/3 x 150 + 1/3 x 30)
350
Combined-cycle plant with dry cooling
0 110 110
Stand-alone steam plant with dry cooling
0 30 30

Session 6: Alternative Cooling Technology
6-5
Other Environmental Issues
A comparison of environmental impacts associated with wet and dry cooling systems was made in nine areas, including water use, waste management, including water discharge, hazardous materials, air emissions, noise, visual resources, public health, biological resources and agriculture and soils.
In many of these areas, the effects are proportional to the water use and the associated withdrawal, evaporation, blowdown, drift, and plume production. This is the case for impacts on waste management, water discharge, hazardous materials, public health, and agriculture and soils. In these cases, the use of dry cooling eliminates the effects entirely. The other areas are discussed further below.
Air Emissions
Dry systems eliminate effects associated with drift and volatile components stripped from the water in wet towers. However, the use of dry systems imposes penalties on plant efficiency and capacity, which requires that additional fuel be burned at the plant or elsewhere on the system to produce the same net power generation. This leads to an increase in the emissions associated with the combustion process. While this is a second-order effect on a state- or system-wide basis, it can be a measurable effect in the vicinity of the plant and should be considered on a case-by-case basis.
Noise
The noise from wet systems comes from both the water falling through the tower fill and the fans and air motion. In the case of dry systems, the water noise is obviously eliminated, but the fan and air noise may be increased since the quantity of air moved through the system is greater.
The importance of this effect is site specific, but, in locations where noise abatement is necessary, the use of special low-noise fans or sound walls may be required. For so-called “ultralow- noise fans” the increase in cost is estimated at approximately 10%. Similar noise abatement may be required for the wet towers in some cases.
Visual Resources
Dry systems effectively eliminate the occurrence of visual plumes. However, they require physically larger, taller structures than wet cooling and, as such, can be a more obvious element at a plant site. The importance of this feature is also site specific.
Biological Impacts
The primary focus in this area is on entrainment and impingement losses regulated under Section 316(b) of the Clean Water Act. Dry systems obviously reduce this impact in proportion to the reduction in total plant water use, estimated in Table 1 as approximately 70%.

Session 6: Alternative Cooling Technology
6-6
A postulated effect of dry cooling is so-called “atmospheric entrainment,” where insects and even small birds may be entrained with the inlet air stream. To date, no research or information is available on the importance of this issue
Performance and Cost
The reduction in the amount of water used and other related environmental benefits of dry cooling are technically achievable. However, the benefits come at a cost. In essentially all situations, the use of water as the cooling medium is the cheapest way to provide cooling at power plants. Furthermore, wet cooling always results in higher annual plant output and in more efficient plant performance during most of the year. The relevant questions are how much more expensive and how great is the effect on plant output and efficiency.
The performance and cost issues are inextricably related. The initial choice of a larger, higher capacity and, hence, more expensive cooling system will result in higher plant capacity and more efficient operation for the life of the plant. This is true for all cooling systems, wet as well as dry.
In general, a proper cost comparison among alternative cooling systems must be made between optimized selections at a particular site. An optimized system would normally be defined as one that minimizes the sum of all costs---initial capital cost, operating energy cost, efficiency penalty cost, and capacity penalty cost---for the life of the plant. The magnitudes of these cost elements are dependent on many variables. Some of the most important include the operating characteristics of the plant generating components, the meteorology at the plant site, the present and projected costs of fuel, the present and projected price of power and the projected demand profiles for the plant. The choice of the optimum or preferred design also depends on the relative importance assigned to present vs. future costs, which depends strongly on the economic objectives and business plans of the plant owner. Therefore, the “optimum system” or the “system of choice” might range from a system of lowest first cost to one of lowest total lifetime cost projected for a 30-year or longer lifetime.
To illustrate the methodology for determining the various cost elements and for selecting an “optimum” system based on a range of criteria, case studies were conducted at four sites. In each case the cooling system was sized to condense the turbine exhaust steam from the steam portion of a nominal 500-MW gas-fired combined-cycle plant typical of what is currently being proposed and built in California.
The cost information and comparisons are based on vendor-supplied data for new, 500 MW gas-fired, combined-cycle plants using fresh water makeup.
Wet System Costs
Table 2 lists the major cost elements of a wet cooling system.

Session 6: Alternative Cooling Technology
6-7
Surface Condenser
Budget price estimates were obtained on steam surface condensers for a turbine exhaust flow of 1,000,000 lb/hr @ 5% moisture, a heat load of 980 x 106 Btu/hr at a turbine back pressure of 2.5 in. Hga (Tcond = 108.7°F). The tube material is 304 stainless steel; 1” OD/20 gauge. The operating points are a terminal temp. difference (TTD) of 5 ºF (if available), a range of 20°F and a cold water temperature of 70–90 °F.
Table 2 Capital Cost Elements for Wet Cooling System Equipment for New Plants
Element Comment Cost
Wet cooling tower Erected tower including structure, fans, circulating pumps, fill, drift eliminators, etc.
Strongly dependent on materials, assumed Douglas Fir; typically 35 to 45% of system cost
Installation/erection Included in base price --
Surface steam condenser
Major cost element (see previous subsection)
Typical range of $5 to $12/kWe; approx. 35 to 45% of system cost
Tower basin Including typical site preparation Significant cost item; function of tower size; estimated at $25/ft of basin perimeter plus $10/sq ft of basin area; typically 3 to 6% of system cost
Electricals and controls Fan/pump motor wiring and controls, etc.
Important cost item; estimated at $25,000 per cell
Circulating water system
Pumps, piping, valves, etc. Can be significant cost item; dependent on site layout; assumed at 5% of total installed cost
Water supply/intake structure
Highly site dependent; minor if source is nearby; major, if water supply is far from site or at much lower elevation
Estimated at 1 to 2% total installed cost
Water treatment/blowdown discharge
Usually minor; may be significant if in zero-discharge region where evaporation ponds or brine concentrators may be required
Estimated at 1% total installed cost
Auxiliary cooling Typically 5% additional heat load Estimated at 5% additional cost
Additional elements Typically minor and site dependent Not included in case study estimates of comparisons
− Site preparation/ access provision
− Winter operation; freeze protection
− Low-noise fans
− Painting
− Fire and lightning protection
− Acceptance testing
− Highly site dependent; likely minor; not likely to be affected significantly by system choice
− Location dependent
− Significant cost if required; more important for dry systems than for wet
− Typically minor costs
− Typically minor costs
− Typically minor costs
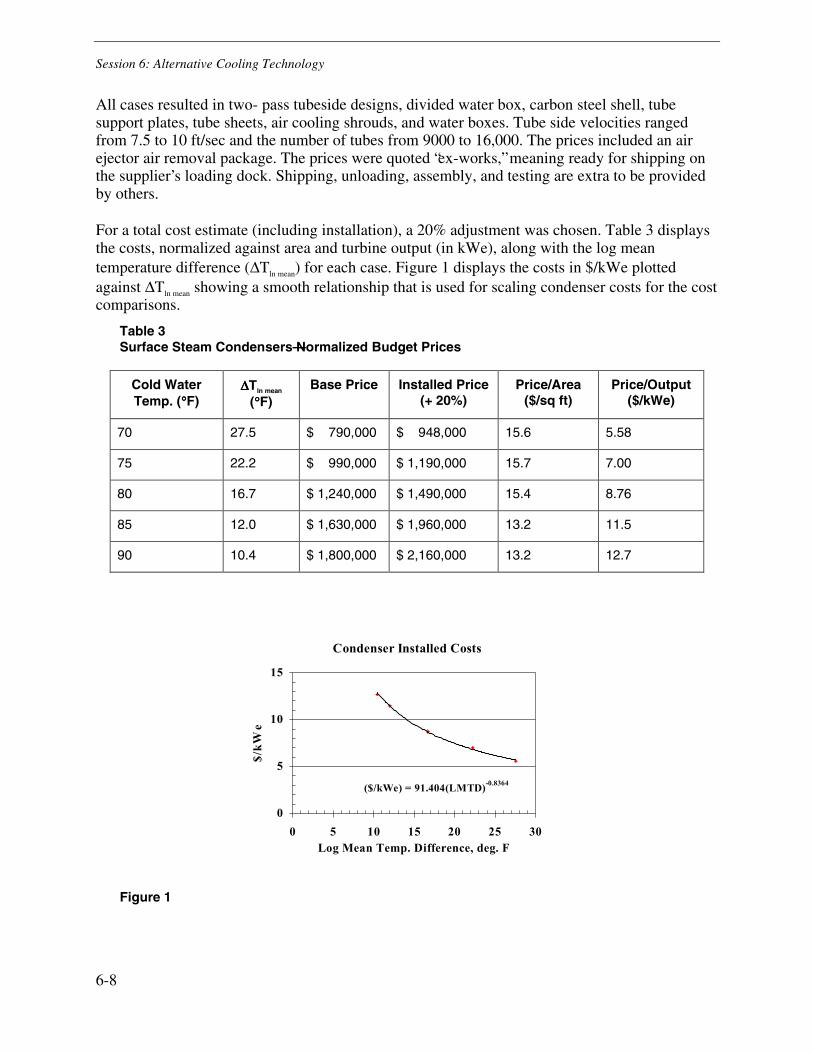
Session 6: Alternative Cooling Technology
6-8
All cases resulted in two- pass tubeside designs, divided water box, carbon steel shell, tube support plates, tube sheets, air cooling shrouds, and water boxes. Tube side velocities ranged from 7.5 to 10 ft/sec and the number of tubes from 9000 to 16,000. The prices included an air ejector air removal package. The prices were quoted “ex-works,” meaning ready for shipping on the supplier’s loading dock. Shipping, unloading, assembly, and testing are extra to be provided by others.
For a total cost estimate (including installation), a 20% adjustment was chosen. Table 3 displays the costs, normalized against area and turbine output (in kWe), along with the log mean temperature difference (∆Tln mean) for each case. Figure 1 displays the costs in $/kWe plotted against ∆Tln mean showing a smooth relationship that is used for scaling condenser costs for the cost comparisons.
Table 3 Surface Steam Condensers—Normalized Budget Prices
Cold Water Temp. (°°°°F)
∆∆∆∆Tln mean
(°°°°F) Base Price Installed Price
(+ 20%) Price/Area
($/sq ft) Price/Output
($/kWe)
70 27.5 $ 790,000 $ 948,000 15.6 5.58
75 22.2 $ 990,000 $ 1,190,000 15.7 7.00
80 16.7 $ 1,240,000 $ 1,490,000 15.4 8.76
85 12.0 $ 1,630,000 $ 1,960,000 13.2 11.5
90 10.4 $ 1,800,000 $ 2,160,000 13.2 12.7
Condenser Installed Costs
($/kWe) = 91.404(LMTD)-0.8364
0
5
10
15
0 5 10 15 20 25 30Log Mean Temp. Difference, deg. F
$/k
We
Figure 1

Session 6: Alternative Cooling Technology
6-9
Cooling Towers
The base system chosen to represent recirculating wet cooling is the mechanical draft, counter-flow wet cooling tower. Budget prices were obtained for wet cooling towers for each of the four sites.
Two criteria were used for each site:
• A “low first cost” case in which the capital cost of the tower was minimized at the expense of additional fan power; and
• An “evaluated cost” case in which the sum of the capital cost and the cost of power evaluated over the assumed 30-year life of the tower was minimized.
2,500,000
2,700,000
2,900,000
3,100,000
3,300,000
3,500,000
3,700,000
3,900,000
4,100,000
4,300,000
0 5 10 15 20 25
Approach, deg F
Syst
em C
apita
l Cos
t, $
Desert Site Mountain Site Valley Site Bay Area Site
Figure 2 Wet Cooling System Capital Cost vs. Approach for Minimum Evaluated Cost Design (for New 500-MWe Facilities with 170-MWe Steam Cycle)
The cost of the power required to operate the pumps and fans of the cooling system is borne continuously for the life of the plant. In order to put these continuing future costs on a common basis with the initial capital costs, they have been converted into an “evaluated cost per kW”. The values chosen for evaluating the cooling system power costs are an energy cost of $60/MWh, a 6.7% discount rate, a 3% escalation, a 50% tax rate, and a 30-year plant life. These result in an evaluated power cost of $3625/kW. The total evaluated costs as a function of approach are shown in Figure 3.
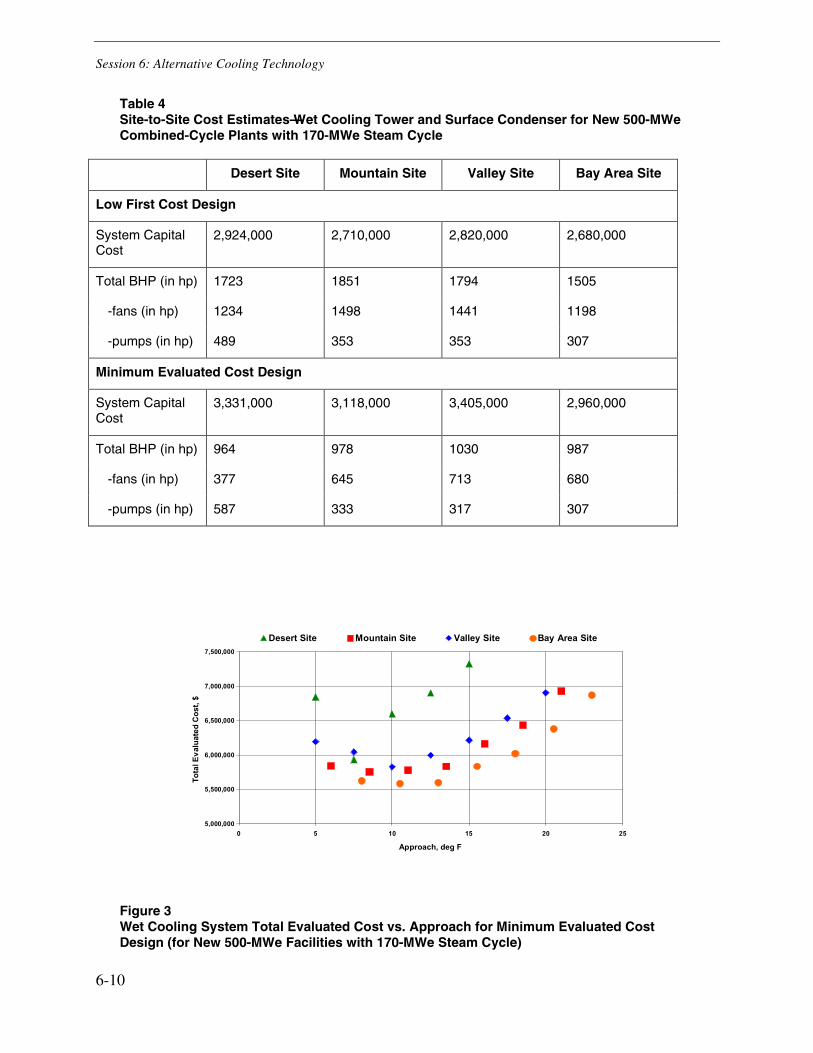
Session 6: Alternative Cooling Technology
6-10
Table 4 Site-to-Site Cost Estimates—Wet Cooling Tower and Surface Condenser for New 500-MWe Combined-Cycle Plants with 170-MWe Steam Cycle
Desert Site Mountain Site Valley Site Bay Area Site
Low First Cost Design
System Capital Cost
2,924,000 2,710,000 2,820,000 2,680,000
Total BHP (in hp) 1723 1851 1794 1505
-fans (in hp) 1234 1498 1441 1198
-pumps (in hp) 489 353 353 307
Minimum Evaluated Cost Design
System Capital Cost
3,331,000 3,118,000 3,405,000 2,960,000
Total BHP (in hp) 964 978 1030 987
-fans (in hp) 377 645 713 680
-pumps (in hp) 587 333 317 307
5,000,000
5,500,000
6,000,000
6,500,000
7,000,000
7,500,000
0 5 10 15 20 25
Approach, deg F
Tota
l Eva
luat
ed C
ost,
$
Desert Site Mountain Site Valley Site Bay Area Site
Figure 3 Wet Cooling System Total Evaluated Cost vs. Approach for Minimum Evaluated Cost Design (for New 500-MWe Facilities with 170-MWe Steam Cycle)

Session 6: Alternative Cooling Technology
6-11
Dry Cooling
The base system for dry cooling is a direct system with a mechanical draft air-cooled condenser (ACC). The major items of the capital cost of the system are displayed in Table 4.
Budget prices for a dry cooling tower and associated heat transfer and flow components were obtained from several major vendors for each of the four sites.
Dry System Cost Analysis
For the dry system cost estimates, vendors were free to select the design point of their own choosing, based presumably on their engineering and commercial experience with the appropriate tradeoff between initial cost and performance penalties. The design ambient temperature chosen for a particular site differed significantly from estimate to estimate, leading to towers of significantly different size and cost for each location. However, the estimates showed good consistency across the range of unit sizes (expressed as ITD; defined as Tcond - Tamb). Figure 4 gives the range of capital cost vs. ITD.
10,000,000
15,000,000
20,000,000
25,000,000
30,000,000
35,000,000
40,000,000
45,000,000
50,000,000
10 15 20 25 30 35 40 45 50 55 60
ITD, deg F
Cap
ital C
ost
Figure 4 Capital Cost vs. ITD for Air-Cooled Condenser (for New 500-MWe Facilities with 170-MWe Steam Cycle)
Power Requirements
Figure 5 displays the power requirements at the motor terminals for the range of design ITD's. The values were normally provided as power required at the motor terminals. In those cases where the required power was specified as fan shaft power, a motor efficiency of 95% was assumed.
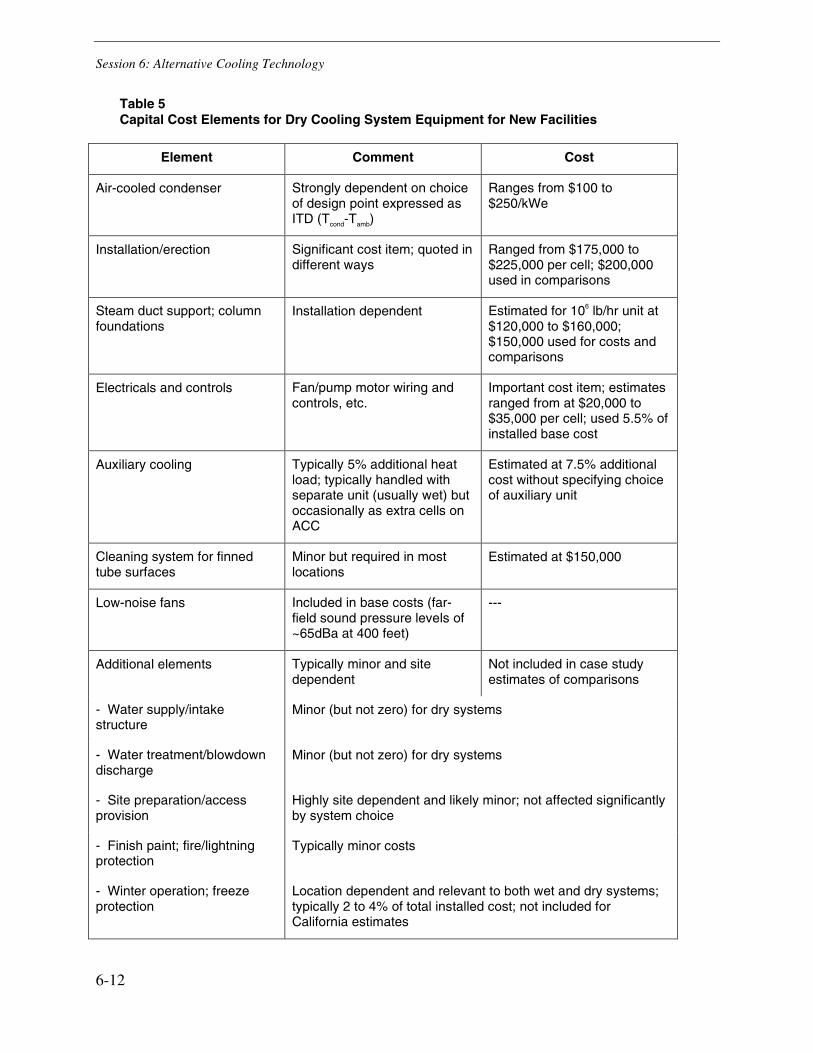
Session 6: Alternative Cooling Technology
6-12
Table 5 Capital Cost Elements for Dry Cooling System Equipment for New Facilities
Element Comment Cost
Air-cooled condenser Strongly dependent on choice of design point expressed as ITD (Tcond-Tamb)
Ranges from $100 to $250/kWe
Installation/erection Significant cost item; quoted in different ways
Ranged from $175,000 to $225,000 per cell; $200,000 used in comparisons
Steam duct support; column foundations
Installation dependent Estimated for 106 lb/hr unit at $120,000 to $160,000; $150,000 used for costs and comparisons
Electricals and controls
Fan/pump motor wiring and controls, etc.
Important cost item; estimates ranged from at $20,000 to $35,000 per cell; used 5.5% of installed base cost
Auxiliary cooling Typically 5% additional heat load; typically handled with separate unit (usually wet) but occasionally as extra cells on ACC
Estimated at 7.5% additional cost without specifying choice of auxiliary unit
Cleaning system for finned tube surfaces
Minor but required in most locations
Estimated at $150,000
Low-noise fans Included in base costs (far-field sound pressure levels of ~65dBa at 400 feet)
---
Additional elements Typically minor and site dependent
Not included in case study estimates of comparisons
- Water supply/intake structure
Minor (but not zero) for dry systems
- Water treatment/blowdown discharge
Minor (but not zero) for dry systems
- Site preparation/access provision
Highly site dependent and likely minor; not affected significantly by system choice
- Finish paint; fire/lightning protection
Typically minor costs
- Winter operation; freeze protection
Location dependent and relevant to both wet and dry systems; typically 2 to 4% of total installed cost; not included for California estimates

Session 6: Alternative Cooling Technology
6-13
2,000
4,000
6,000
8,000
10,000
12,000
14,000
10 20 30 40 50 60
ITD, deg F
Fan
Pow
er, H
P
Figure 5 Fan Power vs. ITD
The capital costs and the evaluated cost of power sum to the total evaluated cost shown in Figure 6.
-
10,000,000
20,000,000
30,000,000
40,000,000
50,000,000
60,000,000
70,000,000
80,000,000
90,000,000
10 20 30 40 50 60
ITD, deg F
Tota
l Eva
luat
ed C
ost,
$
Total Evaluated Cost Capital Cost Evaluated Power Cost
Figure 6 Total Evaluated Costs vs. ITD
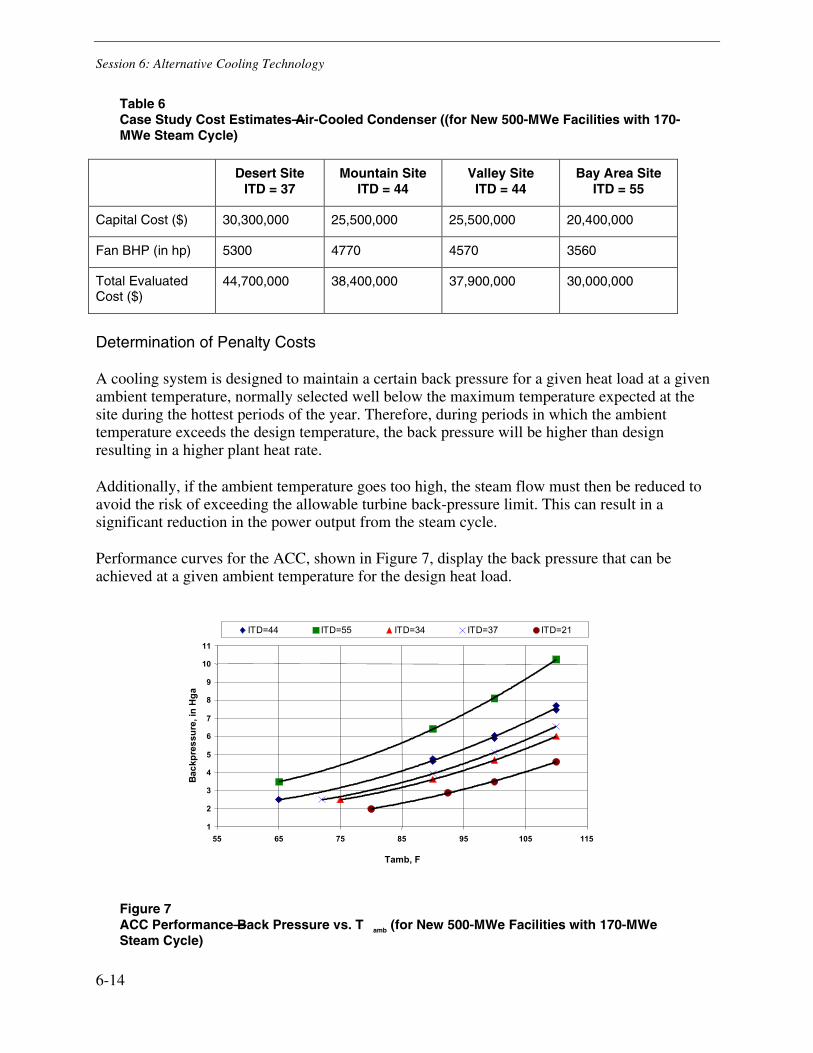
Session 6: Alternative Cooling Technology
6-14
Table 6 Case Study Cost Estimates—Air-Cooled Condenser ((for New 500-MWe Facilities with 170-MWe Steam Cycle)
Desert Site ITD = 37
Mountain Site ITD = 44
Valley Site ITD = 44
Bay Area Site ITD = 55
Capital Cost ($) 30,300,000 25,500,000 25,500,000 20,400,000
Fan BHP (in hp) 5300 4770 4570 3560
Total Evaluated Cost ($)
44,700,000 38,400,000 37,900,000 30,000,000
Determination of Penalty Costs
A cooling system is designed to maintain a certain back pressure for a given heat load at a given ambient temperature, normally selected well below the maximum temperature expected at the site during the hottest periods of the year. Therefore, during periods in which the ambient temperature exceeds the design temperature, the back pressure will be higher than design resulting in a higher plant heat rate.
Additionally, if the ambient temperature goes too high, the steam flow must then be reduced to avoid the risk of exceeding the allowable turbine back-pressure limit. This can result in a significant reduction in the power output from the steam cycle.
Performance curves for the ACC, shown in Figure 7, display the back pressure that can be achieved at a given ambient temperature for the design heat load.
1
2
3
4
5
6
7
8
9
10
11
55 65 75 85 95 105 115
Tamb, F
Back
pres
sure
, in
Hga
ITD=44 ITD=55 ITD=34 ITD=37 ITD=21
Figure 7 ACC Performance—Back Pressure vs. T amb (for New 500-MWe Facilities with 170-MWe Steam Cycle)
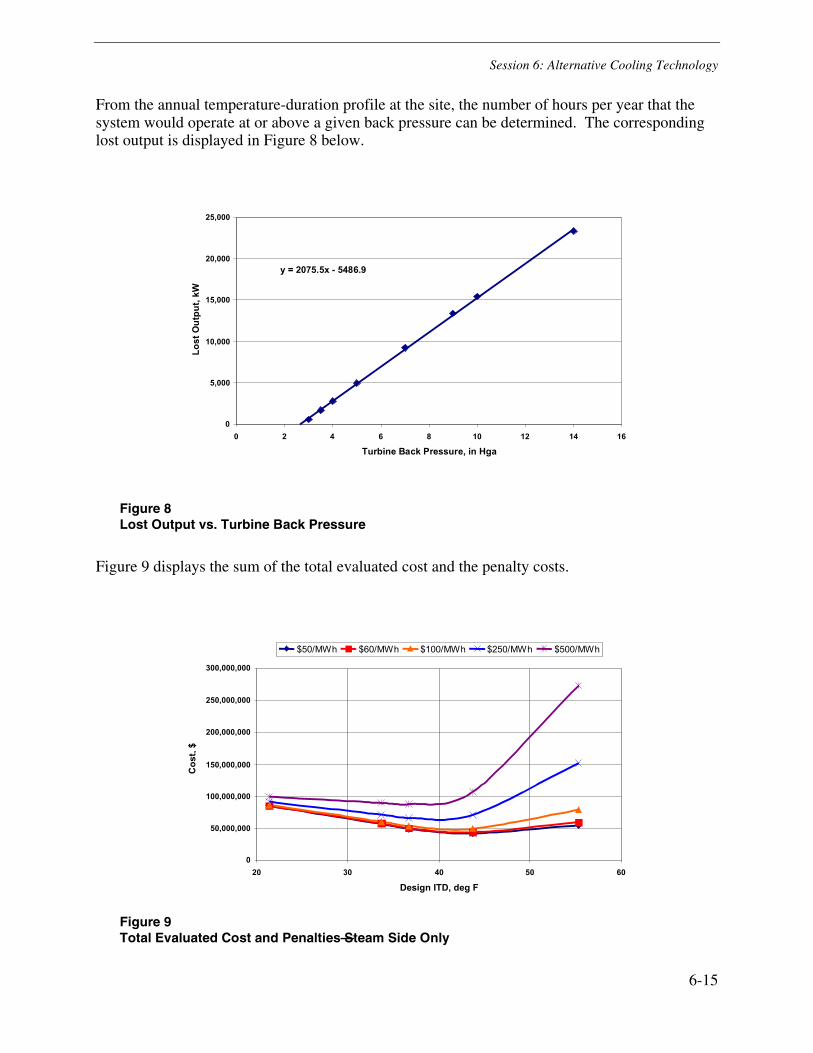
Session 6: Alternative Cooling Technology
6-15
From the annual temperature-duration profile at the site, the number of hours per year that the system would operate at or above a given back pressure can be determined. The corresponding lost output is displayed in Figure 8 below.
y = 2075.5x - 5486.9
0
5,000
10,000
15,000
20,000
25,000
0 2 4 6 8 10 12 14 16
Turbine Back Pressure, in Hga
Lost
Out
put,
kW
Figure 8 Lost Output vs. Turbine Back Pressure
Figure 9 displays the sum of the total evaluated cost and the penalty costs.
0
50,000,000
100,000,000
150,000,000
200,000,000
250,000,000
300,000,000
20 30 40 50 60
Design ITD, deg F
Cos
t, $
$50/MWh $60/MWh $100/MWh $250/MWh $500/MWh
Figure 9 Total Evaluated Cost and Penalties—Steam Side Only

Session 6: Alternative Cooling Technology
6-16
Extension of Penalty Evaluation Procedure to Other Sites
The results of applying this penalty evaluation procedure to other sites differ only because of differing site meteorology.
Additional considerations include:
Operating Power Requirements
The energy required to operate cooling system fans and pumps is energy that must be generated but that cannot be exported or sold by the plant. The cost of this reduced output is incurred for the life of the plant. It is normally expressed as the present worth of a kilowatt that could produce energy at a projected price per MWh for the assumed plant life. This value can be traded off against the capital cost of the cooling system (which can normally be reduced through the expenditure of higher amounts of fan and pump power).
For wet systems in this analysis, the present worth of the power was approximately equal to the capital cost of the cooling system for an optimized system and approximately 160% of the capital cost for a “low first cost” system.
For dry systems, the operating power for a given heat load is much greater—by a factor of 4 to 6—than that for an optimized wet system.
Operations and Maintenance
Comparisons of O&M requirements were based not on detailed analyses or surveys but rather on information obtained during interviews and discussions with staff at operating plants equipped with dry or hybrid systems, all of whom had had previous experience at other plants using wet cooling towers. In each case, the water-conserving system was described as basically trouble free and easy to operate. No additional staff was required, nor was any unusual amount of staff time allocated to the cooling system beyond occasional scheduled cleaning of the finned tube surfaces—and this could be performed with the unit on line.
Therefore, no additional costs were assigned to dry or wet/dry systems for extra O&M requirements.
Summary
Initial capital costs for wet and dry cooling systems that could provide suitable cooling for the four case study sites vary greatly, ranging from $2.7 to $4.1 million for wet systems and from $18 to $47 million for dry systems. Figure 10 displays the initial capital costs for wet and dry cooling systems of both “lowest first cost” and “optimized” designs for each of the four sites.
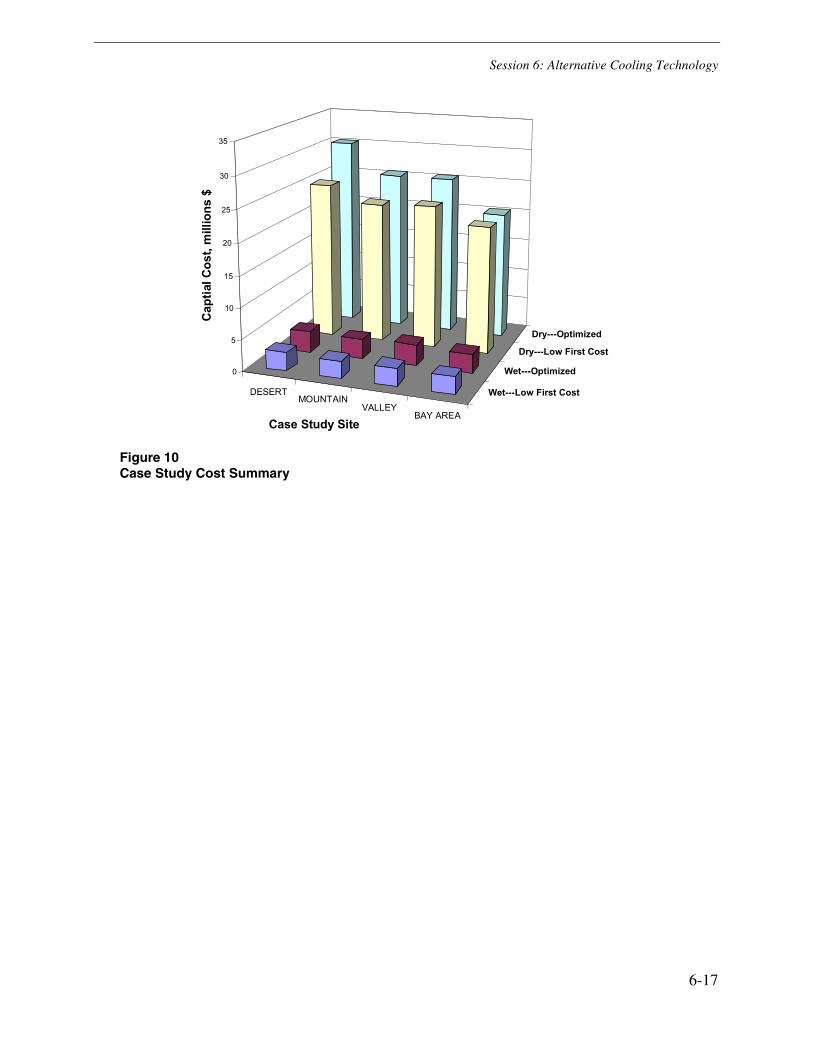
Session 6: Alternative Cooling Technology
6-17
DESERTMOUNTAIN
VALLEYBAY AREA
Wet---Low First Cost
Wet---Optimized
Dry---Low First Cost
Dry---Optimized
0
5
10
15
20
25
30
35
Cap
tial C
ost,
mill
ions
$
Case Study Site
Figure 10 Case Study Cost Summary


Session 6: Alternative Cooling Technology
6-19
The Impact of Air Cooled Condensers on Plant Design and Operations Richard E. Putman Dirk Jaresch
Technical Director Managing Director Conco Consulting Corp. J & W GmbH
Verona, PA 15147 Bochum, Germany
Abstract
Air-cooled condensers were first introduced into the U.S. power industry in the early 1970’s, but only during the last decade has the number of installations greatly increased, largely in response to the growing attention being paid to environmental concerns. The rising importance of this rather different technology for the condensing and recovery of exhaust steam calls for a broader understanding of the associated design and application principles involved, as well as of the performance monitoring techniques and cleaning methods that have to be applied.
This paper identifies the basic configurations of air-cooled condensers used in the power industry together with their advantages and disadvantages when compared to those exhibited by traditional steam surface condensers. The several factors that affect the performance of air-cooled condensers are described in detail, especially the consequences that result from the fouling of the finned-tubes. Measuring the performance of air-cooled condensers is, clearly, an important task and some methods are identified, alternative ways of presenting the data also being included.
To rectify the degradations in performance that result from external tube fouling, a number of cleaning procedures are described. Included among these are details of a new automated cleaning technology that has been successfully applied, and some significant performance improvements that have resulted from the use of this technique are documented.
Keywords: Air-cooled Condensers, Dry Cooling, Performance Monitoring, Cleaning, Maintenance
Introduction
One of the important features of the Rankine cycle, on which all fossil, nuclear and combined cycle power plants are based, is the condensation of the vapor exhausted from the LP turbine stage, the condensate being recycled back through the system. Not only does this reduce the amount of makeup water that has to be supplied and treated but the heat contained in the condensate is also recovered. There are three major condensation systems that are employed:
Session 6: Alternative Cooling Technology
6-20
• Steam surface condensers with once-through water cooling paths
• Steam surface condensers with closed cooling water systems that include either forced or natural draft cooling towers
• Systems with air cooled condensers
Once-through Water Cooling
Once-through condenser water cooling systems take water from a lake, river or sea inlet and discharge it back into the source. While being relatively inexpensive, they can also increase the likelihood of the tubes silting up or fouling. In some cases, environmentalists have real concerns about an excessive heating up of the cooling water source during the summer months, so causing damage to the surrounding ecosystem.
Systems with Cooling Towers
Although more expensive in installed cost, closed systems with cooling towers have the advantage that cooling water chemistry is better able to be controlled, so reducing loss of condenser performance due to fouling. However, today’s plant designer also has to take aesthetic considerations into account. The concrete hyperbolic cooling tower structures that are a part of so many plants may not be allowed in a pristine rural area. The plume from cooling towers may also introduce problems, especially if there is the possibility that the accompanying fog will, without warning, make an adjacent highway dangerous to drive.
Systems with Air Cooled Condensers
Over the past 30 years there has been a growing and competing demand for water for both domestic and industrial use and this has brought an increased interest in the use of air as a cooling medium in place of water. In the utility industry, the earliest applications for the air-cooled condensing of exhaust steam were modified air-cooled heat exchangers similar to those already in use by the process industries. Eventually, air-cooled condensers designed for the utility industry evolved into a configuration that recognized the special needs of condensing a large volume of low pressure vapor as well as the removal of non-condensibles.
Even so, air-cooled heat exchangers are still sometimes used to offset the thermal pollution resulting from the cooling water discharge from steam surface condensers. For instance, the Plant Branch station of Georgia Power is passing a parallel stream of river or lake water through a set of air-cooled heat exchangers in which the temperature of the water stream is reduced by as much as 20 Deg.F. (Blankinship, 2001)(1)
The air-cooled condenser that evolved to meet these needs, while it has some disadvantages, has been able to provide a solution to some otherwise quite intractable design problems. In addition to providing a practical solution to some of the problems identified above for both once-through and cooling tower systems, air-cooled condensers make it possible to build a power plant in locations without adequate cooling water resources, often the case when a power plant is to be

Session 6: Alternative Cooling Technology
6-21
built at the mouth of a coal mine. Thus, in spite of certain cost and other disadvantages, air-cooled condensers offer an important alternative to more conventional cooling water systems and, since 1968, some 65 installations are already operating in various parts of the world, many on combined cycle plants.
Air Cooled Condensers
Figure 1.0 shows a general view of an air-cooled condenser typically of the A-frame design. Berger(1992)(2) indicates that not only does this design facilitate condensate draining and collection but it also ensures that there are no dead zones in the heat transfer surface, that there is a high operating stability during load transients, while it also eliminates freezing even with ambient temperatures as low as –58 Deg.F (-50 Deg.C).
The vapor inlet header constitutes the apex of the ‘A’. A large-diameter and comparatively lengthy pipe connects this header to the exhaust from the low pressure stage of the turbine and its large volume makes this inlet subsystem prone to air inleakage as well as requiring a longer time to evacuate during plant startup.
At the bottom of the A-frame are two outlet headers, each connected to the inlet header by banks of finned tubes as shown in Figure 2.0. Most of the panels on an air-cooled condenser are of this parallel flow type, in which both the condensing vapor and condensate flow together down the insides of the tubes. Piping also connects the two outlet headers together, allowing vapor to pass from one side to the other as well as the condensate to be collected.
Examination of Figure 1. shows dearator (or dephlegmator) panels located towards the center of the banks of tubes. A cross-section through these panels is provided in Figure 3. and it will be seen that the vapor and condensate are in a counter flow arrangement, the vapor rising up into the tube banks from the outlet headers while the condensate flows back down to these headers so that it can be collected and withdrawn. Meanwhile, the upper ends of the tubes in these sections are connected to their own headers, which are also provided with steam jet air ejectors for the removal of non-condensibles.
The finned tubes are necessary because of the low thermal conductivity, low density and low heat capacity of air. The larger surface area required to obtain a given heat removal rate, the area increasing with the design ambient air temperature, also means that the footprint of air-cooled condensers is larger than their water cooled equivalents. This is indicated in Figure 4, the air-cooled condenser provided to Black Hills Power and Light plant in Wyoming, which also shows the type of support structure required. One other problem is the noise created by the large number of fans, which may introduce its own environmental problem. Finally, an air-cooled condenser is more expensive that its water-cooled equivalent. However, in spite of these negative attributes, the air-cooled condenser has been adopted as the equipment of choice for at least 65 installations as the only way to provide new sources of power in difficult locations.

Session 6: Alternative Cooling Technology
6-22
The Environmental Protection Agency and Dry Cooling
In 2000, the U.S. Environmental Protection Agency(3) conducted a comparative study of the environmental impacts of wet vs. dry cooling. Their conclusion was that the energy consumption per lb. condensate was higher for dry cooling than for wet cooling and that the atmospheric emissions associated with that energy consumption was also higher. The energy penalty also increases with the ambient air temperature. These disadvantages are offset by the cooling water intake flow being reduced by 99% over that required by a once-through system; or 4-7% over a closed cooling water system. They also noted that dry cooling eliminates visual plumes, fog, mineral drift and water treatment and waste disposal issues. However, their conclusion was that, ‘dry cooling does not represent the “best technology available (BTA)” for minimizing environmental impact’.
Much of the E.P.A’s concern is that ‘the high costs and energy penalty of dry cooling systems may remove the incentive for replacing older coal-fired plants with more efficient and environmentally favorable new combined-cycle facilities’, the latter presumably equipped with wet-cooling systems. Their general concern is understood but should not prevent plants being built using air cooled condensers where there is no practical alternative.
Fouling Tendencies of Air Cooled Condenser
The external surfaces of the finned tubes on air-cooled condensers are very prone to fouling from pollen, dust, insects, leaves, plastic bags, bird carcasses, etc. Not only is the air flow affected but also the heat transfer coefficient, the deterioration in performance increasing unit operating costs. In severe cases, fouling can also limit the power generation capacity of the turbogenerator.
To improve the heat removal capacity of an air-cooled condenser under conditions of high ambient air temperature, operators will sometimes spray water on the heat exchanger to reduce surface temperature. Unfortunately, depending on the quality of water used, this sometimes leads to new scale formation on the tube fins and, again, reduces the heat transfer rate if the deposits are allowed to accumulate.
Performance Calculation Principles
Several standards exist for calculating the performance of air-cooled heat exchangers and it would seem to be approaching an exact science. Among these standards are ASME PTC.30(4), API Standard 661(5) and the Standards for Air-cooled Heat Exchangers published by the Air-cooled Heat Exchanger Manufacturers Association(6).
However, there are no standards at this time for calculating the performance of air-cooled condensers, nor can the standards for air-cooled heat exchangers be applied. One main difference is that, while air-cooled heat exchangers with their fans are built as discrete units, the fans provided with air-cooled condensers are not uniquely associated with a corresponding bank of tubes. Thus, when a fan is switched off or its speed reduced, not only is the air flow to all tube banks in the condenser reduced but the distribution of the air among the tube banks can also

Session 6: Alternative Cooling Technology
6-23
change. Some air-cooled condensers are also equipped with programmable logic systems that adjust fan speeds, vanes, etc. automatically to ensure that subcooling of the condensate does not occur but this, again, affects the distribution of the air. Fouling of the tube surfaces can also affect air distribution. Finally, local meteorological and ambient conditions have their own effects on the performance of air-cooled condensers.
Kroger(7) outlines in detail a method for calculating the performance of air-cooled condensers from first principles, based on an extensive knowledge of the condenser design data. Unfortunately, this data is not readily available and the calculations are complicated. The following is, therefore, an attempt to gage the performance of air-cooled condensers empirically, using a selected set of operating conditions as the frame of reference.
It is suggested that there be two references cases, both assuming that the turbogenerator is running at full load. Case(a) would be with all air-cooled condenser fans running at full speed and Case(b), also with the turbine at full load but with the fans running at half speed. The reason for having two reference cases is that, in cold weather, it may not be desirable to run the fans at full speed. The condenser should be calibrated when clean for both of these cases, using at least the set of instrumentation indicated in Figure 5.0, the values being averaged across all banks. Among the criteria to be captured for the reference cases, against which subsequent performance can be compared, are:
• Pressure of air at inlet to tube banks - Pai • Pressure of air leaving tube banks - Pao • Pressure drop across the tube banks – ∆Ptb = Pai - Pao (1) • Corresponding air inlet temperature - Tai • Corresponding air outlet temperature - Tao • Vapor saturation temperature - Ts • Condenser backpressure - Ps • Pressure of air at fan inlet - Pfi • Pressure of air at fan outlet - Pfo • Pressure drop across the fans - ∆Pfan = Pfo - Pfi (2) • Fan speed - Nrpm • Condenser duty – Q = W cond*(Hvap - Hliq) (3) • Ambient air temperature - Tamb • Effective modified heat transfer coefficient: Umod = Aeff * Ueff (4)
Using this combined function means that the effective surface area of the tube banks does not need to be known. Assuming that the log mean temperature difference can be calculated from:
LMTD = (Tao – T ai) / logn((Ts - Tai) / (Ts – T ao)) (5)
Then Umod = Aeff * Ueff = Q / LMTD (6)
Meanwhile, the operating data can be presented in several ways:

Session 6: Alternative Cooling Technology
6-24
• One curve that is often available is shown in Figure 6.0, in which the condenser duty is plotted against inlet dry bulb temperature for various values of condenser backpressure. The curve in Figure 6.0 is used when all fans are running at full speed and a similar but different curve is usually available for fans running at half speed. These are in fact condenser capacity curves and can be calibrated against measured conditions when the unit is first started up and while the finned-tube banks in the condenser are still clean. Putman(8) has shown how, subsequently, current condenser duty can be calculated from present backpressure and turbogenerator load, using the low pressure stage expansion lines included in the thermal kit data provided by the manufacturer of the turbogenerator. This may be compared with the condenser duty calculated in accordance with equation (3) above.
• Another form of data presentation is shown in Figure 7.0, in which condenser backpressure is plotted against the percent of design air flow and for various values of the ambient air temperature. The air flow can be estimated from fan characteristic curves using the pressure at the inlet to the tube banks mounted in the A-frame. The actual backpressure can then be compared with that expected at 100% air flow for the current ambient air temperature. The avoidable condenser loss corresponding to this deviation in backpressure can be estimated using, again, the expansion lines included in the thermal kit data for the low pressure stage of the turbogenerator.
Of course, the performance of an air-cooled condenser can become degraded not only by the external fouling of the finned tubes but also by any internal fouling from the condensate (e.g. ammonia corrosion) or by air ingress into the condensing vapor. Harpster(9) has suggested a way of distinguishing between the effects of fouling and air ingress, using instrumentation applied to the air removal system, injecting known amounts of air or nitrogen into that part of the system operating under vacuum and noting the change in effective heat transfer. The air removal system instrumentation can subsequently be used to estimate the contribution of air ingress to the change in the effective heat transfer coefficient.
Cleaning Techniques for Air-Cooled Condensers(10)
The three principal methods for cleaning the external surfaces of air-cooled condensers are as follows:
• Fire hose
• High pressure handlance
• Automated cleaning machine
Fire Hose
While the volume of water consumed is high, a fire hose offers only a low washing effect because of the low pressure involved. The galvanized surfaces of the tubes and fins are not damaged by this method. Unfortunately, in order to perform cleaning the plant must be taken out of service and scaffolding erected. The process may also be time and labor intensive depending on unit design and accessibility.

Session 6: Alternative Cooling Technology
6-25
It has also been found that use of the fire hose only leads to small performance improvements even if the surfaces seem to be optically clean. The reason is that only a portion of the fouling material is washed off while the remainder is pressed between the fin tubes and can not be washed out by this method. Furthermore, once compressed, the fouling material not only hinders heat transfer but also obstructs air flow.
High Pressure Handlance
The high pressure handlance method offers low water consumption and a high water pressure. Unfortunately, the latter can cause the galvanized surfaces to become damaged or even cause the fins to be snapped off. Again, the plant must be taken out of service and scaffolding erected in order that cleaning can be performed. Unit accessibility will affect cleaning productivity.
As with the use of a fire hose, this procedure only leads to small performance improvements and, once the fouling material has been compressed, it hinders heat transfer and obstructs air flow.
Automated Cleaning Machine
The automated cleaning machine, an example of which is shown in Figure 8.0, uses a significant volume of water; but at a pressure that, while allowing for effective surface cleaning, avoids damaging galvanized surfaces and fins. The main components of the system include a nozzle beam, a tracking system, and a control panel. The water contains no additives. The nozzle beam is optimally matched to the tube bundle geometry, with a constant jet angle. Optimizing the geometry of the nozzle beam involves determining the proper nozzle distance to the surface, the jet energy and the selection of the appropriate nozzle design. Variations in nozzle beams are shown in Figures 9.0 and 10.0. The constant jet angle also ensures that there is no damage to or snapping off of tube fins, regardless of the material from which they are fabricated. Furthermore, the carriage on which the nozzle beam is mounted moves at a constant speed and so allows the fouling to be removed effectively and uniformly across the heat exchange elements of the condenser. Because the fouling material is removed, air flow is no longer obstructed.
An important advantage of the automated cleaning method is that cleaning can be performed during operation while the unit is still on-line. Further, there is no need for scaffolding and labor requirements are minimized. The automated cleaning system can be applied in three principal forms:
a. Permanently installed system complete with PLC controls, one system being supplied for each side of the condenser as previously shown in Figure 8.0.
b. Semi-automatic system in which only the guide rails are permanently installed, the nozzle beam carriage being moved from section to section as the cleaning progresses as shown in Figure 11.0.
c. Portable service unit, together with a portable nozzle beam carriage and control unit. The cleaning service is performed in-house or by a qualified service provider as shown in Figure 12.0.

Session 6: Alternative Cooling Technology
6-26
Performance Improvements from Cleaning
Data from several power plants equipped with air-cooled condensers show that, after cleaning to remove external fouling, it was possible to operate the unit with the fans running at half-speed rather than full-speed. The lower auxiliary power consumption resulted in a reduction in operating costs.
In another plant, condenser cleaning resulted in the generated power rising from 15 MW to 18 MW.
To clean an air-cooled condenser installed in a 400 MW power plant located in the United Kingdom, a semi-automatic cleaning system was used. An analysis of the heat rate deviation curve for this unit showed that a 1 in.Hg improvement in turbine back pressure was equivalent to savings of $188.00/h accompanied by an increase in generation capacity of 4 MW.
Turbine back pressure before cleaning = 3.40 in.Hg.
Turbine back pressure after cleaning = 2.62 in.Hg.
Back pressure reduction = 0.78 in Hg.
Savings at a 75% load factor = 0.78 * 188.00 * 7 * 24 * 0.75 = $18,476/week
The data was taken at an ambient temperature of 59 Deg.F and it was found that the air flow before cleaning was 78% of its design flow rate.
Conclusion
In the power industry, the reduced availability of water as the cooling medium for the condensation of exhaust steam, combined with an increased emphasis on environmental considerations, often makes the selection of an air-cooled condenser a viable alternative to the traditional steam surface condenser. Although their capacity is sometimes limited by ambient conditions, their selection can avoid a number of other problems, and often facilitate the acceptance of the proposed plant by the permitting authorities. Further, because the external surfaces of the finned tubes on the air-cooled condenser are prone to fouling, an effective cleaning system is required. One such system has been demonstrated. Finally, there is a need to develop new standards for acceptance test procedures and for calculating their performance under a variety of operating conditions.
References
1. Blankinship, Steve, (2001), “Georgia Power’s New Cooling Tower Design Reduces Environmental Impact”, Power Engineering, September 2001, p. 11.
2. Berger, Norbert, Dry Cooling Systems for Large Power Stations, publ. GEA Energietechnik Gmbh, 1992
Session 6: Alternative Cooling Technology
6-27
3. EPA Rule 316(b) New Facility Rule, Chapters 3: Energy Penalties and Chapter 4: Dry Cooling, publ. EPA (2000)
4. ASME PTC.30, (1991) Air Cooled Heat Exchangers, publ. American Society of Mechanical Engineers, New York, NY
5. API Standard 661, Air-Cooled Heat Exchangers for General Refinery Service, publ. American Petroleum Institute, Washington, D.C.
6. Standard for Air-Cooled Heat Exchangers, (1986), publ. Air-Cooled Heat Exchanger Manufacturers Association, New York.
7. Kröger, D.G., (1998), Air-Cooled Heat Exchangers and Cooling Towers, publ. Begell House, New York
8. Putman, Richard E. (2001), Steam Surface Condensers: Basic Principles, Performance Monitoring and Maintenance, publ. ASME Press, New York, NY.
9. Harpster, J.W. (2001), “On Understanding the Behavior of Non-condensables in the Shell Side Steam Surface Condensers”, Proceedings of IJPGC-2001, New Orleans.
10. Müller-Steinhagen, H., (2000), “Mechanical Cleaning with High Pressure Water of the External Surfaces of Air Cooled Heat Exchangers”, Heat Exchanger Fouling: Mitigation and Cleaning Technologies, publ. PUBLICO Publcations, Essen/Germany, pp.76-87.

Session 6: Alternative Cooling Technology
6-28
Figure 1 General View of Air-cooled Condenser
TURBOGENERATOR
EXHAUST VAPOR
PARALLELFLOW
CONDENSER
CONDENSATE RETURN
VAPOR FLOW
FAN
MOTOR
AIRFLOW
CONDENSATE COLLECTOR
AIR-COOLED CONDENSER
FIGURE 2.0
PARALLELFLOW
CONDENSER
AIRFLOW
PARALLEL FLOW SECTIONS
INLETHEADER
VAPOR
CONDENSATE
Figure 2 Air-Cooled Condenser, Parallel Flow Sections

Session 6: Alternative Cooling Technology
6-29
TURBOGENERATOR
EXHAUST VAPOR
STEAM JETAIR EJECTOR
CONDENSATE RETURN
VAPOR FLOW
FAN
MOTOR
AIRFLOW
CONDENSATE COLLECTOR
AIR-COOLED CONDENSER
FIGURE 3.0DEAERATOR SECTION
INLETHEADER
AIRFLOW
STEAM JETAIR EJECTOR
COUNTERFLOW
CONDENSER(DEPHLEGMATOR)(OR DEAERATOR)
VAPORCONDEN-SATE
Figure 3 Air-Cooled Condenser, Deaerator Section
Figure 4 Air Cooled Condenser in Black Hills Plant

Session 6: Alternative Cooling Technology
6-30
EXHAUST VAPOR
FAN
MOTOR
AIR-COOLED CONDENSER
FIGURE 5.0
INLETHEADER
T
T
T
P
P
ao
ai
fo
fi
amb
pao
pai
INSTRUMENTTAION
Ts
Figure 5 Air Cooled Condenser, Instrumentation
INLET DRY BULB TEMP. - Deg.F
CO
ND
EN
SE
R IN
PU
T E
NE
RG
Y -
MB
TU/h
CONDENSER CHARACTERISTICSALL FANS AT FULL SPEED
FIGURE 6.0
15 in.Hg
13 in.Hg
11 in.Hg
9 in.Hg]
7 in.Hg
6 in.Hg
5 in.Hg
4 in.Hg
3 in.Hg
2 in.Hg
Figure 6 Condenser Characteristics, All Fans at Full Speed

Session 6: Alternative Cooling Technology
6-31
CONDENSER BACKPRESSURE CHARACTERISTICS
FIGURE 7.0
DESIGN AIR FLOW - PERCENT
TUR
BIN
E B
AC
KP
F RE
SS
UR
E -
in.H
g
AMBIENTTEMP.
81.5
77.0
72.5
68.0
63.5
59.0
54.5
50.045.5
41.036.5
Deg.F
Figure 7 Condenser Backpressure Characteristics
Figure 8 Automated Cleaning Machine
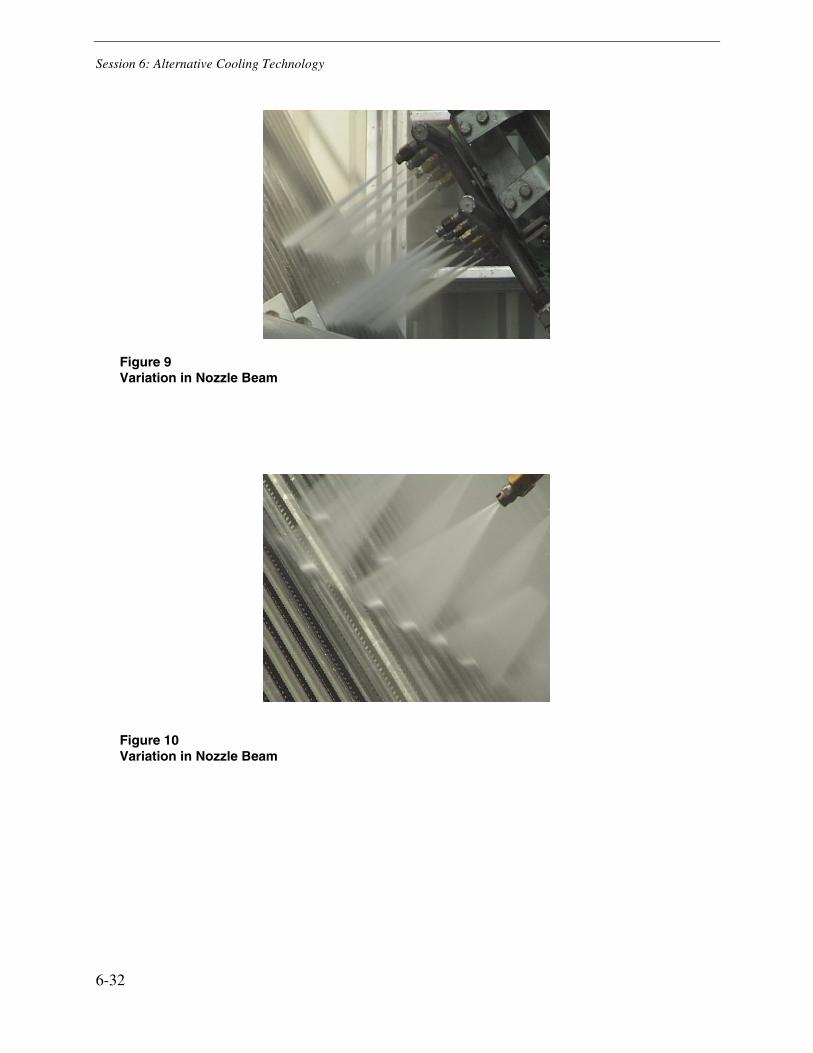
Session 6: Alternative Cooling Technology
6-32
Figure 9 Variation in Nozzle Beam
Figure 10 Variation in Nozzle Beam
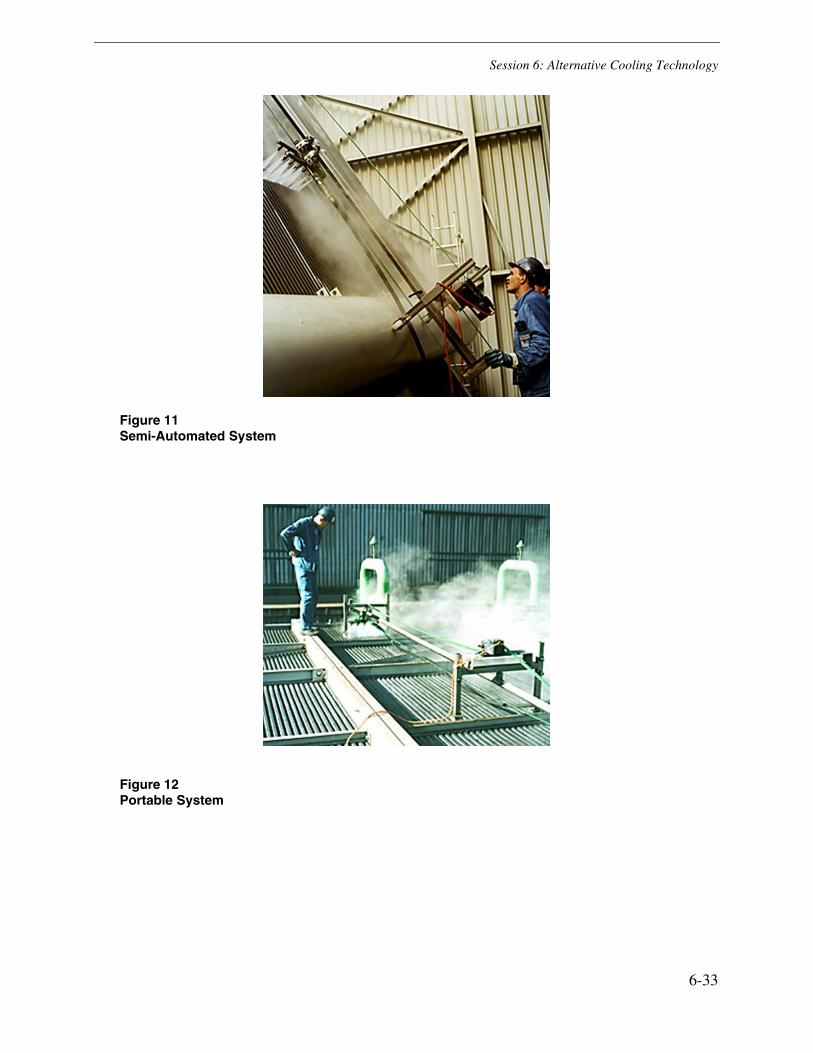
Session 6: Alternative Cooling Technology
6-33
Figure 11 Semi-Automated System
Figure 12 Portable System


Session 6: Alternative Cooling Technology
6-35
EXPERIENCE EVALUATING CONDENSER PERFORMANCE AND TUBE FOULING WITH THE ASME PERFORMANCE TEST CODE ON STEAM
SURFACE CONDENSERS PTC 12.2 -1998
Dale C. Karg Santee Cooper
Moncks Corner, SC
John M. Burns Burns Engineering Services Inc.
Topsfield, MA
Michael C. Catapano Powerfect Inc. Livingston, NJ
Abstract
The Performance Test Code on Steam Surface Condensers underwent a major revision in 1998 with the release of ASME PTC 12.2 – 1998, “Performance Test Code on Steam Surface Condensers”. One of the improvements over the previous code revisions was the development of a new method for determining or estimating tube bundle fouling. Instrumentation has been developed to apply the new methods and was used in a test program on a recently retubed condenser. This paper describes the testing program initiated by Santee Cooper at the Winyah Generating Station where a successful attempt to utilize the guidelines established by the new Code were carried out.
The objectives of our testing program were to:
Evaluate the data collected from the instrumentation developed to determine tube bundle
fouling.
Propose methods for utilizing the new instrumentation to evaluate tube bundle fouling
overtime.
Compare the results of the test to design based on the Heat Exchange Institute Standards for
Steam Surface Condensers (HEI)[2].
The initial results of the program demonstrate a good correlation between the actual versus projected condenser performance and tube bundle fouling by employing the methodology outlined in ASME PTC 12.2 – 1998. Santee Copper’s retubed condenser provided an excellent opportunity for the application of the new test code since the condition of the replacement heat

Session 6: Alternative Cooling Technology
6-36
transfer surface was known as “virtually clean”. The purpose of the testing was solely for investigative and information purposes as there was no performance “acceptance” criteria placed on the retubing project.
Introduction
The determination of the degree to which waterside tube fouling and heat transfer resistances influence condenser performance has long been a challenge to conducting accurate condenser testing. For meaningful results during acceptance testing, the adverse effects of fouling on condenser performance (pressure) needs to be accounted for. As well, during routine operation, quantifying the incremental reduction in power output and higher heat rate caused by tube fouling would allow better informed decisions as to the resultant cost of fouling versus the cost justification for scheduling condenser cleanings. The 1998 revision to ASME PTC 12.2 [1] now provides practical procedures to quantify tube bundle fouling and determine the heat transfer resistances.
The retubing of a condenser in the spring of 2000 at Santee Cooper’s Winyah Generating Station in Georgetown, South Carolina provided an opportunity to apply the methods specified in ASME PTC 12.2 –1998. The results of the testing would be compared to the expected performance of the new tubing based on performance rating methods such as HEI.
As recommended by the test code, it would be necessary to instrument the individual water temperature of several pairs of condenser tubes to determine the tube fouling resistance. The instrumentation device was not a readily available product. Powerfect Inc. offered to design and provide prototype fixtures (tube fouling monitors) based on their experience with patented tube testing and plugging systems. The requirements of this method are in section 4.3.12, “Tube Bundle Fouling (Cleanliness)” of the Code. Burns Engineering Services provided technical support on optimizing the location of the tube fouling monitors and utilization of the test code.
Condenser Retubing
The original condenser was supplied with 18 BWG Admiralty tubes and 90-10 Cu-Ni in the air cooler and periphery areas. The condenser cooling water source is from a cooling pond that receives fresh water for makeup. After 22 years of service the condenser had more than 10% of its tubes plugged. Condenser tube leaks were a concern to maintaining good boiler water chemistry. The original condenser showed evidence of at least three failure modes. A large number of admiralty tubes failed due to steam side ammonia attack below the air removal section. Other failures were attributed to significant pitting on the tube side, likely due to under deposit corrosion. Still others were possibly a result of sulfide attack.
To provide better corrosion protection from ammonia attack and avoid significant modifications to the condenser tube support structure, 90-10 Cu-Ni tube material was selected for retubing the condenser. Analysis of the performance impact of material changes from 18 BWG Admiralty to either 18 or 20 BWG 90-10 Cu-Ni was completed. The analysis to determine the change in design condenser pressure followed the calculation procedures from the condenser
Session 6: Alternative Cooling Technology
6-37
manufacturer’s manual, which is based on HEI [2] methods. The original design information is as follows:
Original Tubes:
Admiralty 18 BWG Main Bank
Quantity 15,088
90–10 Cu-Ni 18 BWG Air Cooler & Periphery
Quantity 1,400
Cooling Surface 151,000 Sq. Ft. Effective Length 35’-0”
Original Design:
Steam Condensed 1.361 x 10⁶ lb./hr.
Heat Load to Circ. Water 1.309 x 10⁹ Btu/hr
Temp Inlet Circ. Water 79° F
Temp Outlet Circ. Water 101.77° F
Circ. Water Flow (Max) 115,000 GPM
Tubeside Velocity (Max) 7 FPS
Flow Passes 2
Cleanliness Factor 85%
Absolute Pressure 2.40 in. Hg.
The design condenser pressure was expected to increase 0.10 in. HgA to 2.50 in. HgA if the tubing was changed from Admiralty to 90-10 Cu-Ni using the original 18 BWG gauge. A PEPSE thermal heat balance model indicated that the increase in design condenser pressure would decrease generation by 729 kW and increase heat rate by 18.7 Btu/kWh on this 300,000 kW unit.
With the material selected, a comparison was made between 18 and 20 BWG tubing to determine the overall expected improvement in performance with better heat transfer provided by the thinner wall 20 BWG tubing. As mentioned above, the calculated design pressure for 18 BWG is 2.50 in. HgA, but it decreased to 2.49 in. HgA for the 20 BWG tubing. The small difference of 0.01 in. HgA in condenser pressure was estimated to decrease heat rate by 2 Btu/kWh and increase output by 74 kW. There was a significant material cost savings associated with the thinner 0.035 in. 20 BWG tubing versus the 0.049 in. 18 BWG tubing if it could be utilized without significant modification to the tube supports.
Santee Cooper contracted Burns Engineering Services to conduct a vibration analysis for the existing tube support spacing and use of the 20 BWG tubing. As a conservative measure to reduce vibration potential, the study recommended that the upper tubes be staked in-between support plates. The staking provided a reasonable cost solution to take advantage of the lower

Session 6: Alternative Cooling Technology
6-38
tube cost and slight performance improvement of the 20 BWG tubing. The decision was made to retube with the 20 BWG 90-0 Cu-Ni tubing with 18 BWG 70-30 Cu-Ni tubing in the air removal and impingement areas.
Performance and Tube Bundle Fouling Test Methodology
A test program following the methods outlined in ASME PTC 12.2 –1998 was initiated and conducted to:
Gain experience with the new test code
Evaluate newly developed instrumentation to measure tube bundle fouling
Propose methods of monitoring tube bundle fouling over time
The test results enabled a comparison of actual versus expected performance for the new
tubing material and wall thickness.
Tube bundle fouling resistance, as per the test code, is determined by measuring the temperature rise of adjacent pairs of tubes distributed throughout the bundle. One tube of each pair is left in the normally fouled condition of the condenser, while the other is thoroughly cleaned or replaced with a new tube. If the condenser is new or retubed, the “clean” reference tubes should be plugged for the period of time between the test and while the condenser is put back in service. As the reference tubes representing the overall fouled condition of the condenser begin to foul the fouling resistance of these tubes will increase. When the clean tubes are unplugged just prior to the test the fouling resistance can be measured as the difference in temperature rise between clean tubes and those representing the overall fouled condition of the tube bundle. The period of time will depend on the aggressiveness of the waterside fouling.
The code suggests a pair of tube fouling monitors be installed for each 2,000 tubes but not to exceed 16 pairs for the condenser. In our case with 15,088 tubes, 8 pairs were installed. During installation additional pairs should be considered to provide redundancy in case any of the sensors fail. Depending on the aggressiveness of fouling, access to the condenser waterboxes, importance of the test and integrity of the installation, consideration to adding as many as 50 percent additional fouling monitors should be considered. Since the installation was a two-pass condenser application, the inlet temperature of the second pass had to be measured as well.
Fouling resistance is calculated for each pair of tubes and then averaged to represent the fouling resistance of the condenser per equation 5.1.11 of the code (see the Test Computation Section for the equation). The data required by the test code:
Common inlet temperature
Condenser pressure
Overall flow
Discharge temperature of each tube pair (in addition to the inlet temperatures to the second
pass for this 2-pass condenser.)

Session 6: Alternative Cooling Technology
6-39
Tube Bundle Fouling Instrumentation
The main objective was to provide an anchoring fixture that could accurately position the temperature sensing leads to the selected, subject tubes, without disturbing the cooling water flow. Care was used to minimize any adverse effects to the overall effort of getting accurate temperature data.
The tube fouling monitors securely hold the temperature sensor at the outlet of the selected tubes or inlet (required for two-pass condensers). The instrument wiring from each sensor is run carefully between tube ligaments and non-mechanically fastened to the tubesheet in several locations. The wiring exits each waterbox at a single location through a full port ball valve and is connected to a data logger. Although not the method utilized for our test, a typical sketch from the test code (Figure G.1) is shown as a method of securing tube fouling monitor sensors:
`
The test code provides the methodology for locating the monitors. With assistance from Burns Engineering Services, the monitors were located in the approximate centroids of equal tube sectors and not within the first three periphery rows. The test tubes were also selected to be near the penetrations that provided the exit for the instrumentation wiring to pass through the waterboxes.
Test Procedure
The test was conducted with instrumentation traceable to the National Institute of Standards and Technology (NIST). All pressure and temperature instrumentation was calibrated prior to the

Session 6: Alternative Cooling Technology
6-40
test. The Code requires that the circulating water discharge temperature include at least one sensor every 1.5 square feet. This condition was met with 5 instruments of various depths for each of the 2 discharge lines. The inlet and outlet temperatures were measured with precision, calibrated RTD’s. Condenser pressures were measured with four basket tips and precision calibrated pressure transmitters. The unit was operated within six percent of design full load during the test.
With the exception of not being able to measure the circulating water flow, the PTC 12.2 – 1998 test procedure was followed. While we recognize that the circulating water flow measurement is a significantly important test parameter it could not be measured during the test. We installed Pitot tube taps as far downstream of the discharge waterbox as possible but the readings were very unstable. Readings taken with an ultrasonic meter were also very unstable. We believe there was too much turbulence in this area.
To estimate the flow, the total dynamic head (TDH) was measured and compared to the flow versus head system curve. The TDH intersected the flow curve very close to the design flow. The circulating water flow was therefore assumed to be at design for the purposes of our demonstration. This method of flow estimation would be acceptable for performance monitoring but not accurate enough for acceptance testing.
Test Computations
The test code provides detailed calculation procedures in Section 5.0 with an example in appendix D. All of the following equation numbers refer to the ASME PTC 12.2 – 1998 test code.
From the test data the test heat load (Q+) is computed from equation 5.1.1 as follows:
Q+ = w+ * c+
p * (T+
2 - T+
1)
Where: + = measured or calculated from test data
Q+ = condenser heat load (Btu/hr)
w+ = flow rate (lb/hr)
c+p = specific heat (Btu/lb°F)
T+2 = outlet temperature (°F)
T+1 = inlet temperature (°F)
From the test data the overall test heat transfer coefficient is calculated using equation 5.1.2:
U+ = Q+ / (Ao * LMTD+)
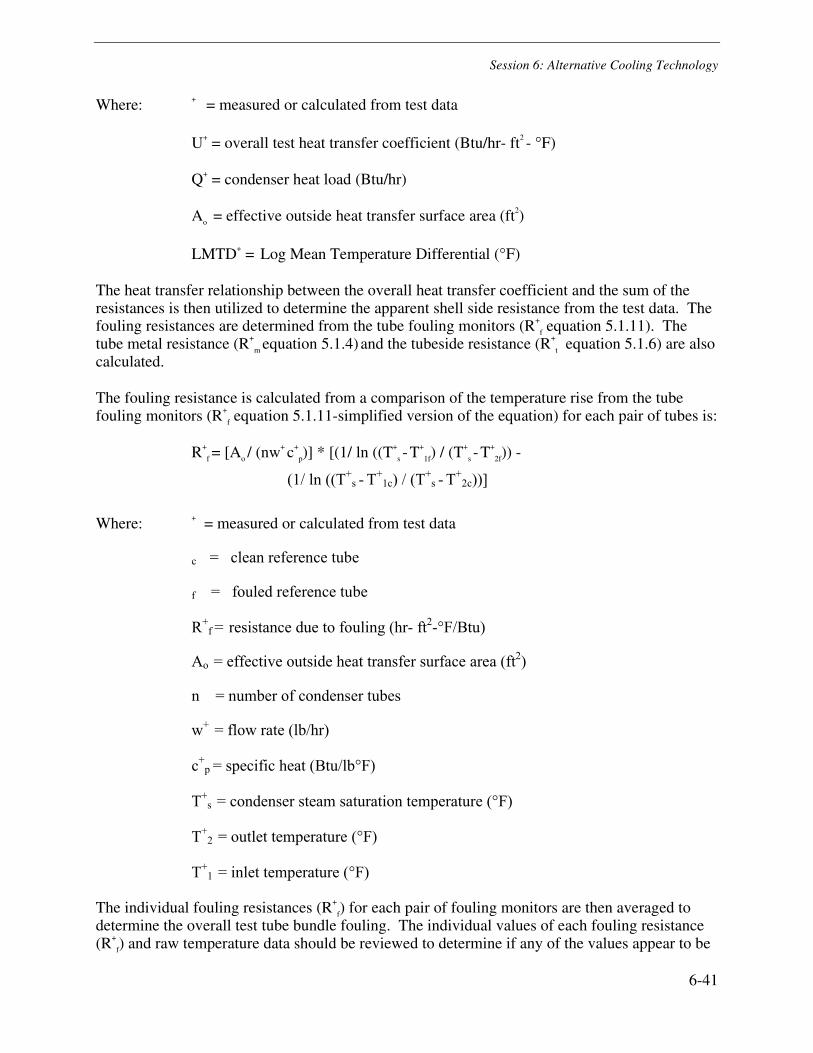
Session 6: Alternative Cooling Technology
6-41
Where: + = measured or calculated from test data
U+ = overall test heat transfer coefficient (Btu/hr- ft2 - °F)
Q+ = condenser heat load (Btu/hr)
Ao = effective outside heat transfer surface area (ft2)
LMTD+ = Log Mean Temperature Differential (°F)
The heat transfer relationship between the overall heat transfer coefficient and the sum of the resistances is then utilized to determine the apparent shell side resistance from the test data. The fouling resistances are determined from the tube fouling monitors (R+
f equation 5.1.11). The tube metal resistance (R+
m equation 5.1.4) and the tubeside resistance (R+
t equation 5.1.6) are also calculated.
The fouling resistance is calculated from a comparison of the temperature rise from the tube fouling monitors (R+
f equation 5.1.11-simplified version of the equation) for each pair of tubes is:
R+
f = [Ao / (nw+ c+
p)] * [(1/ ln ((T+
s - T+
1f) / (T+
s - T+
2f)) -
(1/ ln ((T+s - T
+1c) / (T
+s - T
+2c))]
Where: + = measured or calculated from test data
c = clean reference tube
f = fouled reference tube
R+f = resistance due to fouling (hr- ft2-°F/Btu)
Ao = effective outside heat transfer surface area (ft2)
n = number of condenser tubes
w+ = flow rate (lb/hr)
c+p = specific heat (Btu/lb°F)
T+s = condenser steam saturation temperature (°F)
T+2 = outlet temperature (°F)
T+1 = inlet temperature (°F)
The individual fouling resistances (R+
f) for each pair of fouling monitors are then averaged to determine the overall test tube bundle fouling. The individual values of each fouling resistance (R+
f) and raw temperature data should be reviewed to determine if any of the values appear to be
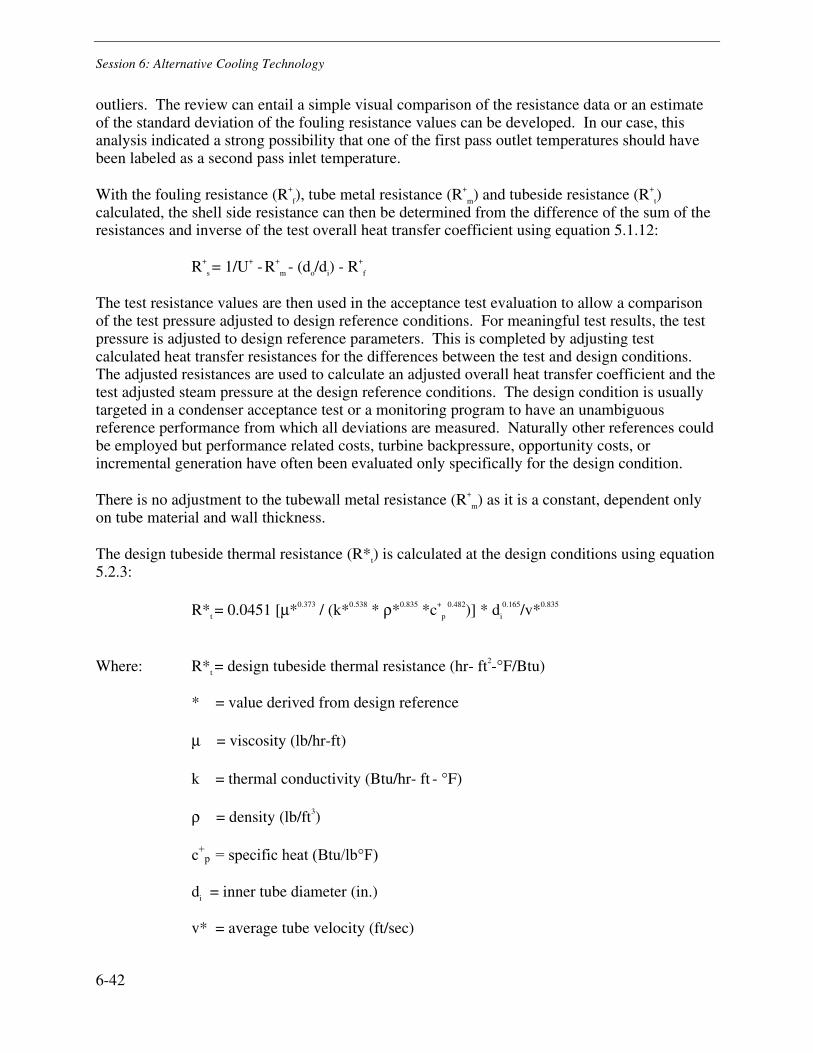
Session 6: Alternative Cooling Technology
6-42
outliers. The review can entail a simple visual comparison of the resistance data or an estimate of the standard deviation of the fouling resistance values can be developed. In our case, this analysis indicated a strong possibility that one of the first pass outlet temperatures should have been labeled as a second pass inlet temperature.
With the fouling resistance (R+
f), tube metal resistance (R+
m) and tubeside resistance (R+
t)
calculated, the shell side resistance can then be determined from the difference of the sum of the resistances and inverse of the test overall heat transfer coefficient using equation 5.1.12:
R+
s = 1/U+ - R+
m - (do/di) - R+
f
The test resistance values are then used in the acceptance test evaluation to allow a comparison of the test pressure adjusted to design reference conditions. For meaningful test results, the test pressure is adjusted to design reference parameters. This is completed by adjusting test calculated heat transfer resistances for the differences between the test and design conditions. The adjusted resistances are used to calculate an adjusted overall heat transfer coefficient and the test adjusted steam pressure at the design reference conditions. The design condition is usually targeted in a condenser acceptance test or a monitoring program to have an unambiguous reference performance from which all deviations are measured. Naturally other references could be employed but performance related costs, turbine backpressure, opportunity costs, or incremental generation have often been evaluated only specifically for the design condition.
There is no adjustment to the tubewall metal resistance (R+
m) as it is a constant, dependent only on tube material and wall thickness.
The design tubeside thermal resistance (R*t) is calculated at the design conditions using equation 5.2.3:
R*t = 0.0451 [µ*0.373 / (k*0.538 * ρ*0.835 *c+
p
0.482)] * di
0.165/v*0.835
Where: R*t = design tubeside thermal resistance (hr- ft2-°F/Btu)
* = value derived from design reference
µ = viscosity (lb/hr-ft)
k = thermal conductivity (Btu/hr- ft - °F)
ρ = density (lb/ft3)
c+p = specific heat (Btu/lb°F)
di = inner tube diameter (in.)
v* = average tube velocity (ft/sec)
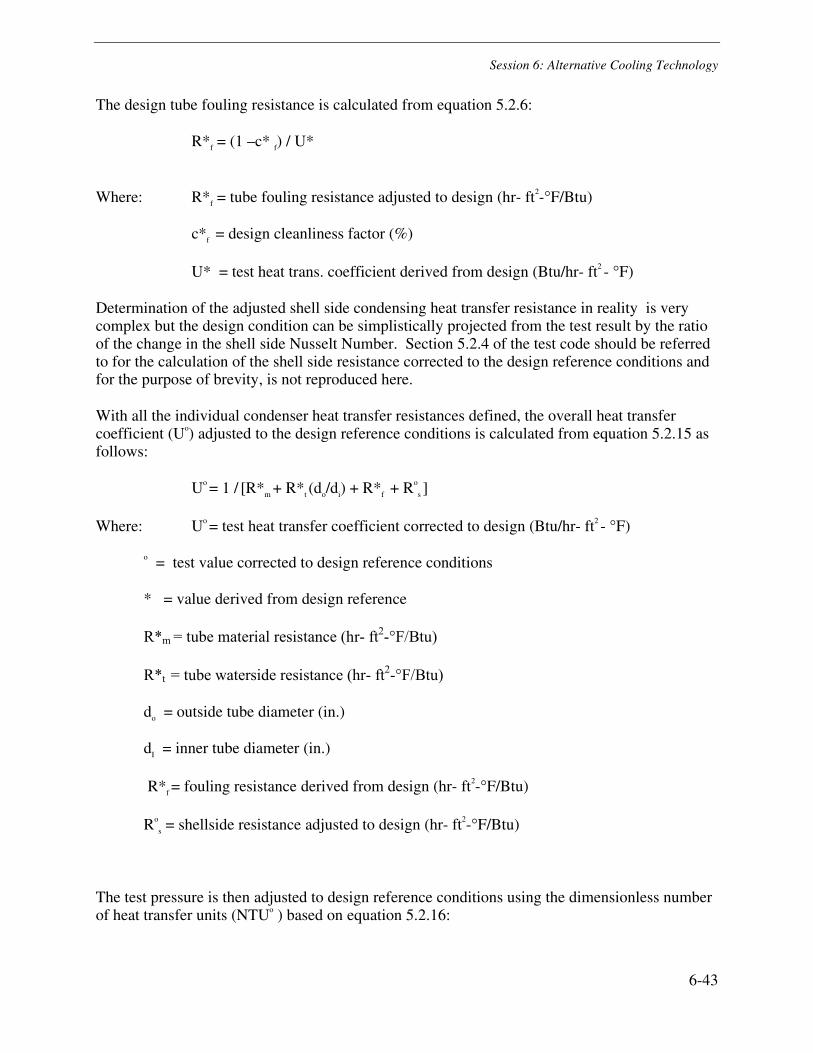
Session 6: Alternative Cooling Technology
6-43
The design tube fouling resistance is calculated from equation 5.2.6:
R*f = (1 – c* f) / U*
Where: R*f = tube fouling resistance adjusted to design (hr- ft2-°F/Btu)
c*f = design cleanliness factor (%)
U* = test heat trans. coefficient derived from design (Btu/hr- ft2 - °F)
Determination of the adjusted shell side condensing heat transfer resistance in reality is very complex but the design condition can be simplistically projected from the test result by the ratio of the change in the shell side Nusselt Number. Section 5.2.4 of the test code should be referred to for the calculation of the shell side resistance corrected to the design reference conditions and for the purpose of brevity, is not reproduced here.
With all the individual condenser heat transfer resistances defined, the overall heat transfer coefficient (Uo) adjusted to the design reference conditions is calculated from equation 5.2.15 as follows:
Uo = 1 / [R*m + R*t (do/di) + R*f + Ro
s ]
Where: Uo = test heat transfer coefficient corrected to design (Btu/hr- ft2 - °F)
o = test value corrected to design reference conditions
* = value derived from design reference
R*m = tube material resistance (hr- ft2-°F/Btu)
R*t = tube waterside resistance (hr- ft2-°F/Btu)
do = outside tube diameter (in.)
dI = inner tube diameter (in.)
R*f = fouling resistance derived from design (hr- ft2-°F/Btu)
Ro
s = shellside resistance adjusted to design (hr- ft2-°F/Btu)
The test pressure is then adjusted to design reference conditions using the dimensionless number of heat transfer units (NTUo ) based on equation 5.2.16:
Session 6: Alternative Cooling Technology
6-44
NTUo = (Uo * A*) / (c*p * w*)
Where: NTUo = Number of Heat Transfer Units
o = test value adjusted to design reference conditions
* = value derived from design reference
Uo = test heat transfer coefficient corrected to design (Btu/hr- ft2 - °F)
Ao = effective outside heat transfer surface area (ft2)
c*p = specific heat (Btu/lb°F)
w* = flow rate (lb/hr)
The adjusted test pressure is then determined from saturation pressure associated with the temperature calculated from equation 5.2.17:
To
s = [(T*
2 - T*
1) * e- NTUo] / (1 - e- NTUo)
Where: NTUo = Number of Heat Transfer Units
o = test value adjusted to design reference conditions
* = value derived from design reference
To
s = condenser steam saturation temperature (°F)
T*
2 = outlet temperature (°F)
T*
1 = inlet temperature (°F)
The test adjusted steam pressure is then compared to the design pressure. If the adjusted test pressure is below the design pressure, the condenser passes the acceptance test.
Discussion of Test Results
The objective of our testing program was to apply the methodology outlined in the new test code especially those related to determining tube bundle fouling. The test provided reasonable results and could be utilized as a demonstration of the test code methods. There was no “acceptance” criteria placed on the retubing project however, the data indicated that the retubed condenser was performing as expected.

Session 6: Alternative Cooling Technology
6-45
As discussed above, the code recommended eight pairs of tubes be monitored to determine the bundle fouling. Because this is a two-pass condenser we located two sets on each of the two first pass outlet tubesheets and two sets on each of the second pass tubesheets. Since the condenser has two passes, the second pass inlet was measured as well. This configuration provided the determination of four fouling resistances in the first pass and four in the second pass. Following the retube, the eight “clean” reference tubes were plugged to allow the tube bundle and representative “fouled “ tubes to build up a fouling resistance. Once the clean tubes were unplugged during an outage, the fouling resistance could be determined from the temperature difference between the fouled and clean tubes as explained previously.
In this case, it took nearly eighteen months for the opportunity of an outage to remove the plugs due to the excellent availability of the unit. Fortunately the cooling water at the station is quite clean and so the tube fouling rate is low. During the same outage, the condenser tubes were cleaned with brushes.
The tube fouling monitoring system was inspected during that outage and found it to be in excellent condition. The wiring was essentially located as it had been installed the prior year and all temperature sensors were working. The data recorded for the calculations presented in this paper was taken approximately 4 weeks after the condenser cleaning. For many condensers with aggressive fouling this would be too long to wait for the testing, because the “clean” tubes would likely reach a level of fouling similar to the “fouled” tubes used for the reference. At the time of the data collection however, three of the eight temperature readings were faulty inside the waterbox. This may have occurred during the condenser cleaning or from the impact of the circulation water during startup. Based on a review of the standard deviation of the fouling resistances, one set of readings indicated a strong possibility that one of the first pass outlet temperatures should have been labeled as a second pass inlet temperature.. If we assume this to have been the case, then we have five fouling resistance values after eighteen months of service. The values of the fouling resistance (R+
f ) based on equation 5.1.11 (shown on in the Test Computation section) are:
Location R+
f - foul resistance
1st Pass East Side (Upper) .0004928
1st Pass West Side (Upper) .0005217
1st Pass West Side (Upper) .0005405
2nd Pass East Side (Lower) .0005765
2nd Pass West Side (Lower) .0006823
Average .0005628
Each fouling resistance value compares fairly well to the average resistance as indicated by the relatively low standard deviation. Therefore we had a higher level of confidence that the average fouling resistance is representative of the tube bundle fouling.
Session 6: Alternative Cooling Technology
6-46
A comparison of the fouling resistance to the HEI derived percent clean was made to get another perspective on the measured test performance and its credibility. As follows, the estimate indicated a tube bundle cleanliness of 72.5%. That was judged to be a reasonable value for this condenser in service about 4 weeks after the tube cleaning and in service for 18 months.
Rfouled in terms of HEI % Cleanliness:
Rfouled = 1/UHEI + R+
f average
UHEI = 675 Btu/hr- ft2 - °F (100% clean at test conditions)
R+
f average = .0005628 hr- ft2-°F/Btu
Rfouled = 1/ UHEI + R+
f average =1/675 + .0005628
Rfouled = 0.0020442 hr- ft2-°F/Btu
Ufouled = 1/ Rfouled = 1/0.0020442 = 489 Btu/hr- ft2 - °F
%c = Ufouled/ UHEI = 489/675 = 72.5%
The test indicated that the overall test pressure adjusted to design was 2.39 in. HgA. The test condenser pressure adjusted to design conditions was determined from the steam saturation temperature calculated by applying the number of heat transfer units at the design conditions (from equation 5.2.17 in the Code). We had predicted that the new design pressure for the change in tube material and gauge to be 2.49 in. HgA based on HEI methods. Based on the results of the performance test, the adjusted design pressure is 0.10 in. HgA better than our expected design value and thus is a reasonable result compared to our expected value.
Methods of Fouling Monitoring
Most of the condenser performance degradation that occurs during operation can be blamed on tube fouling. To maintain maximum station generation for the specific load and inlet water temperatures encountered throughout the year and to decide when it is cost effective to take any tube cleaning actions, it is very important to know the level of tube fouling and its impact on that generation. With these considerations in mind and in addition to the performance monitoring methods presented in the ASME PTC 12.2 – 1998 test code Appendix C, two methods of monitoring fouling based on utilizing the tube fouling monitors are also offered.
The first method involves plugging several sets of tubes, cleaned to an as new condition, to act as “clean” reference tubes. The number of clean tubes required would depend on the period of time that the monitoring program is to cover. Additionally, the number of tube fouling monitors required may have to be based on experience with the program since fouling conditions vary greatly depending on the quality of the circulating water.

Session 6: Alternative Cooling Technology
6-47
The basis of the program is to monitor fouling using an initial set of clean reference tubes while the other clean tubes remain plugged. The remaining plugged tubes will later be unplugged in sets to act as new reference tubes. Depending on the aggressiveness of the fouling, the program would likely require access to the condenser at least monthly to unplug clean tubes.
Initially the condenser would be cleaned and the reference tubes would be replaced with new or cleaned to an as new condition. Several clean tubes would be plugged and the condenser allowed to operate for a short period of time before removing the first set of plugged clean tubes. The period of time will depend on the aggressiveness of the fouling, for example, a week or so for mild organic or crystalline based fouling.
A baseline test to determine the fouling resistance is conducted. The condenser is then monitored on a periodic basis to determine the fouling resistance. The fouling resistance is compared to the baseline to determine the rate of fouling. The above method of converting the fouling resistance to the HEI % cleanliness may be used if desired.
At some point, the fouling of the clean tubes will become similar to the fouled tubes. This can be determined when the original temperature rise determined from the baseline test decreases and the fouling resistance appears to decrease. When this condition is reached, the next set of clean tubes should be unplugged to provide a new comparison to the reference.
Another method of monitoring fouling is to determine a baseline set of performance data and treat the computed shellside resistance, metal resistance and tubeside resistance values as constants for future fouling tests. As described previously and in the test code, calculate a baseline overall test heat transfer coefficient (U+), fouling resistance (R+
f), metal resistance (R+
m), tubeside resistance (R+
t), test shell side resistance (R+
s).
During future tests to monitor fouling the current overall test heat transfer coefficient (U+) is determined. The metal resistance (R+
m), tubeside resistance (R+
t), test shell side resistance (R+
s) can be treated as constants because they would not be expected to change with fouling. The fouling resistance (R+
f) is determined by solving equation (5.1.12) for R+
f, as follows:
R+
f = 1 /U+ - R+
m - R+
t (do/di) - R+
s
The fouling resistance can thus be monitored over time without depending on the reliability of the fouling monitors.
Another benefit of the data provided from the tube fouling monitors is that depending on the condenser discharge temperature instrumentation and temperature stratification the tube fouling monitors may be a better indication of the average outlet condenser temperature.
Conclusions and Recommendations
The results of our test demonstration were consistent with the expectations determined from the reasonable test results. As discussed in the Test Results section, the fouling resistance values of this test exhibited a small standard deviation and when translated into an apparent cleanliness, indicated a credible fouling test result or an acceptable level of fouling.

Session 6: Alternative Cooling Technology
6-48
The condenser was retubed with a change in material and tube gauge to 20 BWG, 90-10 Cu-Ni. HEI and the condenser manufacturer’s manual were used to predict the new design condenser pressure of 2.49 in. HgA. In this case, the test measurements adjusted to design conditions indicated a test pressure of 2.39 in. HgA and thus constituted a reasonable performance level after the retubing. Of course, had this been an actual acceptance test for either a modular rebundling or a new condenser, the test procedures would have been more stringent and included a circulating water flow measurement.
The test code lists procedures to monitor condenser performance. We have offered additional methods to monitor tube bundle fouling based on the calculation procedures and methods presented in the test code.
Some precautions regarding a tube bundle fouling monitoring program should be offered. For the program to be successful it is important to have access to the condenser should maintenance of the fouling monitors be required.
Finally, we believe that our experience with the new ASME condenser test code PTC 12.2 – 1998, indicates that it provides practical and reasonable cost methods of determining the effect of fouling and the overall performance of a condenser. The methods appear to be satisfactory for performing acceptance testing and condenser performance monitoring.
References
1. ASME PTC 12.2 – 1998, “Performance Test Code on Steam Surface Condensers”, 1998.
2. Heat Exchange Institute Standards for Steam Surface Condensers, Ninth ed., 1995.


© 2002 Electric Power Research Institute (EPRI), Inc.All rightsreserved. Electric Power Research Institute and EPRI are registered service marks of the Electric Power Research Institute, Inc.EPRI. ELECTRIFY THE WORLD is a service mark of the ElectricPower Research Institute, Inc.
Printed on recycled paper in the United States of America
1004116
Target:
Coal Boiler Performance Optimization andCombustion NOx Control
EPRI • 3412 Hillview Avenue, Palo Alto, California 94304 • PO Box 10412, Palo Alto, California 94303 • USA800.313.3774 • 650.855.2121 • [email protected] • www.epri.com
About EPRI
EPRI creates science and technology solutions for
the global energy and energy services industry. U.S.
electric utilities established the Electric Power
Research Institute in 1973 as a nonprofit research
consortium for the benefit of utility members, their
customers, and society. Now known simply as EPRI,
the company provides a wide range of innovative
products and services to more than 1000 energy-
related organizations in 40 countries. EPRI’s
multidisciplinary team of scientists and engineers
draws on a worldwide network of technical and
business expertise to help solve today’s toughest
energy and environmental problems.
EPRI. Electrify the World