Comparison Charts of
18
Comparison Charts of State and County Estimates Program for the International Assessment of Adult Competencies (PIAAC) New Mexico U.S. PIAAC Skills Map available at nces.ed.gov/surveys/piaac/skillsmap
Transcript of Comparison Charts of

Comparison Charts of State and County Estimates
Program for the International Assessment of Adult Competencies (PIAAC)
New Mexico
U.S. PIAAC Skills Map available at nces.ed.gov/surveys/piaac/skillsmap

Table of Contents | New Mexico
LiteracyAverage Literacy Scale Scores of Counties in New Mexico ..........................................................1
Percentage with Literacy Skills At or Below Level 1 in Counties in New Mexico ............................... 3
Percentage with Literacy Skills At Level 2 in Counties in New Mexico .................................................. 5
Percentage with Literacy Skills At or Above Level 3 in Counties in New Mexico ................................7
NumeracyAverage Numeracy Scale Scores of Counties in New Mexico ......................................................... 9
Percentage with Numeracy Skills At or Below Level 1 in Counties in New Mexico .............................11
Percentage with Numeracy Skills At Level 2 in Counties in New Mexico ................................................13
Percentage with Numeracy Skills At or Above Level 3 in Counties in New Mexico .............................15

Average Literacy Scale Scores of Counties in New Mexico: 2012/2014/2017
Luna
Guadalupe
Hidalgo
San Miguel
Union
Lea
Mora
Rio Arriba
Socorro
McKinley
Doña Ana
Valencia
Cibola
Chaves
Quay
Roosevelt
Eddy
Torrance
Colfax
Taos
De Baca
Otero
Curry
Grant
Sierra
San Juan
Harding ¹
Bernalillo
Santa Fe
Lincoln
Sandoval
Catron
Los Alamos
New Mexico
150 175 200 225 250 275 300 325
Average Literacy Scale Score
County Indirect Estimates
State Indirect Estimate
County Credible Intervals
State Credible Interval
¹ Interpret data with caution due to potentially unstable predictor variables in small counties.SOURCE: U.S. Department of Education, National Center for Education Statistics, U.S. Program for the International Assessment of Adult Competencies (PIAAC), 2012/2014/2017.
1
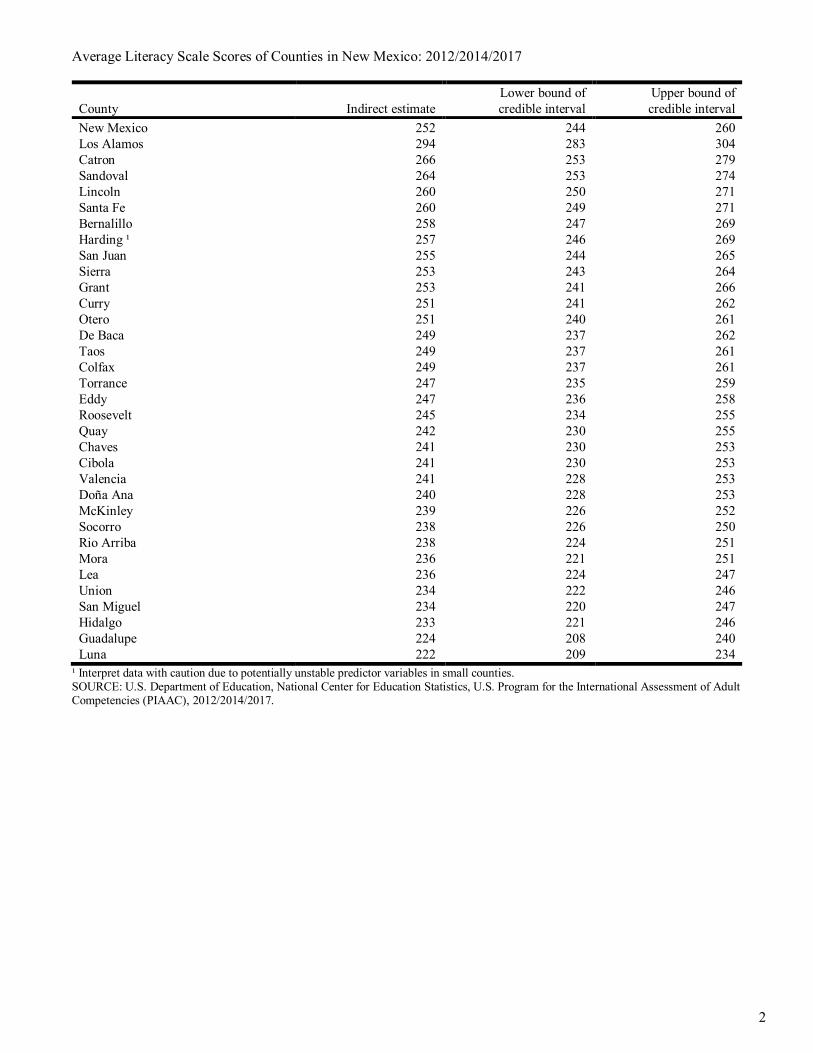
Average Literacy Scale Scores of Counties in New Mexico: 2012/2014/2017
County Indirect estimate Lower bound of credible interval
Upper bound of credible interval
New Mexico 252 244 260 Los Alamos 294 283 304 Catron 266 253 279 Sandoval 264 253 274 Lincoln 260 250 271 Santa Fe 260 249 271 Bernalillo 258 247 269 Harding ¹ 257 246 269 San Juan 255 244 265 Sierra 253 243 264 Grant 253 241 266 Curry 251 241 262 Otero 251 240 261 De Baca 249 237 262 Taos 249 237 261 Colfax 249 237 261 Torrance 247 235 259 Eddy 247 236 258 Roosevelt 245 234 255 Quay 242 230 255 Chaves 241 230 253 Cibola 241 230 253 Valencia 241 228 253 Doña Ana 240 228 253 McKinley 239 226 252 Socorro 238 226 250 Rio Arriba 238 224 251 Mora 236 221 251 Lea 236 224 247 Union 234 222 246 San Miguel 234 220 247 Hidalgo 233 221 246 Guadalupe 224 208 240 Luna 222 209 234
¹ Interpret data with caution due to potentially unstable predictor variables in small counties. SOURCE: U.S. Department of Education, National Center for Education Statistics, U.S. Program for the International Assessment of Adult Competencies (PIAAC), 2012/2014/2017.
2

Percentage with Literacy Skills At or Below Level 1 in Counties in New Mexico: 2012/2014/2017
Los Alamos
Catron
Lincoln
Sandoval
Harding ¹
Santa Fe
San Juan
Bernalillo
Sierra
Colfax
De Baca
Otero
Grant
Eddy
Taos
Curry
Torrance
Quay
Cibola
Mora
Roosevelt
Union
McKinley
Valencia
Rio Arriba
Chaves
Socorro
Doña Ana
Hidalgo
Lea
San Miguel
Guadalupe
Luna
New Mexico
0% 25% 50% 75% 100%
Percentage At or Below Level 1
County Indirect Estimates
State Indirect Estimate
County Credible Intervals
State Credible Interval
¹ Interpret data with caution due to potentially unstable predictor variables in small counties.SOURCE: U.S. Department of Education, National Center for Education Statistics, U.S. Program for the International Assessment of Adult Competencies (PIAAC), 2012/2014/2017.
3

Percentage with Literacy Skills At or Below Level 1 in Counties in New Mexico: 2012/2014/2017
County Indirect estimate (%) Lower bound of
credible interval (%) Upper bound of
credible interval (%) New Mexico 29 24 34 Luna 50 43 56 Guadalupe 43 33 52 San Miguel 41 33 49 Lea 39 34 45 Hidalgo 38 32 45 Doña Ana 38 32 45 Socorro 37 32 43 Chaves 36 31 41 Rio Arriba 35 27 43 Valencia 35 28 41 McKinley 35 28 41 Union 34 28 40 Roosevelt 34 29 39 Mora 33 24 43 Cibola 33 28 39 Quay 31 25 38 Torrance 31 25 37 Curry 30 25 35 Taos 29 23 35 Eddy 29 23 34 Grant 29 22 35 Otero 28 24 33 De Baca 28 21 35 Colfax 28 22 35 Sierra 27 23 32 Bernalillo 26 20 31 San Juan 25 21 29 Santa Fe 24 19 29 Harding ¹ 23 17 30 Sandoval 21 17 26 Lincoln 21 16 25 Catron 15 9 23 Los Alamos 7 3 11
¹ Interpret data with caution due to potentially unstable predictor variables in small counties. SOURCE: U.S. Department of Education, National Center for Education Statistics, U.S. Program for the International Assessment of Adult Competencies (PIAAC), 2012/2014/2017.
4

Percentage with Literacy Skills At Level 2 in Counties in New Mexico: 2012/2014/2017
Los Alamos
Doña Ana
Santa Fe
Bernalillo
Grant
San Miguel
Sandoval
Taos
Chaves
Curry
Roosevelt
Luna
Otero
Rio Arriba
Lincoln
Valencia
Sierra
Torrance
Colfax
Lea
Hidalgo
Socorro
Harding ¹
De Baca
Cibola
Mora
Guadalupe
San Juan
Eddy
Quay
Catron
McKinley
Union
New Mexico
0% 25% 50% 75% 100%
Percentage At Level 2
County Indirect Estimates
State Indirect Estimate
County Credible Intervals
State Credible Interval
¹ Interpret data with caution due to potentially unstable predictor variables in small counties.SOURCE: U.S. Department of Education, National Center for Education Statistics, U.S. Program for the International Assessment of Adult Competencies (PIAAC), 2012/2014/2017.
5
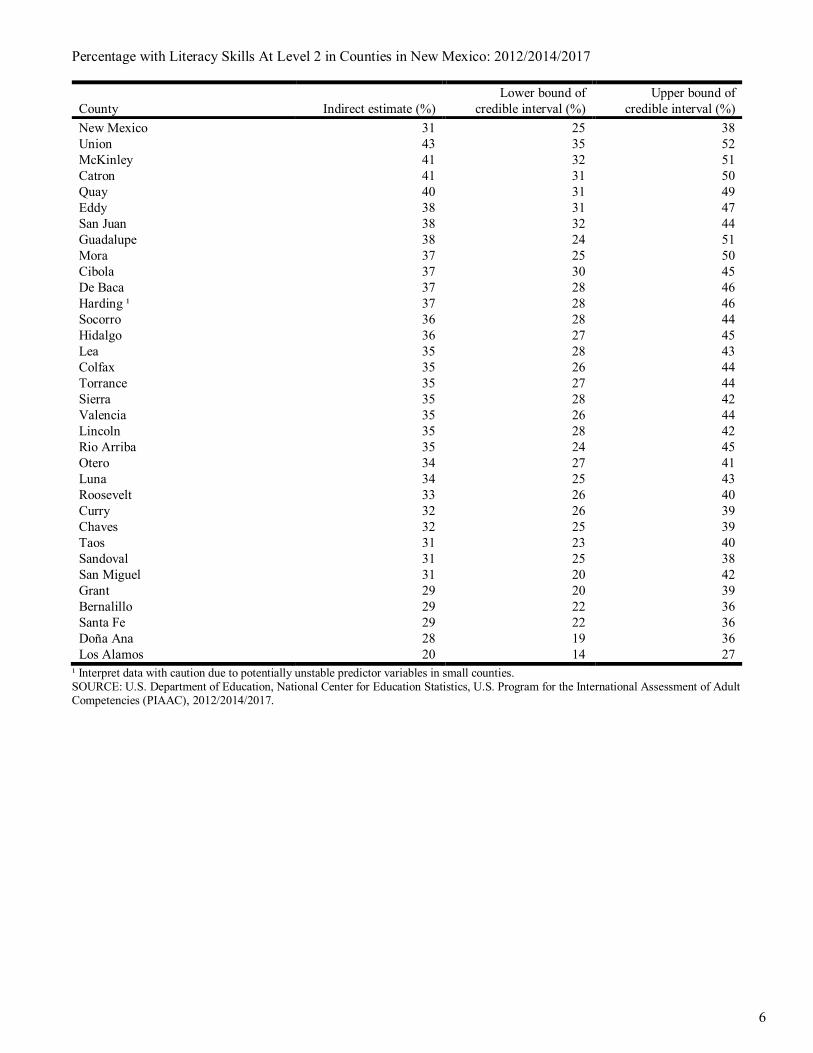
Percentage with Literacy Skills At Level 2 in Counties in New Mexico: 2012/2014/2017
County Indirect estimate (%) Lower bound of
credible interval (%) Upper bound of
credible interval (%) New Mexico 31 25 38 Union 43 35 52 McKinley 41 32 51 Catron 41 31 50 Quay 40 31 49 Eddy 38 31 47 San Juan 38 32 44 Guadalupe 38 24 51 Mora 37 25 50 Cibola 37 30 45 De Baca 37 28 46 Harding ¹ 37 28 46 Socorro 36 28 44 Hidalgo 36 27 45 Lea 35 28 43 Colfax 35 26 44 Torrance 35 27 44 Sierra 35 28 42 Valencia 35 26 44 Lincoln 35 28 42 Rio Arriba 35 24 45 Otero 34 27 41 Luna 34 25 43 Roosevelt 33 26 40 Curry 32 26 39 Chaves 32 25 39 Taos 31 23 40 Sandoval 31 25 38 San Miguel 31 20 42 Grant 29 20 39 Bernalillo 29 22 36 Santa Fe 29 22 36 Doña Ana 28 19 36 Los Alamos 20 14 27
¹ Interpret data with caution due to potentially unstable predictor variables in small counties. SOURCE: U.S. Department of Education, National Center for Education Statistics, U.S. Program for the International Assessment of Adult Competencies (PIAAC), 2012/2014/2017.
6

Percentage with Literacy Skills At or Above Level 3 in Counties in New Mexico: 2012/2014/2017
Luna
Guadalupe
Union
McKinley
Lea
Hidalgo
Socorro
San Miguel
Quay
Mora
Cibola
Rio Arriba
Valencia
Chaves
Eddy
Roosevelt
Torrance
Doña Ana
De Baca
Colfax
San Juan
Otero
Curry
Sierra
Taos
Harding ¹
Grant
Catron
Lincoln
Bernalillo
Santa Fe
Sandoval
Los Alamos
New Mexico
0% 25% 50% 75% 100%
Percentage At or Above Level 3
County Indirect Estimates
State Indirect Estimate
County Credible Intervals
State Credible Interval
¹ Interpret data with caution due to potentially unstable predictor variables in small counties.SOURCE: U.S. Department of Education, National Center for Education Statistics, U.S. Program for the International Assessment of Adult Competencies (PIAAC), 2012/2014/2017.
7

Percentage with Literacy Skills At or Above Level 3 in Counties in New Mexico: 2012/2014/2017
County Indirect estimate (%) Lower bound of
credible interval (%) Upper bound of
credible interval (%) New Mexico 39 33 45 Los Alamos 72 66 78 Sandoval 48 42 54 Santa Fe 47 40 53 Bernalillo 45 38 52 Lincoln 45 38 51 Catron 44 35 52 Grant 42 33 50 Harding ¹ 40 32 47 Taos 39 32 47 Sierra 38 31 44 Curry 38 31 44 Otero 38 31 44 San Juan 37 31 43 Colfax 37 29 45 De Baca 35 26 43 Doña Ana 34 26 42 Torrance 34 26 41 Roosevelt 34 27 40 Eddy 33 25 40 Chaves 32 25 38 Valencia 31 22 38 Rio Arriba 30 21 40 Cibola 29 23 36 Mora 29 18 40 Quay 29 21 37 San Miguel 29 19 38 Socorro 27 19 33 Hidalgo 26 17 34 Lea 25 18 32 McKinley 24 16 32 Union 23 14 31 Guadalupe 20 7 32 Luna 17 9 24
¹ Interpret data with caution due to potentially unstable predictor variables in small counties. SOURCE: U.S. Department of Education, National Center for Education Statistics, U.S. Program for the International Assessment of Adult Competencies (PIAAC), 2012/2014/2017.
8

Average Numeracy Scale Scores of Counties in New Mexico: 2012/2014/2017
Luna
Guadalupe
San Miguel
Hidalgo
Mora
Rio Arriba
Union
McKinley
Socorro
Lea
Doña Ana
Valencia
Cibola
Quay
Chaves
Roosevelt
Torrance
Colfax
Eddy
De Baca
Taos
Otero
Curry
Grant
Sierra
San Juan
Harding ¹
Bernalillo
Santa Fe
Lincoln
Catron
Sandoval
Los Alamos
New Mexico
150 175 200 225 250 275 300 325
Average Numeracy Scale Score
County Indirect Estimates
State Indirect Estimate
County Credible Intervals
State Credible Interval
¹ Interpret data with caution due to potentially unstable predictor variables in small counties.SOURCE: U.S. Department of Education, National Center for Education Statistics, U.S. Program for the International Assessment of Adult Competencies (PIAAC), 2012/2014/2017.
9

Average Numeracy Scale Scores of Counties in New Mexico: 2012/2014/2017
County Indirect estimate Lower bound of credible interval
Upper bound of credible interval
New Mexico 235 226 243 Los Alamos 285 274 296 Sandoval 249 237 260 Catron 248 234 262 Lincoln 245 233 256 Santa Fe 244 232 256 Bernalillo 242 230 253 Harding ¹ 240 227 253 San Juan 239 228 250 Sierra 238 226 249 Grant 236 223 250 Curry 234 223 246 Otero 234 223 245 Taos 231 218 244 De Baca 231 218 244 Eddy 230 218 243 Colfax 230 216 243 Torrance 228 216 242 Roosevelt 227 215 238 Chaves 225 213 236 Quay 224 211 237 Cibola 222 210 234 Valencia 222 209 235 Doña Ana 221 208 235 Lea 220 207 232 Socorro 220 207 232 McKinley 219 205 232 Union 217 205 230 Rio Arriba 216 201 231 Mora 214 198 231 Hidalgo 214 201 228 San Miguel 212 197 227 Guadalupe 206 188 223 Luna 202 189 216
¹ Interpret data with caution due to potentially unstable predictor variables in small counties. SOURCE: U.S. Department of Education, National Center for Education Statistics, U.S. Program for the International Assessment of Adult Competencies (PIAAC), 2012/2014/2017.
10

Percentage with Numeracy Skills At or Below Level 1 in Counties in New Mexico: 2012/2014/2017
Los Alamos
Catron
Sandoval
Lincoln
Santa Fe
Harding ¹
Bernalillo
San Juan
Sierra
Grant
Eddy
Otero
Taos
Colfax
De Baca
Curry
Torrance
Quay
Mora
Valencia
Roosevelt
Chaves
Union
Cibola
Rio Arriba
Doña Ana
Socorro
Lea
McKinley
Hidalgo
San Miguel
Guadalupe
Luna
New Mexico
0% 25% 50% 75% 100%
Percentage At or Below Level 1
County Indirect Estimates
State Indirect Estimate
County Credible Intervals
State Credible Interval
¹ Interpret data with caution due to potentially unstable predictor variables in small counties.SOURCE: U.S. Department of Education, National Center for Education Statistics, U.S. Program for the International Assessment of Adult Competencies (PIAAC), 2012/2014/2017.
11

Percentage with Numeracy Skills At or Below Level 1 in Counties in New Mexico: 2012/2014/2017
County Indirect estimate (%) Lower bound of
credible interval (%) Upper bound of
credible interval (%) New Mexico 40 35 45 Luna 63 56 70 Guadalupe 54 43 65 San Miguel 53 44 62 Hidalgo 52 44 59 McKinley 51 43 59 Lea 50 44 57 Socorro 50 43 57 Doña Ana 50 43 57 Rio Arriba 48 39 57 Cibola 47 41 53 Union 47 40 54 Chaves 47 41 53 Roosevelt 46 41 52 Valencia 46 39 54 Mora 46 35 57 Quay 44 37 52 Torrance 44 36 51 Curry 41 36 47 De Baca 40 32 48 Colfax 40 33 47 Taos 40 33 47 Otero 40 35 45 Eddy 40 33 46 Grant 39 31 46 Sierra 38 33 44 San Juan 37 32 42 Bernalillo 35 29 41 Harding ¹ 34 27 42 Santa Fe 33 27 39 Lincoln 31 25 36 Sandoval 30 25 36 Catron 27 19 36 Los Alamos 11 6 16
¹ Interpret data with caution due to potentially unstable predictor variables in small counties. SOURCE: U.S. Department of Education, National Center for Education Statistics, U.S. Program for the International Assessment of Adult Competencies (PIAAC), 2012/2014/2017.
12

Percentage with Numeracy Skills At Level 2 in Counties in New Mexico: 2012/2014/2017
Doña Ana
Luna
Los Alamos
San Miguel
Roosevelt
Grant
Chaves
Bernalillo
Curry
Hidalgo
Lea
Socorro
Santa Fe
Taos
Otero
Torrance
Sierra
McKinley
Cibola
Valencia
Sandoval
Rio Arriba
Colfax
Guadalupe
San Juan
Lincoln
De Baca
Quay
Harding ¹
Eddy
Mora
Union
Catron
New Mexico
0% 25% 50% 75% 100%
Percentage At Level 2
County Indirect Estimates
State Indirect Estimate
County Credible Intervals
State Credible Interval
¹ Interpret data with caution due to potentially unstable predictor variables in small counties.SOURCE: U.S. Department of Education, National Center for Education Statistics, U.S. Program for the International Assessment of Adult Competencies (PIAAC), 2012/2014/2017.
13

Percentage with Numeracy Skills At Level 2 in Counties in New Mexico: 2012/2014/2017
County Indirect estimate (%) Lower bound of
credible interval (%) Upper bound of
credible interval (%) New Mexico 30 24 37 Catron 43 33 53 Union 39 31 48 Mora 39 26 52 Eddy 39 31 47 Harding ¹ 38 29 47 Quay 37 28 47 De Baca 36 27 46 Lincoln 36 29 43 San Juan 35 29 42 Guadalupe 35 22 48 Colfax 35 25 44 Rio Arriba 33 23 44 Sandoval 33 26 40 Valencia 33 24 42 Cibola 32 25 40 McKinley 32 22 42 Sierra 32 25 39 Torrance 32 23 40 Otero 31 25 38 Taos 31 23 40 Santa Fe 31 24 38 Socorro 31 23 39 Lea 31 23 39 Hidalgo 31 22 40 Curry 30 23 36 Bernalillo 30 22 37 Chaves 28 22 36 Grant 28 19 37 Roosevelt 27 21 34 San Miguel 27 16 38 Los Alamos 26 20 33 Luna 24 15 32 Doña Ana 24 15 32
¹ Interpret data with caution due to potentially unstable predictor variables in small counties. SOURCE: U.S. Department of Education, National Center for Education Statistics, U.S. Program for the International Assessment of Adult Competencies (PIAAC), 2012/2014/2017.
14

Percentage with Numeracy Skills At or Above Level 3 in Counties in New Mexico: 2012/2014/2017
Guadalupe
Luna
Union
Mora
McKinley
Hidalgo
Rio Arriba
Quay
Lea
Socorro
San Miguel
Cibola
Valencia
Eddy
De Baca
Chaves
Torrance
Colfax
Roosevelt
Doña Ana
San Juan
Harding ¹
Otero
Taos
Curry
Catron
Sierra
Grant
Lincoln
Bernalillo
Santa Fe
Sandoval
Los Alamos
New Mexico
0% 25% 50% 75% 100%
Percentage At or Above Level 3
County Indirect Estimates
State Indirect Estimate
County Credible Intervals
State Credible Interval
¹ Interpret data with caution due to potentially unstable predictor variables in small counties.NOTES: The lower bound of the credible interval for Guadalupe County is less than 0% and set to 0%.The predictions for a small number of counties become negative due to the unconstrained linear nature of the model. For more information, please refer to the PIAAC State and County Estimation Methodology Report.SOURCE: U.S. Department of Education, National Center for Education Statistics, U.S. Program for the International Assessment of Adult Competencies (PIAAC), 2012/2014/2017.
15

Percentage with Numeracy Skills At or Above Level 3 in Counties in New Mexico: 2012/2014/2017
County Indirect estimate (%) Lower bound of
credible interval (%) Upper bound of
credible interval (%) New Mexico 30 24 36 Los Alamos 63 56 70 Sandoval 37 30 44 Santa Fe 36 29 43 Bernalillo 35 28 43 Lincoln 33 26 40 Grant 33 24 42 Sierra 30 23 36 Catron 29 20 38 Curry 29 22 36 Taos 29 20 37 Otero 29 22 35 Harding ¹ 28 20 36 San Juan 28 21 34 Doña Ana 27 19 35 Roosevelt 26 19 33 Colfax 25 17 34 Torrance 25 17 33 Chaves 25 18 32 De Baca 24 15 32 Eddy 22 14 29 Valencia 21 13 29 Cibola 21 13 28 San Miguel 20 10 29 Socorro 19 11 27 Lea 19 11 26 Quay 19 10 27 Rio Arriba 19 9 28 Hidalgo 18 9 26 McKinley 17 8 26 Mora 15 4 27 Union 14 5 22 Luna 13 4 21 Guadalupe 11 0 24
¹ Interpret data with caution due to potentially unstable predictor variables in small counties. NOTES: The lower bound of the credible interval for Guadalupe County is less than 0% and set to 0%. The predictions for a small number of counties become negative due to the unconstrained linear nature of the model. For more information, please refer to the PIAAC State and County Estimation Methodology Report. SOURCE: U.S. Department of Education, National Center for Education Statistics, U.S. Program for the International Assessment of Adult Competencies (PIAAC), 2012/2014/2017.
16