
Comparing the Impact of Decline in Leased Line Prices in...
40
Rajat Kathuria Leased Line Prices in India and Indonesia Comparing the Impact of Decline in Leased Line Prices in India and Indonesia: Lessons for Latin America Prof. Rajat Kathuria ICRIER [email protected] Abstract Telecommunications provide access and backbone services which affect efficiency and growth across a wide range of industries. The quality and price of such key services shape overall economic performance, as they affect the capacity of businesses to compete in foreign and domestic markets. Reflecting the rapid pace of innovation in information and communications technologies (ICT), competitive market forces are becoming increasingly important in the provision of telecommunication and networking services, definitely moving the sector away from the ‗‗natural monopoly‘‘ market model (World Bank, 2002). International evidence suggests that market openness in telecommunications services and the quality of the regulatory regime are drivers of ICT sector development (OECD, 2000). This study attempts to assess the impact of decline of leased line prices in Indonesia. It tries to capture this impact through qualitative as well as quantitative impacts. Since the decline in prices occurred recently, 1 the period post the decline is not large enough to do a meaningful time series analysis. However, qualitative assessment is made and the impact is compared with India, where decline in leased line prices led to substantial benefits to user industries. Of particular significance is the trigger to the price decline in Indonesia. The process was set in motion by a presentation of research results by LIRNEasia in Jakarta in October 2005 and culminated with the incumbent operator PT Telkom and others reporting a 69-83 per cent reduction in leased line prices in April 2008 2 . Annex I provides a chronology of the sequence and section 4 in the paper draws interesting comparisons with a similar process in India. Keywords: I. IMPACT OF TELECOM ON ECONOMIC DEVELOPMENT Before dealing with the specific situation in Indonesia it will be useful to briefly examine why modern telecommunications is so important for economic development. Most studies by economists conclude that a 1 Press release of No. 32/DJPT1/KOMINFO/4/2008 showing decline in the tariff of Network Rent towards the decline in the tariff of Internet Access in Indonesia , accessed at http://www.postel.go.id/update/id/baca_info.asp?id_info=946 2 Op cit
Transcript of Comparing the Impact of Decline in Leased Line Prices in...

Rajat Kathuria Leased Line Prices in India and Indonesia
Comparing the Impact of Decline in Leased Line Prices
in India and Indonesia: Lessons for Latin America
Prof. Rajat Kathuria
ICRIER
Abstract
Telecommunications provide access and backbone services which affect efficiency and growth across a
wide range of industries. The quality and price of such key services shape overall economic performance,
as they affect the capacity of businesses to compete in foreign and domestic markets. Reflecting the rapid
pace of innovation in information and communications technologies (ICT), competitive market forces are
becoming increasingly important in the provision of telecommunication and networking services, definitely
moving the sector away from the ‗‗natural monopoly‘‘ market model (World Bank, 2002). International
evidence suggests that market openness in telecommunications services and the quality of the regulatory
regime are drivers of ICT sector development (OECD, 2000). This study attempts to assess the impact of
decline of leased line prices in Indonesia. It tries to capture this impact through qualitative as well as
quantitative impacts. Since the decline in prices occurred recently,1 the period post the decline is not large
enough to do a meaningful time series analysis. However, qualitative assessment is made and the impact is
compared with India, where decline in leased line prices led to substantial benefits to user industries. Of
particular significance is the trigger to the price decline in Indonesia. The process was set in motion by a
presentation of research results by LIRNEasia in Jakarta in October 2005 and culminated with the
incumbent operator PT Telkom and others reporting a 69-83 per cent reduction in leased line prices in
April 20082. Annex I provides a chronology of the sequence and section 4 in the paper draws interesting
comparisons with a similar process in India.
Keywords:
I. IMPACT OF TELECOM ON ECONOMIC DEVELOPMENT
Before dealing with the specific situation in Indonesia it will be useful to briefly examine why modern
telecommunications is so important for economic development. Most studies by economists conclude that a
1 Press release of No. 32/DJPT1/KOMINFO/4/2008 showing decline in the tariff of Network Rent
towards the decline in the tariff of Internet Access in Indonesia , accessed at http://www.postel.go.id/update/id/baca_info.asp?id_info=946
2 Op cit

2
modern telecommunications infrastructure has a substantial impact on economic growth. Based on samples
of 47 and 124 countries, Norton (1992) concludes that in economic development ‗‗a telecommunications
infrastructure must be viewed as at least as important as conventional economic forces such as stable
money growth, low inflation and an open economy.‘‘ Roller and Waverman (2001) found that one-third of
the economic growth in a group of 21 OECD countries over the 20-year period 1970–1990 could be
attributed to the direct and indirect impact of the telecommunications sector. James Burnham has studied
the amazing economic transformation of Ireland in the 1990s, which owed much of its momentum to timely
investment in a modern telecommunications system (2003). The background note of the WTO Secretariat
describes telecommunications as essential to the facilitation of international trade, economic development
and the enrichment of citizen‘s life‘s (WTO1998). Innovation in telecom has also been linked to growth in
electronic commerce and increased accessibility of telecom services are accepted as the foundation of
successful national and global society initiatives and the social benefits these initiatives will bestow. And
finally, Varoudakis, et. al demonstrate that improving the quality and lowering the cost of
telecommunications services holds a key role in improving overall economic performance, especially in
developing countries as a result of:
Better and low-cost telecom services bolster internal efficiency, competitiveness and
strengthen the links of developing economies with global markets.
More competitive telecom markets improve the investment climate, and greatly enhance the
attractiveness of liberalizing countries to FDI.
A low access cost and high-quality telecommunications infrastructure also facilitates the
diffusion of the internet and ICT applications. And the spread of the internet holds great
promise in helping developing countries catch up more rapidly with the expanding pool of
global knowledge
Developing countries may also be able to successfully position themselves in the global ICT
market by nurturing competitive advantage in specific niches—as suggested, for example, by
the booming exports of ICT business services and software in countries like India, Israel and
Malaysia.
It is well known that telecommunications can create direct as well as indirect benefits. Direct benefits
include revenue and employment generation. As with any other form of development, the presence and
growth of industries producing telecommunications goods and services is clearly important to the growth of
real GDP. Growth results in jobs and revenue. The size of the benefits will of course depend upon the
contribution of the sector to GDP and the speed of sector growth. An important indirect benefit through
the use of telecom user services is the (impact) increase in productivity. Induced changes result in
economic growth and an increase in productivity for businesses and individuals.
At a firm level, it would seem that large firms can afford to invest in telecom infrastructure, but it is also
reasonable to assume that such investment would improve efficiency, reduce cost and increase size. This is
however an empirical question and would therefore require more micro level indicators and data to
understand the underlying factors. The issue is that telecom infrastructure such as leased circuits are
‗enabling‘ or general purpose technologies which implies that their use is ubiquitous yet difficult to
measure because they are dominantly indirect. In addition it has been argued that it is not just deployment
of infrastructure or technology that matter, but how the technology is used to transform organizations,
processes and behavior that is important (John Van Reenen et al. 2005). The push to liberalize leased
circuits in the early days of the GATS negotiations was based on the conviction that major benefits could
be generated through competitive provision of telecommunications infrastructure, especially leased circuits.
These benefits included economic and social and are summarized in Figure 1 below.
Figure 1: Spillover benefits of expanding telecommunications services and networks

3
Source: Positive network effects of expanding telecommunications services and networks: economic
opportunity, growth and social benefits, accessed at
http://www.wto.org/english/tratop_e/serv_e/telecom_e/sym_feb08_e/sym_feb08_e.htm
While the government of Indonesia has frequently declared the importance of developing the country‘s
telecommunications sector, typically in statements by the Ministry of Communications and Information
(MoCI), the actual priority given to this effort is questionable. As will be shown in this paper, many policy
decisions have had the effect of limiting competition thereby restricting the possibility of exploiting the
sector as an engine for economic growth. The study offers an assessment of this unrealized potential, and
reviews the scope for medium term telecom sector growth. It also offers some estimates of the likely
impact of telecommunications liberalization on user sectors and on broader economic performance. Section
2 gives an overview of the telecom sector in Indonesia, including the changes that have recently occurred in
the sector. Sections 3 and 4 focus on the leased circuit market in Indonesia and India respectively and
compares the two markets especially with regard to pace and sequencing of ‗liberalization‘ in this category.
Section 5 examines the empirical linkages between the market for leased circuits and certain user groups
and estimates the unrealized growth potential. Section 6 evaluates the benefits from injecting more
competition into the market. Section 7 offers some lessons for Latin American telecommunications markets
based on the results for India and Indonesia while Section 8 concludes and draws the policy implications of
the analysis.
II. INDONESIA'S TELECOMMUNICATIONS MARKET
Until 2000, telecommunications services in Indonesia were provided by a succession of state owned
enterprises reflecting, in part, the natural monopoly characteristics of the service. In part it also reflected the
government‘s reluctance to involve private participation fully in a sector that provided it with control and
cash. It is also possible that complete appreciation of the benefits of competition had not been understood.
Thus, since early 1980s, the telecom sector was dominated by two state owned operators, PT Indosat, the
exclusive provider of international services and PT Perumtel which operated fixed local and long distance
services. In 1991, the latter was partially privatized and reconstituted as PT Telkom. The government
created PT Satelindo in 1993 to be the second provider of international service. However, competition was
limited since PT Indosat owned 7.5 percent of its shares and PT Telkom 25 percent. Furthermore, PT
Satelindo and PT Indosat were required to charge identical tariffs for international service (Goswami,
2006,). In 1994, PT Satelindo and PT Telkomsel were granted a GSM license. Excelcomindo, a company
that the government did not hold shares in, was also given a mobile license in 1996.
The financial crisis of 1997 provided the impetus to reform the sector. The overall programme of telecom
sector deregulation was closely linked to the national economic recovery programme supported by the IMF.
The telecom reform policy, contained in the MoCIs ‗Blueprint‘ dated July 20, 1999 sought to:
Increase the sector performance in the era of globalization

4
Liberalise the sector with a competitive structure by removing monopolistic controls
Increase transparency and predictability of the regulatory framework
Create opportunities for national telecommunications operators to form strategic alliances with
foreign partners
Create business opportunities for small and medium enterprises
Facilitate new job opportunities3.
Recent regulatory reforms in Indonesia have their basis in the Telecommunications Law No. 36 of 1999.
The law provides key guidelines for industry reforms, including industry liberalization, facilitation of new
entrants and enhanced transparency and competition (PT Telkom, Annual Report 2006, submitted to SEC,
USA). Under the Indonesian regulatory framework, the Telecommunications Law only outlines substantive
principles of the subject matter. Detailed implementation of the law is done, interestingly, by Government
regulations, ministerial decrees and decrees of the DGPT. The ‗independent‘ regulatory Authority
(Indonesian Telecommunications Regulatory Body, BRTI) created on July 11, 2003, has been given only
an advisory role and is dependent on DGPT for budgetary support, resulting in a confusing, multilayered
regulatory structure, not conducive to efficient decision making. By the governments own admission ―to
date, it [BRTI] has been largely inactive and the Ministry of Communication and Information has been
more effective in pushing through sector reforms‘ (Indonesian Trade Policy Review 2007, WTO). Part of
the reason for the unrealized potential of telecom in Indonesia must squarely be attributed to the confusing
and multilayered regulatory structure. This is discussed later in Section 5.
The telecommunications law classifies telecommunications providers into three categories (BRTI, 2004):
1. Telecommunications Network Providers;
2. Telecommunications Services Providers; and
3. Special Telecommunications providers
Telecommunications Network Providers are the only ones allowed to put up infrastructure. With a Network
Provider license, it is possible to provide services for:
(a) Fixed Network: local, long distance, international, and closed user network
(b) Mobile Network: terrestrial, cellular, and satellite
As will be argued later the institutional framework does not promote network development. Except mobile
telephony, competition is less than adequate in other segments, including in network roll out and
development creating a situation of substantial unrealized benefits. This seems surprising since Indonesia
is a late starter in telecommunications reform and therefore had the benefit of both technology and policy
options to introduce pro competitive regulation in the sector drawing from the experience of already
successful markets.
Growth of the Indonesian Telecom market has been uneven. While the mobile market has shown
considerable expansion, fixed lines have stagnated in the last two years. It is estimated that fixed lines/100
will decline marginally from 6 to 5.9 in 2008. On the other hand, mobile telephony has grown and
surpassed fixed-line penetration since it does not need the same substantial investment in infrastructure. As
a result the number of mobile subscribers has increased strongly, rising from 32.8 million in 2004 to an
estimated 92 million in 2007, equivalent to access paths/100 of around 37 (Table I).
Table 1: Telecom sector, 2004-08
3 This paper shows that while the policy says the right things, the conditions on the ground even after 17
years deviate significantly from the stated objectives in many respects
5
2004 2005 2006 2007
2008
(est.)
Telephone main lines ('000) 10,202 12,720 14,295 14,811 14,908
Telephone main lines (per 100
population)
4.3 5.3 5.8 6.0 5.9
Mobile subscribers ('000) 32,873 65,000 85,000 92,000 98,000
Mobile subscribers (per 100
population)
13.8 26.9 34.6 37.0 38.8
Internet users ('000) 8,587 9,885 12,000 14,000 15,500
Internet users (per 100 population) 3.6 4.1 4.9 5.6 6.1
Broadband subscriber lines ('000) 132 325 450 575 690
Broadband subscriber lines (per 100
people)
0 0 0 0 0
Personal computers (stock per 1,000
population)
11 12 13 14 15
Source: TPR, 2007 accessed at www.wto.org
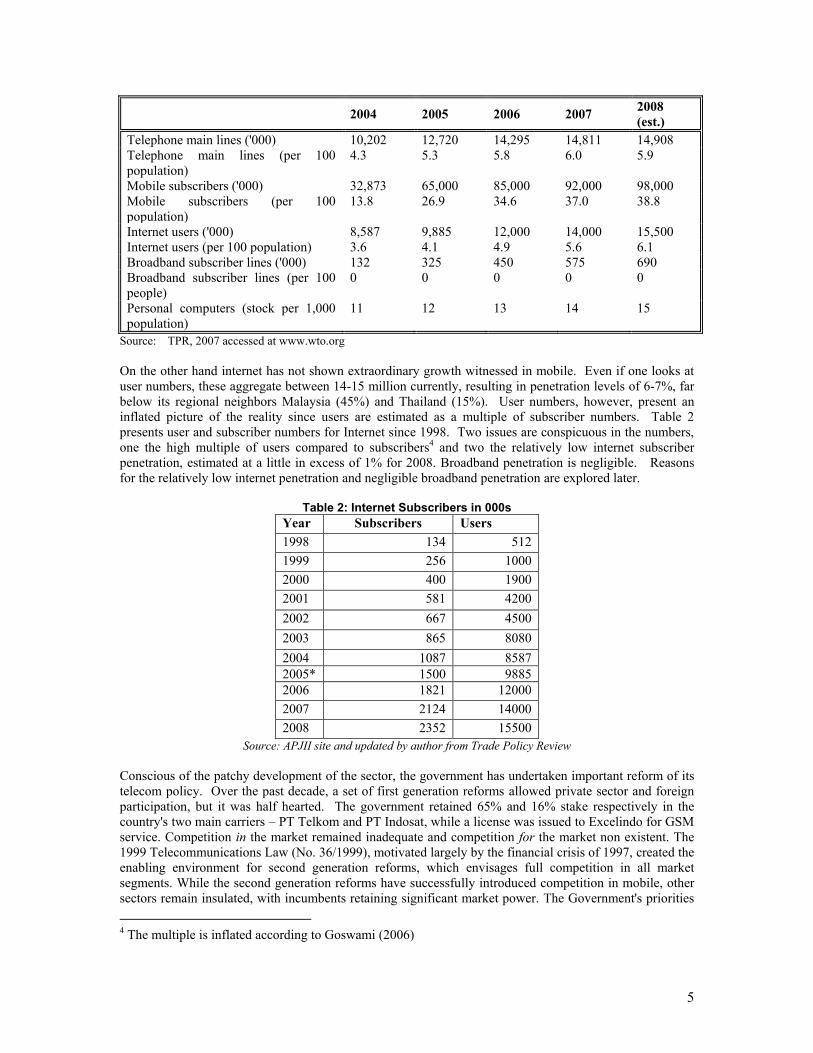
On the other hand internet has not shown extraordinary growth witnessed in mobile. Even if one looks at
user numbers, these aggregate between 14-15 million currently, resulting in penetration levels of 6-7%, far
below its regional neighbors Malaysia (45%) and Thailand (15%). User numbers, however, present an
inflated picture of the reality since users are estimated as a multiple of subscriber numbers. Table 2
presents user and subscriber numbers for Internet since 1998. Two issues are conspicuous in the numbers,
one the high multiple of users compared to subscribers4 and two the relatively low internet subscriber
penetration, estimated at a little in excess of 1% for 2008. Broadband penetration is negligible. Reasons
for the relatively low internet penetration and negligible broadband penetration are explored later.
Table 2: Internet Subscribers in 000s
Year Subscribers Users
1998 134 512
1999 256 1000
2000 400 1900
2001 581 4200
2002 667 4500
2003 865 8080
2004 1087 8587
2005* 1500 9885
2006 1821 12000
2007 2124 14000
2008 2352 15500
Source: APJII site and updated by author from Trade Policy Review
Conscious of the patchy development of the sector, the government has undertaken important reform of its
telecom policy. Over the past decade, a set of first generation reforms allowed private sector and foreign
participation, but it was half hearted. The government retained 65% and 16% stake respectively in the
country's two main carriers – PT Telkom and PT Indosat, while a license was issued to Excelindo for GSM
service. Competition in the market remained inadequate and competition for the market non existent. The
1999 Telecommunications Law (No. 36/1999), motivated largely by the financial crisis of 1997, created the
enabling environment for second generation reforms, which envisages full competition in all market
segments. While the second generation reforms have successfully introduced competition in mobile, other
sectors remain insulated, with incumbents retaining significant market power. The Government's priorities
4 The multiple is inflated according to Goswami (2006)

6
over the next few years include implementing the provisions of the 1999 law, in particular the development
of the regulatory framework that is crucial for the success of the sector liberalization programme.
In 2002, the Government ended the exclusive rights of PT Telkom for domestic long-distance service and
local fixed-line service in August 2005 and of PT Indosat and Satelindo for international calling service in
2003. PT Telkom and PT Indosat were established as Indonesia's only full service providers, a move that
ensured PT Telkom's survival in the face of increasing competition from Voice-Internet Protocol (VoIP)
services. Since 2002, however, PT Telkom has focused most investment in the value-added cellular market
and has added few new fixed lines. The provisions of Indonesia's Telecommunications Law have steered
reforms to end monopolies and open basic telecommunications services to majority foreign ownership.
Thus, Telkom's and Indosat's respective monopolies on domestic and international services were ended in
2002 as a first step towards introduction of full competition. Competition in fixed-line services has
emerged from companies using Voice over Internet Protocol (VoIP) technology. However, the
Government has chosen to restrict entry into this new market segment to five companies: Telkom, Indosat,
Satelindo, and two independent operators. In terms of number of operators, competition is well-advanced in
the provision of mobile services. Telkomsel, jointly owned by PT Telkom and the Singaporean carrier
SingTel, is the largest mobile operator, with a market share of over 50%. Its two main competitors are
Satelindo, fully owned by Indosat, and Excelcomindo, partly owned by TMI Verizon (Table 3).
The reality as it exists today (see Table 3) however does not suggest any degree of success in meeting the
declared objective of introducing ‗effective‘ competition in the sector. In each of the 3 categories (fixed,
cellular and international), the Herfindahl Hirschman Index (HHI) exceeds 18006, implying, according to
the US applied benchmark that the market is ‗presumptively anti competitive‘. Even if a lower benchmark
is applied, say 2500 (the HHI that would obtain with 4 operators of equal size in the relevant market), it
would still ‗raise serious doubts‘ in regard to the extent of competition in the market. An alternative
analysis using the CR4 ratio i.e. the sum of the market shares of the top 4 firms produces poorer results
with respect to competition in the Indonesian telecom market. .
Table 3: Telecommunications market shares in 2006 (Per cent)
Type Operator Share HHI CR4
Fixed phone Telkom 90 8182.75 100
Indosat 2
BakrieTel 5
BB Tel 2
Mobile Telkomsel 54 3650 96
Indosat 26
Excelcom 14
Mobile-8 4
NTS <1
Mandara <1
Hutchinson <1
Primasel <1
International Telkom 52 4148 90
Indosat 38
Source: TPR 2007 and author calculations
5 Before 2002, PT Telkom operated as the exclusive provider of fixed-line local, long-distance, and leased-
line telecommunications services. At the same time, in 1995, Telkom awarded 15-year so-called 'KSO'
concessions to private consortia to operate fixed line services on a monopoly basis in five of seven regional
districts (PT Telkom retained control of Greater Jakarta and East Java). The concessions attracted
substantial foreign investment from large international operators, including France Telecom, Media One,
Telstra, NTT, Cable & Wireless, and Singapore Telecom. Subsequently, Telkom decided to buy out two of
the regional operators, although disputes still exist with two other regional carriers. 6 HHI is the sum of squares of market shares of all providers in the relevant market.

7
There are no limitations on entry for the provision of Internet services. So far, the Government has
licensed 190 Internet service providers (ISPs), of which only 35 are active (TPR 2007). Provider specific
data is not available, however both PT Telkom, through TelkomNet, and PT Indosat, through IndosatNet,
are strong players in the market for Internet services suggesting a concentrated market in the provision of
Internet services as well. In addition, ISPs are not allowed to operate their own international Internet
gateways, but are required to use the facilities of Indosat or Satelindo.
The Indonesian Telecommunications Regulatory Agency (BRTI), an independent telecommunications
regulatory body, was formed in July 2004 to improve transparency in regulation, development and dispute
resolution. Interviews with stakeholders in Jakarta revealed that BRTI at the present time is functioning as
an advisory body to DGPT, which in turn performs, inter alia the task of economic regulation. The
problems associated with such a structure are discussed in a subsequent section.
Indonesia, like many developing and developed countries, has chosen a gradual approach to reform of
telecommunications services. Partial privatization, the opening of selected service segments to competition
(provision of mobile and internet services) and the phasing in of individual regulations has been preferred
to a strategy of radical sector liberalization with the immediate adoption of comprehensive pro-competitive
regulations. This paper argues that as a result of this approach, a number of benefits that could have been
realized especially by introducing competition in the provision of leased circuits have been delayed or
denied to the Indonesian economy. The opportunity loss for the economy has therefore been considerable.
A comparison is made with the benefits secured by India as a result of inducing decline in the prices of
leased circuits through a combination of regulatory intervention and pro competitive policy.
III. THE LEASED-LINE STUDY OF 2006 AND ITS IMPACT
It is now commonly accepted that availability of leased circuits in a timely and cost effective manner can
have significant spillover benefits to user groups7. It was this premise that motivated a study of leased line
prices and its impact on the internet market in Indonesia. The findings of that study expectedly sparked
considerable interest and media coverage8‘9.
The study showed that inadequate supply of backbone and leased line infrastructure and the corresponding
high prices far exceeding benchmark prices in other countries by as much as 48 times forced ISPs to use
Wi-Fi as low-capacity backhaul networks to carry Internet traffic. The price disparity was much higher for
international leased circuits compared to domestic leased circuits (See Tables 4 and 5). The consequence
of the high prices was along familiar lines. It forced Internet access prices to be high and compelled ISPs
to innovate, thus substituting away from high priced leased circuits to Wi-Fi solutions to deliver such
services, albeit illegal at times, to customers.
Table 4: Comparison of Annual Domestic Leased Line Prices: Indonesia, India, and EU Benchmark (2005)
2 Mbps Link
2 km 200 km
Indonesia USD 18,000 USD 45,000
India USD 376 USD 7,603
EU benchmark USD 4,802 USD 9,219
Ratio of Indonesian to Indian price 48:1 6:1
Ratio of Indonesian to EU benchmark price 44:1 5:1
Source: Goswami and Purbo (2006)
7 World Telecommunications Development Report, ITU, 2006
8 Wi-Fi “Innovation” in Indonesia: Working around Hostile Market and Regulatory Conditionsby Divakar
Goswami & Onno Purbo, accessed at http://www.lirneasia.net/projects/completed-projects/indonesia-wifi/ 9 Media coverage accessed at http://www.lirneasia.net/2005/10/findings-from-lirneasia-project-covered-
by-indonesian-papers/

8
Table 5: Comparison of Annual International Full-Circuit Prices to US West Coast in India and Indonesia: Prices (USD) and Price Ratios
Full Circuit
2 Mbps
PT Indosat (Indonesian incumbent) USD 108,528
DT Putra(Indonesian satellite provider) USD 146,400
India USD 37,200
Ratio of PT Indosat to India price 3:1
Ratio of DT Putra to India price 4:1
Source: Goswami and Purbo (2006)
According to the study, non-independent regulation coupled with a non-competitive market environment
for telecommunication services were among the primary reasons for for high leased line prices and
consequently of low penetration of Internet in Indonesia. The policy recommendations that followed
revolved around introducing credible regulatory reform and price control in the markert for leased circuits.
The recommendations however, must be seen not merely in terms of the benefits of introduction of
competition in the sector, but also in terms of their impact on economic prosperity and thus quality of life
by enabling people to cooperate, transact and communicate locally and long distance. A closer look at
Indonesia reveals striking disparities in access and connectivity between cities and rural areas, some of
which remain deprived of any telecommunication infrastructure.
IV. LEASED LINE PRICES IN INDIA AND THEIR IMPACT
Before going on to assess the impact of leased line prices in Indonesia, it may be useful to draw some
lessons from the Indian experience in this regard. The reasons for benchmarking with India are two fold.
One, the Goswami and Purbo (2006) study referred to earlier also benchmarked Indonesian leased line
prices with those prevailing in India, and two, the Indian experience suggests that prices can be regulated
(reduced) even with sizeable political economy constraints.
In the monopoly regime of the 1990s, leased circuit prices in India were singularly high and there was no
attempt to rationalize these since supply was controlled by the Department of Telecommunications (DoT),
who in addition performed the role of licensor and regulator. The creation of the regulator, Telecom
Regulatory Authority of India (TRAI) in 1998 and the introduction of competition in the sector reflected a
new beginning for telecom in India. One of the first markets subject to regulatory intervention was the
market for leased circuits because of the envisaged pro-competitive impact such regulation could have on
the sector and beyond. Thus, TRAI stated ‗leased line tariffs should be cost oriented in order to stimulate
economic activity and efficiency, competition and quality of service‖ (TRAI, 1998). Interestingly, the need
to rationalize leased circuit prices the first time round was driven by an enlightened TRAI, rather than
industry which however participated vigorously in the second round of price cuts of leased circuits in
200510.
TRAI initiated a Consultation process with a view to fixing the price ceiling for Domestic Leased Circuits
(DLC). The downward revision was based on the rationale that the high prices i) discourage other operator
to lease lines ii) imply a loss in revenue for the incumbent iii) result in over investment in the network and
most importantly iv) constrain economic activity that relies on or is linked to the use of leased lines. The
10 Support for reducing leased circuit prices from Industry bodies like Internet Service Providers
Association of India (ISPAI) and NASSCOM figured prominently in 2004-05, presumably after gaining an
appreciation of the consultative process of tariff formulation. See for instance TRAI Consultation Paper –
Revision of Ceiling Tariff for Domestic Leased Circuits 22nd June 2004 and TRAI Consultation Paper –
Consultation Paper to promote competition in IPLC in India 6June 2005.

9
reduction proposed in 1999 was massive and ranged between 67 to 95 per cent depending upon capacity
and distance. Table 6 shows that price ceiling for leased circuit was set at US dollar 2,207 for a 64kbps
circuit for more than 500 km, reflecting a 93 per cent decline from the prevailing levels. Similar reductions
were made for leased lines across different capacities and over various distance slabs. The two most vocal
opponents to the price revision were the incumbent and the VSAT association representing the interests of
the VSAT industry. The incumbent opposed the decline fearing erosion of profit as a result of allowing
cost based access to its network by competitors of downstream services. Revenue from leased circuits
itself comprised less than 2 per cent of the incumbent‘s revenues, so the direct impact of the reduction
could not have been a reason for the reluctance to reduce prices. It was therefore only attempting to create
an entry barrier for new players. But it is to the credit of TRAI the revision was effective and implemented
in March 1999. The opposition from VSAT owners stemmed from diametrically opposite reasons. They
pled that reduction of the magnitude proposed by TRAI would render their industry unviable, since,
according to them demand for VSAT was due to ‗high‘ leased line prices. Lowering prices would
encourage users to shift to leased circuits, thereby destroying the VSAT industry. Not only did the VSAT
industry ‗survive‘ the first round of price cuts, it is prospering even after a second round of price cuts
implemented by TRAI in November 2005. There are 8 VSAT service providers and more than 70,000
VSAT subscribers in India currently and the rate of growth of the industry quarter on quarter since 2002
has been respectable (See Chart 1). The lesson from this experience is for regulators to eschew intervention
that artificially promotes any technology or platform. The telecom industry is highly capital intensive and
its returns highly sensitive to regulation. The cost of bad regulatory decisions has to ultimately be borne by
consumers in terms of high prices or poor quality of service or both. In case VSATs were to become
‗extinct‘ in India as the industry lobby forecast in the face of falling leased circuit prices, so be it. As it
happened it was not to be, and one can only assume that either the industry association got it wrong or that
it was a deliberate ploy to mislead the regulator into garnering advantage for itself!
Chart 1: Rate of Growth of VSAT Subscribers 1
st Quarter 2002 to 4
th Quarter 2007
The benefits of affording access to competitors to an essential facility (leased circuit) derive not only from
regulation induced price declines but also from competition in the supply of services to final users and the
stimulus to dynamic efficiency that is provided by the competition. This was the basis of the TRAI
proposal and it withstood pressure from the incumbent as well as the VSAT association to implement its
agenda for reform.
0
5
10
15
20
25
30
35
40
Q1 Q3 Q1 Q3 Q1 Q3 Q1 Q3 Q1 Q3 Q1 Q3
Year
Gro
wth
%
2002 2003 2004 2005 2006 2007

10
Table 6: Trends in Domestic Leased line tariffs (for highest distance slab i.e. > 500 km) for the Incumbent
US Dollars per annum 1998-2005
Year Capacity
64Kbps 2Mbps(E1) DS-3 STM-1
1998 33,043 157,885 3,315,582 9,946,745
1999* 2,207 50,586 1,062,313 3,186,940
2000 2,053 47,059 988,235 2,964,706
2001 2,003 32,137 674,875 2,024,624
2002 1,994 31,990 671,791 2,015,372
2003 2,106 33,779 608,028 1,824,084
2004 2,183 20,009 420,191 1,260,573
2005 2,103 19,281 404,908 1,214,724
November
2005 *
986 19,041 137,970 370,072
*Regulatory price revision implemented
The tariffs specified by TRAI were in the nature of caps and operators were free to offer discounts to their
customers on a non-discriminatory basis. The price changes however were few as Table 7 shows, since
BSNL was the dominant supplier and although competition in terms of suppliers existed, it was not
effective. Moreover, the incumbent retained ―near monopoly power‖ in the local segment due to the
greater coverage of its network compared to new entrants, who generally had to rely on slower wireless
transmission to provide local connectivity (TRAI 2004). This prompted a second review of leased line
prices, initiated by TRAI in 2004 and implemented in November 2005.11 The announcement of the review
provoked the incumbent into cutting prices in 2004, with the highest reduction coming in the circuits for
which demand was strongest (E1). Finally the second (and last) revision of the ceiling was implemented in
November 2005 across various capacities and over distance slabs. Table 7 shows that significant
reductions were made except for E1 which was subject to greater competitive pressure. Table 8 shows that
competition in the DLC market in India has now materialized, obviating the need for further intervention
by TRAI in price setting. In fact interviews with service providers and TRAI officials reveal considerable
excess supply of domestic leased circuits with operators willing to provide such circuits at aggressive
prices.
Table 7: Percentage change (%) in Domestic Leased line tariffs
Year Capacity
64Kbps 2Mbps(E1) DS-3 STM-1
1999 -93% -67% -67% -67%
2000 0% 0% 0% 0%
2001 0% -30% -30% -30%
2002 0% 0% 0% 0%
2003 0% 0% -14% -14%
2004 0% -43% -33% -33%
2005 0% 0% 0% 0%
November
2005
-54% -3% -67% -70%
11 TRAI Consultation Paper – Revision of Ceiling Tariff for Domestic Leased Circuits 22nd June 2004.

11
Table 8: Number of Service Providers (SP) in Domestic Leased Line
Year No. of SPs Name of Service Providers
1998-99 One BSNL
2000-2008 Eight
Plus IP-II
BSNL, Tata , Bharti, Hughes, Reliance,
Shyam Telelink, HFCL and IP-II Service
Providers.
IP- Infrastructure Providers such as Railways, Power Utilities and Gas Utilities
The other market which is complementary to the DLC market and has an equally fundamental impact on
downstream services such as Internet and Information Technology enabled services (ITES) is the market
for International Private Leased Circuits (IPLC). It is a dedicated point to point connection providing a
non-switched, fixed and assured bandwidth between two points, one being in the home country and the
second in a foreign country. IPLC services in India are available for speeds ranging from 64 kbps to 155
mbps. Broadly speaking, the IPLC is divided into far end and near end termed as half circuit. The tariff for
the far end is dependent upon mutual negotiations between the foreign carriers with their Indian
counterparts. Until 2005, the tariff for near-end half circuit IPLC was forborne.
Through a review conducted, TRAI determined that effective competition had not emerged in the IPLC
business segment until 2004, even after 6 years of sector liberalisation. The reasons were not difficult to
fathom. Bharti Telesonic Ltd. was the only other provider of IPLC in addition to Videsh Sanchar Nigam
Ltd. (VSNL), the incumbent operator. TRAI, consequently, received a number of submissions by
stakeholders that adequate capacity of bandwidth was not being provided and the capacity being provided
was extremely high-priced (TRAI, 2004). In their representation they stated that bandwidth prices in India
were not competitive and the prices for a 2Mbps link were higher than international norms and that this
differential increased significantly for higher capacities (45 Mbps (DS3) and 155 Mbps (STM1)). This can
Table 9: IPLC (Half Circuit) Tariff for US from 2000 to 2008 (US dollar per annum)
Year Capacity
E1 DS3 STM1
1998 413,631.02 - -
1999 404,690.73 - -
2000 342,245.99 6,203,208.56 17,967,914.44
2001 333,889.82 6,203,208.56 17,529,215.36
2002 54,009.14 979,019.53 2,835,479.85
2003 67,558.68 1,033,779.34 2,994,077.65
2004 53,888.13 1,011,823.56 2,808,094.59
2005 44,390.89 790,753.72 2,191,717.79
Nov-05 28,483.79 227,870.29 655,127.08
2006 26,209.68 209,677.42 602,598.57
2007 25,158.19 201,366.74 578,840.80
Source: TRAI and author calculations based on prevailing market exchange rate
be seen from Table 9. The data also shows that prices for IPLCs in 2001 and earlier were astronomical by
any standard and the ratio of prices for E1:DS3:STM1 defied the principle of economies of scale. One can
only attribute the level of prices to the existence of an unfettered monopoly. The first signs of tariff
reduction came in 2002, after Tata acquired the incumbent VSNL. During this time the global leased line
market was also experiencing excess capacity, intense competition and technological development. Table
10 shows that prices fell by 84% across the board; however they still remained significantly above
international benchmarks (TRAI 2004).

12
Intervention therefore became necessary not only for rationalizing the tariff structure but to also ensure that
Indian growing prowess in the Information Technology enabled services (ITES) was not constrained.
Software exporters, BPO industries, banks and other financial services companies are key users of IPLCs
and the competitiveness of these industries in the global market is dependent to a large extent on the price
they pay for IPLC. In addition, Internet Service Providers (ISP) also use IPLC for their upstream
connectivity abroad and high cost of IPLC‘s get reflected into the Internet access tariff which could
adversely affect Internet growth in the country.
Table 10: Percentage decline in IPLC prices
Year Capacity
E1 DS3 STM1
1999 -2% - -
2000 -15% - -
2001 -2% - -
2002 -84% -84% -84%
2003 25% 6% -89%
2004 -20% -2% -6%
2005 -18% -22% -22%
Nov-05 -36% -71% -70%
2006 -8% -8% -8%
2007 -4% -4% -4%
Source: TRAI and author calculation
The prevailing IPLC prices in India are extremely competitive and compare favorably with EU benchmarks
(See Charts 2, 3 and 4). Although there are only three providers, TRAI has recommended introduction of
re-selling in the IPLC market (TRAI 2006). Resale is ―the sale or lease on a commercial basis, with or
without adding value of telecommunication services from a telecommunication carrier‖. Resale is the
modality for optimizing the resources in the sector by facilitating make or buy decisions. It is an important
strategy for many new entrants, especially in the short term when they are building their own facilities.
Resellers or non facility based service providers are introduced to enhance competition. In the context of
resale in IPLC segment, the reseller would provide International bandwidth on demand and could
disaggregate higher capacity into smaller denominations, thus concentrating on their ability to reach out to
new customers.
Chart 2: Price comparison for India and Europe Chart 3: Price comparison for India and Europe
2mbps 45mbps
2 mbps
0
5,000
10,000
15,000
20,000
25,000
30,000
35,000
98 99 00 01 02 03 04 05 06 07
E1-Europe
e1-India
45 mbps
0
100,000
200,000
300,000
400,000
500,000
600,000
700,000
98 99 00 01 02 03 04 05 06 07
ds3-Europe
ds3-India
13
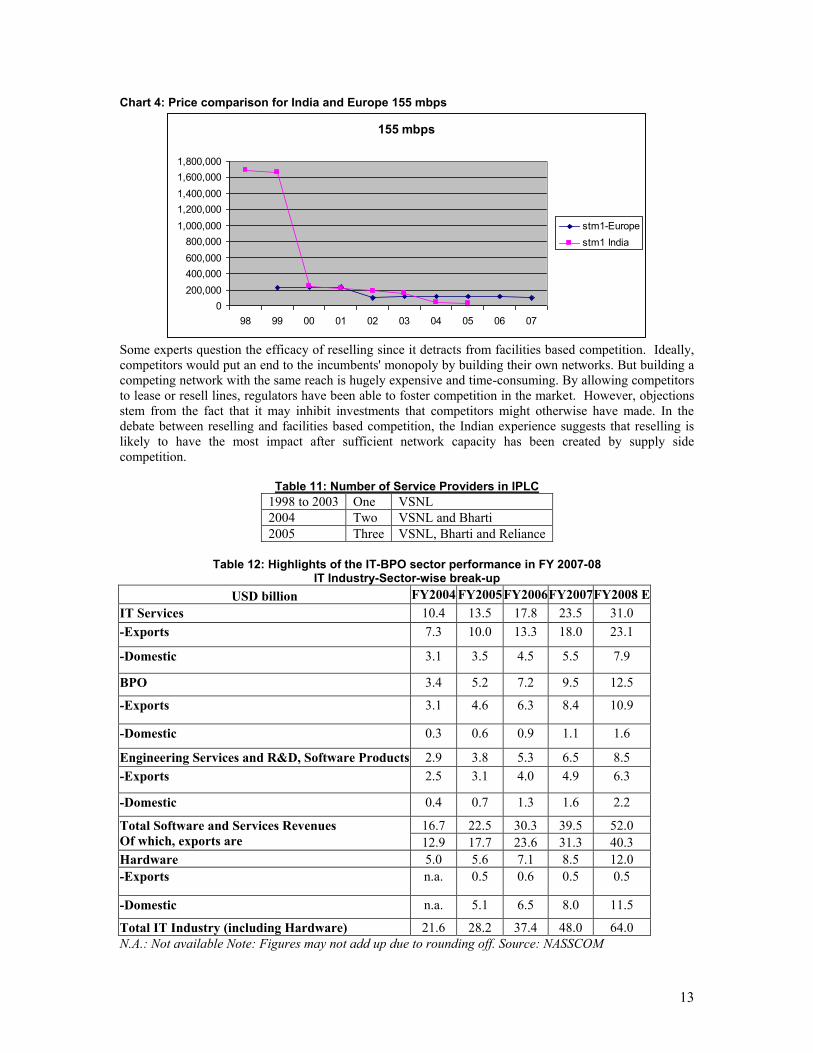
Chart 4: Price comparison for India and Europe 155 mbps
Some experts question the efficacy of reselling since it detracts from facilities based competition. Ideally,
competitors would put an end to the incumbents' monopoly by building their own networks. But building a
competing network with the same reach is hugely expensive and time-consuming. By allowing competitors
to lease or resell lines, regulators have been able to foster competition in the market. However, objections
stem from the fact that it may inhibit investments that competitors might otherwise have made. In the
debate between reselling and facilities based competition, the Indian experience suggests that reselling is
likely to have the most impact after sufficient network capacity has been created by supply side
competition.
Table 11: Number of Service Providers in IPLC
1998 to 2003 One VSNL
2004 Two VSNL and Bharti
2005 Three VSNL, Bharti and Reliance
Table 12: Highlights of the IT-BPO sector performance in FY 2007-08
IT Industry-Sector-wise break-up
USD billion FY2004 FY2005 FY2006 FY2007 FY2008 E
IT Services 10.4 13.5 17.8 23.5 31.0
-Exports 7.3 10.0 13.3 18.0 23.1
-Domestic 3.1 3.5 4.5 5.5 7.9
BPO 3.4 5.2 7.2 9.5 12.5
-Exports 3.1 4.6 6.3 8.4 10.9
-Domestic 0.3 0.6 0.9 1.1 1.6
Engineering Services and R&D, Software Products 2.9 3.8 5.3 6.5 8.5
-Exports 2.5 3.1 4.0 4.9 6.3
-Domestic 0.4 0.7 1.3 1.6 2.2
Total Software and Services Revenues
Of which, exports are
16.7 22.5 30.3 39.5 52.0
12.9 17.7 23.6 31.3 40.3
Hardware 5.0 5.6 7.1 8.5 12.0
-Exports n.a. 0.5 0.6 0.5 0.5
-Domestic n.a. 5.1 6.5 8.0 11.5
Total IT Industry (including Hardware) 21.6 28.2 37.4 48.0 64.0
N.A.: Not available Note: Figures may not add up due to rounding off. Source: NASSCOM
155 mbps
0
200,000
400,000
600,000
800,000
1,000,000
1,200,000
1,400,000
1,600,000
1,800,000
98 99 00 01 02 03 04 05 06 07
stm1-Europe
stm1 India

14
DLC and IPLC markets in India have experienced astonishing price decreases and the prevailing tariffs
have been cited as benchmarks in comparative tariff studies (Goswami, 2006). What is instructive is the
manner in which the price decline occurred. In both markets, regulatory intervention was necessary to
start with but competition was as much necessary to ensure that cost reductions through technical progress
were passed on to the customer. TRAI also overcame the incumbents‘ procedural, legal and technical
reasons for tardiness12. A lack of competition-boosting oversight is one reason for the poor record of
Indonesia in this regard (see below). Most Indian companies using DLC and IPLCs, including ISPS have a
choice of at least three International bandwidth providers and many more domestic leased line providers.
Competition therefore ensures that providers race to offer their customers better and faster access at
increasingly attractive prices.
The benefits of lowered leased line prices have been felt in other industries, especially ITES. IT-ITES
comprises 5.2 per cent of GDP (see Chart 2) and is expected to grow to 64 billion dollars in 2008 (See
Table 12).
Chart 5: Share of IT-ITES in GDP
Box 1 highlights the many drivers for the good performance of IT in India, and importantly credits cost
effective availability of telecom infrastructure as a key reason. This has been supported by other evidence
available from Banking Finance and Accounting (F&A), Customer Interaction Services (CIS), Human
Resource Administration and niche business services. According to NASSCOM,..‖with significant
bandwidth capacity lying unutilized and the steady advancement in technology making access faster and
less expensive than before, it is likely that the share of telecommunications in the cost structure of an IT-
BPO firm may further decline. Firms are also managing to lower their facilities costs by expanding into
other tier-II locations‖13. In addition, Output and Employment Multipliers for Disaggregated Services
Sectors estimated by UNCTAD show that among 15 services sectors the output multiplier is highest for
software services, i.e. 4.36 (Table 13). This implies that for every increase in sectoral output by 0.1 million
rupees there will be an increase in total output by 0.43 million rupees. This is followed by medical and
health services (3.89); hotels and restaurants (3.85); communication services have an output multiplier of
3.15 and an employment multiplier of 2.63. This implies that the aggregate direct and indirect employment
change, in absolute number, resulting from the increase in demand worth 1 million rupees of output of the
sector will be 2.63 million. Employment multipliers are found to be greater than 3 for public
administration, education and research and wholesale and retail trade.
12
See Kathuria (2007) 13 Indian ITES-BPO Industry : NASSCOM Analysis, 2007

15
Table 13 Output and Employment Multipliers for Services Sectors in India
S No Sectors Output Multipliers
Employment
multipliers
1 Hotels and restaurants 3.85 4.27
2 Public administration 3.52 3.50
3 Education and research 3.51 3.42
4 Trade 3.19 3.13
5 Storage and warehousing 3.64 2.85
6 Railway transport services 3.8 2.69
7 Medical and health 3.89 2.65
8 Communication 3.15 2.63
9 Tourism 3.74 2.57
10 Other services 3.3 2.47
11 Ownership of dwellings 2.91 2.38
12 Other transport services 3.37 2.37
13 Banking 3.19 2.33
14 Insurance 3.08 2.14
15 Software 4.36 1.27
Source: UNCTAD 2008
Evidence for India demonstrates the importance of credible regulatory intervention and competition in
driving prices of DLCs and IPLCs to reflect their true cost. In doing so, substantial benefit has been reaped
by user industries such as IT and BPOs. In addition, analysis by the Confederation of Indian Industry
National Broadband Economy Committee shows that the total present value (2004) of benefit to the Indian
economy due to growth from broadband is expected to be US$90 billion for the years 2010 – 2020, with an
11% additional growth in labor productivity. Broadband growth is, inter alia, contingent upon availability
and price of infrastructure. According to CII this activity is expected to launch new business lines and
increased efficiency in existing businesses, leading to direct employment of 1.8 million and total
employment of 62 million by 2020.

16
Box 1: Key Growth Drivers of Indian ITES-BPO Exports
Abundant Talent- India‘s young demographic profile is an inherent advantage complemented by an
academic infrastructure that generates a large pool of English speaking talent. Talent suitability
concerns are being addressed through a combination of government, academia and industry led
initiatives. These initiatives include national rollout of skill certification through NAC (NASSCOM
Assessment of Competence), setting up finishing schools in association MHRD to supplement
graduate education with training in specific technology areas and soft skills and MoU‘s with education
agencies like UGC and AICTE to facilitate industry inputs on curriculum and teaching and develop
faculty development programme.
Sustained cost competitiveness- India has a strong track record of delivering a significant cost
advantage, with clients regularly reporting savings of 25-50 percent over the original cost base. The
ability to achieve such high levels of cost advantage by sourcing services from India is driven
primarily by the ability to access highly skilled talent at significantly lower wage costs and the
resultant productivity gains derived from having a very competent employee base. This is further
complemented by relative advantages in other elements of the cost structure (e.g. telecom) that
contribute to India‟s cost competitiveness – even when compared to other low-cost destinations.
Continued focus on quality- Demonstrated process quality and expertise in service delivery has been
a key factor driving India‘s sustained leadership in global service delivery. Since the inception of the
industry in India, players within the country have been focusing on quality initiatives, to align
themselves with international standards. Over the years, the industry has built robust processes and
procedures to offer world class IT software and technology related services.
World class information security environment- Stakeholders of Indian BPO recognise fool proof
security as an indispensable element of global service delivery. Individual firm level efforts are
complemented by a comprehensive policy framework established by Indian authorities, which has built
a strong foundation for an ‗info-secure‘ environment in the country. These include strengthening the
regulatory framework through proposed amendments to further strengthen the IT Act 2000, scaling up
the cyber lab initiative, scaling up the National Skills Registry (NSR) and establishing a self regulatory
organisation.
Rapid growth in key business infrastructure- Rapid growth in key business infrastructure has
ensured unhindered growth and expansion of this sector. The BPO sector has been a key beneficiary
with the cost of international connectivity declining rapidly and service level improving significantly.
The growth is taking place not only in existing urban centres but increasingly in satellite towns and
smaller cities. Critical business infrastructure such as telecom and commercial real estate is well in
place; improving other supporting infrastructure a key priority for the government. STPI
infrastructure available across the country and magnitude of investments shows government support to
the industry.
Enabling Business policy and Regulatory environment- The enabling policy environment in India
was instrumental in catalyzing the early phases of growth in this sector. Policy makers in India have
laid special emphasis on encouraging foreign participation in most sectors of the economy, recognising
its importance not only as a source of financial capital but also as a facilitator of knowledge and
technology transfer. The Indian ITES-BPO sector has benefited from this approach, with participating
firms enjoying minimal regulatory and policy restrictions along with a broad range of fiscal and
procedural incentives.
Source: Nasscom 2007 Indian ITES-BPO Industry – Fact Sheet (Emphases added)

17
V. Leased Line Prices in Indonesia
The foregoing analysis has shown the positive impact of telecom sector development, especially leased line
price decline in India. A combination of regulatory intervention and competition were identified as the key
instruments to have made it possible. This section attempts to capture the impact, or lack thereof, for
Indonesia.
Table 14: GDP AT CURRENT MARKET PRICES (in billion rupiah)
YEAR GDP Communications %
2003 2,013,674.60 39380.9 1.96%
2004 2,295,826.20 53981.7 2.35%
2005 2,784,960.40 70697.5 2.54%
2006 3,338,195.70 87941.6 2.63%
Source: National Income for Indonesia 2003-2006 Badan Pustak Statistik
The communications sector in Indonesia accounted for 2.63% pf GDP in 2006, while telecommunications
is estimated to be about 75% of that (the rest attributable to post and telegraph), making it roughly about
2% of GDP. The governments target for telecom sector revenue for 2009 is 100 trillion rupiah, and if GDP
continues to grow at the current rate of 6.3 per cent in real terms, telecom sector share in GDP will remain
stagnant at about 2%. This is considerably below the world average of 3.1 per cent14, demonstrating
significant potential for the sector. If sector contribution can rise to 5% (Thailand, Vietnam and Malaysia
are close to achieving 5%, see Table 15), at current levels of GDP this would imply sector revenue of 200
trillion rupiah, roughly double the forecasted amount for 2009. Although this may sound implausible at
this stage, given that large parts of Indonesia are unconnected and most of the telecom infrastructure is
concentrated in Java and Sumatra, appropriate regulatory intervention and institutional design could go a
long way towards bridging the gap. This report argues that tariff rationalization and credible regulation will
be a major determinant in this regard. And if successful, substantial multiplier effects as in the case of India
can be realized15.
Another distinctive feature that emerges from Table 15 is the poor diffusion of internet and broadband in
Indonesia, even when compared with the low penetration rates of India. Indonesia out performs India by a
wide margin in fixed and mobile telephony and prima facie one would expect it to perform better in
internet and broadband as well. It is therefore somewhat surprising that Indonesia fares worse in broadband
and internet. Inevitably, the reasons for this poorer performance must be due to the high prices of leased
circuits which translate into high prices for internet and broadband, thereby affecting demand. This was
explored in the Goswami 2006 study which found Indonesian leased line prices to be much higher than
Indian and European prices (see Tables 4 and 5 above). Innovative solutions were adopted by
entrepreneurs such as Wi-Fi for access and back haul, but these were limited in their geographical coverage
14
World Telecommunication Development Report, 2006, International Telecommunication Union (ITU) 15 Vast stretches of India have been deprived of telecoms infrastructure, a fact acknowledged by TRAI in its
Consultation Paper on Infrastructure sharing, resulting in a digital divide. While telecoms share in GDP
for India is lower than in Indonesia, the share of IT ITES is disproportionately high. Some benefits of
telecom liberalization in India have therefore accrued further up in the value chain in IT-ITES sectors,
which now accounts for more than 5% of GDP. The rapid rise of the Indian IT-ITES sector over the past
decade has contributed to the revenue aggregate of this sector growing by nearly ten-fold and has also
catalysed a wider socio-economic transformation in the country – through strong linkages with other
sectors of the economy. These include backward linkages with sectors that support and feed into the IT-
ITES sector, such as telecommunications and forward linkages with sectors that use IT and ITES. For
example, consumption spending on housing, food items, durable goods and holidays etc. generated
additional output of Rs 290 billion (about US $6.5 billion) in 2006-07. While the IT-ITES sector provides
direct employment to 1.3 million people, it creates additional employment for 5.2 million people (Nasscom
2008). See Chart 5 and Box 1 above as well.

18
to high density neighborhoods in urban areas and could not be relied on to solve the internet puzzle for the
country. The authors themselves assert Wi-Fi adoption in Indonesia to be a temporary and suboptimal
solution to increasing internet diffusion. This is because Wi-Fi is prone to interference and does not provide
carrier class reliability. ISPs adoption of Wi-Fi was forced due to the high cost of backbone
infrastructure.16
High prices for infrastructure, such as leased circuits, are a symptom of a known problem i.e. market
failure. The source of the market failure was, and continues to be the domination of the incumbent, PT
Telkom in the market. Table 16 provides evidence for this. In 2003 the share of PT Telkom in telecom
sector revenue was 92% and although it has declined to 78% in 2006, it needs to fall much more to reduce
its domination in the market. At the current rate of decline, PT Telkom‘s share will fall to 73% by 2009;
nowhere near the share needed to achieve a competitive market in telecom. By contrast the corresponding
figure for the Indian incumbent BSNL is 39 per cent. The decline in BSNL‘s share in total sector revenue
has been swift due to the fact that once private sector entry was allowed into the telecom sector, the
incumbent had to contend with stiff competition in all sub sectors. The last source of BSNL‘s monopoly,
domestic long distance (DLD) was removed in 2002. In contrast, Indonesian reforms have been tentative at
best and PT Telkom retains market power in all segments that it operates17.
Table 15: Summary Indicators in Select Countries
Country
Internet
subscribers
per 100
inhabitants,
2007
GDP per
capita US
$, 2006
GDP per capita,
PPP (current
international $),
2005
Broadband
as a % of
Internet
subscribers,
2007
Tele-density
Fixed (Lines
per 100),
2007
Mobile
tele-
density
(SIMs
per 100),
2007
Tele
Rev/GDP,
2005
China 11.31 2096 6757 44 27.5 41.2 6.6
India 1.15 813 3452 23 3.4 19.98 1.9
Indonesia 1.13 1616 3843 9 7.7 35.33 2.2
Malaysia 18.56 6051 10882 27.7 16.4 87.9 4.8
Philippines 2.37 1392 5137 48.4 4.3 50.8 4.4
Thailand* n/a 3185 8677 n/a 11 80.4 3.1
Vietnam 6 627 3071 24.4 32.7 27.2 4.7
* data on internet subscriber for Thailand is not available
Data Source: http://www.itu.int/ITU-D/ICTEYE/Indicators/Indicators.aspx#, and World Development
Indicators, 2007 and WDR: 2008, Agriculture for Development, World Bank, WTDR, 2006 and individual
regulator web sites
Another reason for the high leased-line prices found in the Goswami study owe to the small share of
revenue contributed by leased circuits to PT Telkom‘s bottom-line. In 2006, the share of leased-line
revenue in PT Telkom‘s total revenue was a meager 1.4%. Even in the preceding years for which data is
available the ratio is very small (See Table 17). The fact that leased circuits contribute a miniscule portion
of the revenue coupled with the perception that leasing lines to other telecommunications operators
facilitates competition in downstream markets against itself, may have led to PT Telkom being
unaccommodating to other providers‘ requests. In fact an interview with PT Telkom revealed as much, and
also the fact that their own requirement for building infrastructure precluded leasing to others.
This situation should have made for an irrefutable case for regulatory intervention to break the stranglehold
of the incumbent in the leased circuit business. Instead it took an inspired piece of research from
LIRNEasia and continuous pressure from stakeholders such as MASTEL and the media to show the
unreasonableness of leased line prices in Indonesia. When the findings were made public, it jolted the
16 See page 152, Goswami Wi-Fi the Network Fix 17 Ibid
19
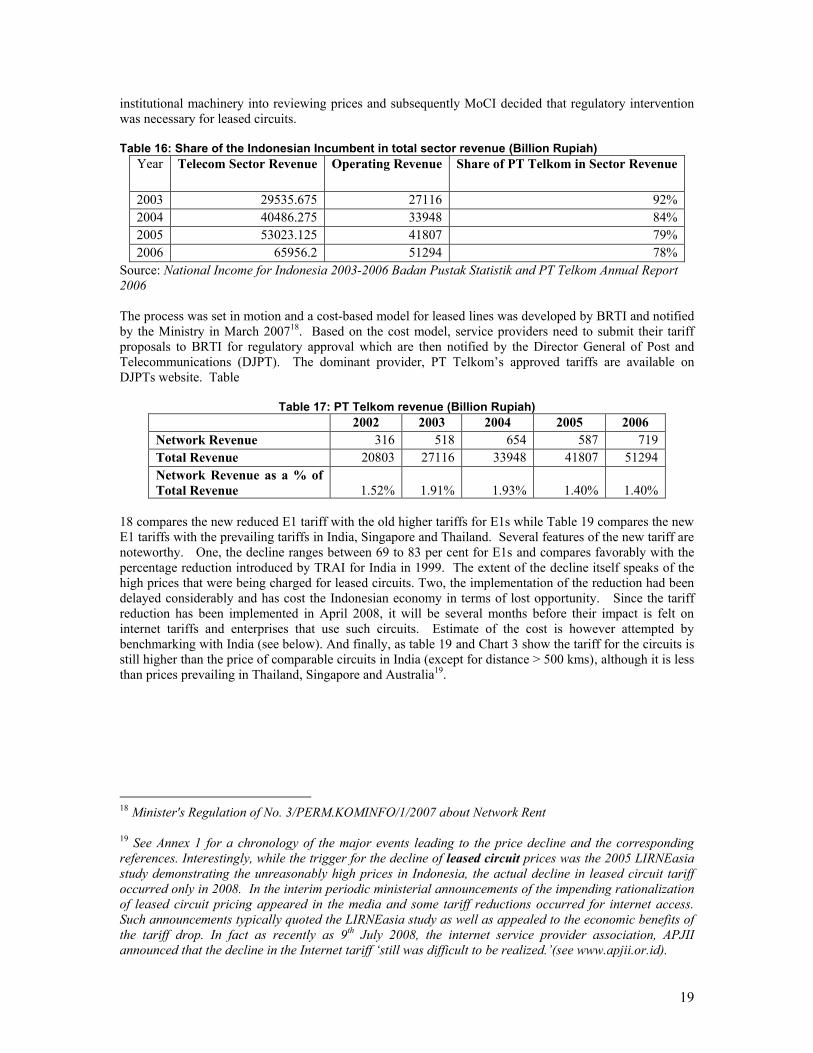
institutional machinery into reviewing prices and subsequently MoCI decided that regulatory intervention
was necessary for leased circuits.
Table 16: Share of the Indonesian Incumbent in total sector revenue (Billion Rupiah)
Year Telecom Sector Revenue Operating Revenue Share of PT Telkom in Sector Revenue
2003 29535.675 27116 92%
2004 40486.275 33948 84%
2005 53023.125 41807 79%
2006 65956.2 51294 78%
Source: National Income for Indonesia 2003-2006 Badan Pustak Statistik and PT Telkom Annual Report
2006
The process was set in motion and a cost-based model for leased lines was developed by BRTI and notified
by the Ministry in March 200718. Based on the cost model, service providers need to submit their tariff
proposals to BRTI for regulatory approval which are then notified by the Director General of Post and
Telecommunications (DJPT). The dominant provider, PT Telkom‘s approved tariffs are available on
DJPTs website. Table
Table 17: PT Telkom revenue (Billion Rupiah)
2002 2003 2004 2005 2006
Network Revenue 316 518 654 587 719
Total Revenue 20803 27116 33948 41807 51294
Network Revenue as a % of
Total Revenue 1.52% 1.91% 1.93% 1.40% 1.40%
18 compares the new reduced E1 tariff with the old higher tariffs for E1s while Table 19 compares the new
E1 tariffs with the prevailing tariffs in India, Singapore and Thailand. Several features of the new tariff are
noteworthy. One, the decline ranges between 69 to 83 per cent for E1s and compares favorably with the
percentage reduction introduced by TRAI for India in 1999. The extent of the decline itself speaks of the
high prices that were being charged for leased circuits. Two, the implementation of the reduction had been
delayed considerably and has cost the Indonesian economy in terms of lost opportunity. Since the tariff
reduction has been implemented in April 2008, it will be several months before their impact is felt on
internet tariffs and enterprises that use such circuits. Estimate of the cost is however attempted by
benchmarking with India (see below). And finally, as table 19 and Chart 3 show the tariff for the circuits is
still higher than the price of comparable circuits in India (except for distance > 500 kms), although it is less
than prices prevailing in Thailand, Singapore and Australia19.
18 Minister's Regulation of No. 3/PERM.KOMINFO/1/2007 about Network Rent
19 See Annex 1 for a chronology of the major events leading to the price decline and the corresponding
references. Interestingly, while the trigger for the decline of leased circuit prices was the 2005 LIRNEasia
study demonstrating the unreasonably high prices in Indonesia, the actual decline in leased circuit tariff
occurred only in 2008. In the interim periodic ministerial announcements of the impending rationalization
of leased circuit pricing appeared in the media and some tariff reductions occurred for internet access.
Such announcements typically quoted the LIRNEasia study as well as appealed to the economic benefits of
the tariff drop. In fact as recently as 9th July 2008, the internet service provider association, APJII
announced that the decline in the Internet tariff „still was difficult to be realized.‟(see www.apjii.or.id).

20
Table 18: PT Telkoms old and new Tariff for E1 Compared (in US dollar)
Distance Existing Tariff for PT Telkom Based
On KM 12/97
PT Telkom Tariff for Java Based
on PM 3/2007)
%
Change
5 -
10 - 265
15 1,416 265 -81
20 1,416 265 -81
25 1,416 745 -47
30 4,495 745 -83
35 4,495 745 -83
40 4,495 745 -83
45 4,495 745 -83
50 4,495 745 -83
100 4,495 745 -83
150 4,837 924 -81
200 4,837 924 -81
250 5,222 1,102 -79
300 5,222 1,102 -79
350 5,222 1,637 -69
400 5,222 1,637 -69
450 5,222 1,637 -69
500 5,222 1,637 -69
>500 5,222 1,637 -69
Source: DJPT website
The appraisal of the Indonesian prices with the corresponding Indian prices needs to be done carefully
before drawing conclusions from such a comparison. Data available from PT Telkom‘s site for leased
circuits shows that prices have been reduced for all categories of circuits (See Annex III). However a
careful reading brings out several features of the Indonesian market that are important for rendering policy
advice. First, the prices shown in Table 18 taken from DJPTs website are prices applicable for Java Island
only. Tariffs for other Islands and between islands are different, in fact significantly higher. For example,
a circuit in Sumatra costs 30 per cent more than the same circuit in Java (See Table 20). Likewise other
island prices are higher than the prevailing prices in Sumatra. Second, inter island prices are substantially
higher than intra island prices, the premium for inter island ranges from 22-30 per cent. As opposed to this,
ceiling prices set by TRAI for India are the same across the country and while the delivered prices could
differ the ceiling cannot be breached. And finally, more than 60 per cent of the circuits owned by PT
Telkom are in Java, the pricing of the circuits further reinforcing the divide between Java and the other
islands20.
20
Discussions with the incumbent, PT Telkom and PSN Networks, a satellite operator in Indonesia revealed that infrastructure roll out has been concentrated in affluent islands such as Java. Moreover, network providers sell only excess capacity in the market after having met their own needs. And given Indonesia’s unique topography, satellite provision remains a realistic though expensive option.

21
Table 19: Tariff for E1 across jurisdictions US dollar per kilometer
Distance Indonesia
(PT Telkom)
India (BSNL) Thailand
(Comm.
Authority)
Singapore
(Singtel)
Australia
(Telstra)
5 265 36 1,503 2,821 1,982
10 265 53 1,503 2,821 2,348
15 265 70 1,503 2,821 2,714
20 265 87 1,503 2,821 2,952
25 745 105 1,503 2,821 3,190
30 745 122 1,503 2,821 3,428
35 745 139 1,503 2,821 3,666
40 745 156 1,503 2,821 3,904
45 745 173 1,503 2,821 4,143
50 745 195 1,503 2,821 4,381
100 745 372 1,503 2,821 5,229
150 924 548 1,503 2,821 5,229
200 924 725 2,515 2,821 6,414
250 1,102 901 2,515 2,821 8,081
300 1,102 1,078 2,515 2,821 8,081
350 1,637 1,254 3,803 2,821 8,081
400 1,637 1,431 3,803 2,821 9,555
450 1,637 1,608 3,803 2,821 9,555
500 1,637 1,784 3,803 2,821 11,417
>500 1,637 1,790 3,803 2,821 11,417
Date 7-Apr-08 1-Nov-07 1-Oct-99 1-Nov-06 1-Nov-07
Source Telkom Teligen Teligen Teligen Teligen
Source: As reported by DJPT accessed from www.dgpostel.id
Thus, while prices of leased circuits in Indonesia have fallen, these are still higher when compared with
Indian prices. Table 21 shows the lower bound of this ratio to vary between 1.36 and 1.87 when estimated
using prices within Java. This is a lower bound because of two reasons. One, as stated earlier, prices for
islands other than Java are higher and two because Indian prices have fallen by an estimated 25-3021 per
cent below the ceiling specified by TRAI in 2005 due to competition. Therefore a more accurate estimate
of the ratio of prevailing prices in Indonesia compared with India would be in the range 2.5 -3.5
Table 20: Comparison of Tariff in Java and Sumatra
Distance in
Kms
Intra Island Java US
dollars per month
Intra Island Sumatra
US dollars per month
Difference
(Sumatra Premium)
Local 189 265 29%
25 -100 605 870 30%
100-200 783 1124 30%
200-300 961 1383 30%
300-600 1496 2150 30%
600-1000 2209 3171 30%
1000-3000 5774 8292 30%
Source: PT Telkom website and author calculation
21 Based on interviews with service providers and TRAI officials

22
DJPTs website provides an explanation of why Indonesian prices are still higher. This is due to the fact that
―India used the WACC level (Weighted Average Cost of Capital) that was more low and constructed his
network by using the cable of optic fibre in the land and not submarine Fiber Optic Cable making the
investment cost lower” (www.dgpostel.id). Chart 6
Source: www.dgpostel.id
Table 21: Comparison of Leased circuits tariffs in US $ per month
for > 500 km distance
Indonesia (PT
Telkom) Java
India (BSNL)
Ratio
E1 2247.25 1727.64 1.30
DS3 23192.31 12518.29 1.85
STM1 62923.08 33577.24 1.87
Admittedly the geography of Indonesia is difficult for deploying terrestrial and submarine fiber optic cable
networks. Indonesia is the world's largest archipelagic state with more than 17,000 islands that stretch from
the Indian Ocean to the Pacific Ocean spanning 5,150 kilometers. Among the major inhabited islands are
Java, where 60% of Indonesians live, Sumatra, Kalimantan, Sulawesi and Papua. Out of a total area of 9.8
million square kilometers, 81 per cent is sea. Accordingly these unique features imply that satellite based
leased circuits will always be in demand. In meetings with BRTI and a satellite based service provider it
became apparent that satellites are deployed as a substitute for terrestrial or submarine cables; once the
latter become available at a given location, satellites are shifted to an unserved or underserved areas where
there is demand. In this way, satellite continues to remain relevant even at the high price it commands.
The price for satellite based leased circuits remain prohibitively high and can cost anywhere between 6000-
9000 US dollars per month for 2 Mbps. CSM, a satellite based provider charges 86 million rupiah per
month for one E1 (Tariff reported to BRTI), slightly above 9000 US dollars at the current exchange rate.
Given the importance of satellite based provision in Indonesia and the time required to deploy fibre optics,
it might be worthwhile for BRTI to consider a cost based pricing scheme for satellite based provision. If it
costs 4-5 times as much for satellite provision, so be it. But if prices do not reflect the underlying cost and
EI tariff comaprison India and Indonesia
0
2,000,000
4,000,000
6,000,000
8,000,000
10,000,000
12,000,000
14,000,000
16,000,000
18,000,000
5 15 25 35 45 100
200
300
400
500
Distance
Ru
pia
h p
er
mo
nth
Indonesia
India

23
are high, temporary regulatory intervention in this realm, though a rarity, may be a solution to the
problem22.
Another area of concern that emerged during meetings with stakeholders is the dominance of PT Telkom in
the last mile. There are 30 odd network licensees who can potentially provide leased circuits in Indonesia.
According to BRTI, therefore, backbone infrastructure is unlikely to be a problem; it is the last mile
dominance of PT Telkom that needs to be addressed. History of telecom liberalization across the world has
demonstrated the difficulty of making incumbents offer fair terms to potential rivals, unless forced by tough
regulatory measures. Evidence from Ofcom and Britain may provide a pointer for the next step necessary
in Indonesia in this regard [See Box 2]. There is agreement across the industry that ―infrastructure-based
competition‖—in other words, more network providers is the way forward. Indonesia has that part in place.
BRTI should now get PT Telkom to adopt ―local loop unbundling‖ (LLU) to open up the last mile at fair
and reasonable terms. Rival ISP operators can thereby install or lease equipment for backbone and lease
PT Telkom‘s lines for the ―last mile‖ to the subscriber at cost based rates to be determined by the
regulator.23 Experience across the world however shows conditions for successfully introducing LLU are
exacting and are unlikely to be met in Indonesia.
Box 2 : Why BT has suddenly decided to cut its wholesale prices
Has OFCOM, Britain's new communications regulator, won its first victory over BT, by scaring it into
making huge price cuts? It certainly looks that way. On May 17th, BT announced dramatic reductions—of
up to 70%—in the prices it charges rival operators that offer high-speed (broadband) internet links over its
network. The announcement came days after OFCOM unveiled the first of several reports into the state of
Britain's telecoms market, in which it criticised BT's high wholesale prices and alluded to the possibility of
breaking the company up. Is that what prompted BT to cut its prices?
22 In markets where satellite competes with fiber/microwave, regulation of land-based backhaul will
indirectly regulate satellite. It is only where satellite is the only option that regulation would be needed. 23 Unbundling has been made to work in a number of countries with relatively dense and
well developed traditional copper networks. However, the conditions have been exacting, requiring:
customisation for the national market, alternative operators to enter the market medium‐ term legal
certainty for those operator, the incumbent operator to be sufficiently restrained, a powerful regulator to
monitor progress and publish statistics, a rapid appeals process to avoid lengthy delays ,and a continuing
refinement of the regulations. The greatest risk has been in the nightmare of regulatory gamesmanship
played by certain incumbent operators. See Unbundling local loops: global experiences Ewan Sutherland,
Link Centre 2007 accessed from http://link.wits.ac.za/papers/LINK.pdf
.
24
Certainly not, sniffs BT. While its actions might appear to have been prompted by fear of break-up, it says
it was responding not to OFCOM's stick, but to its carrot. At the moment, BT shares its network with rival
broadband providers in three ways. First, it offers them its own broadband services on a wholesale basis,
for resale under their own brands. BT makes a good margin, and the rival operator does not have to build
anything. Of the 2m or so broadband connections delivered over telephone lines in Britain, BT retails
around half of them itself, and acts as a wholesaler for the rest in this way. Second, under a scheme called
―local loop unbundling‖ (LLU), the rival operator can install its own equipment in local exchanges and
lease BT's lines for the ―last mile‖ from the exchange to the subscriber. This involves a lot more
investment—rival operators need their own high-speed ―backbones‖ to link up the exchanges—but allows
them to differentiate themselves from BT. Uptake of LLU has, however, been slow: fewer than 10,000
lines have been unbundled. Last week, BT said it would reduce the prices of unbundled loops by around
35% from June 1st, with further cuts to come. But while the monthly cost per unbundled loop has fallen,
the set-up charge for each one is still 50% above the European average, says Serafino Abate of Ovum, a
consultancy. So there is room for more cuts. And while revenue per loop will fall, BT should benefit as the
overall market grows. BT's aim is to encourage rival operators to pursue LLU and not its third broadband
service, called DataStream. This is a halfway house between the first two options, forced on BT by
regulators, in which rival operators use BT's backbone as well as their own infrastructure, providing some
scope for differentiation. BT says this is unfair, since it allows its rivals to piggyback on the whizzy new
backbone it is now building. It would much rather its rivals simply resold its broadband products, or built
their own backbones and used LLU. With its new LLU prices, says Andrew Darley of ING, an investment
bank, BT has now made LLU cheaper than DataStream. It has done so because Ofcom has said that if LLU
takes off, it might relax the regulatory requirements around DataStream. It is this carrot, rather than the
stick of break-up, that has prompted BT to act. What is striking is that there is suddenly agreement across
the industry that ―infrastructure-based competition‖—in other words, more LLU—is the way forward. BT
has historically been reluctant to push LLU, but has now decided that doing so is in its best interests.
Conveniently, many of the rival firms that hoped to exploit LLU have gone bust (thanks, in part, to BT's
previous delaying tactics).
May 20th 2004 The Economist
VI. Impact on Internet
The primary reason for intervention in the leased circuit market by the Indonesian government was to
promote usage of internet. The rate of growth of internet subscribers has in fact declined in 2007-08 to 11
per cent (See Table 2 above). It is possible that the effect of the decline in leased line prices will be pass-
through to internet tariff later and only thereafter affect the subscriber base. An announcement by the
Internet Association on its website states that ISPs in Indonesia are likely to reduce tariffs from 20 – 40%
beginning June 2008, following reduction in leased line prices announced by the incumbent PT Telkom by
46 to 81 per cent in April 2008.24 Other network providers are likely to follow suit, given that new entrants
who provide backbone services will keep leased line prices aligned with PT Telkom due to pressure from
the ministry25. The decline in tariff for leased circuits is based on the Decision of the Director General of
post and telecommunications No.115/2008 (DJPT). According to the Chairman of APJII Sylvia W.
Sumarlin, ISPs will reduce the internet tariff when most contracts with network providers are renewed in
June 2008. The association confirmed the decline would be ―fully implemented by next year in view of the
fact that all contracts of the member's business with the provider of the network will be finished this
year‖26. While tariffs for the internet will fall, these will still remain substantially higher than the Indian
prices. Even if one assumes that tariffs will decline by up to 40 % to about US $ 50 per month, these will
still remain about double the Indian price (See Table 22).
24 www.apjii.or.id 25 Goswami 2006 26 Ibid

25
Table 22: Comparison of Internet Tariff, April 2008
ADSL Unlimited Usage
Indonesia USD 83
India USD 25
Ratio of Indonesian to Indian price 3.3:1
Source: Author, based on data provided by BSNL and PT Telkom
The reason for this is that the decline in network rent for ISPs does not include the international
component; the 46 to 81 per cent decline in domestic leased line tariff covers about 40 per cent of the total
production cost for ISPs. The policy implication of this is that IPLC tariffs also need to be reduced to make
a further impact on Internet prices. BRTI therefore should consider bringing IPLC tariffs under the ambit
of regulation, similar to what TRAI did in the case of India.
This paper has documented the enormous impact price reduction of leased circuits have had in India on
other business users. Since leased lines are a critical producer good for ISPs, high leased line prices
naturally result in high retail price for Internet services. They also jack up the cost for businesses using
leased circuits adversely affecting their competitiveness. The high prices of leased circuits have also
prevented the economy from realizing the multiplier effects of communications technology.
In addition to the benefits to the economy, lower leased circuit process could also have a substantial impact
on the service provider bottom line due to elasticity effects. As stated above, PT Telkom‘s share of
network revenue in total revenue is roughly 1.4 %. If one includes infrastructure and support provided for
enterprise solutions, the share jumps to 30%27. Assuming a conservative elasticity of 2 for leased circuits,
the unrealized benefits to PT Telkom from a 40 per cent reduction in leased line tariffs are estimated to be
in the range of 60 billion to 1.2 trillion rupiah28. To realize these benefits PT Telkom has to eschew
thinking of other telecom providers purchasing circuits from them as competitors, but as customers29.
British Telecom‘s largest source of revenue today is from wholesale rather than retail customers30. If the
output multiplier for communications for Indonesia is the same as that for India (3.1), the unrealized
potential for the Indonesian economy ranges between 0.27% -5.25% of entire telecommunications sector
revenue in 2007.
Like in India, the ICT market in Indonesia is also expected to bring opportunities for local and foreign
vendors, as the country strives to embrace and deploy technologies in the hope to compete with countries in
the ASEAN region. IDC forecasts that the IT market in Indonesia will reach US$1.9 billion in 2007 with
annual growth rate of 10% in 2007. IT is one of Indonesia's fastest growing markets with an annual growth
of 12.2% on average (Chart 7). It however accounts for less than half per cent of GDP today as opposed to
India, where it accounts for 5.2%. The increasing needs for computerization in both private and public
sectors make Indonesia a market with huge potential for software development, outsourcing and security
services, essential for economic growth and national security.
Chart 7: Average Growth ICT Market
27 Interview with PT Telkom 28 This is a conservative assumption for elasticity. Economic theory tells us that elasticity tends to be
higher at higher prices. Given the high prevailing leased circuit prices, the quantity response is therefore
more than likely to offset the price reduction. 29 This impression was given to the author in an interview. 30 http://www.btplc.com/Sharesandperformance/Quarterlyresults/Quarterlyresults.htm

26
Source: Ministry of Industry
The main challenges facing Indonesian ICT industry include low internet penetration that stems from high
leased-line prices. It is therefore crucial that appropriate regulatory mechanisms are put in place for the
economy to realize these benefits. It is not that the government has not recognised the benefits of telecom
infrastructure; in fact the envisaged Palapa Ring Project aims to build a 36,000 kilometer fiber optic
network connecting some 400 major spots in the country. It is expected to create a wireless network for
telephone and broadband Internet. But it will be long before the Palapa Ring project materializes, in the
interim the Indonesian government needs to be serious about implementing good policy to ensure that
benefits of the telecom revolution do not bypass the Indonesian economy. The delay in lowering leased
circuit prices in Indonesia has cost the economy in terms of revenue and efficiency. However, lowering
leased line prices, albeit still high solving one part of the jigsaw puzzle i.e. lowering domestic leased circuit
prices is clearly not enough. In the recommendations section, it is argued that several other things need to
be done for Indonesia to truly benefit from an efficient telecommunications sector.
VII Lessons for Latin America (LA)
Most telecom markets in Latin America have been both privatised and liberalised. Privatisation however,
has met with considerable opposition in a number of countries. While private investment has contributed to
rapid growth in the non-basic services, such as mobile and long distance telephony, fixed lines have
virtually ceased to grow, despite a low 18% teledensity31. Countries with poor infrastructure have
leapfrogged into new applications such as VoIP and WiMAX. But telecoms laws lag behind technological
advances, leaving numerous grey areas that have resulted in acrimonious legal battles among companies,
regulators, and governments. The drive to privatise the telecom industry was seen as a step toward
economic policy reform. The sale of state-owned telecom companies throughout the region and the
resulting infusion of private sector investment contributed to rapid growth particularly in the non-basic
services, such as cellular networks and satellite systems. Privatised carriers have usually been far more
active in upgrading their equipment than their state-owned counterparts. Most LA countries are
characterized by extreme disparity in economic classes, just like India and Indonesia. A decade after the
countries‘ telecom assets were sold off to private businesses, telecom infrastructure is still insufficient,
paving the way for renationalisation of the incumbent telecom companies in Bolivia and Venezuela. The
question on many people‘s mind is whether renationalisation is likely to spread to the rest of the region.
31 Paul Budde Communication 2008 - Telecom Market, Regulatory Overview &
Infrastructure
23.50%21.70%
16.00%14.90%
12.20%
0.00%
5.00%
10.00%
15.00%
20.00%
25.00%
Asia India Vietnam China Indonesia
Average Growth 2006: ICT Market
Series1
27
While there may be valid arguments for the renationalisation of the incumbents, the analysis in this paper
has shown that competition along with strong and robust regulation can serve the interests of stakeholders
in the telecommunications sector. Telecommunication has significant spillover benefits that nations will do
well to capture. The reduction in investment levels in Mexico is attributed to the limited competition in the
sector, a situation that could discourage investment in new enterprises.32
VIII CONCLUSIONS AND RECOMMENDATIONS
Benefits of the telecommunications sector are no longer thought to be confined to the sector itself. The role
of telecommunications as essential to the facilitation of international trade, economic development, and the
enrichment of citizens' lives has become widely accepted. 33 Many emerging economy governments have
come to view inadequate telecommunications networks and services as an impediment to achieving their
full economic potential. Easy access to cheap, fast internet services has become a facilitator of economic
growth and a measure of economic performance. Statistics show a surge in broadband use, especially in
places that are already prosperous. The OECD, a rich-country club, had 221m subscribers in June 2007—a
24% leap over a year earlier. But it is not always the most powerful economies that are most wired. In
Denmark, the Netherlands and Switzerland, over 30% of inhabitants have broadband. In America, by
contrast, the proportion is 22%, only slightly above the OECD average of just under 20%. What accounts
for the differences among rich countries? A few years ago demography was often cited: small, densely
populated countries, such as Korea were easier to wire up than big, sparsely inhabited ones. But the leaders
in broadband usage include Canada, where a tiny population is spread over a vast area. The best
explanation, in fact, is that broadband thrives on a mix of competition and active regulation, to ensure
an open contest.34
It is not only broadband that thrives on a judicious mix of competition and regulatory intervention, other
telecom services also vitally depend on it. A lack of competition-boosting oversight is one reason for the
poor record of the United States in broadband. If one were to ask what is pulling Indonesia back in telecom
sector in general and internet in particular, the two prime candidates would inevitably be inactive regulation
and lack of competition. This has suited the incumbent service provider PT Telkom in that it neither raced
to offer its customers faster access nor priced its leased lines competitively. India‘s BSNL was in a similar
situation in 1999, when TRAI forced it to rationalize leased circuit prices. By itself the price reduction was
not enough, it had to be complemented by alternative service, including infrastructure providers to boost
supply and open the market to ‗infrastructure based competition‖. Even then TRAI had to intervene a
second time in 2005 to further align prices with cost for leased circuits. Indonesia has reduced leased circuit
prices by 46-81 per cent, but the recommendation of this paper is to complement this achievement by
competition boosting regulation for full exploitation of benefits.
The author was informed that there are 30 network providers in Indonesia, but effective competition is yet
to emerge in this segment. By any economic measure, PT Telkom is dominant, and its dominance is
obstructive in the last mile. A structural remedy such as breaking up the incumbent is economically
undesirable today and politically naïve. A workable option is to force PT Telkom to rent out its last mile or
unbundle the local loop. In France, one small start-up firm rented out France Telkom‘s local loop and then
installed technology that was much faster than any of its rivals. It won so many customers that other
operators had to follow suit. In Canada, too, the regulator mandated line-sharing, and provinces subsidised
trunk lines from which smaller operators could lease capacity to provide service.35 In South Korea, where
half the population lives in flats, each block owns its own internal cabling and allows rival operators to put
their equipment in the basement; each tenant then chooses which to use. All these examples highlight the
benefit of competition, a creature that has been absent in the Indonesian leased-line and Internet market.
32 Mexico Trade Policy Review, 2008 accessed from www.wto.org 33 WTO, Background Note by the Secretariat, 1998 34 Economist, Jan 17, 2008 35 Ibid

28
The second policy recommendation is for BRTI to intervene in the IPLC market as well and specify the
cost model. TRAI implemented this in India in 2005 and substantial benefits have accrued since to
software exporters and IT firms, besides making internet more accessible and affordable. Since BRTI
already has a cost based model for DLCs in place, it should be a short step to include IPLCs as part of
regulatory oversight.
Given the nature of Indonesia‘s geography a third recommendation is to cap satellite prices as well. This
might be politically more difficult due to vested interests and reluctance of service providers to disclose
costs. The paper has argued that satellite based circuits will always be in demand; the current price seems
to be based on extracting consumer surplus, rather than on leveraging externalities associated with such
provision. In case the regulator (ministry) is reluctant to specify tariffs for satellite provision, morally
persuading the operators to lower prices is an alternative.
It is not the intention of this paper to propose ‗over regulation‘ of the sector. The dangers of that are well
known and add to the regulatory risk in operations. Market failures however need to be addressed by
independent and competent regulators. While BRTI has five carefully chosen members, it does not have
the power to unilaterally pass decisions. Its budget is allocated by the ministry DGPT and it is only an
advisor to DGPT. Although DGPT is required to consult BRTI on regulatory matters, it is not obliged to
follow BRTI's recommendations. BRTI's decisions should be final but, in practice, they are revised by
DGPT.36 Therefore the final recommendation of this paper is to create a regulatory and institutional
mechanism whereby the regulator, BRTI becomes a truly professional body, accountable for its decisions
but independent of the ministry. It should be funded as per international best practice by a proportion of
sector revenue and be able to take decisions in the interest of the sector rather than in the narrow interest of
the incumbent operator. Unless that is done, the full benefits of telecom and technology would remain
elusive for Indonesia and more importantly, Indonesians.
36 Goswami 2006

29
Annex I
Chronology of events Date Remarks
LIRNEasia Study; Indonesia Wi-Fi Innovation
by Divakar Goswami & Onno Purbo 2005
Indonesian leased line prices are up to 48 times
more than Indian prices. Paper recommends
lowering prices so as to promote internet
development and push economic development
LIRNEasia Networking Meeting; Jakarta
Hilton, Indonesia Director General Present
October
2, 2005
LIRNEasia researchers presented findings from
the WiFi study Minister promises action;
generated enormous press coverage.
Press Coverage:
LIRNEasia‘s WiFi Study in Indonesia
Influences Policy Process; Business
News October 14, 2005
Innovative approach promotes use of
WiFi in Indonesia; Business News,
November 14, 2005
The Government Studies Method of
Lowering Broadband Tariff; Achmad
Rouzni Noor Ii – detikInet Jakarta,
March 14, 2006
Usable Knowledge for Growing the Sector:
ICT Policy & Regulation Research from
LIRNEasia; The Park Hotel, New Delhi, India
March
6, 2006 Research results presented in India
Concluding remarks at Leased Lines Seminar at
the 33rd APEC TEL meeting in Calgary,
Canada
Apr
il
200
6
Research results presented in Canada
Process of Reduction of Leased Line prices
begins: Minister of Communication and
information stipulation number:
(03/PERM.KOMINFO/1/2007)
200
7
Publishes methodology for revision in Leased
Line Tariff
Model provided by BRTI 200
7
Regarding network rent belonging to PT.
TeleKom as the organizer
Notification of Tariff Decline by DJPT
Apr
il
200
8
The press release No.
32/DJPT.1/KOMINFO/4/2008 regarding the
decline in Network Rent towards the Decline in
the tariff of Internet Access
Press Release No.
42/DJPT.1/KOMINFO/4/2008
Implementation of the Government Information
About New Retail Tariff PSTN, Mobile, FWA,
Rental Network for Internet access and tariff
Campaign Issues
Apr
il
200
8
Director General of Post Basuki Yusuf Iskandar
on 17 April 2008 has a press conference related,
inter alia to the implementation of the new tariff
to access networks.

30
Annex II: Trends in Domestic Leased line tariffs (for highest distance slab)
(US dollars per annum, converted from rupees at prevailing exchange rates available at
www.rbi.gov.in)
Pre-TTO Ceiling tariff as
per TTO-99
Market price as
of Dec-04
Revised Tariff
(2005)
E1 157,885 50,586 20,009 18,624
DS3 3,315,582 1,062,313 420,646 134,947
STM1 9,946,745 3,186,940 1,259,663 361,963
64 Kbps 33,043 2,207 2,183 964
Tariffs for 64 kbps is for services through classical method
Trends in Domestic Leased line tariffs (for distance of 50 Kms)
(US dollars per annum, converted from rupees at prevailing exchange rates available at
www.rbi.gov.in)
Pre-TTO Ceiling
tariff as per
TTO-99
Market price
as of Dec-04
Revised
Tariff
(2005)
E1 35,253 8,025 3,161 2,038
DS3 740,306 168,338 66,576 15,535
STM1 2,220,917 505,036 199,773 41,652
64 Kbps 4,395 782 773 285
Trends in Domestic Leased line tariffs (for distance of 100 Kms)
(US dollars per annum, converted from rupees at prevailing exchange rates available at
www.rbi.gov.in)
Pre-TTO Ceiling tariff
as per TTO-
99
Market price as
of Dec-04
Revised Tariff
(2005)
E1 47,004 12,371 4,889 3,856
DS3 987,074 259,991 102,842 28,812
STM1 2,961,222 780,018 308,527 77,235
64 Kbps 5,288 943 932 351

31
Trends in Domestic Leased line tariffs (for distance of 200 Kms)
(US dollars per annum, converted from rupees at prevailing exchange rates available at
www.rbi.gov.in)
Pre-TTO Ceiling tariff as
per TTO-99
Market price as of
Dec-04
Revised Tariff
(2005)
E1 70,505 21,867 8,663 7,537
DS3 1,480,611 1,057,645 418,349 134,926
STM1 4,441,833 1,378,248 545,157 148,379
64 Kbps 8,085 1,242 1,228 504
Trends in Domestic Leased line tariffs (for distance of 500 Kms)
(US dollars per annum, converted from rupees at prevailing exchange rates available at
www.rbi.gov.in)
Pre-TTO Ceiling tariff as per
TTO-99
Market price as
of Dec-04
Revised Tariff
(2005)
E1 88,132 50,356 19,918 18,558
DS3 1,326,392 1,057,645 418,349 134,926
STM1 3,979,154 3,172,982 1,255,048 361,854
64 Kbps 13,208 2,207 2,183 942

32
Trends in IPLC (Half Circuit) Lease rentals
(US dollars per annum, converted from rupees at prevailing exchange rates available at
www.rbi.gov.in)
Capacity Year wise tariff for IPLC (Per annum)
2002* 2003# 1.1.04 # 1.4.04# 2005# Revised
Tariff (2005)
E1
54,009
67,559
53,888
48,431
44,259
28,484 (2Mbps)
DS3
978,396
1,033,121
1,011,824
911,778
790,973
227,870 (45Mbps)
STM1
2,835,480
2,994,078
2,808,095
2,528,422
2,191,060
655,127 (155Mbps)
* Tariff for IPLC services irrespective of the destination
# Tariff applicable for restorable Category and for the farthest destination from India

33
Annex III
PT Telkom Leased Circuit Tariff by Island and Distance in Indonesian Rupiah

34

35

36
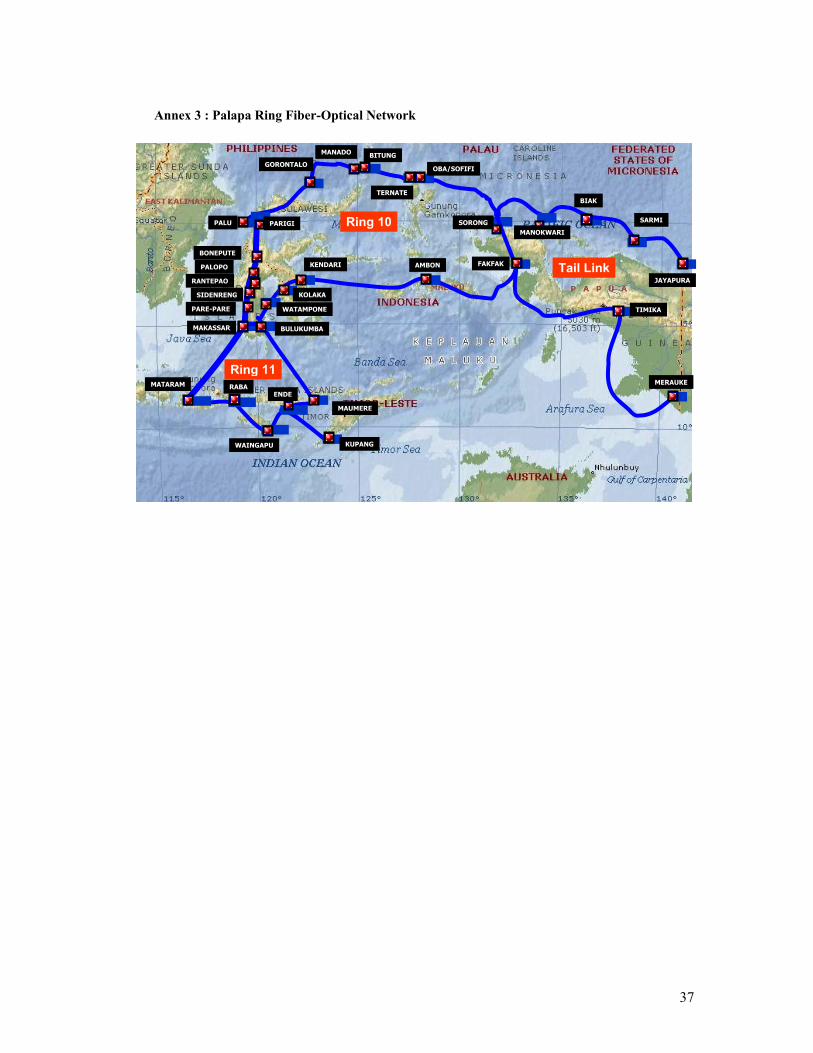
37
Ring 10
Ring 11
Tail Link
MATARAM RABA
WAINGAPU
ENDE
MAUMERE
KUPANG
MAKASSAR BULUKUMBA
WATAMPONE
KOLAKA
KENDARI AMBON
PARIGI PALU
GORONTALO
MANADO
TERNATE
SORONG
FAKFAK
MANOKWARI
BIAK
SARMI
JAYAPURA
TIMIKA
MERAUKE
BONEPUTE
PALOPO
RANTEPAO
SIDENRENG
PARE-PARE
Annex 3 : Palapa Ring Fiber-Optical Network
BITUNG
OBA/SOFIFI
38
ACKNOWLDEGMENTS
I would like to express the deepest appreciation to LIRNEasia, in particular to Rohan Samarajiva and
Helani Galpaya who continually and convincingly augmented the research and scholarship of this paper.
Without their persistent help this paper would not have been possible. I would also like to thank IDRC and
LirneAsia for funding the research, including a field visit to Indonesia. In Indonesia my debt extends to
many. Juni Soehardjo of MASTEL was a pillar of support and tirelessly coordinated meetings in busy
Jakarta. Accordingly I had engaging and fruitful discussions with Koesmarihati, Member, BRTI, Nies
Purwati and Retno Widiastuti of PT Excelcomindo, Harsya Denny Suryo of Telkom Indonesia, Bana Bodri
of Badan Pustak Statistik and Sukarno Abdulrachman of Pasifik Satelit Nusantara. I also benefited from a
conference organized by MASTEL for stakeholders on 5th March 2008. Finally I wish to record my
admiration for Divakar Goswami formerly of LIRNEasia, who generously shared his knowledge about
Indonesia and whose own meticulous research paved the way for the line of enquiry in this paper. For Indu
Sharma, my able secretary, I remain truly indebted. The usual disclaimer applies.

39
REFERENCES
1. Burnham, James B. (2003). Why Ireland Boomed. The Independent Review, VII (4), 537-556.
Norton, Seth. (1992). Transactions Costs, Telecommunications, and the Microeconomics of
Macroeconomic Growth. Economic Development and Cultural Change 41(1), 175- 196.
2. Economist, Jan 17, 2008
3. Gokarn, Subir et al The Rising Tide - Employment and Output Linkages of IT-ITES CRISIL
February 2007
4. Goswami, Divakar & Purbo, Onno (2005). ―Indonesia Wi-Fi Innovation‖ a Study by LIRNEasia
5. Goswami, Divakar (2006). ―Wi-Fi: The Network Fix‖ ICT infrastructure in emerging Asia:
Policy and Regulatory Roadblocks Ch. 6
6. Indonesia Trade Policy Review 2007, WTO
7. International Telecommunication Union (ITU) World Telecommunication Development Report,
2006
8. Kathuria, R. (2007) Telecom Liberalisation: A Case Study of India‘s Experience with Regulation‘
in Jaivir Singh (ed) Regulations, Institutions and the Law, Social Science Press
9. Minister's Regulation of No. 3/PERM.KOMINFO/1/2007 about Network Rent, www.dgpostel.id
10. Nasscom 2007 Indian ITES-BPO Industry – Fact Sheet
11. Nasscom 2008 Indian IT- ITES Industry: Impacting Economy and Society, A Nasscom Deloitte
Study 2008
12. National Income for Indonesia 2003-2006 Badan Pustak Statistik
13. OECD (2000). Information Technology Outlook 2000, Paris
14. OECD 2000
15. PT Telkom Annual Report 2006
16. Reenen, John Van et al (2005). ―Information Technology and Productivity: It ain‘t what you do
it‘s the way that you do I.T‖ EDS Innovation Research Programme Discussion Paper Series
17. Roller, Lars-Hendrik & Waverman, Leonard. (2001). Telecommunications Infrastructure and
Economic Development: A Simultaneous Approach. American Economic Review, 91(4), 909-
923.
18. Silva H.D. & Zainudeen A., 2007, Teleuse on a Shoestring: Poverty reduction through telecom
access at the ‗Bottom of the Pyramid‘, paper prepared for Centre for Poverty Analysis Annual
Symposium on Poverty Research in Sri Lanka, 6-7 December 2007,Colombo
19. Telecommunications Policy 28 (2004) 59–78
20. The Economist May 20th 2004
21. TRAI Consultation Paper – Revision of Ceiling Tariff for Domestic Leased Circuits 22nd June
2004
22. TRAI Consultation Paper – Revision of Ceiling Tariff for Domestic Leased Circuits 22nd June
2004.

40
23. TRAI Consultation Paper to promote competition in IPLC in India 6 June 2005.
24. UNCTAD-India (2008)Benchmarking Development Impacts of Trade Liberalisation of Services
in India
25. Varoudakisa, A and Carlo Maria Rossotto (2004) Regulatory reform and performance in
telecommunications: unrealized potential in the MENA countries, World Bank
26. World Bank (2002), ICT sector strategy paper. Washington, DC
27. World Bank 2002
28. World Bank 2003 Opening up Telecommunications to Competition and MENA Integration in the
World Economy, working paper No 33
29. World Bank(2008) World Development Report: Agriculture for Development
30. World Development Indicators, 2007
31. WTO, Background Note by the Secretariat, 1998


![Quadrilateral Family[1] Rashmi Kathuria](https://static.fdocuments.in/doc/165x107/554cab70b4c905aa608b4606/quadrilateral-family1-rashmi-kathuria.jpg)