

Communications and Timeline Damon Gardenhire Director of Communications and Policy.
28
-
Upload
franklin-cook -
Category
Documents
-
view
217 -
download
3
Transcript of Communications and Timeline Damon Gardenhire Director of Communications and Policy.


Communications and Timeline
Damon GardenhireDirector of Communications and Policy
Top 3 things
• Timeline and process• Data coming next week &
how grades are calculated.• Next steps

Communications
• Communications toolkit• Media Briefing at Capitol
• Embargoed Data – What does this term mean?
KFOR Story
A to F Report Card DataOverview
Maridyth McBee, PhDAssistant State SuperintendentAccountability and Assessment

A to F Report Card
• Comprised of three main sections each worth one-third of the overall grade: –Student Achievement –Student Growth –Whole School Performance
Student Achievement Section • Includes all Oklahoma State Testing Program
(OSTP) exams administered during the most recent school year
Student Achievement Section• The 3% cap for OMAAP and OAAP are applied. • At least thirty (30) students tested before a
performance index is reported.
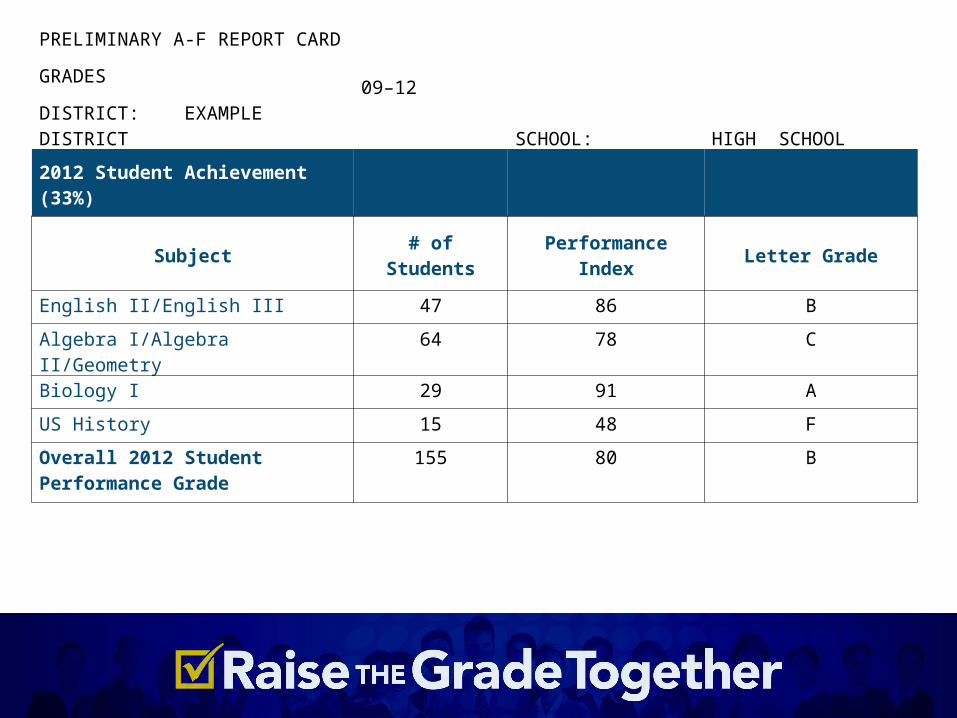
PRELIMINARY A-F REPORT CARD
GRADES09–12
DISTRICT: EXAMPLE DISTRICT SCHOOL: HIGH SCHOOL
2012 Student Achievement(33%)
Subject # of Students Performance Index Letter Grade
English II/English III 47 86 B
Algebra I/Algebra II/Geometry 64 78 C
Biology I 29 91 A
US History 15 48 F
Overall 2012 Student Performance Grade
155 80 B

Student Growth Section
• Growth is divided into two sub-categories; –All students –Bottom twenty-five percent of students

Growth Index: Bottom 25%
• Only students with a pre-score proficiency level of “Unsatisfactory” or “Limited Knowledge” are included.
Growth Index• 30 scores needed to receive a grade for each growth
section.• If less than 30 scores for the bottom 25% section,
grade is based on total growth.• If there are less than 30 scores for the total growth
section, the report card grade is computed using 50% Student Achievement and 50% Whole School Performance.
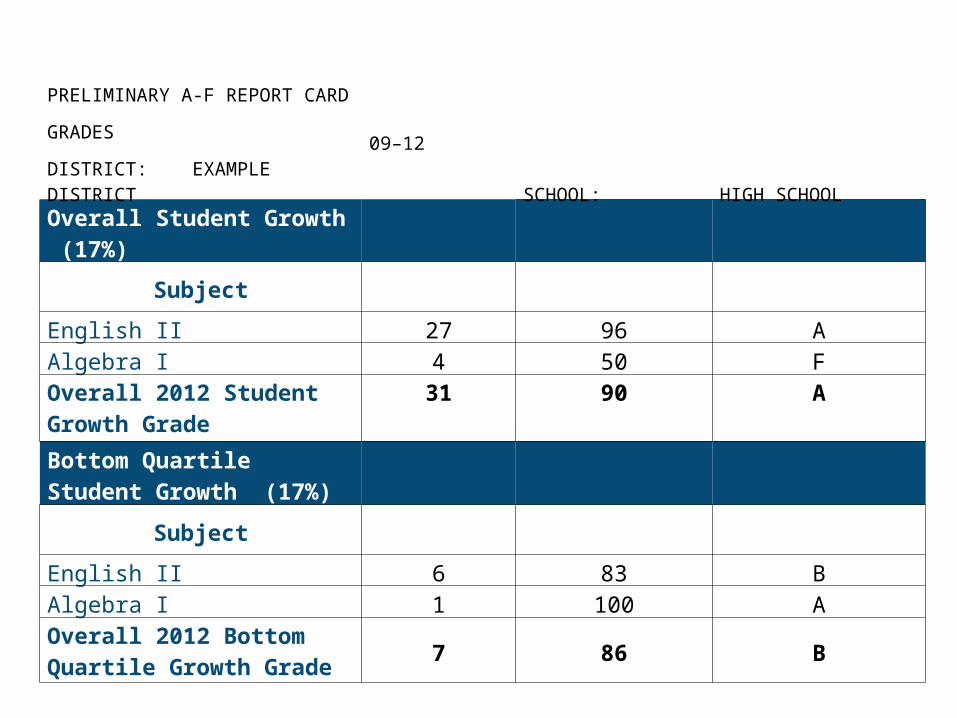
Overall Student Growth (17%)
Subject
English II 27 96 AAlgebra I 4 50 FOverall 2012 Student Growth Grade
31 90 A
Bottom Quartile Student Growth (17%)
Subject
English II 6 83 BAlgebra I 1 100 AOverall 2012 Bottom Quartile Growth Grade
7 86 B
PRELIMINARY A-F REPORT CARD
GRADES09–12
DISTRICT: EXAMPLE DISTRICT SCHOOL: HIGH SCHOOL
Growth Index
• Spreadsheet of matched student scores provided with report card data

Whole School Performance Section • See the following on the Accountability
website– A to F Report Card Data Source Summary– A to F Report Card Guide
.
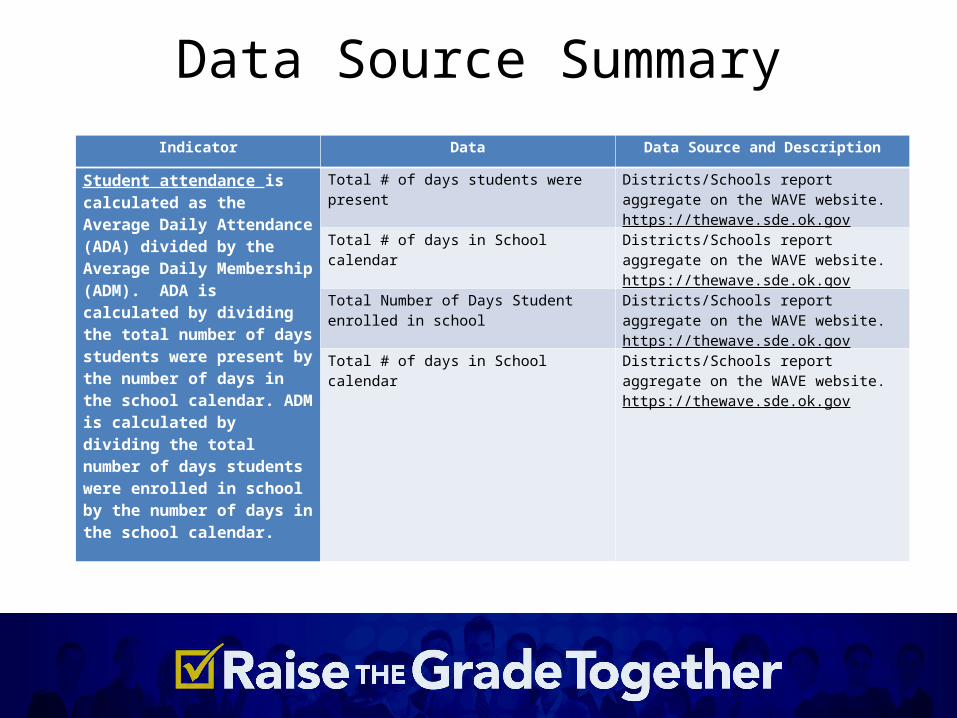
Data Source Summary
Indicator Data Data Source and Description
Student attendance is calculated as the Average Daily Attendance (ADA) divided by the Average Daily Membership (ADM). ADA is calculated by dividing the total number of days students were present by the number of days in the school calendar. ADM is calculated by dividing the total number of days students were enrolled in school by the number of days in the school calendar.
Total # of days students were present Districts/Schools report aggregate on the WAVE website. https://thewave.sde.ok.gov
Total # of days in School calendar Districts/Schools report aggregate on the WAVE website. https://thewave.sde.ok.gov
Total Number of Days Student enrolled in school
Districts/Schools report aggregate on the WAVE website. https://thewave.sde.ok.gov
Total # of days in School calendar Districts/Schools report aggregate on the WAVE website. https://thewave.sde.ok.gov

Whole School Performance (33%)****
Student Attendance Rate A 98.2% 4(.90) = 3.6Advanced Coursework F 0.0% 0(.06) = 0Dropout Rate A 0.0% 4(.04) = .16BONUS
School Climate Survey N
Parent & Community Engagement N
Total Whole School Performance3.76 + 0 =A
FINAL GRADE
PRELIMINARY A-F REPORT CARD
GRADES06-08
DISTRICT: EXAMPLE DISTRICT SCHOOL: MIDDLE SCHOOL
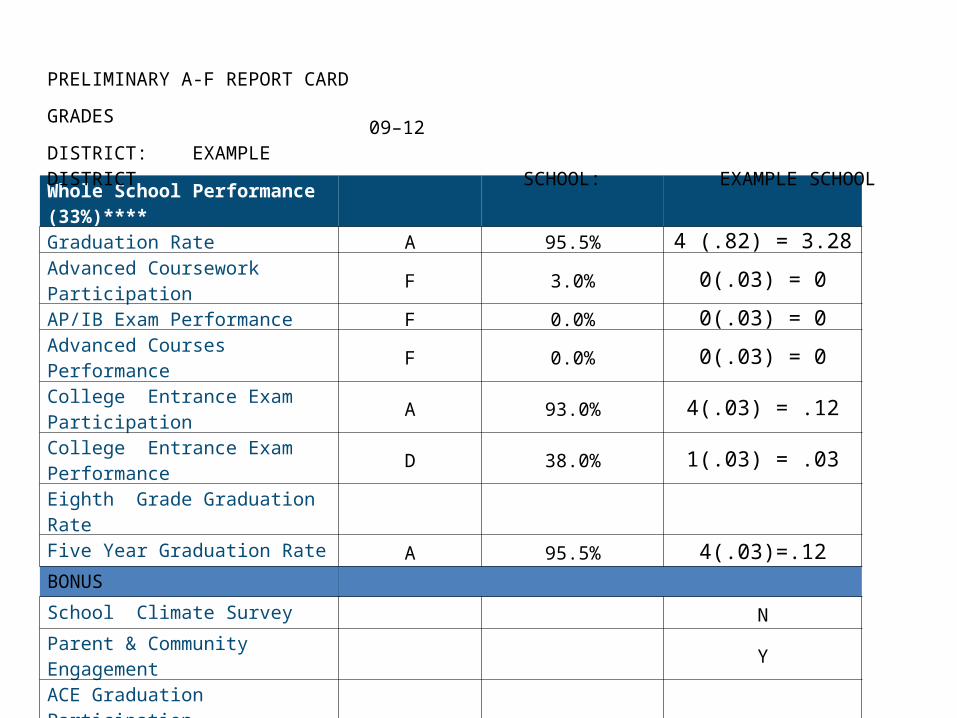
Whole School Performance (33%)****
Graduation Rate A 95.5% 4 (.82) = 3.28Advanced Coursework Participation F 3.0% 0(.03) = 0AP/IB Exam Performance F 0.0% 0(.03) = 0Advanced Courses Performance F 0.0% 0(.03) = 0College Entrance Exam Participation A 93.0% 4(.03) = .12College Entrance Exam Performance D 38.0% 1(.03) = .03Eighth Grade Graduation Rate Five Year Graduation Rate A 95.5% 4(.03)=.12BONUS
School Climate Survey NParent & Community Engagement YACE Graduation Participation College Remediation NTotal Whole School Performance 3.55+.06 = 3.61 =B
FINAL GRADE
PRELIMINARY A-F REPORT CARD
GRADES09–12
DISTRICT: EXAMPLE DISTRICT SCHOOL: EXAMPLE SCHOOL
Timeline • Data released next week• E-mail, letter and posting on Accreditation
website• 30 days to review and make corrections• Data Verification Form included in
communications and on Accountability Website

Resources
Kerri White, MEdAssistant State Superintendent
Educational Support

Raise the Grade Together Symposium
• September 12-13, 2012• For schools preliminarily identified as
Priority, Targeted Intervention, and Focus
Raise the Grade Together Booklet• Week of September 10• Information for all schools that will assist
schools in determining what steps to take that will likely improve student performance

Reward School Grant• Timeline– Preliminary Information about the Grant: Mid-
September– Public Release of Eligible Schools: Early October– Grant Application Due: November 16, 2012
(Tentative)• Partnership Between Reward Schools and
Priority Schools for the benefit of both schools

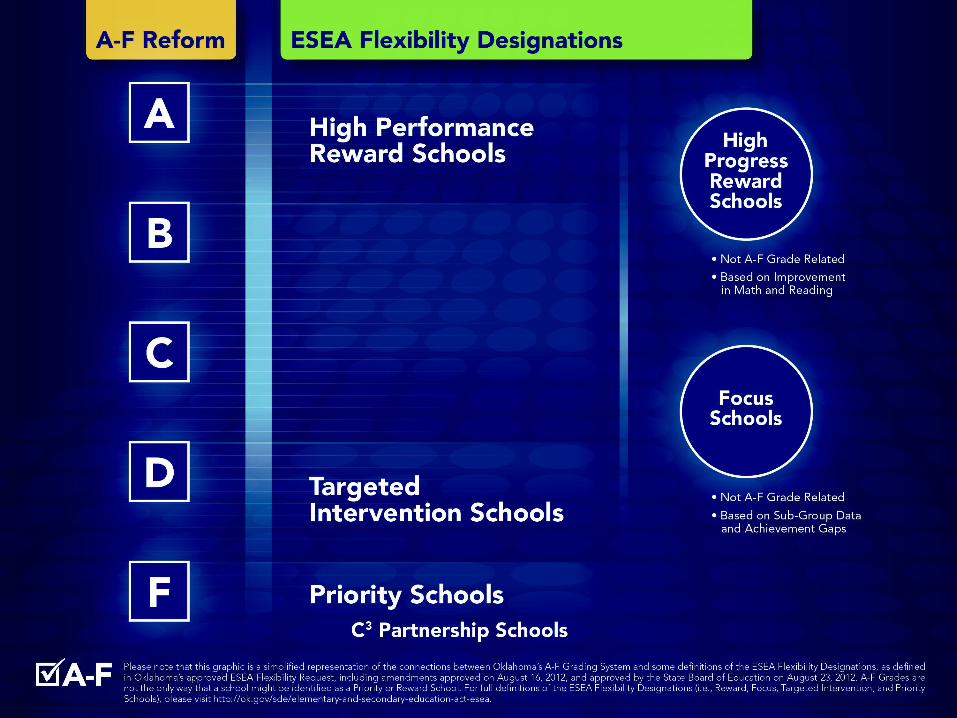
Streamlined, Consistent Terminology• High-Performing Reward School– 2 Methods of Identification
• High-Progress Reward School– 1 Method of Identification
• Focus School– 2 Methods of Identification
• Targeted Intervention School– 1 Method of Identification
• Priority School– 4 Methods of Identification