Commodity Price Booms and Busts: A Primer
50
1 Commodity Price Booms and Busts: A Primer * David S. Jacks (Simon Fraser University and NBER) November 2012 Abstract This paper considers the evidence on real commodity prices over 160 years for 28 commodities representing 5.03 trillion USD worth of production in 2007. In so doing, it suggests and documents a complete typology of commodity price series, comprising long-run trends, medium- run cycles, and short-run boom and bust episodes. The findings of the paper can be summarized as follows: real commodity prices have been on the rise from at least 1950 if evaluated on the basis of the value of production; there is a consistent pattern of commodity price super-cycles in the historical record as well as the present which entail decades-long positive deviations from these long-run trends; these commodity price super-cycles are punctuated by booms and busts which are historically pervasive and becoming more exacerbated over time. These last elements of boom and bust are also found to be particularly bearing in determining real commodity price volatility as well as potentially bearing in determining trend growth in commodity dependent economies. * This paper was prepared for the ANU Centre for Economic History /Centre for Applied Macroeconomic Analysis conference on “Commodity Price Volatility, Past and Present” held in Canberra on November 29-30, 2012. The author thanks the conference organizers for their hospitality and providing the impetus for this paper as well as Stephan Pfaffenzeller for help with the data. Finally, he gratefully acknowledges the Social Science and Humanities Research Council of Canada for research support.
Transcript of Commodity Price Booms and Busts: A Primer

1
Commodity Price Booms and Busts: A Primer*
David S. Jacks (Simon Fraser University and NBER)
November 2012
Abstract
This paper considers the evidence on real commodity prices over 160 years for 28 commodities
representing 5.03 trillion USD worth of production in 2007. In so doing, it suggests and
documents a complete typology of commodity price series, comprising long-run trends, medium-
run cycles, and short-run boom and bust episodes. The findings of the paper can be summarized
as follows: real commodity prices have been on the rise from at least 1950 if evaluated on the
basis of the value of production; there is a consistent pattern of commodity price super-cycles in
the historical record as well as the present which entail decades-long positive deviations from
these long-run trends; these commodity price super-cycles are punctuated by booms and busts
which are historically pervasive and becoming more exacerbated over time. These last elements
of boom and bust are also found to be particularly bearing in determining real commodity price
volatility as well as potentially bearing in determining trend growth in commodity dependent
economies.
* This paper was prepared for the ANU Centre for Economic History /Centre for Applied Macroeconomic Analysis
conference on “Commodity Price Volatility, Past and Present” held in Canberra on November 29-30, 2012. The
author thanks the conference organizers for their hospitality and providing the impetus for this paper as well as
Stephan Pfaffenzeller for help with the data. Finally, he gratefully acknowledges the Social Science and Humanities
Research Council of Canada for research support.

2
I. Introduction
TO BE WRITTEN.
II. Long-run Trends and Medium-run Cycles
A long-standing view in the literature holds that in real terms commodity prices
oftentimes do little better than tread water, exhibiting either downward or non-discernible trends.
This seems to be true regardless of whether the window of observation runs in the mere handful
of decades or across entire centuries (Harvey et al., 2010). Another well-known fact is the
pronounced short-run movement of commodity prices around these long-run trends. It is this
extreme inter- and intra-year volatility against a backdrop of exceedingly slow evolving
dynamics which lead Cashin and McDermott (2002) to typify the long-run behavior of
commodity prices as “small trends and big variability”. Or as Deaton (1999, p. 27) put it: “What
commodity prices lack in trend, they make up for in variance.” A less appreciated fact is the
potential existence of cycles in real commodity prices spanning decades associated with key
events in economic development over time. What this section sets out to do is re-assess the
conventional wisdom on long-run trends as well as introduce new perspectives on commodity
price cycles in the medium run.
The data used in this study comprise long-run annual prices for commodities with at least
5 billion USD worth of production in 2007. Consistent and reliable data collection begins for the
majority of price series in 1850 while no price series enters the data set later than 1900. All told,
they comprise 28 individual series which are drawn from six product categories (animal
products, energy products, grains, metals, minerals, and soft commodities) and which are
enumerated in Table 1.

3
As Table 1 also demonstrates, the data series are not only large in number, but also
economically significant representing 5.03 trillion USD worth of production in 2007.1 Finally,
the individual price series (being expressed in US dollars) were deflated by the US CPI
underlying Officer (2012), supplemented by updates taken from the BLS. The choice of the CPI
as deflator—although not entirely uncontroversial—is a fairly standard practice in the literature.
In what follows, none of the results are materially altered by the consideration of alternative
measures of economy-wide prices such as the US GDP deflator or the US PPI. An appendix to
this paper details the sources for the individual series.
Figures 1-6 document the evolution of real commodity prices from 1850 to 2012. All
series have been converted into index form with real prices in 1900 set equal to 100. Simply
“eye-balling” these series, the previously noted “big variability” of real commodity prices
emerges. Using one common measure of volatility, namely the standard deviation of annual
changes in logged real prices yields an average value of 0.1959 for all commodities and a range
of (0.1348, 0.2955) across commodities. Somewhat curiously, this measure of volatility is itself
fairly narrowly distributed with the vast majority of all observations falling in a much tighter
range defined by 0.1959 +/- 0.04. For better or worse, no clear patterns emerge with respect to
volatility across product categories, except for slightly lower average volatility for metals and
slightly higher average volatility for soft commodities.
However, with respect to long-run trends in the real commodity price data, there are clear
patterns across product categories. Notwithstanding some common global shocks like the peaks
in real prices surrounding World War I, the 1970s, and, to a lesser extent, the late 2000s as well
as the troughs in the 1930s and 1990s, there is a clear divergence in between those commodities
1 Even adjusting for double-counting and neglecting energy products, these productions values are still in excess of
1.92 trillion USD.

4
mired in a perpetual downward trend and those exhibiting a perpetual upward trend. Table 2
draws out this divergence across categories more clearly. Here, real prices in 2012 are compared
to those in 1850, 1900, 1950, and 1975.
It will come as no surprise that energy products have registered increases in real prices
since 1900. Slightly more surprising is the presence of steel and related minerals (chromium, iron
ore, and manganese) in the same category. On the opposite end of the spectrum, soft
commodities have been in collective decline since 1850.2 Indeed, a broader interpretation of soft
commodities often includes grains and hides which suffer from the same fate. The list of
perpetual decliners is rounded out by aluminum (and the related mineral of bauxite) as well as
zinc. This leaves six commodities with a more mixed performance over the past 162 years: beef
and tin which demonstrate a long-run upward trend, but which have eased off somewhat from
their all-time highs in the 1970s; copper and potash which have a consistent upward trend from
1950; and lead and nickel which have essentially been trendless from 1975. Thus, energy
products and minerals are clearly in the “winner” camp, grains and soft commodities are clearly
in the “loser” camp, and metals are left as contested territory.
Interestingly, the combination of Tables 1 and 2 suggest that if anything real commodity
prices are on the rise if evaluated on the basis of the value of production. Of course, this result is
largely driven by energy products and steel, but even excluding these categories, the “winner”
camp accounts for 296.88 billion USD in production versus the 178.41 billion USD in
production for the “loser” camp. How then are these results reconciled with those of Cashin and
McDermott (2002), for instance? First, Cashin and McDermott among others rely on general
commodity price indices, so many of the long-run trends for “winners” are washed out by those
2 The only exception to this statement is the rise in the real price of rubber from 1975 to 2012. However, this result
is more a function of the absolute collapse in rubber prices from the early 1950s and their partial recovery: the index
value stood at 31.96 in 1951, at 7.16 in 1975, and at 10.59 in 2012.

5
of “losers”. Second, there is a slightly different composition of commodities with only 11 of their
16 commodities matching the 28 under consideration in this paper. Finally and most importantly,
there is a massively different composition of product categories: their index only spans the
metals and soft commodities categories. Although metals are somewhat of a mixed bag, soft
commodities—even broadly defined—have been the biggest of “losers” over the past 150 years,
suggesting that much of the conventional wisdom on long-run trends in real commodity prices
may be unduly pessimistic or unduly swayed by events in the very distant past. It also suggests a
potentially very large, but somewhat underappreciated distinction in between “commodities to be
grown” versus “commodities in the ground”.
So much for long-run trends and short-run volatility (of which, more later), now what of
cycles in the medium run? In recent years, the investing community has run with the idea of
commodity price super-cycles (Heap, 2005; Rogers, 2004). In this view, commodity price super-
cycles are broad-based, long-period cycles corresponding to upswings in commodity prices of
roughly 10 to 35 years, implying that a full (trough-to-trough) cycle is roughly twice that length.
These are demand-driven episodes closely linked to historical episodes of mass industrialization
and urbanization which interact with acute capacity constraints in many product categories—in
particular, energy, metals, and minerals—in order to generate above-trend real commodity prices
for years, if not decades on end.
At the same time, a burgeoning literature in identifying commodity price super-cycles has
emerged in the research community (cf. Cuddington and Jerrett, 2008; Erten and Ocampo, 2012;
Jerrett and Cuddington, 2008). The common theme of this literature is that commodity price
super-cycles can be detected in the data by use of asymmetric band pass filters which decompose
the natural log of the real price of commodity i in time t (ln(Pit)) into three components: a long-

6
run trend in excess of 70 years in duration (ln(Pit)_LRt); a super-cycle of 20 to 70 years duration
(ln(Pit)_SCt); and all other shorter cyclical components (ln(Pit)_CCt). Thus, this entails breaking
down the logged price series into three orthogonal components:
1.) ln( ) ln( ) _ ln( ) _ ln( ) _it it t it t it tP P LR P SC P CC
Procedurally, this simply entails taking the logarithmic transformation of the real price indices
reported earlier, estimating a long-run trend (that is, all cyclical components with periods in
excess of 70 years), calculating the deviations of log real prices from this trend, and using these
deviations to identify commodity price super-cycles (that is, all cyclical components with periods
in excess of 20 to 70 years). The reader is referred to the work of Christiano and Fitzgerald
(2003) for details of the asymmetric band pass filter used in this paper (and the previously cited
papers) to identify both the long-run trends and the medium-run commodity price super-cycles.
Figure 7a displays the log of real beef prices from 1850 to 2012 and its estimated long-
run trend. Figure 7b displays the detrended real beef price and the super-cycle component
evident in the former. The scaling on the left-hand-side of the figure is in logs, so a value of 1.00
in Figure 7b represents a 174% deviation from the long-run trend. Thus, the cyclical fluctuations
in beef prices are sizeable. The complete super-cycles for beef prices which deliver deviations
from trend above 0.20 log points (or roughly 22%) can be dated from 1890 to 1929, from 1929 to
1953, and from 1953 to 1999. Figures 8a through 34b replicate the same exercise for the 27
remaining real commodity price series at our disposal. Evidence of large deviations from trend is
apparent in almost all series as is the existence of numerous super-cycles over the past 163
years.3
3 Curiously, although subject to wide fluctuations in its real price (both in absolute terms and relative to trend),
tobacco is the only commodity for which no super-cycle can be detected. This result does not, however, preclude the
existence of multiple booms and busts in real tobacco prices as will be demonstrated below.

7
Tables 3 through 8 enumerate six features of commodity price super-cycles across the six
products categories, namely their start dates, peak dates, trough dates, years to peak, complete
cycle length, and peak value (the largest positive deviation from trend in real prices). All told, 56
commodity price super-cycles with positive price deviations from trend of at least 0.20 log points
are identified. In an attempt to characterize systematic differences in these super-cycles across
time, a battery of regressions were run using three of these features (years to peak, cycle length,
and peak value) as dependent variables and a set of indicator variables capturing three different
time periods, namely from 1914 to 1945 (interwar), from 1946 to 1971 (Bretton Woods), and
from 1972 to 2012 (post-Bretton Woods). Thus, the period from 1850 to 1913 (pre-World War I)
acts as the omitted category. Only two statistically significant results emerge from this exercise.
The post-Bretton Woods era has given rise to a lower value for the years to peak at 14.05 years
0ˆ ˆ( 19.09 5.04)PBW and for the length of cycles at 33.31 years 0
ˆ ˆ( 40.36 7.05)PBW .
Figures 35 through 40 display the histograms for all six features of commodity price-
cycles pooled across the six product categories. Briefly summarizing, we find that the 1890s,
1930s, and 1960s gave rise to the majority of the start dates for commodity price super-cycles
while the 1910s, 1950s, and 1970s gave rise to the majority of the peak dates and the 1930s,
1960s, and 1990s gave rise to the majority of the end dates. Collectively, this suggests a big role
for not only American industrialization/urbanization in the late 19th
century and
European/Japanese re-industrialization/re-urbanization in the mid-20th
century but also the World
Wars in determining the timing of past super-cycles.
Curiously, as Figures 35 through 40 exclude incomplete cycles, they are silent about
currently evolving super-cycles: fully 10 of our 28 commodities demonstrate above-trend real
prices starting from 1994 to 1999; of these, 8 are in the energy products and metals categories

8
(with iron ore critically also making an appearance). In combination with Figure 38 which
demonstrates that the majority of super-cycles peak within 20 years of their start date, this
suggests that we may already be nearing an end to above-trend real commodity prices in the
affected categories.4 Rounding things out, Figures 39 and 40 respectively suggest that the
majority of commodity price super-cycles also evidence complete cycle lengths of less than 40
years and are associated with a very well-behaved distribution of peak values (or peak
amplitudes) whereby the majority of super-cycles are associated with positive deviations from
trend of 20-40%.
Thus, we have been able to establish a consistent pattern of evidence supportive of:
1.) the contention that real commodity prices might best be characterized by upward trends,
especially when evaluated on the basis of the value of production and over the years from 1950;
2.) the notion of commodity price super-cycles in the historical record and present day as well as
for a broader range of commodities than has been previously considered in the literature. What is
missing, however, is any sense of short-run movements in real commodity prices which may be
particularly bearing in determining real commodity price volatility as well as potentially bearing
in determining trend growth in commodity dependent economies. It is to these themes which the
following sections turn.
III. A Century and a Half of Commodity Price Booms and Busts
Up to this point, we have confronted the standing literature on long-run trends and
medium-run cycles through a consideration of 163 years of real commodity price data, finding
4 Indeed, for at least one commodity, natural gas, real prices have already registered their largest deviation from
trend (in 2006). It remains to be seen whether this is symptomatic of other commodity price super-cycles or whether
it simply reflects idiosyncratic features of the natural gas industry, in particular, recent breakthroughs in extraction
technology.

9
some results which can be aligned with the received wisdom on commodity price super-cycles,
but which offers a slightly contrarian—and dare we say, optimistic—view of the long-run course
of real commodity prices. Next, we turn to exploring the short-run dynamics of real commodity
prices, in particular, the widely appreciated phenomena of commodity booms and busts.
Naturally, one important question looms large in this context: how exactly should real
commodity price booms and busts be characterized? Admittedly, there are a number of ways
forward, but one of the most natural is to build on what we have already seen before. Here, we
follow the lead of Mendoza and Terrones (2012) and will take as our basic input the deviations
from the long-run trend in logged real prices for commodity i in time t, calling this component
dit. Let zit represent the standardized version of dit. Commodity i is defined to have experienced a
commodity price boom when we identify one or more contiguous dates for which the boom
condition zit > 1.65 holds (as the value of 1.65 defines the threshold for the 5% upper tail of a
standardized normal distribution). A commodity price boom peaks at *
boomt when the maximum
value of zit is reached for the set of contiguous dates that satisfy the commodity boom condition.
A commodity price boom starts at * where s s
boom boom boomt t t and zit is the smallest, positive
observation in a 7-year centered window. A commodity price boom ends at
* where e e
boom boom boomt t t and zit is the smallest, positive observation in a 7-year centered window.
Highly symmetric conditions define the opposite set of circumstances as well.
Commodity i is defined to have experienced a commodity price bust when we identify one or
more contiguous dates for which the bust condition zit < -1.65 hold (as the value of -1.65 defines
the threshold for the 5% lower tail of a standardized normal distribution). A commodity price
bust troughs at *
bustt when the minimum value of zit is reached for the set of contiguous dates that
satisfy the commodity bust condition. A commodity price bust starts at * where s s
bust bust bustt t t and

10
zit is the largest, negative observation in a 7-year centered window. A commodity price bust ends
at * where e e
bust bust bustt t t and zit is the largest, negative observation in a 7-year centered window.
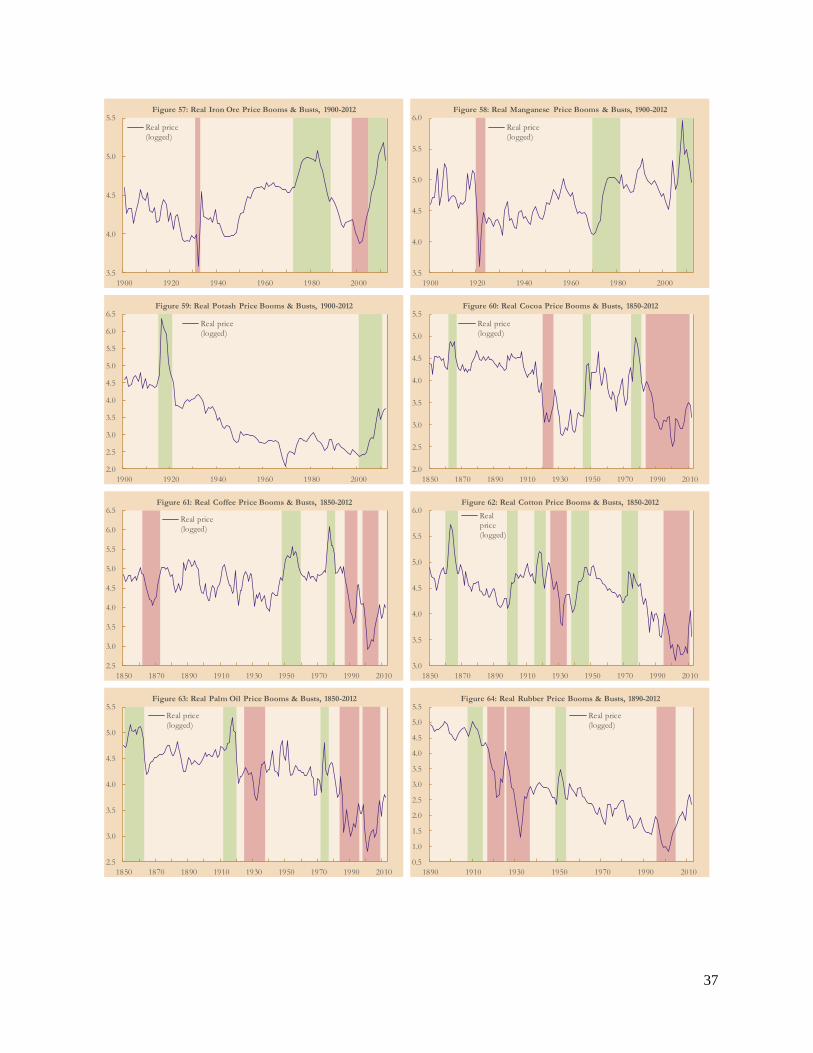
For illustration purposes, the reader is referred to Figure 41 which presents the evidence
on price booms and busts for beef. Again, the log of real beef prices from 1850 to 2012 is
chartered along with the episodes of boom and bust determined by the algorithm given above.
This indicates the presence of three booms (in green) and two busts (in red) for real beef prices
over the past 163 years. Notably, the booms occurred from 1914 to 1921, from 1963 to 1975, and
from 1977 to 1981 while the busts occurred from 1862 to 1870 and from 1949 to 1955,
suggesting that real commodity price booms do not automatically generate real commodity price
busts, nor vice versa. This pattern—or lack thereof—is repeated in Figures 42 through 68 which
replicate the same exercise for the 27 remaining real commodity price series at our disposal.
Evidence of both common and idiosyncratic real commodity price booms and busts is readily
apparent.
Just as in the case of commodity price super-cycles, we provide a full enumeration of the
various commodity price booms and busts underlying these figures in Tables 9 through 14.
There, six features of commodity price super-cycles across the six products categories are
documented, namely their start dates, peak/trough dates, end dates, years to peak/trough, cycle
length, and change to peak/trough (the cumulative increase/decrease in real prices from the
beginning of the boom/bust to the peak/trough). All told, 79 commodity price booms and 73
commodity price busts are identified.
As before, we attempt to characterize systematic difference in these commodity price
booms/busts across time. First, considering commodity price booms alone, a battery of
regressions were run using three of their features (years to peak, cycle length, and change to

11
peak) as dependent variables and a set of indicator variables capturing three different time
periods, namely from 1914 to 1945 (interwar), from 1946 to 1971 (Bretton Woods), and from
1972 to 2012 (post-Bretton Woods). Thus, the period from 1850 to 1913 (pre-World War I) acts
as the omitted category. In terms of statistically significant results, the post-Bretton Woods era
gave rise to a higher value for the years to peak at 4.08 years 0ˆ ˆ( 2.57 1.51)PBW . As to the
cumulative increase in real prices from the beginning of the boom to the peak, this variable has
witnessed a fairly dramatic increase over time 0ˆ ˆ ˆ ˆ( 84.43, 55.45, 43.77,PWWI IW BW
ˆ 114.78)PBW . Thus, the last 40 years have witnessed longer and larger real commodity price
booms than the past.
Figures 69 through 74 display the histograms for these six features of commodity price
booms pooled across the six product categories. Briefly summarizing, we find that the 1850s,
1910s, and 1970s gave rise to the majority of the start dates for commodity price booms while
the 1850/60s, 1910s, and 1970/80s gave rise to the majority of the peak dates and the 1860s,
1910/20s, and 1970/80s gave rise to the majority of the end dates. Collectively, this suggests
much shorter years to peak and cycle lengths than in the case of commodity price super-cycles as
demonstrated in Figures 72 and 73 with the majority of commodity price booms peaking 1-4
years from their start and being 3-6 years in length. What is also very clear is that commodity
price booms are associated with much more pronounced start-to-peak increases in real prices
than would be suggested by the evidence on commodity price super-cycles alone: the majority of
booms are associated with spikes in real prices of 50-150% with values in excess of 300% and
even 1000% not being unheard of.5
5 We also note that currently five commodities are currently experiencing a boom now but are likely past their peak
(iron ore, lead, manganese, steel, and tin) while one commodity is currently experiencing a boom now and likely not
past its peak (wool).

12
Turning to the evidence on commodity price busts, another battery of regressions were
run using three of their features (years to trough, cycle length, and change to trough) as
dependent variables and the same set of indicator variables capturing the three different time
periods with the period from 1850 to 1913 (pre-World War I) acting as the omitted category.
Once again, the post-Bretton Woods era distinguishes itself with significantly longer years to
trough at 4.58 years 0ˆ ˆ( 3.29 1.29)PBW and cycle length at 8.43 years
0ˆ ˆ( 6.86 1.57)PBW . The post-Bretton Woods era along with the interwar period also
distinguished themselves with lower associated values for the change to trough at -52.94% and
-57.84, respectively 0ˆ ˆ ˆ( 43.00; 14.84; 9.94)IW PBW . Thus, the last 40 years have
witnessed longer and larger real commodity price busts—in addition to booms—than the past.
Figures 75 through 80 display the histograms for these six features of commodity price
busts pooled across the six product categories. Briefly summarizing, we find that the 1920s and
1990s gave rise to the majority of the start dates for commodity price busts while the 1930s and
2000s gave rise to the majority of the trough dates and end dates. Figures 78 and 79 suggest
similar dynamics as with commodity price booms with the majority of commodity price busts
troughing 1-4 years from their start and being 3-8 years in length. What is also very clear that
commodity price busts are likewise associated with very pronounced start-to-trough decreases in
real prices: the majority of busts are associated with a cratering in real prices of 45-65%.6
In sum, this consideration of commodity price booms and busts gives rise to a much more
turbulent view of commodities than provided from the lofty perspective of the long- and
medium-run, subject as these commodity booms and busts are to manic price increases and
6 There are two commodities currently experiencing a bust but likely past their trough (aluminum and hides).

13
depressive price declines. And this is seemingly a situation which has only exacerbated over time
and, thus, promises to do so in the future.
IV. Implications for Commodity Price Volatility and Economic Growth
In light of these results, it may be worth our while to consider what the implications of
commodity price booms and busts, in particular their relation to commodity price volatility and
from there to economic growth and development. Admittedly, the nexus between volatility and
growth is a well-tread path (see Jacks, O’Rourke, and Williamson, 2011 on this point), and this
paper does not make any claims to originality in this respect. Rather, by taking the correlation
between higher commodity price volatility and lower economic growth as given, we will set a
more limited goal in trying to associate commodity price booms and busts with periods of acute
commodity price volatility and present some suggestive—but far from convincing—evidence
relating commodity price booms and busts to economic growth.
To begin, we can consider once again the deviations from the long-run trend in logged
real prices estimated in section II. Taking the standard deviation of these values over the entire
span of prices available for each series, we arrive at the figures reported in column (A) of Table
15. There, we can see that the average volatility of these deviations stands at 0.4496 (with a low
of 0.2660 for iron ore and a high of 0.9286 for rubber). Next, we calculate the standard deviation
of these values over the entire span of prices still available for each series, once we exclude
periods of time associated with commodity booms and busts as defined in section III. Thus, we
arrive at the figures reported in column (B) of Table 15 with the average volatility of these
deviations at 0.3290 (and a low of 0.1706 for iron ore and a high of 0.8310 for rubber). Finally,
taking the ratio of (B) to (A), we find that simply by neglecting periods associated with

14
commodity price booms and busts generates levels of volatility which, on average, stand at 72%
of their actual levels (with an associated range of 59% for potash and 95% for bauxite—that is,
every commodity demonstrates lower levels of volatility in the absence of commodity price
booms and busts).
Of course, this may be an unsatisfying exercise for some in that commodity price booms
and busts were defined as those deviations in log prices from their long-run trend which
exceeded a certain threshold. Therefore, the association between boom and bust and volatility as
defined above may seem too automatic. Table 16 repeats the same exercise but with a different
metric for commodity price volatility. Here, we return to a standard measure in the literature,
namely the standard deviation of annual changes in logged real prices. Column (A) again reports
the value of this metric over the entire span of data by commodity, reporting an average value of
0.1959 (and a low of 0.1348 for bauxite and a high of 0.2955 for sugar). Column (B) again
reports the value of this metric over the entire span of data by commodity, once we exclude
periods of time associated with commodity booms and busts as defined in section III. Thus, we
arrive at an average value of 0.1571 (and a low of 0.0729 for steel and a high of 0.2298 for
rubber). Finally, taking the ratio of (B) to (A), we find that simply by neglecting periods
associated with commodity price booms and busts generates levels of volatility which, on
average, stand at 80% of their actual levels (with an associated range of 48% for steel and 97%
for copper—again, every commodity demonstrates lower levels of volatility in the absence of
commodity price booms and busts).
In combination then, it is hard to escape the conclusion that commodity price booms and
busts as defined in this paper are associated with heightened levels of commodity price volatility,
variously defined. But can we push these results even further and draw on the presumed existing

15
link between commodity price volatility and economic growth? Here, things become a little
murkier in that the share of any one commodity in the value of exports—much less to say
aggregate production—is typically small apart from some very rare instances. Thus, with booms
and busts necessarily being defined at the commodity level, more work is needed in: a.)
determining the patterns of commodity production across countries and time; and b.) determining
what constitutes an economy-wide commodity price shock, whether boom or bust.
Provided the reader is willing to grant us a very large grain of salt, we are willing to
admit the following pieces of antipodean evidence for consideration. Cumulatively, beef, natural
gas, wheat, copper, iron ore, and wool represent 85.3 billion AUD, or roughly 29% of Australian
goods and services exports. Conveniently, we also have the real price data and information on
commodity booms and busts detailed above as they relate to these six items. Defining an
economy-wide commodity price shock as the simultaneous occurrence of two or more
commodity price booms or busts for the individual commodities, we find that in the post-World
War II period Australia has experienced two economy-wide commodity price booms (one very
long one from 1971 to 1989 and one newly emergent one from 2005) and one economy-wide
commodity price bust (from 1995 to 2004).
Combining this new information with data from Barro and Ursua (2008) on the evolution
of GDP per capita from 1950 to 2009, we arrive at Figure 81 where again booms are depicted in
green and busts are depicted in red. Here, a consistent—albeit somewhat counterintuitive—story
plays out, namely that commodity price booms have been bad for Australia’s health while
commodity price busts have been good for Australia’s health. This admittedly contentious claim
can be seen more clearly by considering the evidence on trend growth before and after the
initiation of commodity price booms and busts. Thus, in the five years prior to the commodity

16
boom staring in 1971, trend growth in GDP per capita was 1.96% while trend growth in the five
years pursuant to 1971 was 0.49%. Likewise, in the five years prior to the commodity bust
staring in 1995, trend growth in GDP per capita was 2.21% while trend growth in the five years
pursuant to 1995 was 2.72%. Finally, in the five years prior to the commodity boom staring in
2005, trend growth in GDP per capita was 1.83% while trend growth in the five years pursuant to
2005 was 1.37%.
Undoubtedly, much more could and should be done on the front connecting commodity
price booms and busts and their potentially asymmetric linkages to economic growth. At the very
least, however, the previous exercise at least points one way forward in using the dating of
commodity price booms and busts presented in this paper as the raw material for a more rigorous
and hopefully more convincing treatment of the nexus among commodity price booms and busts,
commodity price volatility, and economic growth and development.
V. Conclusion
TO BE WRITTEN.

17
References
Barro, R.J. and J.F. Ursua (2008), “Macroeconomic Crises since 1870.” Brookings Papers on
Economic Activity Spring: 255-335.
Cashin, P. and C.J. McDermott (2002), “The Long-Run Behavior of Commodity Prices: Small
Trends and Big Variability.” IMF Staff Papers 49(2): 175-199.
Christiano, L. and T. Fitzgerald (2003), “The Band Pass Filter.” International Economic Review
44(2): 435-465.
Cuddington, J.T. and D. Jerrett (2008), “Super Cycles in Real Metal Prices?” IMF Staff Papers
55(4): 541-565.
Deaton, A. (1999), “Commodity Prices and Growth in Africa.” Journal of Economic
Perspectives. 13(1): 23-40.
Erten, B. and J.A. Ocampo (2012), “Super-cycles of Commodity Prices Since the Mid-
Nineteenth Century.”
Harvey, D.I., N.M. Kellard, J.B. Madsen, and M.E. Wohar (2010), “The Prebisch-Singer
Hypothesis: Four Centuries of Evidence.” Review of Economics and Statistics 92(2): 367-
377.
Heap, A. (2005), “China—The Engine of Commodities Super Cycle.” Citigroup Smith Barney.
Jacks, D.S., K.H. O’Rourke, and J.G. Williamson (2011), “Commodity Price Volatility and
World Market Integration since 1700.” Review of Economics and Statistics 93(3): 800-
813.
Jerrett, D. and J.T. Cuddington (2008), “Broadening the Statistical Search for Metal Price Super
Cycles to Steel and Related Metals.” Resources Policy 33(4): XXXXX.
Mendoza, E.G. and M.E. Terrones (2012), “An Anatomy of Credit Booms and Their Demise.”
NBER Working Paper 18379.
Officer, L.H. (2012), “The Annual Consumer Price Index for the United States, 1774-2011.”
Accessed from the website, http://www.whatisitworth.com
Rogers, J. (2004), Hot Commodities: How Anyone Can Invest and Profit in the World’s Best
Market. New York: Random House.

18
Appendix This appendix details the sources of the annual price data used throughout this paper. As such,
there are a few key sources of data: the annual Sauerbeck/Statist (SS) series dating from 1850 to
1950; the annual Grilli and Yang (GY) series dating from 1900 to 1986; the annual unit values of
mineral production provided by the United States Geographical Survey (USGS) dating from
1900 to 2012; the annual Pfaffenzeller, Newbold, and Rayner (PNR) update to Grilli and Yang’s
series dating from 1987 to 2010; and the monthly International Monetary Fund (IMF), United
Nations Conference on Trade and Development (UNCTAD), and World Bank (WB) series
dating variously from 1960 and 1980 to 2012. The relevant references are:
Grilli, E.R. and M.C. Yang (1988), “Primary Commodity Prices, Manufactured Goods Prices,
and the Terms of Trade of Developing Countries: What the Long Run Shows.” World
Bank Economic Review 2(1): 1-47.
Pfaffenzeller, S., P. Newbold, and A. Rayner (2007), “A Short Note on Updating the Grilli and
Yang Commodity Price Index.” World Bank Economic Review 21(1): 151-163.
Sauerbeck, A. (1886), “Prices of Commodities and the Precious Metals,” Journal of the
Statistical Society of London 49(3): 581-648.
Sauerbeck, A. (1893), “Prices of Commodities During the Last Seven Years,” Journal of
the Royal Statistical Society 56(2): 215-54.
Sauerbeck, A. (1908), “Prices of Commodities in 1908,” Journal of the Royal Statistical
Society 72(1): 68-80.
Sauerbeck, A. (1917), “Wholesale Prices of Commodities in 1916,” Journal of the Royal
Statistical Society 80(2): 289-309.
The Statist (1930), “Wholesale Prices of Commodities in 1929,” Journal of the Royal
Statistical Society 93(2): 271-87.
In what follows, a more detailed enumeration of the sources for each individual series is
provided.
Aluminum: 1900-2010, GY and PNR; 2011-2012, UNCTAD.
Bauxite: 1900-2012, USGS.
Beef: 1850-1899, SS; 1900-1959, GY; 1960-2012, WB.
Chromium: 1900-2012, USGS.
Cocoa: 1850-1899, Global Financial Data; 1900-1959, GY; 1960-2012, WB.
Coffee: 1850-1899, SS; 1900-1959, GY; 1960-2012, WB.
Copper (wire bars): 1850-1899, SS; 1900-2010, GY and PNR; 2011-2012, UNCTAD.
Corn: 1850-1851, Cole, A.H. (1938), Wholesale Commodity Prices in the United States, 1700-
1861: Statistical Supplement. Cambridge: Harvard University Press; 1852-1859,
Bezanson, A. (1954), Wholesale Prices in Philadelphia 1852-1896. Philadelphia:
University of Pennsylvania Press; 1860-1999, Global Financial Data; 2000-2012, United
States Department of Agriculture National Agricultural Statistics Service.
Cotton: 1850-1899, SS; 1900-1959, GY; 1960-2012, WB.
Hides: 1850-1899, SS; 1900-1959, GY; 1960-2012, UNCTAD.
Iron ore: 1900-2012, USGS.
Lead: 1850-1899, SS; 1900-2010, GY and PNR; 2011-2012, UNCTAD.
Manganese: 1900-2012, USGS.

19
Natural gas (wellhead): 1900-1921, Carter, S. et al. (2006), Historical Statistics of the United
States; 1922-2012, United States Energy Information Administration.
Nickel: 1850-1899, Carter, S. et al. (2006), Historical Statistics of the United States; 1900-2012,
USGS.
Palm oil: 1850-1899, SS; 1900-1959, GY; 1960-2012, WB.
Petroleum (WTI): 1860-2000, Global Financial Data; 2001-2012, IMF.
Potash: 1900-2012, USGS.
Rice: 1850-1899, SS; 1900-1956, GY; 1957-1979, Global Financial Data; 1980-2012, IMF.
Rubber: 1890-1899, Global Financial Data; 1900-1959, GY; 1960-2012, WB.
Steel (hot-rolled bar): 1897-1998, Carter, S. et al. (2006), Historical Statistics of the United
States; 1999-2012, WB.
Sugar: 1850-1899, SS; 1900-1959, GY; 1960-2012, WB.
Tea: 1850-1899, SS; 1900-1959, GY; 1960-2012, WB.
Tin: 1850-1899, SS; 1900-2010, GY and PNR; 2011-2012, UNCTAD.
Tobacco: 1850-1865, Clark, G. (2005), “The Condition of the Working Class in England,
1209-2004.” Journal of Political Economy 113(6): 1307-1340; 1866-1899, Carter, S. et
al. (2006), Historical Statistics of the United States; 1900-1959, GY; 1960-2012, WB.
Wheat: 1850-1999, Global Financial Data; 2000-2012, United States Department of Agriculture
National Agricultural Statistics Service.
Wool: 1850-1899, SS; 1900-1979, GY; 1980-2012, IMF.
Zinc: 1850-2000, Global Financial Data; 2001-2012, IMF.

20
Commodity Production in 2007 Units of measurement Value of production (b 2007 USD)
Animal products 42.12
Beef 11.90 Million tonnes 30.97
Hides 7.01 Million tonnes 11.15
Energy products 2899.76
Natural gas 2939.30 Billion cubic m. 648.75
Petroleum 29759.55 Million barrels 2251.01
Grains 430.70
Corn 789.52 Million tonnes 102.26
Rice 656.97 Million tonnes 218.37
Wheat 612.60 Million tonnes 110.07
Metals 1303.22
Aluminum 32.00 Million tonnes 87.92
Copper 15.00 Million tonnes 100.23
Lead 8.10 Million tonnes 20.71
Nickel 1.45 Million tonnes 53.85
Steel 1351.30 Million tonnes 998.34
Tin 0.35 Million tonnes 5.33
Zinc 11.30 Million tonnes 36.84
Minerals 167.00
Bauxite 213.00 Million tonnes 6.65
Chromium 7.03 Million tonnes 14.13
Iron ore 2043.00 Million tonnes 121.35
Manganese 12.10 Million tonnes 14.40
Potash 34.90 Million tonnes 10.47
Soft commodities 189.16
Cocoa 3.90 Million tonnes 7.63
Coffee 7.44 Million tonnes 17.34
Cotton 25.20 Million tonnes 35.16
Palm oil 39.76 Million tonnes 28.59
Rubber 9.89 Million tonnes 22.65
Sugar 169.00 Million tonnes 37.11
Tea 3.98 Million tonnes 8.43
Tobacco 6.19 Million tonnes 20.51
Wool 1.35 Million tonnes 11.73
Sources: British Geological Survey, World Mineral Production, 2003-2007; BP Energy Yearbook; FAO; USGS.
Table 1: Value of Production across Commodities

21
0
50
100
150
200
250
300
350
400
450
500
1850 1870 1890 1910 1930 1950 1970 1990 2010
Figure 1: Real Animal Product Prices, 1850-2012 (1900=100)
Beef
Hides
0
50
100
150
200
250
300
350
400
450
500
550
600
650
700
750
1850 1870 1890 1910 1930 1950 1970 1990 2010
Figure 2: Real Energy Prices, 1860-2012 (1900=100)
Natural gas
Petroleum
0
50
100
150
200
250
300
1850 1870 1890 1910 1930 1950 1970 1990 2010
Figure 3: Real Grain Prices, 1850-2012 (1900=100)
Corn
Rice
Wheat
0
50
100
150
200
1850 1870 1890 1910 1930 1950 1970 1990 2010
Figure 4a: Real Metal Prices, 1850-2012 (1900=100)
Aluminum
Copper
Lead
0
50
100
150
200
250
300
350
400
450
500
550
1850 1870 1890 1910 1930 1950 1970 1990 2010
Figure 4b: Real Metal Prices, 1850-2012 (1900=100)
Nickel
0
50
100
150
200
250
300
1850 1870 1890 1910 1930 1950 1970 1990 2010
Figure 4c: Real Metal Prices, 1850-2012 (1900=100)
Steel
Tin
Zinc
0
50
100
150
200
250
1900 1920 1940 1960 1980 2000
Figure 5a: Real Mineral Prices, 1900-2012 (1900=100)
Bauxite
Chromium
Iron ore
0
50
100
150
200
250
300
350
400
1900 1920 1940 1960 1980 2000
Figure 5b: Real Mineral Prices, 1900-2012 (1900=100)
Manganese
Potash

22
0
50
100
150
200
250
300
350
400
450
1850 1870 1890 1910 1930 1950 1970 1990 2010
Figure 6a: Real Soft Commodity Prices, 1850-2012 (1900=100)
Cocoa
Coffee
Cotton
0
50
100
150
200
250
300
350
1850 1870 1890 1910 1930 1950 1970 1990 2010
Figure 6b: Real Soft Commodity Prices, 1850-2012 (1900=100)
Palm oil
Rubber
Sugar
0
50
100
150
200
250
300
1850 1870 1890 1910 1930 1950 1970 1990 2010
Figure 6c: Real Soft Commodity Prices, 1850-2012 (1900=100)
Tea
Tobacco
Wool

23
Cumulative change in Cumulative change in Cumulative change in Cumulative change in
Commodity in price from 1850 (%) price from 1900 (%) price from 1950 (%) price from 1975 (%)
Animal products
Beef 156.79 97.24 215.99 -26.52
Hides -41.48 -62.24 -59.35 -18.00
Energy products
Natural gas N/A 14.95 250.24 24.58
Petroleum N/A 623.30 361.55 109.28
Grains
Corn -39.73 -40.45 -55.75 -47.16
Rice -77.76 -72.21 -55.68 -62.53
Wheat -69.23 -69.83 -71.64 -59.67
Metals
Aluminum N/A -89.38 -41.97 -42.28
Copper -28.92 -17.68 85.61 38.73
Lead -44.74 -23.37 -25.52 2.87
Nickel -86.19 -42.53 88.49 -8.30
Steel N/A 18.71 62.93 10.60
Tin 107.03 27.84 18.35 -25.61
Zinc -7.95 -20.57 -26.16 -32.26
Minerals
Bauxite N/A -73.51 -52.22 -67.63
Chromium N/A 79.76 302.42 13.43
Iron ore N/A 40.48 98.50 12.56
Manganese N/A 40.60 36.47 1.98
Potash N/A -57.60 97.58 135.82
Soft commodities
Cocoa -70.09 -76.10 -63.00 -55.80
Coffee -58.17 -46.02 -71.63 -60.01
Cotton -74.04 -65.01 -74.02 -60.75
Palm oil -63.84 -57.58 -51.00 -41.79
Rubber N/A -89.41 -55.86 47.91
Sugar -86.01 -70.50 -50.40 -74.19
Tea -83.57 -68.60 -54.45 -41.93
Tobacco -57.54 -23.04 -62.87 -44.75
Wool -72.09 -66.18 -71.88 -16.60
Table 2: Cumulative Changes in Prices over the Long-Run

24
3.5
4.0
4.5
5.0
5.5
6.0
6.5
1850 1870 1890 1910 1930 1950 1970 1990 2010
Figure 7a: Real Beef Price Components, 1850-2012
Real price (logged)
Long-run trend
3.0
3.5
4.0
4.5
5.0
5.5
1850 1870 1890 1910 1930 1950 1970 1990 2010
Figure 8a: Real Hide Price Components, 1850-2012
Real price (logged)
Long-run trend
-1.0
-0.5
0.0
0.5
1.0
1.5
1850 1870 1890 1910 1930 1950 1970 1990 2010
Figure 7b: Real Beef Price Components, 1850-2012
Detrended price series
Super-cycle component
-1.0
-0.5
0.0
0.5
1.0
1850 1870 1890 1910 1930 1950 1970 1990 2010
Figure 8b: Real Hide Price Components, 1850-2012
Detrended price series
Super-cycle component
3.0
3.5
4.0
4.5
5.0
5.5
6.0
6.5
1900 1920 1940 1960 1980 2000
Figure 9a: Real Natural Gas Price Components, 1900-2012
Real price (logged)
Long-run trend
3.5
4.0
4.5
5.0
5.5
6.0
6.5
7.0
1860 1880 1900 1920 1940 1960 1980 2000
Figure 10a: Real Petroleum Price Components, 1860-2012
Real price (logged)
Long-run trend
-1.0
-0.5
0.0
0.5
1.0
1.5
1900 1920 1940 1960 1980 2000
Figure 9b: Real Natural Gas Price Components, 1900-2012
Detrended price series
Super-cycle component
-1.0
-0.5
0.0
0.5
1.0
1.5
2.0
1860 1880 1900 1920 1940 1960 1980 2000
Figure 10b: Real Petroleum Price Components, 1860-2012
Detrended price series
Super-cycle component

25
3.0
3.5
4.0
4.5
5.0
5.5
6.0
1850 1870 1890 1910 1930 1950 1970 1990 2010
Figure 11a: Real Corn Price Components, 1850-2012
Real price (logged)
Long-run trend
2.0
2.5
3.0
3.5
4.0
4.5
5.0
5.5
1850 1870 1890 1910 1930 1950 1970 1990 2010
Figure 12a: Real Rice Price Components, 1850-2012
Real price (logged)
Long-run trend
-1.0
-0.5
0.0
0.5
1.0
1850 1870 1890 1910 1930 1950 1970 1990 2010
Figure 11b: Real Corn Price Components, 1850-2012
Detrended price series
Super-cycle component
-2.0
-1.5
-1.0
-0.5
0.0
0.5
1.0
1850 1870 1890 1910 1930 1950 1970 1990 2010
Figure 12b: Real Rice Price Components, 1850-2012
Detrended price series
Super-cycle component
2.0
2.5
3.0
3.5
4.0
4.5
5.0
5.5
1850 1870 1890 1910 1930 1950 1970 1990 2010
Figure 13a: Real Wheat Price Components, 1850-2012
Real price (logged)
Long-run trend
2.0
2.5
3.0
3.5
4.0
4.5
5.0
1900 1920 1940 1960 1980 2000
Figure 14a: Real Aluminum Price Components, 1900-2012
Real price (logged)
Long-run trend
-2.0
-1.5
-1.0
-0.5
0.0
0.5
1.0
1850 1870 1890 1910 1930 1950 1970 1990 2010
Figure 13b: Real Wheat Price Components, 1850-2012
Detrended price series
Super-cycle component
-1.0
-0.5
0.0
0.5
1.0
1.5
2.0
2.5
1900 1920 1940 1960 1980 2000
Figure 14b: Real Aluminum Price Components, 1900-2012
Detrended price series
Super-cycle component

26
2.5
3.0
3.5
4.0
4.5
5.0
5.5
1850 1870 1890 1910 1930 1950 1970 1990 2010
Figure 15a: Real Copper Price Components, 1850-2012
Real price (logged)
Long-run trend
3.0
3.5
4.0
4.5
5.0
5.5
1850 1870 1890 1910 1930 1950 1970 1990 2010
Figure 16a: Real Lead Price Components, 1850-2012
Real price (logged)
Long-run trend
-1.0
-0.5
0.0
0.5
1.0
1850 1870 1890 1910 1930 1950 1970 1990 2010
Figure 15b: Real Copper Price Components, 1850-2012
Detrended price series
Super-cycle component
-1.5
-1.0
-0.5
0.0
0.5
1.0
1850 1870 1890 1910 1930 1950 1970 1990 2010
Figure 16b: Real Lead Price Components, 1850-2012
Detrended price series
Super-cycle component
3.0
3.5
4.0
4.5
5.0
5.5
6.0
6.5
1850 1870 1890 1910 1930 1950 1970 1990 2010
Figure 17a: Real Nickel Price Components, 1850-2012
Real price (logged)
Long-run trend
3.5
4.0
4.5
5.0
1897 1917 1937 1957 1977 1997
Figure 18a: Real Steel Price Components, 1897-2012
Real price (logged)
Long-run trend
-2.5
-2.0
-1.5
-1.0
-0.5
0.0
0.5
1.0
1850 1870 1890 1910 1930 1950 1970 1990 2010
Figure 17b: Real Nickel Price Components, 1850-2012
Detrended price series
Super-cycle component
-0.5
0.0
0.5
1.0
1897 1917 1937 1957 1977 1997
Figure 18b: Real Steel Price Components, 1897-2012
Detrended price series
Super-cycle component

27
3.0
3.5
4.0
4.5
5.0
5.5
6.0
1850 1870 1890 1910 1930 1950 1970 1990 2010
Figure 19a: Real Tin Price Components, 1850-2012
Real price (logged)
Long-run trend
3.5
4.0
4.5
5.0
5.5
6.0
1850 1870 1890 1910 1930 1950 1970 1990 2010
Figure 20a: Real Zinc Price Components, 1850-2012
Real price (logged)
Long-run trend
-1.0
-0.5
0.0
0.5
1.0
1.5
2.0
1850 1870 1890 1910 1930 1950 1970 1990 2010
Figure 19b: Real Tin Price Components, 1850-2012
Detrended price series
Super-cycle component
-1.0
-0.5
0.0
0.5
1.0
1.5
1850 1870 1890 1910 1930 1950 1970 1990 2010
Figure 20b: Real Zinc Price Components, 1850-2012
Detrended price series
Super-cycle component
3.0
3.5
4.0
4.5
5.0
5.5
1900 1920 1940 1960 1980 2000
Figure 21a: Real Bauxite Price Components, 1900-2012
Real price (logged)
Long-run trend
3.0
3.5
4.0
4.5
5.0
5.5
1900 1920 1940 1960 1980 2000
Figure 22a: Real Chromium Price Components, 1900-2012
Real price (logged)
Long-run trend
-2.0
-1.5
-1.0
-0.5
0.0
0.5
1.0
1900 1920 1940 1960 1980 2000
Figure 21b: Real Bauxite Price Components, 1900-2012
Detrended price series
Super-cycle component
-1.0
-0.5
0.0
0.5
1.0
1900 1920 1940 1960 1980 2000
Figure 22b: Real Chromium Price Components, 1900-2012
Detrended price series
Super-cycle component

28
3.5
4.0
4.5
5.0
5.5
1900 1920 1940 1960 1980 2000
Figure 23a: Real Iron Ore Price Components, 1900-2012
Real price (logged)
Long-run trend
3.5
4.0
4.5
5.0
5.5
6.0
1900 1920 1940 1960 1980 2000
Figure 24a: Real Manganese Price Components, 1900-2012
Real price (logged)
Long-run trend
-1.0
-0.5
0.0
0.5
1.0
1900 1920 1940 1960 1980 2000
Figure 23b: Real Iron Ore Price Components, 1900-2012
Detrended price series
Super-cycle component
-1.5
-1.0
-0.5
0.0
0.5
1.0
1.5
1900 1920 1940 1960 1980 2000
Figure 24b: Real Manganese Price Components, 1900-2012
Detrended price series
Super-cycle component
2.0
2.5
3.0
3.5
4.0
4.5
5.0
5.5
6.0
6.5
1900 1920 1940 1960 1980 2000
Figure 25a: Real Potash Price Components, 1900-2012
Real price (logged)
Long-run trend
2.0
2.5
3.0
3.5
4.0
4.5
5.0
5.5
1850 1870 1890 1910 1930 1950 1970 1990 2010
Figure 26a: Real Cocoa Price Components, 1850-2012
Real price (logged)
Long-run trend
-2.0
-1.5
-1.0
-0.5
0.0
0.5
1.0
1.5
2.0
1900 1920 1940 1960 1980 2000
Figure 25b: Real Potash Price Components, 1900-2012
Detrended price series
Super-cycle component
-2.0
-1.5
-1.0
-0.5
0.0
0.5
1.0
1850 1870 1890 1910 1930 1950 1970 1990 2010
Figure 26b: Real Cocoa Price Components, 1850-2012
Detrended price series
Super-cycle component

29
2.5
3.0
3.5
4.0
4.5
5.0
5.5
6.0
6.5
1850 1870 1890 1910 1930 1950 1970 1990 2010
Figure 27a: Real Coffee Price Components, 1850-2012
Real price (logged)
Long-run trend
3.0
3.5
4.0
4.5
5.0
5.5
6.0
1850 1870 1890 1910 1930 1950 1970 1990 2010
Figure 28a: Real Cotton Price Components, 1850-2012
Real price (logged)
Long-run trend
-2.0
-1.5
-1.0
-0.5
0.0
0.5
1.0
1850 1870 1890 1910 1930 1950 1970 1990 2010
Figure 27b: Real Coffee Price Components, 1850-2012
Detrended price series
Super-cycle component-2.0
-1.5
-1.0
-0.5
0.0
0.5
1.0
1.5
1850 1870 1890 1910 1930 1950 1970 1990 2010
Figure 28b: Real Cotton Price Components, 1850-2012
Detrended price series
Super-cycle component
2.5
3.0
3.5
4.0
4.5
5.0
5.5
1850 1870 1890 1910 1930 1950 1970 1990 2010
Figure 29a: Real Palm Oil Price Components, 1850-2012
Real price (logged)
Long-run trend
0.5
1.0
1.5
2.0
2.5
3.0
3.5
4.0
4.5
5.0
5.5
1890 1910 1930 1950 1970 1990 2010
Figure 30a: Real Rubber Price Components, 1890-2012
Real price (logged)
Long-run trend
-2.0
-1.5
-1.0
-0.5
0.0
0.5
1.0
1850 1870 1890 1910 1930 1950 1970 1990 2010
Figure 29b: Real Palm Oil Price Components, 1850-2012
Detrended price series
Super-cycle component
-3.5
-3.0
-2.5
-2.0
-1.5
-1.0
-0.5
0.0
0.5
1.0
1890 1910 1930 1950 1970 1990 2010
Figure 30b: Real Rubber Price Components, 1890-2012
Detrended price series
Super-cycle component

30
2.0
2.5
3.0
3.5
4.0
4.5
5.0
5.5
6.0
1850 1870 1890 1910 1930 1950 1970 1990 2010
Figure 31a: Real Sugar Price Components, 1850-2012
Real price (logged)
Long-run trend
3.0
3.5
4.0
4.5
5.0
5.5
1850 1870 1890 1910 1930 1950 1970 1990 2010
Figure 32a: Real Tea Price Components, 1850-2012
Real price (logged)
Long-run trend
-2.5
-2.0
-1.5
-1.0
-0.5
0.0
0.5
1.0
1.5
1850 1870 1890 1910 1930 1950 1970 1990 2010
Figure 31b: Real Sugar Price Components, 1850-2012
Detrended price series
Super-cycle component
-2.0
-1.5
-1.0
-0.5
0.0
0.5
1850 1870 1890 1910 1930 1950 1970 1990 2010
Figure 32b: Real Tea Price Components, 1850-2012
Detrended price series
Super-cycle component
4.0
4.5
5.0
5.5
6.0
1850 1870 1890 1910 1930 1950 1970 1990 2010
Figure 33a: Real Tobacco Price Components, 1850-2012
Real price (logged)
Long-run trend
2.0
2.5
3.0
3.5
4.0
4.5
5.0
5.5
1850 1870 1890 1910 1930 1950 1970 1990 2010
Figure 34a: Real Wool Price Components, 1850-2012
Real price (logged)
Long-run trend
-1.0
-0.5
0.0
0.5
1850 1870 1890 1910 1930 1950 1970 1990 2010
Figure 33b: Real Tobacco Price Components, 1850-2012
Detrended price series
Super-cycle component
-2.0
-1.5
-1.0
-0.5
0.0
0.5
1.0
1850 1870 1890 1910 1930 1950 1970 1990 2010
Figure 34b: Real Wool Price Components, 1850-2012
Detrended price series
Super-cycle component

31
Commodity Start date Peak Trough Years to peak Cycle length Peak value (%)
Beef 1850? 1854 1867 4? 17? 25.90
Hides 1850? 1856 1869 6? 19? 39.15
Beef 1890 1916 1929 26 39 29.87
Hides 1893 1914 1931 21 39 32.64
Beef 1929 1940 1953 11 24 38.28
Hides 1931 1946 1963 15 32 28.74
Beef 1953 1968 1999 15 46 50.14
Table 3: Dates of Commodity Price Supercycles for Animal Products
Commodity Start date Peak Trough Years to peak Cycle length Peak value (%)
Petroleum 1860? 1860 1886 0? 26? 29.25
Petroleum 1886 1918 1936 32 50 40.57
Natural gas 1908 1935 1948 27 40 23.10
Petroleum 1967 1981 1996 14 29 79.08
Natural gas 1970 1982 1994 12 24 51.81
Natural gas 1994 2006 - 12 - 50.04
Petroleum 1996 - - - - 21.11
Table 4: Dates of Commodity Price Supercycles for Energy Products
Commodity Start date Peak Trough Years to peak Cycle length Peak value (%)
Rice 1850? 1854 1869 4? 19? 20.76
Rice 1892 1907 1936 15 44 27.31
Wheat 1893 1915 1934 22 41 32.12
Corn 1897 1913 1933 16 36 38.94
Corn 1933 1949 1962 16 29 21.66
Wheat 1934 1950 1963 16 29 20.29
Rice 1960 1974 1999 14 39 37.74
Corn 1962 1976 2002 14 40 33.80
Wheat 1963 1978 2000 15 37 21.21
Table 5: Dates of Commodity Price Supercycles for Grains

32
Commodity Start date Peak Trough Years to peak Cycle length Peak value (%)
Copper 1850? 1854 1869 4? 19? 37.07
Lead 1850? 1854 1868 4? 18? 26.40
Tin 1850? 1856 1872 6? 22? 36.06
Nickel 1862 1876 1891 14 29 31.08
Zinc 1886 1912 1931 26 45 37.58
Lead 1889 1905 1935 16 46 28.26
Copper 1890 1909 1933 19 43 39.71
Nickel 1891 1910 1924 19 33 24.57
Tin 1893 1911 1928 18 35 43.45
Zinc 1931 1947 1961 16 30 28.54
Copper 1933 1969 1999 36 66 27.61
Lead 1935 1951 1962 16 27 21.44
Tin 1961 1979 1997 18 36 67.59
Zinc 1961 1975 2000 14 39 20.03
Lead 1962 1977 1997 15 35 29.24
Steel 1972 1982 1997 10 25 24.56
Nickel 1995 - - - - 26.83
Lead 1997 - - - - 32.05
Steel 1997 - - - - 21.85
Tin 1997 - - - - 26.97
Copper 1999 - - - - 30.17
Table 6: Dates of Commodity Price Supercycles for Metals
Commodity Start date Peak Trough Years to peak Cycle length Peak value (%)
Manganese 1900? 1910 1926 10? 26? 22.92
Potash 1903 1916 1929 13 26 46.87
Bauxite 1924 1938 1952 14 28 44.69
Chromium 1925 1940 1966 15 41 29.90
Manganese 1926 1955 1970 29 44 33.66
Chromium 1966 1981 1998 15 32 33.00
Iron ore 1969 1981 1997 12 28 39.73
Potash 1969 1982 1999 13 30 43.57
Manganese 1970 1983 1996 13 26 23.13
Iron ore 1997 - - - - 25.44
Table 7: Dates of Commodity Price Supercycles for Minerals

33
Commodity Start date Peak Trough Years to peak Cycle length Peak value (%)
Cotton 1850? 1864 1894 14? 44? 36.79
Palm oil 1850? 1855 1868 5? 18? 29.23
Sugar 1850? 1854 1867 4? 17? 23.76
Wool 1850? 1855 1869 5? 19? 21.71
Wool 1890 1918 1934 28 44 24.25
Palm oil 1891 1914 1931 23 40 40.47
Rubber 1891 1911 1930 20 39 57.96
Cocoa 1893 1908 1937 15 44 44.99
Cotton 1894 1914 1936 20 42 35.04
Sugar 1901 1917 1933 16 32 48.13
Coffee 1903 1919 1940 16 37 21.42
Rubber 1930 1953 1970 23 40 30.45
Sugar 1933 1949 1962 16 29 35.28
Cotton 1936 1950 1962 14 26 28.99
Cocoa 1937 1952 1966 15 29 57.14
Coffee 1940 1954 1966 14 26 43.28
Wool 1960 1979 1999 19 39 23.15
Cotton 1962 1976 2001 14 39 25.16
Palm oil 1962 1977 1995 15 33 35.99
Sugar 1962 1976 2002 14 40 50.02
Cocoa 1966 1979 1994 13 28 50.00
Coffee 1966 1979 2000 13 34 52.94
Cocoa 1994 - - - - 21.69
Rubber 1998 - - - - 33.39
Table 8: Dates of Commodity Price Supercycles for Soft Commodities

34
0
5
10
15
20
Figure 35: Frequency of Commodity Price Supercycle Start Dates
0
5
10
15
20
Figure 36: Frequency of Commodity Price Supercycle Peak Dates
0
5
10
15
20
Figure 37: Frequency of Commodity Price Supercycle End Dates
0
5
10
15
20
25
Figure 38: Frequency of Commodity Price Supercycle Years to Peak
0
5
10
15
20
Figure 39: Frequency of Commodity Price Supercycle Length in Years
0
5
10
15
20
Figure 40: Frequency of Commodity Price Supercycle Peak Values (%)

35
3.5
4.0
4.5
5.0
5.5
6.0
6.5
1850 1870 1890 1910 1930 1950 1970 1990 2010
Figure 41: Real Beef Price Booms & Busts, 1850-2012
Real price
(logged)
3.0
3.5
4.0
4.5
5.0
5.5
1850 1870 1890 1910 1930 1950 1970 1990 2010
Figure 42: Real Hide Price Booms & Busts, 1850-2012
Real price
(logged)
3.0
3.5
4.0
4.5
5.0
5.5
6.0
6.5
1900 1920 1940 1960 1980 2000
Figure 43: Real Natural Gas Price Booms & Busts, 1900-2012
Real price
(logged)
3.5
4.0
4.5
5.0
5.5
6.0
6.5
7.0
1860 1880 1900 1920 1940 1960 1980 2000
Figure 44: Real Petroleum Price Booms & Busts, 1860-2012
Real
price
(logged)
3.0
3.5
4.0
4.5
5.0
5.5
6.0
1850 1870 1890 1910 1930 1950 1970 1990 2010
Figure 45: Real Corn Price Booms & Busts, 1850-2012
Real price
(logged)
2.0
2.5
3.0
3.5
4.0
4.5
5.0
5.5
1850 1870 1890 1910 1930 1950 1970 1990 2010
Figure 46: Real Rice Price Booms & Busts, 1850-2012
Real price
(logged)
2.0
2.5
3.0
3.5
4.0
4.5
5.0
5.5
1850 1870 1890 1910 1930 1950 1970 1990 2010
Figure 47: Real Wheat Price Booms & Busts, 1850-2012
Real price
(logged)
2.0
2.5
3.0
3.5
4.0
4.5
5.0
1900 1920 1940 1960 1980 2000
Figure 48: Real Aluminum Price Booms & Busts, 1900-2012
Real price
(logged)

36
2.5
3.0
3.5
4.0
4.5
5.0
5.5
1850 1870 1890 1910 1930 1950 1970 1990 2010
Figure 49: Real Copper Price Booms & Busts, 1850-2012
Real price
(logged)
3.0
3.5
4.0
4.5
5.0
5.5
1850 1870 1890 1910 1930 1950 1970 1990 2010
Figure 50: Real Lead Price Booms & Busts, 1850-2012
Real price
(logged)
3.0
3.5
4.0
4.5
5.0
5.5
6.0
6.5
1850 1870 1890 1910 1930 1950 1970 1990 2010
Figure 51: Real Nickel Price Booms & Busts, 1850-2012
Real price
(logged)
3.5
4.0
4.5
5.0
1897 1917 1937 1957 1977 1997
Figure 52: Real Steel Price Booms & Busts, 1897-2012
Real price
(logged)
3.5
4.0
4.5
5.0
5.5
6.0
6.5
1850 1870 1890 1910 1930 1950 1970 1990 2010
Figure 53: Real Tin Price Booms & Busts, 1850-2012
Real price
(logged)
3.5
4.0
4.5
5.0
5.5
6.0
1850 1870 1890 1910 1930 1950 1970 1990 2010
Figure 54: Real Zinc Price Booms & Busts, 1850-2012
Real price
(logged)
3.0
3.5
4.0
4.5
5.0
5.5
1900 1920 1940 1960 1980 2000
Figure 55: Real Bauxite Price Booms & Busts, 1900-2012
Real price
(logged)
3.0
3.5
4.0
4.5
5.0
5.5
1900 1920 1940 1960 1980 2000
Figure 56: Real Chromium Price Booms & Busts, 1900-2012
Real price
(logged)
37
3.5
4.0
4.5
5.0
5.5
1900 1920 1940 1960 1980 2000
Figure 57: Real Iron Ore Price Booms & Busts, 1900-2012
Real price
(logged)
3.5
4.0
4.5
5.0
5.5
6.0
1900 1920 1940 1960 1980 2000
Figure 58: Real Manganese Price Booms & Busts, 1900-2012
Real price
(logged)
2.0
2.5
3.0
3.5
4.0
4.5
5.0
5.5
6.0
6.5
1900 1920 1940 1960 1980 2000
Figure 59: Real Potash Price Booms & Busts, 1900-2012
Real price
(logged)
2.0
2.5
3.0
3.5
4.0
4.5
5.0
5.5
1850 1870 1890 1910 1930 1950 1970 1990 2010
Figure 60: Real Cocoa Price Booms & Busts, 1850-2012
Real price
(logged)
2.5
3.0
3.5
4.0
4.5
5.0
5.5
6.0
6.5
1850 1870 1890 1910 1930 1950 1970 1990 2010
Figure 61: Real Coffee Price Booms & Busts, 1850-2012
Real price
(logged)
3.0
3.5
4.0
4.5
5.0
5.5
6.0
1850 1870 1890 1910 1930 1950 1970 1990 2010
Figure 62: Real Cotton Price Booms & Busts, 1850-2012
Real
price
(logged)
2.5
3.0
3.5
4.0
4.5
5.0
5.5
1850 1870 1890 1910 1930 1950 1970 1990 2010
Figure 63: Real Palm Oil Price Booms & Busts, 1850-2012
Real price
(logged)
0.5
1.0
1.5
2.0
2.5
3.0
3.5
4.0
4.5
5.0
5.5
1890 1910 1930 1950 1970 1990 2010
Figure 64: Real Rubber Price Booms & Busts, 1890-2012
Real price
(logged)

38
0.5
1.0
1.5
2.0
2.5
3.0
3.5
4.0
4.5
5.0
5.5
1890 1910 1930 1950 1970 1990 2010
Figure 64: Real Rubber Price Booms & Busts, 1890-2012
Real price
(logged)
3.0
3.5
4.0
4.5
5.0
5.5
1850 1870 1890 1910 1930 1950 1970 1990 2010
Figure 66: Real Tea Price Booms & Busts, 1850-2012
Real price
(logged)
4.0
4.5
5.0
5.5
6.0
1850 1870 1890 1910 1930 1950 1970 1990 2010
Figure 67: Real Tobacco Price Booms & Busts, 1850-2012
Real price
(logged)
2.0
2.5
3.0
3.5
4.0
4.5
5.0
5.5
1850 1870 1890 1910 1930 1950 1970 1990 2010
Figure 68: Real Wool Price Booms & Busts, 1850-2012
Real price
(logged)

39
Panel A: Booms
Commodity Start date Peak End date Years to peak Cycle length Change to peak (%)
Hides 1855 1857 1863 2 8 148
Hides 1910 1915 1920 5 10 67
Beef 1914 1919 1921 5 7 116
Beef 1963 1973 1975 10 12 329
Beef 1977 1979 1981 2 4 60
Panel B: Busts
Commodity Start date Trough End date Years to trough Cycle length Change to trough (%)
Beef 1862 1864 1870 2 8 -28
Hides 1931 1932 1937 1 6 -70
Beef 1949 1951 1955 2 6 -37
Hides 1951 1955 1959 4 8 -61
Hides 2001 2009 2012? 8 11? -56
Table 9: Dates of Commodity Price Booms & Busts for Animal Products
Panel A: Booms
Commodity Start date Peak End date Years to peak Cycle length Change to peak (%)
Petroleum 1915 1920 1923 5 8 69
Natural gas 1972 1983 1991 11 19 494
Petroleum 1972 1980 1986 8 14 397
Natural gas 2002 2008 2010 6 8 126
Panel B: Busts
Commodity Start date Trough End date Years to trough Cycle length Change to trough (%)
Petroleum 1889 1892 1894 3 5 -44
Natural gas 1900? 1906 1911 6? 11? -40
Natural gas 1908 1911 1913 3 5 -29
Petroleum 1930 1931 1934 1 3 -48
Petroleum 1997 1998 1999 1 2 -35
Table 10: Dates of Commodity Price Booms & Busts for Energy Products

40
Panel A: Booms
Commodity Start date Peak End date Years to peak Cycle length Change to peak (%)
Corn 1851 1855 1856 4 5 37
Rice 1851 1855 1857 4 6 44
Wheat 1853 1855 1857 2 4 160
Rice 1859 1860 1863 1 4 34
Corn 1863 1864 1865 1 2 145
Wheat 1866 1867 1868 1 2 92
Corn 1913 1917 1919 4 6 98
Wheat 1914 1917 1920 3 6 87
Rice 1971 1974 1976 3 5 241
Wheat 1971 1974 1976 3 5 140
Corn 1973 1974 1977 1 4 113
Panel B: Busts
Commodity Start date Trough End date Years to trough Cycle length Change to trough (%)
Corn 1928 1932 1936 4 8 -61
Wheat 1928 1932 1937 4 9 -56
Rice 1929 1933 1936 4 7 -56
Rice 1981 1986 1988 5 7 -66
Corn 1985 1987 1995 2 10 -55
Rice 1990 1993 1995 3 5 -32
Corn 1997 2001 2007 4 10 -56
Rice 1997 2001 2007 4 10 -55
Wheat 1997 2000 2007 3 10 -56
Table 11: Dates of Commodity Price Booms & Busts for Grains

41
Panel A: Booms
Commodity Start date Peak End date Years to peak Cycle length Change to peak (%)
Copper 1850? 1853 1863 3? 13? 37
Nickel 1850? 1851 1857 1? 7? 2
Lead 1852 1853 1862 1 10 38
Zinc 1852 1857 1859 5 7 104
Nickel 1872 1873 1877 1 5 227
Steel 1898 1899 1900 1 2 105
Aluminum 1903 1907 1908 4 5 28
Copper 1903 1906 1910 3 7 67
Copper 1914 1916 1918 2 4 82
Zinc 1914 1915 1918 1 4 169
Aluminum 1915 1916 1921 1 6 197
Steel 1915 1917 1919 2 4 102
Lead 1945 1948 1953 3 8 107
Zinc 1949 1951 1952 2 3 36
Tin 1972 1980 1985 8 13 149
Zinc 1972 1974 1976 2 4 228
Lead 1976 1979 1981 3 5 81
Steel 1982 1985 1988 3 6 25
Zinc 1987 1989 1990 2 3 119
Steel 2003 2008 2012? 5 9? 236
Zinc 2005 2006 2008 1 3 192
Lead 2006 2007 2012? 1 6? 94
Tin 2009 2011 2012? 2 3? 83
Table 12: Dates of Commodity Price Booms & Busts for Metals

42
Panel B: Busts
Commodity Start date Trough End date Years to trough Cycle length Change to trough (%)
Tin 1863 1866 1869 3 6 -55
Tin 1873 1878 1881 5 8 -45
Nickel 1894 1895 1900 1 6 -46
Lead 1918 1921 1924 3 6 -46
Tin 1919 1921 1926 2 7 -72
Steel 1920 1922 1923 2 3 -32
Lead 1927 1932 1936 5 9 -55
Tin 1928 1931 1933 3 5 -57
Zinc 1929 1932 1936 3 7 -44
Copper 1930 1932 1936 2 6 -62
Nickel 1980 1986 1987 6 7 -56
Copper 1980 1986 1987 6 7 -36
Lead 1982 1985 1989 3 7 -60
Aluminum 1989 1993 1994 4 5 -63
Nickel 1990 1998 2006 8 16 -76
Lead 1991 1993 1995 2 4 -55
Copper 1995 2002 2004 7 9 -55
Aluminum 1996 2002 2006 6 10 -37
Lead 1997 2002 2004 5 7 -49
Tin 1997 2002 2003 5 6 -43
Steel 2000 2001 2003 1 3 -29
Zinc 2000 2002 2004 2 4 -34
Aluminum 2008 2009 2012? 1 4? -39
Table 12: Dates of Commodity Price Booms & Busts for Metals

43
Panel A: Booms
Commodity Start date Peak End date Years to peak Cycle length Change to peak (%)
Chromium 1915 1918 1919 3 4 171
Potash 1915 1916 1920 1 5 640
Bauxite 1929 1934 1937 5 8 100
Manganese 1970 1977 1981 7 11 152
Bauxite 1972 1974 1975 2 3 64
Chromium 1973 1975 1978 2 5 231
Iron ore 1973 1983 1988 10 15 61
Potash 2001 2009 2010 8 9 300
Iron ore 2005 2011 2012? 6 7? 163
Manganese 2006 2008 2012? 2 6? 203
Chromium 2006 2008 2009 2 3 132
Panel B: Busts
Commodity Start date Trough End date Years to trough Cycle length Change to trough (%)
Bauxite 1916 1918 1919 2 3 -48
Chromium 1920 1921 1930 1 10 -66
Manganese 1920 1921 1923 1 3 -79
Iron ore 1931 1932 1932 1 1 -33
Bauxite 1945 1951 1956 6 11 -39
Chromium 1960 1961 1962 1 2 -49
Bauxite 1997 2003 2006 6 9 -38
Iron ore 1998 2001 2004 3 6 -28
Table 13: Dates of Commodity Price Booms & Busts for Minerals

44
Panel A: Booms
Commodity Start date Peak End date Years to peak Cycle length Change to peak (%)
Tobacco 1850? 1851 1863 1? 13? 11
Palm oil 1851 1854 1862 3 11 56
Sugar 1854 1857 1862 3 8 58
Tea 1856 1860 1862 4 6 30
Wool 1856 1860 1863 5 8 40
Cotton 1860 1863 1867 3 7 155
Cocoa 1862 1863 1866 2 4 93
Tobacco 1873 1874 1875 1 2 67
Tobacco 1886 1887 1889 1 3 44
Cotton 1898 1903 1904 5 6 100
Rubber 1908 1910 1914 2 6 70
Palm oil 1912 1917 1919 5 7 90
Wool 1913 1917 1920 4 7 110
Cotton 1915 1918 1921 3 6 88
Tobacco 1917 1920 1930 3 13 111
Sugar 1919 1920 1921 1 2 112
Tobacco 1933 1935 1939 2 4 109
Cotton 1938 1946 1948 8 10 139
Tobacco 1942 1944 1948 2 6 77
Cocoa 1945 1948 1949 3 4 233
Wool 1946 1951 1955 5 9 98
Coffee 1948 1956 1959 8 11 111
Rubber 1949 1951 1953 2 4 209
Tea 1952 1954 1957 2 5 71
Sugar 1961 1963 1964 2 3 201
Sugar 1968 1974 1976 6 8 1002
Cotton 1969 1973 1978 4 9 83
Palm oil 1972 1974 1976 2 4 161
Cocoa 1975 1977 1980 2 5 170
Coffee 1976 1977 1980 1 4 218
Tea 1976 1977 1979 1 3 55
Sugar 1978 1980 1981 2 3 190
Tea 1982 1984 1986 2 4 65
Wool 2009 - - - - 94
Table 14: Dates of Commodity Price Booms & Busts for Soft Commodities

45
Panel B: Busts
Commodity Start date Trough End date Years to trough Cycle length Change to trough (%)
Coffee 1862 1868 1872 6 10 -54
Rubber 1917 1921 1924 4 7 -80
Tea 1919 1921 1922 2 3 -44
Cocoa 1920 1921 1926 1 6 -59
Cotton 1925 1932 1934 7 9 -71
Palm oil 1925 1932 1937 7 12 -48
Rubber 1926 1932 1936 7 12 -94
Sugar 1928 1932 1935 4 7 -59
Wool 1929 1932 1934 3 5 -58
Tea 1930 1932 1933 2 3 -48
Tobacco 1966 1973 1976 7 10 -48
Wool 1966 1971 1972 5 16 -61
Sugar 1983 1985 1988 2 5 -89
Cocoa 1984 2000 2010 16 26 -77
Palm oil 1984 1990 1995 6 11 -68
Coffee 1987 1992 1994 5 7 -74
Wool 1988 1993 1995 5 7 -55
Tea 1990 1995 1996 5 6 -38
Cotton 1995 2002 2010 7 15 -59
Sugar 1995 1999 2006 4 11 -57
Rubber 1996 2001 2004 5 8 -69
Tobacco 1997 2003 2009 6 12 -35
Wool 1997 2000 2002 3 5 -50
Palm oil 1998 2001 2008 3 10 -61
Coffee 1998 2002 2007 4 9 -71
Tea 2000 2003 2009 3 9 -36
Table 14: Dates of Commodity Price Booms & Busts for Soft Commodities

46
0
5
10
15
20
Figure 69: Frequency of Commodity Price Boom Start Dates
0
5
10
15
20
Figure 70: Frequency of Commodity Price Boom Peaks
0
5
10
15
Figure 71: Frequency of Commodity Price Boom End Dates
0
5
10
15
20
25
30
35
40
Figure 72: Frequency of Commodity Price Boom Years to Peak
0
5
10
15
20
25
30
Figure 73: Frequency of Commodity Price Boom Lengths in Years
0
5
10
15
20
25
Figure 74: Frequency of Commodity Price Boom Increases (%)

47
0
5
10
15
20
25
Figure 75: Frequency of Commodity Price Bust Start Dates
0
5
10
15
20
25
Figure 76: Frequency of Commodity Price Bust Troughs
0
5
10
15
20
25
Figure 77: Frequency of Commodity Price Bust End Dates
0
5
10
15
20
25
30
Figure 78: Frequency of Commodity Price Bust Years to Trough
0
5
10
15
20
Figure 79: Frequency of Commodity Price Bust Lengths in Years
0
5
10
15
20
25
30
Figure 80: Frequency of Commodity Price Bust Declines (%)

48
SD of deviation SD of deviation Proportion of two SDs
Commodity from long-run trend (A) without booms/busts (B) (B)/(A)
Animal products
Beef 0.4022 0.2846 0.71
Hides 0.3544 0.2531 0.71
Energy products
Natural gas 0.3004 0.1875 0.62
Petroleum 0.4013 0.2687 0.67
Grains
Corn 0.3386 0.2423 0.72
Rice 0.5389 0.3428 0.64
Wheat 0.4410 0.3410 0.77
Metals
Aluminum 0.7087 0.4579 0.65
Copper 0.3592 0.2283 0.64
Lead 0.3587 0.2211 0.62
Nickel 0.6460 0.4535 0.70
Steel 0.2663 0.2070 0.78
Tin 0.4141 0.2514 0.61
Zinc 0.2912 0.1821 0.63
Minerals
Bauxite 0.4572 0.4363 0.95
Chromium 0.3451 0.2308 0.67
Iron ore 0.2660 0.1706 0.64
Manganese 0.2956 0.2369 0.80
Potash 0.4852 0.2877 0.59
Soft commodities
Cocoa 0.5157 0.4185 0.81
Coffee 0.4658 0.3866 0.83
Cotton 0.5071 0.3977 0.78
Palm oil 0.4408 0.2638 0.60
Rubber 0.9286 0.8310 0.89
Sugar 0.7220 0.5622 0.78
Tea 0.5573 0.4641 0.83
Tobacco 0.3137 0.2376 0.76
Wool 0.4662 0.3679 0.79
Table 15: Contribution of Booms & Busts to Volatility of Deviations from Long-run Trends

49
SD of price changes SD of price changes Proportion of two SDs
Commodity (A) without booms/busts (B) (B)/(A)
Animal products
Beef 0.1677 0.1488 0.89
Hides 0.2244 0.2023 0.90
Energy products
Natural gas 0.1592 0.1265 0.79
Petroleum 0.2166 0.1761 0.81
Grains
Corn 0.2242 0.2145 0.96
Rice 0.1715 0.1448 0.84
Wheat 0.1852 0.1584 0.86
Metals
Aluminum 0.1648 0.1050 0.64
Copper 0.1790 0.1730 0.97
Lead 0.1727 0.1098 0.64
Nickel 0.2050 0.1739 0.85
Steel 0.1525 0.0729 0.48
Tin 0.1837 0.1591 0.87
Zinc 0.2161 0.1518 0.70
Minerals
Bauxite 0.1348 0.1245 0.92
Chromium 0.2210 0.1642 0.74
Iron ore 0.1488 0.1058 0.71
Manganese 0.2383 0.1990 0.83
Potash 0.2473 0.1620 0.66
Soft commodities
Cocoa 0.2251 0.1915 0.85
Coffee 0.2269 0.2008 0.89
Cotton 0.1793 0.1467 0.82
Palm oil 0.1994 0.1727 0.87
Rubber 0.2880 0.2298 0.80
Sugar 0.2955 0.2216 0.75
Tea 0.1368 0.0975 0.71
Tobacco 0.1370 0.1058 0.77
Wool 0.1831 0.1594 0.87
Table 16: Contribution of Booms & Busts to Volatility of Deviations from Long-run Trends
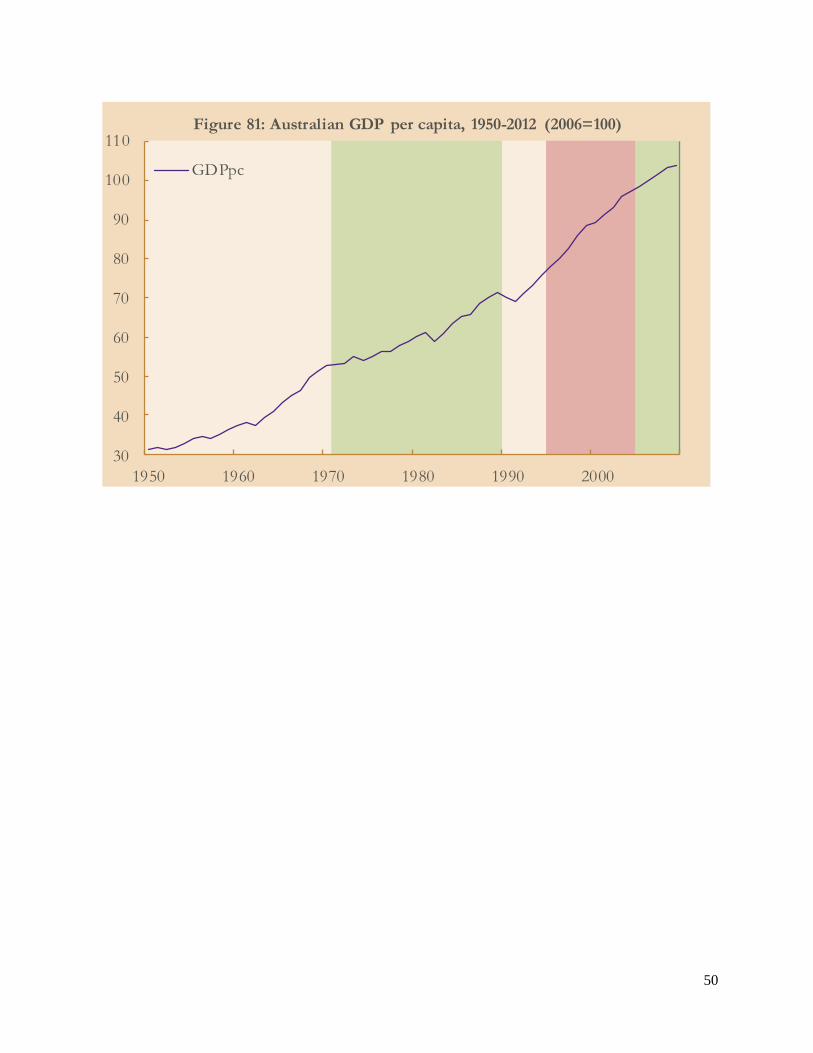
50
30
40
50
60
70
80
90
100
110
1950 1960 1970 1980 1990 2000
Figure 81: Australian GDP per capita, 1950-2012 (2006=100)
GDPpc