Monetary Policy and Stock Market Booms and Busts in the 20th Century
Upload
cruz-raymondCategory
view
38download
0description
11
Natural Resources in LAC: Beyond Booms and Busts?
Americas Conference Miami Herald September 13, 2010
Chief Economist OfficeLatin America and the Caribbean RegionThe World Bank
Beyond booms and busts?
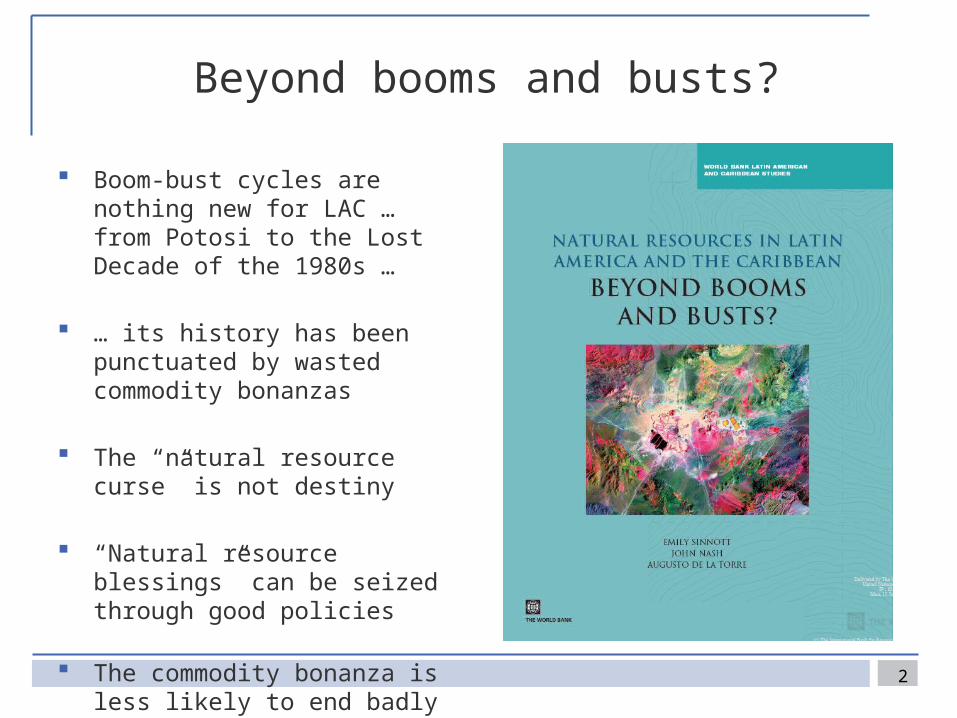
Boom-bust cycles are nothing new for LAC … from Potosi to the Lost Decade of the 1980s …
… its history has been punctuated by wasted commodity bonanzas
The “natural resource curse” is not destiny
“Natural resource blessings” can be seized through good policies
The commodity bonanza is less likely to end badly for LAC this time around
2
First, six stylized facts…
3
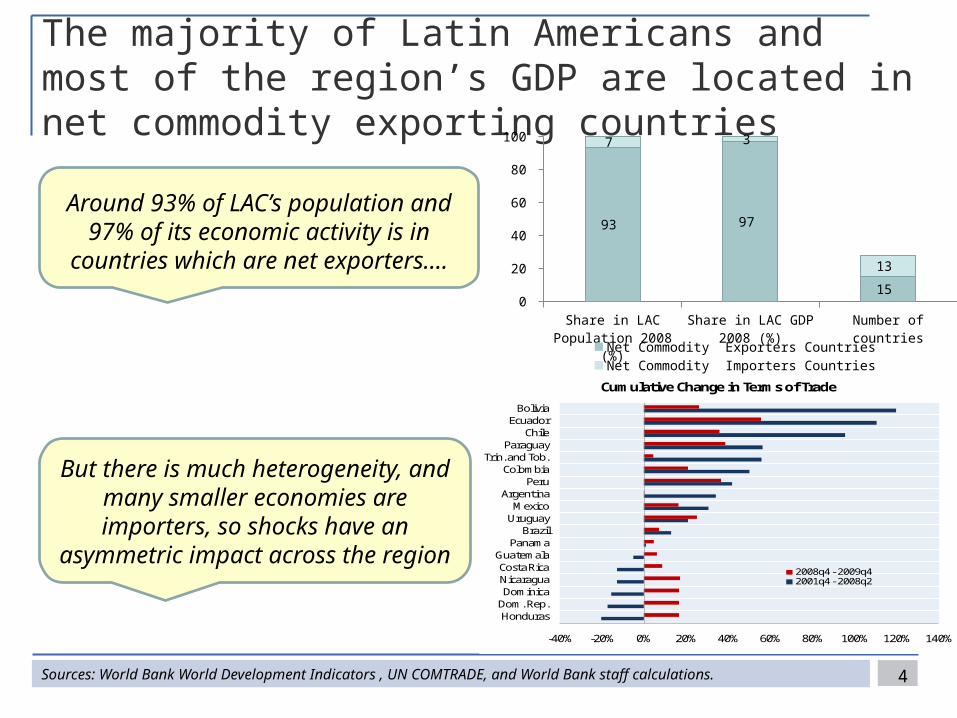
The majority of Latin Americans and most of the region’s GDP are located in net commodity exporting countries
4
Share in LAC Popula-tion 2008 (%)
Share in LAC GDP 2008 (%)
Number of countries0
10 20 30 40 50 60 70 80 90
100
93 97
15
7 3
13
Net Commodity Exporters Countries Net Commodity Importers Countries
-40% -20% 0% 20% 40% 60% 80% 100% 120% 140%
HondurasDom. Rep.Dominica
NicaraguaCosta Rica
GuatemalaPanama
BrazilUruguay
MexicoArgentina
PeruColombia
Trin. and Tob.Paraguay
ChileEcuador
Bolivia
Cumulative Change in Terms of Trade
2008q4 - 2009q42001q4 - 2008q2
Around 93% of LAC’s population and 97% of its economic activity is in
countries which are net exporters….
But there is much heterogeneity, and many smaller economies are importers, so shocks have an asymmetric impact
across the region
Sources: World Bank World Development Indicators , UN COMTRADE, and World Bank staff calculations.
5
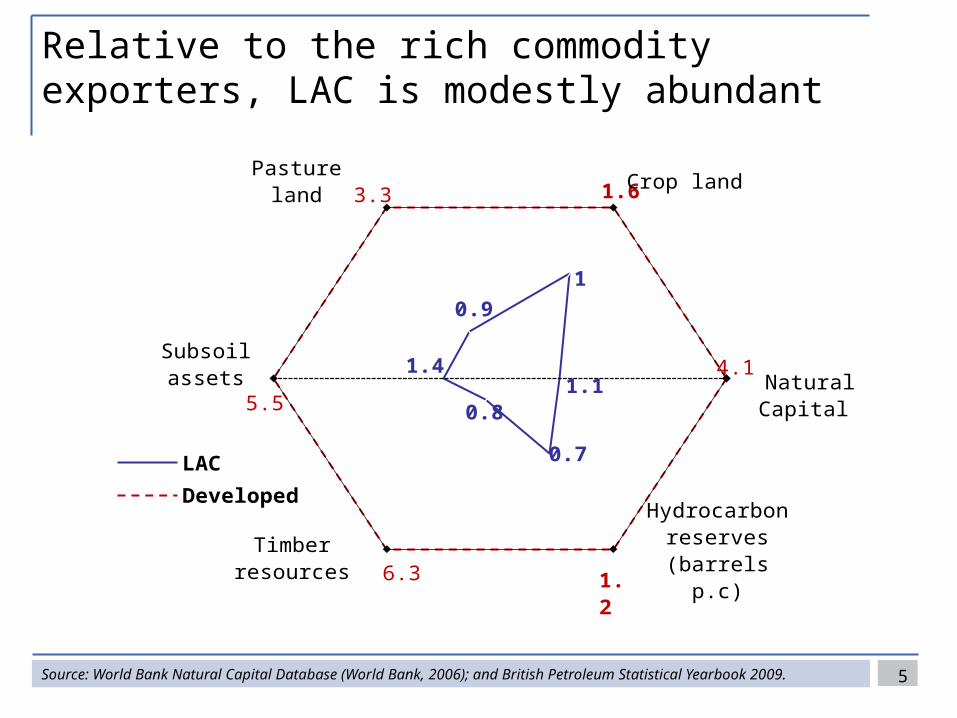
Relative to the rich commodity exporters, LAC is modestly abundant
Source: World Bank Natural Capital Database (World Bank, 2006); and British Petroleum Statistical Yearbook 2009.
4.1
1.63.3
6.3
5.5 0.81.1
0.7
1.4
1
0.9
Crop landPasture land
Subsoil assets
Timber resources
Hydrocarbon reserves (barrels
p.c)
Natural Capital
LAC
Developed
1.2
6
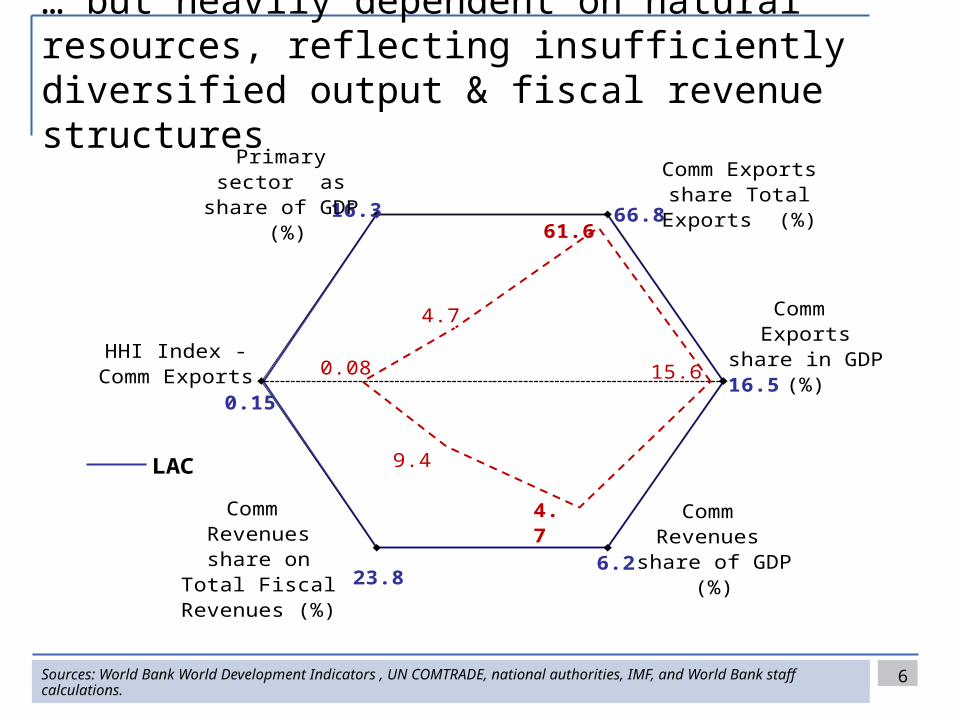
… but heavily dependent on natural resources, reflecting insufficiently diversified output & fiscal revenue structures
Sources: World Bank World Development Indicators , UN COMTRADE, national authorities, IMF, and World Bank staff calculations.
15.6
61.6
4.7
9.4
0.0816.5
66.816.3
0.15
23.86.2
Comm Exports share Total
Exports (%)
Primary sector as share of GDP (%)
HHI Index - Comm Exports
Comm Revenues share on Total
Fiscal Revenues (%)
Comm Revenues share of GDP (%)
Comm Exports share in GDP (%)
LAC
Developed 4.7
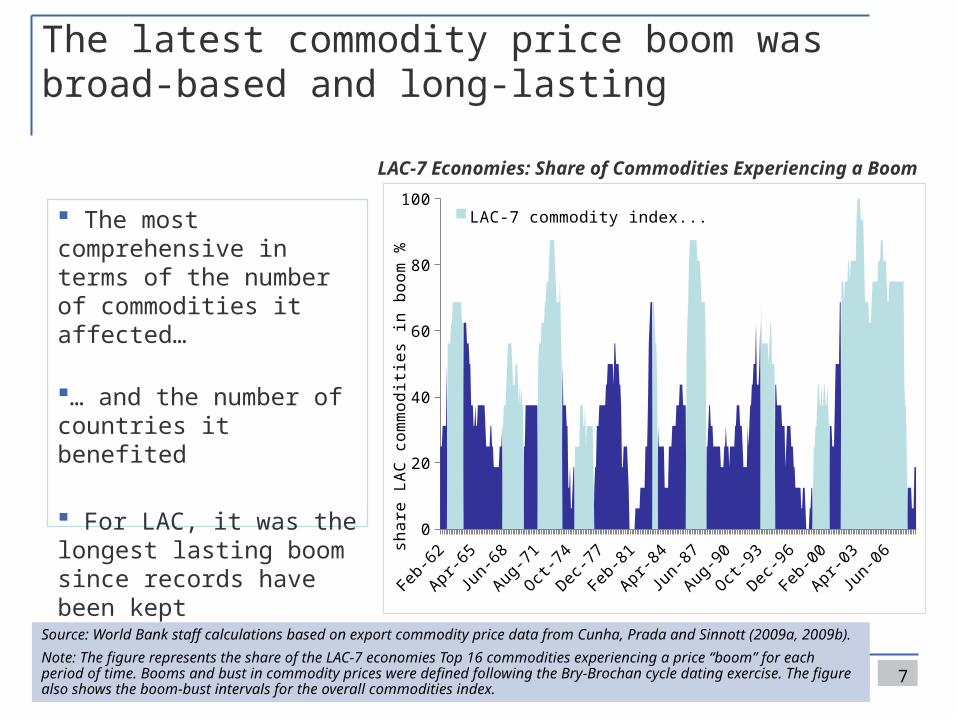
The latest commodity price boom was broad-based and long-lasting
The most comprehensive in terms of the number of commodities it affected…
… and the number of countries it benefited
For LAC, it was the longest lasting boom since records have been kept
7
Source: World Bank staff calculations based on export commodity price data from Cunha, Prada and Sinnott (2009a, 2009b).
Note: The figure represents the share of the LAC-7 economies Top 16 commodities experiencing a price “boom” for each period of time. Booms and bust in commodity prices were defined following the Bry-Brochan cycle dating exercise. The figure also shows the boom-bust intervals for the overall commodities index.
LAC-7 Economies: Share of Commodities Experiencing a Boom
Jan-
62
Sep-6
6
May
-71
Jan-
76
Sep-8
0
May
-85
Jan-
90
Sep-9
4
May
-99
Jan-
04
Sep-0
80
20
40
60
80
100 LAC-7 commodity index in boomLAC-7 commodity index in bust
shar
e L
AC
com
mod
ities
in b
oom
%
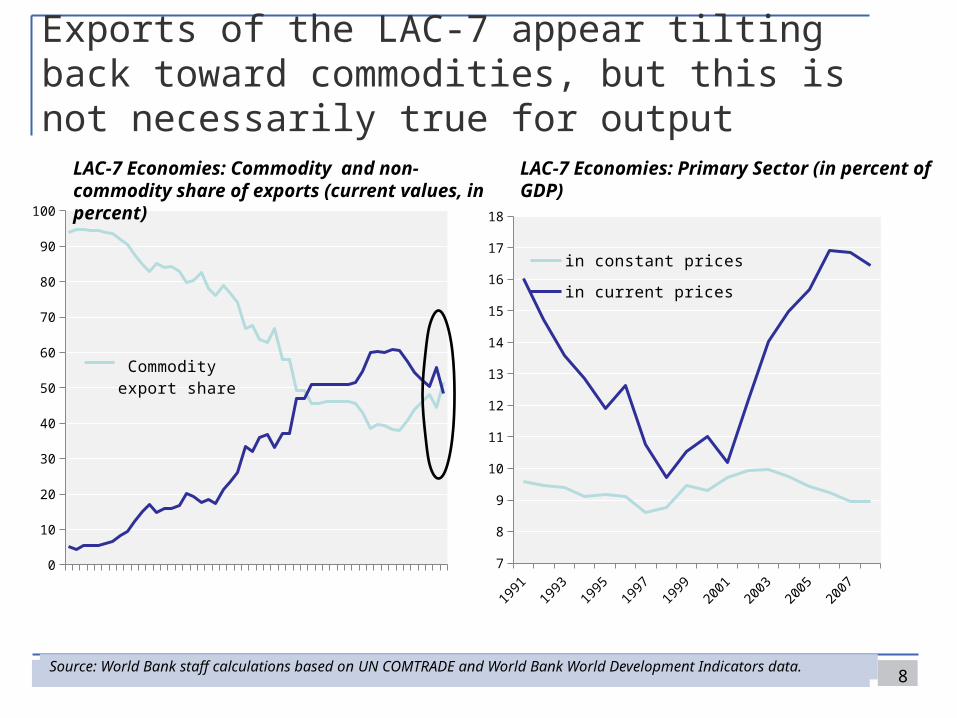
Exports of the LAC-7 appear tilting back toward commodities, but this is not necessarily true for output
8Source: World Bank staff calculations based on UN COMTRADE and World Bank World Development Indicators data.
1962
1965
1968
1971
1974
1977
1980
1983
1986
1989
1991
1993
1994
1996
1999
2002
2005
2008
0
10
20
30
40
50
60
70
80
90
100
Commodity export share
Non-commodity export share
LAC-7 Economies: Primary Sector (in percent of GDP)LAC-7 Economies: Commodity and non-commodity share of exports (current values, in percent)
1991
1993
1995
1997
1999
2001
2003
2005
2007
7
8
9
10
11
12
13
14
15
16
17
18
in constant prices
in current prices
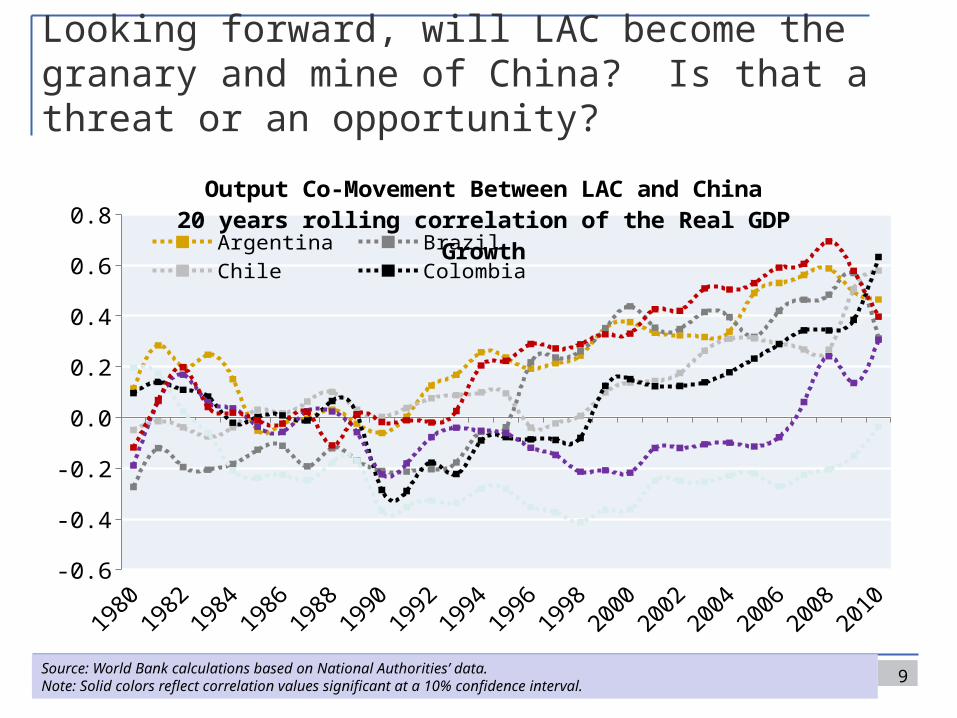
Looking forward, will LAC become the granary and mine of China? Is that a threat or an opportunity?
9
-0.6
-0.4
-0.2
0.0
0.2
0.4
0.6
0.8Output Co-Movement Between LAC and China20 years rolling correlation of the Real GDP
GrowthArgentina BrazilChile Colombia
Source: World Bank calculations based on National Authorities’ data. Note: Solid colors reflect correlation values significant at a 10% confidence interval.
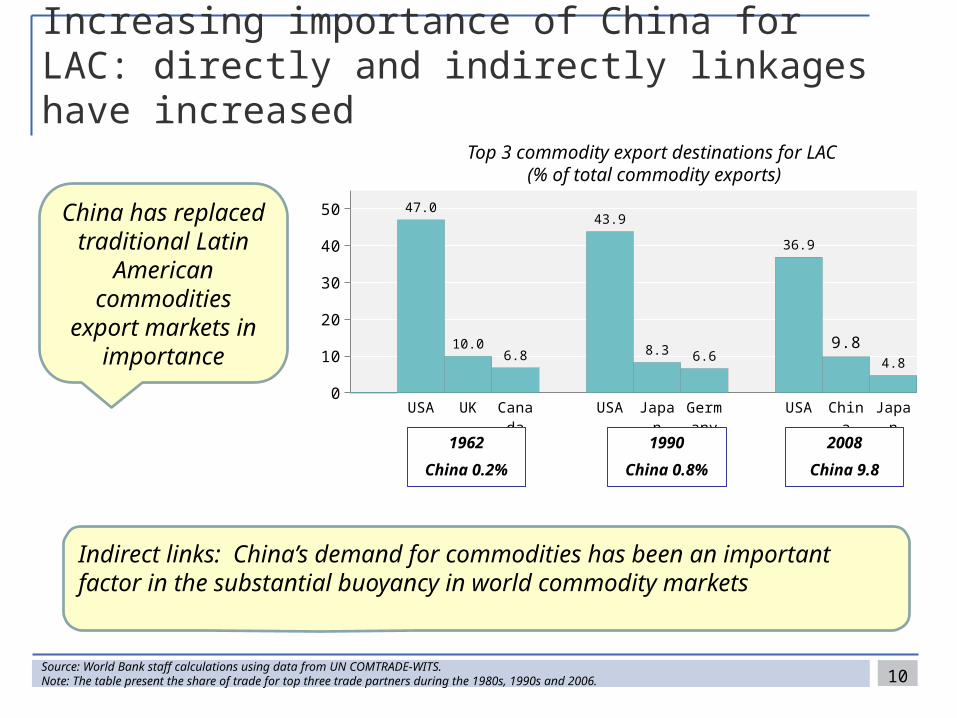
Increasing importance of China for LAC: directly and indirectly linkages have increased
10Source: World Bank staff calculations using data from UN COMTRADE-WITS. Note: The table present the share of trade for top three trade partners during the 1980s, 1990s and 2006.
USA UK Canada
USA Japan Ger-many
USA China Japan0
10
20
30
40
50 47.0
10.06.8
43.9
8.3 6.6
36.9
9.84.8
1962
China 0.2%
1990
China 0.8%
2008
China 9.8
Top 3 commodity export destinations for LAC (% of total commodity exports)
China has replaced traditional Latin
American commodities export
markets in importance
Indirect links: China’s demand for commodities has been an important factor in the substantial buoyancy in world commodity markets
The “natural resource curse” hypothesis: much ado about nothing?
11
12
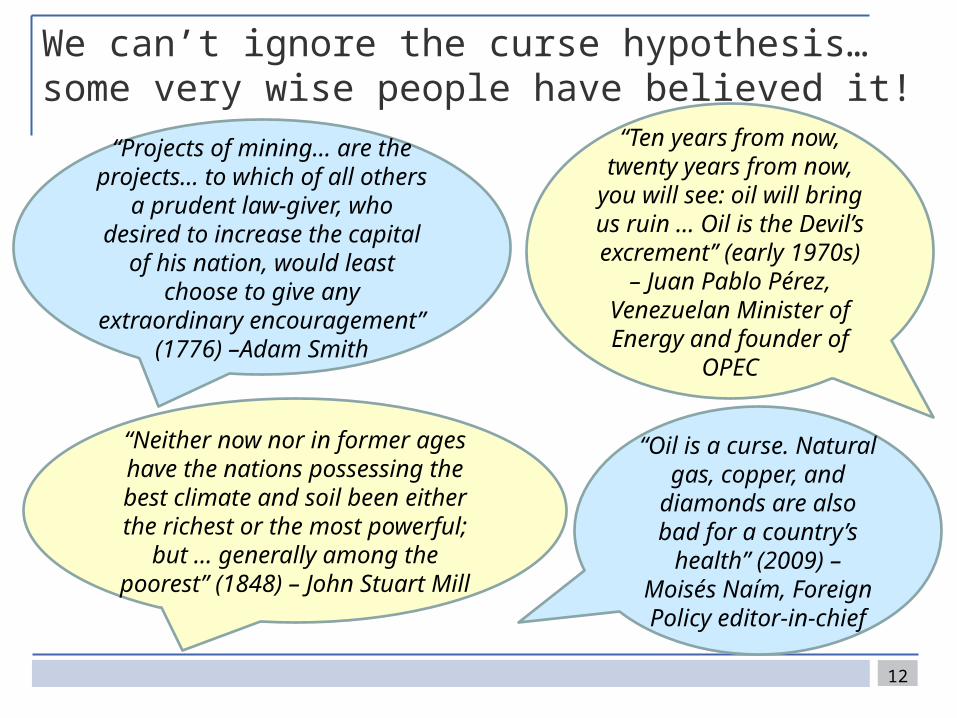
We can’t ignore the curse hypothesis… some very wise people have believed it!
“Ten years from now, twenty years from now,
you will see: oil will bring us ruin … Oil is the Devil’s excrement’’ (early 1970s)
– Juan Pablo Pérez, Venezuelan Minister of Energy and founder of
OPEC
“Neither now nor in former ages have the nations possessing the best
climate and soil been either the richest or the most powerful; but …
generally among the poorest” (1848) – John Stuart Mill
“Oil is a curse. Natural gas, copper, and
diamonds are also bad for a country’s health” (2009) – Moisés Naím, Foreign Policy editor-
in-chief
“Projects of mining… are the projects… to which of all others a prudent law-giver, who desired
to increase the capital of his nation, would least choose to
give any extraordinary encouragement” (1776) –Adam
Smith
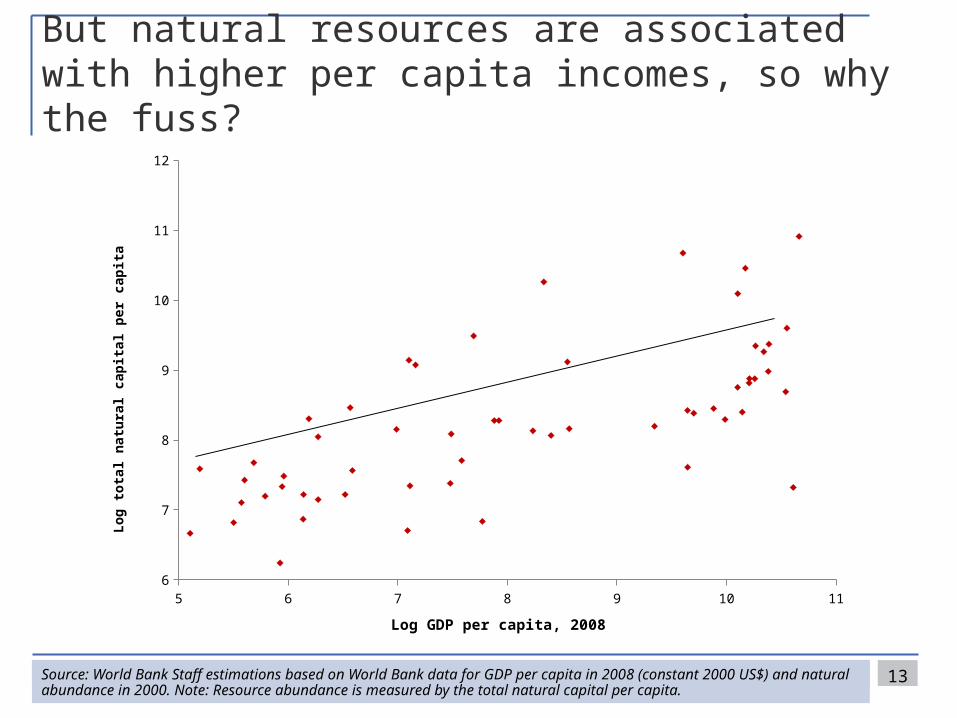
13Source: World Bank Staff estimations based on World Bank data for GDP per capita in 2008 (constant 2000 US$) and natural abundance in 2000. Note: Resource abundance is measured by the total natural capital per capita.
5 6 7 8 9 10 116
7
8
9
10
11
12
Log GDP per capita, 2008
Log
tota
l nat
ural
capi
tal p
er ca
pita
But natural resources are associated with higher per capita incomes, so why the fuss?
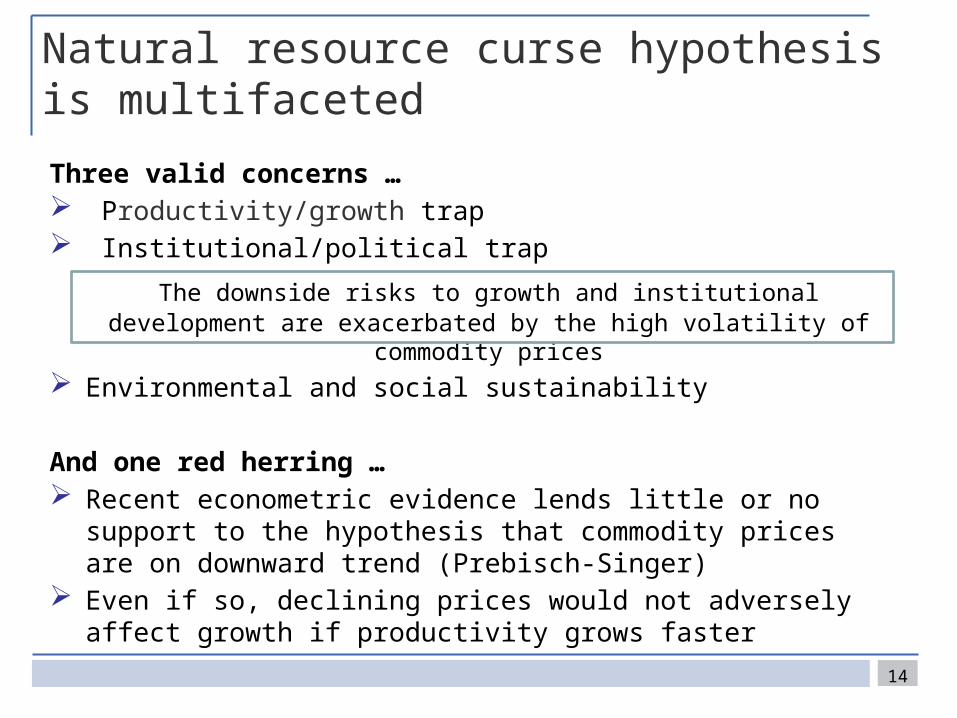
Natural resource curse hypothesis is multifaceted
Three valid concerns … Productivity/growth trap Institutional/political trap
The downside risks to growth and institutional development are exacerbated by the high volatility of commodity prices
Environmental and social sustainability
And one red herring … Recent econometric evidence lends little or no support to the hypothesis
that commodity prices are on downward trend (Prebisch-Singer) Even if so, declining prices would not adversely affect growth if
productivity grows faster
14
Dutch Disease: does commodity specialization undermine growth?
Some evidence seems to say yes Enclave production in many countries in the past, with few linkages and
minimal employment generation Via a strong currency (Dutch Disease), commodities can displace industries
where potential spillovers are higher (Hausmann, Rodrik)
But …. Careful econometric evidence contradicts early finding of a curse effect Many high-income countries developed by exploiting natural resources Commodity sectors can be of high productivity with much innovation Many cases of linkages & upgrading with significant employment effects
Bottom line: issues are more complicated than commonly thought, with much space for policies to determine outcomes
15
Case study of metals illustrates potential of commodity sectors
16
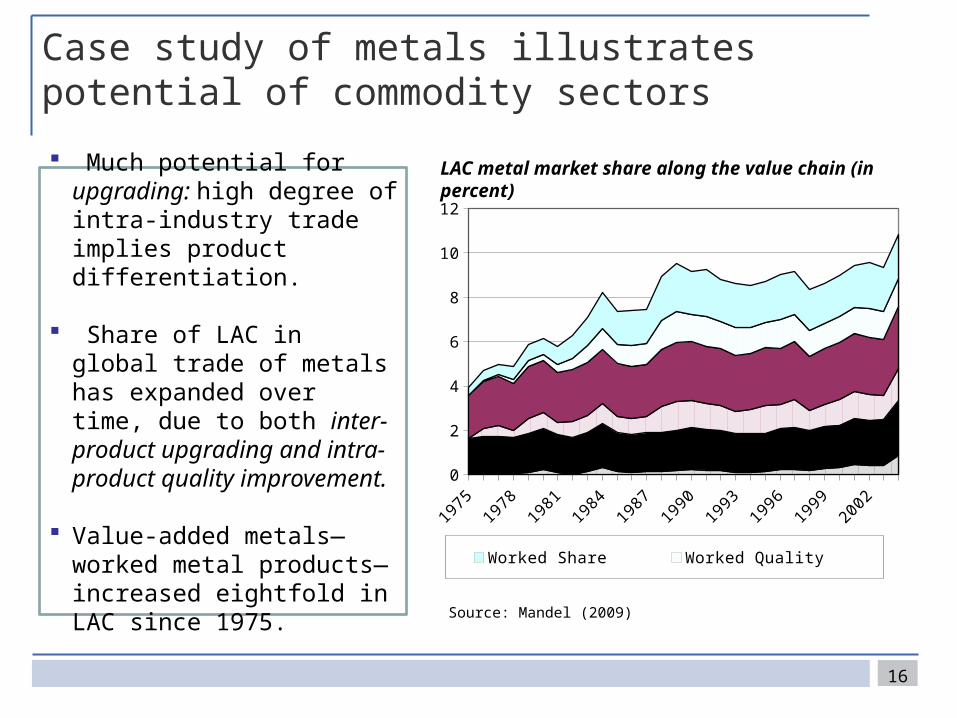
LAC metal market share along the value chain (in percent)
1975
1977
1979
1981
1983
1985
1987
1989
1991
1993
1995
1997
1999
2001
2003
0
2
4
6
8
10
12
Worked Share Worked Quality Unwrought ShareUnwrought Quality Ore Share Ore Quality
Much potential for upgrading: high degree of intra-industry trade implies product differentiation.
Share of LAC in global trade of metals has expanded over time, due to both inter-product upgrading and intra-product quality improvement.
Value-added metals—worked metal products—increased eightfold in LAC since 1975.
Source: Mandel (2009)
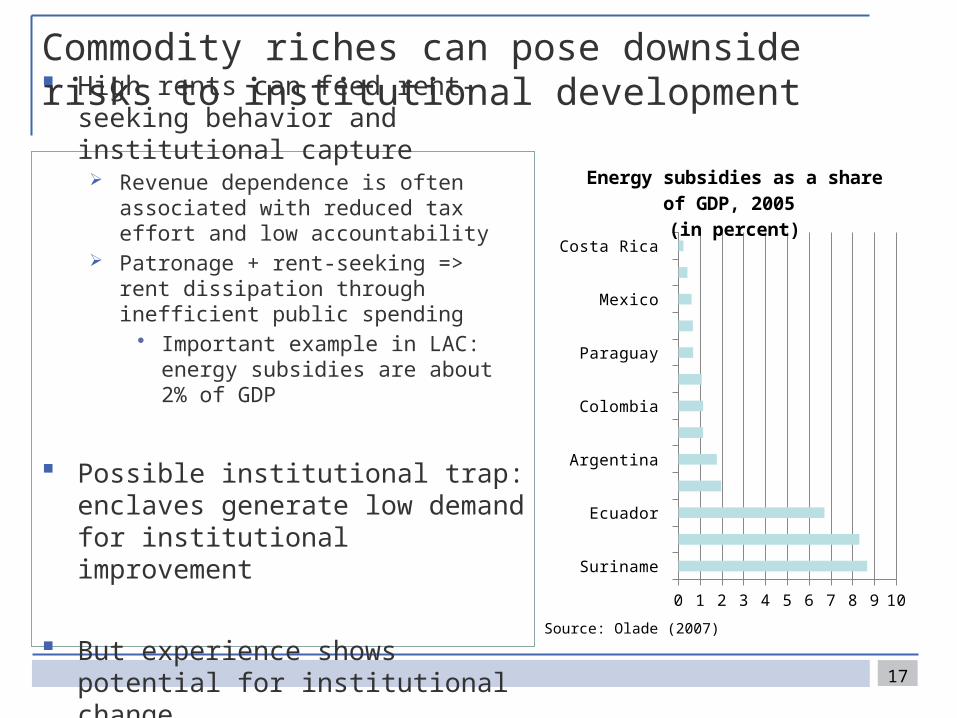
Commodity riches can pose downside risks to institutional development
High rents can feed rent-seeking behavior and institutional capture Revenue dependence is often associated with
reduced tax effort and low accountability Patronage + rent-seeking => rent dissipation
through inefficient public spending• Important example in LAC: energy
subsidies are about 2% of GDP
Possible institutional trap: enclaves generate low demand for institutional improvement
But experience shows potential for institutional change
17
Suriname
Venezuela
Ecuador
Bolivia
Argentina
Guyana
Colombia
Nicaragua
Paraguay
Trinidad & Tobago
Mexico
Guatemala
Costa Rica
0 1 2 3 4 5 6 7 8 9 10
Energy subsidies as a share of GDP, 2005
(in percent)
Source: Olade (2007)
Two institutional dimensions in which LAC seems to suffer less from the resource curse than other regions
No systematic effect in undermining democracy But some recent backsliding in quality of democracy in hydrocarbon
producing states
No tendency for increased large-scale violent conflict in resource-rich states Fewer secessionist movements in LAC – perhaps because these were
worked out over the longer history of independence
Institutions in many LAC countries are improving, but greater decentralization may create special problems
18
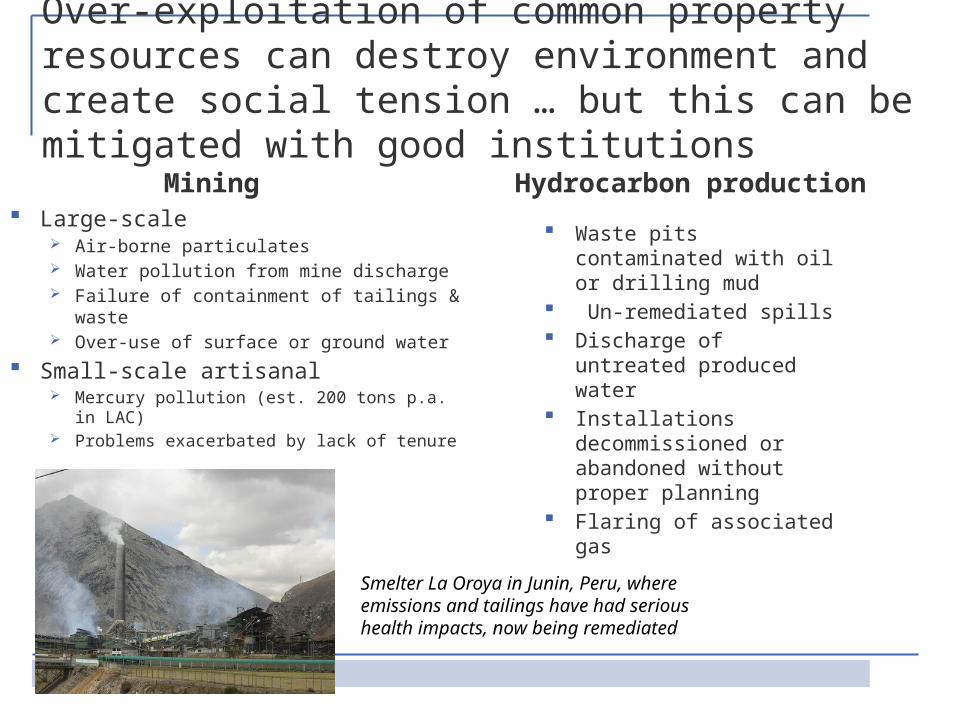
Over-exploitation of common property resources can destroy environment and create social tension … but this can be mitigated with good institutions
Mining Large-scale
Air-borne particulates Water pollution from mine discharge Failure of containment of tailings & waste Over-use of surface or ground water
Small-scale artisanal Mercury pollution (est. 200 tons p.a. in LAC) Problems exacerbated by lack of tenure
Hydrocarbon production
Waste pits contaminated with oil or drilling mud
Un-remediated spills Discharge of untreated
produced water Installations
decommissioned or abandoned without proper planning
Flaring of associated gas
Smelter La Oroya in Junin, Peru, where emissions and tailings have had serious health impacts, now being remediated
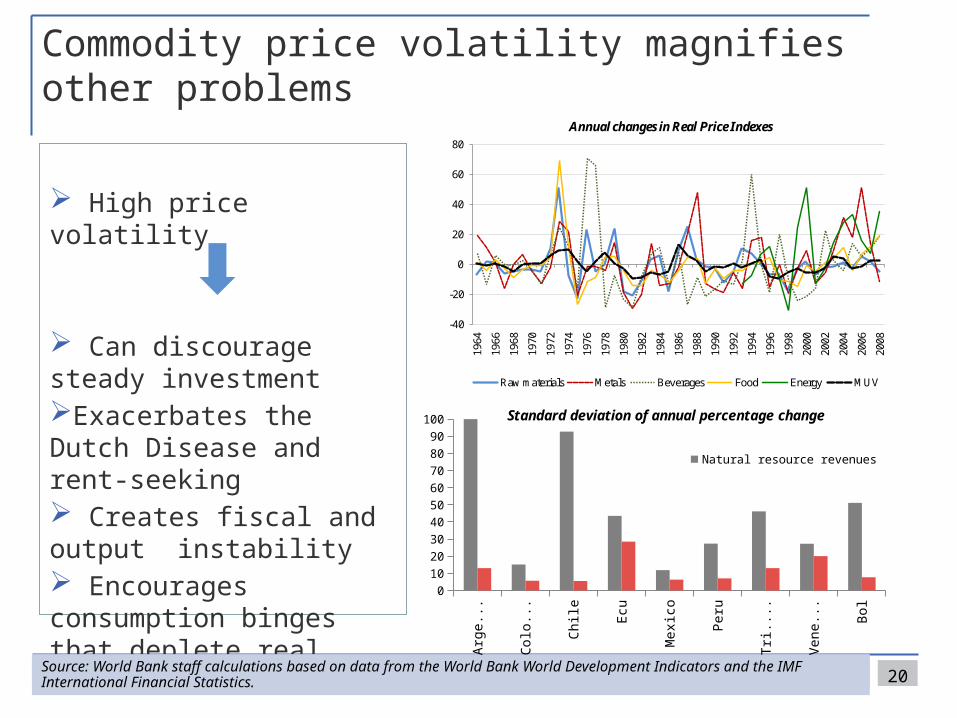
Commodity price volatility magnifies other problems
High price volatility
Can discourage steady investment Exacerbates the Dutch Disease and rent-seeking Creates fiscal and output instability Encourages consumption binges that deplete real wealth
20Source: World Bank staff calculations based on data from the World Bank World Development Indicators and the IMF International Financial Statistics.
Arge
ntina
Colo
mbi
a
Chile
Ecua
dor
Mex
ico
Peru
Tri.
& T
ob.
Vene
zuel
a
Boliv
ia
0102030405060708090
100 Standard deviation of annual percentage change
Natural resource revenues
Non-natural resource revenues
-40
-20
0
20
40
60
80
1964
1966
1968
1970
1972
1974
1976
1978
1980
1982
1984
1986
1988
1990
1992
1994
1996
1998
2000
2002
2004
2006
2008
Annual changes in Real Price Indexes
Raw materials Metals Beverages Food Energy MUV
Managing commodity abundance and commodity price volatility…
It’s all about saving, insurance, andgood regulation
21
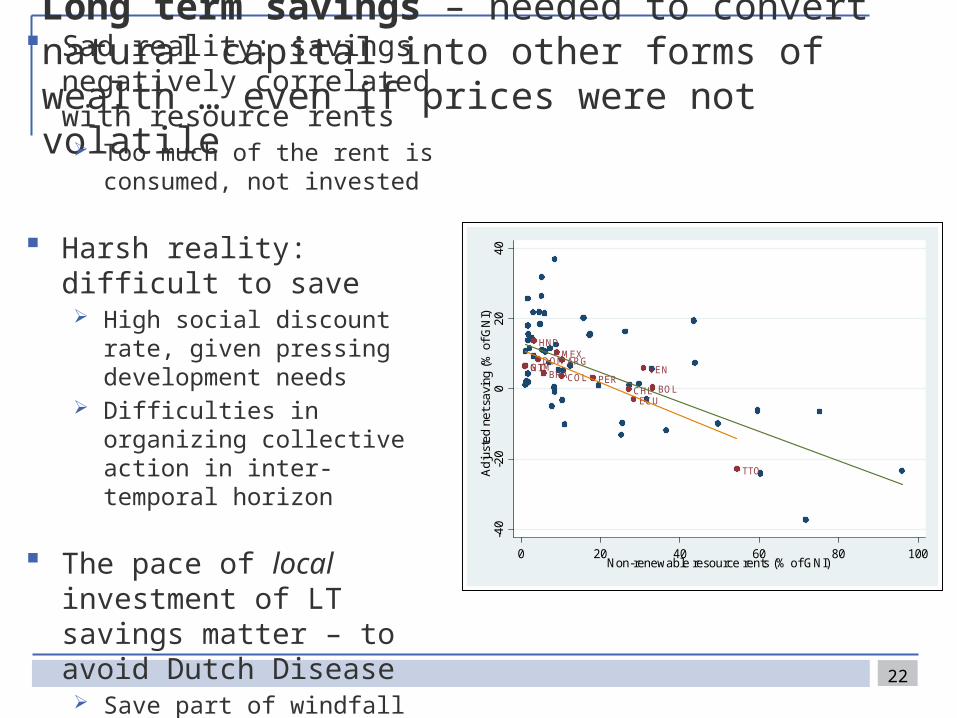
Long term savings – needed to convert natural capital into other forms of wealth … even if prices were not volatile
Sad reality: savings negatively correlated with resource rents Too much of the rent is consumed,
not invested
Harsh reality: difficult to save High social discount rate, given
pressing development needs Difficulties in organizing collective
action in inter-temporal horizon
The pace of local investment of LT savings matter – to avoid Dutch Disease Save part of windfall abroad
22
BRA PERNIC
ARG
COL
ECU
MEX
TTO
DOM
BOL
HND
GTM VEN
CHL
-40
-20
020
40A
djus
ted
net s
avin
g (%
of G
NI)
0 20 40 60 80 100Non-renewable resource rents (% of GNI)
And short term volatility requires other strategies
Self protection: reduce income volatility through diversification Tradable sector diversification (requires avoiding excessive real
appreciation through saving and gradual local investment of windfall) Don’t forget to nurture the goose that lays golden eggs!
• Diversification of commodity production also reduces income volatility Fiscal revenue diversification Buffer adverse impact on the poor through targeted transfers
Market insurance to hedge price volatility Market for hedges and insurance products is incomplete, especially for the
long-term … … but emerging successful experiences in hedging (Mexico, Panama) Political and legal risks hinder the use of market instruments
23
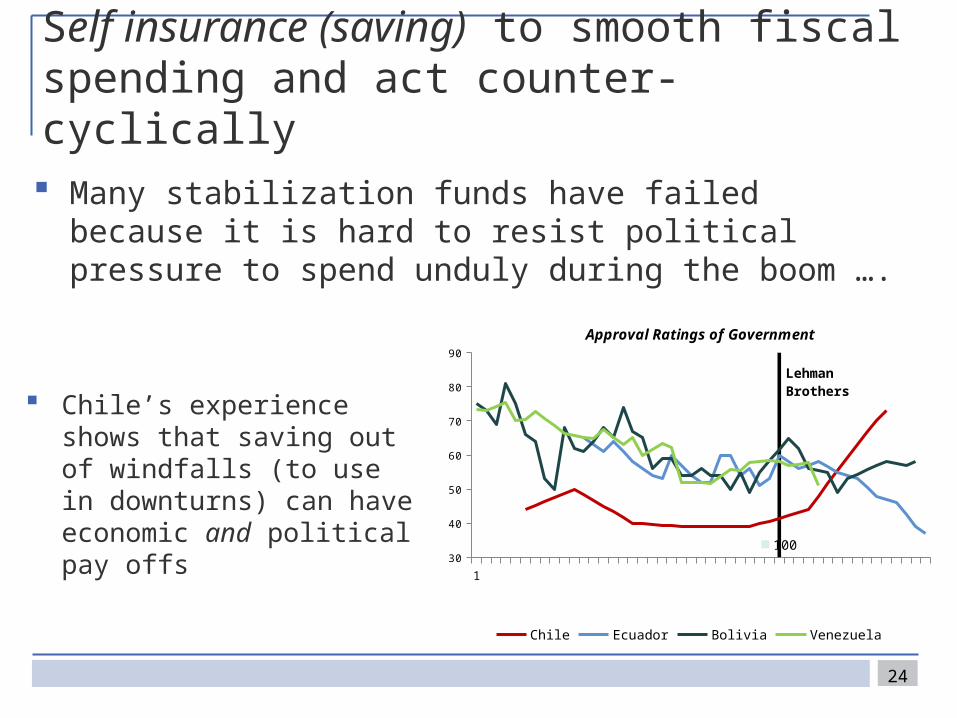
Self insurance (saving) to smooth fiscal spending and act counter-cyclically
Many stabilization funds have failed because it is hard to resist political pressure to spend unduly during the boom ….
24
Chile’s experience shows that saving out of windfalls (to use in downturns) can have economic and political pay offs
130
40
50
60
70
80
90
100
Chile Ecuador Bolivia Venezuela
Lehman Broth-ers
Approval Ratings of Government
Address environmental and social problems with up-front actions and new tools
Reduce environmental impact:
Don’t subsidize environmental destruction!
Take advantage of market-based approaches (tradable permits, PES)
Use strategic environmental assessments
Build local government and civil society capacity to help enforce environmental regulations
25
Reduce social impact:
Grant secure land title in advance of large projects
Educate residents to avoid unrealistic expectations
Strengthen local capacity to negotiate
Promote transparency (EITI) Avoid resettlement if possible

26
Thank you