Booms and busts in China's stock market - European Central Bank
29
WORKING PAPER SERIES NO 1190 / MAY 2010 BOOMS AND BUSTS IN CHINA’S STOCK MARKET ESTIMATES BASED ON FUNDAMENTALS Tuomas A. Peltonen and Daniel Santabárbara by Gabe J. de Bondt,
Transcript of Booms and busts in China's stock market - European Central Bank

Work ing PaPer Ser i e Sno 1190 / May 2010
BooMS and BuStS
in China’S StoCk
Market
eStiMateS BaSed
on FundaMentalS
Tuomas A. Peltonen and Daniel Santabárbara
by Gabe J. de Bondt,
WORKING PAPER SER IESNO 1190 / MAY 2010
In 2010 all ECB publications
feature a motif taken from the
€500 banknote.
BOOMS AND BUSTS IN CHINA’S
STOCK MARKET
ESTIMATES BASED
ON FUNDAMENTALS 1
by Gabe J. de Bondt 2, Tuomas A. Peltonen 3 and Daniel Santabárbara 4
referee
for their comments. The views expressed in the paper are those of the authors and do not necessarily reflect those of the
European Central Bank, Banco de España, or the Eurosystem.
2 Corresponding author: European Central Bank, Kaiserstrasse 29, 60311 Frankfurt am Main, Germany, phone: +49 69 1344 6477,
e-mail: [email protected].
3 European Central Bank, Kaiserstrasse 29, 60311 Frankfurt am Main, Germany, e-mail: [email protected].
This paper can be downloaded without charge from http://www.ecb.europa.eu or from the Social Science Research Network electronic library at http://ssrn.com/abstract_id=1599538.
NOTE: This Working Paper should not be reported as representing the views of the European Central Bank (ECB). The views expressed are those of the authors
and do not necessarily reflect those of the ECB.
1 We wish to thank Marianna Caccavaio, Frank Moss, Christian ThimannEttore Dorrucci, Marcel Fratzscher, and an anonymous
4 Banco de España and European Central Bank, e-mail: [email protected].
© European Central Bank, 2010
AddressKaiserstrasse 2960311 Frankfurt am Main, Germany
Postal addressPostfach 16 03 1960066 Frankfurt am Main, Germany
Telephone+49 69 1344 0
Internethttp://www.ecb.europa.eu
Fax+49 69 1344 6000
All rights reserved.
Any reproduction, publication and reprint in the form of a different publication, whether printed or produced electronically, in whole or in part, is permitted only with the explicit written authorisation of the ECB or the authors.
Information on all of the papers published in the ECB Working Paper Series can be found on the ECB’s website, http://www.ecb.europa.eu/pub/scientific/wps/date/html/index.en.html
ISSN 1725-2806 (online)

3ECB
Working Paper Series No 1190May 2010
Abstract 4
Non-technical summary 5
1 Introduction 6
2 Methodology and data 8
2.1 Methodology 8
2.2 Data 10
3 Empirical results 12
3.1 Modelling stock prices with fundamentals 12
3.2 Stock price misalignments: dating booms and busts 13
3.3 Other factors explaining booms and busts 14
3.4 Robustness 16
4 Conclusions 17
References 19
Tables and fi gures 21
CONTENTS

4ECBWorking Paper Series No 1190May 2010
Abstract
This paper empirically models China’s stock prices using conventional fundamentals: corporate
earnings, risk-free interest rate, and a proxy for equity risk premium. It uses the estimated long-
run stock price misalignments to date booms and busts, and analyses equity market reforms and
excess liquidity as potential drivers of these stock price misalignments. Our results show that
China’s equity prices can be reasonable well modelled using fundamentals, but that various
booms and busts can be identified. Policy actions, either taking the form of deposit rate changes,
equity market reforms or excess liquidity, seem to have significantly contributed to these
misalignments.
JEL code: G12; G18
Keywords: China; Stock price; Equity market; Reforms; Liquidity

5ECB
Working Paper Series No 1190May 2010
Non-technical summary
The stock market in China has been reported to have unique attributes that challenge
traditional asset pricing models and the theory of rationality. Some studies even argue that
China’s stock prices are driven by sentiment as much as by other factors. There is surprisingly
little evidence of the role of fundamentals as drivers of equity prices in China. This study aims to
assess to what extent a fundamental-based model can explain domestic stock price movements in
the Shanghai market. We use a modified version of the dynamic present value model by
Campbell and Shiller (1988), and follow the empirical implementation as in de Bondt (2008a and
2008b). The model considers three fundamentals: corporate earnings, the risk-free interest rate
and a proxy for the equity risk premium. We believe that these fundamentals not only play a role
for the stock price determination in developed economies, but also in emerging economies with
high degree of public intervention. Despite the regulated interest rates and comparatively limited
financial market development in China, there is evidence showing that individuals react to the
return on deposits (the risk-free asset) and equity markets relative performance and risk
perception. Therefore, we believe that this ‘rational’ approach is applicable to China.
We first estimate, using a vector error-correction model, the link between China’s aggregate
stock price index and earnings, the risk-free interest rate as captured by the deposit rate, and a
proxy for the equity risk premium. Based on the long-run stock price misalignments derived
from the estimates of the vector error-correction model, we then date booms and busts using both
a statistical and economic approach. The statistical method defines a boom or bust as a realised
stock price outside the one standard error of regression. The economic definition is a stock price
misalignment beyond 20%. In a second stage, we examine whether there are some China-
specific factors, such as equity market reforms or excess liquidity in the financial system that
could help to explain the deviations of the stock prices from their fundamental values estimated
using the dynamic stock price model.
Our main finding is that the dynamic present value model fits reasonable well to China’s
stock prices and that China’s stock prices are mainly explained by the fundamentals considered.
This conclusion is robust across various proxies for the equity risk premium. It also does not
change if a non-parametric quantile regression framework is used. The latter method offers a
distributional robust method of modelling these relationships. There are, however, periods where
the stock prices have deviated substantially from the fundamental-based estimates. We date two
booms and two bust periods in China’s stock market since April 1999. Finally, we present
evidence that the policy actions by the Chinese authorities either taking the form of stock market
liberalization, low real interest rates or positive excess liquidity seem to have significantly
contributed to the formation of booms in China’s stock market.

6ECBWorking Paper Series No 1190May 2010
1. Introduction
China’s financial system is undergoing a structural shift from a heavily regulated and almost
exclusively bank-based system to one with much greater diversity of segments, including more
developed stock markets (Charles and Darné, 2009). Retained earnings and, to a lesser extent,
bank loans are generally still the main sources of financing of firms. In addition, only a small
fraction of Chinese, mainly state-owned, companies are listed and only about one-fourth of
shares of listed firms are actively traded, whereas the rest is generally held by public entities and
is not allowed to trade.
The research on China’s stock markets has so far focused on pricing behaviour and efficiency
of the Chinese stock markets, market segmentation and explanations for price differentials
among different classes of stocks, market impediments and governmental factors, as well as
corporate governance issues and IPOs (Chan et al., 2007). Moreover, some recent papers
examine the (negligible) reaction of China’s equities to international shocks (Li, 2007 and
Kozluk, 2008). Regarding pricing behaviour and efficiency, a topic most related to our paper,
various methodologies have been used to test the efficient market hypothesis for Chinese stock
markets, obtaining mixed results (see Charles and Darne, 2009 for a review). Charles and Darne
(2009) analyze the efficiency of the Chinese stock markets using variance ratio tests and
conclude that renminbi denominated shares (A-shares) appear to follow a random-walk, i.e. a
weak form efficient market hypothesis. In contrast, the authors find that US dollar denominated
shares (B-shares) seem not to pass the random walk hypothesis. They argue that liquidity, market
capitalization and information asymmetry can play a role in explaining the weak form efficiency.
Beltratti et al. (2009) analyse the stock price effects of the changes in ownership structure
derived of the conversion of non-tradable shares into tradable ones in 2005-2006 and find that
price of stocks characterised by lower liquidity, inactive investors and less transparency before
the reform tend to benefit most from it. Thus, they conclude that the recent financial reforms
significantly improved Chinese stock market fundamentals.
Other researchers have reported that China’s stock market has unique attributes that challenge
traditional asset pricing models and the theory of rationality. For instance, Kang et al. (2002)
suggest that the lack of rigorous stock analysis and research may have led to the perception that
prices are driven by sentiment as much as by other factors. Drew et al. (2003) suggest that the
Chinese market is difficult to comprehend using conventional analysis. The authors document
that their result that book-to-market equity generates on average a negative monthly return may
come from investors’ misvaluation. At the same time, Burdekin and Redferin (2009) present
evidence that individuals react to the real return on deposits (the risk-free asset) and equity
markets relative performance and risk perception. Finally, Eun and Huang (2007) find that while
the market risk (beta) is not priced, there is a significantly negative relationship between firm-
specific risk and expected returns in China.
7ECB
Working Paper Series No 1190May 2010
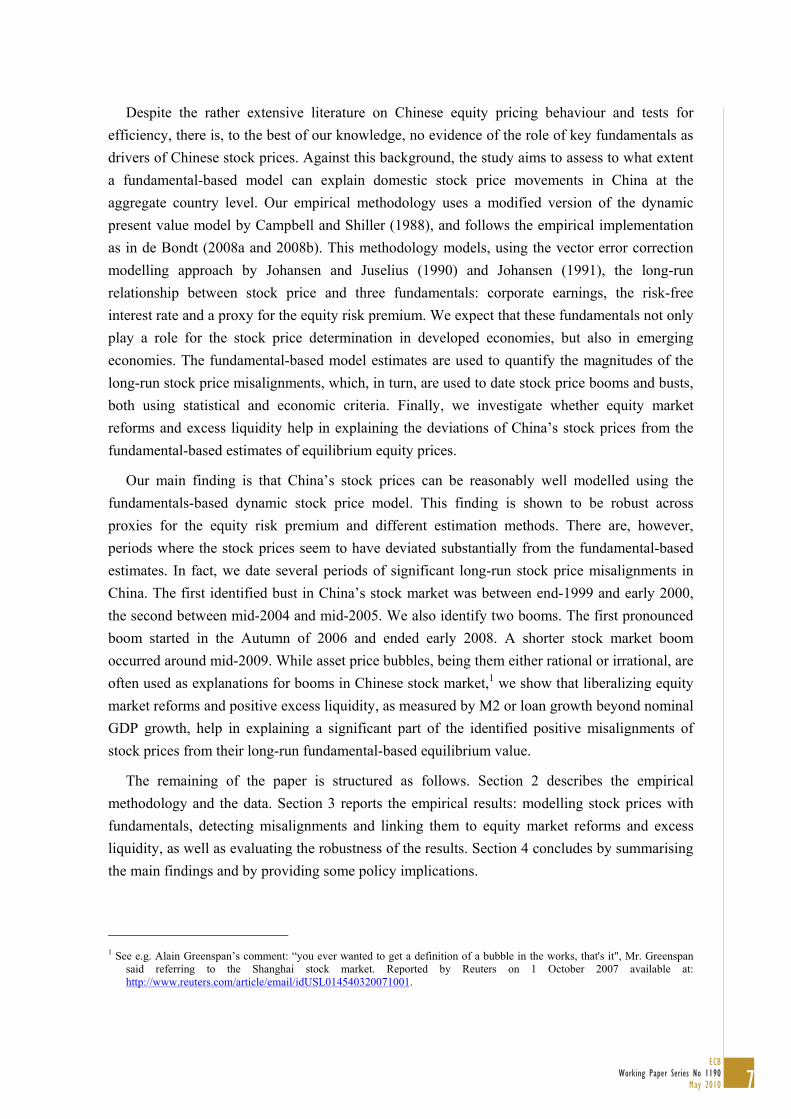
Despite the rather extensive literature on Chinese equity pricing behaviour and tests for
efficiency, there is, to the best of our knowledge, no evidence of the role of key fundamentals as
drivers of Chinese stock prices. Against this background, the study aims to assess to what extent
a fundamental-based model can explain domestic stock price movements in China at the
aggregate country level. Our empirical methodology uses a modified version of the dynamic
present value model by Campbell and Shiller (1988), and follows the empirical implementation
as in de Bondt (2008a and 2008b). This methodology models, using the vector error correction
modelling approach by Johansen and Juselius (1990) and Johansen (1991), the long-run
relationship between stock price and three fundamentals: corporate earnings, the risk-free
interest rate and a proxy for the equity risk premium. We expect that these fundamentals not only
play a role for the stock price determination in developed economies, but also in emerging
economies. The fundamental-based model estimates are used to quantify the magnitudes of the
long-run stock price misalignments, which, in turn, are used to date stock price booms and busts,
both using statistical and economic criteria. Finally, we investigate whether equity market
reforms and excess liquidity help in explaining the deviations of China’s stock prices from the
fundamental-based estimates of equilibrium equity prices.
Our main finding is that China’s stock prices can be reasonably well modelled using the
fundamentals-based dynamic stock price model. This finding is shown to be robust across
proxies for the equity risk premium and different estimation methods. There are, however,
periods where the stock prices seem to have deviated substantially from the fundamental-based
estimates. In fact, we date several periods of significant long-run stock price misalignments in
China. The first identified bust in China’s stock market was between end-1999 and early 2000,
the second between mid-2004 and mid-2005. We also identify two booms. The first pronounced
boom started in the Autumn of 2006 and ended early 2008. A shorter stock market boom
occurred around mid-2009. While asset price bubbles, being them either rational or irrational, are
often used as explanations for booms in Chinese stock market,1 we show that liberalizing equity
market reforms and positive excess liquidity, as measured by M2 or loan growth beyond nominal
GDP growth, help in explaining a significant part of the identified positive misalignments of
stock prices from their long-run fundamental-based equilibrium value.
The remaining of the paper is structured as follows. Section 2 describes the empirical
methodology and the data. Section 3 reports the empirical results: modelling stock prices with
fundamentals, detecting misalignments and linking them to equity market reforms and excess
liquidity, as well as evaluating the robustness of the results. Section 4 concludes by summarising
the main findings and by providing some policy implications.
1 See e.g. Alain Greenspan’s comment: “you ever wanted to get a definition of a bubble in the works, that's it", Mr. Greenspan
said referring to the Shanghai stock market. Reported by Reuters on 1 October 2007 available at: http://www.reuters.com/article/email/idUSL014540320071001.
8ECBWorking Paper Series No 1190May 2010
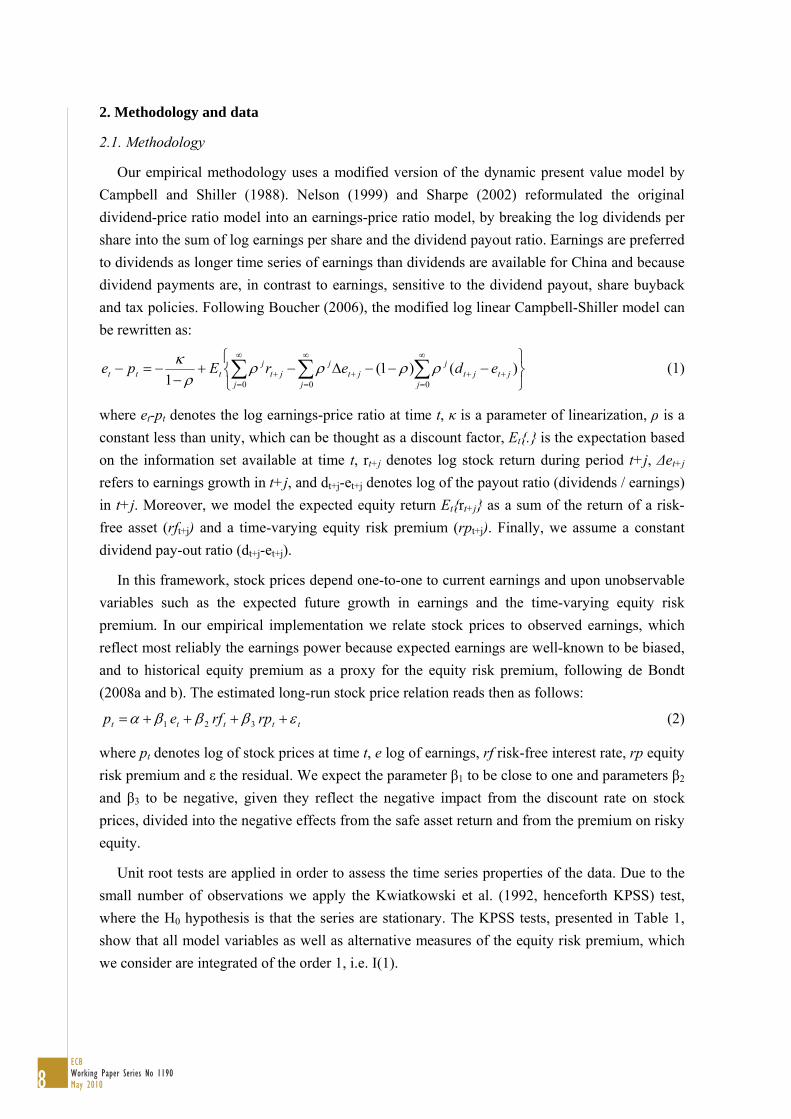
2. Methodology and data
2.1. Methodology
Our empirical methodology uses a modified version of the dynamic present value model by
Campbell and Shiller (1988). Nelson (1999) and Sharpe (2002) reformulated the original
dividend-price ratio model into an earnings-price ratio model, by breaking the log dividends per
share into the sum of log earnings per share and the dividend payout ratio. Earnings are preferred
to dividends as longer time series of earnings than dividends are available for China and because
dividend payments are, in contrast to earnings, sensitive to the dividend payout, share buyback
and tax policies. Following Boucher (2006), the modified log linear Campbell-Shiller model can
be rewritten as:
00 0
)()1(1 j
jtjtj
j jjt
jjt
jttt ederEpe
(1)
where et-pt denotes the log earnings-price ratio at time t, κ is a parameter of linearization, ρ is a
constant less than unity, which can be thought as a discount factor, Et{.} is the expectation based
on the information set available at time t, rt+j denotes log stock return during period t+j, Δet+j
refers to earnings growth in t+j, and dt+j-et+j denotes log of the payout ratio (dividends / earnings)
in t+j. Moreover, we model the expected equity return Et{rt+j} as a sum of the return of a risk-
free asset (rft+j) and a time-varying equity risk premium (rpt+j). Finally, we assume a constant
dividend pay-out ratio (dt+j-et+j).
In this framework, stock prices depend one-to-one to current earnings and upon unobservable
variables such as the expected future growth in earnings and the time-varying equity risk
premium. In our empirical implementation we relate stock prices to observed earnings, which
reflect most reliably the earnings power because expected earnings are well-known to be biased,
and to historical equity premium as a proxy for the equity risk premium, following de Bondt
(2008a and b). The estimated long-run stock price relation reads then as follows:
ttttt rprfep 321 (2)
where pt denotes log of stock prices at time t, e log of earnings, rf risk-free interest rate, rp equity
risk premium and ε the residual. We expect the parameter β1 to be close to one and parameters β2
and β3 to be negative, given they reflect the negative impact from the discount rate on stock
prices, divided into the negative effects from the safe asset return and from the premium on risky
equity.
Unit root tests are applied in order to assess the time series properties of the data. Due to the
small number of observations we apply the Kwiatkowski et al. (1992, henceforth KPSS) test,
where the H0 hypothesis is that the series are stationary. The KPSS tests, presented in Table 1,
show that all model variables as well as alternative measures of the equity risk premium, which
we consider are integrated of the order 1, i.e. I(1).

9ECB
Working Paper Series No 1190May 2010
{Table 1 Unit root tests}
In order to investigate the potential co-integration relationship between stock prices and its
aforementioned fundamental determinants, equation (2) is estimated by maximum likelihood
(ML) applying the vector error correction modelling approach by Johansen and Juselius (1990)
and Johansen (1991):
tktktktt YYYY 1111 ... (3)
The (p x p) matrix, Π, characterises the long-run relationship between the (p x 1) vector of Y
variables: p, e, rf and rp. Cointegration is indicated by the rank of Π, r, and equals the number of
cointegration vectors. The cointegration space includes a deterministic term containing a
constant, α, but no trend. Π is decomposed into λβ′, where λ and β are (p x r) matrices. The rows
of β′ are the cointegrating vectors and determine the long-run relationships between the
variables. The λ-matrix is a weighting matrix and represents the speed of adjustment of the
variables to equilibria.
We approximate the long-run fundamental or fair value, fv, of the stock prices using the fitted
value of the estimated long-run model in Equation (2):
)exp( ttt pfv (4)
The fair valuation gap, fvgap, measures in percentages by how much the actual stock
price index, p, has to change to reach the estimated fair value:
t
ttt p
fvpfvgap
100 (5)
The fair valuation gap, hereafter referred to as long-run stock price misalignment, is used to
define booms and busts in China’s stock market. The economic approach dates booms and busts
in case the long-run stock price misalignment is higher than 20% in line with (Yan et al., 2007)
and a commonly applied threshold by the financial press to define bull and bear markets. A
statistical approach dates booms and busts in case the actual stock price lies outside the one
standard error of the model.
In a second stage analysis, once stock price misalignments have been identified, we test
whether there are some China-specific factors and market imperfections, i.e. stock market
reforms or excess liquidity that could have a contemporaneous or lagged impact on the identified
stock price misalignments:
t
k
jjtj
h
iitit xxfvgap
0,2,2
0,1,1 (6)

10ECBWorking Paper Series No 1190May 2010
The first variable, x1, examines whether structural reforms affect stock price misalignments and
the second one, x2, excess liquidity, given the frequent attention in the financial press that
liquidity might play a role for high stock prices.
2.2. Data
Besides the data for stock market reforms, all the variables used in the analysis are drawn
from the CEIC China Premium Database and are in monthly frequency. The effective sample
period starts in April 1999 and ends in September 2009.
As dependent variable we use the Shanghai A-share Index to represent stock price
developments in China. The Shanghai A-share Index is the benchmark index for renminbi-
denominated shares. The index refers to A-shares, i.e. shares of incorporated companies in China
representing more than 97% of the market capitalization of tradable shares in Shanghai Stock
Exchange. Such shares can be traded by residents and marginally by authorized foreign
institutional investors.
The independent variables, i.e. the fundamental stock price determinants, are specified as
follows. Earnings refer to reported, as opposed to expected, earnings because they are unbiased
and available for a longer period. Both stock prices and earnings are measured in nominal terms
as the price deflator cancels out in case of a long-run elasticity between stock prices and earnings
of one, which indeed appears to be the case.2 As a proxy for the risk free interest rate, we use the
one-year reference rate on deposits deflated by the consumer price index. The one-year time
deposit rate is the return on the least risky asset that the Chinese residents can hold, given
restrictions to acquire government bonds and the implicit governmental guarantee on deposits. It
should be stressed that interest rate liberalization is incomplete in China, implying that effective
interest rates are not fully determined by market forces and are very close to benchmark rates,
especially on deposits (Porter and Xu, 2009 and Feyzioğlu et al., 2009).
Unless stated otherwise, the equity risk premium is approximated by the one-month lagged
36-month rolling earnings yield premium (rp). The earnings yield premium is defined as the
spread between the earnings yield and the ex post real interest rate. The earnings yield, i.e. the
inverted P/E ratio, is commonly viewed as a reasonable approximation for the real expected
return to equity (Siegel, 2005). A three-year moving average of the earnings yield premium is
used. This time span is long enough to avoid that short-run fluctuations in the equity risk
premium affect the long-run level of the equity premium, and thus the fair value of stock prices.
At the same time, it is short enough to capture possible structural changes in the perceived level
of the equity risk premium among equity investors. As a robustness check, the following other
proxies for the equity risk premium are considered: i) A one-month lagged earnings yield
2 Similar coefficients were estimated when using the CPI index as deflator.

11ECB
Working Paper Series No 1190May 2010
premium averaged over a 24-month period (rp24); ii) the realised excess return, i.e. the return on
equity vis-à-vis the return on deposits, over a 36-month (er); and iii) 24-month period (er24).
Moreover, to the extent that aggregate risk in the stock market is captured by the variance of
the stock market return, it is reasonable to expect a positive empirical relationship between our
proxy for the equity risk premium and market volatility (Kim et al., 2004). Regarding the case of
China, we find indeed a positive long-run association between the equity risk premium and stock
market volatility and trace and maximum eigenvalue test statistics indicate the existence of a
cointegrating relationship between the various equity risk premia considered and the stock return
volatility (see Table 2).3 Thus, we expect our proxies for the equity risk premium to capture the
risk-based explanations put forward for the premium (Donaldson and Mehra, 2008).
{Table 2 Cointegration rank test between equity risk premium measures and stock return
volatility}
Finally, the data for the second-stage regressions explaining stock price misalignments is
obtained as follows. First, excess liquidity is measured as the difference in the year-on-year
growth rate in broad money (M2) or loan growth in excess of the year-on-year growth rate of
nominal GDP. Second, the information used to date the stock market reforms is obtained mainly
from China Securities Regulatory Commission (CSRC) and complemented with information
from Bloomberg and Financial Times.4 Table 3 summarizes the main steps in China’s equity
market reforms. The column “Restrictive” denotes months when restrictive measures were taken
by the authorities, while the column “Liberalizing” denotes months when liberalizing actions
were applied. We use these dates to construct corresponding dummy variables for restrictive and
liberalizing stock market reforms. We acknowledge the limitations of our simplified dummy
approach as the stock market reforms have not been monotonous and homogenous. As Cheung et
al. (2009) point out, the regulatory changes, though improving over time, are actually not
monotonic. They characterise the Chinese stock market regulatory framework as starting from
“over-restrictive” and becoming “overunrestrictive”, and then fine-tuned with additional
restrictions. A more detailed quantification, if at all possible, of equity market reforms is
however beyond the scope and aim of the paper.
{Table 3 China’s equity market reforms}
3 Stock return volatility measures the risk of stock price moves calculated from the standard deviation of day to day logarithmic historical price changes. The 30-day price volatility equals the annualized standard deviation of the relative price change for the 30 most recent closing prices, expressed as a percentage. 4 See more details in http://www.csrc.gov.cn/n575458/n4001948/.

12ECBWorking Paper Series No 1190May 2010
3. Empirical results
3.1. Modelling stock prices with fundamentals
Given our interest in the equilibrium or long-run relation of stock prices and their
fundamental determinants, we focus on the long-run relationship in Equation (3). Table 4 reports
the trace and maximum eigenvalue test statistics, which indicate the existence of one
cointegrating relationship between the stock price and its fundamental determinants considered.
{Table 4 Cointegration rank tests}
Table 5 presents the long-run estimates of Equation (3), assuming one cointegration relation.
The lag order is determined by lag exclusion tests and at most four lags are included. Four main
observations emerge from the empirical results.
1. The long-run earnings elasticity is estimated to be close to unity and is statistically significant.
Moreover, the likelihood ratio test for earnings elasticity of unity cannot be rejected at the
conventional levels of statistical significance. This implies that China’s stock prices move one-
to-one to earnings developments in the long run, when controlling for the risk free interest rate
and equity risk premium. It also implies a mean-reverting P/E ratio for China over long samples,
which is also observed for developed countries for which two centuries of data are available.
Table 5 also report the estimation results, whereby the earnings elasticity is restricted to one.
2. The estimated long-run interest rate semi-elasticities are statistically significant and in line
with the estimates for developed countries as reported in de Bondt (2008a). A one percentage
point increase in the deposit rate results in 10% lower stock prices.
3. The estimated long-run equity risk premium semi-elasticities are statistically significant. They
are higher than the estimates as reported in de Bondt (2008a) for developed countries, suggesting
that stock price developments in China are comparatively strongly affected by swings in the
equity risk premium.
4. Our model explains better stock market returns than some standard benchmark models, such
as autoregressive models (AR1 and AR2), or a model with only a constant. In fact, our model
explains 29% (or 17% looking at the adjusted R-squared) of the variance of the monthly return
on China’s stock, compared to up to 6% by the other models. Moreover, the model residuals do
not exhibit serial correlation or heteroscedasticity as indicated by the respective tests. The
normality test shows that the residuals do not follow a normal distribution, but this is not
surprising given it is well-known that equity returns, even at a monthly frequency, are typically
clustered.

13ECB
Working Paper Series No 1190May 2010
{Table 5 Estimation results of the long-run specification}
3.2. Stock price misalignments: dating booms and busts
One way of presenting the estimated fair value of the stock market in China is to modify the observed P/E ratio for the impact of the level of the risk-free interest rate and equity risk
premium according to the long-run estimates of Equation (3). Given the unrestricted estimates of
the earnings elasticity turn out not to deviate significantly from one, these estimated fair values can be seen as a P/E ratio adjusted for the interest rate and equity risk premium. Figure 1 plots the observed P/E ratio and the P/E ratio modified for the interest rate and risk premium for the
restricted model. Prolonged and pronounced deviations between the actual P/E ratio and the
estimated fair P/E ratio indicate signs of long-run stock price misalignments according to the
three considered fundamental determinants and their estimated past relation with the stock price. As can be seen from Figure 1, the actual P/E ratio has been clearly above the “fair” P/E ratio in 2007, but returned to its estimated fair value in the course of 2008. In late 2008, the actual P/E ratio was below the modified P/E ratio, whereas the opposite was the case at the end of the
sample period.
{Figure 1 P/E ratio and P/E ratio modified for interest rate and risk premium}
Figure 2 plots the estimated fair valuation gaps or percentage deviations of the actual outcome of the stock prices from their estimated long-run fair valuations according to the estimates with a
freely estimated earnings elasticity. The estimated long-run stock price misalignments show that
actual stock prices may deviate from their long-run fair value over extended intervals. Such deviations from the fair value are a sign of under- or over-valuation, at least based on the model
and sample period considered. They could, however, also reflect temporary deviations of
earnings growth or the discount factor from their long-run equilibrium levels or structural
changes in the long-run relation between stock prices and their determinants.
{Figure 2 Estimated long-run stock price misalignments}
Table 7 presents the dates of booms and busts in the Chinese stock market applying a
statistical (outside the one standard error of regression confidence band) and economic (more
than 20% misalignment) rule to the long-run stock price misalignments derived from the
unrestricted model. To be sure about the existence of booms and busts, we apply a rule where

14ECBWorking Paper Series No 1190May 2010
booms and busts need to be identified using both statistical and economical criteria. In addition,
booms and busts are expected to be not one-off events but to occur for a prolonged period of at
least two consecutive months. This rule results in two booms and two busts periods since April
1999. The first identified burst took place between October 1999 and February 2000. Another
bust in China’s stock market was between mid-2004 and mid-2005. This was followed with a
pronounced boom which started in October 2006 and ended in February 2008. A new stock
market boom started in May 2009 up to July 2009, as argued by others around that time
(Bastiaensen et al., 2009).
{Table 7 Identified booms and busts in China’s stock market since April 1999}
3.3. Other factors explaining booms and busts
According to our model, fundamentals factors were able to explain only a part of the rise in
2006-07 and the subsequent fall in China’s equity market in 2007-08, as a main factor driving
stock price changes at that time was the error term, i.e. the part not explained by the
fundamentals considered. Two possible explanations arise. First, the identified run-up of Chinese
stock prices in 2006-07 and the subsequent collapse in 2007-08 was driven by bubbles, them
being either rational or irrational (see LeRoy, 2004 for a survey on asset bubbles). Second, there
are some China-specific factors that cause the dynamic stock price model to be inadequate
modelling stock prices in China.
This sub-sections analyses the second possibility, given is not our aim to extend the not well-
developed empirical literature on asset price bubbles, as pointed out by LeRoy (2004).
Consequently, we use three additional variables to test whether they can explain the stock market
misalignments identified earlier: stock market reforms, and two proxies for excess liquidity.
These factors could potentially explain some characteristics of the Chinese stock market and
market imperfections that cannot be captured using the standard fundamental-based model.
Regarding stock market reforms, the Chinese domestic stock market was designed in the
1990s as a segmented one: a market for residents denominated in renminbi (A-share) and a
market for foreigners denominated in US dollars (B-share). In addition, most of the shares of the
listed firms are in the hands of the public sector and are not actively traded. Since the opening of
the Shanghai’s stock market in December 1990, Chinese authorities have gradually introduced
market oriented regulations, including provisions to facilitate raising capital and IPOs by
corporates, to reduce market segmentation and to expand the investor base. In addition,
transparency and better corporate governance have also been encouraged. More detailed
descriptions of stock market reforms can be found in Chen (2003) and in Cheung et al. (2008 and
2009).
15ECB
Working Paper Series No 1190May 2010
Concerning excess liquidity, given the effective interest rates are not fully determined by
market forces in China, abundant liquidity conditions in money markets could explain stock
price booms beyond the interest rate controlled for in the fundamental-based model. Moreover,
there is anecdotal evidence that, at certain times, credit granted to enterprises and households has
been diverted to equity market investments in China, which would also imply a positive
correlation between excess liquidity and stock prices.
Table 8 examines whether the liberalizing reforms have impacted overall stock price
developments in China by regressing the estimated long-run stock price misalignments (Figure
2) on a constant and the liberalizing reform dummy cumulated over a certain period. We thus
examine the impact of the reforms beyond the effect they could have in affecting the
fundamental determinants in stock prices, such as a structurally lower equity risk premium or a
positive longer-term impact on the performance of listed companies and thus on earnings.
Evidence on the latter is reported in Jiang et al. (2008) and in Beltratti et al. (2009). The
estimates show that the liberalizing reforms are positively affecting the long-run stock price
misalignment. This impact is statistically significant for the 1½ to 3 year periods, suggesting that
it takes time before the reform measures positively affect long-run stock price misalignments.
The delayed impact can be explained by the structural nature of the reform measures. In
economic terms, the estimates suggest that the liberalizing reforms have contributed by up to 12
percentage points to the positive deviations of stock market prices from their long-run
fundamental value. One should, however, keep in mind that more than usual caution is warranted
in the interpretation of the results, given the labelling of equity market reforms is somewhat
arbitrary and do not distinguish between their relative importance. This notwithstanding, our
findings can be seen as supporting Zhang et al. (2008), who find that the political consideration
of the Chinese government can be a critical force that drives the stock market. Due to a small
number of months when restrictive reforms were applied, a similar exercise can not be
performed for the restrictive reforms. However, it is striking that the Chinese authorities
introduced restrictive stock market measures in April 2007, when according to our model the
stock prices were clearly above their fundamental value, and just one month before our stock
price misalignment measure recorded its maximum.
{Table 8 Impact of liberalizing reforms on stock price misalignment over various horizons}
Table 9 shows the estimation results of Equation (6) for a contemporaneous impact as well as
for an impact over 1-9 months of excess liquidity together with the liberalisation dummy over 24
months.5 In both cases, the excess liquidity and liberalisation variables are lagged by one month
5 We use the liberalization period of 24 months as a benchmark as the Wald tests do not reject the null hypothesis of the same
estimated coefficients for the liberalisation dummies for the various lags tested.

16ECBWorking Paper Series No 1190May 2010
and moving averages over the specific periods are used. Excess liquidity is defined as M2 or loan
growth in excess of GDP growth. In addition, the table reports the results for a sample with only
positive values of excess liquidity to see whether liquidity booms could explain stock price
booms.
Two conclusions emerge from these regressions: 1) Excess liquidity is generally not affecting
misalignments (see Panels A and B). However, in periods with positive excess liquidity, it is
significantly affecting long-run stock price misalignment generally up to six months (see Panels
C and D). An increase in positive excess liquidity by 1 percentage point results in an about 1½
percentage point higher fair valuation gap. Put differently, accelerating M2 or loan growth
beyond nominal GDP growth seems to boost stock prices in China. Positive excess liquidity
explains about one-third of the variance in the long-run stock price misalignment and together
with liberalizing reforms up to 42%. 2) The estimated impact of the liberalizing reforms remains
statistically significant when also an excess liquidity measure is considered. However, its
economic effect on the stock price misalignment reduces substantially: about 6 percentage points
compared to up to 12 percentage points according to the estimation results when the liberalising
reforms are considered in isolation.
{Table 9 Impact of excess liquidity on stock price misalignment over various horizons}
3.4. Robustness
We analyse the robustness of our results in the following ways. First, we use three alternative
measures of the equity risk premium. Table 10 provides the ML estimation results using the
other measures of the equity risk premium: 24-month instead of 36-month moving average of the
earnings yield premium, as well as the realised excess return, i.e. the return on equity vis-à-vis
the return on deposits, over 36- and 24-month horizons. The estimates show that irrespective of
the considered proxy for the equity risk premium, earnings, interest rate and equity risk premium
are significant long-run stock price determinants. The 36-month moving average of the earnings
yield premium shows, however, the highest explanatory power, and is therefore our preferred
proxy for the equity risk premium. In all cases, the restriction of a long-run earnings elasticity of
one can not be rejected according to the likelihood ratio test.
{Table 10 Johansen’s Maximum Likelihood estimates of long-run specifications with alternative
measures for the equity risk premium}
Second, besides the maximum likelihood estimation, Equation (2) is also estimated by quantile
regressions (Koenker and Bassett, 1978), including the least absolute deviation (LAD) estimation
method (median estimate from the 50% quantile). Quantile process estimators have the

17ECB
Working Paper Series No 1190May 2010
advantage that they are robust to heteroskedasticity, skewness and leptokurtosis (Machada and
Sousa, 2006 and Gowlland et al., 2009). They also provide the possibility to test for symmetry
and slope equality across various quantiles. We perform Newey and Powell (1987) symmetric
quantiles test of conditional symmetry. Conditional symmetry implies that the average values of
two sets of coefficients for symmetric quantiles (here 0.25 and 0.75) around the median (0.50)
will equal the value of the coefficients at the median. The Koenker and Bassett (1982) test for
the equality of the slope (non-intercept) coefficients of the 0.25, 0.50 and 0.75 quantiles is also
reported. It compares the slope coefficients for the median (0.50 quantile) against those
estimated at the upper and lower quartile. Table 11 reports the quantile process estimates using
the 36-month rolling earnings yield premium as a proxy for the equity risk premium. The upper
panel of the table indicates that the three stock price fundamentals significantly help in
explaining China’s stock prices across the various quantiles. The level of the coefficient
estimates do, however, vary. This notwithstanding, the lower panel of the table shows there is
generally no evidence of departures from symmetry and slope equality. The only exception is an
indication that the coefficients with respect to the interest rate differ across quantiles. The higher
quantiles show a larger impact of the interest rate on the stock price. This finding suggests that
an increase in the deposit rate is especially an effective measure to dampen stock price
developments during periods of high stock prices. A similar long-run stock price misalignment
results from this estimation method, as suggested by a high correlation of 0.86 between the long-
run stock price misalignment derived from the ML and the LAD estimates.
{Table 11 Quantile process estimates}
Overall, we conclude that our results are robust over the choice of the measure for equity risk
premium and the estimation method.
4. Conclusions
The study analyses stock prices in China using a model, derived from the Campbell and
Schiller (1988), which is based on three fundamentals: corporate earnings, risk-free interest rate
and a proxy for the equity risk premium. The model estimates are then used to quantify the
magnitudes of long-run stock price misalignments, which, in turn, are used to date stock price
booms and busts. In a second stage, additional factors, such as equity market reforms and excess
liquidity, are examined to test whether they have contributed to the identified stock market
misalignments.
Our main finding is that China’s stock prices can reasonably well be modelled using the
fundamentals-based dynamic stock price model. This finding is new and robust across proxies
for the equity risk premium and estimation method. There are, however, periods where the stock

18ECBWorking Paper Series No 1190May 2010
prices seem to have deviated significantly from the estimates based on the fundamentals. We
identify two boom and two bust periods in China’s stock market since April 1999. While the
often heard explanations for the boom and bust periods in the Chinese stock market are related to
a building of a bubble and its burst, we show that liberalising market reforms and positive excess
liquidity explain a significant part of the identified misalignments in the Chinese stock market.
The implications of our findings are several. First, interestingly, stock prices can be modelled
empirically by fundamental determinants also in a transition economy with a significant
government intervention, such as China. The estimated long-run stock price misalignments
derived from the fundamentals provide a useful valuation tool for investors and fund managers
and an informative monitoring tool for policy makers. Second, we present evidence that policy
actions by the Chinese authorities, either by taking the form of low deposit rates, loose liquidity
conditions, or stock market liberalizations have contributed to the formation of booms in China’s
stock market.

19ECB
Working Paper Series No 1190May 2010
References
Bastiaensen, K., Cauwels, P., Sornette, D., Woodard, D. and Zhou, W.-X., 2009. The Chinese equity bubble: Ready to burst. http://www.citeulike.org/user/NitinCR/article/5196773, 10 July.
Beltratti, A., Bortolotti, B., and Caccavaio, M., 2009. Who gains from financial reforms? Evidence from the Chinese Stock Market. Unpublished working paper. Bocconi University, FEEM and Torino University.
Boucher, C. 2006. Stock prices-inflation puzzle and the predictability of stock market returns. Economics Letters 90, 205-212.
Burdekin, R.C.K. and Redfern, L., 2009. Sentiment effects on Chinese share prices and savings deposits: The post-2003 experience. China Economic Review 20, 246-261.
Campbell, J.Y. and Shiller, R.J., 1988. The dividend-price ratio and expectations of future dividends and discount factors. Review of Financial Studies 1, 195-228.
Charles, A. and Darné, O., 2009. The random walk hypothesis for Chinese stock markets: Evidence from variance ratio tests. Economic Systems 33, 117–126.
Chan, K. C., Fung, H.-G., and Thapa, S., 2007. China financial research: A review and synthesis. International Review of Economics and Finance 16, 416–428
Chen, Z., 2003. Capital markets and legal developments: The China case. China Economic Review 14, 451-472.
Cheung, Y. L., Jiang, P., Limpaphayom, P., and Lu, T., 2008. Does corporate governance matter in China? China Economic Review 19, 460–479.
Cheung, Y. L., Ouyang, Z., and Tan, W., 2009. How regulatory changes affect IPO underpricing in China. China Economic Review, 20, 692-702.
de Bondt, G.J., 2008a. Determinants of stock prices: New international evidence. Journal of Portfolio Management 34, 81-92.
de Bondt, G.J., 2008b. Determinants and future returns of sector stock prices, Colloquium Paper, 27th SUERF Colloquium on ‘New trends in asset management: exploring the implications, Munich 12-14 June.
Donaldson, J. and Mehra, R., 2008. Risk-based explanations of the equity premium in Handbook of the Equity Risk Premium (ed. R. Mehra), 37-99. Elsevier.
Drew, M.E., Naughton, T. and Veeraraghavan, M., 2003. Firm size, book-to-market equity and security returns: Evidence from the Shanghai Stock Exchange. Australian Journal of Management 28, 119–139.
Eun, C.S. and Huang, W., 2007. Asset pricing in China’s domestic stock markets: Is there a logic? Pacific-Basin Finance Journal 15, 452-80.
Feyzioğlu, T., Porter, N., and Takáts, E., 2009. Interest rate liberalization in China. IMF Working Paper 09/171.
Gowlland, C., Xiao, Z. and Zeng, Q. 2009. Beyond the central tendency: Quantile regression as a tool in quantitative investing. Journal of Portfolio Management 35, 106-119.
Jiang, B.B., Laurenceson, J. and Tang, K.K., 2008. Share reform and the performance of China’s listed companies. China Economic Review 19, 489-501.
Johansen, S., 1991. Estimation and hypothesis testing of cointegration vectors in Gaussian vector autoregressive models. Econometrica 59, 1551-1580.
Johansen, S. and Juselius, K., 1990. Maximum Likelihood estimation and inference on cointegration – With applications to the demand for money. Oxford Bulletin of Economics and Statistics 52, 169-210.
Kang, J., Liu, M.-H. and Ni, S.X., 2002. Contrarian and momentum strategies in the China stock market: 1993–2000, Pacific Basin Finance Journal 10, 243-265.
20ECBWorking Paper Series No 1190May 2010
Kim, C.-J., Morley, J.C. and Nelson, C.R., 2004. Is there a positive relationship between stock market volatility and the equity premium? Journal of Money, Credit, and Banking 36, 339-360.
Koenker, R. and Bassett, G., 1978. Regression quantiles. Econometrica, 46, 33–50. Koenker, R. and Bassett, G., 1982. Robust tests for heteroscedasticity based on regression
quantiles. Econometrica, 50, 43–61. Kozluk, T., 2008. Global and regional forces and stock market movements - The case of Russia
and China. BOFIT Discussion Paper 4/2008. Kwiatkowski, D., Phillips, P.C.B., Schmidt P. and Shin, Y. 1992. Testing the null of stationarity
against the alternative of a unit root: How sure are we the economic time series have a unit root? Journal of Econometrics 54, 159–178.
LeRoy, S. F., 2004. Rational Exuberance, Journal of Economic Literature 42, 783-804. Li, H., 2007, International linkages of the Chinese stock exchanges: A multivariate GARCH
analysis. Applied Financial Economics 17, 285-297. Machada,J.A,.F. and Sousa, J., 2006. Identifying asset price booms and busts with quantile
regressions. Banco de Portugal Working Paper 8. MacKinnon, J.G., Haug, A.A. and Michelis, L., 1999. Numerical distribution functions of
likelihood ratio tests for cointegration. Journal of Applied Econometrics 14, 563-577. Nelson, W.R., 1999. The aggregate change in shares and the level of stock prices. Finance and
Economic Discussion Series No. 1999-08. Federal Reserve Board. Newey, W.K. and Powell, J.L., 1987. Asymmetric least squares estimation and testing.
Econometrica 55, 819-847. Porter, N. and Xu, T.T., 2009. What drives China’s interbank market? IMF Working Paper
09/189. Sharpe, S.A., 2002. Reexamining stock valuation and inflation: the implications of analysts’
earnings forecasts. Review of Economics and Statistics 84, 632-648. Siegel, J., 2005. Perspectives on the equity risk premium. Financial Analysts Journal 61, 61-73. Yan, W., Powell, J.G., Shi, J. and Xu, W., 2007, Chinese stock market cyclical regimes: 1991-
2006. Economics Letters 97, 235-239. Zhang, Z., Sun W. and Hua W., 2008. A new perspective on financial anomalies in emerging
markets: The case of China. Applied Financial Economics 18, 1681-1695.

21ECB
Working Paper Series No 1190May 2010
Tables and figures Table 1 Unit root tests
Variables KPSS level
KPSS difference
Baseline specificationStock price p 0.54 * 0.06
Earnings e 1.40 ** 0.10Risk-free interest rate rf 0.76 ** 0.19Equity risk premium rp 1.31 ** 0.23Equity premium, 24-month horizon rp24 1.23 ** 0.18Excess return er 1.11 ** 0.11Excess return, 24-month horizon er24 0.91 ** 0.15
The table presents Kwiatkowski-Philips-Schmidt-Sinn (KPSS) unit root test, with the H0 is that the series are stationary. ** and * denote rejection of the null hypothesis at the 1% and 5% significance level, using the test critical values of 0.739 and 0.463, respectively. Table 2 Cointegration rank test between equity risk premium measures and stock return volatility
Cointegration rank rp rp24 er er24
Trace test0 35.3 ** 29.2 ** 37.8 ** 35.8 **
[0.00] [0.00] [0.00] [0.00]
1 5.45 4.89 2.04 4.28[0.24] [0.30] [0.77] [0.37]
Maximum eigenvalue0 29.8 ** 24.3 ** 35.7 ** 31.6 **
[0.00] [0.00] [0.00] [0.00]
1 5.45 4.89 2.04 4.28[0.24] [0.30] [0.77] [0.37]
Probability values between square brackets. ** and * denote the 1% and 5% significance level, i.e. for a rejection of the H0 of at most r cointegration vectors using the criticial values of MacKinnon et al. (1999).

22ECBWorking Paper Series No 1190May 2010
Table 3 China’s equity market reforms
zing Sep-1986 An OTC equity market was established x Dec-1990 Shanghai Stock Exchange and Shenzhen Stock Exchange were launched x Jan-1992 B-share market for foreign investors were created x Oct-1992 A new regulatory body, the China Securities Regulatory Commission (CSRC) was established Jul-1994 Company Law chart was issued which governs listed companies x Jul-1995 Commercial Bank Law was issued, which clarifies the division between commercial deposit taking
banks and securities firms. Under the new law, commercial banks are not permitted to invest in shares, trust and investment companies or in real estate. Furthermore, banks are obligated to disclose their holdings in securities firms.
Nov-1997 State Council issued the Methods of Administrating Securities by Investment Funds Dec-1998 Securities Law (entered into the force in 1999): A separating financial system is formed. CSRC
became the sole regulatory authority. This law provides regulations on establishment of stock exchanges and broker firms, issuing and trading securities, etc. x
Apr-2000 CSRC announces regulations requiring potential buyers of IPO A-shares to purchase a minimum holding of RMB 10,000.
Feb-2001 B-shares ware available for local investors with foreign currency deposits x Jul-2001 Non-tradable shares reform attempt (abandoned few months later) x Nov-2001 CSRC and Ministry of Finance (MOF) reduce the stamp tax levied on share trading to 0.2%. x Mar-2002 CSRC and MOF cancel a the plan to sell off non-tradable shares x Jun-2002 Overseas institutions were allowed to trade B-shares directly x Jul-2002 Partial foreign participation into securities companies and fund management companies were
allowed x Nov-2002 Qualified Foreign Institutional Investors (QFII) were allowed to purchase A-shares x Nov-2002 Foreign investors were allowed to purchase non-tradable shares x Jun-2004 Shenzhen exchange launch small- and medium enterprises market x Sep-2004 Investment Funds regulation was amended Feb-2005 Commercial banks were allowed to set up the fund management companies x Apr-2005 Second and successful attempt of non-tradable share reform aimed at gradually converting state-
owned shares into tradable shares x Oct-2005 Increase of QFII quota to USD 10bn x Oct-2005 Revision of the Securities Law (entered into force in 2006), that gradually allowed (i) commercial
banks to directly go into the equity market, (ii) SOEs to participate again in the market, (iii) margin trading and short selling and (iv) the issuance new equity derivatives x
Nov-2005 CSRC allowed foreign investors buy tradable A-shares, subjecting them to specified 'lock-up' period. x
Apr-2006 Introduction of the Qualified Domestic Institutional Investors (QDII) scheme, that allows residents to invest abroad x
Dec-2006 Foreign investors were allowed to hold stakes in A-shares over 10% of the capital if maintained more than 3 years x
Apr-2007 To dampen the stock price rally, the government raised the tax duty on equity transactions and reduced the tax burden on incomes related to bank deposits x
Oct-2007 Further expansion of QDII quota to USD 48 bn x Jan-2008 Approved an increase of QFII quota to USD 30bn x Mar-2008 MOF suspended corporate income tax for mutual fund income. x Apr-2008 To foster a depressed market, the government reduced the taxes duties on equity transactions. x Apr-2008 Limitations for former non-tradable shares. First, block sales of converted shares exceeding 1% of
a firm’s equity must go through a separate trading system for large-scale trades. Second, converted shares cannot be sold in the 30 days before release of the firm’s annual or semi-annual reports
Sep-2008 Stamp tax removed. Central government and large state owned companies acquired shares of large Chinese banks. Monetary policy tone shifted from tight to accommodative.
Oct-2008 CSRC allowed margin trading of stocks and stock lending. x Oct/Dec-2008
CSRC suspended IPOs x
Jul-2009 IPOs were restarted. x
Source: The authors based on data from CSRC, supplemented with information from Bloomberg and Financial Times.
Liberali-tive
Date Reform Restric-

23ECB
Working Paper Series No 1190May 2010
Table 4 Cointegration rank tests
Cointegrating equation(s) 0 1 2 3
Trace test 62.6 ** 32.7 * 12.5 3.41[0.00] [0.02] [0.13] [0.07]
Maximum eigenvalue 29.9 * 20.2 9.13 3.41[0.02] [0.07] [0.28] [0.07]
Linear deterministic trend, lag order determined by lag exclusion test. Probability values between square brackets. ** and * denote the 1% and 5% significance level, i.e. for a rejection of the H0 of at most r cointegration vectors using the criticial values of MacKinnon et al. (1999). Table 5 Johansen’s Maximum Likelihood estimates of the long-run specification Earnings e 1 1.23 ** 1.00
(0.35) -Real risk-free interest rf 2 -10.5 ** -9.95 **
(3.19) (2.94)Equity risk premium rp 3 -24.8 ** -20.8 **
(7.02) (2.47)
R-squared 0.29 0.30Adjusted R-squared 0.17 0.18LR test for 1=1 [0.69]LM(1) [0.44] [0.41]LM(4) [0.59] [0.59]Heteroscedasticity [0.29] [0.29]Normality test [0.00] ** [0.00] ** Standard errors between parentheses, p-values between square brackets. ** and * denote the 1% and 5% significance level. Table 6 In-sample fit of the model
R-squared Adjusted R-squaredModel 0.294 0.171AR(1) 0.006 -0.001AR(2) 0.061 0.054
Constant 0.000 0.000

24ECBWorking Paper Series No 1190May 2010
Table 7 Identified booms and busts in China’s stock market Booms BustsStatistically defined: outside the one standard error of the model equation for at least two consecutive months2006.10-2008.2 2009.5-7 1999.10-2000.2 2004.5-10; 2005.5-7Economically defined: more than 20% long-run stock price misalignment for at least two consecutive months2006.8-2008.2 2009.3-9 1999.9-2000.6 2003.9-2004.1 2004.4-2005.3; 2005.5-12 2008.5-8; 2008.10-12Boom 1 Boom 2 Bust 1 Bust 22006.10-2008.2 2009.5-7 1999.10-2000.2 2004.5-10; 2005.5-7 Table 8 Impact of liberalizing reforms on stock price misalignments over various horizons Impact horizon in months 0 1 3 6 12 18 24 30 36 42Liberalizing reform impact 5.80 -1.26 -1.02 3.87 8.42 11.63 ** 10.97 ** 9.31 ** 5.06 * 3.15
(7.85) (8.07) (5.99) (5.07) (4.67) (3.77) (2.87) (2.38) (2.23) (1.99)Adjusted R2 0.00 -0.01 -0.01 0.00 0.06 0.18 0.22 0.19 0.07 0.03 Ordinary least squares estimation results of Equation (6) with 2=0 (excess liquidity not considered). 0 refers to the contemporaneous impact, whereas the other horizons refer to the one-month lagged impact of a moving sum of liberalizing reform dummies over 1, respectively, up to 42 months. Newey-West heteroscedasticity and autocorrelation-corrected standard errors between parentheses. ** and * denote 1% and 5% significance level.

25ECB
Working Paper Series No 1190May 2010
Table 9 Impact of excess liquidity on stock price misalignment over various horizons Impact horizon in months 0 1 2 3 6 9Panel A: total sampleExcess M2 growth impact 0.44 0.43 0.38 0.31 -0.07 -0.59
(1.30) (1.32) (1.34) (1.38) (1.51) (1.60)
Adjusted R20.00 0.00 0.00 -0.01 -0.01 0.00
Excess loan growth impact 0.46 0.42 0.37 0.30 -0.10 -0.75(0.95) (0.99) (1.02) (1.07) (1.26) (1.46)
Adjusted R20.00 0.00 0.00 0.00 -0.01 0.01
Panel B: total sample, joint specification with reform impactExcess M2 growth impact -0.05 0.02 0.01 -0.02 -0.27 -0.50
(1.09) (1.07) (1.07) (1.09) (1.14) (1.21)Liberalizing reform impact, two-year horizon 11.0 ** 10.9 ** 11.0 ** 11.0 ** 11.0 ** 10.9 **
(3.13) (3.09) (3.06) (3.04) (2.99) (2.94)
Adjusted R20.21 0.21 0.21 0.21 0.21 0.21
Excess loan growth impact -0.05 -0.01 -0.02 -0.05 -0.27 -0.59(0.82) (0.81) (0.82) (0.84) (0.93) (1.07)
Liberalizing reform impact, two-year horizon 11.0 ** 11.0 ** 11.0 ** 11.0 ** 11.0 ** 10.9 **(3.18) (3.13) (3.10) (3.10) (3.00) (2.96)
Adjusted R20.21 0.21 0.21 0.21 0.21 0.22
Panel C: sub-sample with positive excess liquidity Positive excess M2 growth impact 1.85 ** 1.91 ** 1.92 ** 1.93 * 1.78 1.42
(0.65) (0.66) (0.69) (0.74) (1.01) (1.38)
Adjusted R20.18 0.18 0.18 0.17 0.11 0.04
Positive excess loan growth impact 1.82 *** 1.85 ** 1.86 ** 1.86 ** 1.78 ** 1.52(0.33) (0.35) (0.38) (0.42) (0.61) (0.98)
Adjusted R20.36 0.35 0.33 0.31 0.21 0.09
Panel D: sub-sample with positive excess liquidity, joint specification with reform impactPositive excess M2 growth impact 1.35 * 1.49 * 1.55 * 1.60 * 1.62 * 1.63
(0.63) (0.60) (0.60) (0.62) (0.73) (0.89)Liberalizing reform impact, two-year horizon 5.90 * 6.10 * 6.27 ** 6.42 ** 6.97 ** 7.55 **
(2.45) (2.36) (2.31) (2.29) (2.30) (2.29)
Adjusted R20.32 0.34 0.34 0.35 0.32 0.30
Positive excess loan growth impact 1.49 ** 1.52 ** 1.54 ** 1.55 ** 1.54 ** 1.56 *(0.40) (0.41) (0.42) (0.43) (0.53) (0.70)
Liberalizing reform impact after two years 3.38 3.86 4.16 4.47 * 5.40 * 6.27 **(2.43) (2.32) (2.26) (2.22) (2.20) (2.24)
Adjusted R20.41 0.42 0.41 0.41 0.36 0.31
Ordinary least squares estimation results of Equation (6) with φ1=0 in panels A and B (liberalizing reforms not considered) and with liberalizing reforms over a 24-month horizon considered in panels C and D. 0 refers to the contemporaneous impact of excess liquidity, whereas the other horizons refer to the one-month lagged impact of a moving average of excess liquidity over 1 to 9 months, respectively. Newey-West heteroscedasticity and autocorrelation-corrected standard errors in parentheses. ** and * denote 1% and 5% significance level.

26ECBWorking Paper Series No 1190May 2010
Table 10 Johansen’s Maximum Likelihood estimates of long-run specifications with alternative measures for the equity risk premium
rp rp24 er er24
Earnings e 1 1.22 ** 1.46 ** 1.77 ** 1.06 **(0.35) (0.24) (0.52) (0.35)
Risk-free interest rate rf 2 -10.5 ** -24.1 ** -38.1 ** -17.7 *(3.48) (3.35) (8.31) (7.63)
Equity risk premium 3 -24.8 ** -30.5 ** -3.76 ** -2.55 **(7.02) (4.11) (0.98) (0.62)
R-squared 0.29 0.07 0.16 0.13Adjusted R-squared 0.17 0.03 0.02 0.05LR test for 1=1 [0.69] [0.09] [0.45] [0.88]LM(1) [0.44] [0.64] [0.82] [0.54]LM(4) [0.59] [0.96] [0.76] [0.87]Heteroscedasticity [0.29] [0.29] [0.80] [0.00] **Normality test [0.00] ** [0.00] ** [0.00] ** [0.00] ** rp = earnings yield premium over 36-month horizon, rp24 over 24-month, er = excess return over 36-month horizon, er24 excess return over 24-month horizon. Standard errors between parentheses, p-values between square brackets. ** and * denote the 1% and 5% significance level. Table 11 Quantile process estimates Quantile Earnings Interest rate Premium Earnings Interest rate Premium
0.1 0.94 ** -2.38 * -16.18 ** 1.00 -2.18 -16.62 **(0.23) (1.16) (3.17) (1.13) (1.53)
0.2 0.92 ** -2.00 -13.85 ** 1.00 -1.90 -14.89 **(0.17) (1.34) (2.91) (1.25) (1.49)
0.3 1.11 ** -3.19 -17.43 ** 1.00 -3.34 -15.38 **(0.14) (1.67) (2.69) (1.84) (1.62)
0.4 0.97 ** -3.20 -14.35 ** 1.00 -3.55 -14.78 **(0.15) (1.93) (2.78) (1.92) (1.45)
0.5 0.98 ** -4.79 * -13.92 ** 1.00 -4.72 * -14.21 **(0.17) (2.07) (3.13) (2.07) (1.39)
0.6 1.22 ** -7.83 ** -16.69 ** 1.00 -7.28 ** -13.07 **(0.27) (2.32) (4.34) (2.28) (1.59)
0.7 1.09 ** -8.87 ** -13.45 ** 1.00 -9.19 ** -11.54 **(0.28) (1.93) (3.13) (1.89) (1.65)
0.8 0.86 ** -10.73 ** -7.12 1.00 -10.55 ** -9.10 **(0.29) (1.90) (4.77) (1.96) (1.56)
0.9 1.08 ** -11.16 ** -9.21 * 1.00 -11.02 ** -7.73 **(0.32) (1.78) (4.56) (1.74) (1.45)
Symmetric quantiles test, probability values0.25, 0.75 0.97 0.20 0.71 0.17 0.55Slope equality test, probability values0.25, 0.5 0.63 0.42 0.33 0.45 0.220.5, 0.75 0.80 0.00 ** 0.27 0.00 ** 0.03 * ** and * denote different from zero at the 1% and 5% significance level.

27ECB
Working Paper Series No 1190May 2010
Figure 1 P/E ratio and P/E ratio modified for interest rate and risk premium
0
10
20
30
40
50
60
70
80
1999 2000 2001 2002 2003 2004 2005 2006 2007 2008 20090
10
20
30
40
50
60
70
80
P/E ratio P/E ratio modified for interest rate and risk premium
Figure 2 Estimated long-run stock price misalignments (%)
-100
-80
-60
-40
-20
0
20
40
60
80
1999 2000 2001 2002 2003 2004 2005 2006 2007 2008 2009-100
-80
-60
-40
-20
0
20
40
60
80

Work ing PaPer Ser i e Sno 1118 / november 2009
DiScretionary FiScal PolicieS over the cycle
neW eviDence baSeD on the eScb DiSaggregateD aPProach
by Luca Agnello and Jacopo Cimadomo