CO2-Measurement during Ventilation Edgar Voigt Jens Pelikan€¦ · The anatomy of the respiratory...
96
CO 2 -Measurement during Ventilation Edgar Voigt Jens Pelikan MT-2853-2008
Transcript of CO2-Measurement during Ventilation Edgar Voigt Jens Pelikan€¦ · The anatomy of the respiratory...
CO2-Measurement during VentilationEdgar VoigtJens Pelikan
MT-
2853
-200
8

CO2-Measurement during Ventilation
Edgar VoigtJens Pelikan

Important Note:
Medical knowledge changes constantly as a result of new research and clinical experience. The authors of this introductory guide have made every effort to ensure that the information given is completely up to date, particularly as regards applications and mode of operation. However, responsibility for all clinical measures must remain with the reader.
All rights, in particular the right of duplication, are reserved by Drägerwerk AG & Co. KGaA. No part of this work may be reproduced or stored in any form using mechanical, electronic or photographic means, without the written permission of Drägerwerk AG & Co. KGaA.
ISBN 3-926762-37-3

04|05
INHALT
1. Basic principles of ventilation 8
1.1 Air 8
1.2 Respiration 10
1.3 Thelungs 15
1.4 Thecirculationoftheblood 27
1.5 Theheart 30
1.6 Controlofrespiration 31
2. Design of a ventilator 32
2.1 Themaincomponentsoftheventilationworkplace 32
2.2 Devicemonitoring 34
2.3 Patientmonitoring 35
3. CO2 monitoring 36
3.1 TheCO2chain 36
3.2 Definitionofcapnometryandcapnography 38
3.3 Measurementprocedures 40
3.4 Thecompositionoftheair 42
3.5 Partialpressure 43
3.6 Volumemeasurementconditions 44
3.7 Watervapour 46
3.8 Respiratoryquotient(RQ) 50
3.9 CO2production(VCO2) 51
3.10 Determinationofdeadspace(Vds) 53
3.11 ThedifferencebetweenPACO2,PaCO2andetCO2 54
3.12 Thephysiologicalcapnogram 56

4. Basic principles of CO2 58
5. Interpreting capnograms 68
5.1 ExponentialdropinPCO2 68
5.2 AconstantreducedPCO2 70
5.3 EvenlylowPCO2withoutplateau 72
5.4 SuddendropofCO2toaroundzero 74
5.5 GradualincreaseinPCO2 76
5.6 SuddendropofCO2,butremainingabovezero 78
5.7 SlopingPCO2plateau 80
5.8 AconstantlyincreasedPCO2 82
5.9 SuddenincreaseinPCO2whichstabilizesonplateauafterashorttime 84
5.10 Suddenshiftofzeroline 86
5.11 SmallCO2variationsattheendofanaesthesia 88
5.12 ContinuousriseininspiratoryandexpiratoryPCO2 90
6. References 92
7. Explanation of abbreviations 94

06|07

CO2-MEASUREMENT DURING VENTILATION | BASIC PRINCIPLES OF VENTILATION
1.1 AIRWe obtain the oxygen we need to maintain life in the different parts of our body from the ambient air.
The composition of the air we inhale is as follows:
20.96% oxygen(O2)
78% nitrogen(N2)
0.04% carbondioxide(CO2)
1% inertgases
Normal air pressure at sea level is 760 mmHg = 1013 mbar. Air is a mixture of gases, and the total air pressure is equal to the sum of the pressures of its different component gases, each gas contributing a volume percentage.
Ptotal = P1 + P2 + P3 + ... Pn
The pressure of each individual gas is described as the partial pressure.
1. Basic principles of ventilation
The ambient air (the inhaled air) contains mainly oxygen and nitrogen.

08|09
The air we exhale has a different composition:
approx.16% oxygen(O2)
78% nitrogen(N2)
approx.5% carbondioxide(CO2)
1% inertgases
By comparing the different compositions of inhaled air and exhaled air, we can see that around 5 % of the inhaled oxygen is not exhaled, and that the carbon dioxide content increases by this same amount. It is clear that a chemical process has taken place within the body whereby the oxygen was consumed and the carbon dioxide generated.
An examination of the exhaled air reveals a reduced oxygen concentration and the presence of newly generated CO2.

CO2-MEASUREMENT DURING VENTILATION | BASIC PRINCIPLES OF VENTILATION
1.2 RESPIRATIONRespiration is subdivided into external and internal respiration.
External respiration describes the process by which the oxygen contained in the inhaled air is transported to the cells, and the carbon dioxide is removed from the cells and expelled via the exhaled air. Internal respiration refers to
a chemical process, a process of combustion that takes place in the cells and produces energy. During oxidation CO2 and H2O occur as end products which have no energy value, and are consequently expelled from the cells and carried in the bloodstream to the excretory organs. Two systems are required by the human body for external respiration:
a) the breathing system for gas exchangeb) the cardiovascular system for transporting oxygen
to and removing surplus carbon dioxide from the tissue cells.
Respiration enables gas exchange in the cells.

10|11
The anatomy of the respiratory tractThe respiratory tract consists of the upper and lower airways. The upper airways include the mouth, nose, pharynx and larynx, while the lower airways are the trachea, bronchi, bronchioles and alveoli.
D-4
675-
2011
Fig. 1:
obere Luftwege
untere Luftwege
upper respiratory tract
lower respiratory tract
The upper airways only transport the gas, while in the lower airways the gas exchange with the blood occurs.

CO2-MEASUREMENT DURING VENTILATION | BASIC PRINCIPLES OF VENTILATION
The noseThe nose has a particularly important role to play due to its position at the beginning of the airways. It is responsible for cleaning, warming and mois-tening the breathing air, while also checking for any harmful admixtures which can be detected by smell. For this purpose the nose is provided with a well-vascularized mucosa. Ciliated epithelia on this mucous membrane trap tiny particles of dust which can then be expelled from the body. As a result of the humidity, increased surface area and high level of blood circulation in the mucous membrane, the relative air humidity in the trachea rises to
D-4
671-
2011
Fig. 2:
In the nasal and pharyngeal cavities the inhaled air is warmed and moistened to physiological conditions.
Nose
Mouth
Larynx
Nasal cavity
Pharynx
12|13
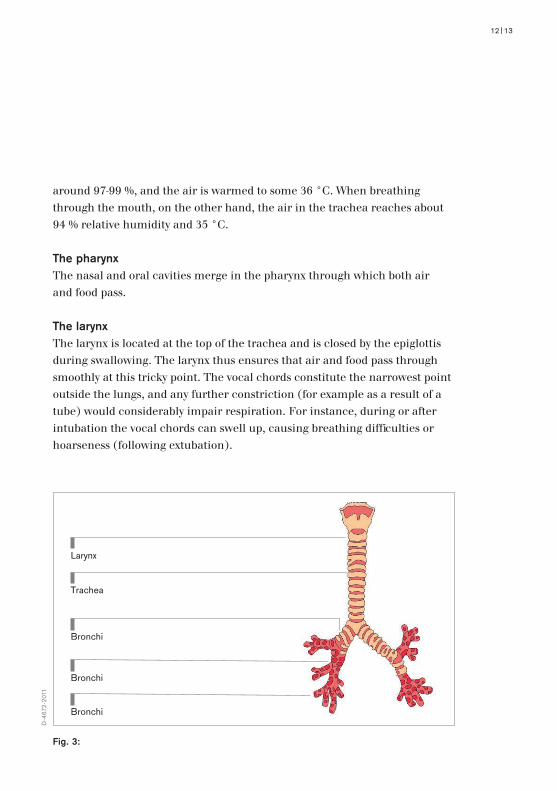
around 97-99 %, and the air is warmed to some 36 °C. When breathing through the mouth, on the other hand, the air in the trachea reaches about 94 % relative humidity and 35 °C.
The pharynxThe nasal and oral cavities merge in the pharynx through which both air and food pass.
The larynxThe larynx is located at the top of the trachea and is closed by the epiglottis during swallowing. The larynx thus ensures that air and food pass through smoothly at this tricky point. The vocal chords constitute the narrowest point outside the lungs, and any further constriction (for example as a result of a tube) would considerably impair respiration. For instance, during or after intubation the vocal chords can swell up, causing breathing difficulties or hoarseness (following extubation).
D-4
672-
2011
Fig. 3:
Trachea
Larynx
Bronchi
Bronchi
Bronchi
CO2-MEASUREMENT DURING VENTILATION | BASIC PRINCIPLES OF VENTILATION
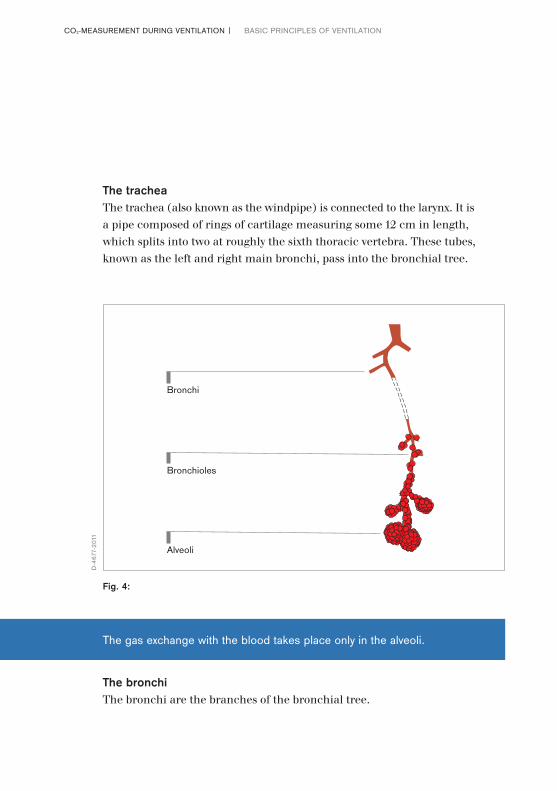
The tracheaThe trachea (also known as the windpipe) is connected to the larynx. It is a pipe composed of rings of cartilage measuring some 12 cm in length, which splits into two at roughly the sixth thoracic vertebra. These tubes, known as the left and right main bronchi, pass into the bronchial tree.
The bronchiThe bronchi are the branches of the bronchial tree.
D-4
677-
2011
Fig. 4:
Bronchi
Alveoli
Bronchioles
The gas exchange with the blood takes place only in the alveoli.
14|15
The bronchiThe bronchioles are further subdivisions of this bronchial tree.
The alveoliThe alveoli are the air sacs which form the “leaves” of the tree. The air flows in from outside and passes along the upper and lower airways all the way to the alveoli, where gas exchange occurs. The air is then transported back out of the body along the same path.
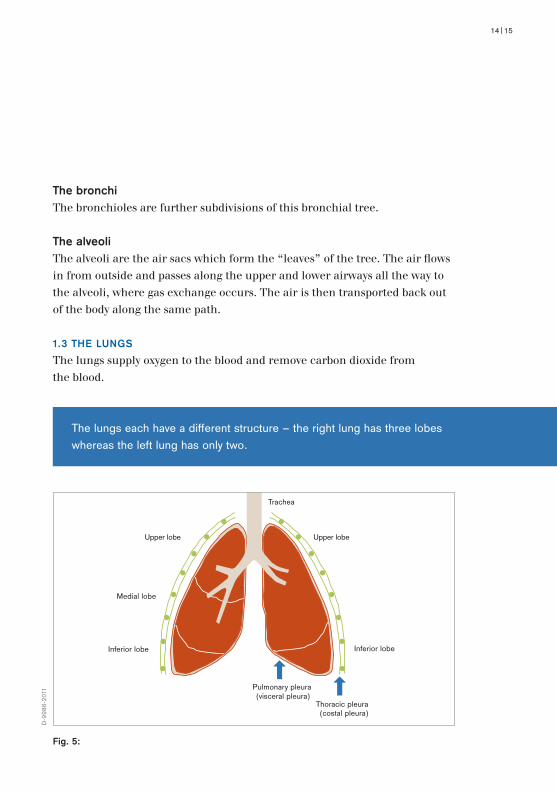
1.3 THE LUNGSThe lungs supply oxygen to the blood and remove carbon dioxide from the blood.
The lungs each have a different structure – the right lung has three lobes whereas the left lung has only two.
Inferior lobe
Medial lobe
Upper lobe Upper lobe
Inferior lobe
Trachea
Pulmonary pleura(visceral pleura)
Thoracic pleura(costal pleura)
rechts links
D-9
986-
2011
Fig. 5:
CO2-MEASUREMENT DURING VENTILATION | BASIC PRINCIPLES OF VENTILATION
Structure of the lungsThe lungs are composed of the bronchi, bronchioles, alveoli (air sacs) and blood vessels.
The air sacs comprise sensitive double walls which are moist and highly elastic. Each alveolus is surrounded by a network of extremely fine blood vessels (capillaries) which have a diameter of 0.1-0.2 mm during exhalation and 0.3-0.5 mm during inhalation. In other words, they roughly double in size during inhalation.
The number of alveoli is estimated at around 300 million and their total surface area available for gas exchange is some 70 to 100 m2. The alveolar walls are so thin that gases can diffuse across them, and it is here that the gas exchange takes place.
The right lung is divided by two deep clefts into three lobes, and the left lung is divided by one cleft into two lobes.
A smooth moist membrane known as the visceral pleura surrounds each of the lungs. At the point where the bronchi enter the lung, this membrane extends to include the inner surface of the chest cavity (here it is termed the parietal pleura), and around the ribs it is named the costal pleura. Between the visceral and parietal pleura there is a closed pleural cavity filled with a small amount of clear fluid (lymph). This allows the lungs to slide smoothly against the chest wall and diaphragm during breathing.
The lungs hang freely in the thoracic cavity, and take up virtually the entire available space. They reach up as far as the sternum, while the broad lower surfaces rest on the diaphragm which separates the thoracic cavity from the stomach. They are only attached in the middle at the mediastinal pleura.
16|17
654
3210
Volume[ L ]
t [ s ]
AZV
RV
FRC ERV
IRV IC VC TLC
Resting expiratory position
D-9
987-
2011
Fig. 6:
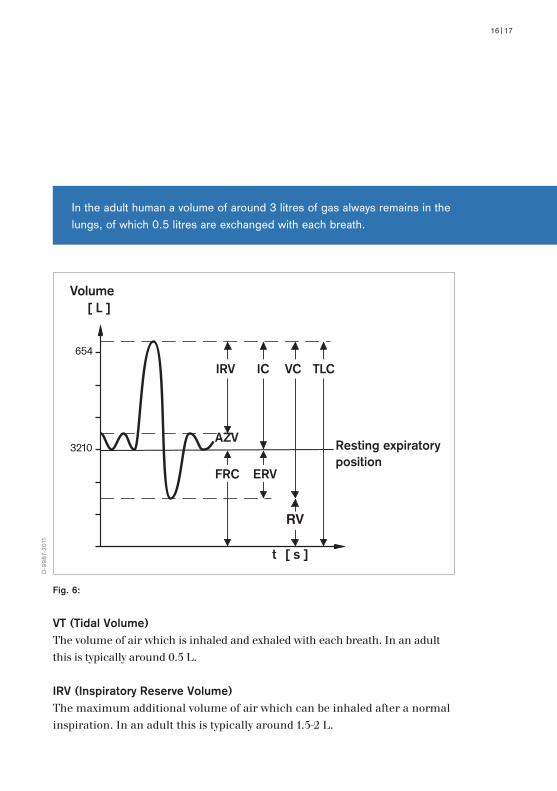
VT (Tidal Volume)The volume of air which is inhaled and exhaled with each breath. In an adult this is typically around 0.5 L.
IRV (Inspiratory Reserve Volume)The maximum additional volume of air which can be inhaled after a normal inspiration. In an adult this is typically around 1.5-2 L.
In the adult human a volume of around 3 litres of gas always remains in the lungs, of which 0.5 litres are exchanged with each breath.

CO2-MEASUREMENT DURING VENTILATION | BASIC PRINCIPLES OF VENTILATION
ERV (Expiratory Reserve Volume)The maximum additional volume of air which can be exhaled after a normal expiration. In an adult this is typically around 1.5-2 L.
RV (Residual Volume)The volume of air which remains in the lung after a maximum expiration. In an adult this is typically around 1.5 L.
TLC (Total Lung Capacity)The volume of air in the lungs following a maximum inspiration.
VC (Vital Capacity)The maximum volume of air which can be exhaled using the greatest possible effort after a maximum inspiration.
IC (Inspiratory Capacity)The maximum volume of air which can be inhaled starting from the resting inspiratory position.
FRC (Functional Residual Capacity)The volume of air in the lungs in the resting inspiratory position. In an adult this is typically around 3 L.
ComplianceIf the airway pressure increases by 20 mbar when 1 L of air flows into the lungs, the compliance as calculated according to the formula stated below will be 50 mL/mbar. Patient compliance determined in this manner includes both the compliance of the lung and the thorax compliance. In a healthy adult the thorax and lung compliance are roughly the same.
Compliance C is the ratio of changing tidal volume VT to the corresponding change in pressure ΔP.

18|19
Each equals approximately 200 mL/mbar, resulting in an overall compliance of 100 mL/mbar in accordance with the following equation:
In clinical terms, a high compliance value signifies lower elastic resistance during inspiration and a weak driving force for expiration. In practice, how-ever, it is only the overall compliance which counts. A representative value for the overall compliance of a healthy adult is from 50 to 100 mL/mbar. Low compliance values can be observed in patients with “stiff” lungs (e.g. ARDS, lung fibrosis, lung oedema), and in cases where there is a reduced amount of space in the thoracic cavity due to certain disorders (e.g. pneumothorax, haemothorax). For ventilation practice this is significant in the sense that it requires careful monitoring of the ventilation process.
Changes in compliance during volume controlled ventilation
In volume controlled ventilation with a tidal volume and PEEP preset on the machine, the differential pressure will be dependent on patient compliance. The plateau pressure can be recorded as a reference value (so long as the PEEP is not changed).
Monitoring lung compliance during ventilation permits conclusions to be drawn about the patient’s condition.
Compliance C = = tidal volume VT [mL] pressure Δ P [mbar]
1 = 1 + 1 C
total C
thorax C
lung

CO2-MEASUREMENT DURING VENTILATION | BASIC PRINCIPLES OF VENTILATION
Tracking the upper pressure value during volume controlled ventilation is therefore an important parameter, as it allows steps to be taken in plenty of time to prevent barotrauma where plateau pressure is increasing due to a change in compliance.
Compliance changes in pressure controlled ventilationIn pressure controlled ventilation a differential pressure (PEEP/Pinsp.) is preset. This setting results in a tidal volume which will be dependent on patient compliance. In this situation a drop in compliance would prevent areas of the lung from becoming over-distended, yet a fall in tidal volume could result in insufficient ventilation. An increase in compliance would bring about an increase in the tidal volume and under certain circumstances could lead to a volume trauma.
Thus the most important parameter in pressure controlled ventilation is the volume, and this parameter must be properly monitored.

20|21
Changes
immediate
overhours/days
overaprolongedperiod
Indications
obstruction
pulmonaryfluids
structuralchange
CHANGES IN COMPLIANCE (TAB. 1)
Age
Adult
Child(10yearsold)
Newborn
Compliance [ml/mbar]
50-100
approx.25
approx.2.5
TYPICAL VALUES (TAB. 2)
ResistanceWhen gas passes through a tube there will be a drop in pressure along the length of the tube which will depend on the tube’s dimensions (length and cross-section) and the properties of the gas (viscosity). The flow resistance R is expressed by the ratio of the pressure difference ΔP between the beginning and the end of the tube, and by the flow per unit time ΔV/Δt.

CO2-MEASUREMENT DURING VENTILATION | BASIC PRINCIPLES OF VENTILATION
If at a flow of 0.5 L/s (30 L/min) the pressure between the beginning and the end of the tube drops by 10 mbar, the resistance is equal to 20 mbar/L/s. In a healthy adult the bronchial flow resistance R is roughly 1 to 2 mbar/L/s, while a tracheal tube has a resistance of two or three times as much, depending on its size.
P1 P2
R
ΔP
Flow
D-4
680-
2011
Fig. 7:
Resistance R = pressure difference ΔP [mbar]
Flow ΔV [L] Δt [s]
In a ventilation system, the greatest resistance is created by the tube.
22|23
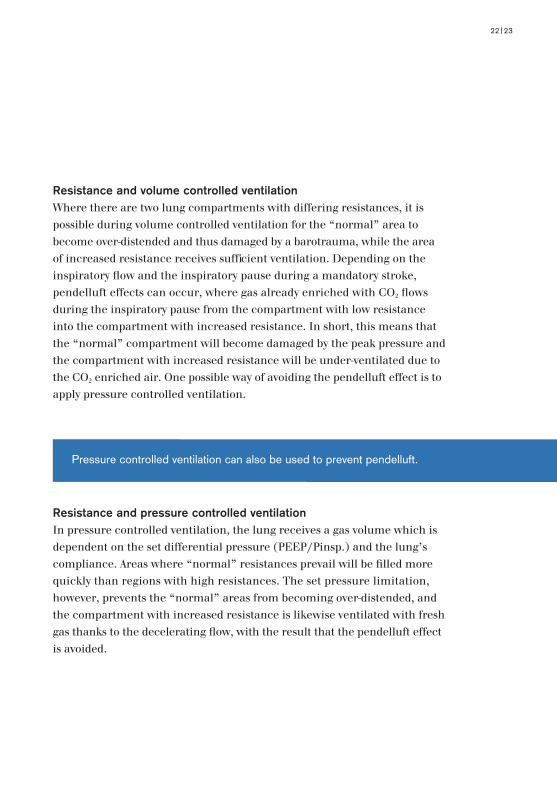
Resistance and volume controlled ventilationWhere there are two lung compartments with differing resistances, it is possible during volume controlled ventilation for the “normal” area to become over-distended and thus damaged by a barotrauma, while the area of increased resistance receives sufficient ventilation. Depending on the inspiratory flow and the inspiratory pause during a mandatory stroke, pendelluft effects can occur, where gas already enriched with CO2 flows during the inspiratory pause from the compartment with low resistance into the compartment with increased resistance. In short, this means that the “normal” compartment will become damaged by the peak pressure and the compartment with increased resistance will be under-ventilated due to the CO2 enriched air. One possible way of avoiding the pendelluft effect is to apply pressure controlled ventilation.
Resistance and pressure controlled ventilationIn pressure controlled ventilation, the lung receives a gas volume which is dependent on the set differential pressure (PEEP/Pinsp.) and the lung’s compliance. Areas where “normal” resistances prevail will be filled more quickly than regions with high resistances. The set pressure limitation, however, prevents the “normal” areas from becoming over-distended, and the compartment with increased resistance is likewise ventilated with fresh gas thanks to the decelerating flow, with the result that the pendelluft effect is avoided.
Pressure controlled ventilation can also be used to prevent pendelluft.

CO2-MEASUREMENT DURING VENTILATION | BASIC PRINCIPLES OF VENTILATION
Changes in resistanceReasons for an increase in airway resistance include constriction of the glottis (laryngospasm); repositioning of the tube on account of swollen mucous membranes; broncho spasm (asthma); foreign particles in the airways and excessive secretion. For ventilation practice this is significant in the sense that it requires careful monitoring of the ventilation process.
Dead space ventilationVentilation can be regarded as having two parts, one part being the volume in which optimal gas exchange has taken place (alveolar ventilation), and the other part being the volume in which no gas exchange has occurred (the physiological dead space).
The physiological dead space is the sum of the anatomical dead space plus the alveolar dead space. The portion of the tidal volume which does not take part in the gas exchange process at all is the anatomical dead space, while the alveolar dead space is the gas which reaches the ventilated yet not perfused alveoli. The lack of blood precludes any gas exchange in this region.
Anatomical dead spaceThe anatomical dead space is made up of the volumes of the conducting airways. These include the trachea, bronchi and bronchioles up to the point where they branch into the alveoli. The term “dead space” refers merely to the lack of opportunity for any exchange of breathing gases. In other ways the dead spaces fulfil important auxiliary functions for respiration. They not only
Age
Adult
Child(10yearsold)
Newborn
Tubus
Resistance [mbar/L/s]
1-2
approx.4
approx.25
approx. 5
NORMAL VALUES (TAB. 3)
24|25
help the ventilation process, but clean, humidify and warm the inspiratory air. In order to determine the dead space in a patient, 2.2 mL/kg body weight can be used as a basis for calculation, though in order to determine the ideal body weight any fatty tissue needs to be subtracted.
Physiological dead spacePhysiological dead space differs from anatomical dead space in that it includes (in addition to the conducting airways) the alveolar areas which are ventilated but not perfused. These alveoli, in which gas exchange cannot take place despite their being ventilated, exist in only small numbers in a person with healthy lungs. In a healthy person, therefore, the volumes of anatomical and physiological dead space are basically equal. It is a different matter in a patient suffering from certain lung function disorders in which not only ventilation but also perfusion is divided very unevenly over the lung. In such cases the physiological dead space may be much greater than the anatomical dead space.
To estimate the dead space ventilation, 2.2 mL/kg body weight excluding fat can be used as the basis for calculation.
CO2-MEASUREMENT DURING VENTILATION | BASIC PRINCIPLES OF VENTILATION
Gas exchange
Although the alveoli have elastic walls they do not have muscles and are thus unable to draw in and expel the breathing air of their own accord. They depend on the movements of the respiratory muscles of the thorax and diaphragm.
During inhalation the thorax is lifted by the intercostal muscles at the same time as the diaphragm is pushed down. The negative pressure that this generates increases the capacity of the lung, and air flows through the upper and lower airways into this enlarged area, diffusing into the blood through the alveolar walls.
In the blood the oxygen combines chemically with haemoglobin (red colour pigment) and forms oxyhaemoglobin (light red colour). This compound is only formed when the PaO2, in other words the oxygen concentration, is high enough. Air containing < 16 % oxygen is not sufficient.
When the oxyhaemoglobin reaches areas of low oxygen content the compound breaks up and oxygen is released to the cells. During exhalation the intercostal muscles relax and the thorax returns to its original position. This reduces the volume of the lungs and the air is forced out of the lungs. The carbon dioxide which is produced during oxidation in the cells is absorbed partly by haemo-globin but mainly by the minerals in the blood. The carbon dioxide diffuses through the walls of the alveoli and is exhaled back into the ambient air.
Thorax and diaphragm are a muscle substitute for the alveoli.
Haemoglobin is the transport medium for the oxygen and carbon dioxide molecules.

26|27
Roughly 10 to 15 respiratory cycles take place per minute in a normal person with healthy lungs.
1.4 THE CIRCULATION OF THE BLOODThe cardiovascular system transports oxygen to the tissue cells and removes surplus carbon dioxide from the cells. The flow of blood is kept at a constant level by the heart, and is composed of the systemic circulation and the pul-monary circulation. There is a total of around 5-7 L of blood in the human body.
Systemic circulationThe starting point of the systemic blood circulation system is the left ventricle. It is the job of the system circulation to supply the organs and tissues with oxygen-rich light red blood via the arteries, and to remove the dark red blood enriched with carbon dioxide through the veins. In addition, the systemic circulation is responsible for regulating body temperature.
Pulmonary circulationThis system transports carbon dioxide-enriched blood from the heart to the lungs via the pulmonary artery and oxygen-rich blood from the lungs to the heart through the pulmonary veins.
The blood circulation is a one-way street in the body with the heart as the driving force. Oxygen-enriched blood is transported to the cells and deoxygenated blood to the lungs.

CO2-MEASUREMENT DURING VENTILATION | BASIC PRINCIPLES OF VENTILATION
DistributionThe breathing gas is distributed throughout the different areas of the lung. It is important for the breathing gas to be evenly distributed and for pressure compensation to take place. The distribution of the breathing gas and the pressure compensation occur on the gas-conducting side, that is from the trachea and bronchi to the alveoli and alveolar areas Pressure compensation takes place whenever there are alveolar areas in the lung with differing flow conditions. The areas where low resistances prevail can then fill areas of high resistance with breathing gas - the pendelluft effect.
DiffusionThe process of gas exchange between alveoli and blood circulation is known as diffusion. This describes the transport of gas from an area of high concentration to an area of low concentration. The gas-permeable alveolar membrane sepa-rates the two systems. The surface area of the lungs is around 70 to 100 m2, and the thickness of the alveolar membrane is roughly 0.5 to 1 mm. In a healthy person, these dimensions enable free gas exchange of the breathing gases oxygen and carbon dioxide.
PerfusionPerfusion refers to the passage of blood through the capillaries of the lung, whereby CO2 is transported to the alveolar membrane and O2 which has diffused through the alveolar membrane is taken to the pulmonary veins. In a healthy person more or less all the blood supplied by the capillaries is available for diffusion with the alveolar gas. Only some 2 % of the blood is not enriched with oxygen (shunt).

28|29
Perfusion
Diffusion
Ventilation
CO2
CO2
O2 O2
D-4
681-
2011
Fig. 8:
CO2-MEASUREMENT DURING VENTILATION | BASIC PRINCIPLES OF VENTILATION
1.5 THE HEARTThe heart is the driving force behind the circulatory system. Its job is to pump blood through the body to even the most distant capillaries. It is comparable to a suction and pressure pump and is capable of triggering impulses of its own accord. At rest, the heart beats around 701/min., in other words the four cardiac cycles take place roughly every second - the contraction and expulsion phases (systole) and the relaxing and filling phases (diastole). The number of heart beats depends on the current oxygen consumption of the body and its organs, and is not consciously controlled.
Function of the heartThere are two phases of cardiac activity – the systole and the diastole.
SystoleContraction of the heart causing the blood to be pumped with great force into the arteries. In clinical practice the arterial blood pressure is a very important parameter as it can be determined quickly and easily and allows the current circulation situation to be assessed to some extent. In a healthy young person the systolic pressure is around 120 mmHg.
DiastoleThe period between two systoles, when the muscle of the heart relaxes and allows the chambers to fill with blood. Due to the fact that the arteries are elastic, the pressure during ventricular diastole does not drop to zero, but to around 80 mmHg in a healthy young person.

30|31
1.6 CONTROL OF RESPIRATIONRespiration can only be controlled consciously to a certain extent. It is possible to hold one’s breath for a short time, but then the compulsion to release the airways takes over. The ability to interrupt breathing has its limits and is subordinate to vital needs. These vital needs are controlled by the vegetative nervous system.
Respiration is controlled by the respiratory centre which is located in the brain stem (medulla oblongata). Respiratory nerves leave this central point and travel down through the spinal cord, then pass out of the spine and arrive at the various respiratory muscles. The respiratory centre transmits electrical impulses to the respiratory muscles, causing them to become active. It adapts the breathing mechanism to current requirements and thus has to be informed of current needs. When exertion increases, more oxygen is needed to produce energy, with the result that more carbon dioxide is generated and absorbed into the blood. This increased carbon dioxide content of the blood leads to faster impulse formation in the respiratory centre, and from here impulses are sent more frequently to the muscles.
The greater the exertion, the higher the oxygen demand. This demand is met by increased frequency and depth of breathing. Getting more oxygen into the lungs, however, is not in itself enough. The oxygen must also reach the cells more quickly, in other words the circulation of the blood must be increased, which is noticeable in an increased heart rate and higher blood pressure. There is a useful correlation between respiration and blood circulation which results from the chemical and nervous links between the two systems.
An increase in CO2 in the blood forms an impulse in the respiratory centre, thus triggering a breathing cycle.

CO2-MEASUREMENT DURING VENTILATION | DESIGN OF A VENTILATOR
Patient monitoring
CO2
(am Y-Stück = at the Y-piece)
Device monitoring
Breathing system with humidifier
Gas blender
Ventilator
O2 Air
ECGNIBPBGA SpO2
D-9
988-
2011
Fig. 9:
2. Design of a ventilator
2.1 THE MAIN COMPONENTS OF THE VENTILATION WORKPLACEGas blender:Responsible for the supply of oxygen
Ventilator:Ensures ventilation of the lungs
Breathing system with humidifier:Linking element between system and patient
Device monitoring:Recognition of technical and operational errors at the device
Patient monitoring:Monitoring the status of the patient
32|33
A ventilator consists of various different components which supplies the patient with a controlled gas concentration from a range of medical gases (which can be set for each individual patient). The tasks of the ventilation system are the same regardless of the mode of ventilation chosen and involve either ventilating the patient or supporting the patient’s own breathing, controlling the time scale for ventilation, length of breathing phase and conditioning of breathing gases. In addition, these functions are supervised by the device’s monitoring system. The highest priority is to counteract the patient’s respiratory insufficiency until the basic illness can be successfully
treated. The ventilator also has a significant therapy role, in that it helps to ensure adequate oxygenation of the lungs and removes CO2 from the alveoli in order to reinstate the surface area of the lung for gas exchange as well as restoring lung mechanics.
The main components of the ventilation workplace
CO2-MEASUREMENT DURING VENTILATION | DESIGN OF A VENTILATOR
2.2 DEVICE MONITORING
The goal of long term ventilation is to bring the non-physiological state of artificial respiration to an end as quickly as possible. Maintaining sponta-neous breathing, however weak it may be, remains the declared objective in the interests of earliest possible extubation. Allowing ventilator patients to breathe freely without any form of mandatory volume-constant ventilation, the ventilator merely supporting the patient’s own spontaneous breathing, demands a highly sensitive monitoring system. Immediate detection and warning of any interruption to ventilation or change in the patient’s situation could mean the difference between life and death. There are two systems which need to be monitored – the long term ventilator and the patient. Device monitoring encompasses inspiratory gas concentration measurement, inspiratory breathing gas temperature (when using an active humidifier), ventilation pressures and the expiratory volume. Of primary importance, therefore, is the monitoring of the gas quality and flow, and these functions should be integrated as standard in a ventilator. From the pressure and flow curves, determination of resistance and compliance, expiratory volume and pressure readings, conclusions can be drawn about the course of ventilation.
System Monitoring
Gasconcentration
Pressure
Volume
Temperature
Spontaneous breathing – irrespective of how weak it is – should always be supported.

34|35
2.3 PATIENT MONITORING
Adapting the ventilator and thus the setting of parameters require data which are provided by the patient monitoring system. This includes the ECG, blood pressure, oxygen saturation and CO2 content. These readings offer information about the cardiovascular system, gas exchange and degree of patient accep-tance of the machine. Although the CO2 measurement forms part of the patient monitoring, Dräger ventilators offer this parameter in their device monitoring systems. The advantage of this is obvious: the sensors are integrated in the hose system, the measured real time curve can be compared with the recorded pressure and flow curves and, in addition, the CO2 production and dead space volume can be determined. Already a standard feature in anaesthesia, we are gradually beginning to see CO2 monitoring become an integral part of the intensive care ventilator.
Patient Monitoring
Carbondioxide
O2Saturation
Non-invasivebloodpressure
Electrocardiogram
Patient monitoring helps us to assess the patient’s acceptance of the ventilator.

CO2-MEASUREMENT DURING VENTILATION | CO2-MONITORING
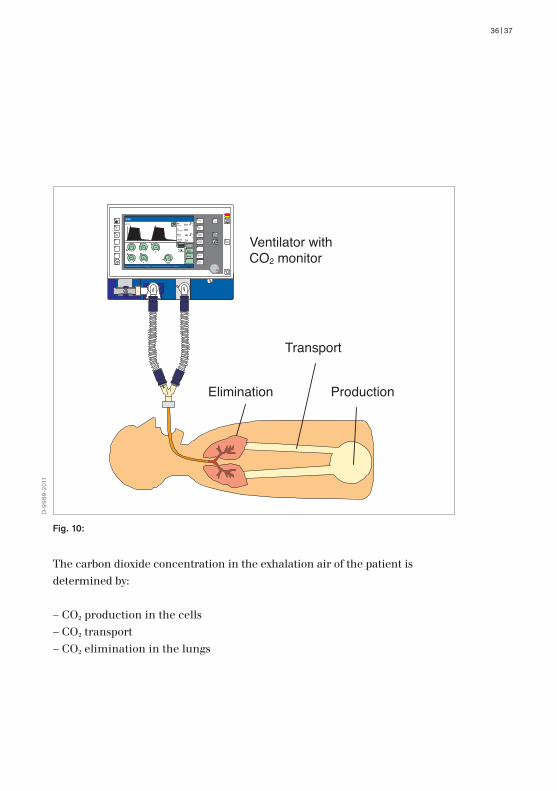
3.1 THE CO2 CHAINThe air we inhale contains oxygen. The gas mixture which is the ambient air flows through the upper and lower airways into the lung, enters the blood by diffusion and is transported to the cells by perfusion. The cells take energy from the oxygen and generate carbon dioxide as an end product. The CO2 chain thus begins in the cells where CO2 production takes place. The carbon dioxide is transported by the cardiovascular system and, by diffusing into the lung, is added to the expiration air and breathed out again. We can measure the CO2 concentration as an end product, and can read off this measured value as end-tidal CO2 and CO2 production on the monitor displays.
3. CO2 monitoring
The CO2 chain begins in the cells which take energy from the oxygen and generate CO2 as an end product.
36|37
Transport
ProductionElimination
100% O2
Insp.hold
Settings
Alarm-Limit
MeasuredValues
Calibration
Configu- ration
SpecialProcedures
ResetCheck
Stop
iP MV 6.8
128C
etCO2
FiO2
23
46
[L/min]
7.3
4.6
[mL/mbar]
[mmHg]
50
30[Vol.%]
IPPV
O2
Vt V
f Ti
PEEP
[mbar]
Seufzer23
B e a t m u n g s p a r a m e t e r v e r ä n d e r n : e n t s p r e c h e n d e s E l e m e n t a n w ä h l e n
IPPV
5
SIMV
BIPAP
CPAP
750 80
12 1,4
B a s i csettings
Exspiration
Ventilator with CO2 monitor
D-9
989-
2011
Fig. 10:
The carbon dioxide concentration in the exhalation air of the patient is determined by:
– CO2 production in the cells– CO2 transport– CO2 elimination in the lungs
CO2-MEASUREMENT DURING VENTILATION | CO2-MONITORING
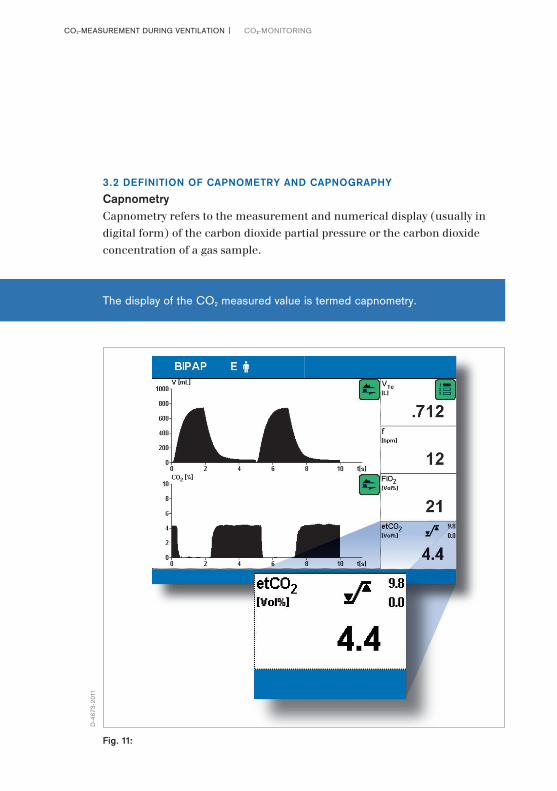
3.2 DEFINITION OF CAPNOMETRY AND CAPNOGRAPHYCapnometryCapnometry refers to the measurement and numerical display (usually in digital form) of the carbon dioxide partial pressure or the carbon dioxide concentration of a gas sample.
D-4
673-
2011
Fig. 11:
The display of the CO2 measured value is termed capnometry.
38|39
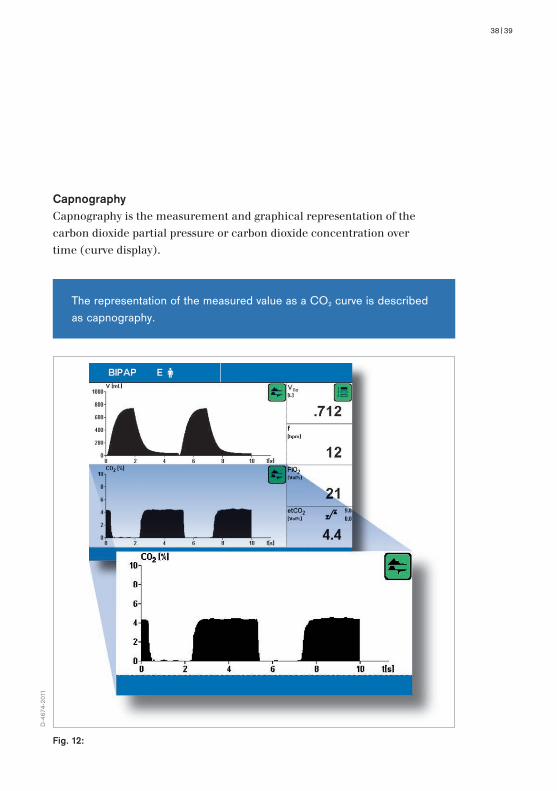
CapnographyCapnography is the measurement and graphical representation of the carbon dioxide partial pressure or carbon dioxide concentration over time (curve display).
D-4
674-
2011
Fig. 12:
The representation of the measured value as a CO2 curve is described as capnography.

CO2-MEASUREMENT DURING VENTILATION | CO2-MONITORING
3.3 MEASUREMENT PROCEDURESThere are currently two methods of measurement commonly used in clinical routine: infrared spectroscopy and mass spectroscopy. Of these methods, infrared spectroscopy is of greater significance. Sample gas is fed through an optical measurement bench and filtered at different wavelengths. From
the results, microprocessors calculate the measured values of the various gas components and display these values. Infrared spectroscopy is applied in two variants, the sidestream and mainstream measurements.
Sidestream measurementsA gas sample is taken continuously by a suction hose at the Y-piece, filter or tube, supplied to a monitoring instrument and then evaluated at the measurement bench mentioned above. One advantage of this system is that the sampling process involves only a small, unobtrusive connector which is fitted to the hose system at the patient. An argument against using this method in the intensive care ward, however, is that the measured values are displayed with a considerable time lag and hence cannot be compared as real time curves with the pressure and flow curves.
Mainstream measurementsA measurement cuvette is placed in the hose system between the Y-piece and the tube. The cuvette is a sterilizable measurement chamber to which a sensor is connected. The gas mixture is continuously evaluated and displayed on the Evita screen.
In sidestream methods of measurement the CO2 curve is always displayed after the pressure and flow curves.

40|41
Cuvette
Patient
CO2-Sensor
DRÄG
ER
100%
O2
Insp.
hold
Settings
Alarm-Limit
MeasuredValues
Calibration
Configu- ration
SpecialProcedures
Reset
Check
Stop
iP MV 6.8
128C
etCO2
FiO2 46
23
[L/min]
7.3
4.6
[mL/mbar]
[mmHg]
50
30[Vol.%]
IPPV
O2
Vt V
f Ti
PEEP
[mbar]
Seufzer23
B e a t m u n g s p a r a m e t e r v e r ä n d e r n : e n t s p r e c h e n d e s E l e m e n t a n w ä h l e n
IPPV
5
SIMV
BIPAP
CPAP
750 80
12 1,4
B a s i csettings
D-9
990-
2011
Fig. 13:
The drawbacks to this system, repeatedly cited in literature on the subject, such as an enlargement of the dead space and the weight of the sensor, are no longer a problem today in the age of minituraisation. The advantages outweigh the disadvantages in that real time measurement as compared to other measurement curves not only permits an accurate assessment of the patient’s current status, but also enables calculation of the CO2 production and the dead space.
The mainstream measurement is a real time method.
CO2-MEASUREMENT DURING VENTILATION | CO2-MONITORING
3.4 THE COMPOSITION OF THE AIRThe ambient air available for gas exchange in the human body contains the following gas concentrations:
– Oxygen O2 at 20.96 % by vol.– Carbon dioxide CO2 at 0.04 % by vol.– Nitrogen N2 at 78 % by vol.– Other inert gases at 1 % by vol.
The human body utilizes oxygen and generates carbon dioxide which is then exhaled in the expiration air. A person with healthy lungs produces around 5.6 % by volume CO2. Nitrogen and the other inert gases do not by nature form any compounds and are breathed out again in the same concentration as before.
Hence the composition of the exhaled air is as follows:
– Oxygen O2 at around 15.4 % by vol.– Carbon dioxide CO2 at around 5.6 % by vol.– Nitrogen N2 at 78 % by vol.– Other inert gases at 1 % by vol.
42|43
3.5 PARTIAL PRESSUREIn many applications the composition of a gas mixture is described using partial pressures. Since air is a mixture of gases, each component gas exerts its share of the overall pressure in relation to its share of the volume. The pressure which can be attributed to each gas as part of the overall pressure is termed the partial pressure. The unit of measurement currently used for pressure is mmHg (millimetres of mercury) or Pa (Pascal). The partial pressure of a gas mixture is calculated according to Dalton’s formula.
Ptotal = PO2 + PCO2 + PN2 + Pinert gases
The units of the pressures in mmHg, Pa or mbar have the following conversion factors:
1 mmHg = 1.33 mbar = 133 Pa = 0.133 kPa1 mbar = 100 Pa = 0.1 kPa = 0.75 mmHg1 kPa = 7.5 mmHg
A unit which was formerly used for mmHg is Torr (1 mmHg = 1 Torr).
In order to be able to convert a volume percentage share to its corresponding partial pressure requires measurement conditions which have been precisely defined in advance.
The pressure of a gas mixture is equivalent to the sum of the individual pressures.
CO2-MEASUREMENT DURING VENTILATION | CO2-MONITORING
3.6 VOLUME MEASUREMENT CONDITIONSThe volume of a particular quantity of gas depends on the pressure and on body temperature. In addition, the volume is also affected by the water vapour partial pressure. For this reason, measurements and indeed theoretical obser-vations always presuppose a precise knowledge of the volume measurement conditions. While the O2 absorption and CO2 production are given in relation to standard physical conditions, tidal volume and ventilation parameters are always stated in relation to the conditions prevailing at a given time in the body. Three volume measurement conditions have been agreed in respiratory physiology:
STPD (Standard Temperature, Pressure Dry)
Oxygen absorption and carbon dioxide production are used to describe the amounts of substances exchanged and tend to be based on normal physical conditions.
These conditions are as follows: a temperature of 0 °C; 760 mmHg (equiva-lent to 1013 mbar) air pressure, dry, i.e. 0 % humidity.
To convert the volume percentage to the partial pressure for STPD, the following calculation is used:
PGas = normal air pressure x gas volume [[% by vol.] 100%
Normal air pressure = 760 mmHg

44|45
ATPS (Ambient Temperature, Pressure Saturated)
The gas volumes are measured at the current barometer pressure and at room temperature in a water vapour saturated state.
BTPS (Body Temperature, Pressure Saturated)
These are statements about the lung volumes and flow rate, and are intended to indicate changes within the lungs or airways. Consequently, they are converted to reflect the conditions prevailing in the body. As a rule, the exhaled air of a human being has been warmed to normal body temperature (37°) and has a humidity level of 100 %. The pressure of the water vapour in a gas mixture is independent of the air pressure but does depend on the temperature. For instance, the water pressure vapour at body temperature (37°) is PH2O = 47 mmHg, which corresponds to a volume share of around 6.2 % by vol. (see also Table 4). To convert the volume percentage to the partial pressure for BTPS, the following calculation is used:
PGas = (barometer press./water vapour press.) x gas vol. [[% by vol.]
100%
Barometer pressure = variableWater vapour pressure = variable, see Table 4
PGas = (normal air press./water vapour press.) x gas share [[% by vol.]
100%
Normal air pressure = 760 mmHgWater vapour pressure = 47 mmHg
CO2-MEASUREMENT DURING VENTILATION | CO2-MONITORING
The calculation which is of interest in ventilation therapy is the assumption according to BTPS because the gas mixture delivered by the ventilator is generally conditioned using active humidifiers so that it is applied with an inspiratory temperature of around 35 to 37 °C and between 90 and 100 % humidity. The expired gas at 100 % humidity and 37 °C can be said to remain fairly constant and thus corresponds to the inspiratory condition.
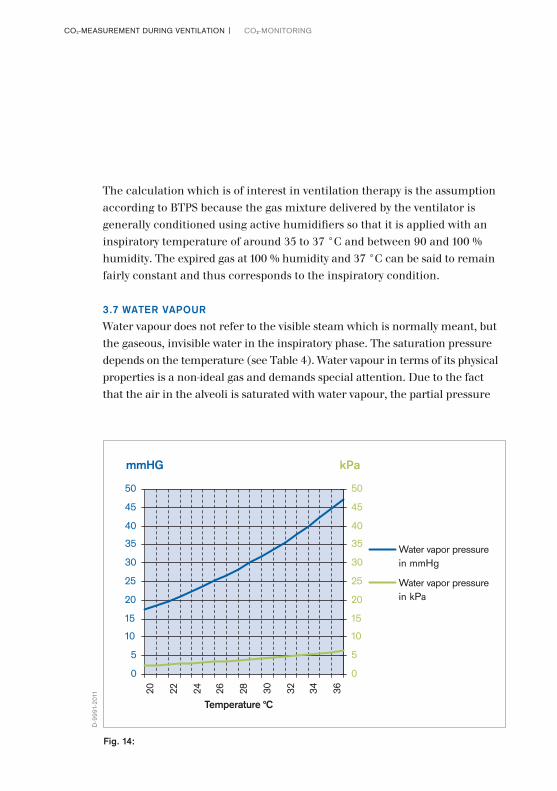
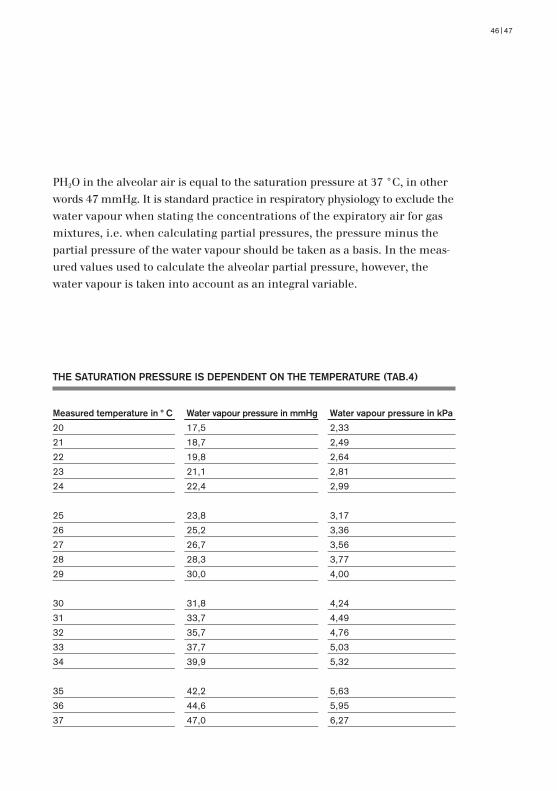
3.7 WATER VAPOURWater vapour does not refer to the visible steam which is normally meant, but the gaseous, invisible water in the inspiratory phase. The saturation pressure depends on the temperature (see Table 4). Water vapour in terms of its physical properties is a non-ideal gas and demands special attention. Due to the fact that the air in the alveoli is saturated with water vapour, the partial pressure
0
5
10
15
20
25
30
35
40
45
50
20 22 24 26 28 30 32 34 36
Temperature °C
0
5
10
15
20
25
30
35
40
45
50
Water vapor pressurein mmHg
Water vapor pressurein kPa
kPammHG
D-9
991-
2011
Fig. 14:
46|47
THE SATURATION PRESSURE IS DEPENDENT ON THE TEMPERATURE (TAB.4)
Measured temperature in ° C Water vapour pressure in mmHg Water vapour pressure in kPa
20 17,5 2,33
21 18,7 2,49
22 19,8 2,64
23 21,1 2,81
24 22,4 2,99
25 23,8 3,17
26 25,2 3,36
27 26,7 3,56
28 28,3 3,77
29 30,0 4,00
30 31,8 4,24
31 33,7 4,49
32 35,7 4,76
33 37,7 5,03
34 39,9 5,32
35 42,2 5,63
36 44,6 5,95
37 47,0 6,27
PH2O in the alveolar air is equal to the saturation pressure at 37 °C, in other words 47 mmHg. It is standard practice in respiratory physiology to exclude the water vapour when stating the concentrations of the expiratory air for gas mixtures, i.e. when calculating partial pressures, the pressure minus the partial pressure of the water vapour should be taken as a basis. In the meas-ured values used to calculate the alveolar partial pressure, however, the water vapour is taken into account as an integral variable.

CO2-MEASUREMENT DURING VENTILATION | CO2-MONITORING
ExampleIf the gas composition of the ambient air as stated above is used, the following values will result for the STPD conditions:
TABLE 5 FRESH AIR, DRY, 0°C
STPD O2 N2 CO2 inert gas ∑
Vol% 20,96 78 0,04 1 100
mmHg 159,3 592,8 0,3 7,6 760
This is the concentration of dry inspiratory air. In the lung, however, the air is enriched to saturation point with water and warmed to 37 °C (BTPS condition). At body temperature the volume share of water vapour is around 6.2 % by vol.
Under BTPS conditions, therefore, the conversion can be carried out as follows:
TABLE 6 FRESH AIR, MOIST, 37°C
BTPS1) O2 N2 CO2 inert gas H2O ∑
Vol% 20,96 78 0,04 1 0 100
mmHg 149,5 556,1 0,3 7,1 0 713
TABLE 7 EXPIRATORY AIR, MOIST, 37°C
BTPS1) O2 N2 CO2 inert gas ∑
Vol% 15,4 78 5,6 1 100
mmHg 109,8 556,1 40 7,1 713
In Tables 6 and 7, the water vapour was not listed as an integral part of gas concentration in % by vol., though it was taken into account with 47 mmHg when converting the partial pressures.
1) Water vapour partial pressure was not taken into consideration

48|49
It is a different matter when we look at the alveolar gas mixture. When the water proportion at 37 °C and 6.2 % by vol. is included in the calculation as part of the total gas mixture, the values change as follows:
TABLE 8 FRESH AIR, MOIST, 37°C
BTPS O2 N2 CO2 inert gas H2O ∑
Vol% 19,74 73,12 0,04 0,9 6,2 100
mmHg 150 556 0,3 6,7 47 760
TABLE 9 ALVEOLAR AIR, MOIST, 37°C
BTPS O2 N2 CO2 inert gas H2O ∑
Vol% 13,2 74,4 5,3 0,9 6,2 100
mmHg 100,3 566 40 6,7 47 760
The composition of the alveolar air differs from that of moist fresh air due to the fact that oxygen is constantly being taken out of it and carbon dioxide added. The respiratory quotient is generally lower than 1, i.e. more oxygen is removed from the alveolar air than carbon dioxide is added, resulting in greater enrichment with nitrogen as compared with the moist fresh air. The stated concentration values (partial pressures) can also be seen as monitoring values in the Evita ventilators.
The alveolar oxygen and carbon dioxide partial pressures are extremely important parameters in clinical routine (physiological values).
PAO2 ≈ 100 mmHgPACO2 ≈ 40 mmHg The alveolar partial pressures are primarily dependent on the degree of alveolar ventilation. Thus an increase in alveolar ventilation will result in a drop in PACO2 and a reduction in ventilation will bring about a rise in PACO2.
CO2-MEASUREMENT DURING VENTILATION | CO2-MONITORING
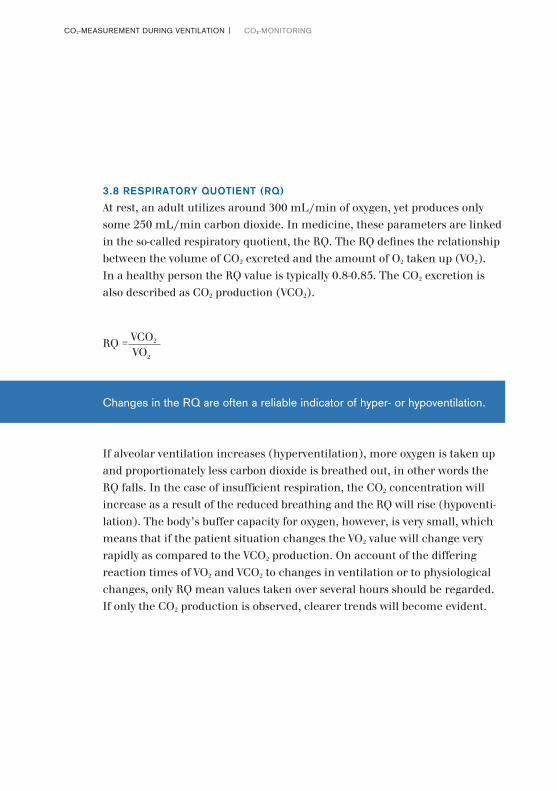
3.8 RESPIRATORY QUOTIENT (RQ)At rest, an adult utilizes around 300 mL/min of oxygen, yet produces only some 250 mL/min carbon dioxide. In medicine, these parameters are linked in the so-called respiratory quotient, the RQ. The RQ defines the relationship between the volume of CO2 excreted and the amount of O2 taken up (VO2). In a healthy person the RQ value is typically 0.8-0.85. The CO2 excretion is also described as CO2 production (VCO2).
If alveolar ventilation increases (hyperventilation), more oxygen is taken up and proportionately less carbon dioxide is breathed out, in other words the RQ falls. In the case of insufficient respiration, the CO2 concentration will increase as a result of the reduced breathing and the RQ will rise (hypoventi-lation). The body’s buffer capacity for oxygen, however, is very small, which means that if the patient situation changes the VO2 value will change very rapidly as compared to the VCO2 production. On account of the differing reaction times of VO2 and VCO2 to changes in ventilation or to physiological changes, only RQ mean values taken over several hours should be regarded. If only the CO2 production is observed, clearer trends will become evident.
RQ = VCO2 VO2
Changes in the RQ are often a reliable indicator of hyper- or hypoventilation.
50|51
3.9 CO2 PRODUCTION (VCO2)The aim of ventilation is to provide the patient with a supply of oxygen sufficient for his particular condition and remove the carbon dioxide generated. The latter can be monitored by means of continuous CO2 measurement. Since this parameter is primarily of interest in intubated patients, it is useful to have a CO2 monitoring system integrated in the ventilator.
It is also possible to gain more detailed information about ventilation, metab-olism and nutrition by observing additional parameters which can be derived from the breathing gas concentrations and the flow, such as the dead space and CO2 production.
The human body needs energy for life and we get this energy from the food we eat. However, these substances first have to be converted into energy before they can be used, and the body uses oxygen to catabolize the foodstuffs, thereby releasing CO2. The energy released during this process is continuously made available to the body in chemical form as ATP (adenosine triphosphate) and is then reconverted in the cells into mechanical work, heat or transport processes. The CO2 which is produced diffuses out of the cells into the blood and is exhaled via the lungs. A further by-product of this process is water. The most simple form of metabolism is the oxidation (combustion) of carbohydrates such as glucose:
C6H12O6 + 6 O2 −−> 6 H2O + 6 CO2 + energy
The same amount of oxygen is consumed as carbon dioxide is formed.
The CO2 breathing gas concentration and the flow can be used to gain useful information about ventilation, metabolism and nutrition.
CO2-MEASUREMENT DURING VENTILATION | CO2-MONITORING
Our physical capabilities change proportionately to changes in our metabolism. Hence the maximum oxygen uptake VO2 at the end of strenuous work represents a criterion for and measure of the body’s functional capacity. If on the other hand we want to assess the effects of physical exertion on a patient, the energy consumption (represented by VCO2) should be measured during the course of the activity. One example of this is shock. When in shock, the patient’s energy consumption drops to below normal levels. The blood supply to peripheral regions of the body is inadequate and an oxygen deficit can be observed. If the blood circulation increases again once the shock condition has receded, the energy consumption will also rise. Monitoring energy consumption thus permits an assessment of the state of shock.
Other reasons for an increase in CO2 production could include hyperthermia, pain, increased muscle tone, or the wake-up phase.
The CO2 production VCO2 is a measure of the physical stress on a patient.
52|53
3.10 DETERMINATION OF THE DEAD SPACE (VDS)
The expiratory tidal volume is composed of two volumes: the gas from the dead space and the gas from the alveolar area. An expiratory volume sensor will always record both these volumes and display them as one reading. This does not provide the user with the essential information about how much of the expiratory volume has taken part in gas exchange. However, by processing both real time measuring signals (volume and CO2), it is possible to calculate the dead space with a high degree of accuracy. A relative increase in dead space points to a rise in respiratory insufficiency and can be regarded as an indicator of the current patient situation. Patients suffering from fever or with high dead space values are at particular risk if the muscles then also show signs of fatigue.
Monitoring the dead space Vds reflects the current patient situation and indicates respiratory insufficiency.
CO2-MEASUREMENT DURING VENTILATION | CO2-MONITORING
3.11 THE DIFFERENCE BETWEEN PACO2, PaCO2 AND ETCO2
The last point of measurement before the next inspiration begins and the CO2 curve drops to zero is described as the end-tidal CO2 value (etCO2). If a plateau has formed on the curve then it can be assumed that the measured concentration will correspond to the alveolar CO2 reading (PACO2). The PaCO2 generally differs from the PACO2 by 2-3 mmHg on account of an arteriovenous admixture. The PaCO2 value, recorded by means of a blood gas analysis, is thus somewhat higher than the PACO2 value measured in the breathing gas flow during expiration.
The CO2 values from the BGA usually differ by 2-3 mmHg from the values measured in the breathing gas due to arteriovenous admixture.

54|55
Alveolar PACO2=40 mmHg
PACO2=40 mmHg
PaCO2=42 mmHg(with venous admixture)
PvCO2=46 mmHg
Arterial blood
Venousblood
CO2 O2
D-9
992-
2011
Fig. 15:
PACO2: alveolar CO2 concentrationPaCO2: arterial CO2 concentrationPvCO2: venous CO2 concentration

CO2-MEASUREMENT DURING VENTILATION | CO2-MONITORING
3.12 THE PHYSIOLOGICAL CAPNOGRAM
A – B: Emptying of the upper dead space of the airways. The CO2 concentration in this section of the curve equals zero, as this is the first phase of expiration during which air from the upper airways, which has not been involved in the process of gas exchange, is analysed.
B – C: Gas from the lower dead space and alveoli. The CO2 concentration increases continuously, as the air being analysed comes partly from the upper airways and partly from the alveoli which are rich in CO2.
C - D: Alveolar gas This phase is described as the “alveolar plateau”. The curve rises very slowly. The air being analysed comes mainly from the alveolar area.
D: End-tidal CO2 partial pressure Represents the highest possible concentration of exhaled CO2 and is reached at the end of expiration. This point is described as end-tidal CO2 (etCO2) and represents the final portion of air which was involved in the exchange of gases in the alveolar area. It thus represents under certain conditions a reliable index of CO2 partial pressure in the arterial blood.
D – E: Inspiration The CO2 concentration falls rapidly, as fresh gas not containing CO2 forces its way into the airways at the beginning of inspiration.

56|57
Paw
t
t
Flow
t
PCO2
CD
BA E
D-4
687-
2011
Fig. 16:
CO2-MEASUREMENT DURING VENTILATION | BASIC PRINCIPLES OF CO2
VF
T
E FI
CV
CaQ
VO2 VCO2
D-4
688-
2011
Fig. 17:
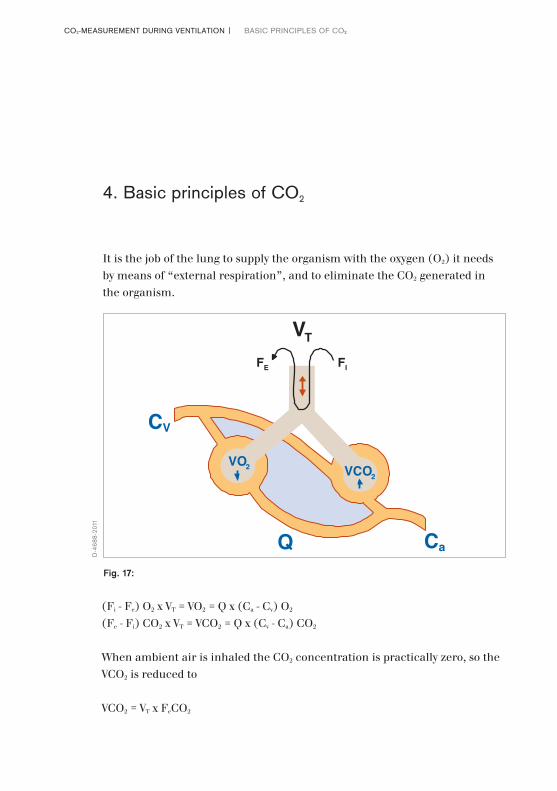
(Fi - Fe) O2 x VT = VO2 = Q x (Ca - Cv) O2
(Fe - Fi) CO2 x VT = VCO2 = Q x (Cv - Ca) CO2
When ambient air is inhaled the CO2 concentration is practically zero, so the VCO2 is reduced to
VCO2 = VT x FeCO2
It is the job of the lung to supply the organism with the oxygen (O2) it needs by means of “external respiration”, and to eliminate the CO2 generated in the organism.
4. Basic principles of CO2
58|59
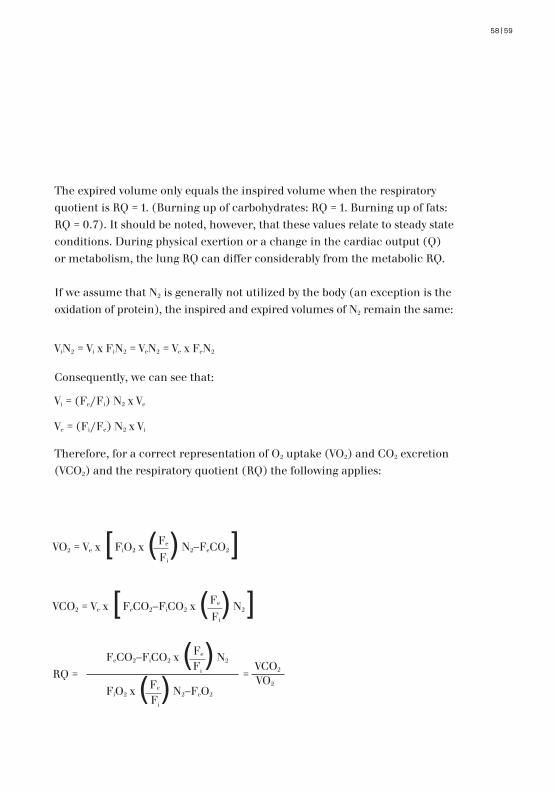
The expired volume only equals the inspired volume when the respiratory quotient is RQ = 1. (Burning up of carbohydrates: RQ = 1. Burning up of fats: RQ = 0.7). It should be noted, however, that these values relate to steady state conditions. During physical exertion or a change in the cardiac output (Q) or metabolism, the lung RQ can differ considerably from the metabolic RQ.
If we assume that N2 is generally not utilized by the body (an exception is the oxidation of protein), the inspired and expired volumes of N2 remain the same:
ViN2 = Vi x FiN2 = VeN2 = Ve x FeN2
Consequently, we can see that:
Vi = (Fe/Fi) N2 x Ve
Ve = (Fi/Fe) N2 x Vi
Therefore, for a correct representation of O2 uptake (VO2) and CO2 excretion (VCO2) and the respiratory quotient (RQ) the following applies:
VO2 = Ve x [FiO2 x (Fe)N2–FeCO2] Fi
VCO2 = Ve x [FeCO2–FiCO2 x (Fe)N2] Fi
RQ = = VCO2
VO2
FeCO2–FiCO2 x (Fe)N2
Fi
FiO2 x (Fe)N2–FeO2
Fi
CO2-MEASUREMENT DURING VENTILATION | BASIC PRINCIPLES OF CO2
If this “nitrogen correction” is not made, the result of calculating the oxygen consumption (VO2) will be a few percent too low in the case of ambient air respiration and normal RQ. Since the inspiratory CO2 concentration is negligible during ambient air respiration it is not necessary to undertake the nitrogen correction when calculating CO2 excretion.
If we succeed in measuring all the parameters relevant to the calculation, it will be possible to use the Fick principle to determine the pulmonary perfusion Q from the VO2 and VCO2 in combination with an analysis of the arteriovenous admixture.
In order to determine the volume sizes (V), we must have the same volume measurement conditions in each case.
ATPS = Ambient Temperature, Pressure, SaturatedBTPS = Body Temperature, Pressure, SaturatedSTPD = Standard Temperature, Pressure, Dry
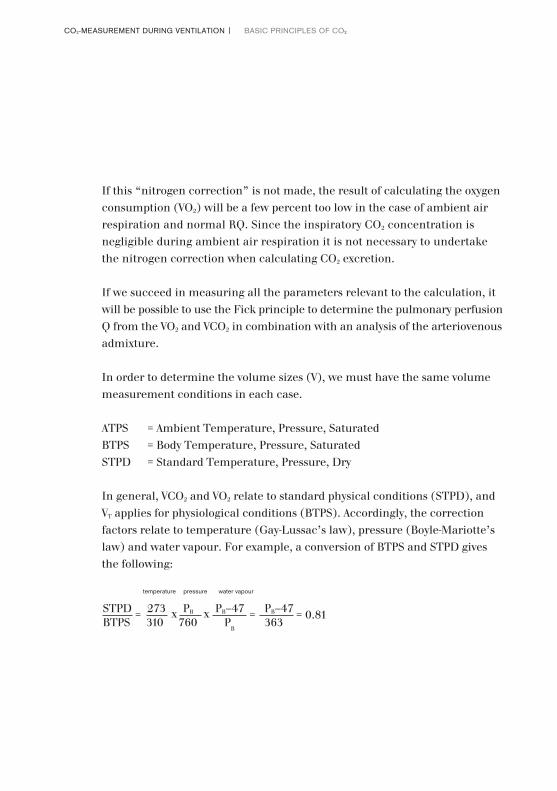
In general, VCO2 and VO2 relate to standard physical conditions (STPD), and VT applies for physiological conditions (BTPS). Accordingly, the correction factors relate to temperature (Gay-Lussac’s law), pressure (Boyle-Mariotte’s law) and water vapour. For example, a conversion of BTPS and STPD gives the following:
STPD = 273 x PB x PB–47 = PB–47 = 0.81
BTPS 310 760 PB 363
temperature pressure water vapour

60|61
As stated above, the VO2 and VCO2 must be the same under steady state conditions on both the ventilation and the perfusion sides. The VO2 taken up by the cardiovascular system from the lung corresponds to the volume removed by the blood:
VO2 = Q x (Ca - Cv) O2
and vice versa for the excreted CO2 volume VCO2
VCO2 = Q x (Cv - Ca) CO2
In order to determine Q using the Fick principle it is thus only necessary to determine the O2 or CO2 differences by means of arteriovenous oxygen or mixed-venous CO2 blood gas analysis. Using CO2 to calculate Q (cardiac output) is less suitable on account of difficult measurement conditions (Henderson- Hasselbalch equation). If all the parameters are available with a sufficient degree of accuracy, the global ventilation-perfusion ratio (VA/Q) can be determined, changes in perfusion during oxygen uptake VO2 and CO2 production (VCO2) can be estimated, and relative changes during the course of therapy can be documented.
CO2-MEASUREMENT DURING VENTILATION | BASIC PRINCIPLES OF CO2
PCO2
1.
2. 4.
3. et
D-4
689-
2011
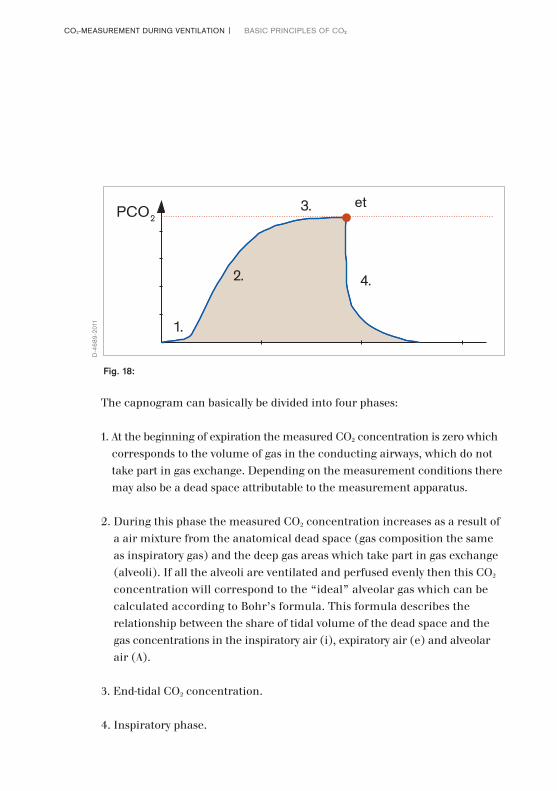
Fig. 18:
The capnogram can basically be divided into four phases:
1. At the beginning of expiration the measured CO2 concentration is zero which corresponds to the volume of gas in the conducting airways, which do not take part in gas exchange. Depending on the measurement conditions there may also be a dead space attributable to the measurement apparatus.
2. During this phase the measured CO2 concentration increases as a result of a air mixture from the anatomical dead space (gas composition the same as inspiratory gas) and the deep gas areas which take part in gas exchange (alveoli). If all the alveoli are ventilated and perfused evenly then this CO2 concentration will correspond to the “ideal” alveolar gas which can be calculated according to Bohr’s formula. This formula describes the relationship between the share of tidal volume of the dead space and the gas concentrations in the inspiratory air (i), expiratory air (e) and alveolar air (A).
3. End-tidal CO2 concentration.
4. Inspiratory phase.
62|63
Since the following applies for O2
O2: Fi > Fe > FA
and for CO2
CO2: FA > Fe > Fi
it is useful to transpose Bohr’s formula as follows:
This permits calculation of the dead space Vds from VT, Fi, Fe and FA, and the alveolar gas concentration FA from VT, Vds, Fi and Fe.
On account of the fact that the alveolar air can vary in terms of space or time, it has proven useful to calculate a so-called “effective” or “ideal” alveolar air. The expiratory gas is a mixture of alveolar air and inspiratory air, and consequently the following applies:
and based on PAO2 we arrive at the following result:
(Fe–Fi)CO2 = (FA–Fi)CO2 = (PA–Pi)CO2 (Fi–Fe)O2 (Fi–FA)O2 (Pi–PA)O2
PACO2 = PiO2 – (Fi–Fe)O2 x (PACO2 – PiCO2)
(Fe–Fi)CO2
Vds = (Fe–FA)O2 = (FA–Fe)CO2
VT
Fi–FA
FA
CO2-MEASUREMENT DURING VENTILATION | BASIC PRINCIPLES OF CO2
As the ratio of CO2 excretion to O2 uptake is described as the respiratory quotient (RQ), we can see that:
and hence
If at the same time the PiCO2 is regarded as negligible, the alveolar gas equation can be simplified as follows:
PACO2 = (PiO2–PAO2) x RQ
Furthermore, if it is assumed that variations in the gas compo-sition of the alveolar air affect CO2 exchange only to a limited extent then, somewhat simplified, the arterial CO2 pressure can be said to be equivalent to the alveolar CO2 pressure, which gives the following when describing the “effective” or “ideal” alveolar gas pressures:
PAiCO2 = (PiO2–PAiO2) x RQ
RQ = VCO2 = (Fe–Fi)CO2 VO2 (Fi–Fe)O2
PAO2 = PiO2 – 1 x (PACO2 – PiCO2)
RQ
PAO2 = PiO2 – 1 x PACO2
RQ
PAiO2 = PiO2 – 1 x PACO2
RQ
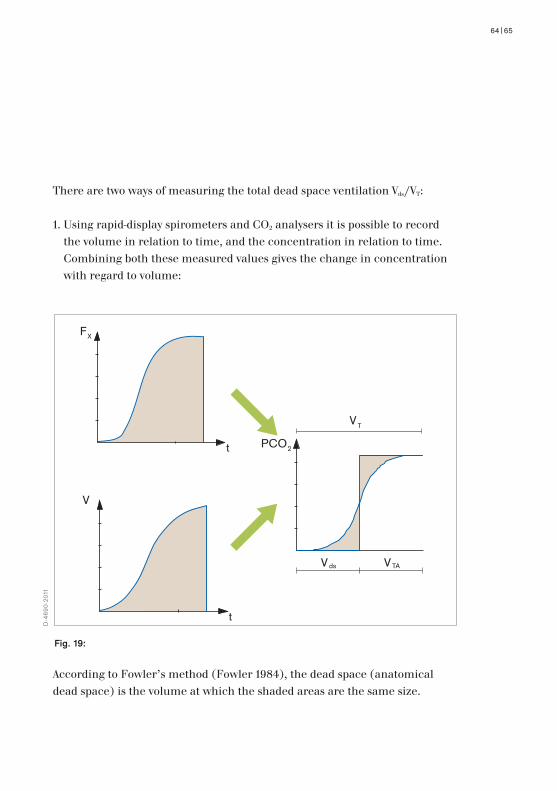
There are two ways of measuring the total dead space ventilation Vds/VT:
1. Using rapid-display spirometers and CO2 analysers it is possible to record the volume in relation to time, and the concentration in relation to time. Combining both these measured values gives the change in concentration with regard to volume:
According to Fowler’s method (Fowler 1984), the dead space (anatomical dead space) is the volume at which the shaded areas are the same size.
64|65
PCO2
VT
Vds VTA
FX
t
V
t
D-4
690-
2011
Fig. 19:

CO2-MEASUREMENT DURING VENTILATION | BASIC PRINCIPLES OF CO2
2. If the expiratory gas is collected in a Douglas bag, the mean expiratory CO2 concentration can be measured and used in the Bohr formula. In the same way, the expiratory gas can be channelled through a mixing chamber in which the concentration evens out, providing a mixed expiratory concen-tration. If the end-expiratory (end-tidal) CO2 concentration is used to calculate the dead space this will give the anatomical dead space Vds ana in accordance with Bohr’s formula. If however the “ideal” alveolar CO2 concentration is taken as the basis for calculating the dead space, the result will be the “physiological” or “effective” dead space Vds eff. In a normal, healthy patient, the alveolar dead space (the parallel dead space in contrast to the serial anatomical dead space) is small enough to be negligible in clinical terms. Nevertheless, in the case of pathological conditions (e.g. anaesthesia, pulmonary disorders, haemorrhagic shock), a clear distinction should be made between the anatomical (serial) and the alveolar (parallel) dead space, as well as between the end-expiratory (end-tidal) and the “ideal”.

66|67
Greatly simplified, the different relationships can be represented as follows:
Vds = PCO2 et–PeCO2 VT ana PCO2 et–PiCO2
Vds = PaCO2–PCO2 et VT alv PaCO2–PiCO2
Vds eff = Vds ana + Vds alv
PaCO 2
t
Pet = Pa = PA
Pet < Pa
Pe < Pa
D-4
691-
2011
Fig. 20:

CO2-MEASUREMENT DURING VENTILATION | INTERPRETING CAPNOGRAMS
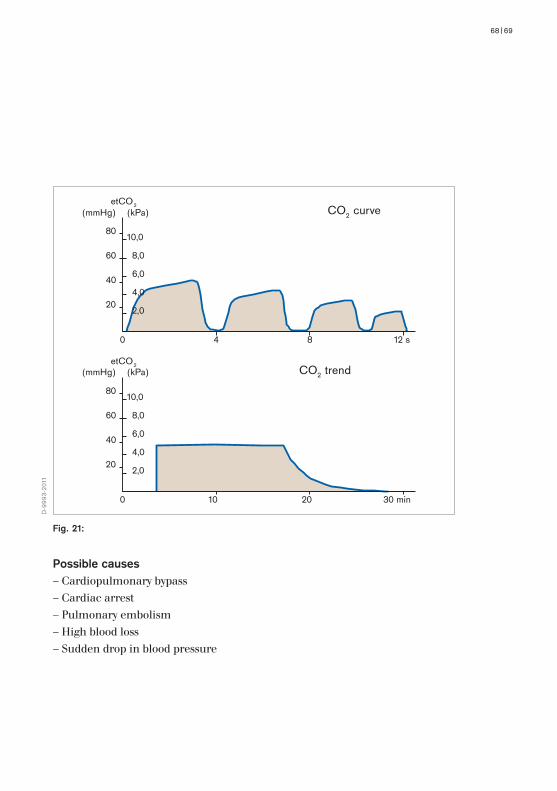
5.1 EXPONENTIAL DROP IN PCO2
The ventilation/perfusion ratio (VA/Q) extends from 0 (total shunt) right up to ∞ (total dead space ventilation). In cases when there is no longer any perfusion (Q = 0 due to circulatory failure, total bypass during systemic perfusion with heart lung machine, riding embolus with complete obstruction of a. pulmonalis), then no gas exchange will take place in the alveoli. If alve-olar ventilation (VA) continues, the alveolar volume (VA = FRC = Functional Residual Capacity) will be flushed out and the alveolar gas concentration will adjust to equal the inspiratory gas concentration:
PiO2 = FiO2 x (PB - PH2O), which PiCO2 = 0
The development over time is independent of the time constant T. This time constant as a numerical value describes the speed of the washing in and washing out processes, in this case
In 1 T, therefore, 63 % of the volume (FRC) is flushed out, in 2 T it will be 86.5 % and in 3 T as much as 95 %. ausgewaschen.
If the alveolar perfusion (QVA) is not quite zero, as in the case of a sudden massive volume deficiency, the result - if ventilation remains constant - will be relatively severe hyperventilation with a rapid exponential drop in the end-tidal PCO2 without the zero line being reached.
5. Interpreting capnograms
T = FRC VA
68|69
20
6,0
8,0
10,0
40
60
80
4 8 12 s
(mmHg) (kPa)etCO2
CO2 curve
0
4,0
2,0
202,0
4,0
6,0
8,0
10,0
40
60
80
10 20 30 min
(mmHg) (kPa)etCO2
CO2 trend
0
D-9
993-
2011
Fig. 21:
Possible causes– Cardiopulmonary bypass– Cardiac arrest– Pulmonary embolism– High blood loss– Sudden drop in blood pressure

CO2-MEASUREMENT DURING VENTILATION | INTERPRETING CAPNOGRAMS
5.2 A CONSTANT REDUCED PCO2
In this context we must make a distinction between spontaneous breathing and ventilation.
1. Ventilation When the MV (minute volume = 0 VT x f) remains constant and consequently the VA is constant, then relatively severe hyperventilation will result if there is reduced perfusion Q. The VA/Q ratio is > 1. This hyperventilation can also be observed if the CO2 production in the peripheral circulation decreases under conditions of constant perfusion Q (hypothermia), or if large perfusion areas are excluded from circulation (ischaemia e.g. of the aorta).
2. Spontaneous breathing Under normal conditions, normoventilation (end-tidal PCO2 = 40 mmHg) will prevail if the acid-base balance is properly regulated. If the respiratory system attempts to compensate for metabolic acidosis (e.g. in shock), larger amounts of CO2 will have to be exhaled in order to enable partial compen-sation of the pH value. The result is hyperventilation (end-tidal PCO2 < 40 mmHg). Hyperventilation (respiratory alkalosis with increase in pH value) can be seen when inspiratory efforts increase due to an oxygen deficiency resulting from an oxygenation disorder in the lung (e.g. large shunt areas) or in the case of a hyperventilation syndrome triggered psychogenically.

70|71
202,0
4,0
6,0
8,0
10,0
40
60
80
4
(mmHg) (kPa)etCO2
0
202,0
4,0
6,0
8,0
10,0
40
60
80
10
(mmHg) (kPa)etCO2
0
8 12 s
CO2 curve
20 30 min
CO2 trend
D-9
994-
2011
Fig. 22:
Possible causes– Hyperventilation as a result of high minute volume– Low body temperature

CO2-MEASUREMENT DURING VENTILATION | INTERPRETING CAPNOGRAMS
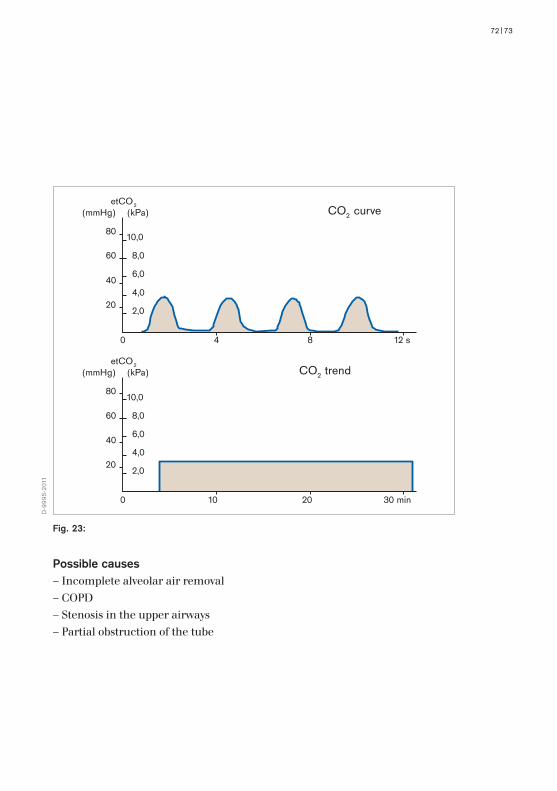
5.3 EVENLY LOW PCO2 WITHOUT PLATEAU FOLLOWING SHOCKAn end-tidal PCO2 which remains at an evenly low level without any particular plateau formation indicates that no pure alveolar concentrations can be measured, but instead mixed air components consisting of alveolar air, anatomical and alveolar dead space are present.
The reasons for this are high frequency breathing with small tidal volumes (VT), in other words increased dead space ventilation, residual relaxation at the end of anaesthesia, and possibly exacerbated by high external resistances in the circle system. Increased resistances can also be caused by secretion or stenosis in the ventilation system including the tube (e.g. cuff hernia) when the patient is repositioned.
72|73
202,0
4,0
6,0
8,0
10,0
40
60
80
4 8 12 s
(mmHg) (kPa)etCO2
CO2 curve
0
202,0
4,0
6,0
8,0
10,0
40
60
80
10 20 30 min
(mmHg) (kPa)etCO2
CO2 trend
0
D-9
995-
2011
Fig. 23:
Possible causes– Incomplete alveolar air removal– COPD– Stenosis in the upper airways– Partial obstruction of the tube
CO2-MEASUREMENT DURING VENTILATION | INTERPRETING CAPNOGRAMS
5.4 SUDDEN DROP OF PCO2 TO AROUND ZEROA sudden drop of the PCO2 to roughly zero indicates that no alveolar air can be measured during expiration. The small variations in concentration which are recorded indicate that there are still minimal concentration variations at the point of measurement, i.e. that a small volume containing a CO2 concentration of zero is reaching the measuring point during the inspiratory phase. The subsequent expiration contains only a small amount of gas mixture from the tube or upper trachea. This constitutes a dangerous situation and the ventilation system should be immediately checked (for obstructions or disconnection).

74|75
202,0
4,0
6,0
8,0
10,0
40
60
80
4
(mmHg) (kPa)etCO2
0
202,0
4,0
6,0
8,0
10,0
40
60
80
10
(mmHg) (kPa)etCO2
0
8 12 s
CO2 curve
20 30 min
CO2 trend
D-9
996-
2011
Fig. 24:
Possible causes– Accidental extubation– Complete obstruction of the airways– Disconnection– Oesophageal intubation (drop after 1-2 tidal volumes)

CO2-MEASUREMENT DURING VENTILATION | INTERPRETING CAPNOGRAMS
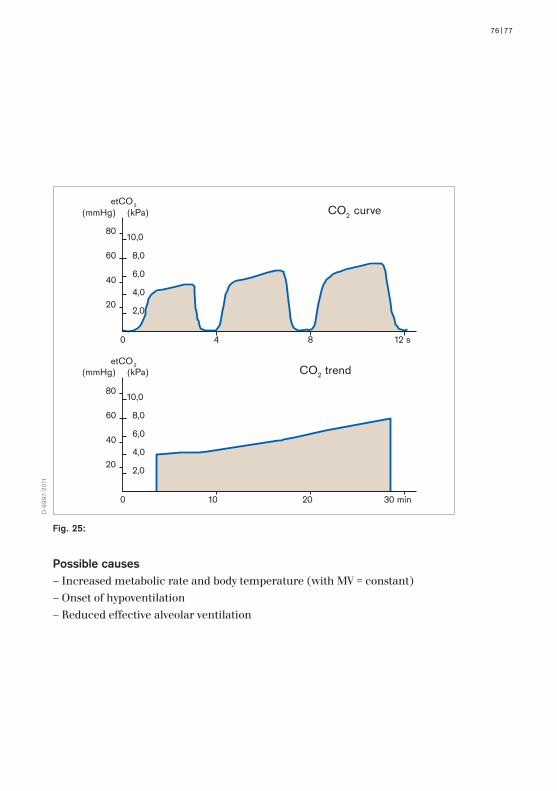
5.5 GRADUAL INCREASE IN PCO2
By definition, an end-tidal increase in PCO2 is an indication of hypoventilation. The alveolar ventilation (VA) is not matched to the pulmonary perfusion (Q). Once again, a distinction needs to be made between a spontaneously breathing patient and a ventilated patient.
1. Spontaneous breathing If the curve is normal (no dead space ventilation) it can be assumed that the CO2 response curve has shifted due to a central respiratory depression (anaesthetics, opiates). In addition to this central depression, however, this is also an indication of insufficient respiration, either due to residual relaxation at the end of anaesthesia or muscle fatigue after long term ventilation, or due to myasthenia gravis.
2. Ventilation If the CO2 rises during controlled ventilation then we also have hypoventila-tion (VA) in relation to the perfusion (Q) or increased CO2 production in the organism (faster metabolism with increased temperature, malignant hyperthermia, high glucose content in the parenteral feeding, CO2 insufflation during abdominal laparoscopy).
76|77
204,0
6,0
8,0
10,0
40
60
80
4 8 12 s
(mmHg) (kPa)etCO2
CO2 curve
0
2,0
202,0
4,0
6,0
8,0
10,0
40
60
80
10 20 30 min
(mmHg) (kPa)etCO2
CO2 trend
0
D-9
997-
2011
Fig. 25:
Possible causes– Increased metabolic rate and body temperature (with MV = constant)– Onset of hypoventilation– Reduced effective alveolar ventilation
CO2-MEASUREMENT DURING VENTILATION | INTERPRETING CAPNOGRAMS
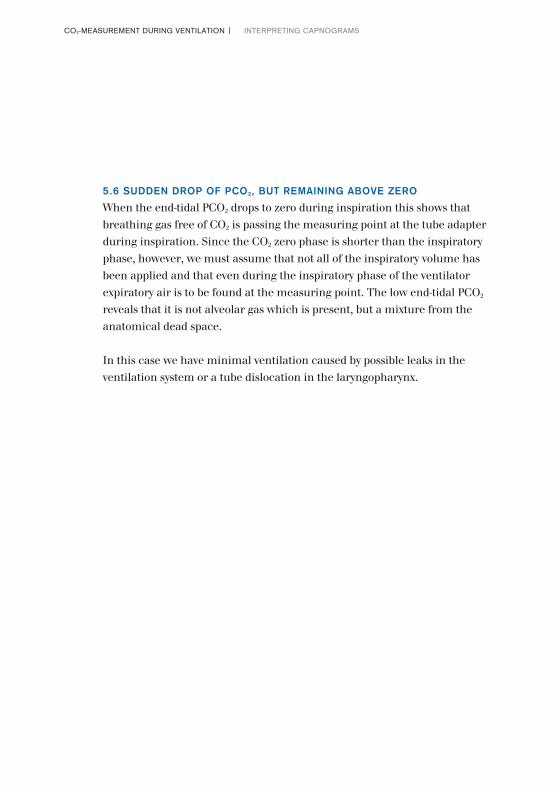
5.6 SUDDEN DROP OF PCO2, BUT REMAINING ABOVE ZEROWhen the end-tidal PCO2 drops to zero during inspiration this shows that breathing gas free of CO2 is passing the measuring point at the tube adapter during inspiration. Since the CO2 zero phase is shorter than the inspiratory phase, however, we must assume that not all of the inspiratory volume has been applied and that even during the inspiratory phase of the ventilator expiratory air is to be found at the measuring point. The low end-tidal PCO2 reveals that it is not alveolar gas which is present, but a mixture from the anatomical dead space.
In this case we have minimal ventilation caused by possible leaks in the ventilation system or a tube dislocation in the laryngopharynx.
78|79
202,0
4,0
6,0
8,0
10,0
40
60
80
4
(mmHg) (kPa)etCO2
0
202,0
4,0
6,0
8,0
10,0
40
60
80
10
(mmHg) (kPa)etCO2
0
8 12 s
CO2 curve
20 30 min
CO2 trend
D-9
998-
2011
Fig. 26:
Possible causes– Leaks in the hose system (tube)– Partial airway stenosis– Tube in laryngopharynx

CO2-MEASUREMENT DURING VENTILATION | INTERPRETING CAPNOGRAMS
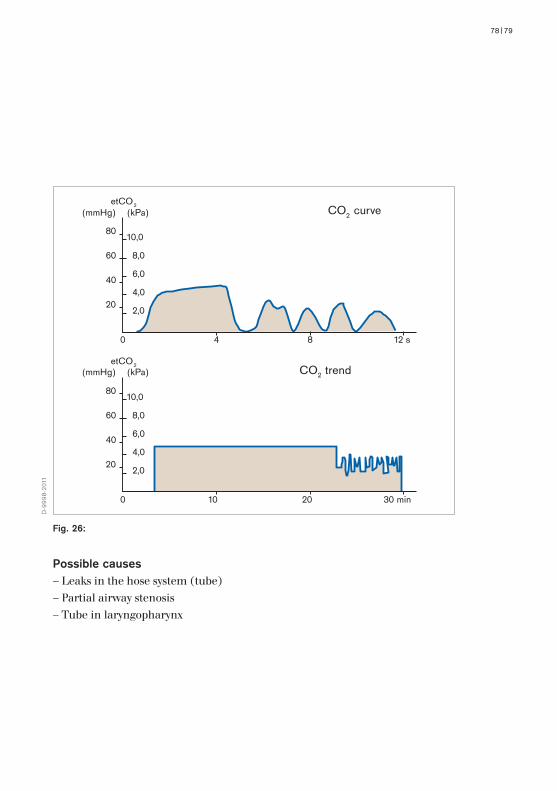
5.7 SLOPING PCO2 PLATEAUIf the expiratory CO2 plateau continues to rise to an excessive extent, this indicates a non-homogeneous emptying of the alveoli due to non-homogeneous distribution of the local ventilation/perfusion ratio with asynchronous emptying of the alveoli, as a result of differing time constants in different alveolar regions.
Generally speaking, the end-tidal PCO2 does not correspond to the PaCO2, but is lower and indicates an alveolar dead space ventilation.
80|81
204,0
6,0
8,0
10,0
40
60
80
4 8 12 s
(mmHg) (kPa)etCO2
CO2 curve
0
2,0
D-1
0003
-201
1
Fig. 27:
Possible causes– Asthma– Ventilatory maldistribution (asynchronous emptying)– Asthmatic bronchitis
CO2-MEASUREMENT DURING VENTILATION | INTERPRETING CAPNOGRAMS
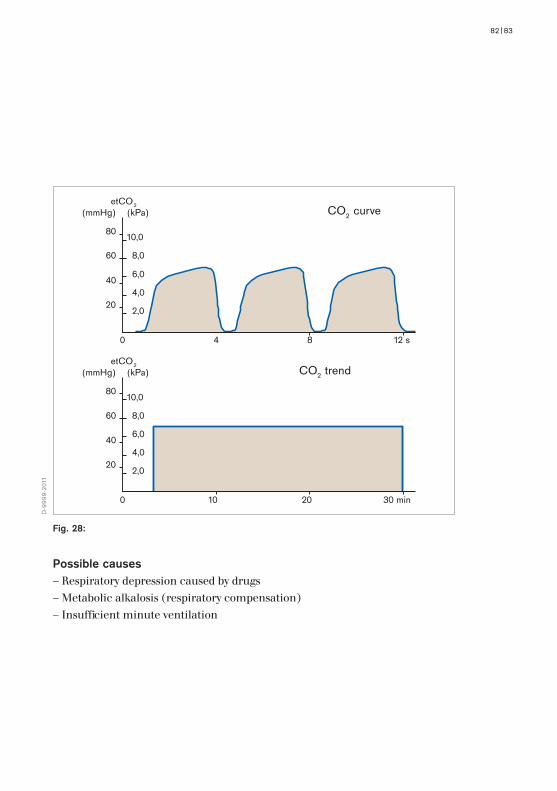
5.8 A CONSTANTLY INCREASED PCO2
Once again, we must distinguish between spontaneous breathing and ventilation.
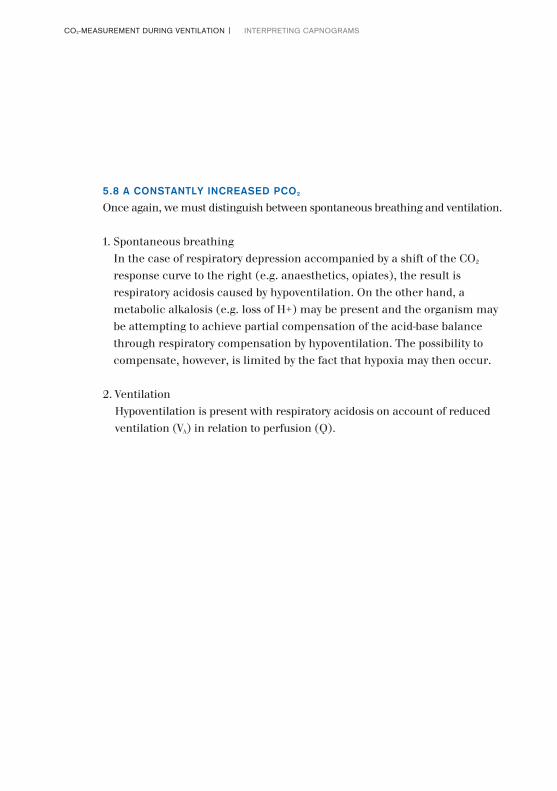
1. Spontaneous breathing In the case of respiratory depression accompanied by a shift of the CO2 response curve to the right (e.g. anaesthetics, opiates), the result is respiratory acidosis caused by hypoventilation. On the other hand, a metabolic alkalosis (e.g. loss of H+) may be present and the organism may be attempting to achieve partial compensation of the acid-base balance through respiratory compensation by hypoventilation. The possibility to compensate, however, is limited by the fact that hypoxia may then occur.
2. Ventilation Hypoventilation is present with respiratory acidosis on account of reduced ventilation (VA) in relation to perfusion (Q).
82|83
202,0
4,0
6,0
8,0
10,0
40
60
80
4
(mmHg) (kPa)etCO2
0
202,0
4,0
6,0
8,0
10,0
40
60
80
10
(mmHg) (kPa)etCO2
0
8 12 s
CO2 curve
20 30 min
CO2 trend
D-9
999-
2011
Fig. 28:
Possible causes– Respiratory depression caused by drugs– Metabolic alkalosis (respiratory compensation)– Insufficient minute ventilation

CO2-MEASUREMENT DURING VENTILATION | INTERPRETING CAPNOGRAMS
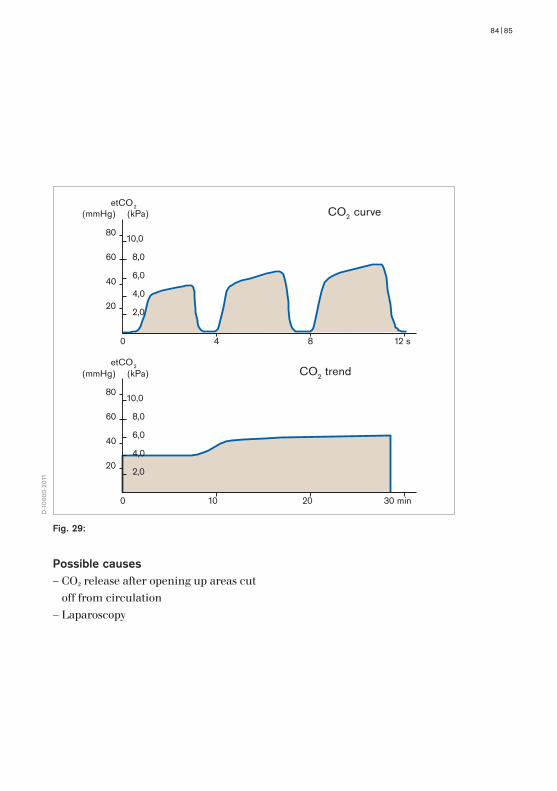
5.9 SUDDEN INCREASE IN PCO2 WHICH STABILIZES ON A PLATEAU AFTER A SHORT TIMEWhen the ventilation/perfusion ratio in the lung is normal, the end-tidal PCO2 may rise and then stabilize on a constant plateau if for a short amount of time an increased CO2 volume reaches the lung from peripheral areas. This occurs in patients undergoing constant ventilation when an ischaemia is opened up in the upper thigh, causing large amounts of CO2 from the areas excluded from circulation to get into the circulation and thus into the lung.
A similar rise can be observed during laparoscopy when carbon dioxide is injected into the abdominal cavity (pneumoperitoneum). The increased amount of absorbed CO2 must then be exhaled.
84|85
204,0
6,0
8,0
10,0
40
60
80
4 8 12 s
(mmHg) (kPa)etCO2
CO2 curve
0
2,0
202,0
4,0
6,0
8,0
10,0
40
60
80
10 20 30 min
(mmHg) (kPa)etCO2
CO2 trend
0
D-1
0000
-201
1
Fig. 29:
Possible causes– CO2 release after opening up areas cut
off from circulation– Laparoscopy
CO2-MEASUREMENT DURING VENTILATION | INTERPRETING CAPNOGRAMS
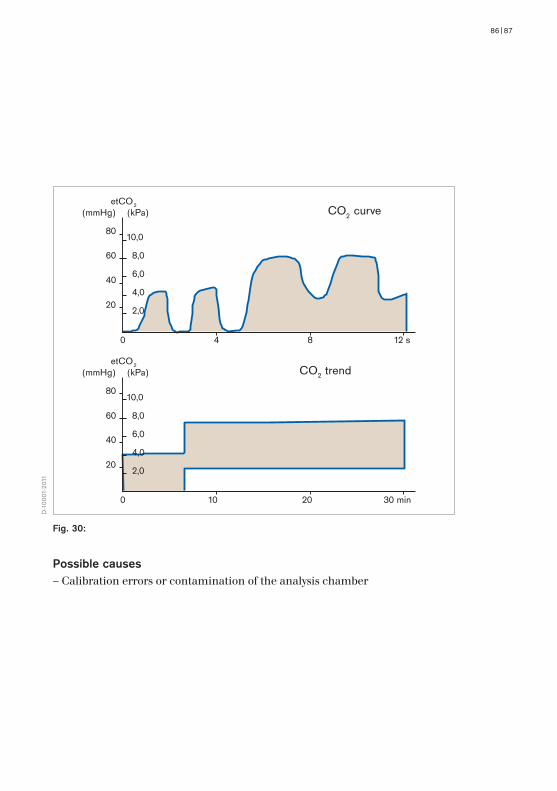
5.10 SUDDEN SHIFT OF THE ZERO LINEA sudden upward shift of the zero line with equal inspiratory and expiratory PCO2 difference can be the result of calibration errors or drops of water in the analysis chamber. In the case of mainstream measurements, secretion deposits in the optical measurement path may be responsible for this phenomenon.
86|87
204,0
6,0
8,0
10,0
40
60
80
4
(mmHg) (kPa)etCO2
0
2,0
202,0
4,0
6,0
8,0
10,0
40
60
80
10
(mmHg) (kPa)etCO2
0
8 12 s
CO2 curve
20 30 min
CO2 trend
D-1
0001
-201
1
Fig. 30:
Possible causes– Calibration errors or contamination of the analysis chamber

CO2-MEASUREMENT DURING VENTILATION | INTERPRETING CAPNOGRAMS
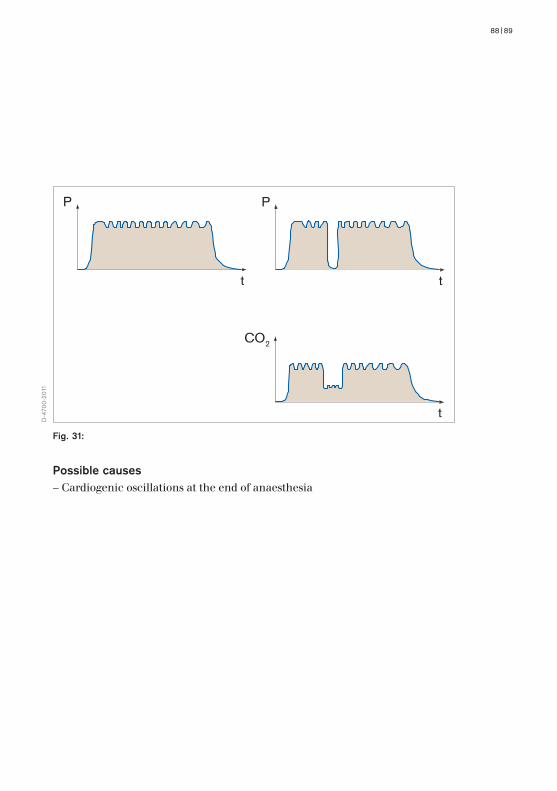
5.11 SMALL CO2 VARIATIONS AT THE END OF ANAESTHESIAMinor fluctuations in the CO2 concentration can be observed (e.g. at the end of anaesthesia) when attempts are made to increase the PACO2 by means of hypoventilation (low ventilation frequency), until spontaneous breathing starts thanks to inspiratory efforts. These variations are known as cardiogenic oscillations. They are caused by heart-rate dependent intra-thoracic volume changes resulting from the heartbeat volume (∼ 70 mL). The positive phase is a result of the venous filling of the heart (increase in intra-thoracic volume) which causes a low expiratory gas flow, thus forcing alveolar air from the upper part of the tube to the measuring point. During the contraction of the heart the blood is expelled and the intra-thoracic volume decreases with resulting low inspiratory gas flow at the tube adapter and at the measuring point. As inspiratory gas is added a lower CO2 concentration is displayed.
88|89
t
P
t
t
P
CO2
D-4
700-
2011
Fig. 31:
Possible causes– Cardiogenic oscillations at the end of anaesthesia

CO2-MEASUREMENT DURING VENTILATION | INTERPRETING CAPNOGRAMS
5.12 CONTINUOUS RISE IN INSPIRATORY AND EXPIRATORY PCO2
An inspiratory and expiratory rise in PCO2 can be taken as an indication of CO2 rebreathing in cases when the soda lime is exhausted or the absorber is switched off. During spontaneous breathing the patient will hyperventilate, as can be seen from the CO2 response curve, and will attempt to eliminate the CO2 by creating large minute volumes.

90|91
t
P
CO2 ventilated
spontaneous breathingCO2
t
t
D-1
0002
-201
1
Fig. 32:
Possible causes– CO2 rebreathing
CO2-MEASUREMENT DURING VENTILATION | REFERENCES
Practical Cardiology / Vol. 8 No. 7 / June 1982Use of End-tidal PCO2 in MonitoringJohn J. Osborn, M.D.
Health Devices, September-Oktober 1986Carbon Dioxide Monitors
Critical Care Clinics - Vol. 4, No. 3, July 1988Noninvasive Carbon Dioxide MonitoringM. Christine Stock, M.D.
Anaesthesiol. Reanimat. 16 (1991) H. 1, 12- 22Kapnometrie und Kapnographieals Sicherheitsfaktoren in der AnästhesieJ. Baum
6. References

92|93

CO2-MEASUREMENT DURING VENTILATION | EXPLANATION OF ABBREVIATIONS
C ContentF Fractional concentrationP Partial pressureQ PerfusionV Gas volumesa ArterialA Alveolaralv Alveolarana Anatomicalds Dead spacee Expiratoryeff Effectiveet End-tidalTotal Totali InspiratoryT Tidalv Venousv Venous mixtureCa Content in arterial bloodCO2 Carbon dioxideCv Content in venous bloodetCO2 End-tidal CO2 contentFA Fractional gas concentration in the alveolar airFe Fractional gas concentration in the expiration airFi Fractional gas concentration in the inspiration airH2O WaterN2 NitrogenO2 Oxygen
7. Explanation of abbreviations
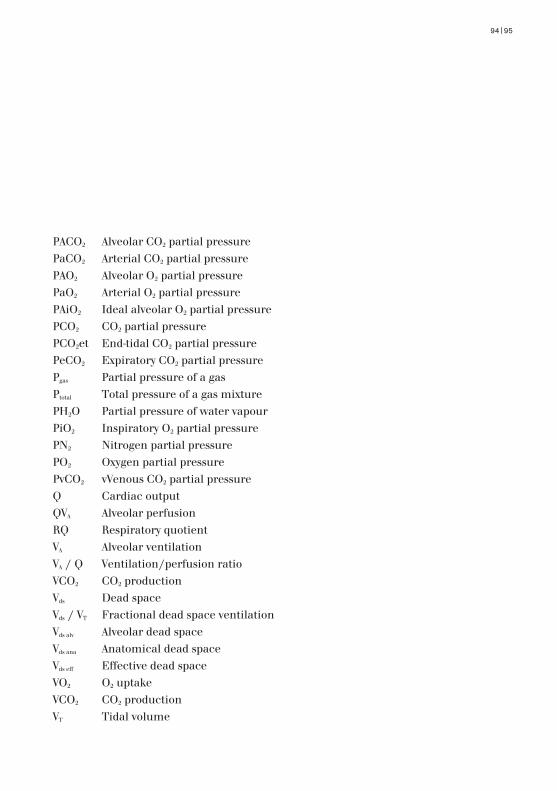
94|95
PACO2 Alveolar CO2 partial pressurePaCO2 Arterial CO2 partial pressurePAO2 Alveolar O2 partial pressurePaO2 Arterial O2 partial pressurePAiO2 Ideal alveolar O2 partial pressurePCO2 CO2 partial pressurePCO2et End-tidal CO2 partial pressurePeCO2 Expiratory CO2 partial pressurePgas Partial pressure of a gasPtotal Total pressure of a gas mixturePH2O Partial pressure of water vapourPiO2 Inspiratory O2 partial pressurePN2 Nitrogen partial pressurePO2 Oxygen partial pressurePvCO2 vVenous CO2 partial pressureQ Cardiac outputQVA Alveolar perfusionRQ Respiratory quotientVA Alveolar ventilationVA / Q Ventilation/perfusion ratioVCO2 CO2 productionVds Dead spaceVds / VT Fractional dead space ventilationVds alv Alveolar dead spaceVds ana Anatomical dead spaceVds eff Effective dead spaceVO2 O2 uptakeVCO2 CO2 productionVT Tidal volume

90 9
7 45
0 |
15.0
6-2
| C
omm
unic
atio
ns &
Sal
es M
arke
ting
| P
P |
LE
| P
rinte
d in
Ger
man
y |
Sub
ject
to m
odifi
catio
ns |
© 2
015
Drä
gerw
erk
AG &
Co.
KG
aA
CORPORATE HEADQUARTERSDrägerwerk AG & Co. KGaAMoislinger Allee 53–5523558 Lübeck, Germany
www.draeger.com
REGION EUROPE CENTRAL AND EUROPE NORTHDräger Medical GmbH Moislinger Allee 53–5523558 Lübeck, GermanyTel +49 451 882 0Fax +49 451 882 [email protected]
REGION EUROPE SOUTHDräger Médical S.A.S. Parc de Haute Technologie d’Antony 225, rue Georges Besse92182 Antony Cedex, FranceTel +33 1 46 11 56 00Fax +33 1 40 96 97 [email protected]
REGION MIDDLE EAST, AFRICA, CENTRAL AND SOUTH AMERICADräger Medical GmbHBranch Office DubaiDubai Healthcare City P.O. Box 505108Dubai, United Arab EmiratesTel + 971 436 24 762Fax + 971 436 24 [email protected]
REGION ASIA / PACIFICDraeger Medical South East Asia Pte Ltd25 International Business Park#04-27/29 German CentreSingapore 609916, SingaporeTel +65 6572 4388Fax +65 6572 4399 [email protected]
REGION NORTH AMERICADraeger Medical, Inc.3135 Quarry Road Telford, PA 18969-1042, USATel +1 215 721 5400Toll-free +1 800 437 2437Fax +1 215 723 [email protected]
Manufacturer:Dräger Medical GmbH23542 Lübeck, GermanyThe quality management system at Dräger Medical GmbH is certified according to ISO 13485, ISO 9001 and Annex II.3 of Directive 93/42/EEC (Medical devices).
As of August 2015:Dräger Medical GmbH changes to Drägerwerk AG & Co. KGaA.
Locate your Regional Sales Representative at: www.draeger.com/contact