Forensic investigation into alleged irregularities in Tlokwe City Council

63
Chapter 3: Hazards and vulnerability in the Tlokwe Local Municipality’s water catchment area
3.1 Introduction
In this chapter, the second research objective is addressed, namely identifying and
conceptualising the generic hazards, and the hazards that are related to a water
catchment area including the related groundwater compartments and those specific
to the catchment area that can affect the Tlokwe Local Municipality’s surface
catchment areas. To address this objective as outlined in Figure:5, the water
catchment area and system as a part of the hydrological cycle is discussed with the
aim of conceptualizing the hydrological cycle within the water catchment area and
identifying the factors that must be considered in the catchment. The hydrological
cycle and the catchment hydrological cycle are discussed.
This is followed by a concise discussion of Disaster Risk and its three determinants
and risk identification, with the aim of conceptualising a model that can be used in
the disaster risk process. A generic classification and a discussion of potential
natural and anthropogenic hazards and specific water catchment related natural
and anthropogenic hazards are then provided.
A concise description of the Mooi River catchment area and system, with the aim of
providing a spatial model of the Mooi River Catchment area is provided. This is
followed by a more detailed discussion of quaternary Catchment Area C23D that is
used to demonstrate a methodology to acquire the information necessary for an
effective conceptual model. This includes identifying and describing entities in the
catchment area and system, a concise description of the catchment area and
system and the possible risk factors affecting the catchment area and system.
A concise description of the groundwater systems associated with the Mooi River
catchment area, including dolomite compartments and mining voids, follows. The
aim is to provide a diagrammatic representation of the groundwater associated with
the Mooi River catchment. The summary lists factors within the catchment, the
catchment hydrological systems as well as potential hazards and their sources that
must be taken into consideration when conceptualising a spatial information
system.
64
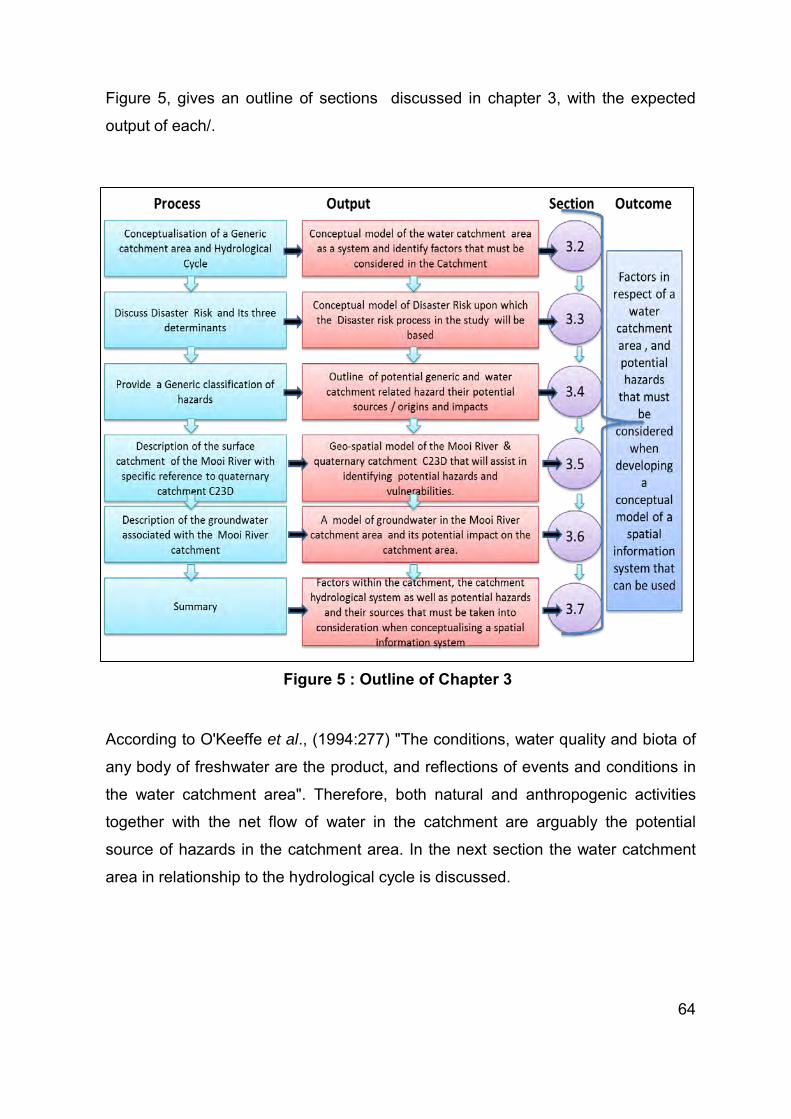
Figure 5, gives an outline of sections discussed in chapter 3, with the expected
output of each/.
According to O'Keeffe et al., (1994:277) "The conditions, water quality and biota of
any body of freshwater are the product, and reflections of events and conditions in
the water catchment area". Therefore, both natural and anthropogenic activities
together with the net flow of water in the catchment are arguably the potential
source of hazards in the catchment area. In the next section the water catchment
area in relationship to the hydrological cycle is discussed.
Figure 5 : Outline of Chapter 3

65
3.2 Conceptualisation of the generic catchment area and hydrological cycle
3.2.1 Water Catchment Area
The water catchment area as indicated in Figure 6 is the basic hydrological unit that
can be described as the total geographical area, that is the land area and
groundwater area from which all water that precipitates on that surface contributes
to the discharge reaching a particular converging point known as the catchment
outlet, within the river network (Environment Agency, 2011:1; Redowicz,
2011:Online; Fourie et al., 2010:Online; Davis, 2008:5; Thompson, 1996:4).
The catchment can therefore be conceptualised as a basin where the river mouth
is represented by the plug through which all the water in the basin (catchment) will
flow (Fourie, et al., 2010:Online; Davis, 2008:5).
Figure 6: Quaternary Catchment C23F as an example of a surface water

66
The surface catchment area as defined above is based on the assumption that all
water that precipitates in the area will ultimately flow through the convergence
point, in the case of this study, where the Mooi River, flows into the Vaal River.
However, it is possible that a portion of the precipitated water that infiltrates the
ground can become part of the groundwater with its solvents, that ingress into the
surface water of another catchment area. Therefore, groundwater that ingresses in
the surface water of one catchment area can have its origin with its associated
hazards in another catchment area (Know Your Watershed, 2011:6). It is also
possible that anthropogenic interventions can result in the transfer of water
between catchment areas influencing the net flow (quantity), the quality for example
solvents and solids, and ecology of water of the catchments involved (Seetal,
2013:6; WWF GLOBAL, 2013:Online; WWF GERMANY, 2009:Online; Cyrus,
2001:Online).
For the purpose of this study, water quality and water quantity include the potential
hazards related with water quality and quantity. For example, water quantity, which
implies a volume of water, where for example, a sudden increase of river flow has
the potential to result in a flash flood. For water quality, for example, radioactive
contaminants are hazardous pollutants, where both the former and latter have the
potential to effect a disaster (UASA, 2011:Online; Van Der Merwe - Botha,
2009:Online; Jooste & Rossouw, 2002:Online).
Based on the above, knowledge of the water catchment area and system is
significant in the management of the potential risks of disasters, in that it provides
information concerning the spatial location of potential hazards, for example, an
explosives factory and vulnerabilities, for example indigents, squatting on the banks
of a river in relation to the water catchment area and hydrological system and water
resource.
In the next section the cycle of the the net global movement of water namely the
hydrological cycle is dicussed.

67
3.2.2 Hydrological Cycle
The hydrological cycle as illustrated in Figure 7 is a conceptual model of how water
moves around between the earth and atmosphere in a solid, liquid or gaseous state
(Know Your Watershed, 2011:Online; Davis, 2008:5). Figure 7, is the authors
conceptualisation of the global hydrological cycle based on the literature reviewed.
The hydrological cycle (natural water cycle) comprises: of the ecosystems that
includes rivers, wetlands, surface water, groundwater, lakes, dams, natural and
unnatural water channels, water obstruction, flood plains; processes that includes
evapotranspiration / infiltration, run-off and precipitation and; continuous movement
of water on and in the earth (ground- and surface water) and between the earth and
the atmosphere (Know Your Watershed, 2011:4; Thompson, 1996:3,4 & O'Keeffe
et al., 1994:277). Theoretically, the total amount within the global water cycle
Figure 7: Schematic representation of the global water cycle.

68
remains constant as outlined in the water balance equation below (Davis, 2008:10).
The water balance equation for the global hydrological cycle is a mathematical
model providing a description of the hydrological cycle operating within a given time
and is represented as a closed system where there is no mass (water) or energy
created or lost within it (University of Arkansas, 2013:Online; NCAR, 2013:Online;
Redowicz,2011:22-24; Davis, 2008:10-12). The movement of water and energy
within the cycle has the potential to give rise to meteorological and hydrological
hazards; this potential is illustrated when considering the different phases of the
cycle as represented in the water balance below.
The water balance equation is represented as:
P± E ± ΔS ± Q = 0
Where P is precipitation. Precipitation is all of the water that is released from the
atmosphere that reaches the earth's surface. It includes rain, drizzle, sleet, snow,
fog and hail, and is the main input of surface water within the cycle. Precipitation is
the result of the condensation of atmospheric water vapour that precipitates by
atmospheric cooling. As the atmosphere cools, its ability to hold water decreases,
causing the water vapour to condense as water or ice around minute particles
called condensation nuclei, and then to precipitate (USGS, 2013a:Online; NCAR,
2013:Online; Redowicz, 2011:25-26; NWS Jetstream, 2010:Online; Davis, 2008:14-
16; Ward, 2003:Online).
The importance of the precipitation phase of the cycle in Disaster Risk
Management includes the intensity (storms with flash floods) and duration
(torrential rain) of precipitation that can cause floods (City of Cape Town, 2013;
Hoo, 2011:Online; Mail & Guardian:Staff Report, 2009:Online; Davis, 2008:30); the
type of precipitation (hail and snowstorms) that can cause sudden drop in
temperature, structural damage and damage to crops, and the role that
precipitation plays in the quality and quantity of water. The amount of precipitation
influences not only the quantity of water but the quality as well. As water has a
dilution effect, the more water, the greater the potential of the water body to dilute
and reduce the effect of the contaminants entering the water. Precipitation also has
the potential to dissolve air borne particles, particles on buildings, trees and
particles on the surface. An example of the above is acid rain, which can be caused

69
by the burning of fossil fuels that release carbon dioxide, nitrogen oxides and
sulphur oxides into the atmosphere. The carbon dioxide dissolves in the
precipitation to form carbonic acid, nitrogen oxide combines with the precipitation to
form weak nitric acid and sulphur oxide combines with the precipitate to form a
weak sulphuric acid. All these weak acids can then lower the pH of rainwater, which
is normally between 5 to 6 (Briney, 2013:Online; Rose-Innes, 2012; Scorgie &
Kornelius, 2009:3; Davis, 2008:34 -35).
Where E is evaporation. Evaporation is the transformation of liquid water into a
gaseous state in the presence of sufficient energy to effect the transformation. The
diffusion of the gaseous water into the atmosphere is dependent on sufficient water
being available to effect the evaporation, and the receiving atmosphere being
below saturation point. Evaporation includes open water evaporation, interception
(evaporation from a plants surface), and transpiration from plants (USGS,
2013b:Online; Oblack, 2013:Online; Science Daily, 2013:Online; Clulow et al.,
2012:Online; Davis, 2008:10,36,38). The importance of evaporation in respect of
Disaster Risk Management is its effect on water quality and quantity. The effect on
surface and groundwater quantity is that increased evaporation decreases the
amount of water reaching surface streams and the amount of water infiltrating the
ground; this can lead to droughts (SAPA, 2013:Online; Makana, 2013:Online;
Wren, 1992:Online). The impact on the quality of water is that evaporation can lead
to the concentrating of remaining impurities (including pollutants), as well as the
concentrating of salt in the soil (Matercherea, 2011:3745 - 3748; Davis, 2008:54;
Slaughter, 2005:3)
Where ΔS is change in water storage. Storage water includes water stored as soil
water (moisture), deep groundwater, water in lakes, dams and other reservoirs,
glaciers, seasonal snow cover, etc., with the largest portion of water stored as snow
or ice caps (polar ice caps) and groundwater. Water in storage is influenced by
inflow and inflow rate, as well as outflow and outflow rate, of the water in and out of
the water storage component. Water stored is therefore in continuous flux, and will
not remain constant and is therefore, indicated in the cycle as a change of water
storage (USGS, 2013c:Online; USGS, 2013d:Online; USGS, 2013e:Online; Davis,
2008:11,56).

70
The importance of water storage in respect of Disaster Risk Management is its
influence on water quality, quantity and geophysical activities (sink holes, seismic
movements, etc.). As water infiltrates through the vadose zone into the
groundwater, it can dissolve mineral salts, sewage, chemical, pollutants for
example organic toxins (fertilizers) and sulphate’s from tailing dams, biological
pollutants such as E Col, affecting the quality of the water, in some instances
making it unfit for domestic consumption (Zeelie & Hodgson, 2013:Online;
Lawrence et al., 2001:19 -21). Rise in groundwater level can result in an increase
of the amount of water entering the surface water and likewise a decrease in
groundwater can result in a decline of the base flow of surface water.
Where Q is Runoff. Runoff is the term that refers to the movement of water on or
below the surface to a channelized stream after it has reached the surface as
precipitation. The process of the movement of water in a channelized form is known
as either river or stream flow (USGS, 2013f:Online; Oblack, 2012:Online; Annville
Pennsylvania, 2013:Online; Barron et al., 2009:6721-6723; Davis, 2008:78;
Smakhtin, 1997:125.). The stream flow can be measured as the discharged volume
(in m3 /s (cumecs)), and recorded on a hydrograph (Ponce, 2013:Online; Ashton,
2011:5-14; Lim et al., 2005:408). The hydrograph can be used as an effective Early
Warning tool and modelling tool in disaster management. It can indicate base flow,
and flows resulting after significant rain in the catchment namely, peak flow, storm
flow or quick flow at the point where it is placed (Davis, 2008:78). The
characteristics of the hydrograph and the shape of the storm flow recorded, is
influenced by the upstream catchment characteristics. These include catchment
size, angles of the slope, shape of catchment, soil type, urbanisation, the
antecedent water moisture, vegetation type and the percentage coverage of the
vegetation (S-cool, 2013:Online; EPA, 2012:Online; Davis, 2008:79; ASCE,
1996:349).
Where Q. = (QO + QT +QG ).
- Where QO is the, overland flow, and refers to the water that runs across the
surface of the land before reaching the stream (Eslick, 2013:Online;
Williams, 2013:Online; Katopodes & Bradford, 1999:1-27).

71
- Where QT is the sub surface flow through or lateral flow, of subsurface water
normally in the unsaturated zone. Once water infiltrates through the soil
surface it continues to move either through the soil matrix or along
preferential flow paths (Bachmair & Weiler, 2012:Online; Davis, 2008:62;
Freeze, 2010:Online; Anderson et al., 1997: 2637-2639).
- Where QG is the ground flow of water in the deeper saturated zone. It is the
major contributor to the base flow of channelized or river flow, with through
flow been a lesser contributor. The water will normally infiltrate from the
surface into the unsaturated zone, from there it will flow into the saturated
zone, and down slopes often into a stream. The slow seepage of
groundwater (saturated) zone is the major contributor to base flow of a river
(EPA, 2012:B107-B112; Goulburn-Murray, 2010:1-5; NERC, 2009:1-5;
Davis, 2008:86). The significance in the Mooi River catchment is the major
rivers; the Mooi River, Wonderfontein Spruit and Loop Spruit are perennial
even in the dry seasons as both the upper catchment of Mooi River and the
Wonderfontein Spruit base flow is contributed to by major groundwater
aquifers.
As the study focuses on a specific catchment area, the dynamics of the
hydrological cycle for a catchment are discussed below.
3.2.3 The catchment hydrological cycle
The catchment hydrological cycle is a more detailed conceptual model depicting
the movement of water between the earth and the atmosphere within a specific
catchment area. The cycle consists of the total amount of water that can be in the
form of precipitation (P) (rain, snow, sleet, mist, etc.), total run off (Q) both ground-
and surface water, both liquid and solid, (E) water vapour as the result of
evaporation and transpiration, condensates and (S) water storage, within the
specific catchment area (Redowicz, 2011:18-22; Barron et al., 2009:6728; Muller,
2009:4-7; Davis 2008:10; Slabbert, 2007:1,14-19; Snaddon et al., 1998:Online).
Unlike the global hydrological cycle, the water balance in the cycle may change, as
water precipitates and water flows outs of or into the system. For example a tropical
front, where moist in the atmosphere originates hundreds of kilometres from the
specific catchment area can contribute to a sudden net increase of the total amount

72
of water in the catchment’s hydrological cycle. While evaporated water arising in
the catchment may condensate and precipitate outside the catchment area,
resulting in a net loss of water in the catchment area. Ground- and surface water
can be exported and imported from beyond the boundaries of the catchment,
thereby impacting on the net gain or loss of water in the catchment cycle (D.I.G,
2013:Online; Canadian Geographic, 2013:Online; Davis, 2008:10-11; Perry,
2005:Online). Despite the catchment hydrological cycle being limited to a specific
catchment, the phases of the cycle and generic factors contributing to the possible
risk of disaster in the global hydrological cycle are similar. To establish an effective
spatial information system that will reduce the potential risk of disaster in the
catchment, it is important to identify the route of water-flow from precipitation to the
river streams, sources of possible pollution including point sources of pollutants,
and approximate location of diffuse pollution (Davis, 2008:129), water extraction
points, factors influencing the speed and quantity of water-flow and other structures
that could impact on the quality and quantity of water (Davis, 2008:92-95).
Figure 8, below, is a conceptualisation of the water catchment area and the
hydrological cycle as an integrated system, indicating potential sources of hazards,
including pollutants, and the activities that can influence the flow of water through
the hydrological cycle. In Figure 8, the hydrological cycle includes the components
of the water balance equation discussed above, but differs from the global water
cycle as illustrated in figure 7, as the net inflows or outflows of water into the
catchment will and can affect the water balance in the catchment system.

73
Figure 8: Conceptualisation of the water catchment and hydrological cycle as an
integrated system.

74
The above provides a concise discussion, of the water cycle and surface water
catchment. As the focus of the study is on potential risk of disaster within the water
catchment area, the following section introduces disaster risk and its determinants.
3.3 Disaster Risk and its three determinants
3.3.1 Introduction
In this section, the term Disaster Risk, with its three determinants, namely hazards,
vulnerability and resilience, is analysed. The data and information used in the
discussion and the conceptual modelling are based on a document study and
literature research of both primary and secondary data and information sources (De
Vos, et al., 2008 :314-325 & Mouton, 2008:179-180). The aim is to formulate a
conceptual model upon which the Disaster Risk Assessment process will be based
that can be used when determining the information required for an effective spatial
information system that will identify, avoid, mitigate and manage potential risk.
3.3.2 Concise discussion of Disaster Risk and its three determinants
Disaster Risk is a function of ((hazards x vulnerability)/(resilience)). Therefore, the
risk of disaster has three components, viz. hazards, vulnerability and resilience,
and it is directly proportional to the hazards risks and vulnerability, while inversely
proportionate to the resilience (coping capacity) against the potential risk. This
implies that the greater the potential risk of hazards or vulnerability, the greater the
potential risk of a disaster (Van Niekerk, et al., 2002:12).
Risk has two defining components. Firstly, the probability component (chance,
likelihood, frequency, etc.) and secondly, the impact component (consequence,
impact, seriousness, etc.) of the negative outcome that may arise (Steyn, et al.,
2008:335; Visser & Erasmus, 2007:196; Twigg, 2004:43; Guild & Marais, 2001:75).
3.3.3 Risk and vulnerability analyses
The importance of risk in disaster risk management, is the probability that a specific
hazard or hazards may exploit particular vulnerability in a specific community or
communities, resulting in social (including life and injury), economic and
75
environmental loss, destruction, etc. (Van Niekerk, et al., 2002:18). Therefore, to
avoid, mitigate, reduce the impact of a potential disasters, the risk of hazards and
vulnerability (potential exposure to hazards) must be reduced while resilience (the
ability to cope with the potential risk of hazards) must be increased.
This will require that in any effective disaster management system, the potential
hazards and vulnerabilities be identified as early as possible, this includes the
identifying of the potential source, likelihood of occurrence and potential ability of a
hazard to trigger a disasters.
Figure 9, provides a concise outline of a risk management process that can be
used to: obtain hazard data; analyse the risk of hazards; evaluate the risk of
hazards; and avoid, reduce and manage the potential impact of the hazards.
Figure 10 provides a holistic process that can be used to address vulnerabilities
with the aim of decreasing vulnerabilities while increasing resilience.

76
Figure 9: A Risk Management Process that can be used in risk management.

77
Figure 10: Sustainable Livelihood framework adapted for vulnerability analysis and reduction.

78
In this section, a summary of the determinants of disaster risk is provided. The
following section provides a concise classification of one of the determinants of
disaster risks, namely hazards.
3.4 Classification of hazards
3.4.1 Classification of generic hazards
To assist with hazard identification and assessments, hazards are categorised into
several groups and sub groups. Although numerous category systems exist,
according to Coppola (2011:15), the following should be considered when
categorising hazards:
• The categories chosen must accommodate the full range of hazards and none should be overlooked.
• It is possible that a hazard in one category can cause a secondary hazard in another category. An example of the latter is Vajont (Vaiont), Italy, where in 1963, a landslide (primary hazard) occurred in the 261 m high dam. Because of the filling of the dam, the resulting wave was a 200-metre tsunami (secondary hazard) that flooded dwellings and villages (Longarone, Castellavazzo, Erto and Casso) below the wall, killing between 1800 - 2000 people (French Ministry Of Sustainable Development, 1963: 1-5; Semenza & Ghirotti. 2000:87-96). In this example the primary hazard and secondary hazard, are in different categories.
• It is possible to place a hazard in more than one category, and this may lead to confusion. Despite the confusion, all the hazards must be accommodated in the category system used.
The classification of hazards is a tool that assists in identifying potential hazards
that may arise in an area being studied. Figure 11 provides a summary of different
hazards, based on the above guidelines and the work of Coppola (2011) and Twigg
(2004).

79
Figure 11: Classification of hazards.

80
It should be noted that the list is not exhaustive, as with technology development
and urbanisation new hazards will arise. For example, an automated flow control
system at a major dam can, as a result of a power failure, result in an error, for
example, not opening enough flood gates, causing the dam to overflow or its wall to
give way to the pressure, resulting in a downstream flooding.
As this study focuses mainly on potential hazards related to the water resource and
the catchment area only, an introduction to the groups and subgroups of generic
hazards according to Coppola (2011:38) and Twigg (2004:15) is given. Potential
hazards associated with the water resource and associated catchments are then
provided in more detail.
Coppola (2011:38) and Twigg, (2004:15) group the hazards as follows (See Figure
11):
Natural Hazards. These natural processes have the potential to exploit
vulnerability and cause a disaster. Natural hazards can then be divided into sub
groups including the following:
• Geological hazards are natural earth processes or phenomena, which
include geological, neotectonic, geophysical and geomorphologic,
hazards.
• Hydrometerological hazards are hazards of atmospheric, hydrological and
oceanographic nature.
• Biological hazards are organic in origin or those conveyed by biological
vectors, and include exposure to parasites, bacteria, fungus, virus bio-
toxins and other bio-active substance,
Technological hazard. These are anthropogenic (man-induced) hazards, and
include industrial, transport, chemical spills, pollution, urbanisation, mining,
agricultural practices, dam failures, production of toxins, ozone depleting products,
nuclear activities, and bioengineering.
Environmental degradation. These are hazardous activities (both natural and
anthropogenic) that can irreversible damage the natural resource base and
adversely alter the natural (eco) systems and processes.
Intentional hazards is another group that Coppolla (2011:35) includes. Intentional
hazards are hazards arising from the conscious decision of man to act in anti-social

81
or anti-establishment manner. These include wars, terrorism, sabotage, and
modern chemical, biological and nuclear warfare.
When developing an effective disaster management system it is important to note
that certain hazards give rise to disasters. These can occur when the hazard event
occurs or at very short notice, known as rapid onset/impact disasters, these include
earthquakes, flash floods, bush and veld fires, tsunamis, and tornados, of which
many cannot be predicted in advance. While other hazardous events can take a
longer period of time for example weeks, months, years and decades to manifest
as a disaster, (known as a slow onset / impact disasters). These hazards include,
droughts, environmental degradation, desertification, coral bleaching, urbanisation,
water salinization and the slow accumulation of toxic matter, for example, heavy
metals (Uranium and Mercury) and toxins (organophosphates) (DWF, 2013:Online;
IRIN, 2012:Online; Femina & Werrell, 2011:Online; Blakemore, 2011:Online; &
Provention, 2009:Online). For example, in the Wonderfontein Spruit tributary of the
Mooi River, deep-level mining has contributed to the dewatering of certain
groundwater compartments, the depositing of uranium and other heavy metal in
tailings, and is contributing to acid mine drainage which will increase as mines
become less active. These pollutants are slowly migrating through both
groundwater and surface water to the primary source of Tlokwe Local Municipality
drinking water (North West Independent, 2013:1; Lang, 2011:Online; Masondo &
Evans, 2011:Online; Lang, 2010:Online; Winde, 2010b:239; Winde & Stoch,
2010b:76).
The next section focuses in more detail on hazards related to water resources and
water catchment areas.
3.4.2 Water resource and water catchment related hazards
3.4.2.1 Biological Hazards
These are potential hazards resulting from living organisms and include those as a
result of toxins and/or disease produced by bacteria, viruses, algae, fungi and
parasites. A detailed discussion on biological hazards is beyond the scope of this
mini-dissertation. A detail discussion for interest is provided in Appendix C 1.

82
Bacteria: Some bacteria are highly contagious and can be spread through
contaminated drinking water polluted by human and animal faeces and other
waste, and in some instance can be found in groundwater. Good sanitation,
individual hygiene and treatment of water by boiling and use of bactericide such as
chlorine can prevent and stop the spread of these bacteria (DOH 2011a:Online;
Geddes & Grosset, 1997). Concentrated populations with poor sanitation are more
susceptible to epidemic outbreaks. The illnesses can result in the infected
population becoming more vulnerable to other potential hazards. An example of
typical bacteria epidemics is the regular cholera out-breaks in Southern and South
Africa. The 2001 cholera out-break in Kwazulu Natal recorded 12000 infections and
50 deaths by 2 January (Barrow, 2001:Online); by 12 January 2001 it had spread
to six provinces and the total deaths numbered 64, and the total infections 18000
(BBC, 2001:Online). The 2008 outbreak that started in Zimbabwe and later spread
to South Africa had 98741 infections and 4, 293 deaths reported in Zimbabawe. By
December 2008, Vhembe district of Limpopo was declared a disaster area (Doctors
Without Borders, 2008:Online). In December 2008, it was found that the eastern
part of the Limpopo River between Zimbabwe and South Africa tested positive for
cholera (Gabara, 2008:Online). By January 2009, 15 deaths had been recorded in
South Africa, and the number of cases were 2100 (AFP, 2009:Online). Regarding
Disaster Risk Management, in Tlokwe Local Municipality which has a blue drop
status for water and is faring well with green drop status, there are parts of the
community that are occasionally exposed to leaking sewage, which increases the
risk of deadly bacteria outbreaks (Boqo, 2012:5).
Protozoa (parasitic). These include the enteric protozoa (of which one of the
major symptoms is diarrhoea) that are water borne and found in infested drinking
water and recreational water that is infested, often by faecal waste that contains the
infective stage of the parasites’ life cycle (DOH 2011:Online; CDC, 2011:Online). In
its infective phase as oocytes or cysts, chlorine and iodine do not seem to have an
impact on theses parasites. Boiling and use of filters that will prevent the parasite
from entering drinking water sources are the most effective means to purify
contaminated water. In respect of Disaster Risk, protozoa infection can manifest
themselves as secondary hazards and all can cause diarrhoea (Marks & Anad,

83
2012:Online; CFIA, 2012:Online; DOH, 2011:23; CDC, 2010a:Online; CDC,
2010b:Online).
Viral: More than 100 species of viruses can be found in sewage. The diseases that
can be caused include hepatitis, polio, meningitis and gastroenteritis. Viral matter of
between 105 and 1011 can be found in one faecal stool of an infected person
(Bosch, 1998:191). The virus in faecal matter (in the case of faecal matter
deposited on the ground), in disposed solid waste and in untreated sewage can
reach both ground- and surface water by land run-off and other point sources,
exposing humans to infected water that may be used for agriculture, drinking and
recreational purposes (Bosch, 1998:193). Norwalk virus is an example of a virus
that has been associated with swimming in lakes and pools (Hedberg & Osterholm,
1993:205). It should be noted that many waterborne viruses are resistant to boiling,
changes in pH and disinfectants. Consequently, water that conforms to bacterial
standards could remain contaminated by certain types of viruses (Taylor,
2011:209). Implying that water that has not specifically been treated for viral
contamination can remain contaminated. In respect of disaster risks, lack of
sanitation and raw sewage can assist in the spread of the disease. The importance
of good water treatment, hygiene and good sanitation must be emphasized if a viral
outbreak is to be prevented or reduced in respect of water borne viruses.
Algae Blooms: In South Africa many water impoundments are found that can be
contaminated by poorly and untreated sewage effluent, phosphates and other
fertilisers used for agricultural purposes, giving rise to eutrophication (Pindihama et
al., 2011:19884; Harding, 2006; Oberholser et al., 2005:86; O'Keeffe et al., 1994:
287). Eutrophication, the process of nutrient enrichment, for example, an increase
of Phosphates (O'Keeffe et al., 1994:286 -287), gives rise to an environment that is
suitable for the accelerated growth of algae that can result in algae bloom. In South
Africa, the species responsible for these blooms include cyanobacteria and the
blue/green algae (DOH, 2003). The excess algae can deplete the oxygen carrying
capacity of water, accelerate eutrophication, block water plant filters and produce
toxins in general affecting sensitive ecosystems. The toxins produced include
hepatoxin such as microcystins, nodularins & cylindrosermopsins that affect the
liver; neurotoxins such as anatoxins and saxitoxins that depress the function of the

84
nervous system, and dermatoxins such as lyngbyatoxin & aphlysiatoxia that
influence the skin (Oberholster et al., 2005:57- 60). Although the organism can be
destroyed, it is the toxins that can cause acute poisoning in humans and deaths in
animals (Pindihama et al., 2011:19885). It is difficult to remove the toxins from
water through normal water treatment methods (Pindihama et al., 2011:19884;
Harding, 2006:I; Oberholster et al., 2005:86). Although no human fatalities have
been reported in South Africa, stock and game losses have been recorded
(Pindihama et al., 2011: 1988; Harding, 2006:I; Oberholster et al., 2005). Algae
blooms have the potential to produce enough toxins in water used by livestock to
cause significant losses. The potential chronic effects of the toxins cannot be
disregarded. This potential to cause livestock losses, and significantly impact on
the livelihood of communities, requires that these toxins be considered as a
potential hazard.
Invasive flora and fauna can destroy the environment, and impact on the
indigenous fauna and flora (ISSG, 2012:Online; NECIS, 2012:Online). In the
following dams of the catchment area, Boskop Dam, Potchefstroom Lakeside
Resort and the Klipdrift Dam, carp (Cyprinus Carpio) can be found, and in
Potchefstroom Lakeside Resort wide mouth black bass (Microsterus Salmoides,
(Musil & Macdonald, 2007:175) are found, both of which are invasive species. An
example of the impact of invasive species is the Cyprinus Carpio that is known for
uprooting plants, reducing the quality of water, destroying water plants and
concentrating nutrients thereby significantly impacting on the environmental
integrity (Charles & Dukes, 2007:Online).
Animal vectors include rodents, for example, rats carry fleas (e.g. Xenophysylla
Cheopis) that can carry the plague (Yersinia Pestis), which can infect humans. The
pandemic in Europe that killed approximately 25 000 000 people in 1340, is an
indication of the disastrous effect caused by the infection that can occur where
sanitation is problematic (National Geographic, 2012:Online; Davis and Netlleman,
2012:Online). Insect vectors, for example mosquitoes (Anopheles) which breed in
stagnant water and other water sources, have the potential to cause lethal and
debilitating illnesses (Jupp, 2005:Online). An example is malaria, which can cause
epidemics (In 2010 there were 7963 malaria infections with 81 deaths in South

85
Africa (DOH, 2011)) or result in increased vulnerability of the infected to other
potential hazards including droughts, heat waves and famine. In respect of disaster
risk management, animal vectors can be a result of other hazards (for example
droughts and flooding) resulting in infestation of rodents and insects such as
mosquitoes.
Hydrological hazards are discussed below.
3.4.2.2 Hydrological Hazards
Hydrological hazards are extreme events associated with water occurrence,
movement and distribution and are one of the more significant hazards (CGER,
1999:4). These include floods and droughts and they are often secondary hazards
resulting from meteorological processes. These include prolonged rainfall for
example, Hurricane Sandy in 2012 (Barron, 2012:Online; Kunkle et al.,
2012:Online), Hurricane Katrina in 2005 (Shah, 2005:Online; NOAA, 2005:Online),
and the 1981 Laingsburg flood, where 425 mm of rainfall in the catchment of the
Buffalo river above Laingsburg over a period of two days resulted in a six meter
high wall of water build up that flooded Laingsburg on 25 January 1981, killing 194
persons and destroying 184 houses (SAWDIS, 2009:Online) and sea surges as a
result of onshore winds. Hydrological hazards themselves can give rise to
secondary hazards, including landslides, mudslides and soil erosion (Coppola,
2011:69; CGER, 1994:4). Specific hydrological hazards are discussed below.
3.4.2.2.1 Floods
Floods can be either slow rising over days or weeks, or can be fast rising, causing
flash floods (Coppola, 2011:69). In the case of the Mooi River there are at least two
large dams, a number of smaller dams, and a significant number of small farm
dams and a number of hydrological points in the catchment area that could assist
as early warning systems; the dams, if properly managed, could assist in delaying
slow onset flooding. For the latter to be successful, it will require that the water
monitoring point information be integrated into the Tlokwe Disaster management
system. When considering a spatial information system that will address the
possible hazards of floods, it is important to consider high-risk geographic land
types. These include river flood plains, low lying and in some cases highly fertile

86
areas, flanking rivers (Coppola, 2011:60). Unfortunately in South Africa we
continuously see as the result of urbanisation the development of settlements on
these flood plains, for example, Klipriver (Joburg, 2012:Online) in the Gauteng
Province and the Cape Flats (Cape Times, 2012:Online; Stewart, 2009:Online) in
the Cape Province. In Tlokwe small groups of families tend to settle for short
periods of time in the flood plain of Mooi River below the golf course (Riekert,
2011). Secondly, it includes basins and valleys that are prone to flooding. These
are areas exposed to abnormally high runoff during intense rainstorms (Coppola,
2011:60). Thirdly, it includes land lying below retention structures, for example
dams, weirs and levees which, as a result of poor construction or maintenance, can
give way, flooding the area below them (Coppola, 2011:61). Examples include the
Levee break during the Hurricane Katrina (levee failure from lake Pontchartrian
during Hurricane Katrina (NOAA, 2005:Online)), and of dam failures (Movri Dam
Disaster (Dhar et al., 1981:71)). Fourthly, deforestation and overgrazing has the
ability to cause floods, as soil that was anchored by vegetation is systematic
eroded, thereby reducing the water retention capability resulting in a systematic
increase in run-off with erosion (Coppola, 2011:62).
3.4.2.2.2 Drought
A drought is an example of a slow onset hazard when dry weather persists long
enough, reducing the available water to such an extent that crops are damaged
and there is insufficient water for industrial, agriculture and domestic use.
According to Coppola (2011:62), droughts can be categorised as meteorological
(seasonal rainfall is below average), agricultural (insufficient moisture to meet a
specific crops need), hydrological (decline in surface and groundwater) and
socioeconomic (famine). Although droughts are rare occurrences in the Tlokwe
Local Municipality area, the potential effect of climate change, the cessation of
mining upstream and anthropogenic interventions (sabotage, negligence, etc.) on
the quantity and quality of water available for domestic and agriculture use are
unknown. Droughts therefore must be considered by the Tlokwe Local Municipality
in that it is directly dependent on the Mooi River for domestic, industrial, agricultural
and commercial activities, and large areas of the Local Municipality are used for
intensive and extensive agricultural activities. Where some areas are provided with

87
water through surface man-made canals, others use boreholes and others are
mainly dependent on rain. Rain and other weather related patterns are discussed in
the next section.
3.4.2.3 Meteorological Hazards
These weather events are related to atmospheric weather patterns or conditions
(Coppola, 2011:64).They include tropical depressions, tropical storms, cyclones,
hurricanes and typhoons that describe a large scale closed circulation system in
the atmosphere that combines with low pressure and strong winds. Secondary
hazards can arise from the impact of these types of storm systems such as lack of
drinking water, spread of disease through sewage-contaminated water, and an
increase in vermin such as rats (Coppola, 2011:54; IFRC, 2009:Online).
Tornadoes, although rare, have occurred in various regions in South Africa. These
are funnel clouds extended downwards from a cumulonimbus cloud, mostly formed
from a super cell that is rotating thunder storms, with the destructive winds
generated having the ability to cause destruction, loss of life and injury effects when
coming into contact with community dwellings and other infrastructure such as
buildings (OBlack, 2014a:Online; Weather Wiz Kids, 2014a:Online; Coppola,
2011:67-68; The Weather Channel, 2009:Online).
Strait line winds are thunderstorm related wind movingly linearly at high speeds
and can be severe when exceeding 92 km/h. These strait line winds include,
downdrafts (column of air rapidly move towards the ground surface), downbursts
(downdraft with a horizontal dimension of 4km), microburst (concentrated
downburst with maximum speed of 268 km/h), gust forces (where the leading edge
of the rain cooled wind meets warm air of the thunderstorm) (Coppola, 2011:68-69).
Hailstorms are events where there is a precipitation of large lumps of ice and
compact snow. Hail are ice crystals forming within in a cloud suspended in strong
updrafts while more layers of ice are added until the holding capacity of the cloud is
exceeded (Oblack, 2014b:Online; Weather Wiz Kids, 2014b.:Online; Tsagalidis,
2012:Online; Coppola, 2011:6-71; The National Weather Service Forecast Office,
2010a:Online).

88
Frost occurs where crystals form from water vapour when it freezes upon contact
with a surface below frost point (Weather Online, 2014:Online; Met Office,
2013:Online; Coppola, 2011:71)
Extreme cold, where the actual temperature can be further decreased by increase
in wind, also called the chilling factors, can result in hypothermia and later death in
individuals who are not protected from extreme cold (International federation of Red
Cross and Red Crescent Societies, 2014:Online; Coppola, 2011:71-73; National
Disaster Management, 2008:Online;).
Extreme heat, including heat waves, is caused by extremely high temperatures
and can result in death, with the aged and young most susceptible (International
federation of Red Cross and Red Crescent Societies, 2014:Online; Coppola,
2011:71).
Windstorms are periods of high winds not associated with convective events,
considered severe if they exceed 64km/h; for example, gradient high winds caused
by large-scale pressure system (Coppola, 2011:75).
Wildfires are secondary hazards that can result from metrological events, including
lightning, hot and dry winds (Weather Wiz Kids, 2013c: Online; Coppola, 2011:77;
Twisp, 2012: Online).
Thunderstorms are local storms produced mainly by cumulonimbus clouds. They
can be accompanied by thunder, lightning, winds, heavy rain and in some cases,
hail. Their damage is normally the result of the precipitation and the winds they
generate (Coppola, 2011:78 -79; The National Weather Service Forecast Office,
2010b:Online ).
The above provides merely a summary of a few of the meteorological hazards
associated with water catchment areas, and focuses mostly on those that can
occur in South Africa.
3.4.2.4 Mining induced seismic activity
Deep-level mining inducing seismic activity occurs in close proximity to the Tlokwe
Local Municipality area. For example, Stilfontein gold mine is approximately 2.5 km
from the Tlokwe Local Municipality boundary (Odendaal, 2011; Durrheim et al.,

89
2010; Meyer, 2005; Kirsten, 1994:1). The investigation of Durrheim et al., (2006: 7-
8) is important, since it found that deep mining caused rocks surrounding
excavations to deform, straining the rock mass and causing failures either along
pre-existing weaknesses or causing new raptures. Large seismic events invariably
take place along pre-existing geological weaknesses, and sometimes may occur
hundreds of metres away from the mining activity. Dewatering of the rock mass
during mining may tend to stabilise faults that are close to failure. When the
ground-water level in the mine rises (for example when a mine has stopped
pumping), fault stability decreases and seismic events are likely to be triggered.
The above highlights the potential hazardous effect of deep-level mining, and the
cessation of pumping of water from mines in respect of seismic events.
In the next paragraph, another consequence of the closing of mines and cessation
of pumping namely Acid Mine Drainage (AMD) is discussed.
3.4.2.5 AMD (Acid Mine Draining)
According to Naidoo (2009), AMD is one of the single most important threats to the
environment. AMD arises primarily when mineral pyrites (fool's gold or iron
disulphide), comes into contact with oxygenated water, converting it into acidic
water that has an increased solubility for heavy metals including Uranium, thereby
further increasing the toxicity of the water (Pratt, 2011:Online; McCarthy,
2011:Online; McCarthy, 2010:Online). In 2002, approximately 7-13.5 million litres
per day of AMD water started decanting from an abandoned mine near
Krugersdorp (Pratt, 2011:Online; Hobbs & Cobbing, 2007:Online), having a
significant impact on the environment. This resulted in a 16000 cubic metre void in
the calcium carbonate rock near the Cradle of Humankind world heritage site (Pratt,
2011:Online). A detailed discussion of AMD is provided in Appendix C 3.
The significance of the above is that it demonstrates the possibility of decanting of
AMD (or Acid Rock Drainage) on the surface and polluting surface water when
mining and pumping of mining void water ceases. In the case of the Mooi River,
one of its tributaries is in close proximity to a number of mines that have closed or
that are reaching the end of their productive life span.
90
3.4.2.6 Sinkholes and subsidence’s
Large dolomite aquifers underline significant portions of the Mooi River Catchments
area to the North and North East of Boskop Dam, the Wonderfontein Spruit
tributary of the Mooi River and areas within the Tlokwe Local Municipality area
(Potgieter, 2014). Dolomite is composed of CaMg(CO3)2, calcite (Ca(H2CO3)) and
magnesite (Mg(H2CO3)), that can under the right conditions dissolve in the
presence of H20 (water) and C02 (carbon dioxide) to form a weak carbonic acid
(H2CO3) (DOWA, 2009:6; Heath, 2008:5; DOPW, 2003:1). In nature and in the
absence of any major events, this process is slow and can take millions of years
before erosion, subsurface solution cavities and caves are formed (DOWA,
2009:4). The process of sinkhole forming begins when water percolates through
faults, fissures etc. into the sub surface dolomite, causing erosion as the carbonic
acid dissolves the dolomite, leaving large cavities below the ground surface with
the potential of collapsing and forming sinkholes. The process of sinkhole formation
can be triggered by surface water seepage (e.g. leaking water bearing services,
including sewage and storm water systems) eroding the soil covering the dolomite
rock and carrying material down into the underlying cave system, which breaks
through "cave-ins" to the surface to cause a sinkhole (DOPW, 2003:2). Sinkholes
can also form when the groundwater level is lowered (e.g. through borehole and
mine dewatering). This lowers pore water pressure, which then lowers the ground
bearing capacity (DOPW, 2003:2). The resulting sinkhole/s formed can be from 1 to
100m in diameter and between 1 to 150m deep (DOPW, 2003:2)
The above is significant from a disaster risk perspective, in that large portions of the
upper Mooi River, Wonderfontein Spruit and part of the Potchefstroom city area lie
on top of dolomite, and the impact of future mining activities (including closures) on
the groundwater levels and dolomite is unknown. Sinkholes are discussed in more
detail in appendix C4.
In the next paragraph, Uranium and radiation are discussed.
3.4.2.7 Uranium and radiation
Radioactivity is the spontaneous release of energy in the form of particles or waves
from unstable atoms (Wymer, 2001:300). The particles that can be released are

91
Alpha and Beta particles and the wave is known as the Gama wave (Wymer,
2001:300; Urone, 2001:790).
The effect of radiation on the body is known as ionising radiation, and it can have
either a deterministic effect or stochastic effect on the body. Deterministic effect is
where the energy is imparted to the cell; if the energy exceeds a certain threshold
(see Table 3), the cell stops functioning. If sufficient cells are damaged it can
destroy the tissue and impair functioning and may even cause death.
Table 3 Effects of a dose of radiation (Kotze et al., 2003:985; Urone, 2001:827)
Dose Effect Risk Ranking
according to
(Author) rem Sv
0-25 0-0.25 No observable effect Low
26-100 0.26-1 Slight or moderate decrease in white blood cell
count
Medium
100-
200
1-2 Significant reduction in white blood cells,
nausea, loss of hair, and is rarely fatal.
High
200-
500
2-5 Lethal to 50% of those exposed in 30 days if
untreated
High
>500 >5 Death High
Definition of rem and Sv based on Urone (2001:825-826)
rem Roentgen
equivalent man
A dose unit of ionizing radiation closely related to its effect on
biological tissue. rem = rad X Relative Biological Effectiveness
Sv Sievert Is defined as Gy (gray were I Gy = 1 J/kg = 1rad) x Relative
Biological Effectiveness

92
Stochastic effect occurs when the energy imparted to a cell is below the threshold,
and the cells survive, but may become modified. For example, after a latency
period that may develop into cancer cells (Wymer, 2001:300-301; Urone, 2001:825-
827). Uranium doses far exceeding national and international limits have been
found in the Wonderfontein Spruit tributary of the Mooi River (North West
Independent, 2013:1; Lang, 2011:Online; Masondo & Evans, 2011:Online; Lang,
2010:Online; Winde, 2010a:239; ).
The above provided a concise discussion of generic and water related hazards. In
the next section, a concise description is given of the methodology that is used to
obtain information related to Mooi River surface and groundwater catchment area
using quaternary catchment area C23D as an example of its application.
3.5 Description of the surface catchment of the Mooi River
3.5.1 The Quaternary catchment area of the Mooi River
In the previous sections, a generic description of the catchment hydrological cycle,
catchment area and hazards was provided. In this section, the Mooi River
catchment area is discussed with specific reference to the quaternary catchment
C23D. The limiting nature of the mini-dissertation allows for the in detail discussion
of only one of the quaternary catchment areas are discussed in detail. The
discussion includes the methodology used to describe the catchment system of the
Mooi River and a more detailed application of the methodology on quaternary
catchment C23D.
The first part of this section provides a schematic outlay of the quaternary
catchments C23D, C23E, C23F, C23G, C23H, C23K, C23J, C23L, that form the
Catchment Area of the Mooi River. This enables the reader to visualise the spatial
relationship of the quaternary catchment areas. This is followed by an overview of
the methodology used to provide a concise description of the quaternary catchment
area C23D. Figure 12 provides a schematic outlay of all the quaternary catchments
of the Mooi River, assisting with visualising the individual quaternary catchment's
spatial location and its relationship to the other quaternary catchments within the
catchment area of the Mooi River. In Figure 12, a schematic outlay of the
quaternary catchments based on Google Earth© satellite images and Map 1, 2 and

93
3 is provided. It should be noted that the schematic outline is not drawn to scale, as
its purpose is to indicate the relationship between the various catchment areas.
Figure 12: Schematic representation of the Mooi River and its major tributaries in
relation to the quaternary catchment areas.

94
A concise discussion of the methodology used to describe the Mooi River
catchment area and system follows.
3.5.2 The research design and methodology used to describe the Mooi River catchment area and system.
In this section, a concise description of the methodology used to describe the
catchment system is provided. It is used to identify and describe the catchment
area, point sources of inflows, potential hazards, potentially vulnerable
communities, ecosystems and other features that could influence the occurrence of
potential disasters.
To a significant extent, the methodology involves the identifying of spatial
information including artefacts that can be deduced from satellite images, such as
mining activity or signs thereof, farming activity or signs thereof, human settlements
or signs thereof, etc. that could also be identified from hard copy and digital maps,
photographs, satellite images and diagrams of the study area. It includes the use of
existing information in the form of studies (Commissioned by organs of state,
universities, etc.) and official reports (Environmental Impact Assessment Studies,
etc.) and therefore involves a document study, which is a qualitative methodology
(De Vos, et al., 2008:272,315; Struwig & Stead, 2007:13). The statistical method
used is mainly descriptive by nature, as graphs and summaries of analysed data
are used, for example in determining the gradient of a river course (Utts & Heckard,
2007:15.17) (See Appendix E Part D). The methodology and processes to identify
the surface water (that is the river with its tributaries) in the Mooi River catchment
area are discussed below.
Existing digital vector and raster maps, original copies of topographic maps, Google
Earth©, "World Wide Telescope: Microsoft Research©, and the review of recent
literature are used to identify the flow of the Mooi River, its tributaries, catchment
area, the point sources of inflows into the river, the points of discharge and features
of interest. This is achieved by using existing digital maps from various sources,
see Appendix D, topographic paper maps, and superimposing the maps on the
satellite images from Google Earth© and World Wide Telescope: Microsoft
Research© to identity features and to determine the accuracy of data by a process
similar to triangulation. In that, all the available, digital and hard copies of maps

95
together with personal observation and interpretation of satellite images are used to
collaborate the accuracy of the data used (Huysamens, 1995:169).
In the case of this study, Arc GIS©, a geographical information system was used to
convert various types of digital maps obtained from various sources into shape
files. It should be noted that many of the available maps are using the municipal
demarcations prior to the recent local government elections, and it is therefore
necessary to redraw these maps so as to include the new demarcations; for
example Merafong City is now included in the Gauteng Province. It should be noted
that although Potchefstroom is the official name of the area studied, the
municipality is called the Tlokwe City Council. The shape files are then reprocessed
to create demarcated shape files for the catchment area of the Mooi River and its
tributaries. The reprocessing included dissolving (Ormsby et al., 2009:284-5,286-
293), intersecting (Ormsby et al., 2009:315, 316), creating, and editing (Ormsby et
al., 2009:386-97) of features. The major landmarks and the rivers identified on the
shape files are then converted into kml (Keyhole Markup Language (Shankland,
2008:1)) format and are used (superimposed) together with Google Earth satellite
images to trace and verify the flow of the rivers; point sources; identify mining
activities and other artifacts that could impact on the ground- and surface water.
Snap shots (satellite images) of important landmarks, features and point sources
are then taken.
Where spatial information is only available on satellite images, the information was
traced and converted into kml format, and where necessary converted into shape
files. To verify dry river beds, or visual traces of old stream and river beds, contours
were used, imposed on satellite image, and digitized. The elevation of the digitized
paths was determined using the elevation profile tool application that is available on
Google Earth© together with the contour shape file of the catchment area, to ensure
that the traced possible river course has an elevation profile expected of a river
course. That is, the river would indicate a drop in mean level above sea level as it
flowed from its origin towards its catchment convergent point.
When using the data the following must be considered:
• Deviation in accuracy may arise as the magnification of the satellite images change.

96
• The projection of the earth which is spheroid, when represented in two dimensions, can cause distortions. These distortions can be observed where highly magnified satellite imagery sets join.
• The accuracy is dependent on the tools used to digitize. In this study the tool used for digitizing is a mouse.
• Despite the above possible accuracy problems, when determining perimeter and surface areas, using two different GIS (Arc GIS©, Planet GIS©), the deviation is less than 0.08 %.
The catchment data collected for the quaternary catchment area C23D, includes
vector layers of the rivers, local government data, roads, areas of seismic activity
and location of settlements and was superimposed on a satellite image of the
catchment area. The farms associated with the Wonderfontein Spruit and major
tributaries within quaternary catchment area C23D were then identified. The
elevation profile of the river and major tributaries in quaternary catchment C23D
were determined and converted to drop in metres over kilometres to give an
indication of angle of the slope of the river course, as it can be assumed that the
greater the angle of the slope of the river course, the greater the increase in the
water runoff rate that can be expected. These tables and graphs are attached as
Appendix E.4 & E. 5. Satellite images where photos are taken of important river
inflows, outflows, settlements, dams and other infrastructure (including, road
bridges, water canals, mine tailings and activities in the river bed that needed to be
considered when assessing the potential of hazards and the needs for effective
disaster risk management are attached as Appendix E 2 & E 3.
In this section, a map (Map 4 & Appendix A3) superimposed on a satellite image of
the C23D quaternary catchment area is provided, and is followed by a discussion
with the aim of providing more insight into the quaternary catchment area. The
discussion is divided into three sections. In the first section a general description of
the quaternary catchment is given; this includes farms, local government structure
related to the catchment, settlements and other points of interest. The second
section provides general dimensions, the perimeter, and the area of the catchment.
The third section discusses the river flow characteristics, which includes the
elevation profile. (Tables and graphs are attached as Appendix E). This is followed
by a discussion of a few of the significant points observed. It should be noted that

97
the above discussion is deduced from the observations of the satellite images and
shape files. The presentation of the quaternary catchment is provided below
3.5.3 The use of the above methodology to discuss Quaternary Catchment C23D
3.5.3.1 Introduction
The C23D catchment was used as a example in this study as it is arguably one of
the most vulnerable quaternary catchments in the Mooi River catchment, and it
provides an example how potential hazards have being manifested through
anthropological activities.
The Wonderfontein Spruit flows across a number of dolomitic compartments
separated by dolorite and syenite dykes, of which a number have been dewatered
to allow mining, (see Map 3) that do not only influence the quality and quantity of
water, but as the result of anthropogenic intervention, for example mining, have
potentially negatively impacted on water quality, quantity and environment.
The quaternary catchment C23D lies in the Gauteng Province. From its origin near
the Tudor Dam it flows through the Lancaster Dam, over the Luipaardsvlei-,
Kagiso-, Nelsghoogte-, Bekkersdal-, Gemspost- and Venterpost farms. At least
nine large mine tailings were identified, and a number of town developments on
either side of the Spruit (stream) can be observed. These include Kagiso,
Azaadville, Rietvallei, Mohlakena, Bekkersdal and Westonaria (See Appendix C:
Part A, B, C & D).
3.5.3.2 Catchment dimensions and river flow characteristics
The perimeter is 115.42 km and the catchment area is 512.5 km2. The river course,
flow and the drop in metres above mean sea level (mamsl) are outlined in Appendix
C: Part D & E.
3.5.3.3 Potential hazards in the quaternary catchment area C23D
The Wonderfontein Spruit has its origin at Tudor Dam (see Map 4), which is
presently filled with sediment high in radioactive particles, and water-flowing from
the point of the Tudor and Lancaster dams is highly acidic. From there the river
flows through the wetland to the South of Kagiso. In this area the wetlands, assists

98
in removing the sediments, and the pH of the water is increased as a result of the
occasional, raw sewage flows into the sprurt from the poorly maintained sewer
alongside the spruit near Kagiso and the Kagiso sewage pump. In this area the
activated sewage that enters from the Flip Human sewage works also provides
nutrients that helps sustain the wetland (Opperman, 2008:iii, 91, 96). It should be
noted that at many sewage plants there is an occasional flow of raw sewage into
African rivers (Kleynhans, 2011:2; Merafong Local Minicipality, 2011:24,43). The
sewage inflows assist in maintaining the wetlands. It is further estimated that the
mines in the West and Far West Rand discharge approximately 12 tons of uranium
in the fluvial system annually (Coetzee et al, 2006:20).
This could explain the reasons for finding sediments in the Wonderfontein Spruit
with uranium concentration up to 1000 times the natural background concentration,
and uranium concentrations of 10000 and 40000 times the natural background
concentration have been found in decanting groundwater from abandoned mines
(Coetzee et al, 2009:166). The mining process also results in the unnatural
leaching of heavy metals from the exposed reef. Therefore, water pumped from the
mine can have abnormally high concentrations of heavy metals and is a contributor
to the so-called Acid Mine Drainage (AMD). It is estimated that approximately 17
Ml/day (with a salt load of 12603 Kg /day) from the Wonderfontein Spruit, flows into
the Mooi River (Van Dyk, 2005:34). The significance of the quaternary catchment is
that it is heavily populated with a number of working and non-working deep-level
mines, large industries and large townships. The water in this catchment is
therefore exposed to hazardous pollutants and toxins. Secondly, the wetlands to a
certain extent slow down the flow of the water, thereby allowing sedimentation of
uranium and heavy metals through natural and biological processes. This also
assists with the normalization of the pH. Thirdly, the fresh water from the Mooi
River eyes and Gerhrad Minnebron Eye can have a diluting effect on the water-
flowing in from the Wonderfontein Spruit. Fourthly, the water quality and quantity
will via the surface and groundwater interaction have a significant influence on the
water used by Tlokwe Local Municipality for domestic use

99
Map 4: Quaternary Catchment C23D is superimposed on a Google
Earth© satellite image
100
3.6 Description of the groundwater associated with the Mooi River catchment.
3.6.1 Introduction
Groundwater forms part of the water-flow and water storage phase of the
catchment’s hydrological cycle (Davis, 2008:10-12). Groundwater and groundwater
voids have the potential to influence both the quantity of and quality of water
available in a catchment area. For example, discharge of hazardous toxins,
including radioactive nuclides, can result in geophysical hazards, including
sinkholes and seismic movements as the result of changes in the storage dynamics
(for example, significant increase or decrease of the groundwater level) of these
voids (Stoch & Winde, 2010:84). Two major sources of groundwater in the Mooi
River catchment area are namely dolomitic karst aquifers (dolomite compartments)
and underground voids. The majority of anthropogenic underground voids have
resulted from mining.
A concise discussion of the groundwater compartments (Dolomitic karst) in the
Mooi River catchment is given below.
3.6.2 Groundwater compartments
The compartments are composed of two chains of compartments each divided into
smaller compartments by dolerite and syenite dykes (Winde & Erasmus, 2011:294).
Portions of the one chain of compartments form part of the catchment area of the
Mooi River in the North and the other forms part of the catchment area of the
Wonderfontein Spruit (a tributary of the Mooi River) and the Mooi River catchment
between Klerkskraal Dam and Boskop Dam. Figure 13 provides a schematic
representation of the catchment area (it should be noted that it is not drawn to
scale).
Figure 13 illustrates the spatial relationship between the two chains of dolomite
compartments. The Northern compartments that form part of the Mooi River
Catchment Area is the Mooi River, Holfontein and Steenkoppies compartments
(Holland, 2009a:Online; Holland, 2009b:Online; Holland and Wiegmans,
2009:Online). As there is very little industrial, mining or community development or

101
commercial activity in these areas, the quality and quantity of the water is mainly
influenced by agricultural activities. The water is therefore of a reasonable quality
and of sufficient reserves.
Figure 13: Schematic representation of the Mooi River and major tributaries in relation to the quaternary catchment areas and Dolomitic

102
The water compartment associated with the Wonderfontein Spruit water catchment
area are Zuurbekom, Gemsbokfontein, Venterspost, Bank, Oberholzer and the
Boskop-Turffontein dolomitic karst compartments (Winde & Erasmus, 2011:293-
298;. Stoch & Winde, 2010:86-87; Holland, 2009a:Online; Holland 2009b:Online;
Department of Water Affairs & Forestry, 2006:29; Cousens & Garrett, 1969a:422;
Cousens & Garrett, 1969b:Online). Three of these compartments Venterspost,
Bank and Oberholzer, have been dewatered to prevent the flooding of the mines in
the area (Winde and Erasmus, 2011:293-298; Stoch & Winde, 2010:86-87;
Department of Water Affairs & Forestry, 2006:29). To prevent recharge of these
dewatered compartments, water is channelized away from the natural riverbed
through a pipeline which has a diameter of one metre and is approximately 29 km
in length and was built from Donaldson Dam to Carletonville. Secondly, water is
continuously pumped from the functioning mine voids, and the water not used by
the mine is released into the catchment. Thirdly, mine water released into the river
is channelized via cement canals to prevent the water recharging the voids.
3.6.3 Mining Voids
Gold mining in the catchment area is predominantly deep-level mining. To enable
extraction of gold bearing ore from the gold bearing reef, shafts were sunk below
the dolomite water compartments, then tunnels were excavated to reach the face
of the gold bearing reef, and the gold bearing reef was then extracted. In this
process, large cavities resulted, and in some instance the dolerite and syenitic
dykes that separated the compartments were breached, possibly compromising the
impermeable boundaries between the compartments. Water entering these cavities
or voids was then pumped to the surface to prevent flooding. When mines ceased
functioning, the pumping stops and these voids are exposed to potential flooding
and filled with water polluted from the heavy metals on the exposed face of the
voids and other pollutants in the void that are remnants of the mining activities
(Cousens & Garrett, 1969:425 -428). Figure 14 provides a schematic outline of the
mining basins in the East Rand, West Rand and Far West Rand, these basins are a
result of mining voids, that have as a result of mining compromised the dykes
separating the different compartments. In Figure 15, a schematic representation of
the mining voids in relation to the dolomitic compartments is provided.

103
Figure 14: Significant Mining Basins associated with the Wonderfontein Spruit Catchment Area.

104
Figure 15: Schematic representation of the dolomite compartment and mining voids associated with the Mooi River Catchment Area

105
Figure 14 and 15, provides an insight into the breaching of existing dolomitic
compartment’s, and the formation of new underground voids as the result of mining
that have the potential to store additional groundwater, while the potential does
exist, that mining initiated water pollutants such as AMD, heavy metals, radioactive
nucleotides, can now migrate between previously sealed compartments. The
significance from a disaster and water resource management perspective is their
potential to influence the water resource quality and quantity in the Mooi River,
therefore, processes, such as the cessation of mining and the consequential
flooding of mines, far beyond its surface catchment boundaries, and these factors
must be considered in long term disaster management planning.
A concise summary of this chapter is provided below.
3.7 Summary
In this chapter the two fundamental aspects of research objective 2, firstly, the
water catchment and resource system are conceptualised and secondly, a concise
description of generic and water related hazards is given. Both aspects are then
applied in a concise discussion of the quaternary catchment area C23D. Based on
the above, when developing a spatial information system to enhance effective
disaster risk management and disaster management, the factors outlined below
must be taken into consideration.
Firstly; It is important to identify the route of water-flow from precipitation to the river
streams, sources of possible pollution including point sources, and approximate
location of diffuse pollution (Davis, 2008:129). Water extraction points, factors
influencing the speed and quantity of water-flow, town planning and development
and other structures that could impact or be impacted upon potential hazards
related to the water catchment area and water resource. Information on
hydrological and geo-hydrological dynamics, including historical and current
records on base, peak and maximum flows of the river and its tributaries; the
historical and current records on the natural and anthropogenic reservoirs and
aquifers levels and capacities; flow rates of natural ingresses (springs, etc.) in
rivers from aquifers and; historical and current records of rain fall in the catchment

106
area and elevation profiles, will assist in the establishment of an effective disaster
risk and disaster management system.
To assist in addressing the possible hazards of floods, it is important to consider
high-risk geographic land types. These firstly, include river flood plains, which
include low-lying land that is in some instances highly fertile areas flanking rivers.
Natural and anthropogenic activities within the catchment area are reflected in the
receiving water ecosystem. This implies that information on the type of activity
including spatial information is required of all activities within the catchment area
that are potential hazards or potential hazard sources. The catchment area of the
river flowing may extend beyond the borders of the local municipality in which the
river flows. For example, the Mooi River catchment lies in two provinces, namely
the North West Province and Gauteng Province; three district councils, and Tlokwe,
Kgetleng River, Rustenburg, Ventersdorp, Merafong, Westonaria, Mogale City and
Westonaria Local Municipalities. Each of these governance structures has its own
priorities and needs. Therefore, the short and medium term needs for economic
and social development of one local municipality, may have a negating impact on
the economic development, social development and environmental integrity of a
local municipality downstream in the catchment. This implies that information and
spatial information on activities in the catchment areas within and outside the local
municipality’s area of responsibility that may have a hazardous impact on the local
municipality must be maintained and effectively utilized to avoid and mitigate
potential disasters.
A risk has two factors, namely probability and impact, and provision must be made
for these when determining the risk of a hazard and risk of a disaster. Hazard risk
determination is a process that includes identification, analysing evaluation and
resolving of the hazard risk. The relationship between the three determinants,
hazard, vulnerability and resilience must be taken into consideration and provision
must be made for all possible hazards that may occur. Finally, vulnerable social,
economic and environmental systems must be spatially identified and the
vulnerability determined, so that the risk of disaster can be reduced or mitigated.

107
The concise discussion on quaternary catchment area C23D provides a
methodology for identifying, obtaining and presenting the information needed for an
effective spatial information system.
In the next chapter, a spatial information system is conceptualised.