2.2 Emerging trends in hazards, vulnerability patterns and ...
19
Living with Risk: A global review of disaster reduction initiatives 44 2.2 Emerging trends in hazards, vulnerability patterns and the impact of disasters More than 90 per cent of the deaths related to natural disasters occur in developing countries. Disaster impact statistics show a global trend that there are now more disasters but fewer people dying, even though greater numbers of people are affected and economic losses are increasing. Physical exposure of human beings and the fragility of economic assets to disasters have been partly shaped by patterns of settlement. Beneficial climatic and soil conditions that have spurred economic activities are associated with hazard-prone landscapes. Both volcanic slopes and flood plains historically have attracted human activities. Where settlement patterns have contributed to configure risk scenarios, new forces such as population growth and increased rural/urban migration act as dynamic pressures which contribute to increasing people’s exposure to hazards. Poverty levels and the impact of development processes, especially those associated with an increasingly global society reflect current trends in socio-economic vulnerability related to the impacts of disasters. The pace of modern life has also introduced new forms of vulnerabilities related to technological developments and biological threats. Localized and systemic environmental degradation is becoming highly influential as well, lowering the natural resilience to disasters. This is demonstrated by delayed recovery time and a weakened resource base on which human activity relies. Phenomena like El Niño/La Niña, climate change and the potential for rising sea levels, are affecting the patterns and intensity of hydrometeorological hazards. Environmental degradation influences the effects of natural hazards by exacerbating their impacts and limiting the natural coping capacity and resilience of the areas affected. Biological hazards in the form of plant or animal contagion, extensive infestations, human disease epidemics and pandemics continue to influence society in new and unpredictable ways. They exert particular impact on critical social aspects such as mortality, family relationships, health and economic productivity, among other things. Disasters triggered by technological hazards often result in major accidents associated with industrialization and technological innovation. These can have a significant socio-economic and environmental impact. Although technological hazards have been part of society for hundreds of years, trends show increasing impact. Specifically, in the energy, transportation and industrial sectors, technology can carry associated risks that are not always understood. The adverse effects of some technological disasters, both on society and on the environment, can considerably outlast the impacts associated with natural disasters.
Transcript of 2.2 Emerging trends in hazards, vulnerability patterns and ...

Living with Risk: A global review of disaster reduction initiatives
44
2.2 Emerging trends in hazards, vulnerability patterns and the impact of disasters
More than 90 per cent of the deaths related to natural disasters occur in developing countries. Disaster impactstatistics show a global trend that there are now more disasters but fewer people dying, even though greaternumbers of people are affected and economic losses are increasing.
Physical exposure of human beings and the fragility of economic assets to disasters have been partly shaped bypatterns of settlement. Beneficial climatic and soil conditions that have spurred economic activities are associatedwith hazard-prone landscapes. Both volcanic slopes and flood plains historically have attracted humanactivities.
Where settlement patterns have contributed to configure risk scenarios, new forces such as population growthand increased rural/urban migration act as dynamic pressures which contribute to increasing people’s exposureto hazards.
Poverty levels and the impact of development processes, especially those associated with an increasingly globalsociety reflect current trends in socio-economic vulnerability related to the impacts of disasters. The pace ofmodern life has also introduced new forms of vulnerabilities related to technological developments and biologicalthreats.
Localized and systemic environmental degradation is becoming highly influential as well, lowering the naturalresilience to disasters. This is demonstrated by delayed recovery time and a weakened resource base on whichhuman activity relies.
Phenomena like El Niño/La Niña, climate change and the potential for rising sea levels, are affecting thepatterns and intensity of hydrometeorological hazards. Environmental degradation influences the effects ofnatural hazards by exacerbating their impacts and limiting the natural coping capacity and resilience of theareas affected.
Biological hazards in the form of plant or animal contagion, extensive infestations, human disease epidemics andpandemics continue to influence society in new and unpredictable ways. They exert particular impact on criticalsocial aspects such as mortality, family relationships, health and economic productivity, among other things.
Disasters triggered by technological hazards often result in major accidents associated with industrialization andtechnological innovation. These can have a significant socio-economic and environmental impact. Althoughtechnological hazards have been part of society for hundreds of years, trends show increasing impact.
Specifically, in the energy, transportation and industrial sectors, technology can carry associated risks that arenot always understood. The adverse effects of some technological disasters, both on society and on theenvironment, can considerably outlast the impacts associated with natural disasters.
2Risk awareness and assessment2.2 Emerging trends in hazards, vulnerability patterns and the impact of disasters
45
Trends in impact of disasters
While no country in the world is entirely safe, thelack of capacity to limit the impact of hazardsremains a major burden for developing countries,where over 90 per cent of natural disasters fatalitiesoccur. Twenty-four of the 49 least developedcountries still face high levels of disaster risk. Atleast six of them experienced between two and eightmajor disasters during each of the last 15 years,with long-term consequences for humandevelopment. These figures do not include theconsequences of the many smaller and unrecordeddisasters that cause significant loss at the local level.
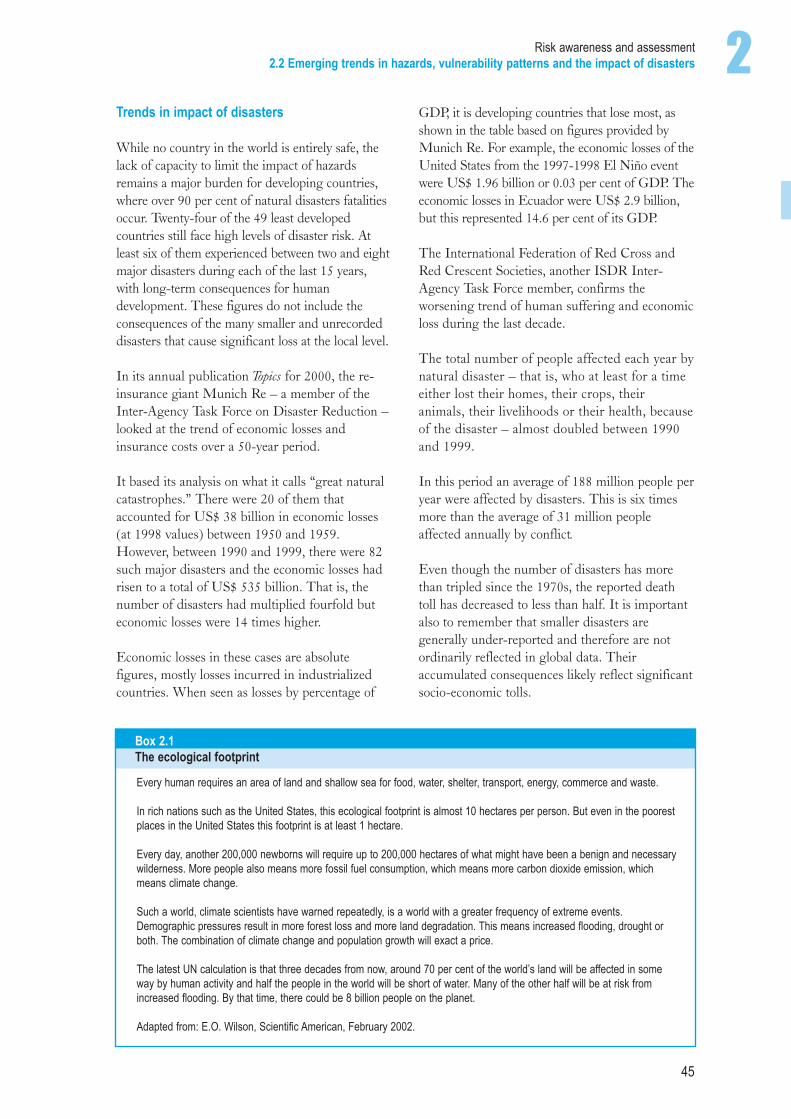
In its annual publication Topics for 2000, the re-insurance giant Munich Re – a member of theInter-Agency Task Force on Disaster Reduction –looked at the trend of economic losses andinsurance costs over a 50-year period.
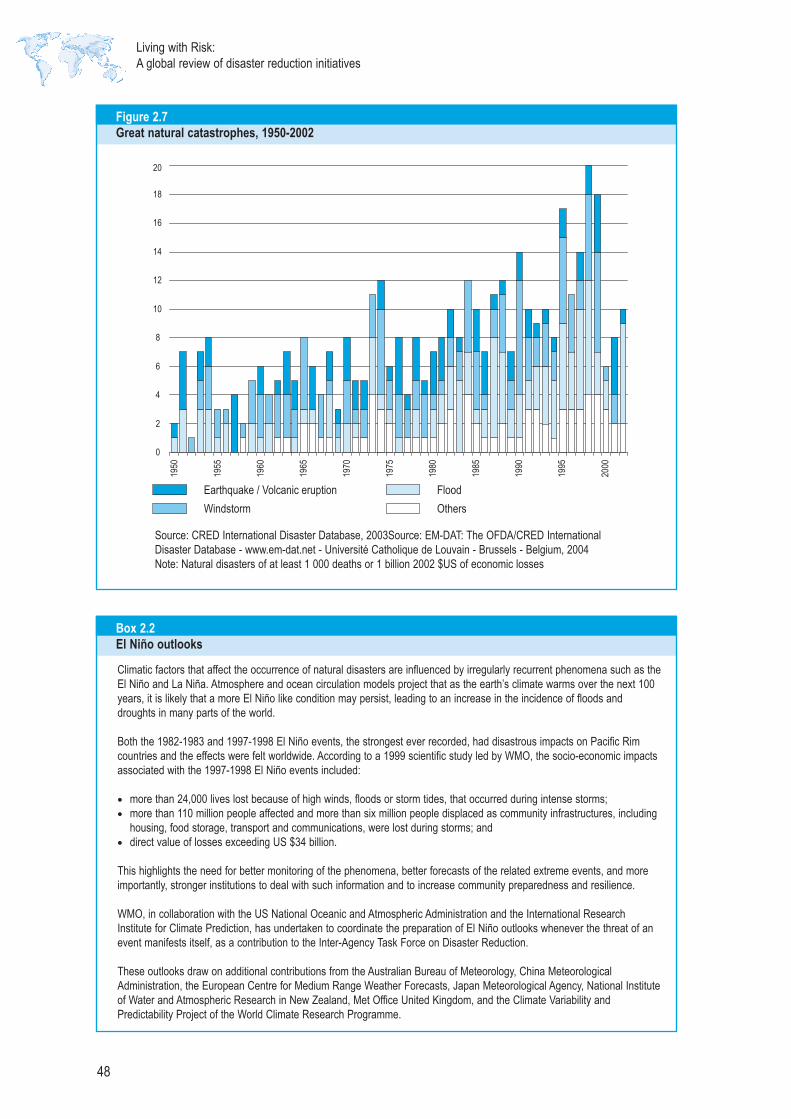
It based its analysis on what it calls “great naturalcatastrophes.” There were 20 of them thataccounted for US$ 38 billion in economic losses(at 1998 values) between 1950 and 1959.However, between 1990 and 1999, there were 82such major disasters and the economic losses hadrisen to a total of US$ 535 billion. That is, thenumber of disasters had multiplied fourfold buteconomic losses were 14 times higher.
Economic losses in these cases are absolutefigures, mostly losses incurred in industrializedcountries. When seen as losses by percentage of
GDP, it is developing countries that lose most, asshown in the table based on figures provided byMunich Re. For example, the economic losses of theUnited States from the 1997-1998 El Niño eventwere US$ 1.96 billion or 0.03 per cent of GDP. Theeconomic losses in Ecuador were US$ 2.9 billion,but this represented 14.6 per cent of its GDP.
The International Federation of Red Cross andRed Crescent Societies, another ISDR Inter-Agency Task Force member, confirms theworsening trend of human suffering and economicloss during the last decade.
The total number of people affected each year bynatural disaster – that is, who at least for a timeeither lost their homes, their crops, theiranimals, their livelihoods or their health, becauseof the disaster – almost doubled between 1990and 1999.
In this period an average of 188 million people peryear were affected by disasters. This is six timesmore than the average of 31 million peopleaffected annually by conflict.
Even though the number of disasters has morethan tripled since the 1970s, the reported deathtoll has decreased to less than half. It is importantalso to remember that smaller disasters aregenerally under-reported and therefore are notordinarily reflected in global data. Theiraccumulated consequences likely reflect significantsocio-economic tolls.
Box 2.1The ecological footprint
Every human requires an area of land and shallow sea for food, water, shelter, transport, energy, commerce and waste.
In rich nations such as the United States, this ecological footprint is almost 10 hectares per person. But even in the poorestplaces in the United States this footprint is at least 1 hectare.
Every day, another 200,000 newborns will require up to 200,000 hectares of what might have been a benign and necessarywilderness. More people also means more fossil fuel consumption, which means more carbon dioxide emission, whichmeans climate change.
Such a world, climate scientists have warned repeatedly, is a world with a greater frequency of extreme events.Demographic pressures result in more forest loss and more land degradation. This means increased flooding, drought orboth. The combination of climate change and population growth will exact a price.
The latest UN calculation is that three decades from now, around 70 per cent of the world’s land will be affected in someway by human activity and half the people in the world will be short of water. Many of the other half will be at risk fromincreased flooding. By that time, there could be 8 billion people on the planet.
Adapted from: E.O. Wilson, Scientific American, February 2002.
Living with Risk: A global review of disaster reduction initiatives
46
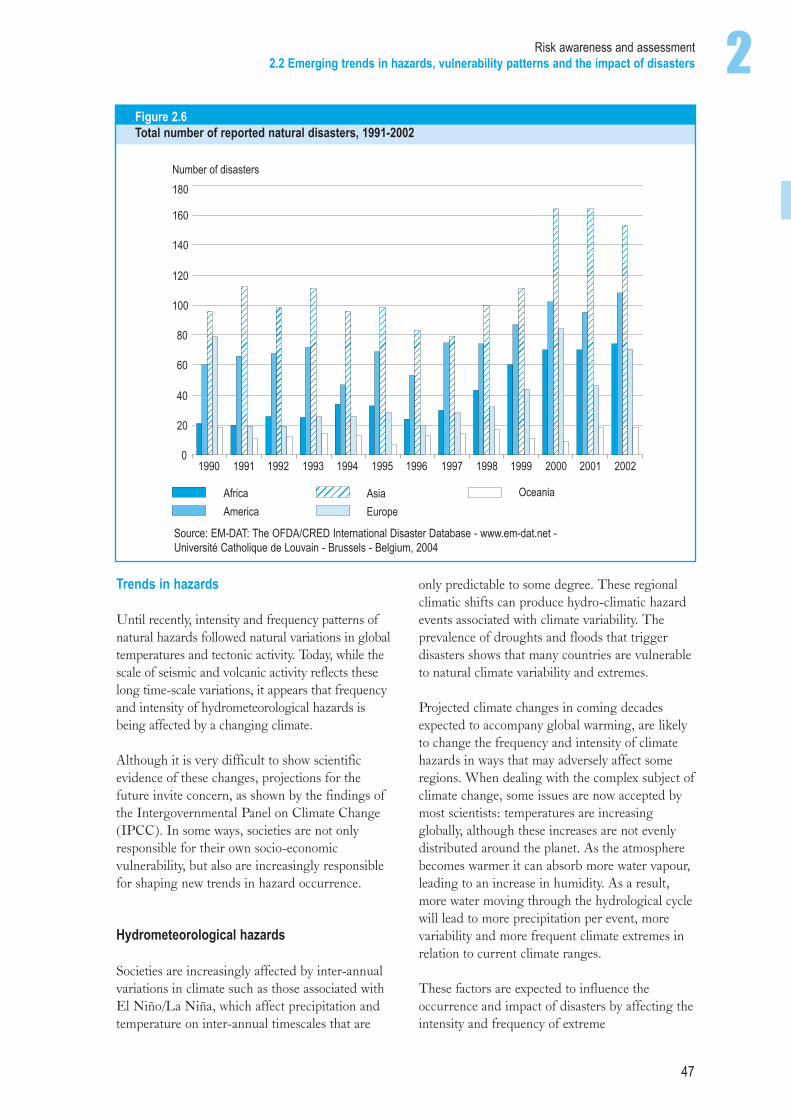
There is considerable geographic variation in theoccurrence and impact of natural hazards. Asiawas affected by approximately 43 per cent of allnatural disasters in the last decade. During thesame period, Asia accounted for almost 70 percent of all lives lost due to natural hazards.
During the two El Niño periods of 1991-1992and 1997-1998, floods in China alone affectedover 200 million people in each period.Nevertheless, in relative terms and considered percapita, Africa is the most heavily affected region,in particular when drought, epidemics and famineare considered.
The most terrible year in human losses during thelast decade was 1991, when a cyclone devastatedBangladesh killing 139,000 people, bringing theglobal deaths for that year to 200,000.
Cyclones continue to hit the Bangladesh coastsbut such a catastrophe has not happened since.This is in part because the machinery of warningand preparedness – watchful officials, an awarepublic and a stronger sense of communityresponsibility – has improved in the last decade.
The worst disaster-related global economic loss ofthe 1990s was the 1995 Great Hanshin-Awajiearthquake in Kobe, Japan. A highly developed andwell-prepared nation faced serious setbackseconomically by losing important facilities of aprimary port. Even eight years after that disaster, theamount of trade passing through Kobe remains 15per cent less than pre-earthquake totals.
A particular concern emerging from long-termdisaster trends is that the number and impact ofweather-related disasters have rapidly increased overthe last few decades. A comprehensive studyundertaken by the World MeteorologicalOrganization (WMO) looked at weather impacts for2002 and examined their complexities and impact ondifferent countries.
Notable points from this study were the catastrophicfloods in Europe in August, causing losses of about $20billion (the bulk of the year’s global losses), the severewinter for Mongolia resulting in estimated losses equalto 15 per cent of gross national income, and the tropicalstorms in the Federated States of Micronesia, where thefatalities reached the exceptionally high national rate of40 per 100,000 people.
Figure 2.5Economic losses, major* natural disasters, 1950-2002
Economic losses (in billion $US, 2001 values)of which insured losses (in billion $US, 2001 values)
Trend of economic lossesTrend of insured losses
>167
0
10
20
30
40
50
60
70
80
1950 1955 1960 1965 1970 1975 1980 1985 1990 1995 2000
Billion $US
Source: MunichRe, 2002*Note: Exceeding 100 deaths and/or $US 100 million in claims
Trends in hazards
Until recently, intensity and frequency patterns ofnatural hazards followed natural variations in globaltemperatures and tectonic activity. Today, while thescale of seismic and volcanic activity reflects theselong time-scale variations, it appears that frequencyand intensity of hydrometeorological hazards isbeing affected by a changing climate.
Although it is very difficult to show scientificevidence of these changes, projections for thefuture invite concern, as shown by the findings ofthe Intergovernmental Panel on Climate Change(IPCC). In some ways, societies are not onlyresponsible for their own socio-economicvulnerability, but also are increasingly responsiblefor shaping new trends in hazard occurrence.
Hydrometeorological hazards
Societies are increasingly affected by inter-annualvariations in climate such as those associated withEl Niño/La Niña, which affect precipitation andtemperature on inter-annual timescales that are
only predictable to some degree. These regionalclimatic shifts can produce hydro-climatic hazardevents associated with climate variability. Theprevalence of droughts and floods that triggerdisasters shows that many countries are vulnerableto natural climate variability and extremes.
Projected climate changes in coming decadesexpected to accompany global warming, are likelyto change the frequency and intensity of climatehazards in ways that may adversely affect someregions. When dealing with the complex subject ofclimate change, some issues are now accepted bymost scientists: temperatures are increasingglobally, although these increases are not evenlydistributed around the planet. As the atmospherebecomes warmer it can absorb more water vapour,leading to an increase in humidity. As a result,more water moving through the hydrological cyclewill lead to more precipitation per event, morevariability and more frequent climate extremes inrelation to current climate ranges.
These factors are expected to influence theoccurrence and impact of disasters by affecting theintensity and frequency of extreme
2Risk awareness and assessment2.2 Emerging trends in hazards, vulnerability patterns and the impact of disasters
47
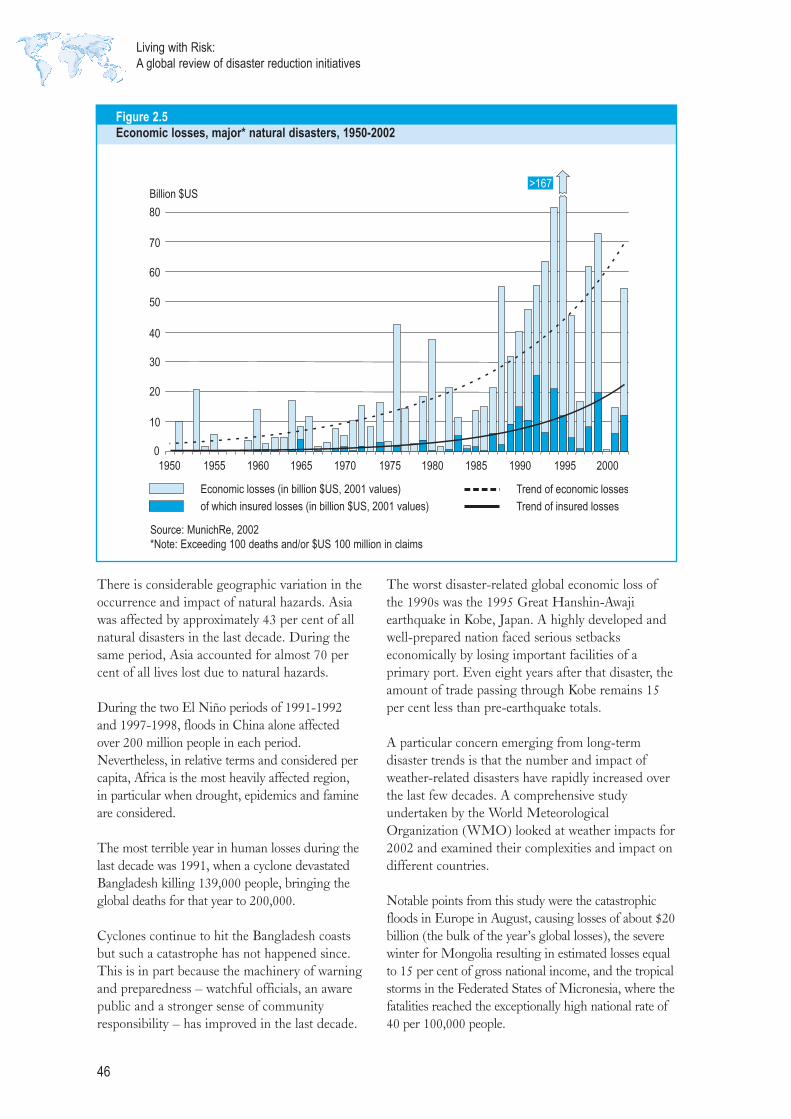
Figure 2.6Total number of reported natural disasters, 1991-2002
AfricaAmerica
AsiaEurope
Oceania
1990 1991 1992 1993 1994 1995 1996 1997 1998 1999 2000 2001 20020
20
40
60
80
100
120
140
160
180Number of disasters
Source: EM-DAT: The OFDA/CRED International Disaster Database - www.em-dat.net - Université Catholique de Louvain - Brussels - Belgium, 2004
Living with Risk: A global review of disaster reduction initiatives
48
Figure 2.7Great natural catastrophes, 1950-2002
Earthquake / Volcanic eruptionWindstorm
FloodOthers
1950
1955
1960
1965
1970
1975
1980
1985
1990
1995
2000
0
2
4
6
8
10
12
14
16
18
20
Source: CRED International Disaster Database, 2003Source: EM-DAT: The OFDA/CRED InternationalDisaster Database - www.em-dat.net - Université Catholique de Louvain - Brussels - Belgium, 2004Note: Natural disasters of at least 1 000 deaths or 1 billion 2002 $US of economic losses
Box 2.2El Niño outlooks
Climatic factors that affect the occurrence of natural disasters are influenced by irregularly recurrent phenomena such as theEl Niño and La Niña. Atmosphere and ocean circulation models project that as the earth’s climate warms over the next 100years, it is likely that a more El Niño like condition may persist, leading to an increase in the incidence of floods anddroughts in many parts of the world.
Both the 1982-1983 and 1997-1998 El Niño events, the strongest ever recorded, had disastrous impacts on Pacific Rimcountries and the effects were felt worldwide. According to a 1999 scientific study led by WMO, the socio-economic impactsassociated with the 1997-1998 El Niño events included:
• more than 24,000 lives lost because of high winds, floods or storm tides, that occurred during intense storms;• more than 110 million people affected and more than six million people displaced as community infrastructures, including
housing, food storage, transport and communications, were lost during storms; and• direct value of losses exceeding US $34 billion.
This highlights the need for better monitoring of the phenomena, better forecasts of the related extreme events, and moreimportantly, stronger institutions to deal with such information and to increase community preparedness and resilience.
WMO, in collaboration with the US National Oceanic and Atmospheric Administration and the International ResearchInstitute for Climate Prediction, has undertaken to coordinate the preparation of El Niño outlooks whenever the threat of anevent manifests itself, as a contribution to the Inter-Agency Task Force on Disaster Reduction.
These outlooks draw on additional contributions from the Australian Bureau of Meteorology, China MeteorologicalAdministration, the European Centre for Medium Range Weather Forecasts, Japan Meteorological Agency, National Instituteof Water and Atmospheric Research in New Zealand, Met Office United Kingdom, and the Climate Variability andPredictability Project of the World Climate Research Programme.
2Risk awareness and assessment2.2 Emerging trends in hazards, vulnerability patterns and the impact of disasters
49
hydrometeorological events. As is known,changes in precipitation patterns, soilmoisture and vegetation cover are linked tothe occurrence of floods and droughts aswell as contributing to landslides and othertypes of debris flow. Another likely result ofglobal warming is rising sea levels whichwould contribute to higher storm surgesduring hurricane and typhoon landfall incoastal areas.
The Inter-Agency Task Force on DisasterReduction (IATF/DR) has a workinggroup dealing with climate and disasters. Inthe area of drought preparedness andmitigation, there are a number ofcoordinated and collaborative initiatives thatare foreseen to be undertaken within theframework of the IATF/DR involving all itsworking groups.
Drought
Drought is usually characterized in terms of its spatialextension, intensity and duration. Its creepingcharacteristics and various impacts make the adoption ofa precise and universally accepted definition of droughtdifficult, adding a degree of confusion. Drought is oftenforgotten once it ends, and seems to catch everybodyunawares again once it reappears.
Droughts are usually classified as being meteorological,hydrological, agricultural, economic or social in nature,revealing the multiple and cross-cutting causes andimpacts on societies and ecosystems.
Box 2.32002 floods in Europe
Flood damageUnusually heavy rain provoked record floods inEurope and Asia in 2002. According to WMO,“Floods in more than 80 countries have killedalmost 3,000 people and caused hardship for morethan 17 million worldwide since the beginning of2002. Property damage amounted to over US$ 13billion with more than 8 million square kilometres ofland affected by floods – an area almost as large asthe United States”.
In Europe, the rains starting in August provokedflooding of the major rivers, including the Elbe,Danube, and Vltava. Prague and Dresden were atthe centre of the storm, with the Czech Republic,Slovakia, Germany and Austria hit hard. Alsoaffected were Italy, Spain, Russia, Romania andHungary. Over 100 people died, hundreds ofthousands were evacuated, and there wasextensive damage to basic infrastructure and thecommercial and private sectors. According toMunichRe, the losses in economic terms amountedto more than 15 billion Euros.
Tea and sympathyResponding to the floods, some Mozambican artistsorganized a concert called “Bridge over troubledwater” in sympathy for the affected people, althoughtheir country is still recovering from the 2000 and2001 floods. The Government of Sri Lanka, for itspart, airlifted no less than 2000 kilograms of Ceylontea to German, Austrian and Czech flood victims.
Source: <http://www.reliefweb.int/w/rwb.nsf/s> and<http://www.iutcolmar.uha.fr/internet/Recherche/JCERDACC.nsf>.
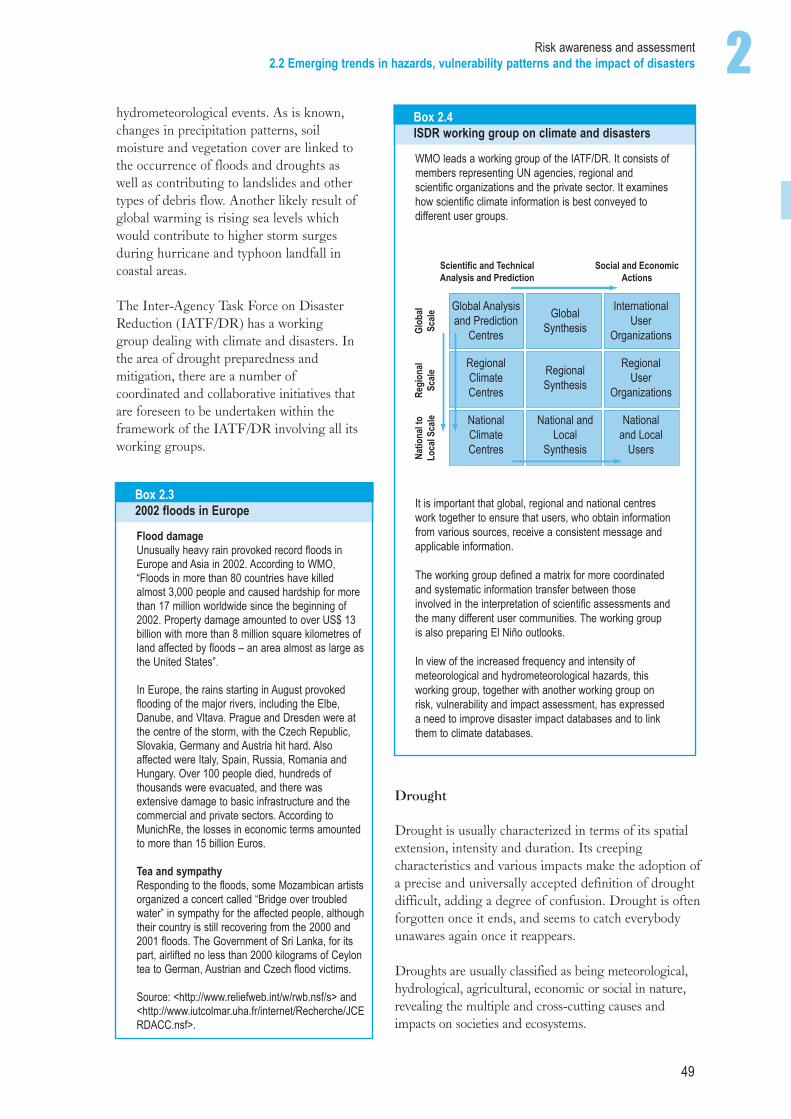
Box 2.4ISDR working group on climate and disasters
WMO leads a working group of the IATF/DR. It consists ofmembers representing UN agencies, regional andscientific organizations and the private sector. It examineshow scientific climate information is best conveyed todifferent user groups.
It is important that global, regional and national centreswork together to ensure that users, who obtain informationfrom various sources, receive a consistent message andapplicable information.
The working group defined a matrix for more coordinatedand systematic information transfer between thoseinvolved in the interpretation of scientific assessments andthe many different user communities. The working groupis also preparing El Niño outlooks.
In view of the increased frequency and intensity ofmeteorological and hydrometeorological hazards, thisworking group, together with another working group onrisk, vulnerability and impact assessment, has expresseda need to improve disaster impact databases and to linkthem to climate databases.
Global Analysisand Prediction
Centres
GlobalSynthesis
InternationalUser
Organizations
RegionalClimateCentres
RegionalSynthesis
RegionalUser
Organizations
NationalClimateCentres
National andLocal
Synthesis
Nationaland Local
Users
Scientific and TechnicalAnalysis and Prediction
Social and EconomicActions
Glob
alSc
aleRe
gion
alSc
aleNa
tiona
l to
Loca
l Sca
le
Living with Risk: A global review of disaster reduction initiatives
50
Meteorological drought is defined by thedeficiency of precipitation from expected ornormal levels over an extended period of time.Hydrological drought is best defined bydeficiencies in surface and subsurface watersupplies leading to a lack of water for meetingnormal and specific water demands.
Usually triggered by meteorological andhydrological droughts, agricultural drought may becharacterized by deficiency in the water availabilityfor specific agricultural operations such asdeficiency of soil moisture, which is one of the mostcritical factors in defining crop productionpotential. Economic droughts have been referred toas low rainfalls outside the normal expectedparameters with which an economy is equipped tocope. Social droughts are linked to the direct, aswell as indirect, impacts on human activities.
During coming years, it is expected thatvulnerability to drought will increase, mainly due topopulation increases, environmental degradationand development pressures. Several efforts havetherefore been made at international, regional and
national levels to address drought challenges.In that context, and unlike sudden-onset disasters,drought presents unique characteristics that requiredifferent approaches to reduce their impacts.
• Drought does not directly destroy shelter,infrastructure or food stores.
• Drought effects are cumulative.• It is often very difficult to detect the onset of
droughts until major impacts becomediscernible, such as lack of water or food.
• Impacts can be spread over a largergeographical area than the damages that resultfrom most other natural disasters.
• Quantification of impacts and provision ofdisaster relief is far more difficult.
Further, there are several social and economicparameters that affect the severity of drought. Foodprices, conflicts, human activity, vegetation, watersupplies and demand, all make it extremely difficultto quantify or define indicators of its severity.
Southern AfricaDrought has been a recurrent feature in mostparts of Southern Africa, with five recent major
Box 2.5ISDR discussion group on drought
The ISDR ad hoc discussion group on drought, composed of sixteen experts, has produced a report, titled An IntegratedApproach to Reducing Societal Vulnerability to Drought. The document identifies many critical issues associated withdrought risk reduction, including:
• supporting and strengthening programmes for the systematic collection and processing of meteorological andhydrological observations;
• building and strengthening scientific networks for the enhancement of scientific and technical capacities in meteorology,hydrology and other related fields;
• developing an inventory of climate and water resources indicators and indices;• improving understanding of drought climatology (frequency, intensity and spatial extent) and patterns;• understanding the principal causes of drought at local, regional and global levels;• developing decision support models for the dissemination of drought-related information to end users and appropriate
methods for encouraging feedback on climate and water supply assessment products, and on other forms of earlywarning information;
• developing and disseminating vulnerability and risk assessment tools that are appropriate for different social andenvironmental conditions;
• disseminating drought planning methodologies that can be adopted by drought-prone countries in the preparation ofplans;
• developing national and regional drought management policies that emphasize monitoring and early warning, riskassessment, mitigation and response as an essential part of drought preparedness;
• supporting development of regional networks for drought preparedness that build greater institutional capacity by sharinglessons learned in drought monitoring, prediction, vulnerability assessment, preparedness and policy development;
• educating policy makers and the public regarding the importance of improved drought preparedness as a part ofintegrated water resources management; and
• enhancing collaboration among regional and international organizations, within regions as well as between regions toaddress overlapping responsibilities and jurisdictional issues.
The complete report is available on ISDR’s web site <http://www.unisdr.org>.
2Risk awareness and assessment2.2 Emerging trends in hazards, vulnerability patterns and the impact of disasters
51
periods of drought, in 1980-1983, 1987-1988,1991-1992, 1994-1995 and 1997-1998. Threeof these events were regional in scale, with the1991-1992 drought considered the worst inliving memory, placing more than 20 millionpeople at risk.
Central and South-West AsiaThe persistent multi-year drought occurring inCentral and South-West Asia since November2001 is an example of climatic variability thathas affected up to 60 million people in parts ofIran, Afghanistan, Tajikistan, Uzbekistan andTurkmenistan.
Chronic political instability in many parts of theregion and military action in Afghanistan havefurther complicated the situation. A recent studyby IRI concludes that over the last three yearsCentral and South-West Asia represent thelargest region of persistent drought in the world.
In Iran alone, 37 million people have beenaffected. Water reserves in the country werereduced by 45 per cent in 2001, 800,000 headof livestock were lost in 2000, and 2.6 millionhectares of irrigated land and 4 million hectaresof rain-fed agriculture were affected. Damage toagriculture and livestock has been estimated bythe UN at US$ 2.5 billion in 2001 and US$1.7 billion in 2000. Afghanistan and Pakistanare affected on a similar scale.
Sea level rise and coastal systemsAn estimated 46 million people living in coastalareas are at risk of flooding from storm surgesevery year, and sea-level rise poses a longer-termthreat. Climate change may likely exacerbatethese trends with significant impacts upon the
ecosystems and populations. A growing number ofpeople will inhabit coastal areas.
Many traditional communities and subsistencepopulations also rely on the wealth of resources incoastal areas and continue to be drawn to thesehigh-risk regions. For example, indigenous coastaland island communities in the Torres Strait ofAustralia and in New Zealand’s Pacific IslandTerritories are especially vulnerable.
Although adaptation options exist, such measuresare not easily implemented on low-lying land.Also, climate change and sea level rise issues arenot yet well incorporated in current models forcoastal zone management.
Box 2.6Reducing drought impacts
The need to improve drought preparedness throughthe development of policies and plans has becomewell accepted: South Africa (early 1990’s), sub-Saharan Africa (UNDP/UNSO, 2000), West Asian andNorth African countries, Mediterranean region(CIHEAM, 2001), Morocco. Some of theseprogrammes were developed with the UN Conventionto Combat Desertification (UNCCD). The total numberof countries who ratified the Convention is 190 (as atDecember 2003).
In Australia, the 1992 National Drought Policy is widelyrecognized as a successful policy and often replicated.It has three main objectives:
• encourage primary producers and other sections ofrural Australia to adopt self-reliant approaches tomanaging for climatic variability;
• maintain and protect Australia’s agriculture andenvironment resource base during periods ofextreme climate stress; and
• ensure early recovery of agriculture and ruralindustries, consistent with long-term sustainablegoals.
Living with Risk: A global review of disaster reduction initiatives
52
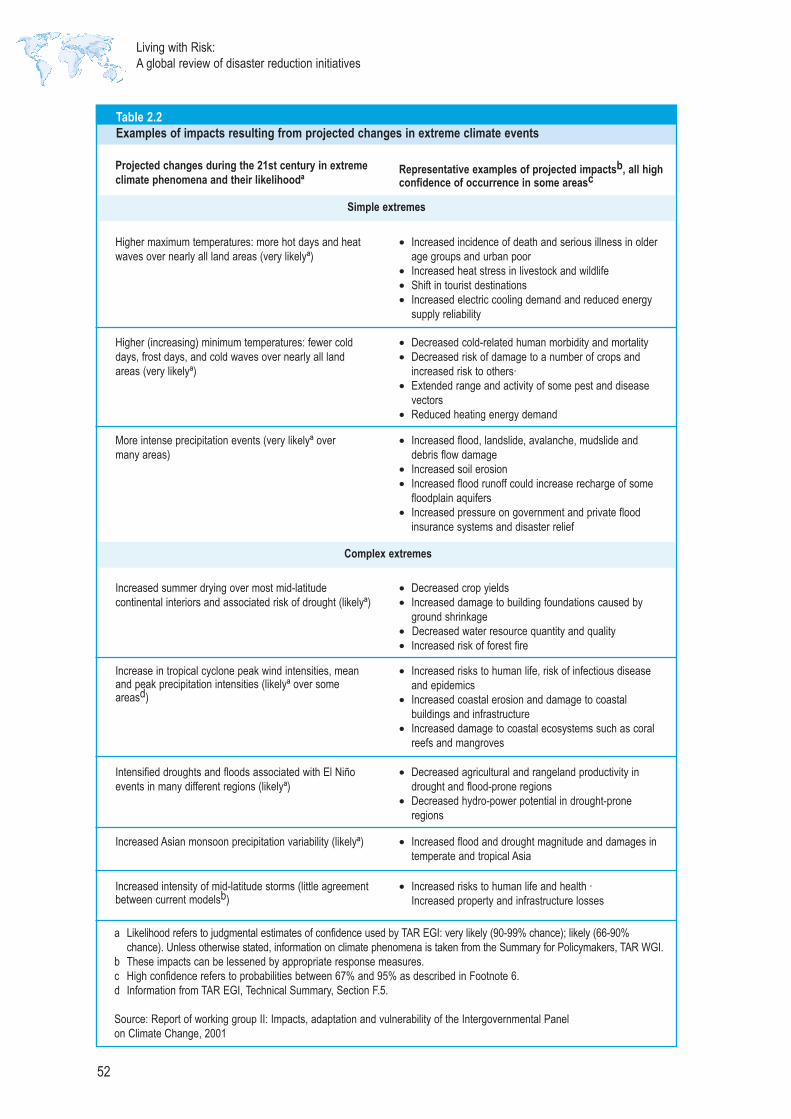
Table 2.2Examples of impacts resulting from projected changes in extreme climate events
Projected changes during the 21st century in extremeclimate phenomena and their likelihoodª
Representative examples of projected impactsb, all highconfidence of occurrence in some areasc
Higher maximum temperatures: more hot days and heatwaves over nearly all land areas (very likelyª)
• Increased incidence of death and serious illness in olderage groups and urban poor
• Increased heat stress in livestock and wildlife• Shift in tourist destinations• Increased electric cooling demand and reduced energy
supply reliability
Higher (increasing) minimum temperatures: fewer colddays, frost days, and cold waves over nearly all land areas (very likelyª)
• Decreased cold-related human morbidity and mortality• Decreased risk of damage to a number of crops and
increased risk to others·• Extended range and activity of some pest and disease
vectors• Reduced heating energy demand
More intense precipitation events (very likelyª over many areas)
• Increased flood, landslide, avalanche, mudslide anddebris flow damage
• Increased soil erosion• Increased flood runoff could increase recharge of some
floodplain aquifers• Increased pressure on government and private flood
insurance systems and disaster relief
Increased summer drying over most mid-latitudecontinental interiors and associated risk of drought (likelyª)
• Decreased crop yields• Increased damage to building foundations caused by
ground shrinkage• Decreased water resource quantity and quality• Increased risk of forest fire
Increase in tropical cyclone peak wind intensities, meanand peak precipitation intensities (likelyª over someareasd)
• Increased risks to human life, risk of infectious diseaseand epidemics
• Increased coastal erosion and damage to coastalbuildings and infrastructure
• Increased damage to coastal ecosystems such as coralreefs and mangroves
Intensified droughts and floods associated with El Niñoevents in many different regions (likelyª)
• Decreased agricultural and rangeland productivity indrought and flood-prone regions
• Decreased hydro-power potential in drought-proneregions
Increased Asian monsoon precipitation variability (likelyª) • Increased flood and drought magnitude and damages intemperate and tropical Asia
Increased intensity of mid-latitude storms (little agreementbetween current modelsb)
• Increased risks to human life and health ·Increased property and infrastructure losses
Simple extremes
Complex extremes
a Likelihood refers to judgmental estimates of confidence used by TAR EGI: very likely (90-99% chance); likely (66-90%chance). Unless otherwise stated, information on climate phenomena is taken from the Summary for Policymakers, TAR WGI.
b These impacts can be lessened by appropriate response measures.c High confidence refers to probabilities between 67% and 95% as described in Footnote 6.d Information from TAR EGI, Technical Summary, Section F.5.
Source: Report of working group II: Impacts, adaptation and vulnerability of the Intergovernmental Panel on Climate Change, 2001

2Risk awareness and assessment2.2 Emerging trends in hazards, vulnerability patterns and the impact of disasters
53
Geological hazards
Geological hazards include internal earthprocesses of tectonic origin, such as earthquakes,tsunamis and volcanic emissions, as well asexternal processes such as mass movements –landslides, rockslides, rock falls or avalanches,surface collapses, and debris and mud flows.
Earthquakes and volcanic eruptions represent theclassic rapid-onset, sudden-impact hazards. Theregional distribution of earthquakes andvolcanoes is closely related to the geophysicalactivity associated with the tectonic plates. Mostof the world’s earthquakes and volcanoes occuralong the tectonically active margins of thesemajor plates – but also at weak points withinthem.
While many tectonic hazards occur lessfrequently in a particular place than otherhazards, explosive demographic growth and rapidurbanization processes increase the exposure ofhuman beings and their economic assets.
Earthquakes and volcanic activity also act astriggering events for secondary or tertiary hazards.Ground-shaking effects produced by earthquakescan promote tsunamis and seiches, and areassociated with mass movements such aslandslides, avalanches and rockfalls. In the samefashion, ground deformation that accompaniesmagma’s rise in eruptive phases of volcanoes cangenerate massive landslides, debris flows andlahars.
Mass movement and landslides contribute to majordisasters every year on a global scale, and theirfrequency is on an upward trend. The number ofdeaths caused by landslides is likely underestimated,since they are usually masked by the broad disasterstatistics of earthquakes and floods. Recent examplesare the debris flows in Venezuela in December 1999with around 20,000 deaths, and the El Salvadorearthquakes of 2001, which caused 600 deaths in justone landslide.
Box 2.7Disaster risk and climate change
Although climate change from rising greenhouse gas concentrations is not implicated as the primary cause of the growth ofdisasters over recent decades, it remains highly relevant to disasters and to disaster reduction for several key reasons:
1. The existing trends evident in weather parameters, though small, will be having some effect on hazard events already – forexample rising global temperatures on heat waves.
2. The Intergovernmental Panel on Climate Change (IPCC) has consistently projected the likelihood of increased frequencyand intensity of hazards in the future – when and where these changes will become manifest is very uncertain, soprecautionary preparations are essential.
3. The experience of countries in managing multiyear climatic changes can provide valuable lessons for dealing with theprojected longer-term changes.
4. Disaster reduction provides a solid, meaningful, no-regrets set of activities in support of climate change adaptation plans.5. Responses to the climate change issue, in respect to both emission mitigation and adaptation, will inevitably alter the
climate-related risks of countries, possibly negatively.
Source: Report of working group II: Impacts, adaptation and vulnerability of the Intergovernmental Panel on Climate Change, 2001
Box 2.8Towards landslide risk management
The Joint Technical Committee on Landslides (JTC-1)comprises representatives from the International Society forSoil Mechanics and Geotechnical Engineering, theInternational Society for Rock Mechanics and theInternational Association for Engineering Geology. The JTC-1 promotes the development of educational programmes,including research, information dissemination and newtechniques in landslide risk reduction. It also organizesevents related to landslide risk management, such as theinternational symposium on landslides held every fouryears. <http://www.em.pucrs.br/islrio>
Another initiative on this subject is the InternationalConsortium on Landslides (ICL), a scientific NGO based atKyoto University, created under the auspices of UNESCO,WMO, FAO and the ISDR Secretariat. The ICL aims topromote landslide research, as well as landslide riskassessment and mitigation studies. To this purpose, it isfacilitating the development of specific projects inconjunction with the protection of cultural and naturalheritage.<http://icl.dpri.kyoto-u.ac.jp/>
Living with Risk: A global review of disaster reduction initiatives
54
Volcanic hazards
About 50 to 60 volcanoes erupt every year. Largeeruptions endanger the lives, settlements andlivelihoods of almost 500 million people estimatedto live near active volcanoes. That number willincrease in the future as more than 60 large andgrowing cities are located near potentially activevolcanoes.
Volcanoes with high levels of activity are locatedpredominantly in developing countries,particularly in Latin America, the Caribbean, andparts of Asia and in the South-West Pacific.Despite improvements in many national civildefence agencies, eruptions are becomingincreasingly risky because of rising populationdensities and expanding infrastructure in the areassurrounding volcanoes.
As the physical characteristics and chemicalproperties of a specific volcano become betterknown, it can be monitored more easily. However,the prediction of an impending eruption is still amajor challenge for volcanologists. Therefore,predicting future volcanic eruptions and related
hazards must also be matched with a series ofother forms of risk management, including:
• analysis of volcanic risks;• early warning and short-term forecasting of
eruptions;• timely evacuation of people from hazardous areas;• development of land-use and contingency plans
to minimize future volcanic disasters; and• sustained information programmes for the
population.
Major volcanic eruptions do not occurspontaneously. They are preceded by a variety ofphysical, geological and chemical changes whichaccompany the rise of magma towards the Earth’ssurface. The monitoring of these changes withwell-established scientific techniques provides thebest opportunity to develop a warning system.Recent volcanic events show that the cost ofmonitoring volcanic activity and pre-disasterplanning is very small when compared to thepotential losses.
For early warning to be effective, sustained publiceducation and information are necessary. This
Box 2.9Nyiragongo Volcano, Democratic Republic of the Congo
Goma is overshadowed by two large and active volcanoes, Nyiragongo and Nyamalagira. Both are linked by a commonsubterranean geological structure, and the crater of the former contains what is said to be the largest lava lake in the world.According to a French-British scientific report in 2002, any weaknesses in the sides could result in catastrophicconsequences for the surrounding population. Nyiragongo and neighbouring Nyamuragira are responsible for nearly two-fifths of Africa’s eruptions.
Nyiragongo is considered by the scientific community as one of the most dangerous volcanoes in Africa. In 1977 extremelyfluid, fast moving lava flows drained the lava lake killing about 50-100 people, although other estimates run as high as 2,000fatalities. Additional activity occurred in 1982 and 1994. Significantly, following a crater eruption of Nyamuragira in January2000, the only local volcanologist signalled the possibility of a later eruption of Nyiragongo, which indeed occurred inFebruary 2001.
In May 2001, the small Goma observatory requested assistance to acquire seismographs, thermometers and funds toconduct field surveys. Nyiragongo again showed signs of activity later in the year, and an earthquake was felt in Goma whileblack smoke was sighted above the volcano. Similar phenomena were noted in January 2002, that suggested an imminenteruption.
The local volcanologist again sent messages to the international community four days later, raising the alarm and requestingassistance. Nyiragongo began erupting on 17 January and continued for six days. One lava flow headed for the town ofGoma where it split the town in half. Another lava flow headed towards the town of Gisenyi in Rwanda.
According to an expert report, "the eruption forced the rapid exodus of 300,000 to 400,000 people, mostly into neighbouringRwanda, with dramatic humanitarian consequences… Forty-seven victims were reported killed directly due to the eruption,to which one must add another 60 people killed during the explosion of the petrol station in Goma centre on January 21."
At least 16,000 homes were destroyed, leaving 100,000 people homeless, and 24,000 children without schools. Goma andGisenyi also suffered from strong seismic activity associated with the eruption.
Adapted from: Final report of the French-British scientific team, 2002.
2Risk awareness and assessment2.2 Emerging trends in hazards, vulnerability patterns and the impact of disasters
55
includes understanding results of volcanic studiesand analysis, the possible dangers and the localplans to address them prior to emergencyconditions. This can be done through education,although the best prepared communities alsoconduct regular disaster warning and preventionexercises.
In 1990, the International Association ofVolcanology and Chemistry of the Earth’sInterior (IAVCEI) launched a programme tosupport the UN International Decade forNatural Disaster Reduction (IDNDR) and topromote the reduction of risks related tovolcanoes.
The initiative selected 16 volcanoes formonitoring and research with the aim of directingattention to a small number of active volcanoes. Itencouraged a range of research and public-awareness activities aimed at understanding thevolcanoes and the hazards they pose.
Biological hazards
A wide range of diseases, originated ortransmitted by organisms that affect people, theircrops or animals, are considered biologicalhazards.
Exposure to biological hazards is in many caseslinked to the occurrence of other natural hazards,such as floods, drought, and storms. Theincreasing prevalence of hydrometeorologicalhazards may influence the occurrence of water-and vector-borne diseases such as cholera,malaria, leptospirosis and typhus.
In the same vein, vulnerability to insectinfestations can constitute an additional source ofconcern for many countries, in association withthe impacts of climate change. That could be thecase for the Russian Federation, according to arecent national assessment of global climatechange and associated risks.
The outbreak of severe acute respiratorysyndrome (SARS) infected 6,000 people andcaused more than 400 deaths in 30 countries.WHO has declared SARS as the mostsignificant outbreak of disease spread through airtravel in history. The various impacts of SARS,
Box 2.10A society falling apart: Southern Africa’s silent disaster
When more than 14 million people in Southern Africafaced famine in 2002, an intervention with food aidbegan that by February 2003 had averted massstarvation. But hunger was not the crisis. It was asymptom of a pernicious new process.
HIV/AIDS, together with food shortages, poverty,common disease and mismanagement is bringing aregion to its knees. Millions are dying and all the foodaid mustered will not save them. What is needed is anintegrated approach that reverses the slow butinexorable destruction of Southern Africa’s socialfabric.
World attention is focused elsewhere because thetelevision images that define disaster in Africa aremissing in this case. There are not skeletal figuresstudded across the landscape, no agonizing evidenceof malnutrition, no hunger camps, and no endless linesof wasting children with flies buzzing in their eyes.
Today’s disaster is a silent one and most of thosedying are dying at home. The disaster is the erosion ofSouthern Africa’s communities. AIDS, a killer on itsown, is uniting with other factors to weaken andundermine the ways in which people recover fromadversity using age-old coping mechanisms.
Poor access to health care, the acculturated spread oftuberculosis, malaria and other diseases, an appallingabsence of safe water and sanitation, uncontrolledurbanization and ineffective agriculture are among theaggravating factors. Added to this is AIDS. So manyproblems are emerging and they are quietly feedingand exploiting one another.
Life is becoming unsustainable. Farmers fall ill withAIDS, wives leave the fields to nurse them. Fewerhands in the field means less food, and coupled withdrought, that may spell famine. But rain or no rain,there is poverty. The farmers die, leaving wivesinfected and penniless, wondering how to feed theirchildren and pay for their education. They cannotafford seed or fertilizer, cannot work the land as theyused to. And they agonize over their children’s future.Who will care for them when they are orphaned?
Southern Africa already counts 3.2 million childrenorphaned by AIDS, many of them in householdsheaded by the eldest child, where neither tomorrow’smeal nor education is certain. Schools exclude themwhen they cannot pay the fees, buy exercise booksand uniforms. While one generation is dying of AIDS,the next generation is being denied the right tosucceed.
Adapted from: Juan Manuel Suarez del Toro, President of the International Federation of Red Crossand Red Crescent Societies, 2003.
Living with Risk: A global review of disaster reduction initiatives
56
ranging from the restricted access to goods,services and information as well as severefinancial repercussions illustrate theincreasing vulnerability to biologicalhazards in the context of a shrinking world.
Among the biological hazards that pose athreat to contemporary societies, thehuman pandemic HIV/AIDS occupies aspecial place. Due to its enormous socialand economic impacts on communities, italso constitutes a major vulnerability factorfor other natural hazards. In particular,HIV/AIDS exacerbates vulnerability todrought conditions.
The situation is very critical in SouthernAfrica, facing catastrophic consequences ofHIV/AIDS infection. With manycountries recording adult HIV infectionrates of 25-30 per cent, the 1990s haveseen the deaths of thousands of skilledpeople occupying middle-managementpositions in the private and public sectors.
Precious opportunities to developsustainable local and technical capacities indisaster reduction have been underminedby continuing HIV-related deaths. Withits far-reaching effects that span allprofessions, social sectors and communitiesin Southern Africa, HIV/AIDS willcontinue to constitute a major aspect ofboth household and national vulnerabilityfor the foreseeable future.
Environmental degradation
As human activity continues to alter the biosphere,changes result in localized environments as well as inlarger ecosystems. Environmental degradationcompounds the actual impacts of hazards, limits anarea’s ability to absorb those impacts, and lowers theoverall natural resilience to hazard impacts and disasterrecovery.
In addition, environmental degradation that occurs and issignificant enough to alter the natural patterns in anecosystem, affects the regular temporal and spatialoccurrence of natural phenomenon. Climate variabilityand climate change are currently the most obviousexamples.
Environmental degradation, natural disasters andvulnerability are all linked. The connection betweenenvironmental degradation and the progressive impact ofnatural disasters can be illustrated by the case of theYangtze River basin in China, where concerns related toenvironmental vulnerability have been incorporated inwatershed management.
Viet Nam offers another example of the complex linksbetween deforestation, floods and landslides. Viet Nam’sforest cover dropped from 43 per cent to 28 per cent in50 years. This is due to a combination of many years ofwar, with the use of deforestation as a tool of war; legaland illegal trade in timber as Viet Nam’s economybecame more open to international investment and trade;and also quite likely by climate change. Reduced forestcover makes the people of Viet Nam more vulnerable tofloods and landslides.
Box 2.11Flooding in China
The catastrophic floods in the Yangtze River basin, China, in 1998, brought to national attention the fact that changes inthe use of land and the environmental degradation of watersheds had greatly exacerbated flooding. Extremely high levelsof rainfall in the Yangtze Basin and rapid snowmelt from Tibet and the Himalayas only magnified the risks posed bydegraded landscapes.
Prior to this event, the pressure for rapid development tended to overshadow environmental concerns. Sinceenvironmental degradation has now been firmly accepted as one of the root causes of increased impacts from naturalhazards, it is essential to understand and act on both the conceptual and operational links between environmentalmanagement and disaster risk reduction.
Having concluded that flooding was worsened by environmental degradation, in 1999 the government formulated a newpolicy framework to promote ecological watershed management. As a result, a massive plan was initiated to redirect land-use management in river basins, targeted at the Yangtze and the Yellow River basins.
In effect, economic and social pressures – made worse bydrought – have caused a breakdown of the traditional systemof land-use management that was adapted to such fragileenvironments.
2Risk awareness and assessment2.2 Emerging trends in hazards, vulnerability patterns and the impact of disasters
57
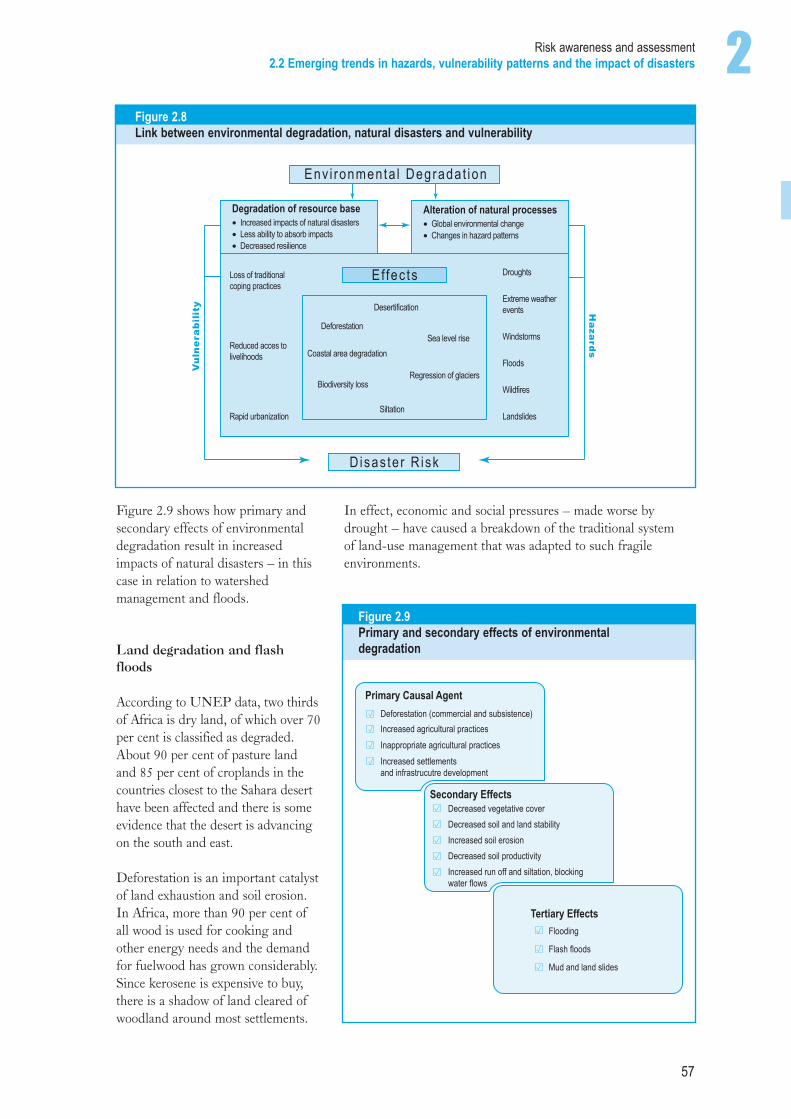
Figure 2.9 shows how primary andsecondary effects of environmentaldegradation result in increasedimpacts of natural disasters – in thiscase in relation to watershedmanagement and floods.
Land degradation and flashfloods
According to UNEP data, two thirdsof Africa is dry land, of which over 70per cent is classified as degraded.About 90 per cent of pasture landand 85 per cent of croplands in thecountries closest to the Sahara deserthave been affected and there is someevidence that the desert is advancingon the south and east.
Deforestation is an important catalystof land exhaustion and soil erosion.In Africa, more than 90 per cent ofall wood is used for cooking andother energy needs and the demandfor fuelwood has grown considerably.Since kerosene is expensive to buy,there is a shadow of land cleared ofwoodland around most settlements.
Figure 2.8Link between environmental degradation, natural disasters and vulnerability
Env i ronmenta l Degradat ion
Disas te r R isk
Effec ts
Degradation of resource base• Increased impacts of natural disasters• Less ability to absorb impacts• Decreased resilience
Alteration of natural processes• Global environmental change• Changes in hazard patterns
Loss of traditionalcoping practices
Reduced acces tolivelihoods
Rapid urbanization
Droughts
Extreme weatherevents
Windstorms
Floods
Wildfires
Desertification
Deforestation
Coastal area degradation
Biodiversity loss
Siltation
Sea level rise
Regression of glaciers
Vulnerability
Hazards
Landslides
Figure 2.9Primary and secondary effects of environmentaldegradation
Primary Causal AgentDeforestation (commercial and subsistence)Increased agricultural practicesInappropriate agricultural practicesIncreased settlementsand infrastrucutre development
Secondary Effects Decreased vegetative cover Decreased soil and land stability Increased soil erosion Decreased soil productivity Increased run off and siltation, blocking water flows
Tertiary Effects Flooding
Flash floods
Mud and land slides
Living with Risk: A global review of disaster reduction initiatives
58
Increasing land degradation also exacerbates floodrisk, especially flash floods. In Southern Africa,escalating land degradation is strongly associatedwith overgrazing, which accounts for more thanhalf the soil degradation in the region.
Wildland fire as an environmental hazard
Throughout the world, fire is part of agricultureand pastoral livelihoods. Natural wildfires areestablished elements in traditional land-usesystems and have beneficial effects in naturalecosystem processes and in bio-geo-chemicalcycles. However, the excessive use or incidence offire due to rapid demographic and land-usechanges leads to the destruction of property andreduction of natural productivity. Thoseconsequences reduce the carrying capacities,biodiversity and vegetation cover of the landscape.
Climate variability such as the periodic occurrenceof extreme droughts or the protracted effectsassociated with the El Niño/La Niña phenomenonadd to the severity of fire impacts. Projecteddemographic and climate change scenarios suggestthat these situations will become more criticalduring coming decades.
Box 2.12Land degradation in Southern Africa
Declining agricultural yields in countries of theSouthern Africa Development Community (SADC) arealso attributed to water erosion. In South Africa, asmuch as 6.1 million hectares of cultivated soil areaffected by water erosion, with up to 300 million tonsof soil lost annually due to physical degradationprocesses. Similarly, it is estimated that approximately30 per cent of croplands in communal farming areas ofZimbabwe have been abandoned due to depleted soilfertility.
In Zambia, soil erosion by water is the most seriousform of physical soil degradation, with approximately100,000 hectares designated at various stages ofdegradation. Land degradation processes have beenparticularly prominent in Zambia as a result ofdeforestation, dense human population, overgrazing,poor crop cover and poor soil managementtechniques. This is reflected in marked deforestation,reaching 2,644 square kilometres annually from 1990-1995. While land degradation increases the severity offlood and drought impacts in the region, it is anunsurprising outcome, both of widespread ruralpoverty as well as macroeconomic forces.
Box 2.13ISDR working group on wildland fires
The objective of the ISDR working group on wildlandfires has been to propose means and to facilitate thecreation of mechanisms to share information andundertake tasks to reduce the negative impacts offire on the environment and humanity. It bringstogether both technical members of the firecommunity and authorities concerned with policy andnational practices in fire management to realize theircommon interests of fire risk management anddisaster reduction at a global scale.
The working group was chaired and coordinated bythe Global Fire Monitoring Center at the Max PlanckInstitute for Chemistry, in Freiburg, Germany. Theworking group attends to the existing programmesbeing implemented by its members to ensurecomplementary work plans. It has pursued severalkey priorities:
• Establish, and determine operational proceduresfor a global network of regional and national focalpoints for the early warning of wildland fire, firemonitoring and impact assessment, with theintention to enhance existing global fire monitoringcapabilities and facilitate the functioning of aglobal fire management working programme ornetwork.
• Propose internationally agreed criteria for thecollection of fire data and related damageassessments in order to generate knowledgerequired by the various user communities atglobal, regional, national and local levels.
• Strengthen the existing regional, national and localcapabilities in fire management and policydevelopment through the dissemination ofinformation and increased networkingopportunities to meet multiple information needs.These include international initiatives such as theConvention on Biological Diversity, the Conventionto Combat Desertification, the UN FrameworkConvention on Climate Change, the UN Forum onForests, the FAO Global Forest ResourcesAssessment and the ongoing international criteriaand indicators processes of the CollaborativePartnership on Forests. They also embody theoverall scope of work of the UN agencies andprogrammes concerned.
• Transfer knowledge to local communities toadvance their participation and utilization ofappropriate tools that contribute to wildfireprevention, fire disaster preparedness and firehazard mitigation.
In 2004 the working group developed into a globalnetwork and programme.
<http://www.fire.uni-freiburg.de>
2Risk awareness and assessment2.2 Emerging trends in hazards, vulnerability patterns and the impact of disasters
59
Technological hazards
Technological hazards are related to quicklyoccurring, high-impact events such as hazardouschemical spills and nuclear accidents. They aretherefore linked more with exposure rather thanenvironmental degradation. In the case ofhazardous materials – chemical and toxic waste orleakage – exposure is the critical factor.
That was the case in Bhopal, India, in 1984,where gas leaked to form a deadly cloud thatkilled and injured thousands of people. Most ofthese casualties came from poor families allowed tosettle around the chemical plant. The fatalconsequences of this chemical release were directlyrelated to economic growth, as a complex andpoorly managed industrial system threatened anunsuspecting and unprepared community.
Exposure to technological hazards is notexclusively an urban industrial issue. Virtuallyevery modern product and process is disseminatedto most countries and social settings. Of the 25nations with operating nuclear power stations, atleast 14 are in developing countries. Major oilspills and releases of nuclear radiation areassociated predominantly with advanced energyand transportation technologies. Chernobyl,Exxon Valdez, Minimata and Bhopal are someunforgettable names of past technologicaldisasters. These should underline the importanceof reducing future risks.
Trends in physical vulnerability
Ninety per cent of the global population growthoccurs in Least Developed Countries (LDCs). Inthese countries, exposure to hazards is alreadyhigh through dense concentrations of populationin often unsafe human settlements. Vulnerabilitylevels are also exacerbated by socio-economic andenvironmental conditions.
In 1980, sub-Saharan Africa had a population of385 million. This figure is expected to at leastdouble by 2005. In some instances, foodproduction represents 40 per cent of GDP, yetpopulation growth is outstripping foodproduction. What is more, food production couldslow with less reliable rainfall patterns.
The long-term trends of demographic growth forLDCs are creating environmental, as well aspolitical, refugees. As many as 10 million peoplehave migrated during recent years but there mayeventually be even greater redistribution of theAfrican population in response to thedeteriorating food situation. Some of thisredistribution will likely concentrate even greaternumbers in hazardous areas, or swell cities thatare already poorly suited to address the needs ofrapid growth.
Due to the urban concentration of population, thegreatest potential for disaster exists in the 100most populous cities. Over three-quarters of theseare exposed to at least one natural hazard. No lessthan 70 of these cities can expect, on average, toexperience a strong earthquake at least once every50 years. The greatest concern is for the 50 fastestgrowing cities, all of which are located indeveloping countries.
Cities were often built on accessible locations withinherent risks such as coastlines, to facilitatetransport, or floodplains because of their fertilitywith ample space for growth. Urbanization andincreasing competition for land result inunregulated construction. This spills into adjacenthigh-risk areas such as hillsides, low-lying areas,industrial areas or floodplains.
Cities now hold disproportionate amounts ofmaterial wealth in terms of residential andcommercial buildings and infrastructure. Thisinfrastructure is critical to the economic activitiesof the city. The impact of disasters on cities candevastate national economies and limit access toindustrial markets at an international level. This isespecially important where one or two primaryurban areas account for the major economic valuesand social vitality of a country.
Urbanization and rural displacement account forthe rapid growth of informal, illegal settlements inthe most risk-prone places near cities includingMexico City, Rio de Janeiro and Manila. Disasterrisk concerns go hand in hand with other equallypressing urban issues, such as decayinginfrastructure, poor housing and homelessness,hazardous industries, inadequate services,unaffordable and poor transportation links, andunemployment.
Living with Risk: A global review of disaster reduction initiatives
60
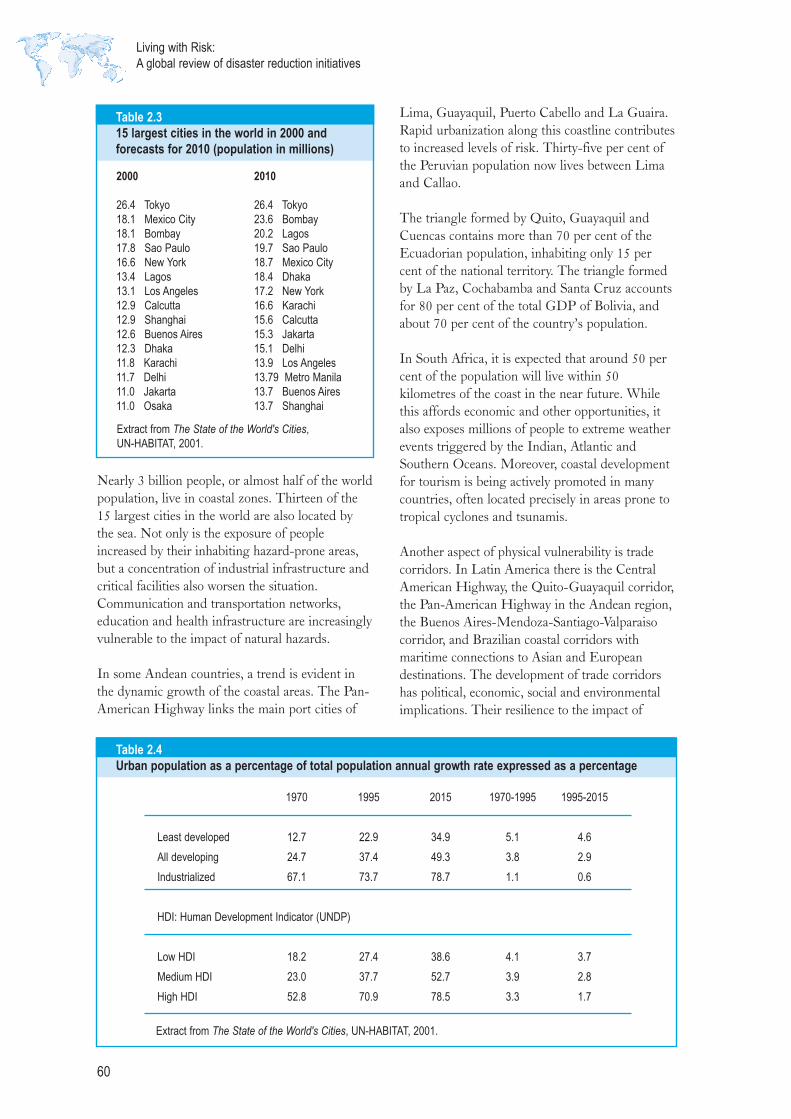
Nearly 3 billion people, or almost half of the worldpopulation, live in coastal zones. Thirteen of the15 largest cities in the world are also located bythe sea. Not only is the exposure of peopleincreased by their inhabiting hazard-prone areas,but a concentration of industrial infrastructure andcritical facilities also worsen the situation.Communication and transportation networks,education and health infrastructure are increasinglyvulnerable to the impact of natural hazards.
In some Andean countries, a trend is evident inthe dynamic growth of the coastal areas. The Pan-American Highway links the main port cities of
Lima, Guayaquil, Puerto Cabello and La Guaira.Rapid urbanization along this coastline contributesto increased levels of risk. Thirty-five per cent ofthe Peruvian population now lives between Limaand Callao.
The triangle formed by Quito, Guayaquil andCuencas contains more than 70 per cent of theEcuadorian population, inhabiting only 15 percent of the national territory. The triangle formedby La Paz, Cochabamba and Santa Cruz accountsfor 80 per cent of the total GDP of Bolivia, andabout 70 per cent of the country’s population.
In South Africa, it is expected that around 50 percent of the population will live within 50kilometres of the coast in the near future. Whilethis affords economic and other opportunities, italso exposes millions of people to extreme weatherevents triggered by the Indian, Atlantic andSouthern Oceans. Moreover, coastal developmentfor tourism is being actively promoted in manycountries, often located precisely in areas prone totropical cyclones and tsunamis.
Another aspect of physical vulnerability is tradecorridors. In Latin America there is the CentralAmerican Highway, the Quito-Guayaquil corridor,the Pan-American Highway in the Andean region,the Buenos Aires-Mendoza-Santiago-Valparaisocorridor, and Brazilian coastal corridors withmaritime connections to Asian and Europeandestinations. The development of trade corridorshas political, economic, social and environmentalimplications. Their resilience to the impact of
Table 2.315 largest cities in the world in 2000 andforecasts for 2010 (population in millions)
2000
26.4 Tokyo18.1 Mexico City18.1 Bombay17.8 Sao Paulo16.6 New York13.4 Lagos13.1 Los Angeles12.9 Calcutta12.9 Shanghai12.6 Buenos Aires12.3 Dhaka11.8 Karachi11.7 Delhi 11.0 Jakarta11.0 Osaka
2010
26.4 Tokyo23.6 Bombay20.2 Lagos19.7 Sao Paulo18.7 Mexico City18.4 Dhaka17.2 New York16.6 Karachi15.6 Calcutta15.3 Jakarta15.1 Delhi13.9 Los Angeles13.79 Metro Manila13.7 Buenos Aires13.7 Shanghai
Extract from The State of the World's Cities,UN-HABITAT, 2001.
Table 2.4Urban population as a percentage of total population annual growth rate expressed as a percentage
1970 1995 2015 1970-1995 1995-2015
Least developed 12.7 22.9 34.9 5.1 4.6All developing 24.7 37.4 49.3 3.8 2.9Industrialized 67.1 73.7 78.7 1.1 0.6
HDI: Human Development Indicator (UNDP)
Low HDI 18.2 27.4 38.6 4.1 3.7Medium HDI 23.0 37.7 52.7 3.9 2.8High HDI 52.8 70.9 78.5 3.3 1.7
Extract from The State of the World's Cities, UN-HABITAT, 2001.

2Risk awareness and assessment2.2 Emerging trends in hazards, vulnerability patterns and the impact of disasters
61
natural hazards is particularly important tomaintain their economic value and to realize theintended sustainable development of cities andregions.
Vulnerability and trade corridors
An example of the high vulnerability to therecurrent impacts of natural hazards in the contextof trade corridors is provided by the experience inCentral America. During Hurricane Mitch in1998, the Central American intra-regional marketwas interrupted for more than two weeks bydamages to many parts of the Central AmericanHighway. In Peru and Ecuador, the impact from ElNiño in 1997-1998 disrupted the circulation of thePan-American Highway in hundreds of sections.
Trends in socio-economic vulnerability
The relationship between disaster risk anddevelopment offers a good starting point toidentify macro trends in socio-economicvulnerability. To some degree, socio-economic andenvironmental vulnerability is shaped bydevelopment processes and vice versa.Understanding how patterns of social change anddevelopment set the scene for future disastersbecomes crucial to improving disaster riskassessment and analysis, and therefore is essentialfor disaster risk reduction as a whole.
Development and vulnerability
An analysis of disaster impacts shows that anestimated 97 per cent of natural disaster- relateddeaths each year occur in developing countries(World Bank 2001). Although losses are smallerin absolute figures, the percentage of economiclosses in relation to the GDP in developingcountries far exceeds those in industrializedcountries.
Between 1985 and 1999, the world’s wealthiestcountries sustained 57.3 per cent of the measuredeconomic losses to disasters, representing 2.5 percent of their combined GDP. During the sameyears, the world’s poorest countries endured 24.4per cent of the economic toll of disasters,representing 13.4 per cent of their combined GDP.
Some vulnerability factors are closely associatedwith certain types of development models andinitiatives. The links between disaster anddevelopment are elaborated in detail in theUNDP’s 2004 report Reducing Disaster Risk: Achallenge for development.
Poverty is a key issue in the analysis ofvulnerability. In Southern Africa, poverty levelsremain high, especially in rural areas. Thirty-sevenper cent of Mozambicans, 64 per cent ofZambians and 36 per cent of Zimbabweans live onless than US$ 1 per day.
Per capita GDP for Zambia and Mozambique fallfar short of per capita GDP in developingcountries. In addition, high levels of foreign debthave discouraged investment and growth, withZambia shouldering external debts that constitute181 per cent of its GDP. Under these conditions,it is unrealistic to expect significant investments athousehold or national levels to mitigate the impactof natural or other threats.
Globalization
The impact of globalization on patterns ofvulnerability is critical to identify new trends indisaster risk. The impacts of economic adjustmentmeasures to encourage greater efficiencies andglobal competitiveness have commonly resulted inshrinking job markets.
Loss of income can render people more vulnerableto disaster risk. In South Africa, from 1996-2000more than 500,000 formal sector jobs were lost.From 1997-2000, more than 140,000 miners losttheir jobs and 50,000 primarily female workerslost their jobs in textile industries.
Traditional knowledge at risk
The pace of technological and cultural changeposes a real threat to the wealth of local knowledgeand related skills and resources preserved amongindigenous people and in many ruralcommunities. Economic vulnerability can increaseas local livelihoods are transformed from relyingon traditional forms of production to using moreintensive or modern methods of agriculture andland-use systems.
Living with Risk: A global review of disaster reduction initiatives
62
In the past, people from Pacific islands usedvarious techniques to cope with the impact ofnatural hazards. This included food preservation,harvesting wild foods, planting disaster-resistantcrops, using hazard-resistant designs of traditionalhouses and construction, and relying onestablished social networks for extendedcommunity support.
Many of these traditions have become neglectedas more people gravitate towards modern lifestyles,becoming increasingly disassociated from asensitive consideration of natural conditions in theprocess. It has also been observed that crops,which formerly provided contingent food reservesin many countries at times of disaster, are nowrarely planted.
Box 2.14Traditional versus modern ways of coping – is it necessary to choose?
The traditional pattern of agricultural land use in the Sahel was well adapted to uncertain rainfall conditions. Generallyspeaking, the northern zone of Sahel having a mean annual rainfall of 100-350 millimetres was used for livestock. Thesouthern Sahel, with a rainfall of 350-800 millimetres, was able to support rain-fed crops.
This system permitted a degree of flexible interdependence. Herders followed the rains by seasonal migration, whilecultivators grew a variety of drought-resistant subsistence crops such as sorghum and millet to reduce the risk of failure.Fallow periods were used to rest the land for as much as five years in order to maintain the fertility of the soil. In theabsence of a cash economy, a barter system operated between herders and sedentary farmers.
During recent decades, this system has collapsed for a variety of reasons. Population growth has exerted pressure on theland, resulting in soil erosion. In turn, the rangelands have been overgrazed with rapid degradation of the resource base.The need of national governments for export earnings and foreign exchange has produced a trend towards cash crops.These demands have competed for land with the subsistence requirements for basic grains and reduced the fallowingsystem.
Subsistence crops have been discouraged to the extent that produce prices have consistently declined in real value over 20years. At the same time, the practice of maintaining food reserves has been seriously neglected under pressure of loanrepayments to international banks. In addition, a lack of government investment to improve the productivity of rain-fedagriculture and a failure to organize credit facilities for poor farmers have tended also to undermine the stability of the ruralbase.
National governments have progressively campaigned against a nomadic lifestyle. In many instances, foreign aid has beenearmarked for sedentary agriculture rather than to benefit herders. Increasingly, strict game preservation laws have beenintroduced which restrict the possibility of local inhabitants hunting for meat during drought. Traditional forms of livelihood,such as caravan trading, have declined as a result of the enforcement of international boundaries and customs duties,together with competition from lorries.
Adapted from: K. Smith, 1996.