Central bank liquidity and the recent financial crisis
72
Central bank liquidity and the recent financial crisis Adam B. Ashcraft December 2008 Sincere thanks to Paul Goldsmith-Pinkham and Dennis Kuo for excellent research assistance This presentation presents preliminary findings and is being distributed to stimulate discussion and elicit comments. The views expressed in the presentation are those of the author and are not necessarily reflective of views at the Federal Reserve Bank of New York or the Federal Reserve System. Any errors or omissions are the responsibility of the author.
Transcript of Central bank liquidity and the recent financial crisis
Central bank liquidity and the recent financial crisis
Adam B. AshcraftDecember 2008
Sincere thanks to Paul Goldsmith-Pinkham and Dennis Kuo for excellent research assistance
This presentation presents preliminary findings and is being distributed to stimulate discussion and elicit comments. The views expressed in the presentation are those of the author and are not necessarily reflective of views at the Federal Reserve Bank of New York or the Federal Reserve System. Any errors or omissions are the responsibility of the author.
2
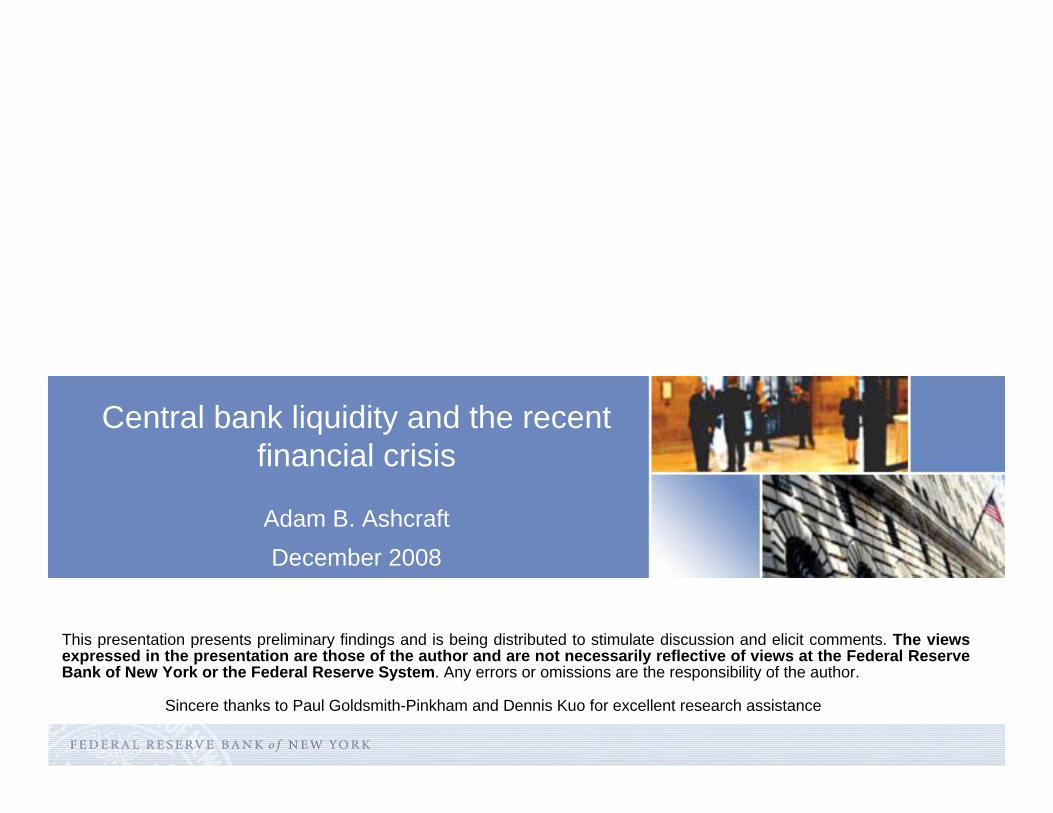
Markets liquid and stable through August 2007
Spread of One Month Rates to OIS
-0.5
0.0
0.5
1.0
1.5
2.0
2.5
Jan-07 Mar-07 May-07 Jul-07 Sep-07 Nov-07 Jan-08 Mar-08 May-08 Jul-08
%
FHLB NY LIBOR ABCP AA FHLB DN DW
August 8, 2007
3
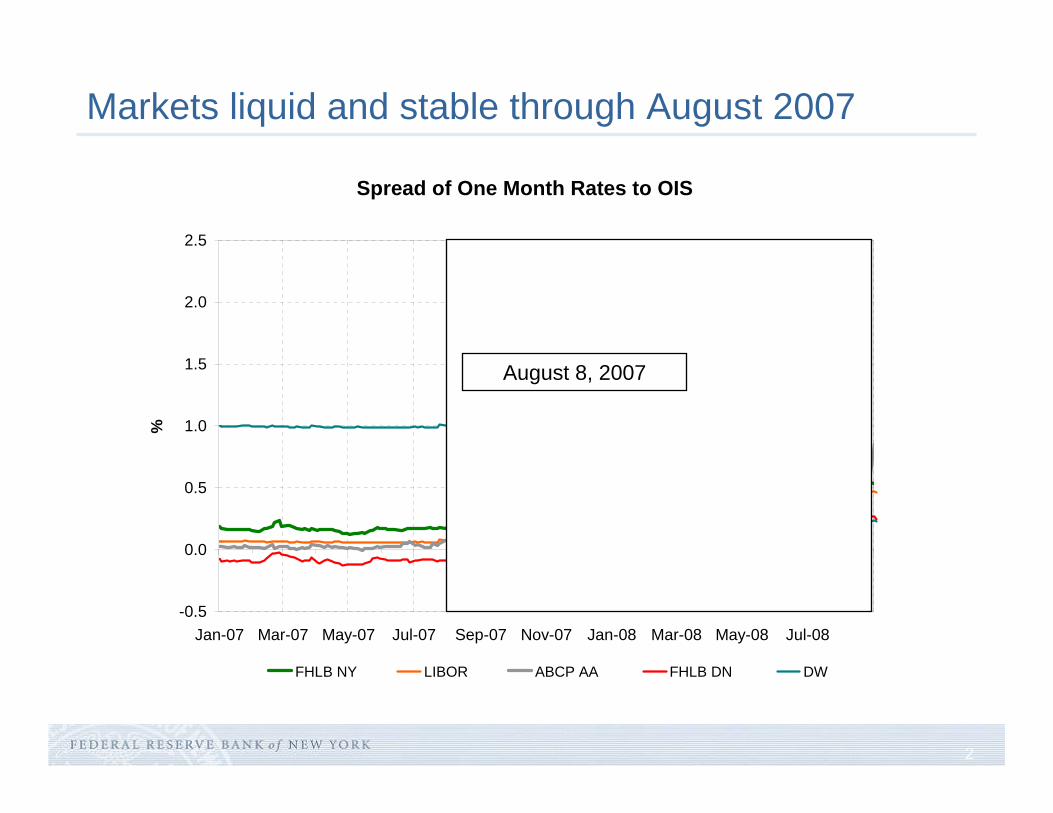
Illiquid and volatile markets after August 8, 2007
Spread of One Month Rates to OIS
-0.5
0.0
0.5
1.0
1.5
2.0
2.5
Jan-07 Mar-07 May-07 Jul-07 Sep-07 Nov-07 Jan-08 Mar-08 May-08 Jul-08
%
FHLB NY LIBOR ABCP AA FHLB DN DW
4
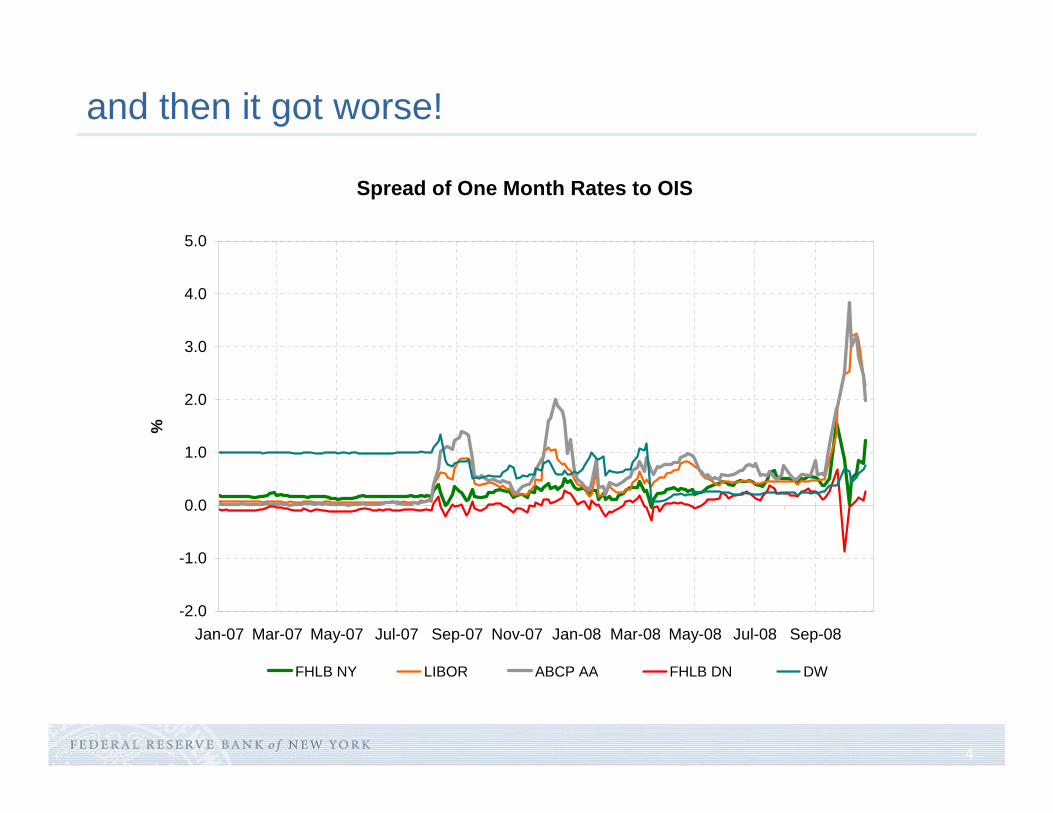
and then it got worse!
Spread of One Month Rates to OIS
-2.0
-1.0
0.0
1.0
2.0
3.0
4.0
5.0
Jan-07 Mar-07 May-07 Jul-07 Sep-07 Nov-07 Jan-08 Mar-08 May-08 Jul-08 Sep-08
%
FHLB NY LIBOR ABCP AA FHLB DN DW
5
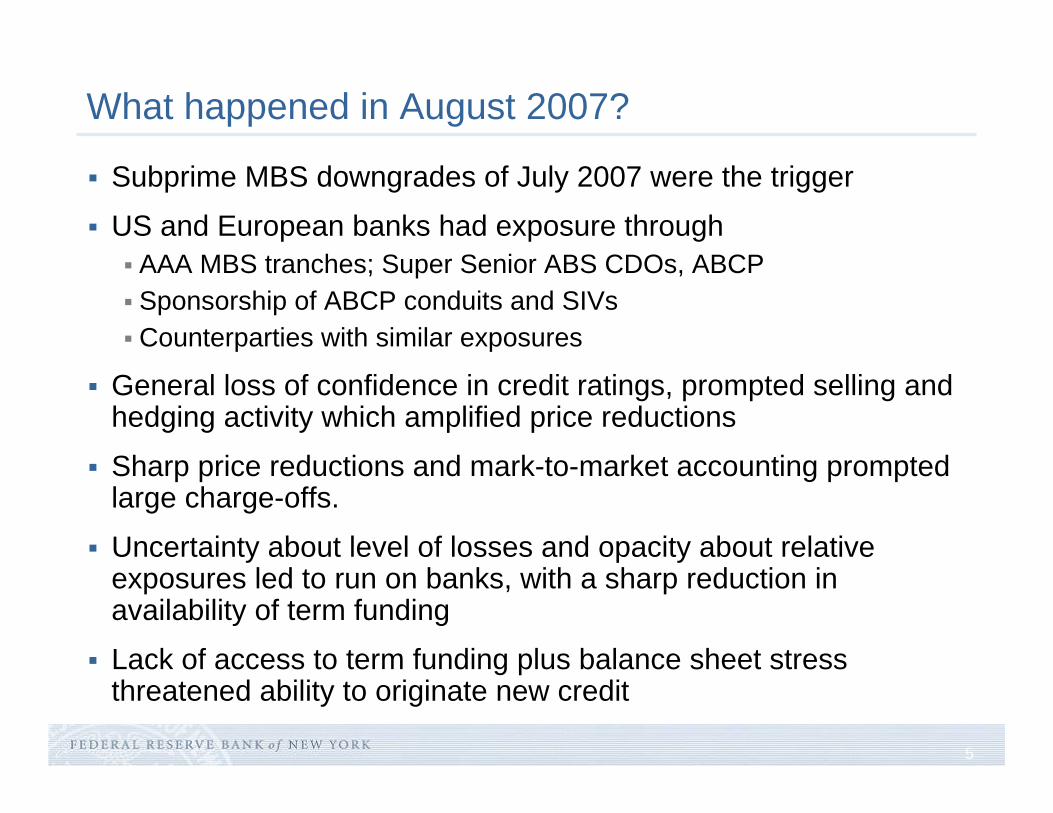
What happened in August 2007?
Subprime MBS downgrades of July 2007 were the trigger
US and European banks had exposure throughAAA MBS tranches; Super Senior ABS CDOs, ABCPSponsorship of ABCP conduits and SIVsCounterparties with similar exposures
General loss of confidence in credit ratings, prompted selling and hedging activity which amplified price reductions
Sharp price reductions and mark-to-market accounting prompted large charge-offs.
Uncertainty about level of losses and opacity about relative exposures led to run on banks, with a sharp reduction in availability of term funding
Lack of access to term funding plus balance sheet stress threatened ability to originate new credit
6
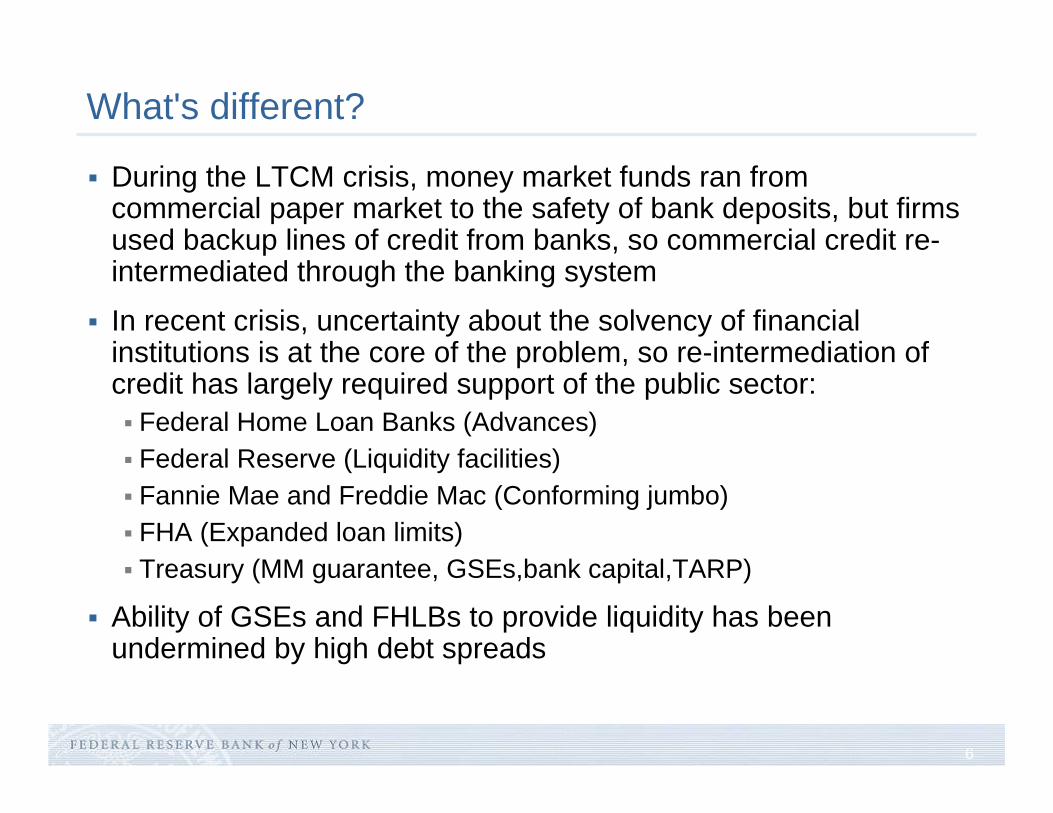
What's different?
During the LTCM crisis, money market funds ran from commercial paper market to the safety of bank deposits, but firms used backup lines of credit from banks, so commercial credit re-intermediated through the banking system
In recent crisis, uncertainty about the solvency of financial institutions is at the core of the problem, so re-intermediation of credit has largely required support of the public sector:
Federal Home Loan Banks (Advances)Federal Reserve (Liquidity facilities)Fannie Mae and Freddie Mac (Conforming jumbo)FHA (Expanded loan limits)Treasury (MM guarantee, GSEs,bank capital,TARP)
Ability of GSEs and FHLBs to provide liquidity has been undermined by high debt spreads
7
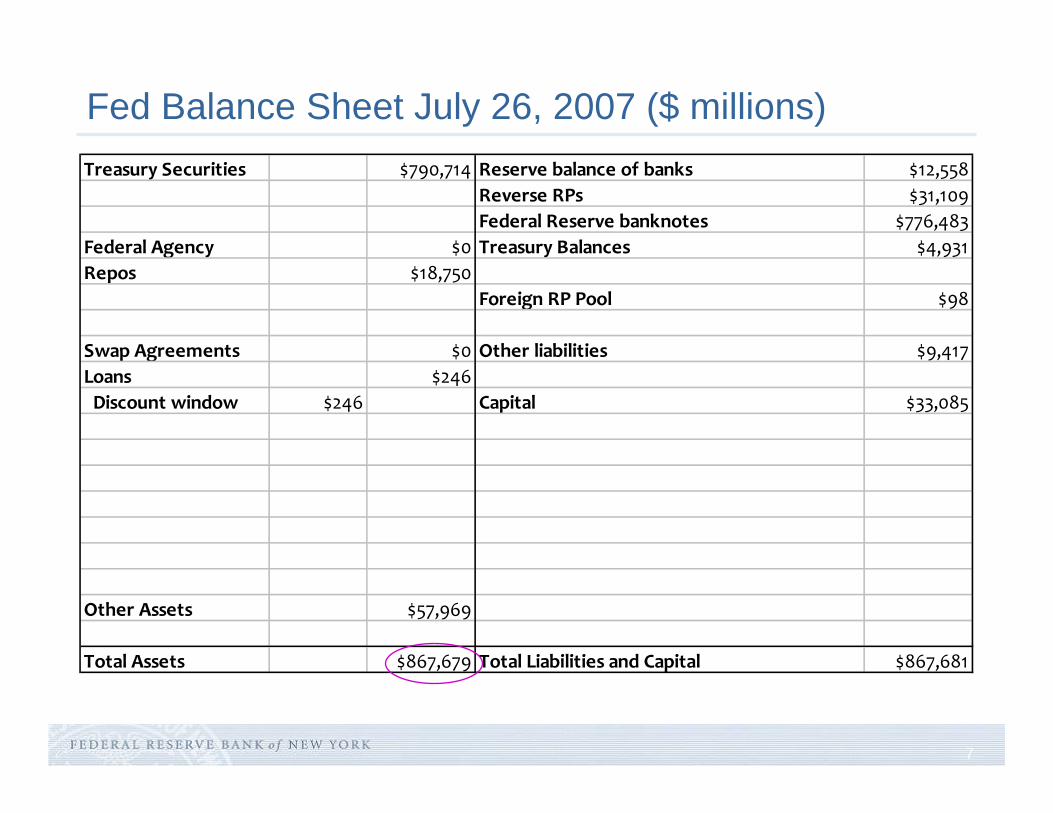
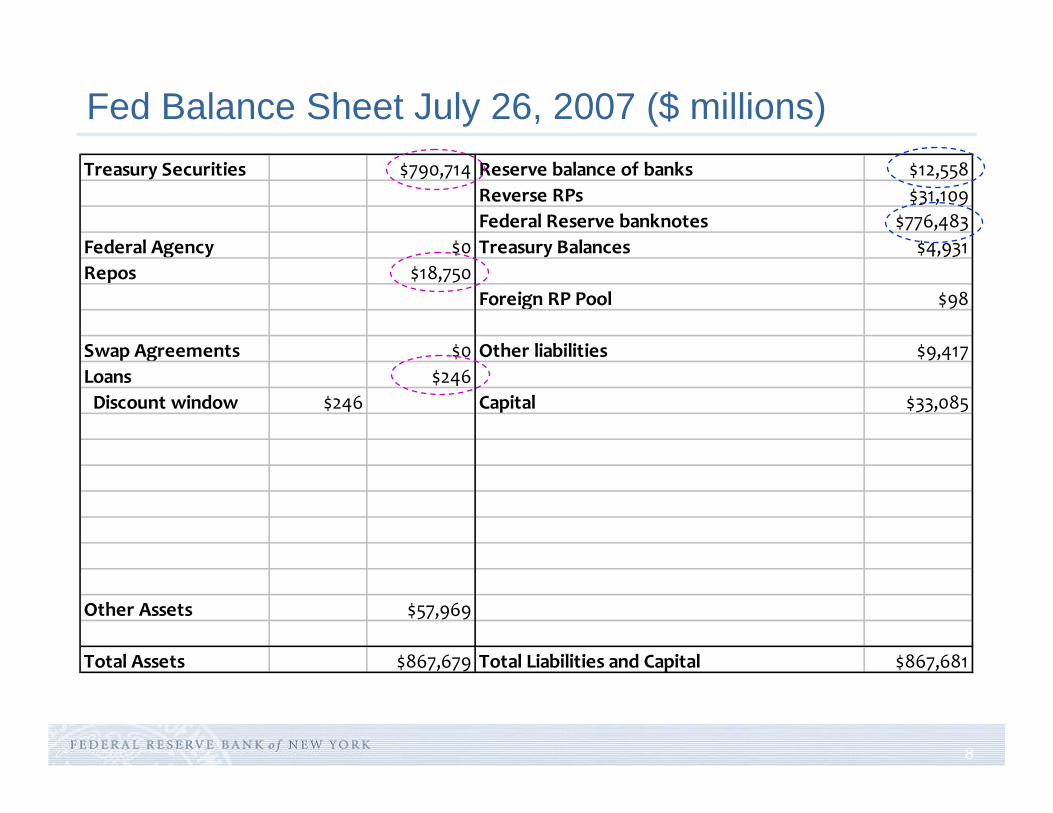
Fed Balance Sheet July 26, 2007 ($ millions)Treasury Securities $790,714 Reserve balance of banks $12,558
Reverse RPs $31,109Federal Reserve banknotes $776,483
Federal Agency $0 Treasury Balances $4,931Repos $18,750
Foreign RP Pool $98
Swap Agreements $0 Other liabilities $9,417Loans $246 Discount window $246 Capital $33,085
Other Assets $57,969
Total Assets $867,679 Total Liabilities and Capital $867,681
8
Fed Balance Sheet July 26, 2007 ($ millions)Treasury Securities $790,714 Reserve balance of banks $12,558
Reverse RPs $31,109Federal Reserve banknotes $776,483
Federal Agency $0 Treasury Balances $4,931Repos $18,750
Foreign RP Pool $98
Swap Agreements $0 Other liabilities $9,417Loans $246 Discount window $246 Capital $33,085
Other Assets $57,969
Total Assets $867,679 Total Liabilities and Capital $867,681
9
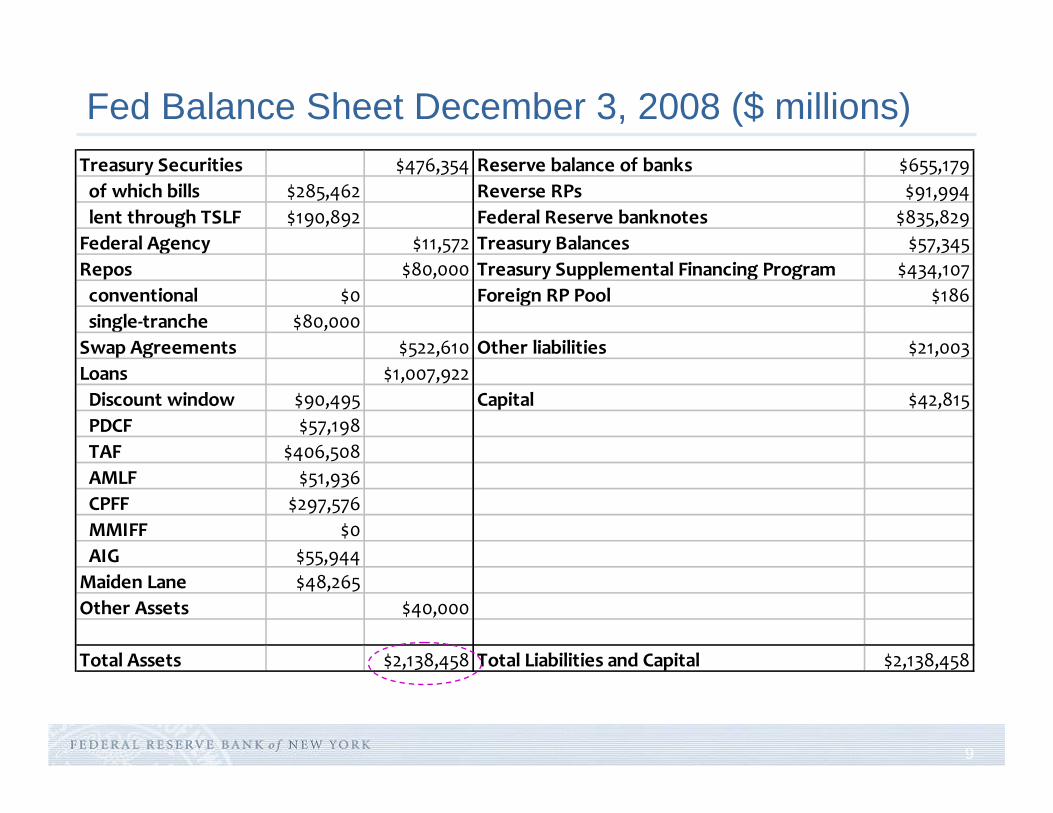
Fed Balance Sheet December 3, 2008 ($ millions)Treasury Securities $476,354 Reserve balance of banks $655,179 of which bills $285,462 Reverse RPs $91,994 lent through TSLF $190,892 Federal Reserve banknotes $835,829Federal Agency $11,572 Treasury Balances $57,345Repos $80,000 Treasury Supplemental Financing Program $434,107 conventional $0 Foreign RP Pool $186 single‐tranche $80,000Swap Agreements $522,610 Other liabilities $21,003Loans $1,007,922 Discount window $90,495 Capital $42,815 PDCF $57,198 TAF $406,508 AMLF $51,936 CPFF $297,576 MMIFF $0 AIG $55,944Maiden Lane $48,265Other Assets $40,000
Total Assets $2,138,458 Total Liabilities and Capital $2,138,458
10
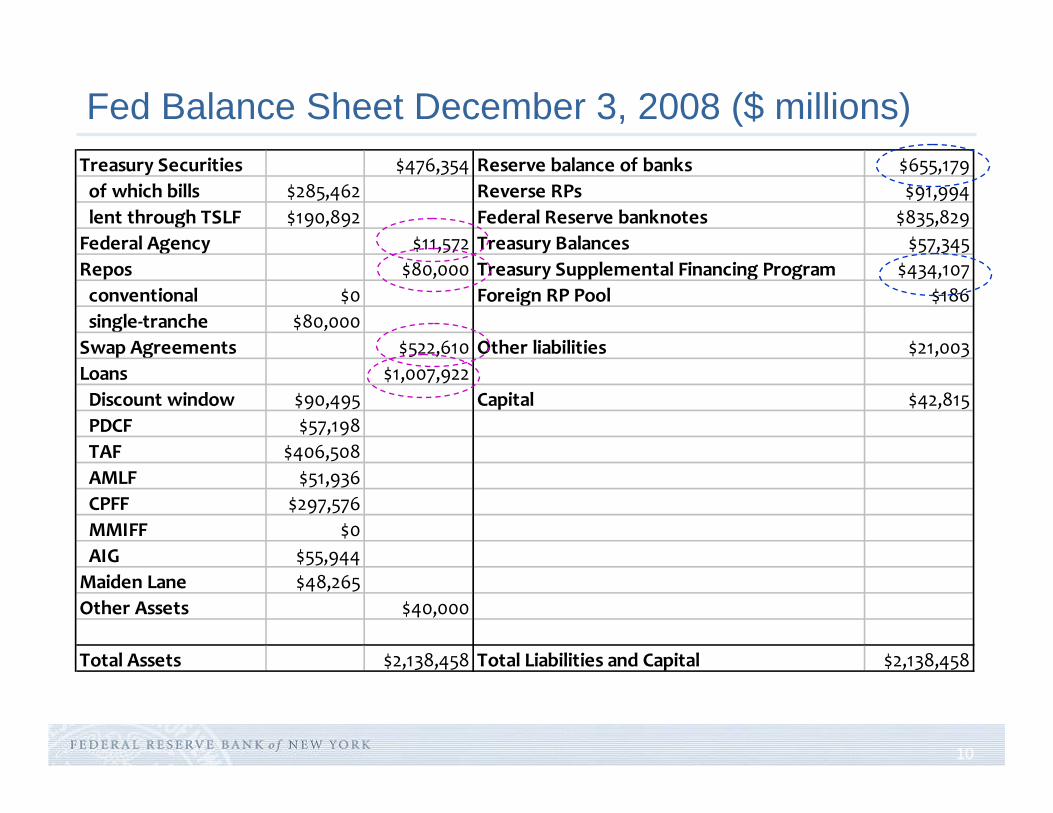
Fed Balance Sheet December 3, 2008 ($ millions)Treasury Securities $476,354 Reserve balance of banks $655,179 of which bills $285,462 Reverse RPs $91,994 lent through TSLF $190,892 Federal Reserve banknotes $835,829Federal Agency $11,572 Treasury Balances $57,345Repos $80,000 Treasury Supplemental Financing Program $434,107 conventional $0 Foreign RP Pool $186 single‐tranche $80,000Swap Agreements $522,610 Other liabilities $21,003Loans $1,007,922 Discount window $90,495 Capital $42,815 PDCF $57,198 TAF $406,508 AMLF $51,936 CPFF $297,576 MMIFF $0 AIG $55,944Maiden Lane $48,265Other Assets $40,000
Total Assets $2,138,458 Total Liabilities and Capital $2,138,458
11
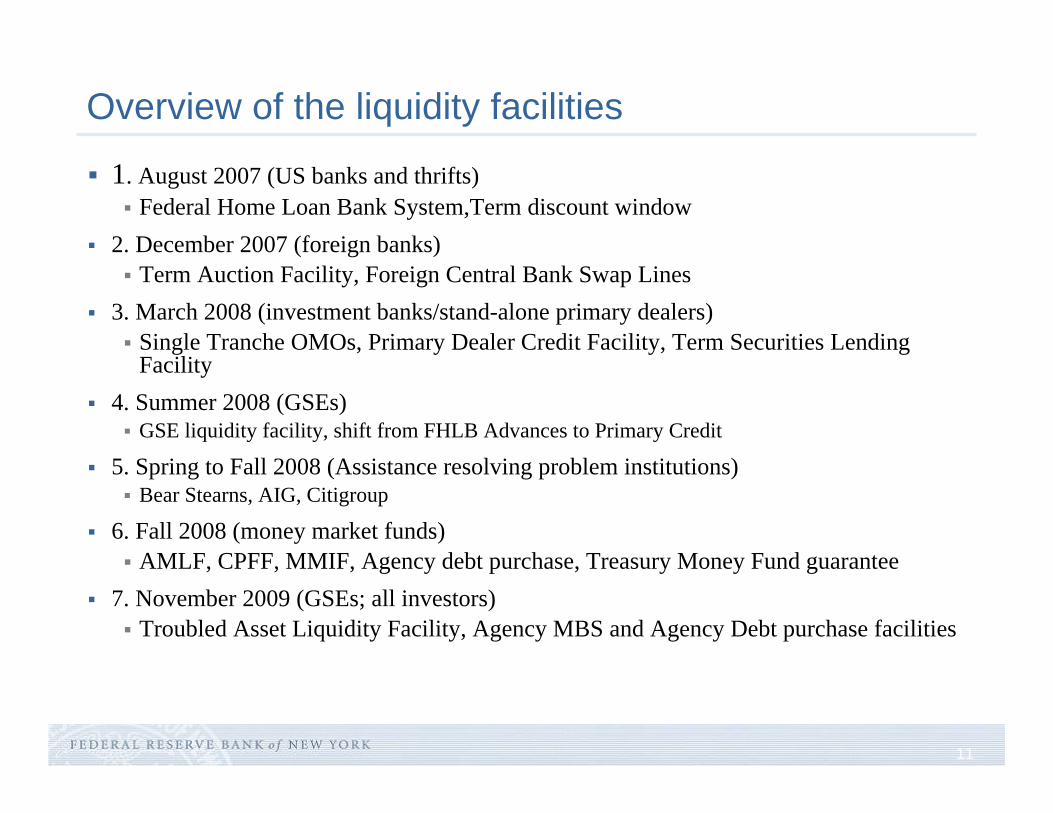
Overview of the liquidity facilities
1. August 2007 (US banks and thrifts)Federal Home Loan Bank System,Term discount window
2. December 2007 (foreign banks)Term Auction Facility, Foreign Central Bank Swap Lines
3. March 2008 (investment banks/stand-alone primary dealers)Single Tranche OMOs, Primary Dealer Credit Facility, Term Securities Lending Facility
4. Summer 2008 (GSEs)GSE liquidity facility, shift from FHLB Advances to Primary Credit
5. Spring to Fall 2008 (Assistance resolving problem institutions)Bear Stearns, AIG, Citigroup
6. Fall 2008 (money market funds)AMLF, CPFF, MMIF, Agency debt purchase, Treasury Money Fund guarantee
7. November 2009 (GSEs; all investors)Troubled Asset Liquidity Facility, Agency MBS and Agency Debt purchase facilities
12
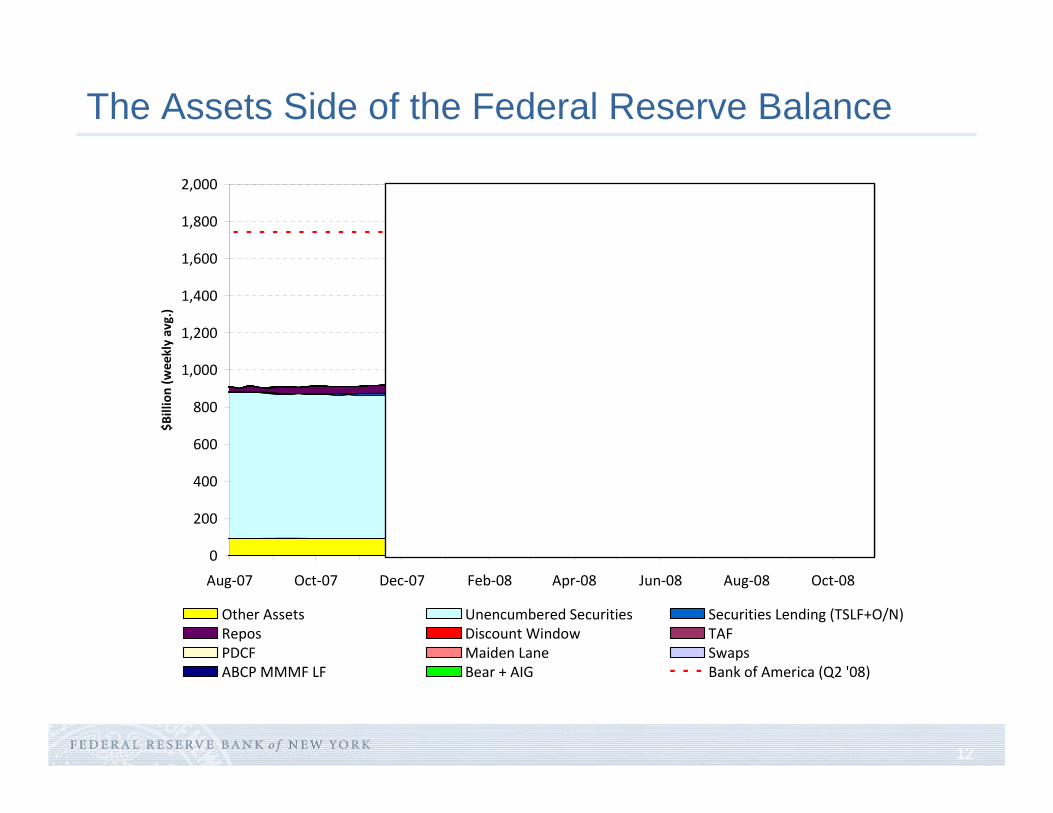
The Assets Side of the Federal Reserve Balance
0
200
400
600
800
1,000
1,200
1,400
1,600
1,800
2,000
Aug‐07 Oct‐07 Dec‐07 Feb‐08 Apr‐08 Jun‐08 Aug‐08 Oct‐08
$Billion (w
eekly avg.)
Other Assets Unencumbered Securities Securities Lending (TSLF+O/N)Repos Discount Window TAFPDCF Maiden Lane SwapsABCP MMMF LF Bear + AIG Bank of America (Q2 '08)
13
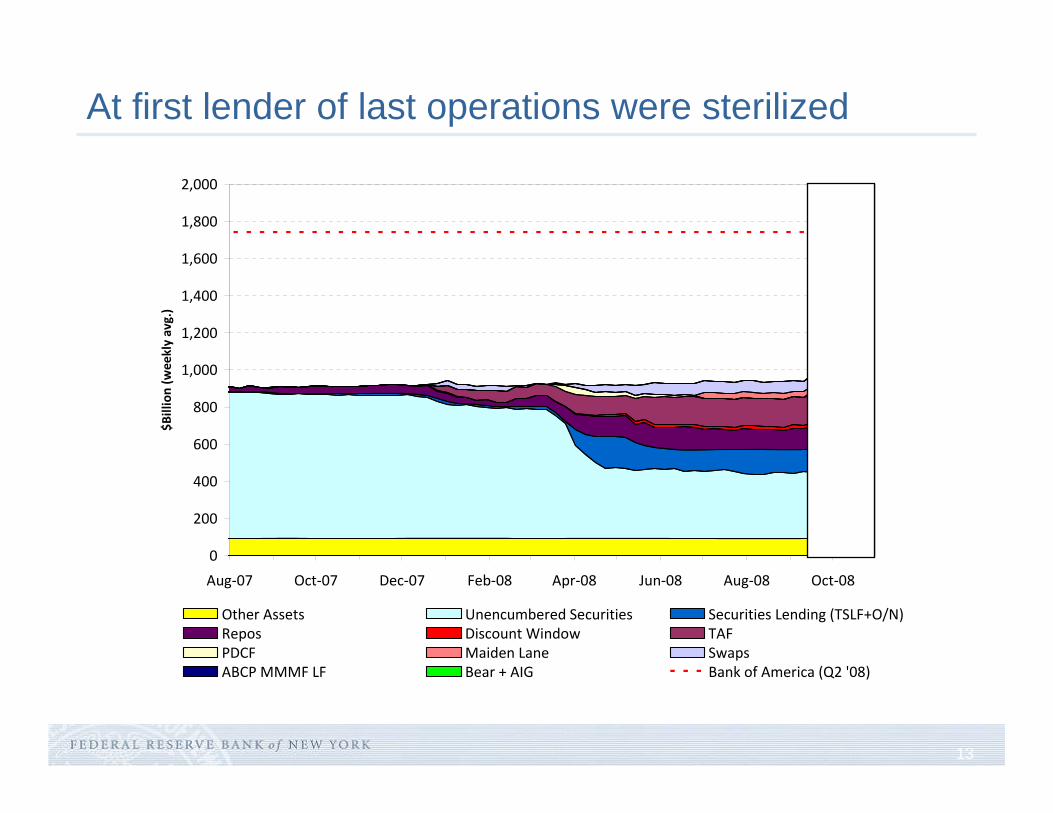
At first lender of last operations were sterilized
0
200
400
600
800
1,000
1,200
1,400
1,600
1,800
2,000
Aug‐07 Oct‐07 Dec‐07 Feb‐08 Apr‐08 Jun‐08 Aug‐08 Oct‐08
$Billion (w
eekly avg.)
Other Assets Unencumbered Securities Securities Lending (TSLF+O/N)Repos Discount Window TAFPDCF Maiden Lane SwapsABCP MMMF LF Bear + AIG Bank of America (Q2 '08)
14
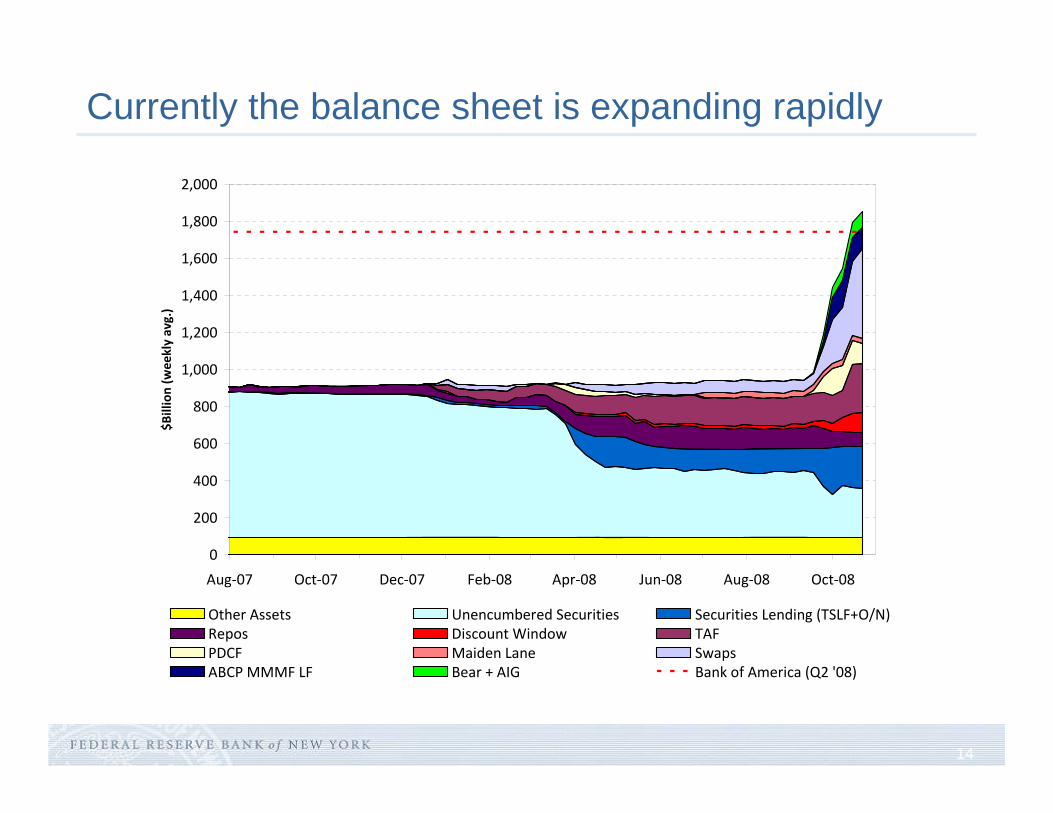
Currently the balance sheet is expanding rapidly
0
200
400
600
800
1,000
1,200
1,400
1,600
1,800
2,000
Aug‐07 Oct‐07 Dec‐07 Feb‐08 Apr‐08 Jun‐08 Aug‐08 Oct‐08
$Billion (w
eekly avg.)
Other Assets Unencumbered Securities Securities Lending (TSLF+O/N)Repos Discount Window TAFPDCF Maiden Lane SwapsABCP MMMF LF Bear + AIG Bank of America (Q2 '08)
15
What's next?
Agency debt and MBS purchases of $600 billion (next 2 quarters)replaces Treasury MBS purchase programimmediate decline of 50 bps in mortgage rates on announcement
Term ABS Liquidity Facility of at least $200 billion (Feb 2008)Consumer ABS, Student loans, SBA loansPossible expansion to CMBS, RMBS, leveraged loans, etc
Maiden Lane II to close soon: AIG RMBS portfolioMaiden Lane I: Bear StearnsMaiden Lane III: AIG CDO portfolio
16
1. August 2007 (US banks and thfits)
Payment stress, reluctance to lend, shift to overnight funding, and federal funds rate volatility
Federal Home Loan Bank System vs the Federal Reserve
Background on the FHLBs
Documenting the use of Advances
17
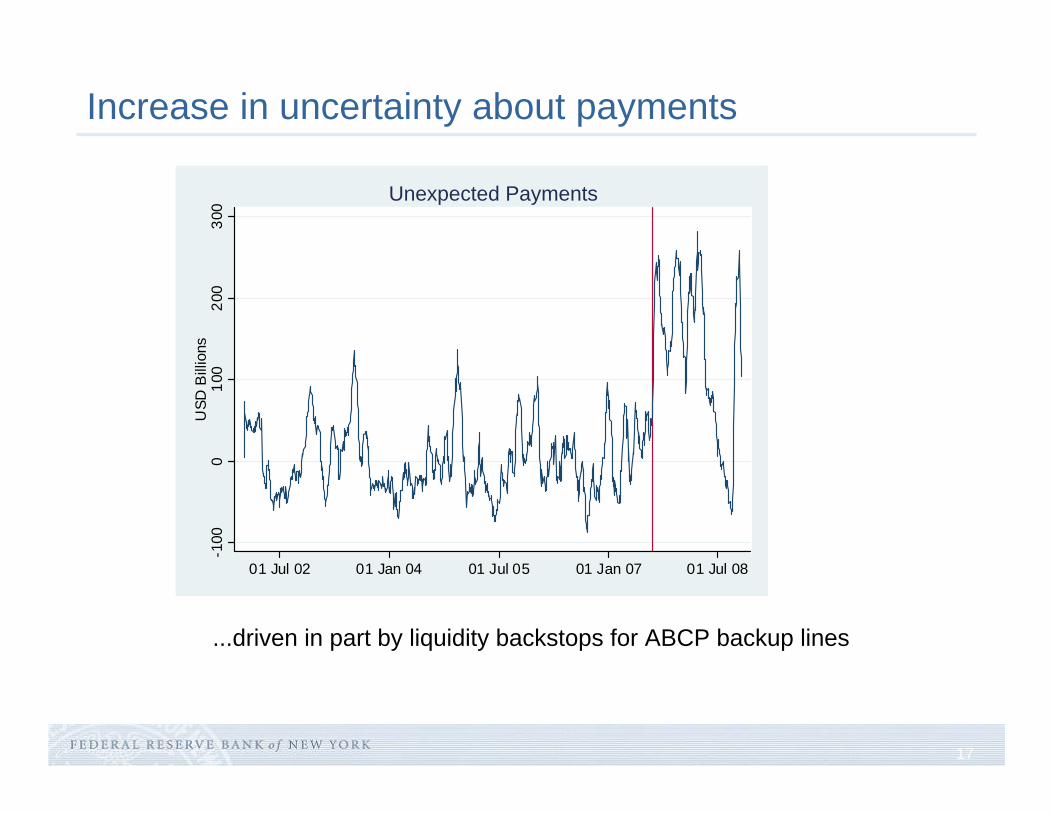
Increase in uncertainty about payments
-100
010
020
030
0U
SD B
illio
ns
01 Jul 02 01 Jan 04 01 Jul 05 01 Jan 07 01 Jul 08
Unexpected Payments
...driven in part by liquidity backstops for ABCP backup lines
18
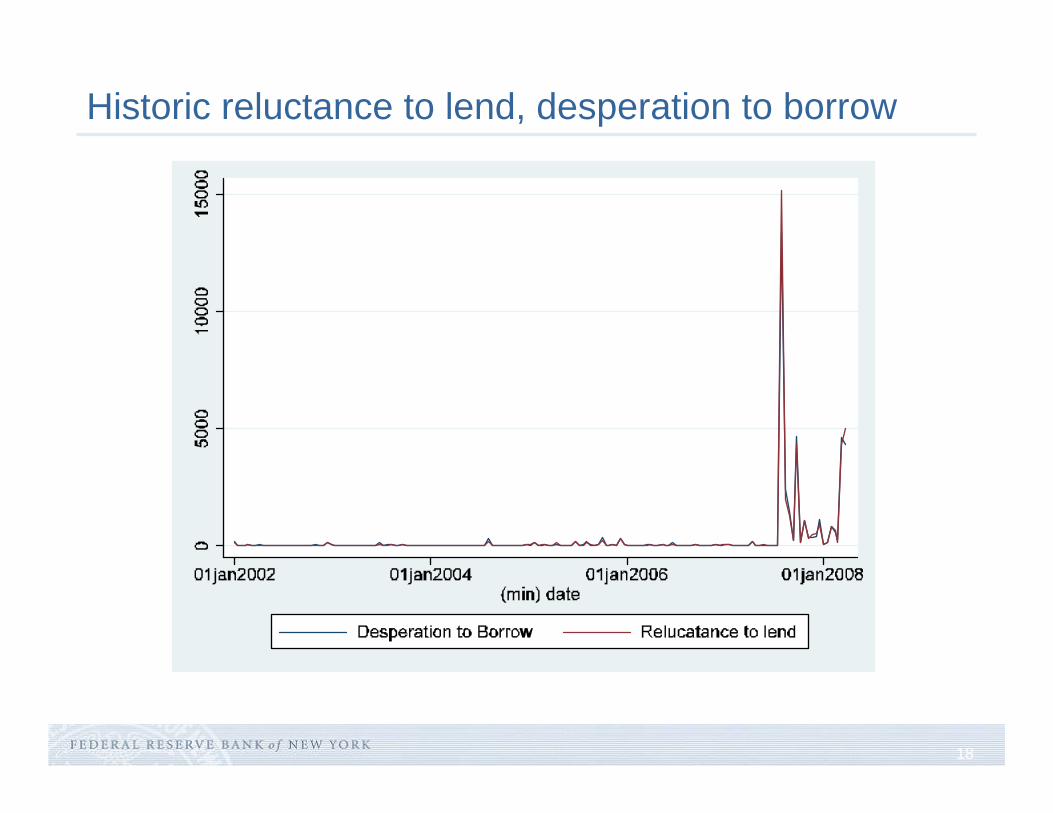
Historic reluctance to lend, desperation to borrow
19
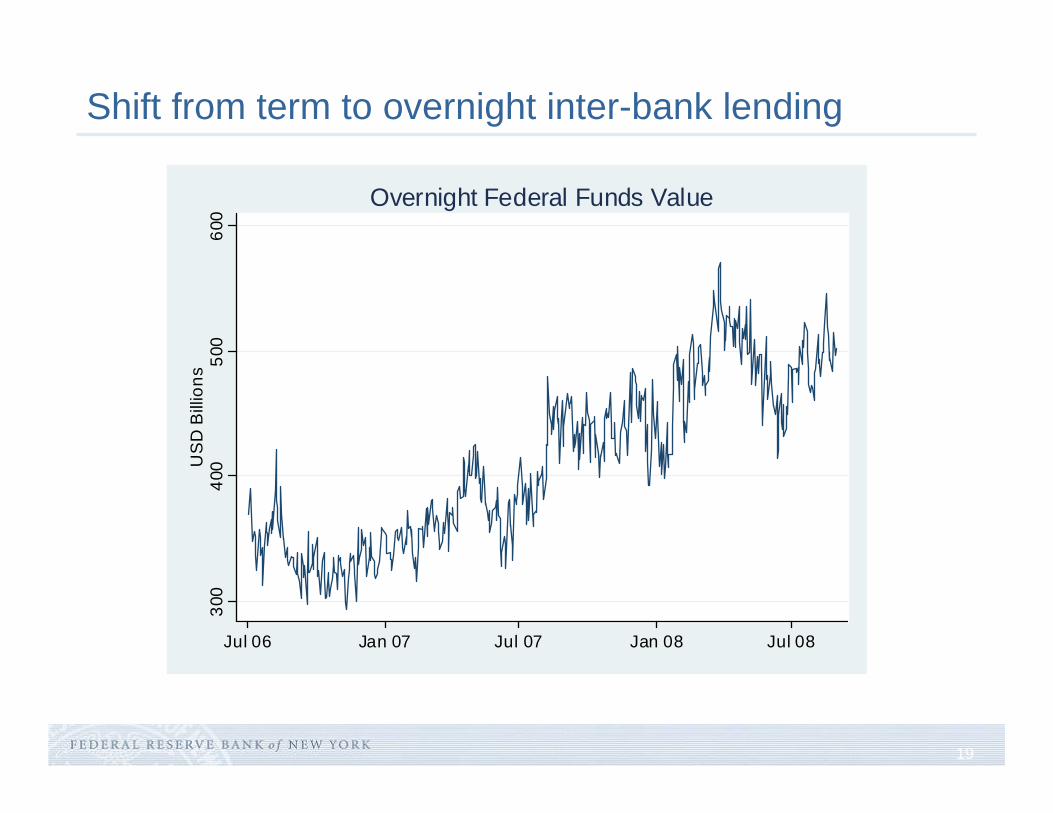
Shift from term to overnight inter-bank lending
300
400
500
600
US
D B
illio
ns
Jul 06 Jan 07 Jul 07 Jan 08 Jul 08
Overnight Federal Funds Value
20
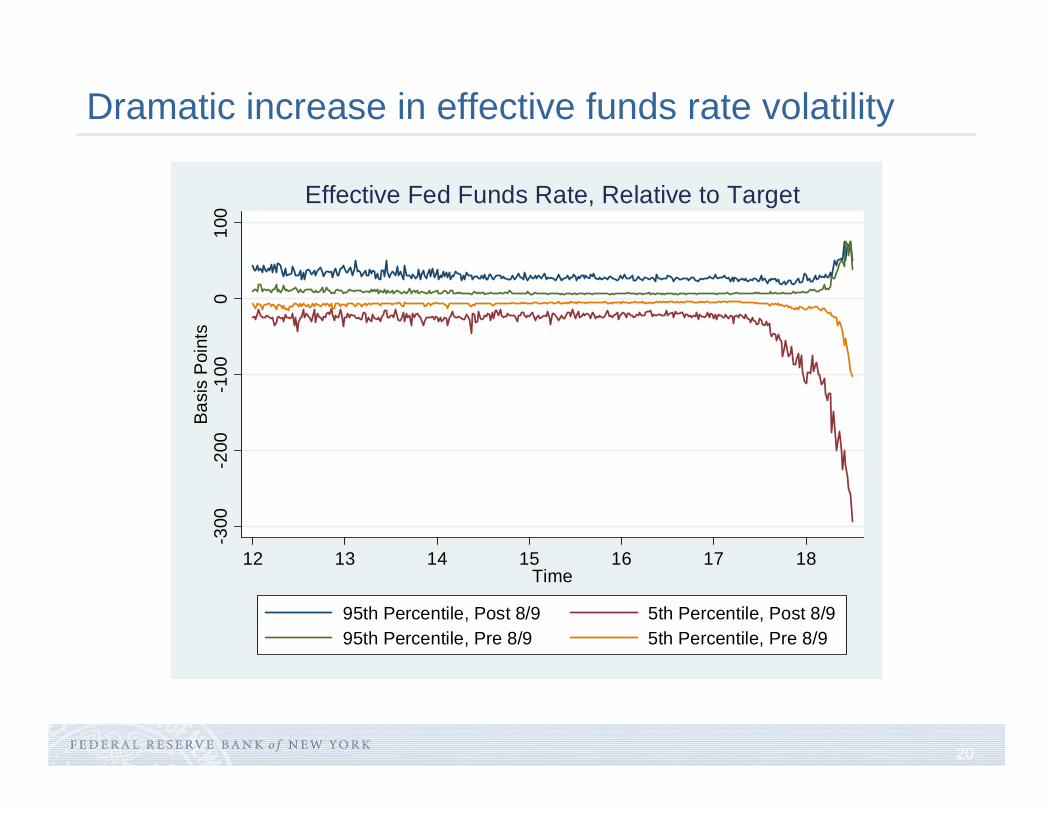
Dramatic increase in effective funds rate volatility
-300
-200
-100
010
0Ba
sis
Poin
ts
12 13 14 15 16 17 18Time
95th Percentile, Post 8/9 5th Percentile, Post 8/995th Percentile, Pre 8/9 5th Percentile, Pre 8/9
Effective Fed Funds Rate, Relative to Target
21
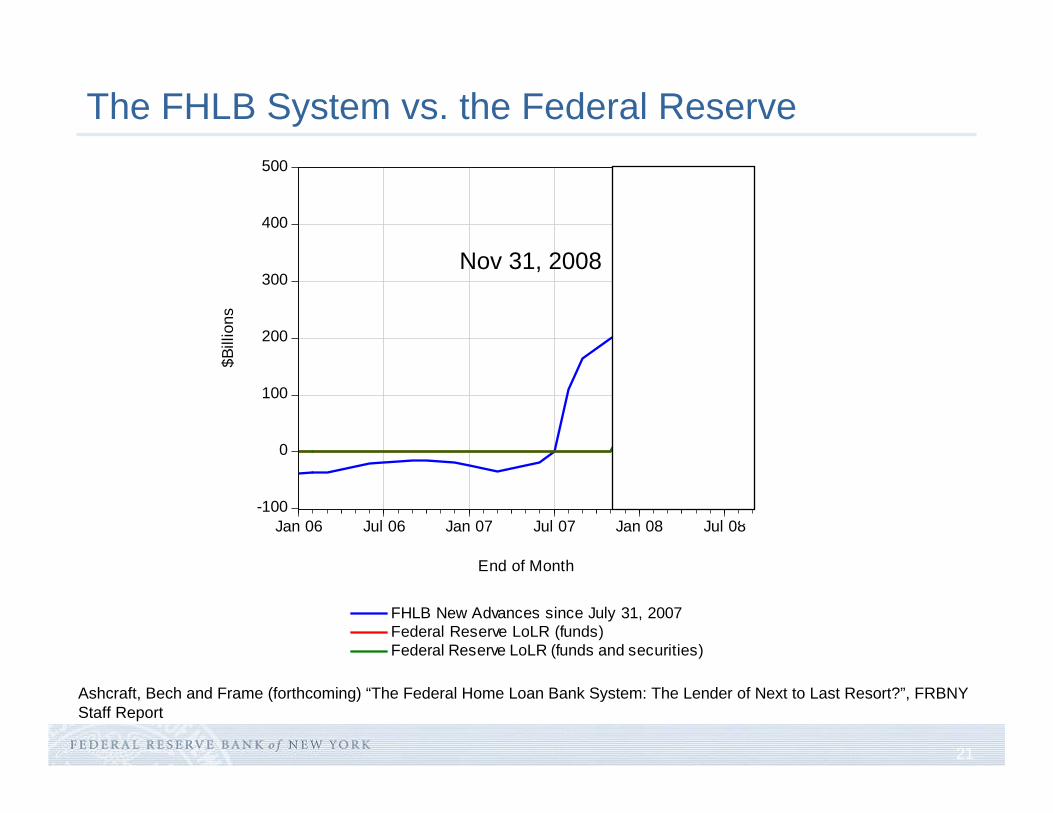
The FHLB System vs. the Federal Reserve
Ashcraft, Bech and Frame (forthcoming) “The Federal Home Loan Bank System: The Lender of Next to Last Resort?”, FRBNY Staff Report
-100
0
100
200
300
400
500
Jan 06 Jul 06 Jan 07 Jul 07 Jan 08 Jul 08
FHLB New Advances since July 31, 2007Federal Reserve LoLR (funds)Federal Reserve LoLR (funds and securities)
$Bill
ions
End of Month
Nov 31, 2008
22
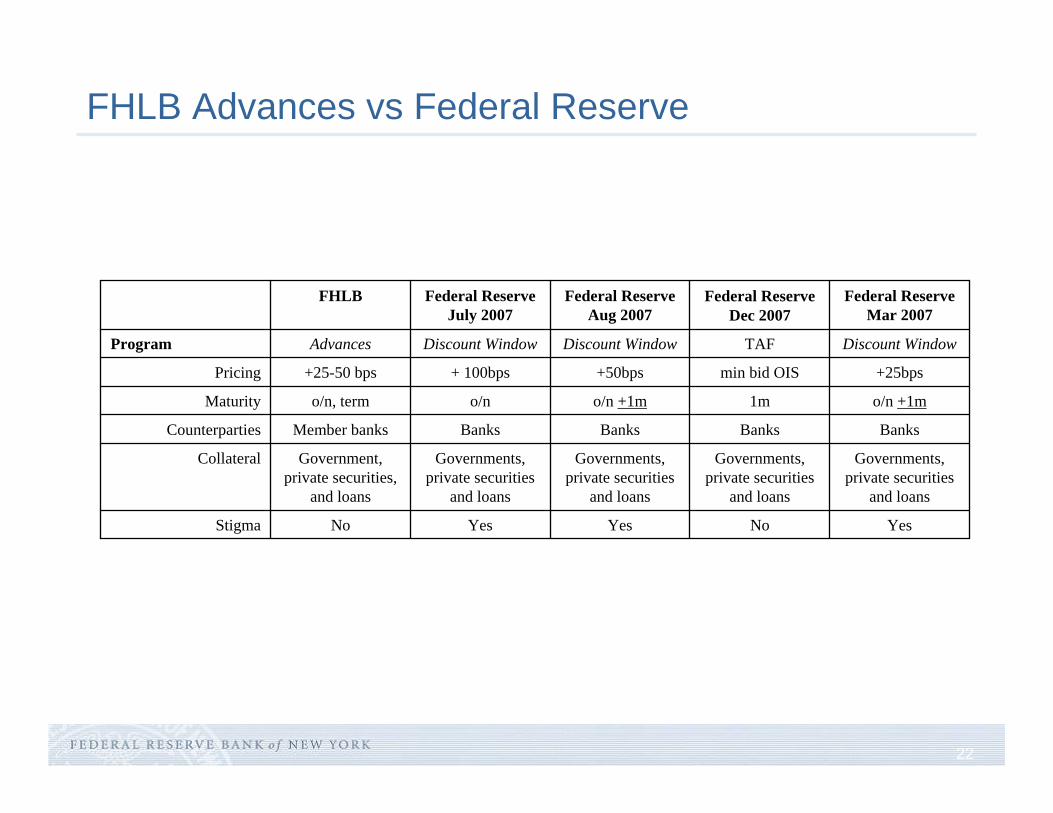
FHLB Advances vs Federal Reserve
No
Governments, private securities
and loans
Banks
1m
min bid OIS
TAF
Federal Reserve Dec 2007
Governments, private securities
and loans
Governments, private securities
and loans
Governments, private securities
and loans
Government, private securities,
and loans
Collateral
Yes
Banks
o/n +1m
+25bps
Discount Window
Federal Reserve Mar 2007
Yes
Banks
o/n +1m
+50bps
Discount Window
Federal Reserve Aug 2007
YesNoStigma
BanksMember banksCounterparties
o/no/n, termMaturity
+ 100bps+25-50 bpsPricing
Discount WindowAdvancesProgram
Federal Reserve July 2007
FHLB

23
Why not the Fed (at least not right away)?
0
20
40
60
80
100
120
-120
-80
-40
0
40
80
120
Jan 07 Jul 07 Jan 08 Jul 08
Discount Window Lending (Primary Credit)All-in-Cost Spread bwt. FHLB NY and Discount Window (Right Axis)
Basis Points$Bill
ions
Weekly Averages
24
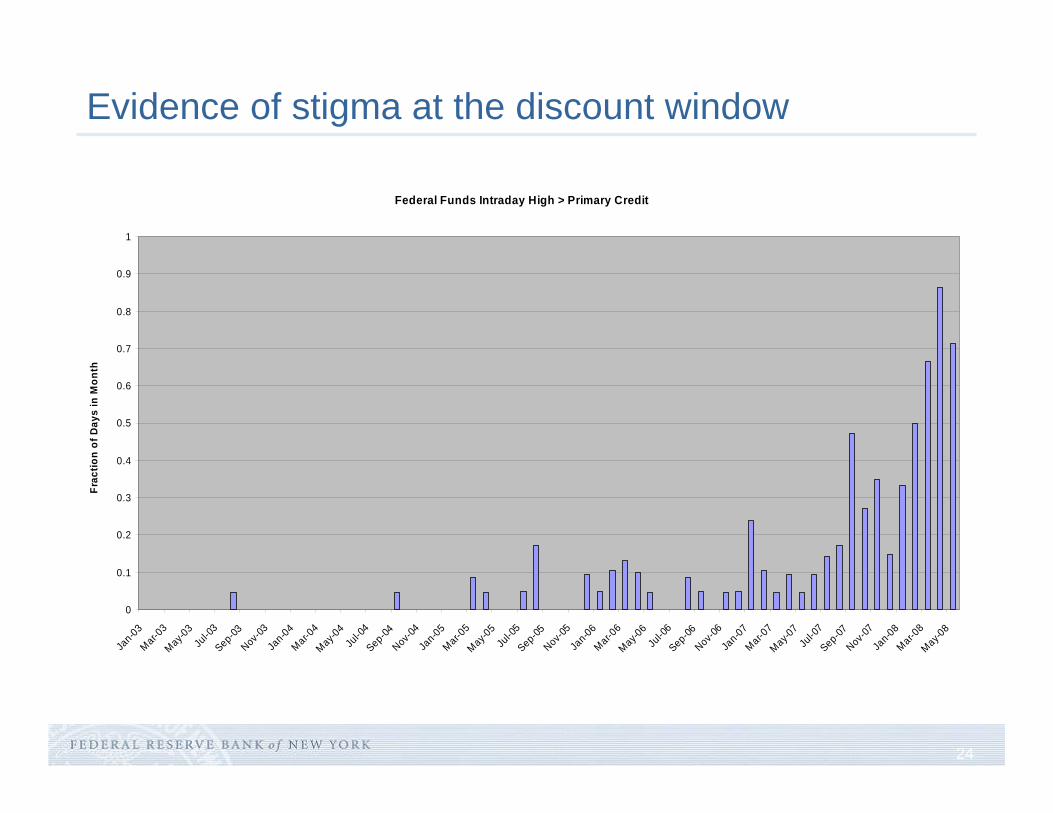
Evidence of stigma at the discount window
Federal Funds Intraday High > Primary Credit
0
0.1
0.2
0.3
0.4
0.5
0.6
0.7
0.8
0.9
1
Jan-03
Mar-03
May-03
Jul-0
3Sep-03Nov-0
3Ja
n-04Mar-0
4May-0
4Ju
l-04
Sep-04Nov-0
4Ja
n-05Mar-0
5May-0
5Ju
l-05
Sep-05Nov-0
5Ja
n-06Mar-0
6May-0
6Ju
l-06
Sep-06Nov-0
6Ja
n-07Mar-0
7May-0
7Ju
l-07
Sep-07Nov-0
7Ja
n-08Mar-0
8May-0
8Fr
actio
n of
Day
s in
Mon
th
25
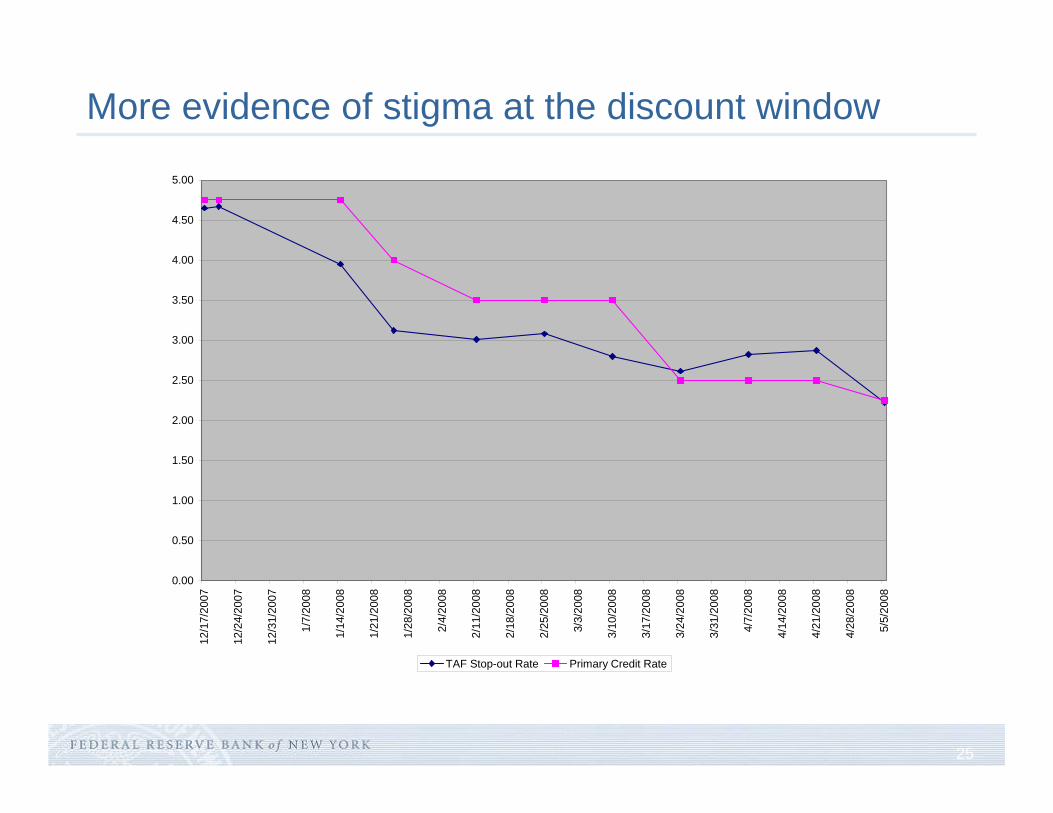
More evidence of stigma at the discount window
0.00
0.50
1.00
1.50
2.00
2.50
3.00
3.50
4.00
4.50
5.00
12/1
7/20
07
12/2
4/20
07
12/3
1/20
07
1/7/
2008
1/14
/200
8
1/21
/200
8
1/28
/200
8
2/4/
2008
2/11
/200
8
2/18
/200
8
2/25
/200
8
3/3/
2008
3/10
/200
8
3/17
/200
8
3/24
/200
8
3/31
/200
8
4/7/
2008
4/14
/200
8
4/21
/200
8
4/28
/200
8
5/5/
2008
TAF Stop-out Rate Primary Credit Rate
26
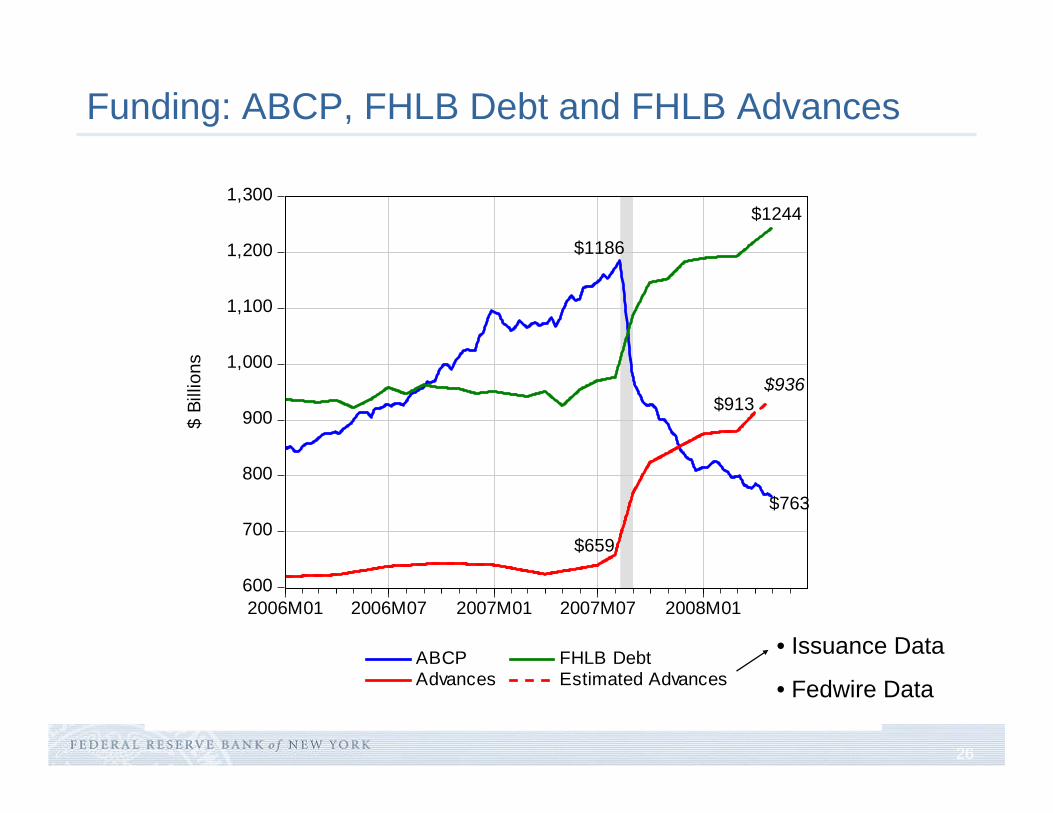
Funding: ABCP, FHLB Debt and FHLB Advances
600
700
800
900
1,000
1,100
1,200
1,300
2006M01 2006M07 2007M01 2007M07 2008M01
ABCP FHLB DebtAdvances Estimated Advances
$ Bi
llion
s
$1186
$659
$913$936
$1244
$763
• Issuance Data
• Fedwire Data
27
Historical perspective: Frame and Flannery (2006)
FHLB system founded during Depresion (1932) to promote use of long-term, fixed-rate, fully-amortizing mortgages
Historically made overcollateralized loans to thrifts funded by the issue of debt implicitly guaranteed by the US Treasury:
FHLBs contribute 10 percent of net earnings to low and moderate income housing programs and also pay interest on REFCORP bonds
In 1989, FIRREA opened up FHLB membership to commercial banks and credit unions
Between 1989 and 2005, rapid growth in membership (3.2k to 8k institutions) and system assets ($175b to $1t)
28
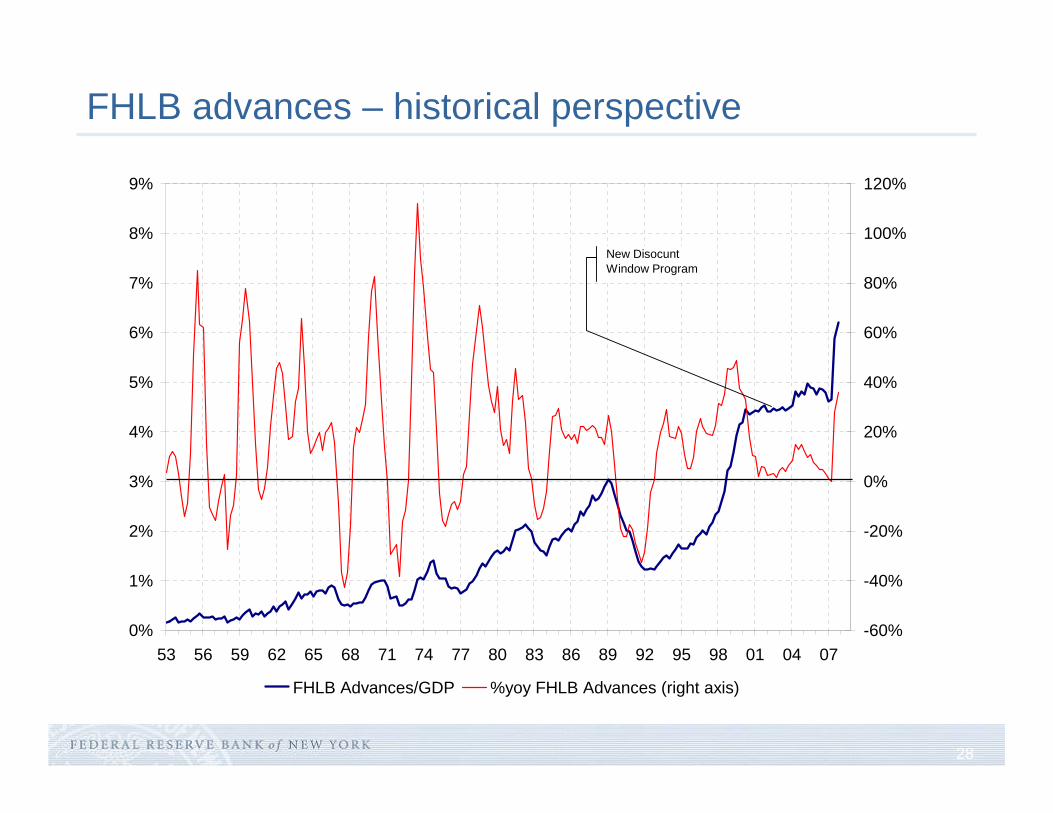
FHLB advances – historical perspective
0%
1%
2%
3%
4%
5%
6%
7%
8%
9%
53 56 59 62 65 68 71 74 77 80 83 86 89 92 95 98 01 04 07-60%
-40%
-20%
0%
20%
40%
60%
80%
100%
120%
FHLB Advances/GDP %yoy FHLB Advances (right axis)
New Disocunt Window Program
29
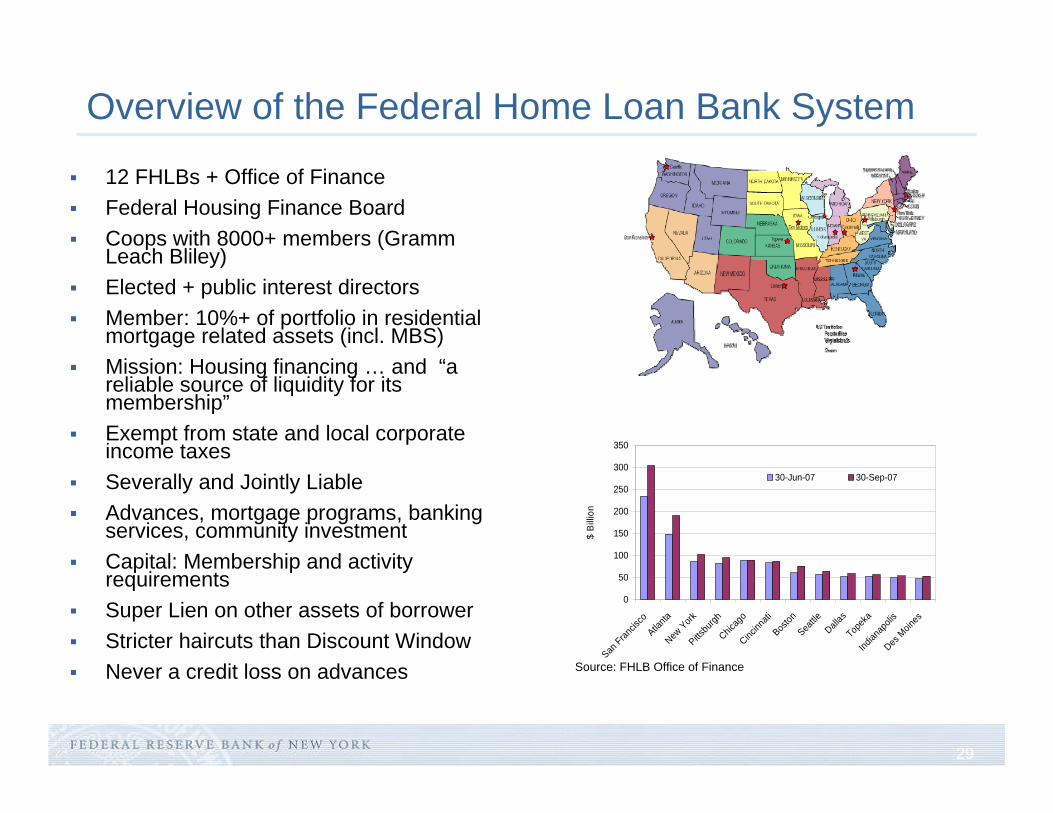
Overview of the Federal Home Loan Bank System
0
50
100
150
200
250
300
350San
Francis
coAtla
ntaNew
YorkPitts
burgh
Chicag
oCinc
innati
Boston
Seattle
Dallas
Topek
aInd
ianap
olis
Des M
oines
$ Bi
llion
30-Jun-07 30-Sep-07
12 FHLBs + Office of FinanceFederal Housing Finance Board Coops with 8000+ members (GrammLeach Bliley)Elected + public interest directorsMember: 10%+ of portfolio in residential mortgage related assets (incl. MBS)Mission: Housing financing … and “a reliable source of liquidity for its membership”Exempt from state and local corporate income taxesSeverally and Jointly LiableAdvances, mortgage programs, banking services, community investmentCapital: Membership and activity requirements Super Lien on other assets of borrowerStricter haircuts than Discount WindowNever a credit loss on advances Source: FHLB Office of Finance
30
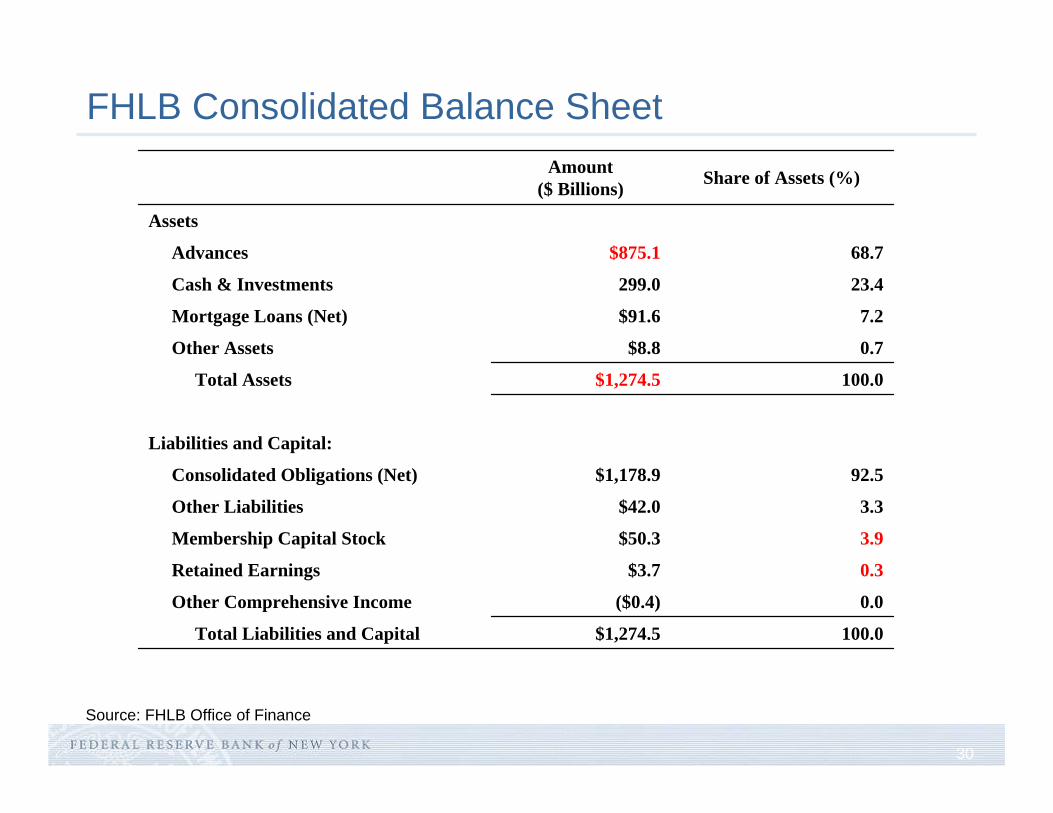
FHLB Consolidated Balance Sheet
Source: FHLB Office of Finance
100.0$1,274.5Total Liabilities and Capital
0.0($0.4)Other Comprehensive Income
0.3$3.7Retained Earnings
3.9$50.3Membership Capital Stock
3.3$42.0Other Liabilities
92.5$1,178.9Consolidated Obligations (Net)
Liabilities and Capital:
100.0$1,274.5Total Assets
0.7$8.8Other Assets
7.2$91.6Mortgage Loans (Net)
23.4299.0Cash & Investments
68.7$875.1Advances
Assets
Share of Assets (%)Amount($ Billions)
31
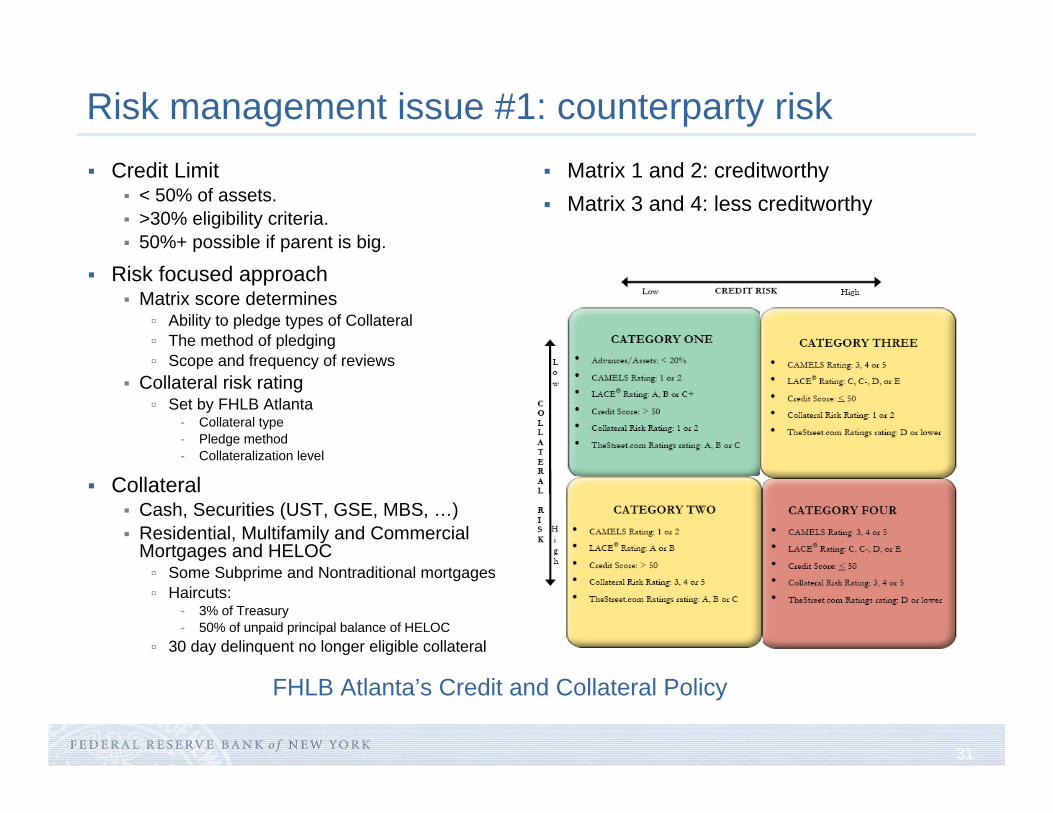
Risk management issue #1: counterparty riskCredit Limit
< 50% of assets. >30% eligibility criteria. 50%+ possible if parent is big.
Risk focused approachMatrix score determines
Ability to pledge types of CollateralThe method of pledgingScope and frequency of reviews
Collateral risk rating Set by FHLB Atlanta
- Collateral type- Pledge method- Collateralization level
CollateralCash, Securities (UST, GSE, MBS, …) Residential, Multifamily and Commercial Mortgages and HELOC
Some Subprime and Nontraditional mortgages Haircuts:
- 3% of Treasury - 50% of unpaid principal balance of HELOC
30 day delinquent no longer eligible collateral
Matrix 1 and 2: creditworthyMatrix 3 and 4: less creditworthy
FHLB Atlanta’s Credit and Collateral Policy
32
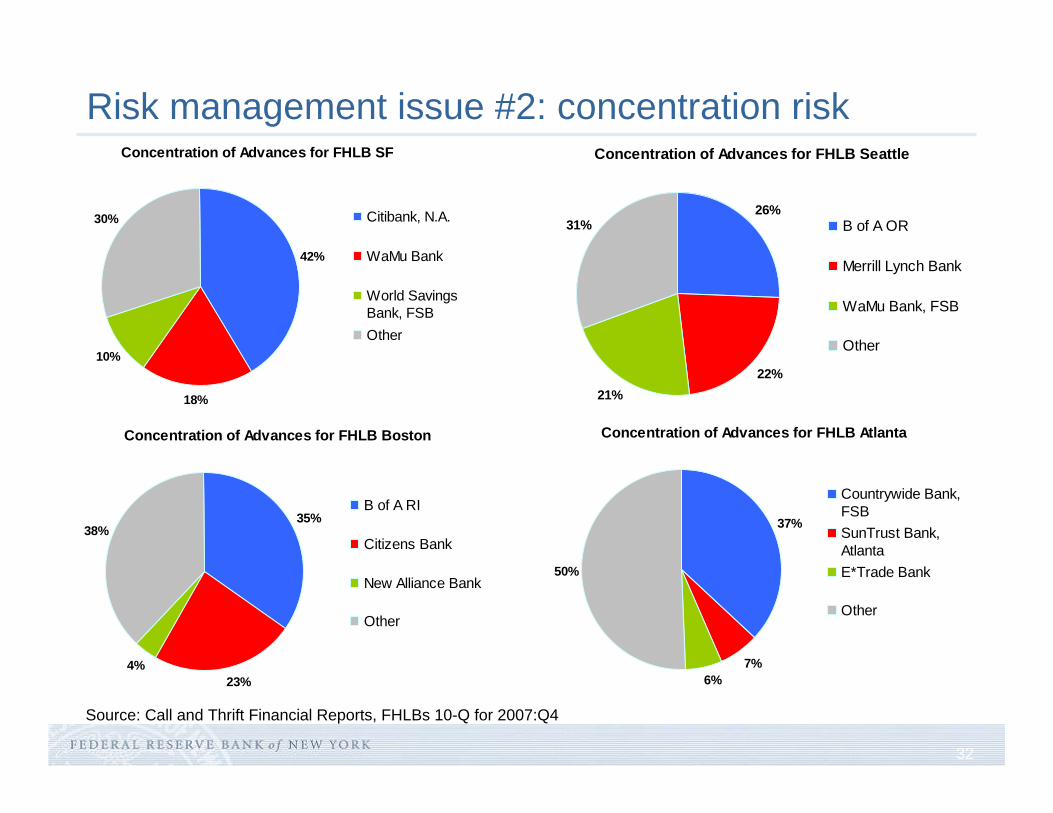
Risk management issue #2: concentration riskConcentration of Advances for FHLB SF
42%
18%
10%
30% Citibank, N.A.
WaMu Bank
World SavingsBank, FSBOther
Concentration of Advances for FHLB Seattle
26%
22%21%
31% B of A OR
Merrill Lynch Bank
WaMu Bank, FSB
Other
Concentration of Advances for FHLB Boston
35%
23%4%
38%
B of A RI
Citizens Bank
New Alliance Bank
Other
Concentration of Advances for FHLB Atlanta
37%
7%6%
50%
Countrywide Bank,FSBSunTrust Bank,AtlantaE*Trade Bank
Other
Source: Call and Thrift Financial Reports, FHLBs 10-Q for 2007:Q4
33
Risk management issue #3: moral hazard
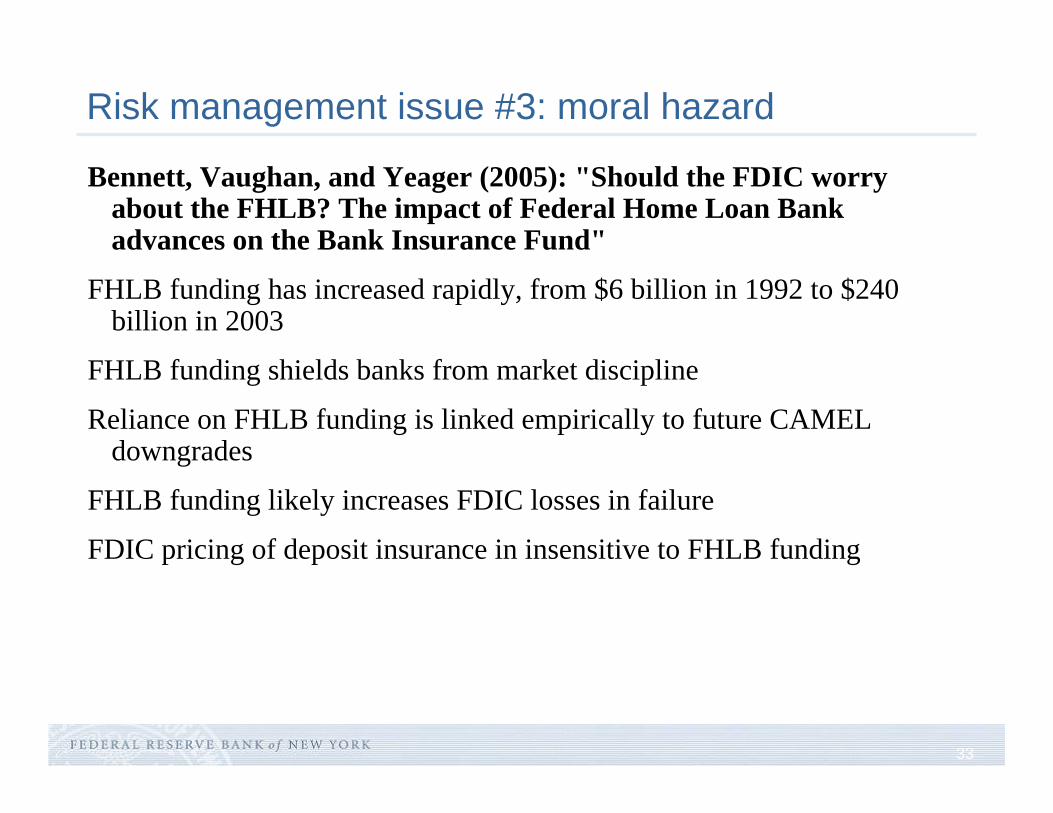
Bennett, Vaughan, and Yeager (2005): "Should the FDIC worry about the FHLB? The impact of Federal Home Loan Bank advances on the Bank Insurance Fund"
FHLB funding has increased rapidly, from $6 billion in 1992 to $240 billion in 2003
FHLB funding shields banks from market discipline
Reliance on FHLB funding is linked empirically to future CAMEL downgrades
FHLB funding likely increases FDIC losses in failure
FDIC pricing of deposit insurance in insensitive to FHLB funding
34
Risk management #4: interest rate risk
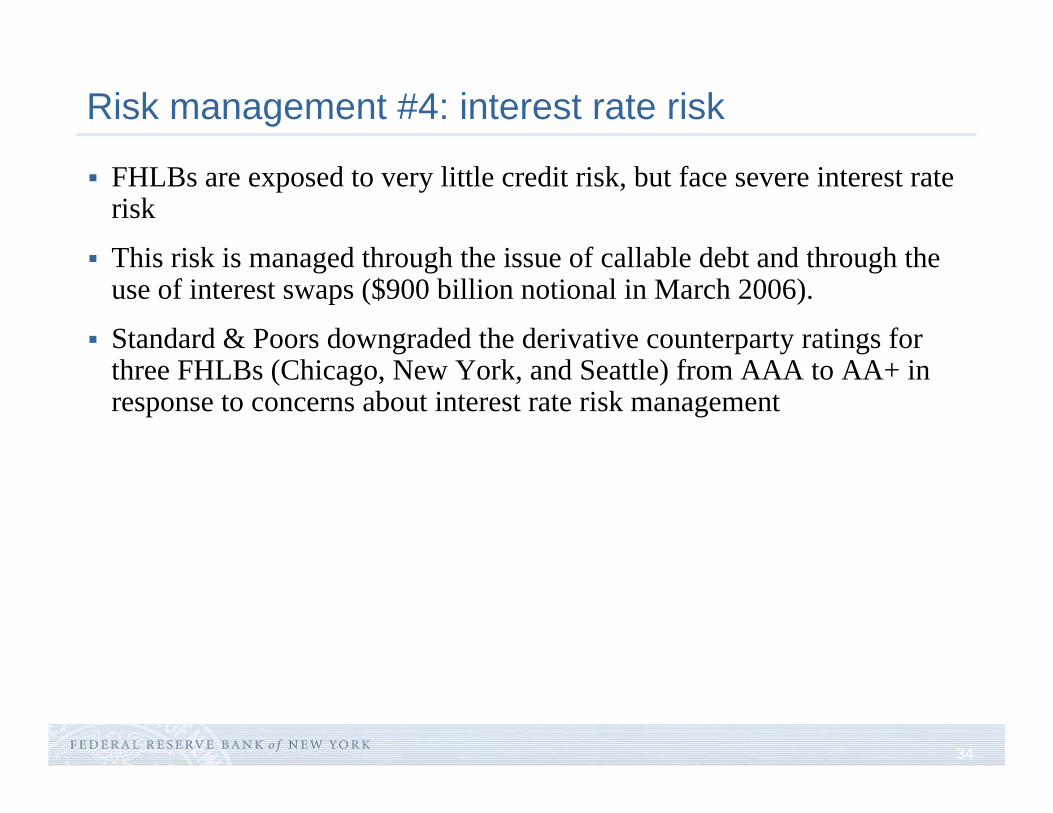
FHLBs are exposed to very little credit risk, but face severe interest rate risk
This risk is managed through the issue of callable debt and through the use of interest swaps ($900 billion notional in March 2006).
Standard & Poors downgraded the derivative counterparty ratings for three FHLBs (Chicago, New York, and Seattle) from AAA to AA+ in response to concerns about interest rate risk management
35
In Aggregate: What Explains the Increase in Advances?
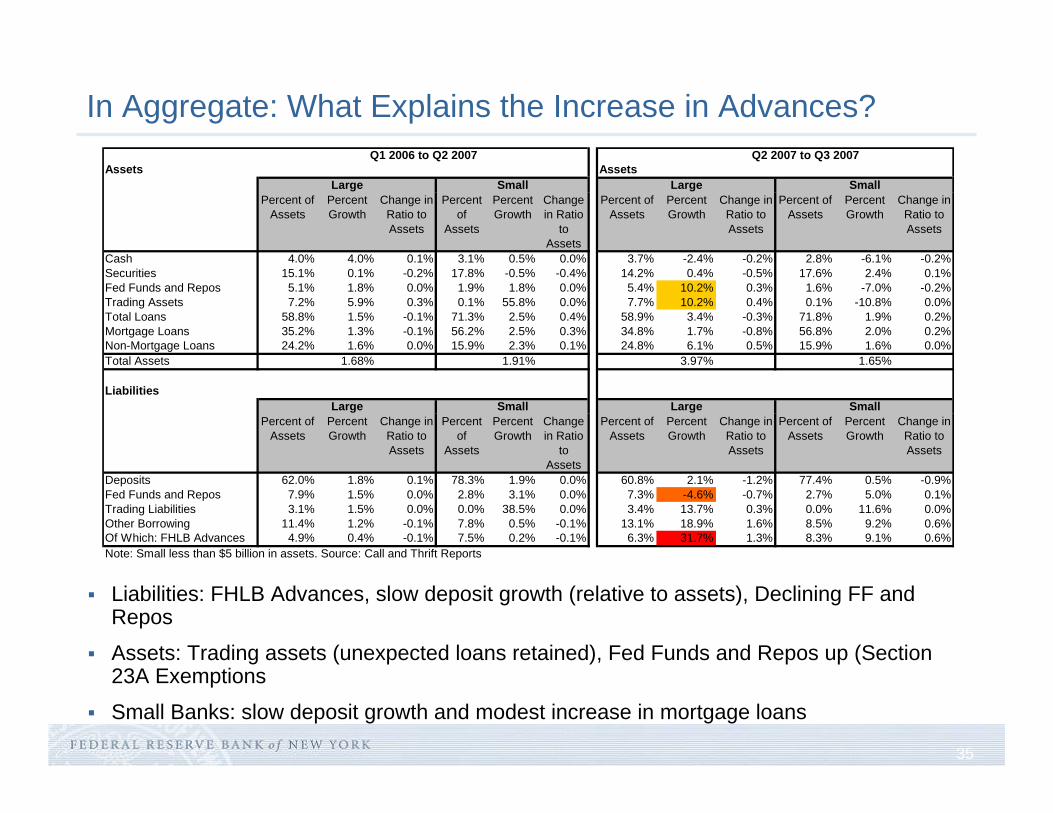
Liabilities: FHLB Advances, slow deposit growth (relative to assets), Declining FF and Repos
Assets: Trading assets (unexpected loans retained), Fed Funds and Repos up (Section 23A Exemptions
Small Banks: slow deposit growth and modest increase in mortgage loans
Assets Assets
Percent of Assets
Percent Growth
Change in Ratio to Assets
Percent of
Assets
Percent Growth
Change in Ratio
to Assets
Percent of Assets
Percent Growth
Change in Ratio to Assets
Percent of Assets
Percent Growth
Change in Ratio to Assets
Cash 4.0% 4.0% 0.1% 3.1% 0.5% 0.0% 3.7% -2.4% -0.2% 2.8% -6.1% -0.2%Securities 15.1% 0.1% -0.2% 17.8% -0.5% -0.4% 14.2% 0.4% -0.5% 17.6% 2.4% 0.1%Fed Funds and Repos 5.1% 1.8% 0.0% 1.9% 1.8% 0.0% 5.4% 10.2% 0.3% 1.6% -7.0% -0.2%Trading Assets 7.2% 5.9% 0.3% 0.1% 55.8% 0.0% 7.7% 10.2% 0.4% 0.1% -10.8% 0.0%Total Loans 58.8% 1.5% -0.1% 71.3% 2.5% 0.4% 58.9% 3.4% -0.3% 71.8% 1.9% 0.2%Mortgage Loans 35.2% 1.3% -0.1% 56.2% 2.5% 0.3% 34.8% 1.7% -0.8% 56.8% 2.0% 0.2%Non-Mortgage Loans 24.2% 1.6% 0.0% 15.9% 2.3% 0.1% 24.8% 6.1% 0.5% 15.9% 1.6% 0.0%Total Assets 1.68% 1.91% 3.97% 1.65%
Liabilities
Percent of Assets
Percent Growth
Change in Ratio to Assets
Percent of
Assets
Percent Growth
Change in Ratio
to Assets
Percent of Assets
Percent Growth
Change in Ratio to Assets
Percent of Assets
Percent Growth
Change in Ratio to Assets
Deposits 62.0% 1.8% 0.1% 78.3% 1.9% 0.0% 60.8% 2.1% -1.2% 77.4% 0.5% -0.9%Fed Funds and Repos 7.9% 1.5% 0.0% 2.8% 3.1% 0.0% 7.3% -4.6% -0.7% 2.7% 5.0% 0.1%Trading Liabilities 3.1% 1.5% 0.0% 0.0% 38.5% 0.0% 3.4% 13.7% 0.3% 0.0% 11.6% 0.0%Other Borrowing 11.4% 1.2% -0.1% 7.8% 0.5% -0.1% 13.1% 18.9% 1.6% 8.5% 9.2% 0.6%Of Which: FHLB Advances 4.9% 0.4% -0.1% 7.5% 0.2% -0.1% 6.3% 31.7% 1.3% 8.3% 9.1% 0.6%Note: Small less than $5 billion in assets. Source: Call and Thrift Reports
Large Small
Large Small
Q1 2006 to Q2 2007
Large Small
Large Small
Q2 2007 to Q3 2007
36
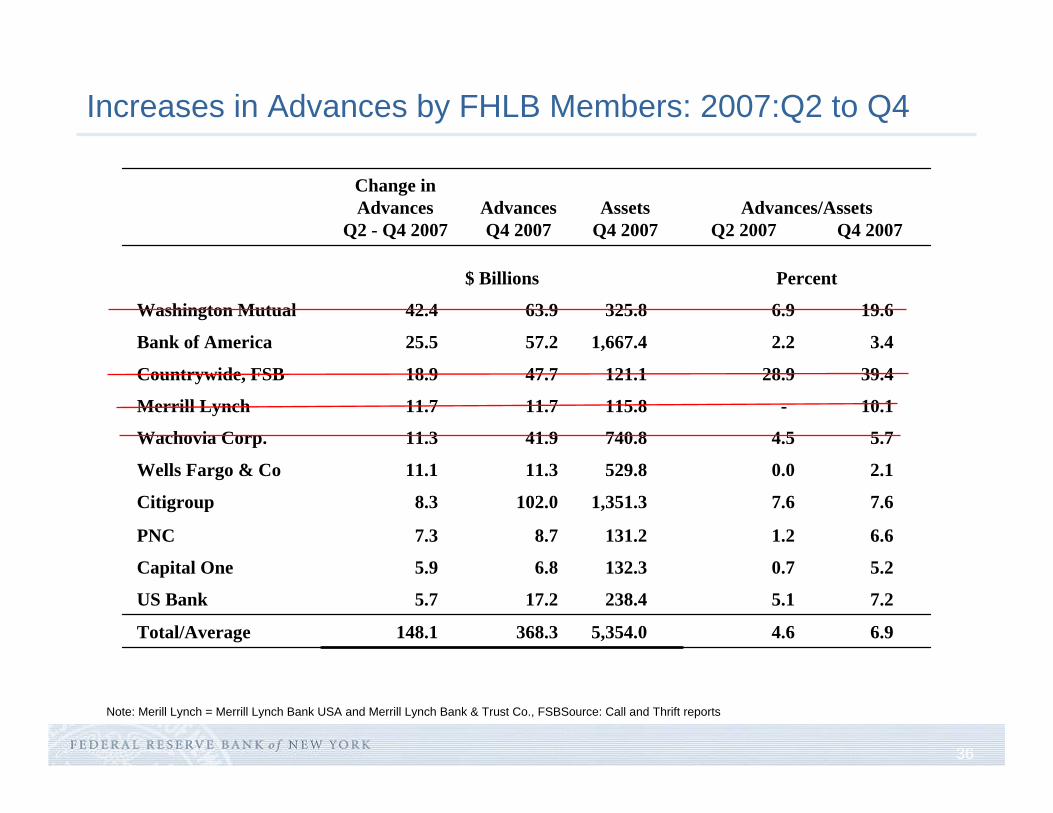
Increases in Advances by FHLB Members: 2007:Q2 to Q4
6.9 4.6 5,354.0 368.3 148.1 Total/Average
7.2 5.1 238.4 17.2 5.7 US Bank
5.2 0.7 132.3 6.8 5.9 Capital One
6.6 1.2 131.2 8.7 7.3 PNC
7.6 7.6 1,351.3 102.0 8.3 Citigroup
2.1 0.0 529.8 11.3 11.1 Wells Fargo & Co
5.7 4.5 740.8 41.9 11.3 Wachovia Corp.
10.1 -115.8 11.7 11.7 Merrill Lynch
39.4 28.9 121.1 47.7 18.9 Countrywide, FSB
3.4 2.2 1,667.4 57.2 25.5 Bank of America
19.6 6.9 325.8 63.9 42.4 Washington Mutual
Percent$ Billions
Advances/AssetsQ2 2007 Q4 2007
AssetsQ4 2007
AdvancesQ4 2007
Change inAdvances
Q2 - Q4 2007
Note: Merill Lynch = Merrill Lynch Bank USA and Merrill Lynch Bank & Trust Co., FSBSource: Call and Thrift reports
37
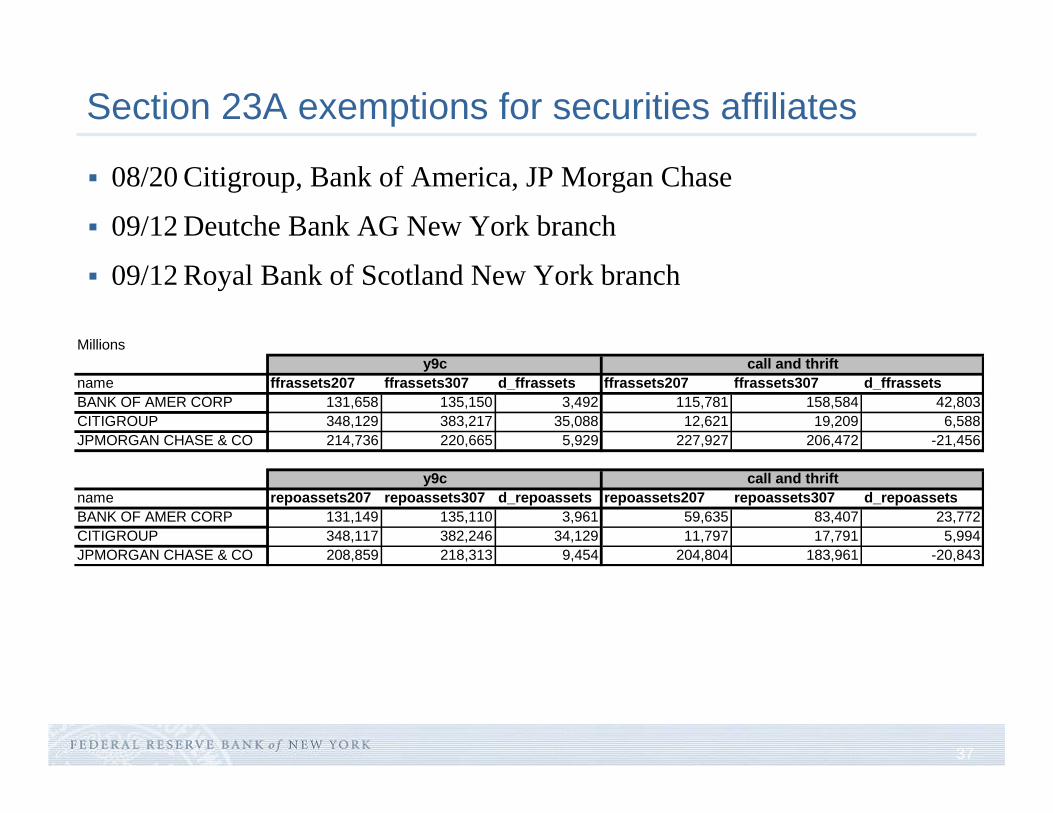
Section 23A exemptions for securities affiliates
08/20 Citigroup, Bank of America, JP Morgan Chase
09/12 Deutche Bank AG New York branch
09/12 Royal Bank of Scotland New York branch
Millions
name ffrassets207 ffrassets307 d_ffrassets ffrassets207 ffrassets307 d_ffrassetsBANK OF AMER CORP 131,658 135,150 3,492 115,781 158,584 42,803CITIGROUP 348,129 383,217 35,088 12,621 19,209 6,588JPMORGAN CHASE & CO 214,736 220,665 5,929 227,927 206,472 -21,456
name repoassets207 repoassets307 d_repoassets repoassets207 repoassets307 d_repoassetsBANK OF AMER CORP 131,149 135,110 3,961 59,635 83,407 23,772CITIGROUP 348,117 382,246 34,129 11,797 17,791 5,994JPMORGAN CHASE & CO 208,859 218,313 9,454 204,804 183,961 -20,843
y9c call and thrift
y9c call and thrift
38
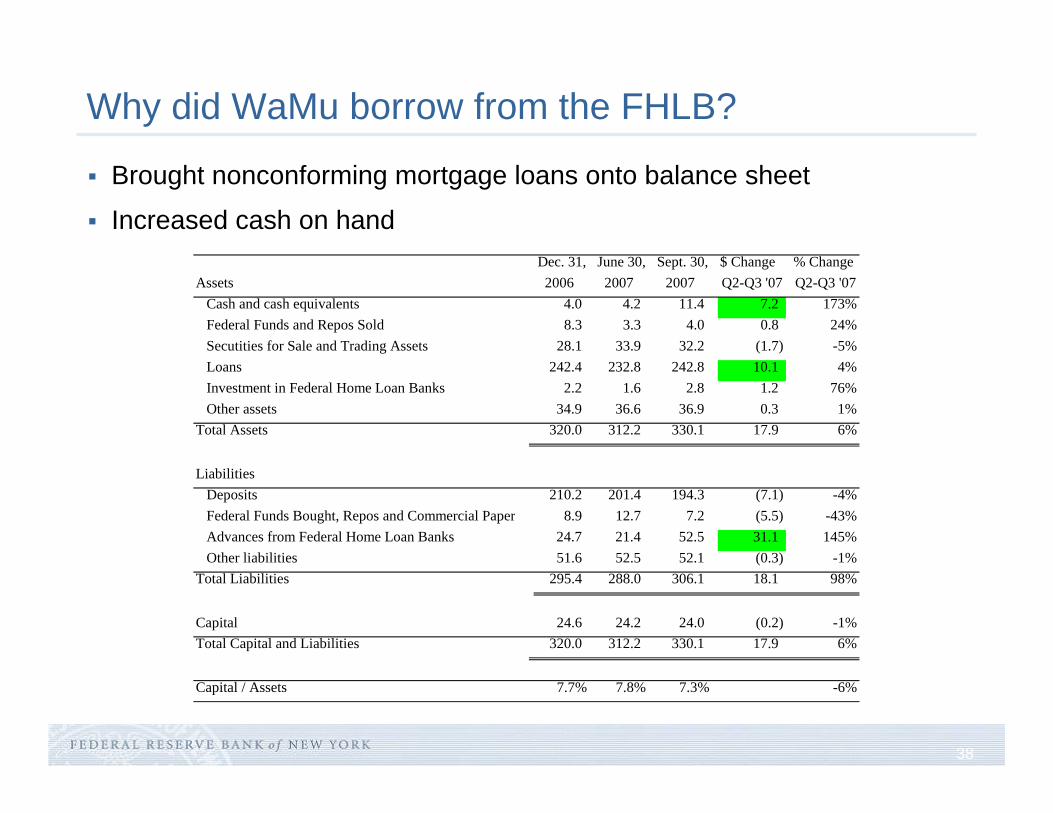
Why did WaMu borrow from the FHLB?
Brought nonconforming mortgage loans onto balance sheet
Increased cash on handDec. 31, June 30, Sept. 30, $ Change % Change
Assets 2006 2007 2007 Q2-Q3 '07 Q2-Q3 '07 Cash and cash equivalents 4.0 4.2 11.4 7.2 173% Federal Funds and Repos Sold 8.3 3.3 4.0 0.8 24% Secutities for Sale and Trading Assets 28.1 33.9 32.2 (1.7) -5% Loans 242.4 232.8 242.8 10.1 4% Investment in Federal Home Loan Banks 2.2 1.6 2.8 1.2 76% Other assets 34.9 36.6 36.9 0.3 1%Total Assets 320.0 312.2 330.1 17.9 6% Liabilities Deposits 210.2 201.4 194.3 (7.1) -4% Federal Funds Bought, Repos and Commercial Paper 8.9 12.7 7.2 (5.5) -43% Advances from Federal Home Loan Banks 24.7 21.4 52.5 31.1 145% Other liabilities 51.6 52.5 52.1 (0.3) -1%Total Liabilities 295.4 288.0 306.1 18.1 98%
Capital 24.6 24.2 24.0 (0.2) -1%Total Capital and Liabilities 320.0 312.2 330.1 17.9 6%
Capital / Assets 7.7% 7.8% 7.3% -6%
39
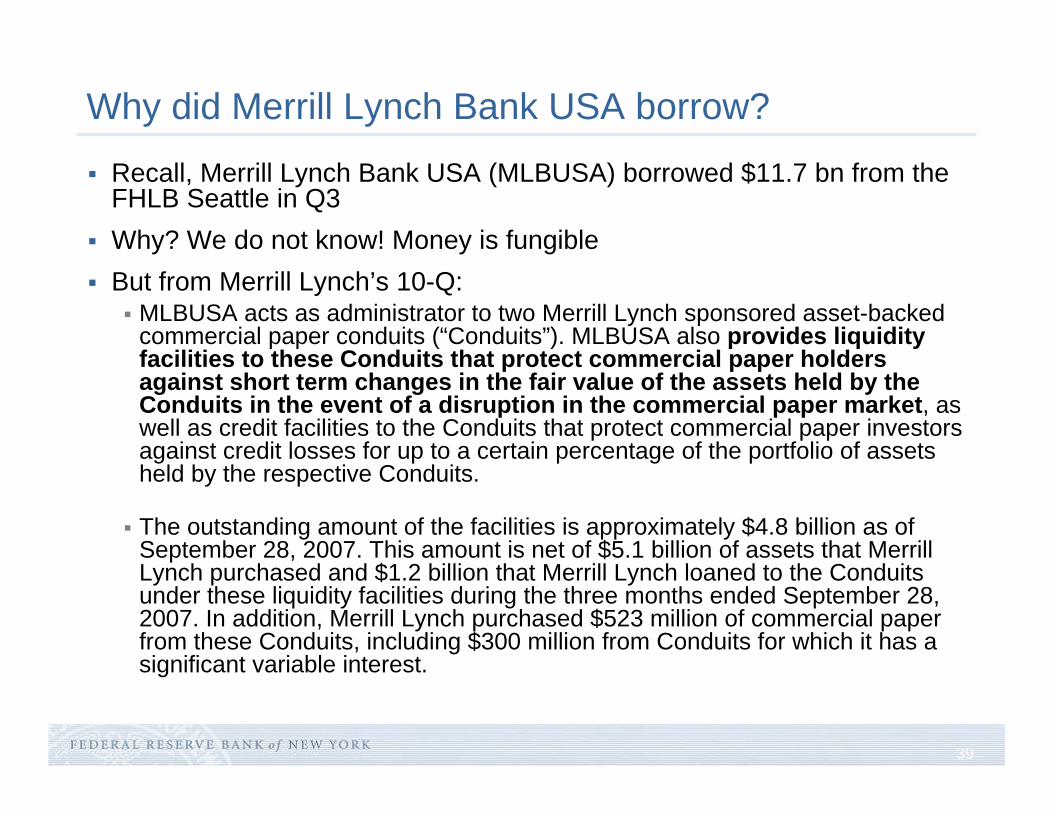
Why did Merrill Lynch Bank USA borrow?
Recall, Merrill Lynch Bank USA (MLBUSA) borrowed $11.7 bn from the FHLB Seattle in Q3Why? We do not know! Money is fungibleBut from Merrill Lynch’s 10-Q:
MLBUSA acts as administrator to two Merrill Lynch sponsored asset-backed commercial paper conduits (“Conduits”). MLBUSA also provides liquidity facilities to these Conduits that protect commercial paper holders against short term changes in the fair value of the assets held by the Conduits in the event of a disruption in the commercial paper market, as well as credit facilities to the Conduits that protect commercial paper investors against credit losses for up to a certain percentage of the portfolio of assets held by the respective Conduits.
The outstanding amount of the facilities is approximately $4.8 billion as of September 28, 2007. This amount is net of $5.1 billion of assets that Merrill Lynch purchased and $1.2 billion that Merrill Lynch loaned to the Conduits under these liquidity facilities during the three months ended September 28, 2007. In addition, Merrill Lynch purchased $523 million of commercial paper from these Conduits, including $300 million from Conduits for which it has a significant variable interest.
40
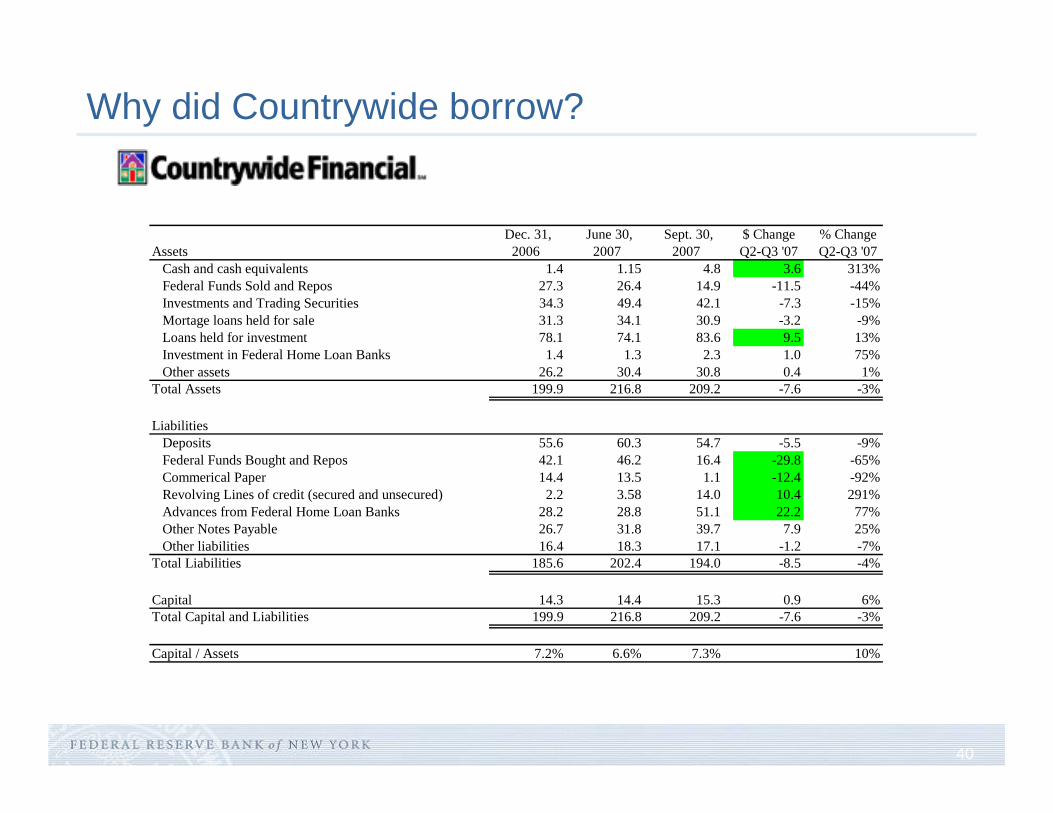
Why did Countrywide borrow?
Dec. 31, June 30, Sept. 30, $ Change % ChangeAssets 2006 2007 2007 Q2-Q3 '07 Q2-Q3 '07 Cash and cash equivalents 1.4 1.15 4.8 3.6 313% Federal Funds Sold and Repos 27.3 26.4 14.9 -11.5 -44% Investments and Trading Securities 34.3 49.4 42.1 -7.3 -15% Mortage loans held for sale 31.3 34.1 30.9 -3.2 -9% Loans held for investment 78.1 74.1 83.6 9.5 13% Investment in Federal Home Loan Banks 1.4 1.3 2.3 1.0 75% Other assets 26.2 30.4 30.8 0.4 1%Total Assets 199.9 216.8 209.2 -7.6 -3%
Liabilities Deposits 55.6 60.3 54.7 -5.5 -9% Federal Funds Bought and Repos 42.1 46.2 16.4 -29.8 -65% Commerical Paper 14.4 13.5 1.1 -12.4 -92% Revolving Lines of credit (secured and unsecured) 2.2 3.58 14.0 10.4 291% Advances from Federal Home Loan Banks 28.2 28.8 51.1 22.2 77% Other Notes Payable 26.7 31.8 39.7 7.9 25% Other liabilities 16.4 18.3 17.1 -1.2 -7%Total Liabilities 185.6 202.4 194.0 -8.5 -4%
Capital 14.3 14.4 15.3 0.9 6%Total Capital and Liabilities 199.9 216.8 209.2 -7.6 -3%
Capital / Assets 7.2% 6.6% 7.3% 10%
41
Explain differential advance usage across institutions
Focus on all bank and thrift reports, 2006:Q1 to 2007:Q4
Identify the "normal" correlation between Advances and other Balance Sheet Categories over 2006:Q1 to 2007:Q2:
Repo lending
Trading Assets
Loans (Mortgage and non-Mortgage)
Funding (Deposits and Repo borrowing)
Document how this correlation changes during the last two quarters of 2007
42
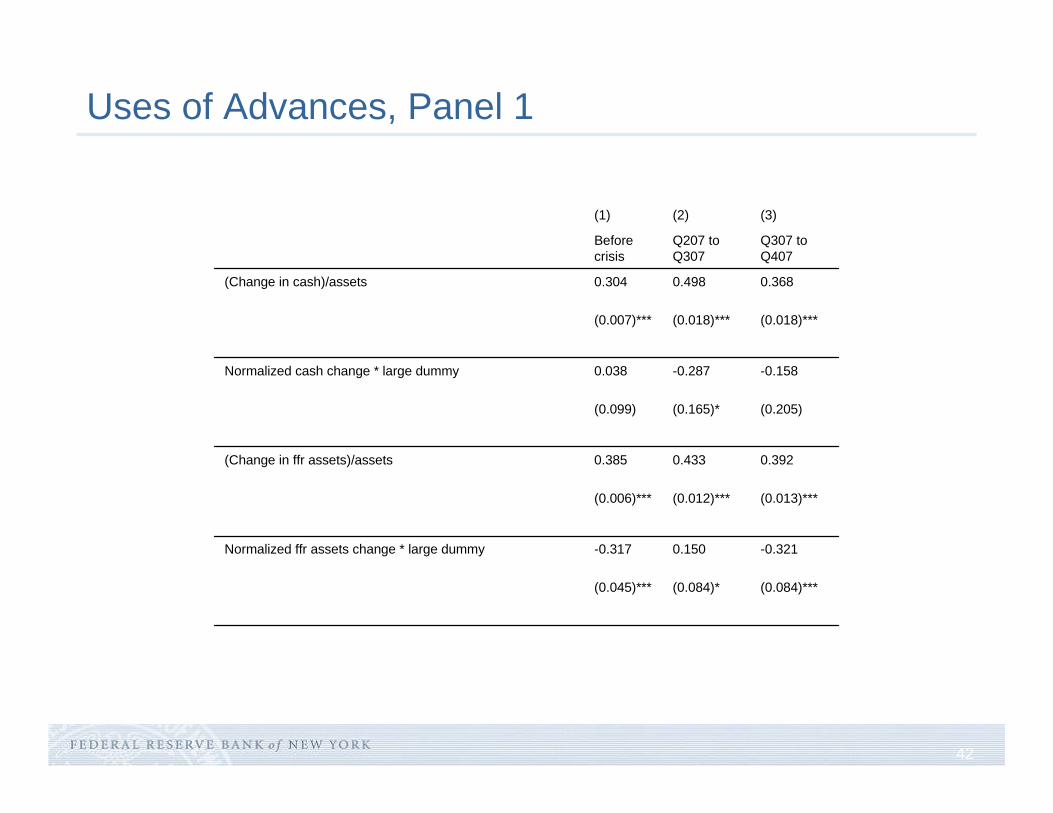
Uses of Advances, Panel 1
(0.084)***(0.084)*(0.045)***
-0.3210.150-0.317Normalized ffr assets change * large dummy
(0.013)***(0.012)***(0.006)***
0.3920.4330.385(Change in ffr assets)/assets
(0.205)(0.165)*(0.099)
-0.158-0.2870.038Normalized cash change * large dummy
(0.018)***(0.018)***(0.007)***
0.3680.4980.304(Change in cash)/assets
Q307 to Q407
Q207 to Q307
Before crisis
(3)(2)(1)
43
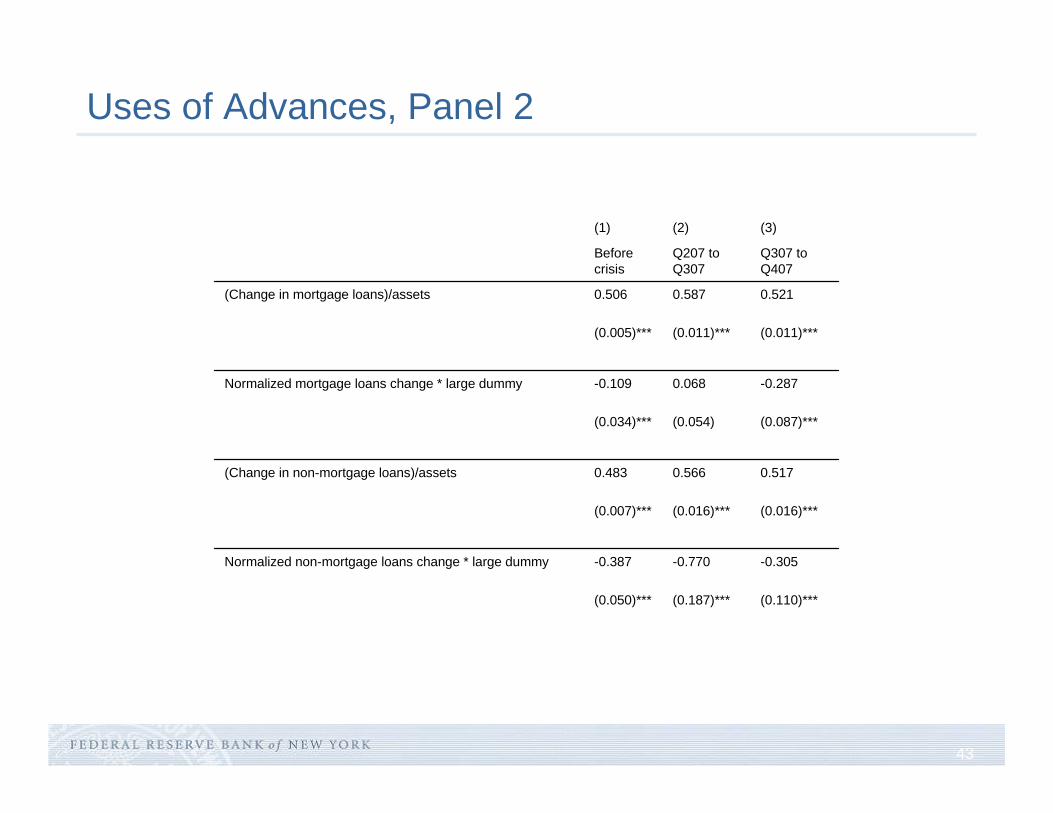
Uses of Advances, Panel 2
(0.110)***(0.187)***(0.050)***
-0.305-0.770-0.387Normalized non-mortgage loans change * large dummy
(0.016)***(0.016)***(0.007)***
0.5170.5660.483(Change in non-mortgage loans)/assets
(0.087)***(0.054)(0.034)***
-0.2870.068-0.109Normalized mortgage loans change * large dummy
(0.011)***(0.011)***(0.005)***
0.5210.5870.506(Change in mortgage loans)/assets
Q307 to Q407
Q207 to Q307
Before crisis
(3)(2)(1)
44
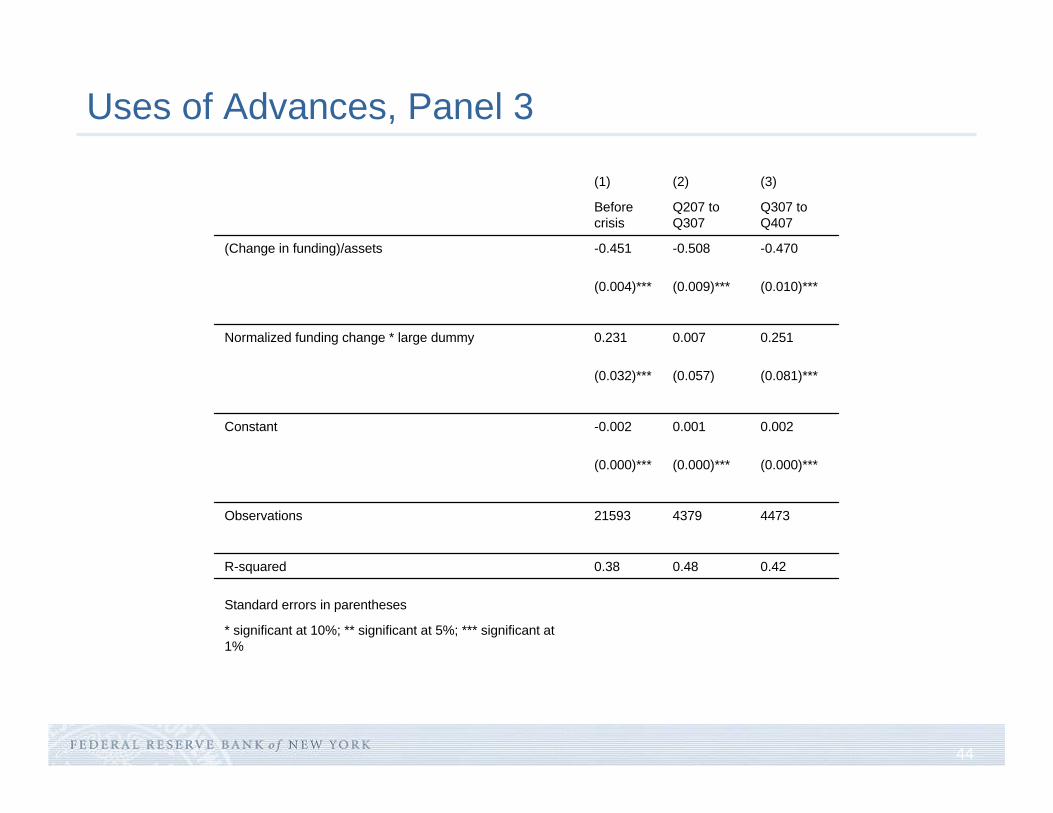
Uses of Advances, Panel 3
* significant at 10%; ** significant at 5%; *** significant at 1%
Standard errors in parentheses
0.420.480.38R-squared
4473437921593Observations
(0.000)***(0.000)***(0.000)***
0.0020.001-0.002Constant
(0.081)***(0.057)(0.032)***
0.2510.0070.231Normalized funding change * large dummy
(0.010)***(0.009)***(0.004)***
-0.470-0.508-0.451(Change in funding)/assets
Q307 to Q407
Q207 to Q307
Before crisis
(3)(2)(1)
45
2. December 2007 (foreign banks)
Dollar LIBOR panel membership and FHLB access
FHLB Advances versus Discount window
The Term Auction Facility
The Foreign Central Bank Swap Lines
46
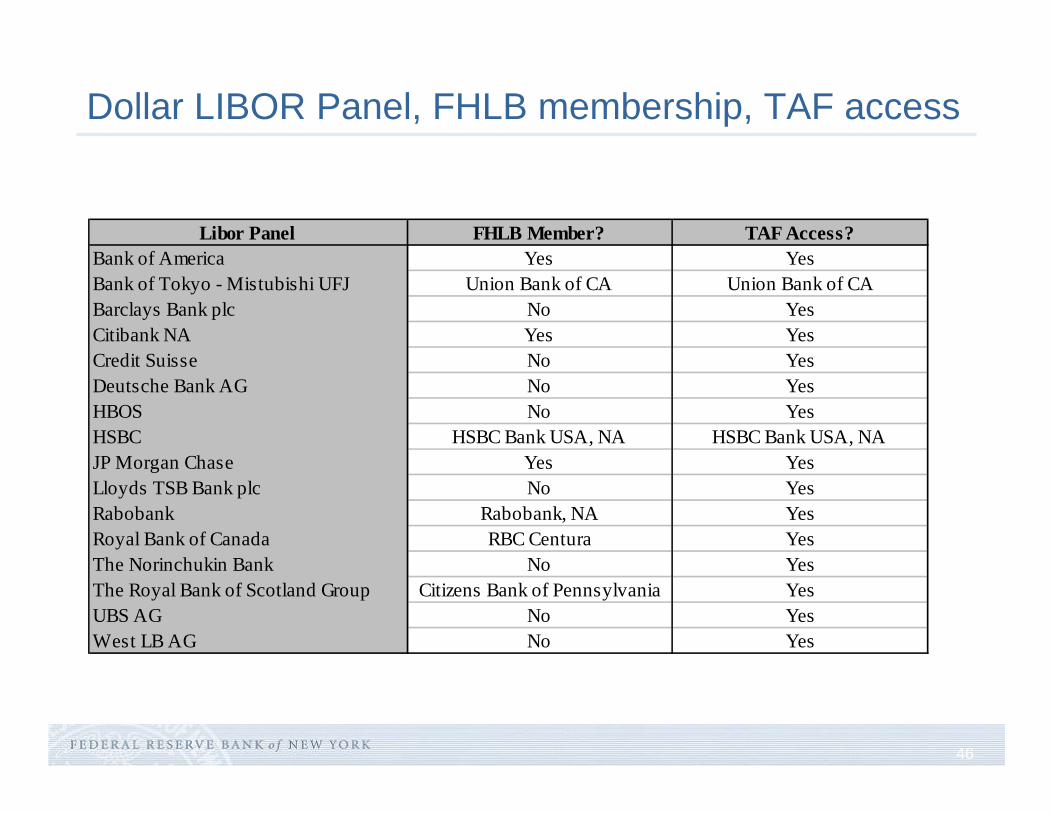
Dollar LIBOR Panel, FHLB membership, TAF access
Libor Panel FHLB Member? TAF Access?Bank of America Yes YesBank of Tokyo - Mistubishi UFJ Union Bank of CA Union Bank of CABarclays Bank plc No YesCitibank NA Yes YesCredit Suisse No YesDeutsche Bank AG No YesHBOS No YesHSBC HSBC Bank USA, NA HSBC Bank USA, NAJP Morgan Chase Yes YesLloyds TSB Bank plc No YesRabobank Rabobank, NA YesRoyal Bank of Canada RBC Centura YesThe Norinchukin Bank No YesThe Royal Bank of Scotland Group Citizens Bank of Pennsylvania YesUBS AG No YesWest LB AG No Yes
47
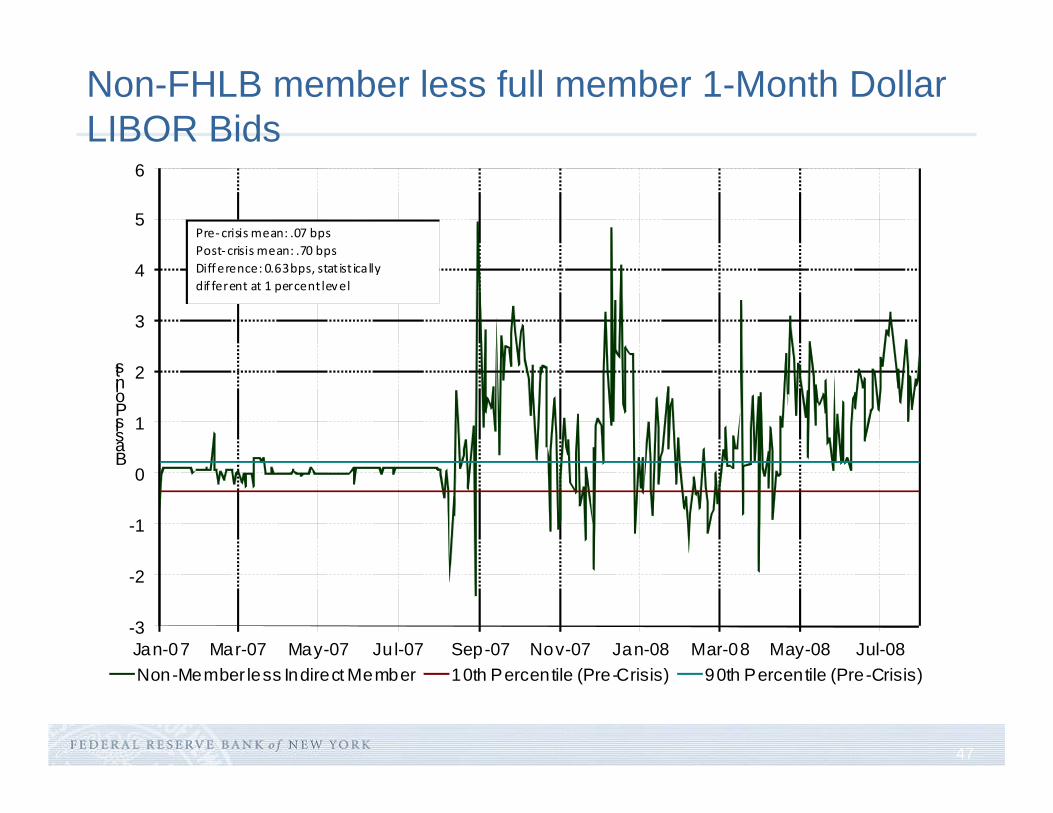
Non-FHLB member less full member 1-Month Dollar LIBOR Bids
-3
-2
-1
0
1
2
3
4
5
6
Jan-07 Mar-07 May-07 Jul-07 Sep-07 Nov-07 Jan-08 Mar-08 May-08 Jul-08
Basis Points
Non-Member less Indirect Member 10th Percentile (Pre-Crisis) 90th Percentile (Pre-Crisis)
Pre‐crisis mean: .07 bpsPost‐crisis mean: .70 bpsDifference: 0.63 bps, stat ist ically dif ferent at 1 percent level
48
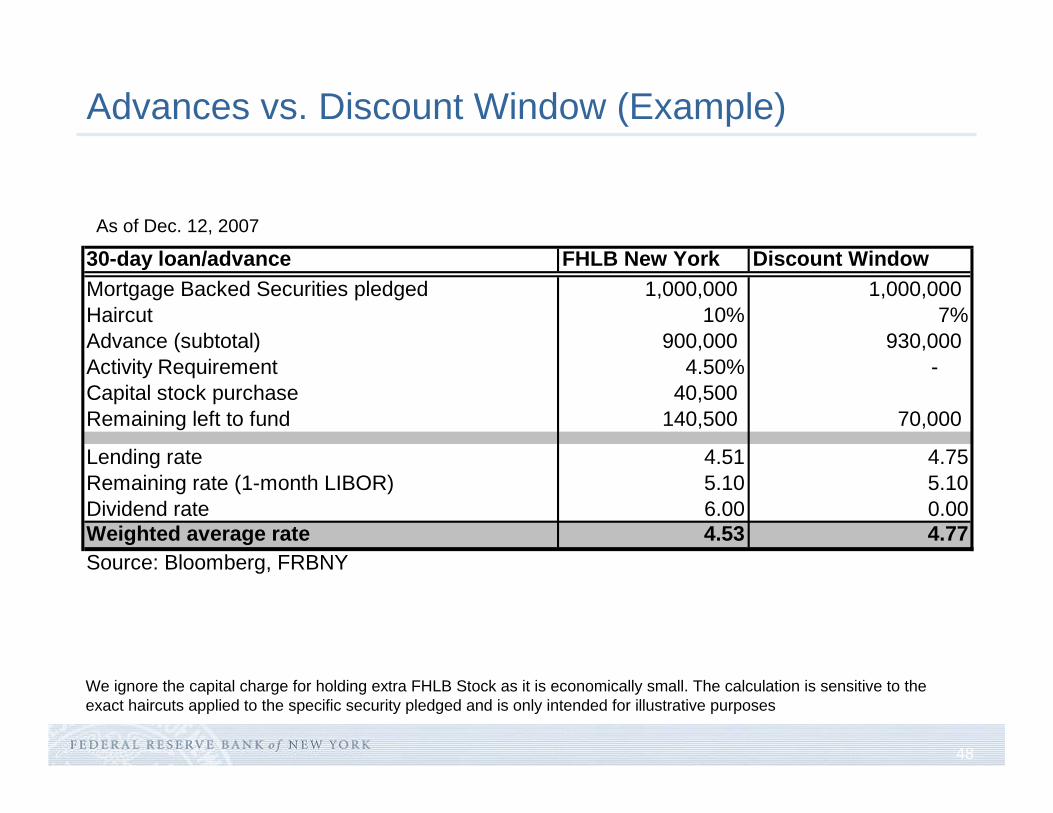
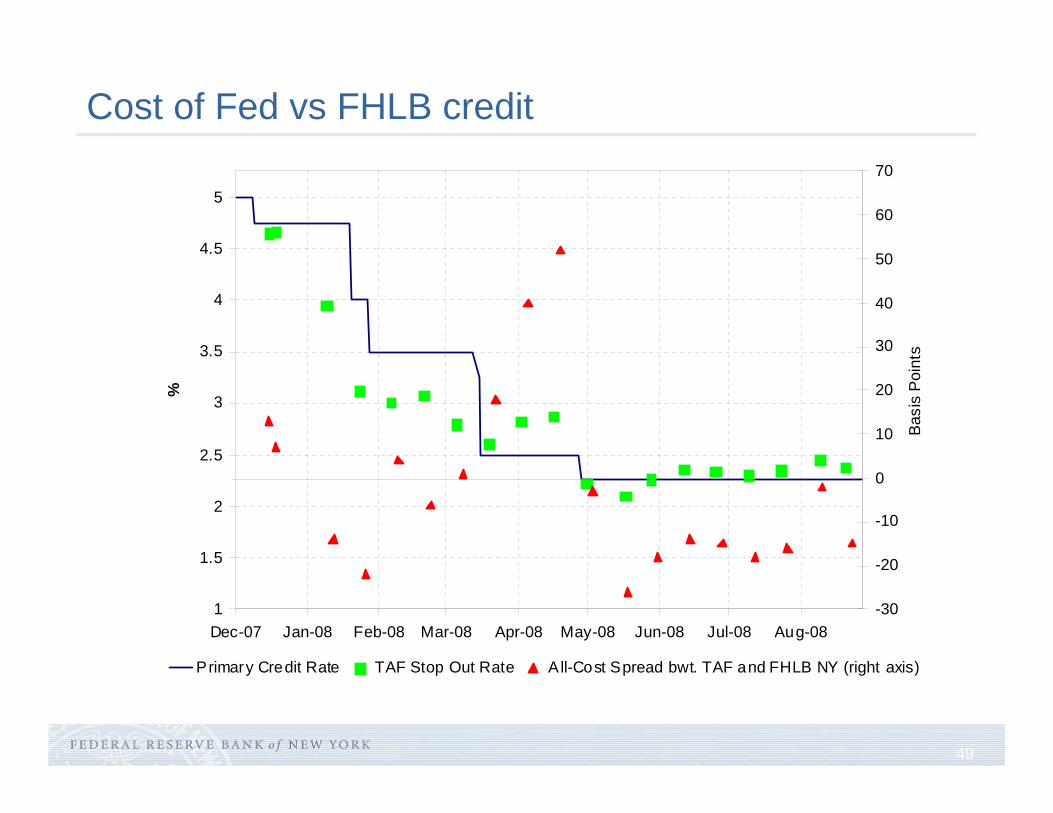
Advances vs. Discount Window (Example)
We ignore the capital charge for holding extra FHLB Stock as it is economically small. The calculation is sensitive to the exact haircuts applied to the specific security pledged and is only intended for illustrative purposes
As of Dec. 12, 2007
30-day loan/advance FHLB New York Discount Window Mortgage Backed Securities pledged 1,000,000 1,000,000 Haircut 10% 7%Advance (subtotal) 900,000 930,000 Activity Requirement 4.50% - Capital stock purchase 40,500 930,000 Remaining left to fund 140,500 70,000
Lending rate 4.51 4.75Remaining rate (1-month LIBOR) 5.10 5.10Dividend rate 6.00 0.00Weighted average rate 4.53 4.77Source: Bloomberg, FRBNY
49
Cost of Fed vs FHLB credit
1
1.5
2
2.5
3
3.5
4
4.5
5
Dec-07 Jan-08 Feb-08 Mar-08 Apr-08 May-08 Jun-08 Jul-08 Aug-08
%
-30
-20
-10
0
10
20
30
40
50
60
70
Bas
is P
oint
s
P rimary Credit Rate TAF Stop Out Rate All-Cost Spread bwt. TAF and FHLB NY (right axis)
50
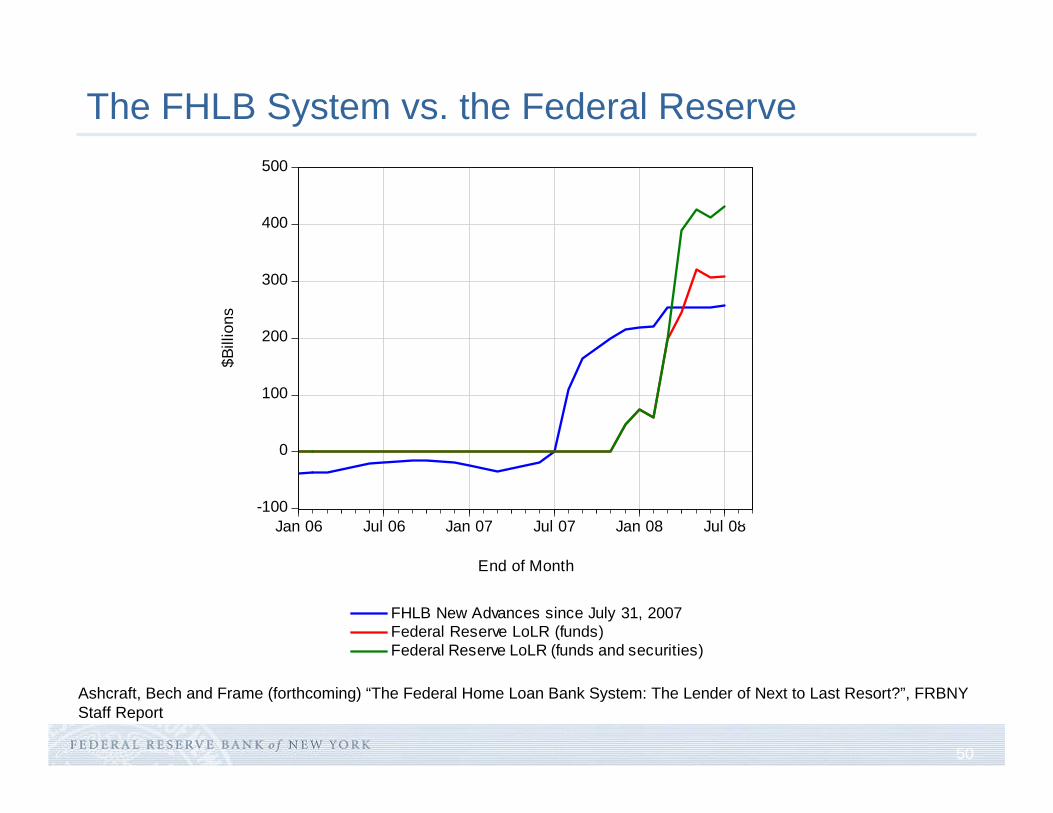
The FHLB System vs. the Federal Reserve
Ashcraft, Bech and Frame (forthcoming) “The Federal Home Loan Bank System: The Lender of Next to Last Resort?”, FRBNY Staff Report
-100
0
100
200
300
400
500
Jan 06 Jul 06 Jan 07 Jul 07 Jan 08 Jul 08
FHLB New Advances since July 31, 2007Federal Reserve LoLR (funds)Federal Reserve LoLR (funds and securities)
$Bill
ions
End of Month
51
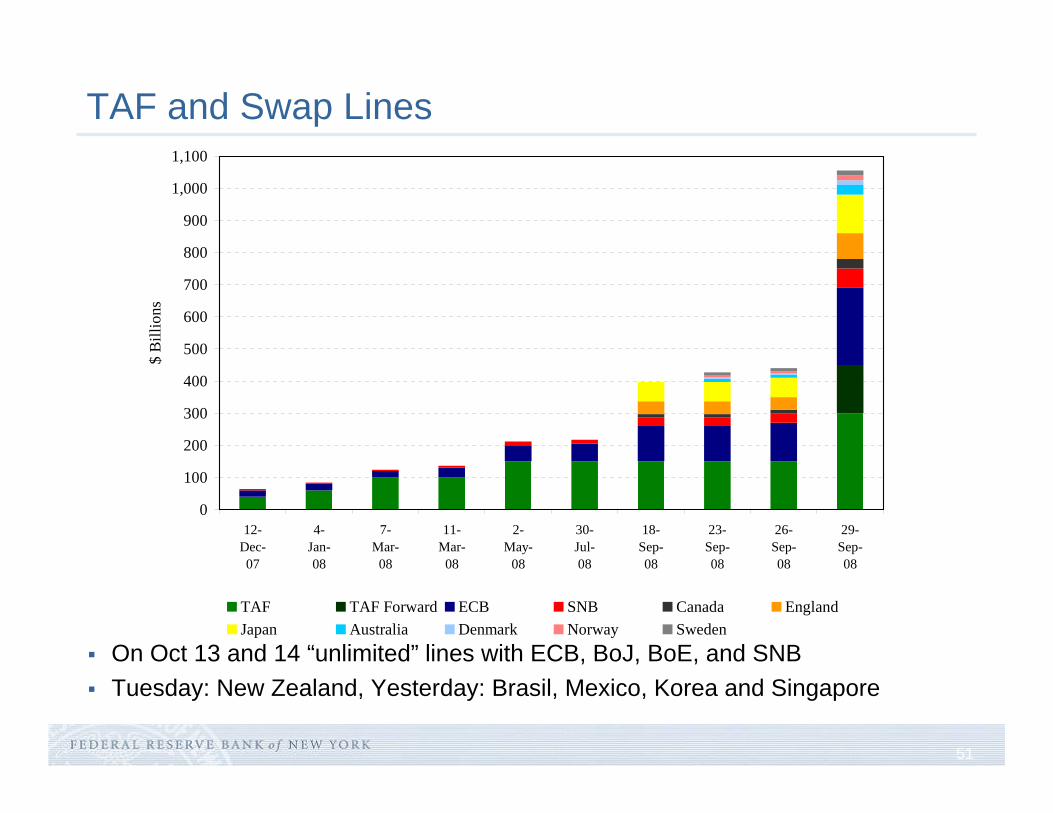
TAF and Swap Lines
On Oct 13 and 14 “unlimited” lines with ECB, BoJ, BoE, and SNBTuesday: New Zealand, Yesterday: Brasil, Mexico, Korea and Singapore
0
100
200
300
400
500
600
700
800
900
1,000
1,100
12-Dec-07
4-Jan-08
7-Mar-
08
11-Mar-
08
2-May-
08
30-Jul-08
18-Sep-08
23-Sep-08
26-Sep-08
29-Sep-08
$ B
illio
ns
TAF TAF Forward ECB SNB Canada EnglandJapan Australia Denmark Norway Sweden
52
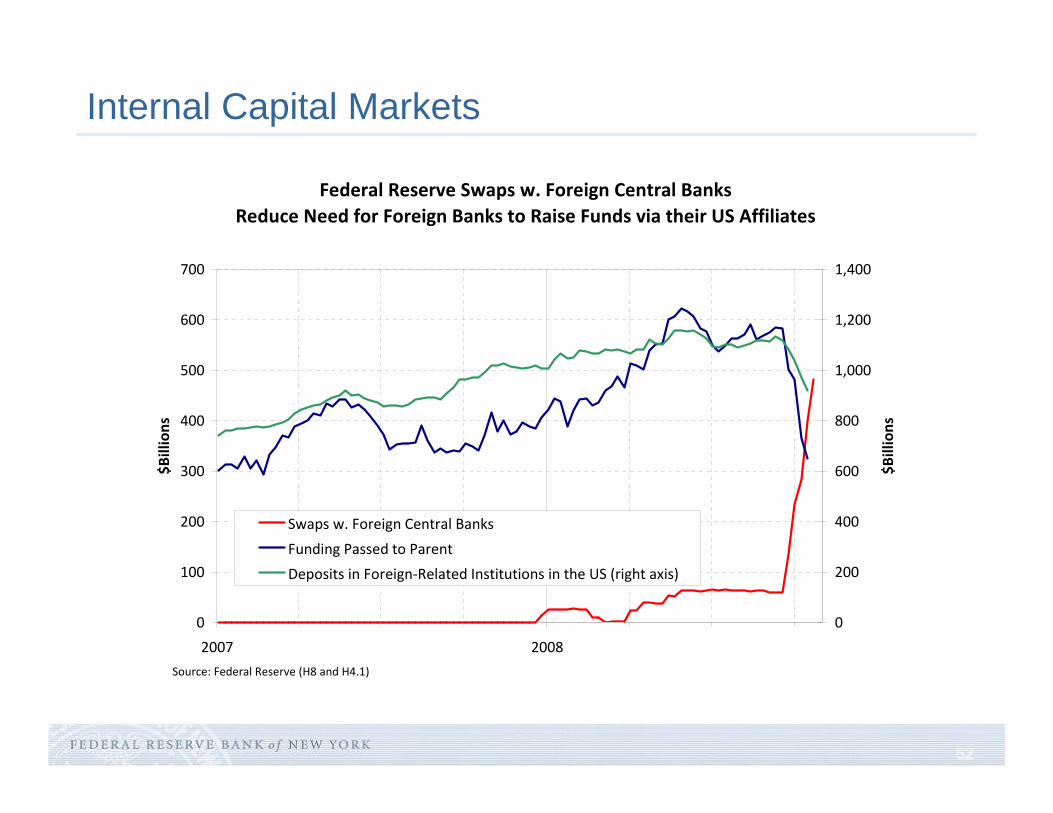
Internal Capital Markets
Federal Reserve Swaps w. Foreign Central Banks Reduce Need for Foreign Banks to Raise Funds via their US Affiliates
0
100
200
300
400
500
600
700
2007 2008
$Billions
0
200
400
600
800
1,000
1,200
1,400
$Billions
Swaps w. Foreign Central Banks
Funding Passed to Parent
Deposits in Foreign‐Related Institutions in the US (right axis)
Source: Federal Reserve (H8 and H4.1)
53
3. March 2008 (investment banks)
The run on secured credit
Primary dealers and access to the Federal Reserve
Central Bank response: Single tranche open-market operationsPDCFTSLFMaiden Lane
54
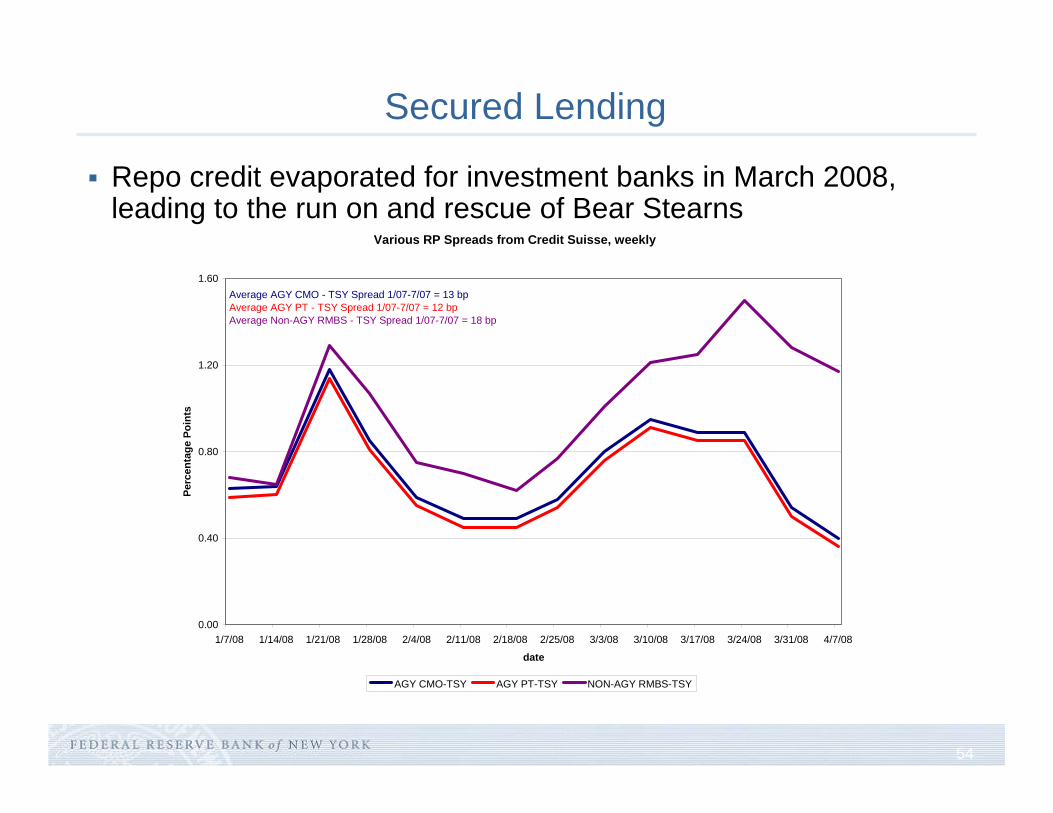
Secured Lending
Repo credit evaporated for investment banks in March 2008, leading to the run on and rescue of Bear Stearns
Various RP Spreads from Credit Suisse, weekly
0.00
0.40
0.80
1.20
1.60
1/7/08 1/14/08 1/21/08 1/28/08 2/4/08 2/11/08 2/18/08 2/25/08 3/3/08 3/10/08 3/17/08 3/24/08 3/31/08 4/7/08
date
Perc
enta
ge P
oint
s
AGY CMO-TSY AGY PT-TSY NON-AGY RMBS-TSY
Average AGY CMO - TSY Spread 1/07-7/07 = 13 bpAverage AGY PT - TSY Spread 1/07-7/07 = 12 bpAverage Non-AGY RMBS - TSY Spread 1/07-7/07 = 18 bp
55
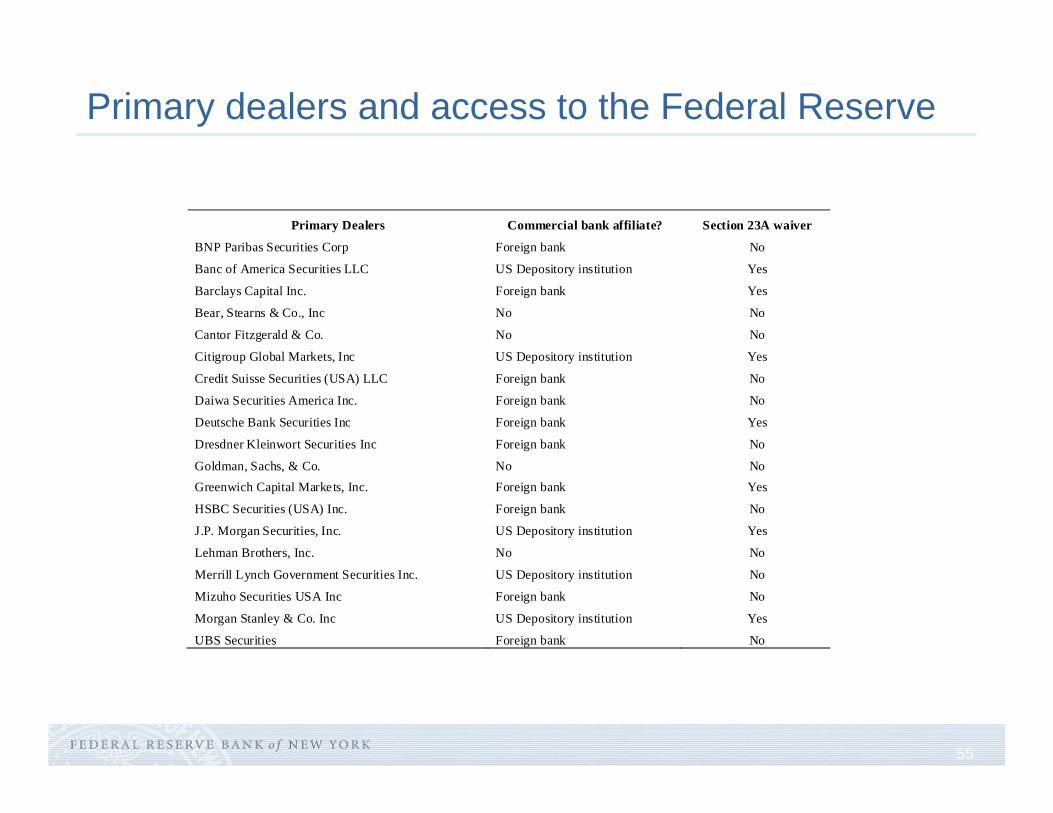
Primary dealers and access to the Federal Reserve
Primary Dealers Commercial bank affiliate? Section 23A waiver
BNP Paribas Securities Corp Foreign bank No
Banc of America Securities LLC US Depository institution Yes
Barclays Capital Inc. Foreign bank Yes
Bear, Stearns & Co., Inc No No
Cantor Fitzgerald & Co. No No
Citigroup Global Markets, Inc US Depository institution Yes
Credit Suisse Securities (USA) LLC Foreign bank No
Daiwa Securities America Inc. Foreign bank No
Deutsche Bank Securities Inc Foreign bank Yes
Dresdner Kleinwort Securities Inc Foreign bank No
Goldman, Sachs, & Co. No No Greenwich Capital Markets, Inc. Foreign bank Yes
HSBC Securities (USA) Inc. Foreign bank No
J.P. Morgan Securities, Inc. US Depository institution Yes
Lehman Brothers, Inc. No No
Merrill Lynch Government Securities Inc. US Depository institution No
Mizuho Securities USA Inc Foreign bank No
Morgan Stanley & Co. Inc US Depository institution Yes
UBS Securities Foreign bank No
56
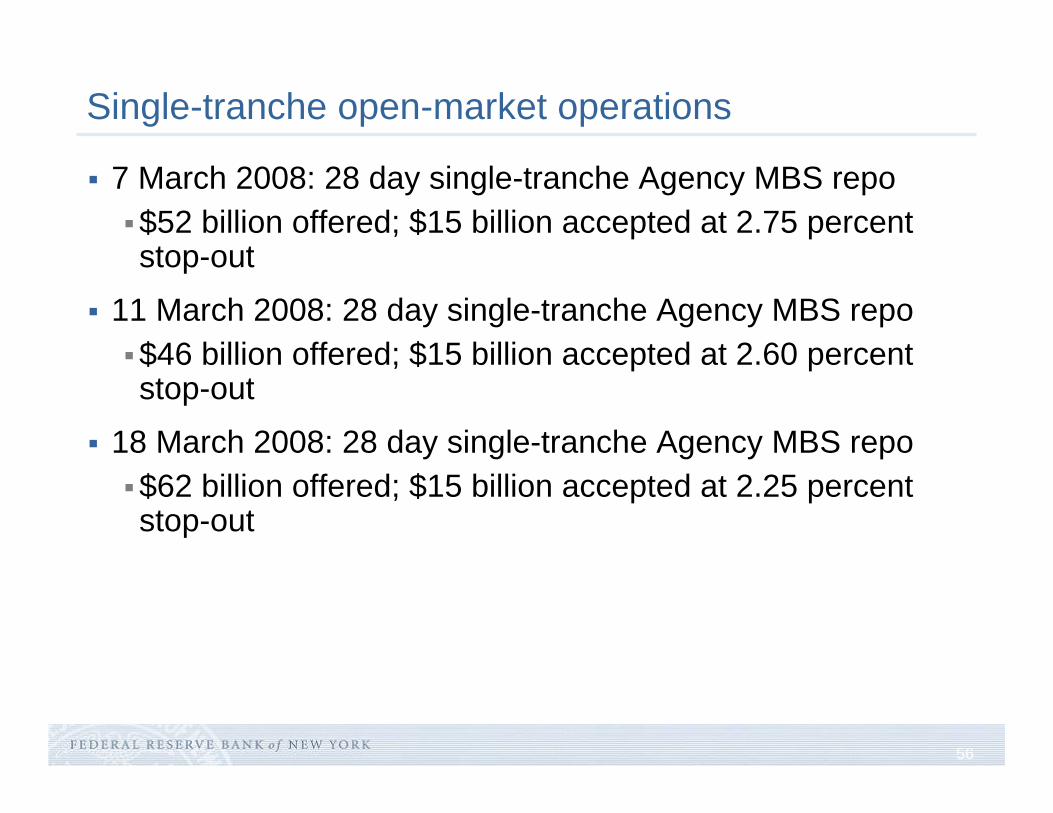
Single-tranche open-market operations
7 March 2008: 28 day single-tranche Agency MBS repo$52 billion offered; $15 billion accepted at 2.75 percent stop-out
11 March 2008: 28 day single-tranche Agency MBS repo$46 billion offered; $15 billion accepted at 2.60 percent stop-out
18 March 2008: 28 day single-tranche Agency MBS repo$62 billion offered; $15 billion accepted at 2.25 percent stop-out
57
Term Securities Lending Facility
Announced 11 March 2008, initial size of $200 billionSwap of Treasuries for non-Treasury collateral for 28 daysFixed quantity offered, fee determined by single-price auction
Two collateral schedulesSchedule I: OMO (Treasury, Agency, and Agency MBS); minimum bid fee of 10 bpsSchedule II: OMO + Investment grade Corporate, RMBS, CMBS, and ABS debt; minimum fee of 25 bps
First auction 27 March for $75 billion, Schedule II collateral$86 billion submitted, stop-out rate of 33 bps
TSLF Options program for quarter-end, September 2008right to deliver Schedule II collateral at fixed fee of 25 bps
58
Primary Dealer Credit Facility
Announced 16 March 2008
Overnight demand facility, similar to discount window
Leverage tri-party repo clearing framework
Borrower pays the primary credit rate
Eligible collateralinitially: OMO + Investment grade securitiesseptember 2008: all tri-party repo collateral
Recourse to borrower
Backend fee for persistent usagefor usage more than 30 out of last 120 days
59
4 Summer 2008 (banks and thrifts, again)
Evaporation of confidence by foreign investors in Agency Debt and MBS, driven by concerns about Fannie Mae and Freddie Mac, but contagion to the Federal Home Loan Banks
Re-intermediation of credit through from Federal Home Loan Banks to the Discount Window
60
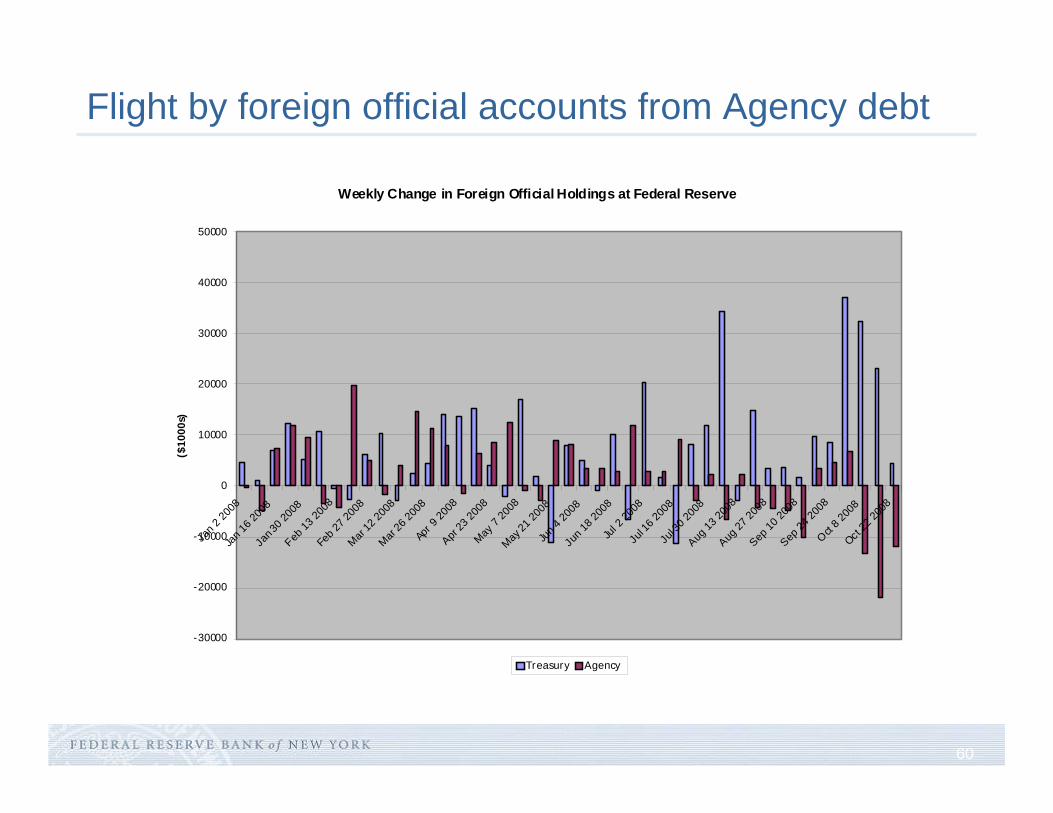
Flight by foreign official accounts from Agency debt
Weekly Change in Foreign Official Holdings at Federal Reserve
-30000
-20000
-10000
0
10000
20000
30000
40000
50000
Jan 2
2008
Jan 1
6 200
8Ja
n 30 2
008
Feb 13
2008
Feb 2
7 200
8Mar
12 20
08Mar
26 20
08Ap
r 9 20
08Apr
23 20
08May
7 20
08May
21 20
08Ju
n 4 20
08Ju
n 18 2
008
Jul 2
2008
Jul 1
6 200
8Ju
l 30 2
008
Aug 13
2008
Aug 27
2008
Sep 10
2008
Sep 24
2008
Oct 8 2
008
Oct 22
2008
($10
00s)
Treasury Agency
61
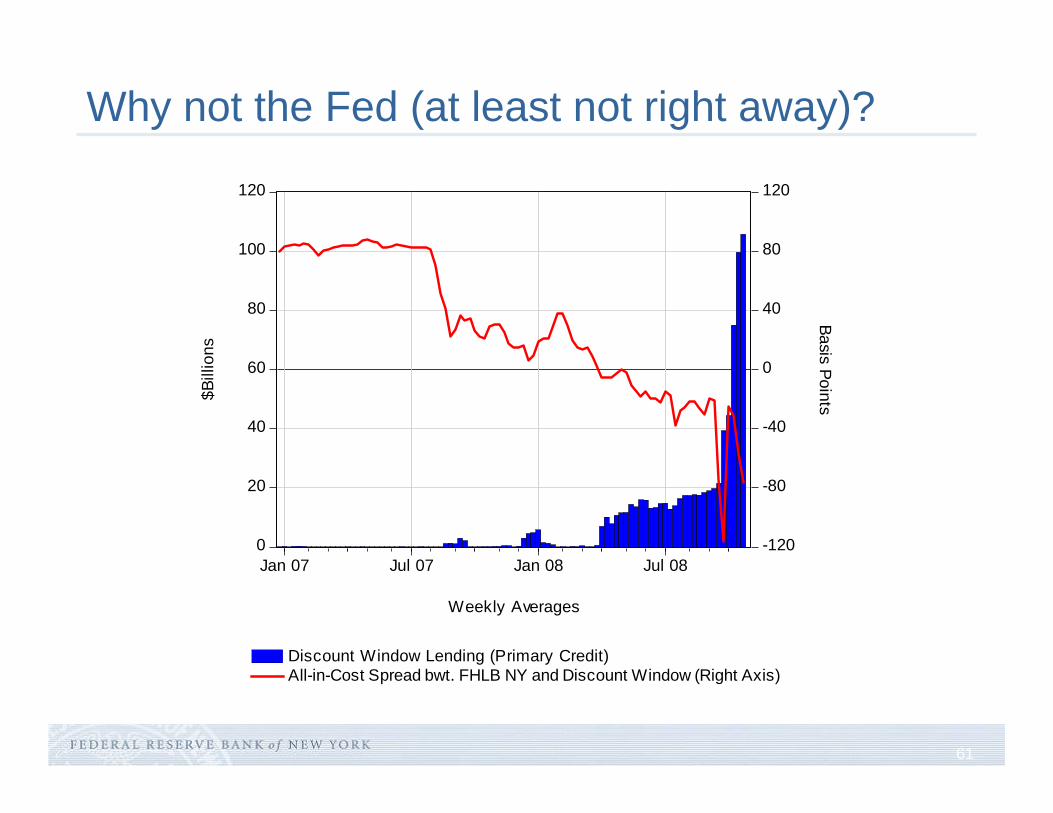
Why not the Fed (at least not right away)?
0
20
40
60
80
100
120
-120
-80
-40
0
40
80
120
Jan 07 Jul 07 Jan 08 Jul 08
Discount Window Lending (Primary Credit)All-in-Cost Spread bwt. FHLB NY and Discount Window (Right Axis)
Basis Points$Bill
ions
Weekly Averages
62
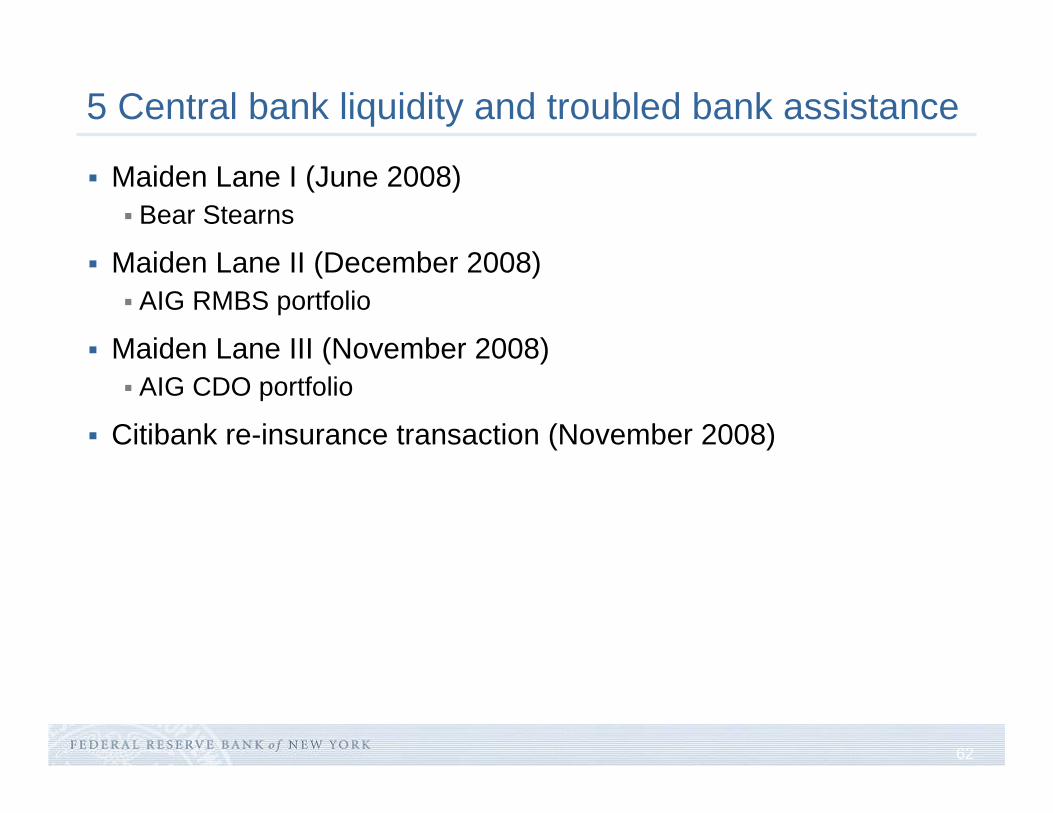
5 Central bank liquidity and troubled bank assistance
Maiden Lane I (June 2008)Bear Stearns
Maiden Lane II (December 2008)AIG RMBS portfolio
Maiden Lane III (November 2008)AIG CDO portfolio
Citibank re-insurance transaction (November 2008)
63
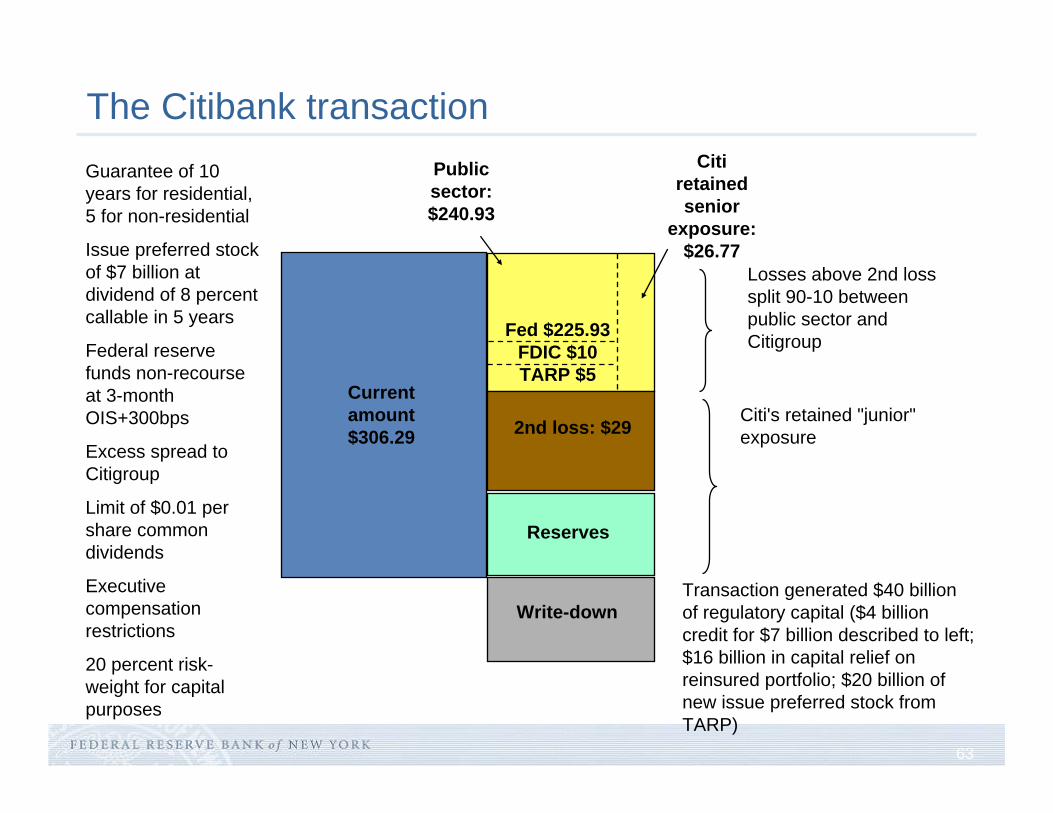
The Citibank transaction
Write-down
Current amount $306.29
Reserves
Citi's retained "junior" exposure
Public sector: $240.93
2nd loss: $29
Losses above 2nd loss split 90-10 between public sector and Citigroup
Citiretained senior
exposure: $26.77
Guarantee of 10 years for residential, 5 for non-residential
Issue preferred stock of $7 billion at dividend of 8 percent callable in 5 years
Federal reserve funds non-recourse at 3-month OIS+300bps
Excess spread to Citigroup
Limit of $0.01 per share common dividends
Executive compensation restrictions
20 percent risk-weight for capital purposes
Fed $225.93 FDIC $10 TARP $5
Transaction generated $40 billion of regulatory capital ($4 billion credit for $7 billion described to left; $16 billion in capital relief on reinsured portfolio; $20 billion of new issue preferred stock from TARP)
64
6 Fall 2008 (money market funds)
Collapse of Lehman Brothers led to Reserve Fund breaking the buck
Rescue of AIG in part due to concerns about spillovers to the retail sector
GICscommercial paper programrepo book
Subsequent run on money market fundsTreasury guarantee using the foreign exchange stabilization fundAgency debt purchase by Federal Reservenon-recourse ABCP facilityCP Funding FacilityMMIF
65
Commercial Paper Funding Facility
Structured as a credit facility to a SPV authorized under section 13(3) of the Federal Reserve Act, which will serve as a funding backstop to facilitate the issuance of term commercial paper.
The Federal Reserve Bank of New York will commit to lend to the SPV on a recourse basis. The New York Fed will be secured by all the assets of the SPV.
U.S. dollar-denominated three-month commercial paper (including ABCP) that is rated at least A-1/P-1/F1.Eligible issuers are U.S. issuers of commercial paper, including U.S. issuers with a foreign parent company.The maximum amount of a single issuer’s commercial paper the SPV may own at any time will be the greatest amount of U.S. dollar-denominated commercial paper the issuer had outstanding on any day between January 1 and August 31, 2008
66
CPFF terms
At the time of its registration to use the CPFF, each issuer must pay a facility fee equal to 10 basis points of the maximum amount of its commercial paper the SPV may own.
Pricing will be based on the then-current 3-month overnight index swap (OIS) rate plus fixed spreads: +100 bps for unsecured CP (with potential 100 bps unsecured credit surcharge), +300 basis points for ABCP.
67
Money Market Investor Funding Facility
The MMIFF will be a credit facility provided by the Federal Reserve to a series of special purpose vehicles established by the private sector (PSPVs) in accordance with the terms described below. Each PSPV will purchase eligible money market instruments from eligible investors using financing from the MMIFF and from the issuance of asset-backed commercial paper (ABCP). The MMIFF is authorized under section 13(3) of the Federal Reserve Act.
A PSPV will purchase from eligible investors at amortized cost U.S. dollar-denominated certificates of deposit, bank notes and commercial paper with a remaining maturity of 90 days or less. Each PSPV will only purchase debt instruments issued by ten financial institutions designated in its operational documents. Each of these financial institutions will have a short-term debt rating of at least A-1/P-1/F1 from two or more major nationally recognized statistical rating organizations (NRSROs).
68
Concentration limits, eligible investor
At the time of a PSPV’s purchase of a debt instrument issued by a financial institution, the debt instruments of that financial institution may not constitute more than 15 percent of the assets of the PSPV, except during an initial ramp-up period when the concentration limit will be 20 percent.
Eligible investors will include U.S. 2a-7 money market mutual funds and over time may include other money market investors.
69
Downgrade and/or default
If the debt instruments of a financial institution held by a PSPV are no longer eligible assets due to a short-term debt rating downgrade, the PSPV must cease all asset purchases until all of the PSPV’s assets issued by that financial institution have matured.
Upon a default of any asset held by a PSPV, the PSPV must cease all asset purchases and repayments on outstanding ABCP. Proceeds from maturation of the PSPV’s assets will be used to repay the New York Fed and, upon maturation of all assets in thePSPV, any remaining available cash will then be used to repay principal and interest on the ABCP. Any excess spread will be allocated as described below.
70
Liabilities of PSPVs
Each PSPV will finance its purchase of an eligible asset by selling ABCP and by borrowing under the MMIFF.
The PSPV will issue to the seller of the eligible asset ABCP equal to 10 percent of the asset’s purchase price.
The ABCP will have a maturity equal to the maturity of the assetand will be rated at least A-1/P-1/F1 by two or more major NRSROs.
The Federal Reserve Bank of New York will commit to lend to each PSPV 90 percent of the purchase price of each eligible asset until the maturity of the asset.
The New York Fed loans will be on an overnight basis and at the primary credit rate.
The loans will be senior to the ABCP, with recourse to the PSPV,and secured by all the assets of the PSPV.
71
Termination and wind-down options
A PSPV will cease purchasing assets and will enter the wind-down process described below on April 30, 2009, unless the Board extends the MMIFF.
During the wind-down process, proceeds from the maturation of the assets of a PSPV on a given day will be used first to repay principal and interest on the New York Fed loans and then to repay principal and interest on the ABCP that matures on that day.
A small fixed amount of any excess spread remaining in the PSPV after completion of the wind-down process will be allocated proportionally among investors that sold assets to the PSPVs; the New York Fed will receive any remaining excess spread.
72
6 November 2008 (GSEs; US investors)
Failure of Agency debt and MBS spreads to respond to US Treasury's Agency MBS purchase program
Federal Reserve Announces $500 billion purchase program, spreadsfall by 50 bps immediately on announcement
Breakdown of consumer credit securitization markets: auto loan ABS, credit card ABS, student loans prompted creation of the Term Asset-backed Securities Liquidity Facility (TALF)
$20 billion TARP capital into Federal Reserve controlled SPVMonthly auctions for term non-recourse credit with no re-margining (like funding for cash flow CDO tranche); borrowers bid spread over OIS and post haircut, but have explicit put optionFederal Reserve using its balance sheet to overcome reluctance of primary dealers to fund repo lending