Stability-Liquidity Tradeoffs in Post-Crisis Bond Markets · Stability-Liquidity Tradeoffs in...
26
Stability-Liquidity Tradeoffs in Post-Crisis Bond Markets Darrell Duffie Graduate School of Business, Stanford University Brookings, November 17, 2015 PRE - SET TEMPLATES & USAGE TIPS
Transcript of Stability-Liquidity Tradeoffs in Post-Crisis Bond Markets · Stability-Liquidity Tradeoffs in...

Stability-Liquidity Tradeoffs in Post-Crisis Bond Markets
Darrell Duffie
Graduate School of Business, Stanford University
Brookings, November 17, 2015
P R E - S E T T E M P L AT E S & U S A G E T I P S

A stability-‐liquidity tradeoff
• Capital and ac6vity rules have improved bank stability and reduced commitments of bank-‐affiliated balance sheets to financial market intermedia6on.
• This raises incen6ves for agency intermedia6on, CCPs, all-‐to-‐all trade, shadow-‐bank intermedia6on, and a shiD by banks away from low-‐risk standardized (low-‐margin) products.
• The net impacts on market efficiency are s6ll playing out, and depend on other factors, including monetary policy.

Treasuries bid-‐ask spreads are stable
0
1
2
3
4
5
6
7
8
9
1/1/2005 1/1/2007 1/1/2009 1/1/2011 1/1/2013 1/1/2015
256ths
2-‐year 5-‐year 10-‐year
Source: Adrian, Fleming, Stackman, and Vogt (2015) (BrokerTec data)

Treasury note trade price impacts
Source: Adrian, Fleming, Stackman, and Vogt (2015) (from BrokerTec data)
0
3
6
9
12
15
18
1/1/2005 1/1/2007 1/1/2009 1/1/2011 1/1/2013 1/1/2015
256ths per $100 million
2-‐year 5-‐year 10-‐year

Symptoms of changing liquidity • Tradi6onal liquidity measures such as price impact and bid-‐
ask spread look fine.
• Turnover and trade sizes are generally down.
• Single-‐name CDS and matched-‐book repo markets are withering.
• The 10-‐year Treasury note “yield crash” of October 15, 2014 is a symptom of changes in the mix of intermediaries, including HFT.

Trade size has declined
Source: Adrian, Fleming, Stackman, and Vogt (2015) (BrokerTec data)
0
5
10
15
20
25
1/1/2005 1/1/2007 1/1/2009 1/1/2011 1/1/2013 1/1/2015
Millions of D
ollars
2-‐year 5-‐year 10-‐year

Treasury market turnover
0
0.02
0.04
0.06
0.08
0.1
0.12
0.14
Data source: SIFMA
Daily volum
e/ou
tstand
ing

Figure 4.13: Benchmark Price Impact (Cash) Figure 4.14: Benchmark Trade Size (Cash)
Figure 4.15: Treasury Active Contract Trade Size
(Futures)
0.0
0.5
1.0
1.5
2.0
2.5
3.0
2004 2006 2008 2010 2012 2014
32nds per $100
million
2 Year 5 Year 10 Year
Note: Slope coefficients from weekly regressions of 5” price changes on 5” net order flow for the on-the-run notesSource: Staff calculations, based on data from BrokerTec.
0
5
10
15
20
25
30
2004 2006 2008 2010 2012 2014
$ millions 2 Year 5 Year 10 Year
Note: 21-day moving average; Average trade size; On-the-run notesSource: Staff calculations, based on data from BrokerTec.
0
1
2
3
4
5
6
7
8
9
2004 2006 2008 2010 2012 2014
$ millions 2 Year 5 Year 10 Year
Note: 21-day moving average; 8:20 - 15:00 ETSource: Staff calculations, based on data from CME Group.
69
duffie
Typewritten Text
Treasury futures average trade size
duffie
Typewritten Text
Source: Joint Staff Report, The U.S. Treasury Market (2015)

21
Decline in GCF net lending volume
-100
-80
-60
-40
-20
0
20
40
60
80
100
$ bi
llion
s
Mar 11 Sep 11 Mar 12 Sep 12 Mar 13 Sep 13 Mar 14 Sep 14 Mar 15 Sep 15month
Non-BHC Dealers Small BHC dealers Large BHC Dealers
Monthly AverageDaily Net Cash Positions by Dealer Group
duffie
Typewritten Text
Source: Martin (2015), FRBNY.

Copyright 2014 FINRA
Corporate bond – average bid-ask spreads
$0.00
$0.20
$0.40
$0.60
$0.80
$1.00
$1.20
$1.40
2002 2004 2006 2008 2010 2012 2014 2016
$ pe
r uni
t par
Investment Grade
High Yield

Copyright 2014 FINRA
Corporate bond – average trade size
0.00
0.20
0.40
0.60
0.80
1.00
1.20
1.40
1.60
1.80
2.00
2002 2004 2006 2008 2010 2012 2014 2016
$ mill
ion
1,000 Most Active BondsLess Active Bonds

Turnover of corporate and municipal bonds
0
0.001
0.002
0.003
0.004
0.005
0.006
0.007
0.008
Municipal bonds Corporate bonds
Daily volum
e/ou
tstand
ing
Data source: SIFMA

When more dealers compete, corporate bond trade costs go down
-‐10
0
10
20
30
40
50
60
1 2 3 4 5 6 7 8 9 10 11 12 13 14 15 16 17 18 19 20
Cost in Basis Points
Number of dealers responding
Investment Grade
High Yield
Source: Hendersho` and Madhavan (2014)

Number of CDS trades per quarter
0
50,000
100,000
150,000
200,000
250,000
300,000
350,000
400,000 Single-‐Name Index
Data source: DTCC

Who handles U.S. bonds?
0
500
1000
1500
2000
2500
3000
3500
4000
2001 2002 2003 2004 2005 2006 2007 2008 2009 2010 2011 2012 2013 2014
Bond Fund+ETF Dealer Bonds Financed
Data sources. ICI: AUM, bond mutual funds + ETFs. FRBNY: primary dealer daily financing (securi6es out) of UST + agencies + MBS + corporate bonds.
Assets (b
illion USD
)

Net monthly cash inflows to bond funds
-‐80
-‐60
-‐40
-‐20
0
20
40 1/1/13
3/1/13
5/1/13
7/1/13
9/1/13
11/1/13
1/1/14
3/1/14
5/1/14
7/1/14
9/1/14
11/1/14
1/1/15
3/1/15
5/1/15
7/1/15
9/1/15
Billion
s of d
ollars
Data source: Investment Company Ins6tute

Section 4 Figures
Figure 4.1: Financial Assets of Security Brokers and Dealers
Figure 4.2: Net Treasury Positions of Primary Dealers
Figure 4.3: Gross Treasury Positions of Primary
Dealers Figure 4.4: Estimated Treasury Market-Making
Positions of Primary Dealers
Figure 4.5: Ownership of Treasury Debt by Investor
Group
Figure 4.6: Government Bond Fund Flows
0
1
2
3
4
5
6
1990 1994 1998 2002 2006 2010 2014
$ trillions
Note: Quarterly observations; Total financial assets of security brokers and dealers as reported in the financial accounts of the United StatesSource: Staff calculations, based on data from Federal Reserve Board.
-200
-150
-100
-50
0
50
100
150
2002 2004 2006 2008 2010 2012 2014
$ billions
Note: 4-week moving averageSource: Staff calculations, based on data from FRBNY.
0
1
2
3
4
5
6
7
8
9
0
100
200
300
400
500
600
2002 2004 2006 2008 2010 2012 2014
%$ billions
Position
Position as % of Debt Outstanding,ex-Fed (RHS)
Note: 4-week moving average; Sum of dealers’ short and long positions Source: Staff calculations, based on data from FRBNY.
0.0
0.5
1.0
1.5
2.0
2.5
3.0
0
50
100
150
200
250
2002 2004 2006 2008 2010 2012 2014
%$ billions
Position
Position as % of Debt Outstanding, ex-Fed (RHS)
Note: 4-week moving average; Smaller of each dealer’s short and long position in each reporting bucket, aggregated across dealers and buckets Source: Staff calculations, based on data from FRBNY.
0
10
20
30
40
50
60
2004 2006 2008 2010 2012 2014
%
Mutual funds Pension fundsHouseholds State and local governmentsDepository institutions Money market fundsInsurance companies Other financial institutionsNonfinancial businesses Federal Reserve
Note: Mutual funds includes closed-end funds and exchange-traded funds; Pension funds includes government retirement fundsSource: Staff calculations, based on data from Federal Reserve Board.
-10-8-6-4-202468
10
2004 2006 2008 2010 2012 2014
$ billions
Note: Total net monthly flows; Some funds own agency debt securities and MBS in addition to Treasury securitiesSource: Staff calculations, based on data from Morningstar.
67
duffie
Typewritten Text
Government bond fund flows
duffie
Typewritten Text
Source: Joint Staff Report: The U.S. Treasury Market

Asset management stability issues • Comments on the risk of a crisis arising from sudden bond
fund redemp6ons seem exaggerated. • A rush for the exits would impact prices, but bids will likely
arrive before a crisis is triggered. Who exactly would “fail”? • Large hedge funds present a poten6al for unwind risk, given
their reliance on leverage and expert porkolio managers. • Large agency-‐based managers seem more benign, and have
not been designated as SIFIs. • Regulators also focus on insurance firms that are ac6ve in
financial markets. Some have been designated. • Money-‐market funds are migra6ng to government securi6es

Supplementary content

Depth has declined from recent highs
Source: Adrian, Fleming, Stackman, and Vogt (2015) (from BrokerTec data)
0
500
1000
1500
2000
2500
1/1/2005 1/1/2007 1/1/2009 1/1/2011 1/1/2013 1/1/2015
Millions of D
ollars
2-‐year 5-‐year 10-‐year

T-‐note mul6lateral plakorm volumes
0
10
20
30
40
50
60
2001 2002 2003 2004 2005 2006 2007 2008 2009 2010 2011
10-‐year 5-‐year 2-‐year
Source: Fleming (2014) (BrokerTec data)
Daily volum
e (billions of d
ollars)

FX dealer versus non-‐dealer volumes
0
500
1000
1500
2000
2500
3000
3500
1995 1998 2001 2004 2007 2010 2013
Dealers Non-‐dealers
Source: Rime and Schrimpf (2014) (BIS data)
Daily trade volume (billions of U
SD)

Some remaining system vulnerabili6es
• Improving but s6ll fragile design of tri-‐party repo leaves the poten6al for repo fire sales.
• Lending of last resort is overly limited by Dodd-‐Frank.
• Poten6al for pro-‐cyclical margins, pending new FSB standards (more research needed).
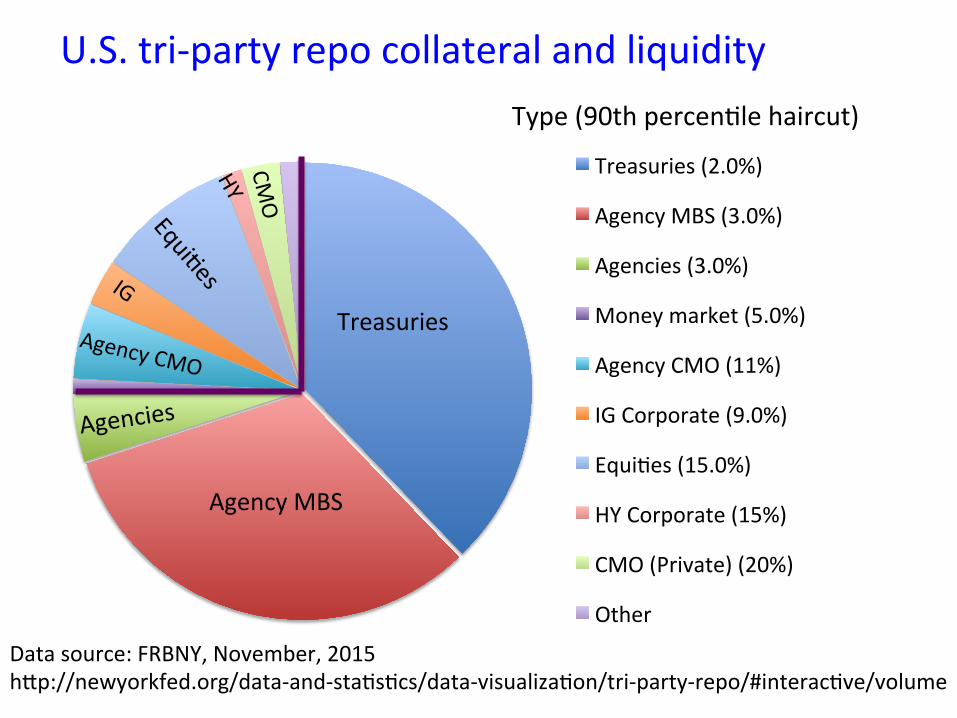
Type (90th percen6le haircut)
Treasuries (2.0%)
Agency MBS (3.0%)
Agencies (3.0%)
Money market (5.0%)
Agency CMO (11%)
IG Corporate (9.0%)
Equi6es (15.0%)
HY Corporate (15%)
CMO (Private) (20%)
Other
Treasuries
Agency MBS
Agencies
Agency CMO
CMO
U.S. tri-‐party repo collateral and liquidity
Data source: FRBNY, November, 2015 h`p://newyorkfed.org/data-‐and-‐sta6s6cs/data-‐visualiza6on/tri-‐party-‐repo/#interac6ve/volume

US GSIFI FHC
U.S. Bank U.S. Broker Dealer
Counterparty
U.K. Broker Dealer
Zone of stays on failure terminaNon of swaps, repos, sec-‐lending

Daily average volume of interest rate deriva6ves
0
200
400
600
800
1000
1200
1400
1600
1995 1998 2001 2004 2007 2010 2013
US-‐OTC US-‐EXCH UK-‐OTC
Daily average volum
e ( $
billions)
Data sources. BIS: OTC Triennial (April), U.S. exchanges Table 23A (March).