
Capacity Headroom Positioning Paper - SP Energy … procedures and documentation. ... There are two...
25
f o r a L o w C ar b o n F u t u r e F l e x i b l e N e t w o r k s Network Capacity Headroom Positioning Paper Report No: 7640–01–R0 September 2015
-
Upload
nguyenquynh -
Category
Documents
-
view
214 -
download
1
Transcript of Capacity Headroom Positioning Paper - SP Energy … procedures and documentation. ... There are two...

for a Low Carbon Future
Flexible Networks
NetworkCapacityHeadroomPositioning PaperReport No: 7640–01–R0
September 2015

Network Capacity Headroom 5 June 2014
Report No 7640–01–R0 Page 2 of 25
DOCUMENT HISTORY AND STATUS
CONFIDENTIALITY (Confidential or not confidential): Confidential
Project No.: 7640
Project Name: Flexible Networks – Network Capacity Headroom
Author: Luke Taylor and Charlotte Higgins
Issued by: TNEI Services Ltd
Revision Date issued Reviewed by
Approved by
Date Approved Revision Type
R0 5/6/2014 C Higgins A Collinson 5/6/2014 First issue
Quality Assurance TNEI is registered with BS Quality Assurance Limited (Registration Number FS 27760) as compliant with BS EN ISO 9001. All work conducted by TNEI, its subsidiary companies and its subcontractors is carried out in accordance with in-house procedures and documentation. Disclaimer THE CONTENTS OF THIS DOCUMENT ARE FOR THE CONFIDENTIAL USE OF ONLY THOSE PERSONS TO WHOM IT IS INTENDED, AND MAY NOT BE REPRODUCED OR CIRCULATED IN WHOLE OR IN PART.
TNEI Services Ltd
Bainbridge House
86 – 90 London Road
Manchester
M1 2PW
Tel: +44 (0) 161 233 4800
Fax: +44 (0) 161 233 4801
Milburn House
Dean Street
Newcastle Upon Tyne
NE1 1LE
Tel: +44 (0) 191 211 1400
Fax: +44 (0) 191 211 1432
Duart House Finch Way Strathclyde Business Park, Bellshill Glasgow ML4 3PR
Tel : 0141 228 4755
Chester House
76-86 Chertsey Road
Woking Surrey
GU21 5BJ
United Kingdom
Network Capacity Headroom 5 June 2014
Report No 7640–01–R0 Page 3 of 25
CONTENTS 1 INTRODUCTION ....................................................................................... 4
1.1 FLEXIBLE NETWORKS FOR A LOW CARBON FUTURE .................................................. 4 1.2 EXISTING CAPACITY HEADROOM BENCHMARKING ..................................................... 6
1.2.1 Available Capacity ......................................................................... 6 1.2.2 Existing Demand ........................................................................... 7 1.2.3 Capacity Headroom ....................................................................... 7
2 WHITCHURCH ......................................................................................... 8
2.1 AVAILABLE CAPACITY ................................................................................ 9 2.1.1 Thermal Capacity .......................................................................... 9 2.1.2 Voltage Capacity .......................................................................... 10 2.1.3 Fault Level Capacity ..................................................................... 10
2.2 EXISTING DEMAND .................................................................................. 10 2.3 EXISTING CAPACITY HEADROOM .................................................................... 11
3 ST ANDREWS .........................................................................................13
3.1 AVAILABLE CAPACITY ............................................................................... 14 3.1.1 Thermal Capacity ......................................................................... 14 3.1.2 Voltage Capacity .......................................................................... 14 3.1.3 Fault Level Capacity ..................................................................... 14
3.2 EXISTING DEMAND .................................................................................. 15 3.3 CAPACITY HEADROOM .............................................................................. 16
4 WREXHAM, RUABON ................................................................................17
4.1 AVAILABLE CAPACITY ............................................................................... 17 4.1.1 Thermal Capacity ......................................................................... 18 4.1.2 Voltage Capacity .......................................................................... 18 4.1.3 Fault Level Capacity ..................................................................... 18
4.2 EXISTING DEMAND .................................................................................. 18 4.3 CAPACITY HEADROOM .............................................................................. 19
5 CONCLUSIONS ........................................................................................21
5.1 WHITCHURCH ...................................................................................... 21 5.2 ST ANDREWS ....................................................................................... 21 5.3 RUABON ............................................................................................ 21
APPENDIX A – NETWORK REINFORCEMENT OPTIONS AND COSTS ...............................23
A.1 WHITCHURCH .......................................................................................... 23 A.2 ST ANDREWS ........................................................................................... 25 A.3 RUABON ............................................................................................... 25

Network Capacity Headroom 5 June 2014
Report No 7640–01–R0 Page 4 of 25
1 Introduction
1.1 Flexible Networks for a Low Carbon Future
‘Flexible Networks for a Low Carbon Future’ is a Scottish Power Energy Networks (SPEN) Tier 2 Low Carbon Network Fund (LCNF) trial project. LCNF Tier 2 projects are awarded annually on a competitive basis to UK Distribution Network Operators (DNO) and are administered through Ofgem.
Flexible Networks will provide the DNOs with economic, DNO-led solutions to enhance the capability of the networks as heat and transport are increasingly de-carbonised resulting in an increase in electricity use. Crucially, these solutions will be capable of being quickly implemented and will help to ensure that the networks do not impede the transition to a low carbon future.
Solutions are needed that can:
• Determine more accurately the capacity headroom while maintaining licence obligations,
• Allow that headroom to be exploited in a safe, reliable and cost-effective manner, and,
• Provide incremental increases in headroom in a timely and cost-effective manner.
Flexible Networks will aim to provide a 20% increase in network capacity through a number of innovative measures. This will enable more customers to make the transition to new low carbon generation and demand technologies. The project involves enhanced monitoring and analysis to better understand and improve existing performance, and the deployment of novel technology for improved network operation and capacity - including dynamic asset rating, network automation, voltage regulation and energy efficiency measures.
To ensure representative and replicable outputs, the project involves three carefully selected trial areas across SP Distribution and SP Manweb licence areas, covering various network topology and customer demographics: St Andrews in Scotland, Wrexham in Wales and Whitchurch in England, see Figure 1-1.
The three trial areas have known capacity issues and consequently offer a real opportunity to analyse and implement alternative flexible solutions to network reinforcement. All three sites have different but representative characteristics and customer demographics, and are similar in that they have near-term constraints due to increasing demand and an uptake of low carbon technology. The rapid nature of these changes both imposes a requirement, but also provides the opportunity to trial solutions that are faster and more cost-effective to implement than traditional reinforcement.

Network Capacity Headroom 5 June 2014
Report No 7640–01–R0 Page 5 of 25
Figure 1-1: Trial Area Location Map
The specific issues facing these three locations are mirrored across the UK electricity distribution network, and this project will be able to provide generic solutions and recommendations to address these.

Network Capacity Headroom 5 June 2014
Report No 7640–01–R0 Page 6 of 25
1.2 Existing Capacity Headroom Benchmarking
This paper benchmarks the existing capacity headroom for each of the three network trial areas using a business as usual approach. This will enable the performance of the Flexible Networks solutions being deployed to be characterised in terms of improvement to capacity headroom.
Network capacity headroom is benchmarked for the following three network areas:
• Whitchurch
• St Andrews
• Wrexham (Ruabon)
The network capacity headroom available at these three sites is determined from:
• Available Capacity
• Existing demand and generation
This study determines the available capacity and existing demand/generation using existing documentation, such as the Long Term Development Statement (LTDS), load and generation connection applications, and any measurement data currently available.
1.2.1 Available Capacity
Available network capacity is limited by the following networks parameters:
• Thermal Capacity
• Voltage Capacity
• Fault Level Capacity
Thermal capacity is determined by the continuous and short-term rating of transformers, circuit conductors and switchgear
Voltage capacity is limited by statutory voltage limits which are imposed on distribution networks at all voltage levels.
Fault level capacity is primarily determined by the breaking and making capacity of switchgear connected within the distribution network; however the fault level capacity of any single item of equipment in the distribution network should not be exceeded.
Engineering Recommendation P2/6 “Security of Supply” provides guidance on classifying network supplies and specifies the minimum magnitude of demand that must be supplied during an outage. The available capacity of a network is reduced during an outage for example during maintenance or following fault conditions. Consideration of the reduced capacity is required in the majority of network areas to ensure that the network is capable of maintaining safe operation whilst supplying the minimum magnitude of demand in the areas affected by the outage.

Network Capacity Headroom 5 June 2014
Report No 7640–01–R0 Page 7 of 25
1.2.2 Existing Demand
Network demand varies daily, weekly, monthly and yearly. Existing demand can be accurately ascertained through measurement. The ability to quantify existing demand is dependent on the specifications of the measurement instrumentation and the frequency of data capture and storage. Network demand is typically quantified in the following ways:
• Annual Maximum Demand
• Annual Minimum Demand
• Annual Statistical Information (load duration curves, probability analysis)
Currently SPEN have 30 min MW and MVAr measurements at their primary 33/11kV substations and Maximum Demand Indicators (MDI’s) installed at secondary ground-mounted substations (11kV/LV).
The network capacity and any transfer capability must be greater than the maximum network demand.
1.2.3 Capacity Headroom
Available capacity headroom can be considered for two types of connection:
• Load Connections
• Generation Connections
The typical impact of the two types of connection on available capacity differs; an example is shown below in Table 1-1 for a circuit which primarily supplies power to consumers. It should be noted that the thermal impact may vary depending on connection location and existing circuit load/generation mix.
Table 1-1: Impact of Connection on Available Capacity
The available capacity headroom is dependent on the capacity parameter, for example:
Thermal capacity headroom = (Thermal Capacity – Thermal Loading)
Thermal Capacity
Each capacity parameter may vary at a different rate which is dependent on the characteristics of the network and the load/generation to be connected.
The MVA capacity headroom available for new load is usually different to the capacity headroom available for new generation.
Thermal Loading Voltage Fault Level
Load
Generation

Network Capacity Headroom 5 June 2014
Report No 7640–01–R0 Page 8 of 25
2 Whitchurch
Whitchurch is a market town in Shropshire with a population of approximately 9000. There are two 132/33kV grid transformers located at Whitchurch. These two grid transformers are supplied by different 132kV network zones, designated as Cheshire and Wales. A large voltage phase angle difference between these two 132kV supplies exists and therefore the two Whitchurch 132/33kV grid transformers cannot be operated in parallel. The 132/33kV grid transformer supplied from Wales operates in parallel with Oswestry and Marchwiel grid transformers and connects to the 33kV network that supplies Whitchurch, see Figure 2.1 (note – not all circuits shown for clarity).
Figure 2-1: Whitchurch 132/33kV Network
The 33/11kV system, in Whitchurch, consists of three 33/11kV primary transformers that supply the 11kV distribution network. The three primary transformers and 11kV distribution network will be referred to as the Whitchurch network group. The transformers are located at Whitchurch Primary Substation, Liverpool Road Primary Substation and Yockings Gate Primary Substation. The 11kV circuits from these primary transformers are operated radially but with the facility to be interconnected following a system outage. Interconnection is achieved by closing an 11kV switch or circuit breaker that is normally operated open and is referred to as the normally open point (NOP), see Figure 2.2. Existing automation within the 11kV network enables control of the NOPs.
132kV33kV11kV

Network Capacity Headroom 5 June 2014
Report No 7640–01–R0 Page 9 of 25
Figure 2-2: Whitchurch 33/11kV Network
2.1 Available Capacity
The existing network must be capable of supplying the Whitchurch network group during an outage of any one of the three primary transformers. This requirement also applies to the four grid transformers which must be capable of supplying the 33kV network during an outage of any one of the grid transformers. The main points with regard to available capacity of the Whitchurch network group are:
2.1.1 Thermal Capacity
33kV
• Recent network studies show that during the loss of any of the grid transformers, the 33kV circuit supplying the Whitchurch network group, which would operate at 99% of its thermal rating.
11kV
• Whitchurch and Liverpool Road 33/11kV primary transformers have a continuous rating of 7.5MVA and a short term rating of 10MVA. Yockings Gate 33/11kV primary transformer has a continuous rating of 7.5MVA.
• The theoretical group capacity of the Whitchurch network group is 20MVA and is based on a single transformer outage.
• Existing 11kV cable circuits in the Whitchurch network group generally have a continuous rating of 3.6MVA and overhead line circuits have a rating of 3.33MVA.
• The Whitchurch Business Park is the main load centre for the Whitchurch network group. It is fed from Yockings Gate primary substation and can be back-fed from Liverpool Road primary substation during fault
Network Capacity Headroom 5 June 2014
Report No 7640–01–R0 Page 10 of 25
conditions. These two feeder circuits have an aggregate maximum demand of 3.5MVA and a capacity of 3.6MVA.
• The Whitchurch network group capacity is limited to less than the theoretical capacity due to the existing 11kV circuit ratings, the location of load centres within the 11kV network group and the resulting distribution of electrical load. The actual group capacity is equivalent to the current maximum demand plus an additional 0.1MVA of load if this is connected at the Whitchurch Business Park. It may be possible to connect loads greater than 0.1MVA in other areas of the Whitchurch network group.
2.1.2 Voltage Capacity
33kV
• Network studies show that the 33kV circuits supplying Whitchurch network group operate near lower voltage limits during loss of the Whitchurch grid transformer. There is currently 1MW of spare load capacity available in the Whitchurch network group before 33kV reinforcement is required.
11kV
• Whitchurch, Liverpool Road and Yockings Gate 33/11kV transformers have a -15% primary winding tap option, this is sufficient to compensate the predicted voltage drop within the 33kV system during loss of the Whitchurch Grid transformer.
2.1.3 Fault Level Capacity
33kV
• The maximum design fault level capacity within the 33kV network is 750MVA.
• No fault level issues have been identified.
11kV
• The available fault level capacity within the 11kV Whitchurch network group is 250MVA.
• No fault level issues have been identified.
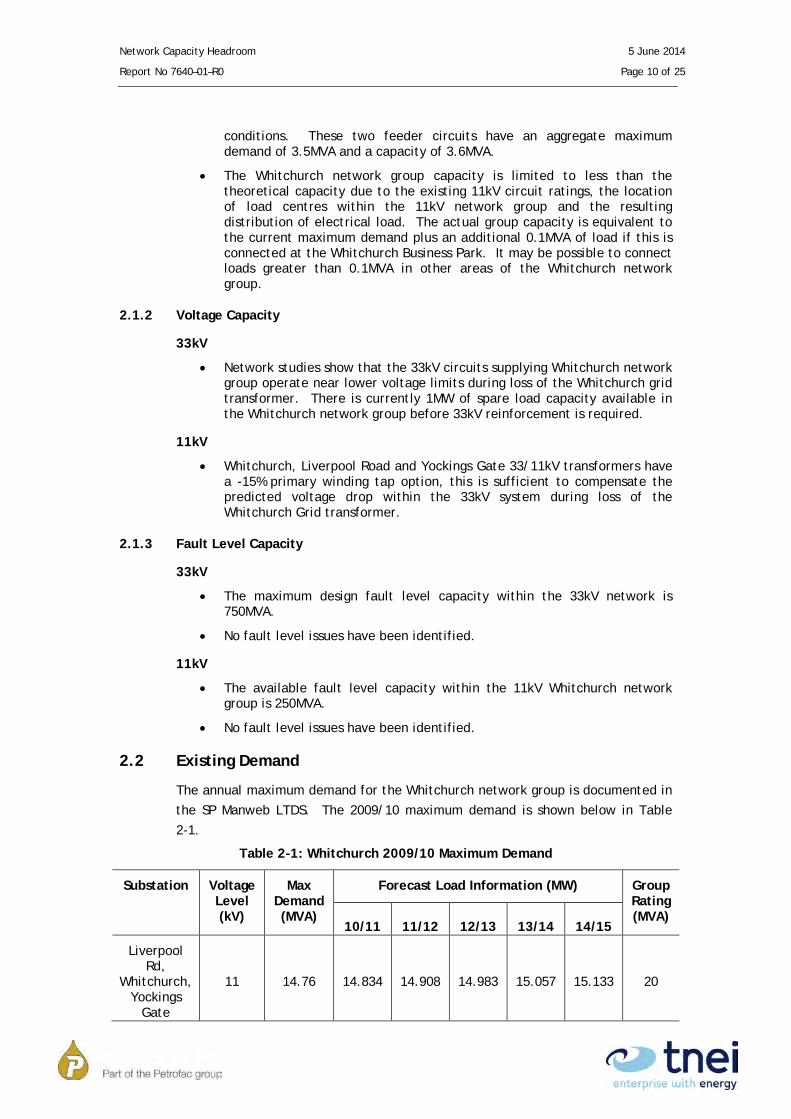
2.2 Existing Demand
The annual maximum demand for the Whitchurch network group is documented in the SP Manweb LTDS. The 2009/10 maximum demand is shown below in Table 2-1.
Table 2-1: Whitchurch 2009/10 Maximum Demand
Substation Voltage Level (kV)
Max Demand (MVA)
Forecast Load Information (MW) Group Rating (MVA)
10/11 11/12 12/13 13/14 14/15
Liverpool Rd,
Whitchurch, Yockings
Gate
11 14.76 14.834 14.908 14.983 15.057 15.133 20

Network Capacity Headroom 5 June 2014
Report No 7640–01–R0 Page 11 of 25
Consecutive half hourly average power data is available for the three primary substation transformers that supply the Whitchurch 11kV network group. From this data, annual aggregate load profiles have been calculated.
Figure 2-3: Whitchurch Network Group Load Duration Curve
2.3 Existing Capacity Headroom
The 2009/10 maximum demand of 14.76MVA was used to benchmark the existing capacity headroom.
There is less than 1% existing load capacity headroom for new load connections at Whitchurch Business Park, the main load centre of the Whitchurch network group. The primary limiting network capacity parameter is the 3.6MVA thermal rating of the 11kV circuit connected between Yockings Gate primary and Liverpool Road primary, via Whitchurch Business Park. There may be increased load capacity headroom for load connections in other areas of the Whitchurch network group.
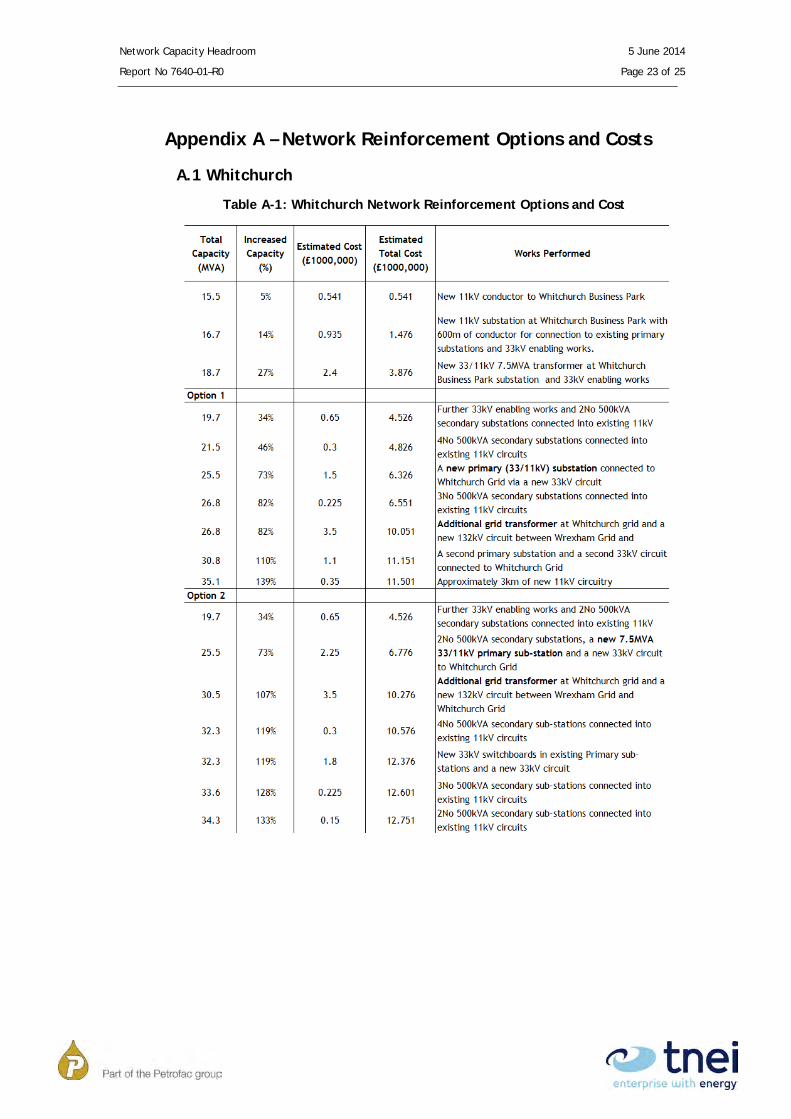
Estimated costs, based on traditional network reinforcements, for increasing load capacity at Whitchurch Business Park by up to 27% are shown below in Figure 2.4.
Any 11kV network group capacity increase in excess of 1MW requires enabling work at 33kV to prevent 33kV thermal and voltage limits from becoming exceeded. Details of these traditional reinforcements are provided in Appendix A with two further options for increasing network group capacity by up to 139%.

Network Capacity Headroom 5 June 2014
Report No 7640–01–R0 Page 12 of 25
Figure 2-4: Whitchurch Traditional Reinforcement Costs (33kV enabling works
are indicated by blue star)
Network Capacity Headroom 5 June 2014
Report No 7640–01–R0 Page 13 of 25
3 St Andrews
St Andrews is a large town in the rural location of Fife, Scotland, with a population of approximately 17,000. St Andrews is a tourist area and is also home to the well-known St Andrews University. Increasing numbers of new connection requests in St Andrews is a significant area of concern.
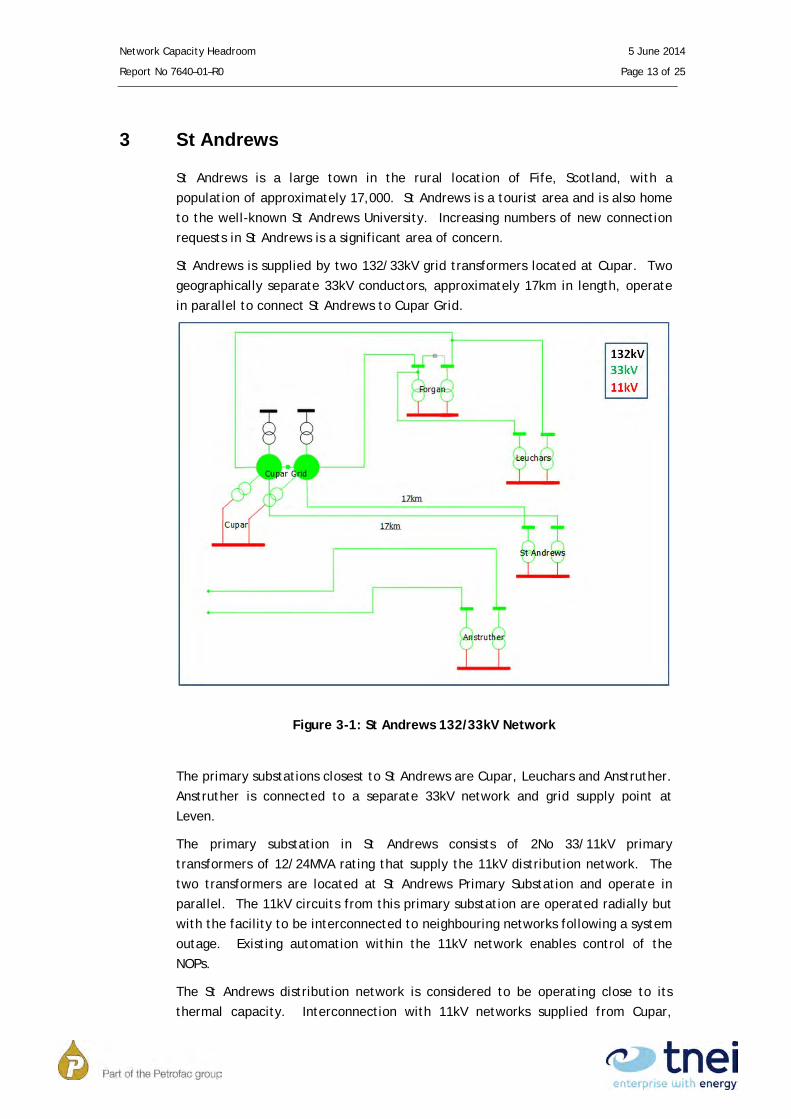
St Andrews is supplied by two 132/33kV grid transformers located at Cupar. Two geographically separate 33kV conductors, approximately 17km in length, operate in parallel to connect St Andrews to Cupar Grid.
Figure 3-1: St Andrews 132/33kV Network
The primary substations closest to St Andrews are Cupar, Leuchars and Anstruther. Anstruther is connected to a separate 33kV network and grid supply point at Leven.
The primary substation in St Andrews consists of 2No 33/11kV primary transformers of 12/24MVA rating that supply the 11kV distribution network. The two transformers are located at St Andrews Primary Substation and operate in parallel. The 11kV circuits from this primary substation are operated radially but with the facility to be interconnected to neighbouring networks following a system outage. Existing automation within the 11kV network enables control of the NOPs.
The St Andrews distribution network is considered to be operating close to its thermal capacity. Interconnection with 11kV networks supplied from Cupar,

Network Capacity Headroom 5 June 2014
Report No 7640–01–R0 Page 14 of 25
Anstruther and Leuchars primary substations is possible; however St Andrews Primary is considered to be a largely isolated load centre.
3.1 Available Capacity
The existing network must be capable of supplying the St Andrews 11kV network during an outage of one of the parallel supplies. This includes outage of a 33/11kV transformer or 33kV circuit conductor. The main points with regard to available capacity are:
3.1.1 Thermal Capacity
33kV
• Each of the 33kV circuit conductors connecting St Andrews to Cupar has a summer rating of 17.6MVA and winter rating of 20.86MVA.
11kV
• The two primary transformers supplying St Andrews each have a continuous rating of 12MVA and short-term rating of 24MVA.
• It is SP Distribution practice to operate a primary substation with two 12/24MVA transformers to 26MVA, provided that 2MVA can be transferred to other points in less than 2 hours by means of the lower voltage system.
• The theoretical group capacity for St Andrews substation is 21MVA and is based on a single circuit conductor outage.
• Spare thermal capacity of 5MVA is available at Leuchars primary substation, 2.3MVA at Anstruther and 2.2MVA at Cupar, however interconnection with St Andrews at 11kV is not considered a viable option because of the long circuit lengths and resulting voltage drop.
3.1.2 Voltage Capacity
33kV
• No 33kV voltage capacity issues have been identified
11kV
• Although 11kV interconnection of St Andrews with neighbouring networks is possible if one of the St Andrews primary substation transformers is out-of-service, the interconnection is via long rural HV lines and as such the resulting voltage drop proves to be a limiting factor.
3.1.3 Fault Level Capacity
33kV
• The maximum design fault level capacity within the 33kV network is 1000MVA.
• No fault level issues have been identified.
11kV
• The available fault level capacity within the 11kV network is 250MVA.
• No fault level issues have been identified.

Network Capacity Headroom 5 June 2014
Report No 7640–01–R0 Page 15 of 25
3.2 Existing Demand
The annual maximum demand at St Andrews is documented in the SP Distribution LTDS. The 2009/10 maximum demand is shown below in Table 3.1.
Table 3-1: St Andrews 2009/10 Maximum Demand
Substation Voltage Level (kV)
Max Demand Forecast Load Information (MW)
Group Rating (MVA) (MVA) 10/11 11/12 12/13 13/14 14/15
St Andrews 11 20.40 20.40 20.60 20.80 21.00 21.20 21
Consecutive half hourly average power data is available for the two primary substation transformers that supply the St Andrews 11kV network. From this data, annual aggregate load profiles have been calculated.
Figure 3-2: St Andrews Network Group Load Duration Curve

Network Capacity Headroom 5 June 2014
Report No 7640–01–R0 Page 16 of 25
3.3 Capacity Headroom
The current load capacity headroom is 0.6MVA or 3% of network capacity. This is based on the 2009/10 maximum demand of 20.4MVA and a group rating of 21MVA.The primary limiting network capacity parameter is the thermal rating of the 33kV circuit conductors connecting St Andrews to Cupar.
Additional limiting factors are:
• Limited thermal and voltage capacity due to voltage drop during load transfer to Cupar, Leuchars or Ansthruther networks through interconnection at 11kV.
• The short-term thermal rating of the primary transformers which is 24MVA.
The estimated cost for increasing load capacity at St Andrews by up to 100% based on traditional network reinforcements is £3.5m for a new additional 40MVA circuit conductor. Full details of options investigated for increasing the available network load capacity at St Andrews are provided in Appendix A.

Network Capacity Headroom 5 June 2014
Report No 7640–01–R0 Page 17 of 25
4 Wrexham, Ruabon
Ruabon is a small village located in the borough of Wrexham, Wales, with a population of approximately 2500. SPEN was approached by the local council with a request to install Photovoltaic (PV) panels in approximately 3900 properties in the Wrexham area including Ruabon, as a carbon reduction initiative with a potential of 6.26MW of PV generation. This has raised concern that installation of large amounts of PV will exceed the generation capacity of the network.
Ruabon is supplied primarily by two grid substations, Legacy Local and Oswestry Grid 132/33kV grid transformers. Two geographically separate 33kV conductors operate in parallel to connect Ruabon to the grid substations, see Figure 4-1. Please note that for clarity, not all circuits and substations are shown.
Figure 4-1: Ruabon 33kV Network
The Ruabon 33/11kV system consists of one 7.5MVA 33/11kV primary transformer which supplies the 11kV distribution network. The 11kV circuits from this primary substation are operated radially but with the facility to be interconnected to neighbouring networks supplied from Llangollen, Johnstown, Monsanto and Maelor Creamery following a system outage. Existing automation within the 11kV network enables control of the NOPs.
4.1 Available Capacity
The Ruabon network must continue to operate within thermal, voltage and fault level limits during loss of a grid transformer or one of the 33kV circuit conductors

Network Capacity Headroom 5 June 2014
Report No 7640–01–R0 Page 18 of 25
that connects Ruabon to the grid substations. The network load must also be transferable to neighbouring 11kV networks during loss of Ruabon primary transformer. Key points relating to the available network capacity are given below.
4.1.1 Thermal Capacity
33kV
• The winter thermal capacity of each of the 33kV circuit conductors is 17MVA.
11kV
• The primary transformer supplying Ruabon has a continuous rating of 7.5MVA with no short-term rating capacity.
• The 2010 LTDS gives a group firm capacity of 7.5MVA.
• The primary transformer does not have the capability for reverse power flow.
4.1.2 Voltage Capacity
33kV
• No existing voltage level issues have been identified.
11kV
• The 11kV target voltage is 11.0kV
• The no-load voltage at the LV terminals of secondary substations is set to 250V which is near the statutory maximum of 253V (230V + 10%). Tap changers at secondary substations are manual and operable offline only.
4.1.3 Fault Level Capacity
33kV
• The maximum design fault level capacity within the 33kV network is 750MVA.
• No fault level issues have been identified.
11kV
• The available fault level capacity within the 11kV network is 250MVA.
• No fault level issues have been identified.
4.2 Existing Demand
The annual maximum demand at Ruabon is documented in the SP Manweb LTDS. The 2009/10 maximum demand is shown below in Table 4-1.

Network Capacity Headroom 5 June 2014
Report No 7640–01–R0 Page 19 of 25
Table 4-1: Ruabon 2009/10 Maximum Demand
Substation Voltage Level (kV)
Max Demand of 09/10
Forecast Load Information (MW) Group Rating (MVA) (MVA) 10/11 11/12 12/13 13/14 14/15
Ruabon 11 7.84 7.88 7.92 7.96 8.00 8.04 7.5
Consecutive half hourly average power data is available for the Ruabon primary transformer. From this data, annual load profiles have been calculated.
Figure 4-2: Ruabon Network Group Load Duration Curve
4.3 Capacity Headroom
There is no existing load capacity headroom available at Ruabon. This is based on the 2009/10 maximum demand of 7.84MVA and a group rating of 7.5MVA.
The replacement of the 7.5MVA transformer by a transformer with a continuous rating of 7.5MVA and short-term rating of 10MVA is being considered, see Table A.3 in the Appendix. The new transformer will be fitted with an on-load tap changer and automatic voltage control (AVC) scheme. The available tapping range is +/-10% and the new transformer has full reverse power capability.
For no load conditions, the secondary substation transformer voltage is close to the upper statutory limit. Reverse power flow due to generation will increase the LV voltage towards and in excess of upper statutory voltage limits and as such reverse power flow cannot be permitted. To prevent reverse power and network

Network Capacity Headroom 5 June 2014
Report No 7640–01–R0 Page 20 of 25
voltage levels exceeding statutory limits, existing generation capacity headroom is limited by the minimum load demand. As this is measured at the primary substation by SPEN, this metric alone may not prevent local exceedances of the voltage upper statutory limit due to clustering of embedded generation on the LV network. To date, this has been assessed on a case-by-case basis by the SP Manweb network design team before granting approval for connection of LV embedded generation.
For the period corresponding to the 2009/10 LTDS, the minimum half-hourly real power load demand during 2009/10 was 1.036MW. The minimum daytime real power load demand occurred on 30th June at 11:00am and was 1.33MW (please note that only daytime load values, when PV generation is likely to be operational, were considered for this comparison).
The existing total installed PV generation on the Ruabon LV network is approximately 0.521MW. A landfill gas generation facility is also connected on the Ruabon 11kV network with a declared generation export of 2.24MW and an actual generation export of 0.43MW. Both the landfill gas and the PV generation have been connected since the publication of the 2009/10 LTDS. Based on the 2009/10 minimum daytime load and the generation connected since then, this indicates that there is no generation capacity headroom on the Ruabon network.

Network Capacity Headroom 5 June 2014
Report No 7640–01–R0 Page 21 of 25
5 Conclusions
Available network capacity headroom has been determined for the three Flexible Networks test areas based on available documentation and measured network data. The capacity headroom for all three areas is limited primarily by thermal and voltage limits and is summarised in Table 5-1.
5.1 Whitchurch
There is less than 1% existing load capacity headroom for the Whitchurch network group for new load connections at Whitchurch Business Park, the main load centre. This is limited by the thermal rating of the local 11kV circuits. Capacity headroom for new load connections in other areas of the Whitchurch network group may be higher.
The 33kV circuits are also currently operating very close to thermal rating and lower voltage statutory limits during loss of any of the three grid transformers in the 33kV group.
5.2 St Andrews
The current load capacity headroom for St Andrews is 0.6MVA which is 3% of existing network load capacity. The primary limiting network capacity parameter is the thermal rating of the 33kV circuit conductors connecting St Andrews primary substation to Cupar grid substation.
Future increases in load are also limited by the short-term thermal rating of primary transformers and the voltage drop during load transfer to Cupar, Leuchars or Ansthruther 11kV networks under outage conditions.
5.3 Ruabon
The maximum demand at Ruabon exceeds the transformer rating by 0.34MVA to give a load capacity headroom of -5%.
The existing generation capacity headroom available in the Ruabon network is limited by the upper voltage statutory limit at LV being exceeded under reverse power flow conditions. Based on the 2009/10 minimum daytime load and generation connected at HV and LV since then, there is no generation capacity headroom on the Ruabon network.

Network Capacity Headroom 5 June 2014
Report No 7640–01–R0 Page 22 of 25
Table 5-1: Network Capacity Headroom
Network Group
Network Group Rating (MVA) 2009/10
Load (MVA)
Capacity Headroom
(%) LTDS Actual
Whitchurch 20 14.86 14.76 1%
St Andrews 21
20.4 3%
Ruabon Load 7.5
7.84 -5%
Generation n/a 0MW - 0%
Network Capacity Headroom 5 June 2014
Report No 7640–01–R0 Page 23 of 25
Appendix A – Network Reinforcement Options and Costs
A.1 Whitchurch
Table A-1: Whitchurch Network Reinforcement Options and Cost

Network Capacity Headroom 5 June 2014
Report No 7640–01–R0 Page 24 of 25
Figure A-1: Whitchurch Reinforcement Costs and Capacity Increase
0
2
4
6
8
10
12
14
0% 20% 40% 60% 80% 100% 120% 140% Capacity Increase
Option 1 Option 2

Network Capacity Headroom 5 June 2014
Report No 7640–01–R0 Page 25 of 25
A.2 St Andrews
Table A-2: St Andrews Network Reinforcement Options and Cost
A.3 Ruabon
Table A-3: Ruabon Network Reinforcement Options and Cost