Burden of Diabetes in California - CDPH Home · Burden of Diabetes in California, ... contents are...
25
Burden of Diabetes in California California Department of Public Health Chronic Disease Control Branch September 2014
Transcript of Burden of Diabetes in California - CDPH Home · Burden of Diabetes in California, ... contents are...

Burden of Diabetes in California California Department of Public Health Chronic Disease Control Branch September 2014

1 | P a g e
Burden of Diabetes in California, 2014
This publication was prepared in September 2014 by the Chronic Disease Control Branch. The content included in this report may be reproduced with the following citation: Conroy SM, Lee AK, Pendleton L, Bates JH. (2014). Burden of Diabetes in California. Sacramento, California: Chronic Disease Control Branch, California Department of Public Health. Inquiries regarding the content of this report may be directed to: Data and Information Section Chronic Disease Control Branch California Department of Public Health MS 7208, PO Box 997377 Sacramento, CA 95899-7377 Phone: (916) 552-9900
This publication was supported by Grant/Cooperative Agreement Number 5U58DP002007-05 from the Centers for Disease Control and Prevention (CDC). Its contents are solely the responsibility of the authors and do not necessarily represent the official view of CDC. This project was supported by California Department of Public Health. The Heart Disease and Diabetes Prevention Unit is the State’s public health program for the prevention and control of diabetes. © 2014 California Department of Public Health, Center for Chronic Disease Prevention and Health Promotion

2 | P a g e
Table of Contents Executive Summary ....................................................................................................................................... 4
I. Introduction ............................................................................................................................................... 5
II. What is diabetes? ...................................................................................................................................... 6
Type 1 diabetes ......................................................................................................................................... 6
Type 2 diabetes ......................................................................................................................................... 6
Gestational diabetes ................................................................................................................................. 6
Other types of diabetes ............................................................................................................................ 6
Prediabetes (also called impaired glucose tolerance) .............................................................................. 6
III. Diabetes in California ............................................................................................................................... 7
Diabetes by age group .............................................................................................................................. 7
Type 2 diabetes by gender and race/ethnicity ......................................................................................... 8
Type 2 diabetes by social determinants of health .................................................................................... 9
Type 2 diabetes and obesity by county .................................................................................................. 10
Risk factors for type 2 diabetes .............................................................................................................. 12
Co-morbidities of type 2 diabetes .......................................................................................................... 13
IV. Diabetes Complications ......................................................................................................................... 14
End-stage renal disease (kidney failure) ................................................................................................. 14
Amputation ............................................................................................................................................. 15
V. Diabetes Mortality .................................................................................................................................. 16
Overall causes of death ........................................................................................................................... 16
Diabetes mortality rates by race ............................................................................................................. 17
VI. Diabetes Prevention and Control Activities ........................................................................................... 18
Heart Disease and Diabetes Prevention Unit ......................................................................................... 18
The California Wellness Plan ................................................................................................................... 19
Appendix: Methodology ............................................................................................................................ 20
Data Sources ........................................................................................................................................... 20
California Health Interview Survey ..................................................................................................... 20
California Death Statistical Master File ............................................................................................... 20
CDC WONDER Online Database .......................................................................................................... 21
California Office of Statewide Health Planning and Development Patient Discharge Data ............... 21
United States Renal Data System ........................................................................................................ 21

3 | P a g e
California Department of Finance Population Data ............................................................................ 22
Statistical Methods ................................................................................................................................. 22
Age adjustment ................................................................................................................................... 22
Confidence intervals ........................................................................................................................... 22
Unstable estimates ............................................................................................................................. 22
References .................................................................................................................................................. 23

4 | P a g e
Executive Summary
Over 2.3 million California adults report having been diagnosed with diabetes, representing one out of every 12 adult Californians. The vast majority of diabetes cases in California are type 2, representing 1.9 million adults. The prevalence increases with age—one out of every six adult Californians aged 65 and above have type 2 diabetes—and is higher among ethnic/racial minorities and Californians with low education attainment and/or family income. Compared with non-Hispanic Whites, Hispanics and African Americans have twice the prevalence of type 2 diabetes and are twice as likely to die from their disease.
Diabetes is the seventh leading cause of death in California, and determined to be the underlying cause of death in almost 8,000 people each year. As diabetes is a contributing factor to many deaths from heart disease and stroke, diabetes may be under-represented as a contributing cause of death.
Obesity and smoking are strong risk factors for type 2 diabetes. Obese adults have a four times higher risk of type 2 diabetes compared to normal weight adults in California. Adults with type 2 diabetes are also more likely to have other health problems, including cardiovascular disease and arthritis. One of every two adults with type 2 diabetes also has hypertension. Complications among California adults with diabetes have decreased between 2001 and 2007, as indicated by the rate of hospitalizations for end-stage renal disease and lower extremity amputations; however, this decline has diminished and may even have increased in recent years.
The California Department of Public Health (CDPH) has a number of ongoing activities that support the primary prevention of diabetes through the promotion of healthy eating, increased physical activity, tobacco cessation, and the prevention and control of overweight and obesity. Secondary prevention activities focus on evidence-based strategies to prevent or delay the onset of complications among Californians diagnosed with type 2 diabetes. CDPH is establishing a statewide network of evidence-based lifestyle change programs that are designed to prevent the development of type 2 diabetes among people at highest risk and prevent or delay the onset of complications among people diagnosed with type 2 diabetes.

5 | P a g e
I. Introduction
Diabetes is a serious health condition and a major risk factor for heart disease and stroke. Uncontrolled diabetes can lead to significant disability, including blindness, amputations, and kidney failure. The number of adults in the United States (U.S.) with diabetes has risen dramatically since 1990, and continues to increase. The recently released National Diabetes Statistics Report, 2014 from the Centers for Disease Control and Prevention (CDC) indicates that 29.1 million people, or 9.3 percent of the U.S. population, now have diabetes1—many of whom do not know they have the disease. The estimated number of new diabetes cases in Californian has increased from 131,000 in 1995 to 209,000 in 2010 (age-adjusted rates) according to the CDC’s Behavioral Risk Factor Surveillance System.2 If current trends continue, as many as one out of every three U.S. adults will have diabetes by the year 2050.3
Type 2 diabetes—the most common form of the disease—can be prevented through healthy eating, lowering body weight, and increasing physical activity. People who have diabetes should adopt these same measures to manage their condition, along with medications to lower blood glucose, if indicated. Another crucial part of diabetes management is lowering the risk of heart disease and stroke by managing blood pressure and lipid levels, and stopping tobacco use.
The purpose or this brief report is to describe the current burden of diabetes among adults in California, and to describe some of the current diabetes prevention and control activities being implemented by CDPH.

6 | P a g e
II. What is diabetes?
Diabetes is a disease in which the body has a shortage of insulin, a decreased ability to use insulin, or both. Insulin is a hormone that allows glucose (sugar) to enter cells and be converted to energy. When diabetes is not controlled, glucose and fats remain in the blood and, over time, damage vital organs.
Type 1 diabetes usually is first diagnosed in children and young adults, although it can occur at any age. Type 1 diabetes is an autoimmune disease that may be caused by genetic, environmental, or other factors. It accounts for about 5 percent of diabetes cases. There is no known way to prevent it, and effective treatment requires the use of insulin.
Type 2 diabetes accounts for 90–95 percent of diabetes cases and is usually associated with older age, obesity, and physical inactivity, family history of type 2 diabetes, or a personal history of gestational diabetes. Diabetes rates vary by race and ethnicity, with American Indian, Alaska Native, African American, Hispanic/Latino, and Asian/Pacific Islander adults about twice as likely as white adults to have type 2 diabetes. Type 2 diabetes can be prevented through healthy food choices, physical activity, and weight loss. It can be controlled with these same activities, but insulin or oral medication also may be necessary.
Gestational diabetes is a form of glucose intolerance that is diagnosed during pregnancy. Gestational diabetes occurs more often in African-American, Hispanic/Latino, and American-Indian women, as well as in women who are obese or have a family history of type 2 diabetes. It requires treatment to bring maternal blood glucose to normal levels and avoid complications in the infant. Evidence suggests that gestational diabetes increases the risk that the mother, and the babies of mothers who have gestational diabetes, will develop type 2 diabetes later in life.
Other types of diabetes result from specific genetic conditions (such as maturity-onset diabetes of youth), surgery, medications, infections, pancreatic disease, and other illnesses. Other types of diabetes account for less than 5 percent of all diagnosed cases.
Prediabetes (also called impaired glucose tolerance) is a condition in which blood sugar levels are higher than normal, but not high enough to be diagnosed as diabetes. People with prediabetes are at high risk of developing type 2 diabetes, as well as heart disease and stroke. Studies have shown that people with prediabetes who lose weight and increase their physical activity can reduce their blood sugar levels back to normal and prevent diabetes from developing.

7 | P a g e
III. Diabetes in California
Over 2.3 million California adults report having been diagnosed with diabetes, according to the 2012–1012 California Health Interview Survey (CHIS).4 This represents 8.4 percent of the population or one of every 12 adult Californians.1*
Diabetes by age group • The vast majority of diabetes cases in California are type 2, representing 1.9 million adults,
or 6.9 percent of the population. • The prevalence of type 1 diabetes is less than 2 percent for all age groups. • In contrast, the prevalence of type 2 diabetes is less than 2 percent for adults under age 45,
but rises sharply to 10 percent for ages 45–64 years, and 17 percent for ages 65 years and older.
*Note: This prevalence of 8.4 percent in California cannot be directly compared to 9.3 percent in the U.S. overall from the CDC report, National Diabetes Statistics Report, 2014.1 The CDC figure includes data collected from people who had blood tests showing diabetes who were not previously aware they had the disease. The CHIS results only include adults who know they have been diagnosed with diabetes.
0.6 1.6 1.7
10.1
1.7
16.8
1.1
6.9
0.0
5.0
10.0
15.0
20.0
Type I Type II
Prev
alen
ce (%
)
Figure 1. Type 1 and Type 2 Diagnosed Diabetes by Age, 2011-2012
18-44 years old
45-64 years old
65 years and older
All ages
Source: California Health Information Survey (CHIS) 2011–2012 Adult Survey. Response to "Other than during pregnancy, has/had a doctor ever told you that you have diabetes or sugar diabetes?" and "Were you told that you had Type 1 or Type 2 diabetes?"

8 | P a g e
Type 2 diabetes by gender and race/ethnicity
• The prevalence of type 2 diabetes is 13 percent higher in men than women in California. • Hispanics, African Americans, and Asian/Pacific Islanders have higher prevalence of type 2
diabetes than non-Hispanic Whites. Hispanics and African Americans have two times higher prevalence: 1 in 20 non-Hispanic Whites have type 2 diabetes, compared with 1 in 10 Hispanics and 1 in 11 African Americans.
4.9
6.2
7.5
8.8
10.5
6.4
7.2
0.0 5.0 10.0 15.0 20.0
Non-Hispanic White
Asian/Pacific Islander
American Indian/Alaska Native
African American
Hispanic
Race/Ethnicity
Female
Male
Gender
Figure 2. Type 2 Diagnosed Diabetes by Gender and Race/Ethnicity, 2011–2012
Age-adjusted Prevalence (%)
Source: California Health Information Survey (CHIS) 2011–2012 Adult Survey. Response to "Other than during pregnancy, has/had a doctor ever told you that you have diabetes or sugar diabetes?" and "Were you told that you had Type 1 or Type 2 diabetes?" American Indian or Alaska Native or other single and multiple race not shown due to unstable estimates.

9 | P a g e
Type 2 diabetes by social determinants of health
• The prevalence of diagnosed type 2 diabetes is two times higher in Californian adults without a high-school diploma compared to those with a college degree.
• Similarly, the percent of adults in Californians with diabetes is almost two times higher in those with family incomes below 200 percent of the federal poverty level compared to those whose income is 300 percent above.
5.3
7.3
9.1
8.7
4.8
7.1
9.9
0.0 5.0 10.0 15.0 20.0
300% or more
200-299%
100-199%
0-99%
Poverty Level
College graduate
High school, GED & vocational
Grade School
Education
Figure 3. Type 2 Diagnosed Diabetes by Education and Poverty Level, 2011–2012
Age-adjusted Prevalence (%)
Source: California Health Information Survey (CHIS) 2011–2012 Adult Survey. Response to "Other than during pregnancy, has/had a doctor ever told you that you have diabetes or sugar diabetes?" and "Were you told that you had Type 1 or Type 2 diabetes?"

10 | P a g e
Type 2 diabetes and obesity by county
Estimated Prevalence of Type 2 Diagnosed Diabetes and Obesity (age 18 years or older) by Counties in California
County Type 2 Diabetes Obesity Estimated N Prevalence (%) 95% CI Estimated N Prevalence (%) 95% CI
Alameda 62,000 5.3 (3.9 - 6.8) 243,000 21.0 (17.7 - 24.3) Butte 11,000 6.5 (3.9 - 9.1) 41,000 23.8 (18.5 - 29.1)
Contra Costa 53,000 6.7 (4.5 - 8.8) 193,000 24.0 (19.8 - 28.2) Del Norte, Siskiyou, Lassen,
Trinity, Modoc, Plumas, Sierra 9,000 8.2 (5.2 - 11.1) 34,000 31.4 (25.6 - 37.3)
El Dorado 8,000 5.8 (3.1 - 8.6) 32,000 22.9 (17.2 - 28.6) Fresno 45,000 6.9 (4.8 - 9.1) 195,000 30.0 (25.3 - 34.7)
Humboldt 7,000 6.7 (4.3 - 9.1) 29,000 27.6 (20.7 - 34.4) Imperial 5,000 4.0 (2.2 - 5.7) 47,000 41.7 (32.2 - 51.2)
Kern 41,000 7.3 (4.8 - 9.9) 185,000 33.2 (26.9 - 39.4) Kings 9,000 9.4* (3.3 - 15.5) 35,000 36.6 (25.7 - 47.6) Lake 4,000 8.1* (1.1 - 15.1) 13,000 26.4 (16.9 - 35.8)
Los Angeles 536,000 7.2 (6.5 - 8.0) 1,831,000 24.7 (23.3 - 26.1) Madera 10,000 10.2 (5.2 - 15.3) 34,000 34.4 (25.7 - 43.2)
Marin 5,000 2.7 (0.7 - 4.7) 27,000 13.9 (8.9 - 18.9) Mendocino 3,000 5.0 (2.9 - 7.1) 18,000 26.5 (20.0 - 33.0)
Merced 19,000 10.8 (5.3 - 16.2) 60,000 34.1 (26.3 - 41.9) Monterey 26,000 8.9 (5.9 - 12.0) 72,000 25.1 (20.1 - 30.1)
Napa 8,000 7.4 (3.1 - 11.7) 30,000 28.9 (19.7 - 38.1) Nevada 3,000 3.9 (2.2 - 5.6) 15,000 18.5 (14.4 - 22.6) Orange 131,000 5.7 (4.6 - 6.8) 533,000 23.1 (20.5 - 25.8)
Placer 20,000 7.2 (4.5 - 10.0) 49,000 18.1 (13.7 - 22.5) Riverside 118,000 7.4 (5.4 - 9.5) 412,000 25.9 (22.7 - 29.2)
Sacramento 76,000 7.2 (5.1 - 9.3) 295,000 28.0 (23.6 - 32.3)

11 | P a g e
Estimated Prevalence of Type 2 Diagnosed Diabetes and Obesity (age 18 years or older) by Counties in California County Type 2 Diabetes Obesity
Estimated N Prevalence (%) 95% CI Estimated N Prevalence (%) 95% CI San Benito 3,000 7.4* (2.9 - 11.9) 17,000 41.2 (29.0 - 53.4)
San Bernardino 127,000 8.8 (6.4 - 11.2) 478,000 33.2 (29.3 - 37.0) San Diego 160,000 6.9 (5.8 - 8.0) 512,000 22.1 (20.1 - 24.0)
San Francisco 24,000 3.6 (2.0 - 5.2) 77,000 11.3 (8.5 - 14.2) San Joaquin 37,000 7.6 (4.6 - 10.6) 168,000 34.7 (28.7 - 40.6)
San Luis Obispo 11,000 5.3 (3.0 - 7.6) 25,000 12.6 (9.2 - 15.9) San Mateo 38,000 6.7 (3.1 - 10.3) 94,000 16.6 (12.1 - 21.0)
Santa Barbara 14,000 4.7 (2.4 - 6.9) 64,000 20.5 (14.8 - 26.2) Santa Clara 79,000 5.8 (4.0 - 7.6) 263,000 19.3 (16.3 - 22.3) Santa Cruz 10,000 5.1 (2.9 - 7.3) 54,000 27.1 (20.0 - 34.3)
Shasta 10,000 7.2 (4.8 - 9.6) 35,000 25.7 (20.1 - 31.3) Solano 22,000 7.1 (3.8 - 10.4) 109,000 35.8 (29.1 - 42.6)
Sonoma 15,000 4.0 (2.2 - 5.8) 80,000 21.5 (16.7 - 26.3) Stanislaus 37,000 10.1 (6.9 - 13.2) 112,000 30.1 (24.0 - 36.3)
Sutter 7,000 10.0 (6.3 - 13.8) 21,000 30.1 (24.1 - 36.1) Tehama, Glenn, Colusa 7,000 9.0 (5.2 - 12.7) 32,000 38.2 (30.2 - 46.2)
Tulare 40,000 13.2 (8.9 - 17.4) 115,000 38.0 (31.5 - 44.5) Tuolumne, Calaveras, Amador,
Inyo, Mariposa, Mono, Alpine 9,000 5.9 (2.8 - 9.0) 27,000 18.7 (13.9 - 23.5)
Ventura 37,000 6.0 (4.0 - 7.9) 140,000 22.7 (18.0 - 27.4) Yolo 10,000 6.5 (3.9 - 9.0) 27,000 17.8 (13.2 - 22.5)
Yuba 6,000 11.8 (6.7 - 16.8) 16,000 32.2 (24.4 - 39.9) California 1,912,000 6.9 (6.5 – 7.2) 6,892,000 24.8 (32.2 - 51.2)
Abbreviations: CI, confidence interval. Source: California Health Information Survey (CHIS) 2011–2012 Adult Survey. Diabetes indicates response to "Other than during pregnancy, has/had a doctor ever told you that you have diabetes or sugar diabetes?" and "Were you told that you had Type 1 or Type 2 diabetes?" Obesity based on self-reported height and weight with a calculated body mass index (BMI) ≥30 kg/m2. *Represents unstable estimates.

12 | P a g e
Risk factors for type 2 diabetes
• The Report of the Surgeon General, The Health Consequences of Smoking—50 Years of Progress, concludes that smoking is causally linked to type 2 diabetes, and the risk of developing diabetes is 30–40 percent higher for active than nonsmokers.5 In the CHIS data, current/former smokers had a slightly higher (19% higher) prevalence of diagnosed type 2 diabetes.
• Obesity is a strong risk factor for type 2 diabetes. Obese adults have a four times higher risk of type 2 diabetes compared to normal weight adults in California.
3.0
6.3
12.9
6.3
7.5
0.0 5.0 10.0 15.0 20.0
Normal (<25 kg/m²)
Overweight (25-<30 kg/m²)
Obese (≥30 kg/m²)
Body Mass Index (kg/m²)
Never
Current/former
Smoking Status
Figure 4. Type 2 Diagnosed Diabetes Prevalence by Risk Factor, 2011-2012
Age-adjusted Prevalence (%)
Source: California Health Information Survey (CHIS) 2011–2012 Adult Survey. Response to "Other than during pregnancy, has/had a doctor ever told you that you have diabetes or sugar diabetes?" and "Were you told that you had Type 1 or Type 2 diabetes?"

13 | P a g e
Co-morbidities of type 2 diabetes
• Adults with type 2 diabetes more often have other health problems. • One of every two adults with type 2 diabetes also has hypertension. This is two times higher
than among those without diabetes. • Adults with diabetes are two times more likely to have cardiovascular disease than adults
without diabetes • Adults with diabetes are 50 percent more likely to have arthritis than adults without
diabetes. Arthritis may present additional barriers for adults with diabetes attempting to manage their condition through physical activity.6
24.5 18.9
7.1
56.5
28.5
13.9
0.0
10.0
20.0
30.0
40.0
50.0
60.0
70.0
Hypertension Arthritis Cardiovascular Disease
Age-
Adju
sted
Pre
vale
nce
(%)
Figure 5. Prevalence of Other Health Conditions in Adults without Diabetes and with Type 2 Diabetes,
2011–2012
Without Diabetes With Type 2 Diabetes
Source: California Health Information Survey (CHIS) 2011–2012 Adult Survey. Response to "Other than during pregnancy, has/had a doctor ever told you that you have diabetes or sugar diabetes?" and "Were you told that you had Type 1 or Type 2 diabetes?" Arthritis based on "Have you ever been told by a doctor that you have some form of arthritis, gout, lupus, or fibromyalgia?" Hypertension based on "Has a doctor ever told you that you have high blood pressure?" Cardiovascular Disease based on multiple questions: Has a doctor ever told you that you had a stroke, have any kind of heart disease, or have heart failure or congestive heart failure?
14 | P a g e
IV. Diabetes Complications
End-stage renal disease (kidney failure)
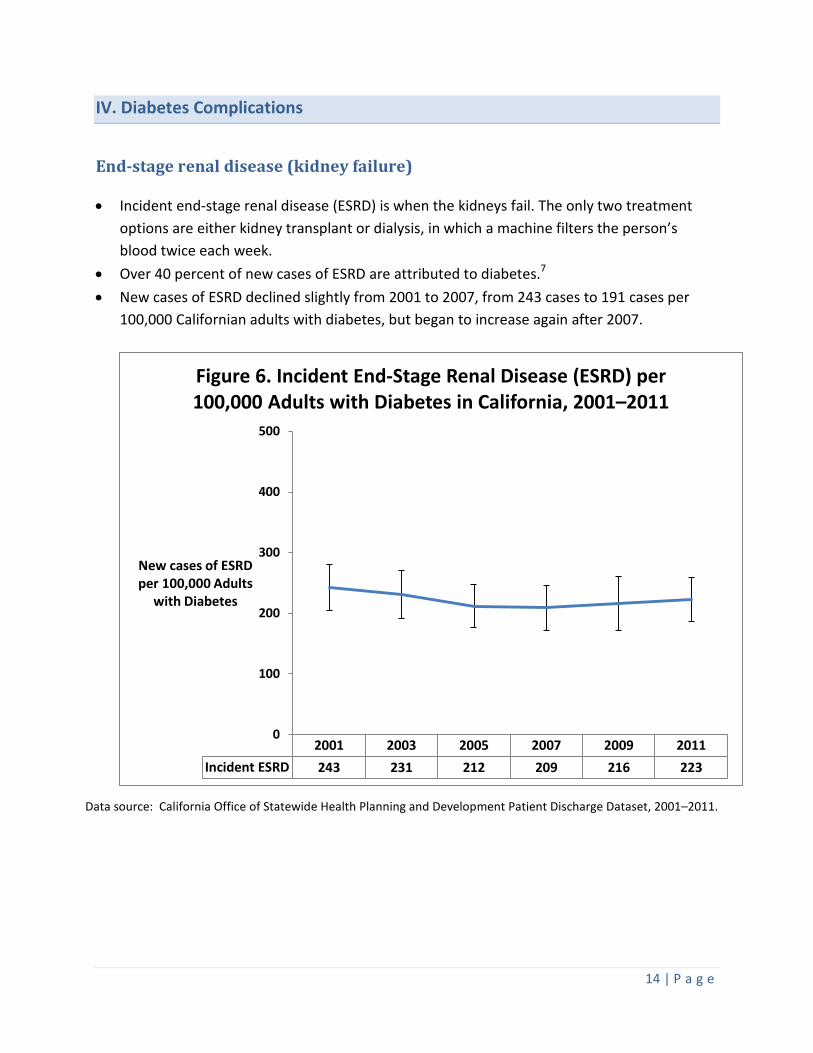
• Incident end-stage renal disease (ESRD) is when the kidneys fail. The only two treatment options are either kidney transplant or dialysis, in which a machine filters the person’s blood twice each week.
• Over 40 percent of new cases of ESRD are attributed to diabetes.7 • New cases of ESRD declined slightly from 2001 to 2007, from 243 cases to 191 cases per
100,000 Californian adults with diabetes, but began to increase again after 2007.
Data source: California Office of Statewide Health Planning and Development Patient Discharge Dataset, 2001–2011.
2001 2003 2005 2007 2009 2011Incident ESRD 243 231 212 209 216 223
0
100
200
300
400
500
New cases of ESRD per 100,000 Adults
with Diabetes
Figure 6. Incident End-Stage Renal Disease (ESRD) per 100,000 Adults with Diabetes in California, 2001–2011

15 | P a g e
Amputation
• About 60 percent of all non-traumatic lower-limb amputations in adults occur in people with diabetes.1
• Lower extremity amputations declined from 2001 to 2009 among adult Californians with diabetes, similar to what is being seen in the nation overall.8 This finding may suggest better medical management of diabetes and its complications.
–
Data source: California Office of Statewide Health Planning and Development Patient Discharge Dataset, 2001–2011.
2001 2003 2005 2007 2009 2011Lower Extremity Amputations 387 369 339 300 269 318
0
100
200
300
400
500
Lower Extremity Amputations per 100,000 Adults with Diabetes
Figure 7. Age-Adjusted Rate of Lower Extremity Amputations per 100,000 Adults with Diabetes in
California, 2001–2011

16 | P a g e
V. Diabetes Mortality
Overall causes of death
• Diabetes is the seventh leading cause of death in California, and determined to be the underlying cause of death in almost 8,000 people each year.
• Diabetes may be underreported as a cause of death, and is a contributing factor to many deaths from heart disease and stroke.1
• People with diabetes have shorter life expectancies: for someone age 50 or over, diabetes cuts off eight years of life.9
Data Source: California Death Statistical Master File.
59,854
58,058
17,398
13,606
13,001
11,675
7,924
5,870
4,699
4,525
2,735
2,407
0 10,000 20,000 30,000 40,000 50,000 60,000 70,000
Heart Disease
Cancer
Injuries
Stroke
Chronic Lower Respiratory Diseases
Alzheimer's Disease
Diabetes Mellitus
Influenza and Pneumonia
Chronic Liver Disease Cirrhosis
Hypertension / Renal Disease
Nephritis
Parkinsons
Number of Deaths
Figure 8. Leading Causes of Death in California, 2012

17 | P a g e
Diabetes mortality rates by race
• Diabetes mortality rates vary by race. In almost all years, mortality due to diabetes is two times higher among African Americans and Hispanics than among non-Hispanic Whites.
• Since 1999, diabetes mortality rates among African Americans and Hispanics have decreased significantly. In contrast, diabetes mortality rates among American Indians and Alaskan Natives have fluctuated; trends for Asian or Pacific Islander and non-Hispanic Whites have remained relatively stable over time.
Source: CDC WONDER Online Database released 2012.
1999 2000 2001 2002 2003 2004 2005 2006 2007 2008 2009 2010African American 49.7 46.2 43.3 49.3 48.4 45.7 49.0 46.6 48.0 44.0 41.1 38.8Hispanic 38.4 36.0 37.6 36.7 36.8 36.6 38.5 35.2 34.1 32.6 29.0 29.5American Indian or Alaskan Native 33.1 26.3 27.3 27.7 41.0 34.5 38.9 41.9 37.7 32.3 25.7 33.9Asian or Pacific Islander 20.2 16.9 17.5 19.0 20.3 19.1 19.7 18.2 18.6 18.5 17.4 16.9Non-Hispanic White 17.9 17.3 17.3 18.0 18.2 18.2 19.0 18.2 17.6 17.3 16.0 16.0
0
10
20
30
40
50
60
Figure 9. Age-Adjusted Diabetes Mortality Rates by Race in California, 1999–2010
African American
Hispanic
American Indian orAlaskan NativeAsian or PacificIslanderNon-Hispanic White

18 | P a g e
VI. Diabetes Prevention and Control Activities
Heart Disease and Diabetes Prevention Unit
In July 2013, CDPH was awarded funding from the CDC for “State Public Health Actions to Prevent and Control Diabetes, Heart Disease, Obesity and Associated Risk Factors and Promote School Health.” This initiative is referenced in California as “Prevention First: Advancing Synergy for Health” (Prevention First), and represents a new approach that promotes coordination and collaboration among state and local programs to promote health and prevent and control cardiovascular disease (CVD), diabetes, and their risk factors. CDPH has integrated these activities into the new Heart Disease and Diabetes Prevention Unit, which aims to reduce premature death and disability from CVD and diabetes. Critical to the success of these efforts are partnerships with local public health departments, voluntary associations, non-profits, health care systems, health associations and foundations, and other state agencies.
The Prevention First initiative contains a variety of activities that support the primary prevention of diabetes through the promotion of healthy eating, increased physical activity, and the prevention and control of overweight and obesity. Prevention First includes specific evidence-based strategies and goals that address diabetes prevention and management including: Prevent the onset of diabetes among those with prediabetes by:
• Promoting awareness of prediabetes among people at risk so that they may take action.
o CDC estimates that 37 percent of adults in the U.S. have prediabetes and are at risk for developing diabetes. Most are unaware they have the condition.
• Promoting the use of, and increased access to (via reimbursement), lifestyle intervention programs in community settings modeled after CDC’s National Diabetes Prevention Program (NDPP) that can prevent or delay the onset of type 2 diabetes among people with prediabetes.
o These programs have been shown to help people cut their risk of developing diabetes in half.10
o Studies show that people with prediabetes who reduce their weight by 5 percent to 7 percent and do 150 minutes per week of moderate physical activity can reduce their risk of developing diabetes by 58 percent.11

19 | P a g e
Prevent or delay the onset of complications among people diagnosed with type 2 diabetes by:
• Promoting participation in and availability of American Diabetes Association (ADA)-recognized, American Association of Diabetes Educators (AADE)-accredited, state-accredited/certified, and/or Stanford licensed diabetes self-management education (DSME) programs.
• Working with health care systems to promote adoption of protocols to refer patients with diabetes to DSME programs.
• Increasing access to DSME programs via reimbursement. • Managing the condition with healthful eating, regular physical activity, weight loss,
self-management training, tobacco cessation, and medications to lower blood glucose levels.
The California Wellness Plan
CDPH, CDCB recently released the California Wellness Plan (Plan) in February 2014. This Plan is the result of a statewide process to develop a roadmap for CDPH and its partners to promote health and eliminate preventable chronic disease in California. The overarching goal of the Plan is Equity in Health and Wellbeing. Its focus areas are to: (1) create communities where people can be healthy, (2) improve the quality of clinical and community care, (3) increase access to usable health information, (4) assure continued public health capacity to achieve health equity, and (5) empower communities to create healthier environments. The Plan aligns with the Let’s Get Healthy California Taskforce (LGHCTF) priorities and includes 26 priorities and performance measures developed in 2012 that are based upon evidence-based strategies to prevent chronic disease and promote equity. The Plan contains 15 objectives specific to diabetes, including objectives to increase utilization of diabetes prevention and self-management programs, as well as broad objectives to reduce the prevalence of obesity and diabetes among children and adults. The Plan may be found on the CDPH, CDCB website at http://www.cdph.ca.gov/programs/cdcb/.

20 | P a g e
Appendix: Methodology
Data Sources
California Health Interview Survey The California Health Interview Survey (CHIS) is a representative population-based, random-digit dial, cross-sectional health survey of non-institutionalized individuals in California and covers a wide range of health topics. The survey provides statewide information on the health and health needs of the overall population in California, including many racial and ethnic groups. For the 2011–2012 CHIS, a total of 42,935 adults were surveyed. CHIS is designed to meet two sampling objectives: (1) provide estimates for 41 large and medium-size counties in California, and for groups of counties with the smallest populations; and (2) provide estimates for California’s overall population, major racial and ethnic groups, and for several smaller ethnic subgroups. Sampling weights are applied to the data files and are based on the State of California’s Department of Finance population estimates and projections, with adjustment for populations not eligible to participate in CHIS (e.g., nursing homes, prisons). The resulting weighted estimates represent one year of California’s residential population.12
Trends over time or comparisons with previous CHIS data (2001, 2003, 2005, 2007, or 2009) are not presented in this report. There are a number of cycle-specific methodological changes implemented in the 2011–2012 CHIS cycle that may impact the validity in comparing estimates over time.13 Briefly, CHIS data collection was biennial from 2001 to 2009, with data collected during a 7–9 month period every other year. In 2011, CHIS changed to a continuous data collection cycle across a two-year period. The CHIS 2011–2012 data were collected between June 15, 2011, and January 14, 2013. Approximately half of the interviews were conducted during the 2011 calendar year and half during the 2012 calendar year. CHIS also updated their weighting, based on the 2010 Census; previous CHIS cycles were based on projections based on the 2000 Census. Furthermore, a larger percentage of adult interviews (22%) were collected via cell phone than in previous years. Further information on the design and methodology of CHIS may be found on their website (http://healthpolicy.ucla.edu/chis/).
California Death Statistical Master File The California Death Statistical Master File was used for the leading causes of death analysis. The Center for Health Statistics and Informatics in CDPH compiles the Death Statistical Master File annually from death certificates of California residents. The death certificates contain the cause of death, coded using the International Classification of Diseases (ICD-10). The table below details the ICD-10 codes used.

21 | P a g e
Cause of Death ICD-10 codes Heart Disease I00-I09, I11, I13, I20-I51 Cancer C00-C97 Injuries (Accidents, Suicide, Homicide) U01-03, V01-Y09, Y85-Y86, Y87.0, Y87.1 Stroke I60-I69 Chronic Lower Respiratory Disease J40-J47 Alzheimer’s Disease G30 Diabetes E10-E14 Influenza and Pneumonia J09-J18 Chronic Liver Disease K70, K73-K74 Essential Hypertension/Renal Disease I10, I12, I15 Nephritis N00-N07, N17-N19, N25-N27 Parkinson’s Disease G20-G21
CDC WONDER Online Database The Center for Disease Control and Prevention’s Wide-ranging Online Data for Epidemiologic Research (CDC WONDER) system was used to generate the age-adjusted diabetes mortality rates. The mortality data was published by the National Center for Health Statistics and CDC from the Multiple Cause of Death Files, 1999–2010, as compiled from data provided by the 57 vital statistics jurisdictions through the Vital Statistics Cooperative Program. Accessed at http://wonder.cdc.gov/mcd-icd10.html on June 23, 2014.
California Office of Statewide Health Planning and Development Patient Discharge Data The California Office of Statewide Health Planning and Development compiles administrative data on all patients discharged from non-Federal hospitals in California (Patient Discharge Data). Lower extremity amputations were identified with the following coding algorithm: any of the ICD-9-CM procedure codes 84.10-84.19 and no traumatic procedure codes 895.0-897.7. An ICD-9-CM diagnosis code of 250.x had to be present in any position for the amputation to be counted in the numerator of the rate for adults with diabetes.
United States Renal Data System The United States Renal Data System (USRDS) is a national data collection system that monitors individuals with end-stage renal disease (ESRD) in the United States. This system is funded by the National Institute of Diabetes, Digestive, and Kidney Diseases (NIDDK). The online application on the USRDS website, Renal Data Extraction and Referencing (RenDER) system (http://www.usrds.org/render/xrender_home.asp), was used to determine the number of individuals in California who had incident ESRD, and how many of these individuals also had diabetes.
22 | P a g e
California Department of Finance Population Data Population data are from the California Department of Finance’s Demographic Research Unit. The data files are: “Total Population Only by Age and Race/Ethnicity” that provides intercensal population estimates of single years in California for the years 2000–2009;14 and “Total Population Only by Race/Hispanic and Age” that provides the 2010 Census population for year 2010 and population projections in California for year 2011.15
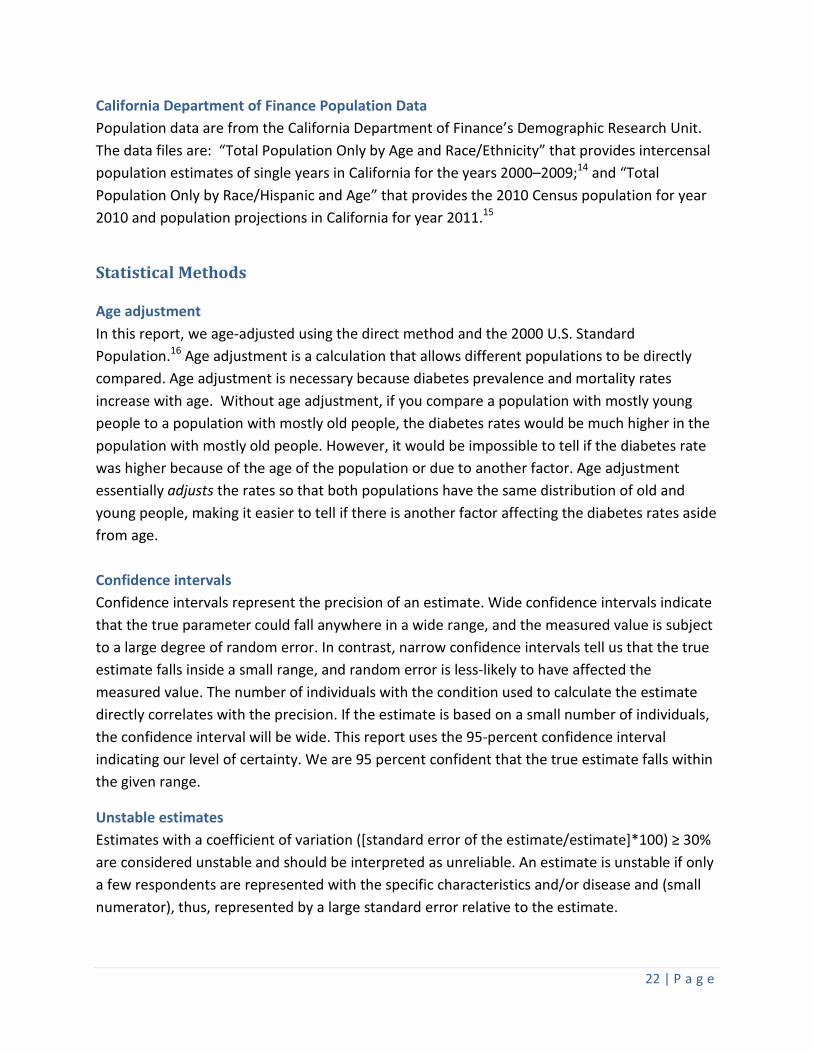
Statistical Methods
Age adjustment In this report, we age-adjusted using the direct method and the 2000 U.S. Standard Population.16 Age adjustment is a calculation that allows different populations to be directly compared. Age adjustment is necessary because diabetes prevalence and mortality rates increase with age. Without age adjustment, if you compare a population with mostly young people to a population with mostly old people, the diabetes rates would be much higher in the population with mostly old people. However, it would be impossible to tell if the diabetes rate was higher because of the age of the population or due to another factor. Age adjustment essentially adjusts the rates so that both populations have the same distribution of old and young people, making it easier to tell if there is another factor affecting the diabetes rates aside from age. Confidence intervals Confidence intervals represent the precision of an estimate. Wide confidence intervals indicate that the true parameter could fall anywhere in a wide range, and the measured value is subject to a large degree of random error. In contrast, narrow confidence intervals tell us that the true estimate falls inside a small range, and random error is less-likely to have affected the measured value. The number of individuals with the condition used to calculate the estimate directly correlates with the precision. If the estimate is based on a small number of individuals, the confidence interval will be wide. This report uses the 95-percent confidence interval indicating our level of certainty. We are 95 percent confident that the true estimate falls within the given range.
Unstable estimates Estimates with a coefficient of variation ([standard error of the estimate/estimate]*100) ≥ 30% are considered unstable and should be interpreted as unreliable. An estimate is unstable if only a few respondents are represented with the specific characteristics and/or disease and (small numerator), thus, represented by a large standard error relative to the estimate.

23 | P a g e
References 1. Centers for Disease Control and Prevention. National Diabetes Statistics Report:
Estimates of Diabetes and Its Burden in the United States, 2014. Atlanta, GA: US Department of Health and Human Services, 2014. Accessed online on June 26, 2013 at: http://www.cdc.gov/diabetes/pubs/statsreport14/national-diabetes-report-web.pdf.
2. Centers for Disease Control and Prevention, National Diabetes Surveillance System. California - Total number (in thousands) of new cases of diagnosed diabetes among adults aged 18-76 years, 1996-2010. Accessed online on June 26, 2013 at: http://www.cdc.gov/diabetes/statistics
3. Boyle JP, Thompson TJ, Gregg EW, Barker LE, Williamson DF. Projection of the year 2050 burden of diabetes in the US adult population: dynamic modeling of incidence, mortality, and prediabetes prevalence. Popul Health Metr 2010;8:29.
4. California Health Interview Survey. CHIS 2011-2012 Adult Survey. Los Angeles, CA: UCLA Center for Health Policy Research, February 2014.
5. Centers for Disease Control and Prevention, National Center for Chronic Disease Prevention and Health Promotion, Office on Smoking and Health. The Health Consequences of Smoking—50 Years of Progress: A Report of the Surgeon General. Atlanta, GA: US Department of Health and Human Services, 2014.
6. California Arthritis Partnership Program. Arthritis and Physical Activity. Sacramento, CA: California Department of Public Health, 2013.
7. Centers for Disease Control and Prevention. National Chronic Kidney Disease Fact Sheet: General Information and National Estimates on Chronic Kidney Disease in the United States, 2014. Atlanta, GA: US Department of Health and Human Services, 2014.
8. Gregg EW, Li Y, Wang J, Burrows NR, Ali MK, Rolka D, et al. Changes in diabetes-related complications in the United States, 1990-2010. N Engl J Med 2014;370(16):1514-23.
9. Franco OH, Steyerberg EW, Hu FB, Mackenbach J, Nusselder W. Associations of diabetes mellitus with total life expectancy and life expectancy with and without cardiovascular disease. Arch Intern Med 2007;167(11):1145-51.
10. Centers for Disease Control and Prevention. National Diabetes Prevention Program. Accessed on June 26, 2014 at http://www.cdc.gov/diabetes/prevention/about.htm.
11. Centers for Disease Control and Prevention, National Center for Chronic Disease Prevention and Health Promotion, Division of Diabetes Translation. Diabetes - Success and Opportunities for Population-Based Prevention and Control, At A Glance 2011. US Department of Health and Human Services, 2011.
12. California Health Interview Survey. CHIS 2011-2012 Adult Survey. Los Angeles, CA: UCLA Center for Health Policy Research, February 2014.
13. California Health Interview Survey. What's New in the 2011-2012 California Health Interview Survey. Los Angeles, CA: UCLA Center for Health Policy Research, 2013.
14. California Department of Finance, Demographic Research Unit. Race/Ethnic Population with Age and Sex Detail, 2000–2010. Sacramento, CA: California Department of Finance, September 2012.
24 | P a g e
15. California Department of Finance, Demographic Research Unit. State and County Total Population Projections by Race/Ethnicity and Detailed Age, 2010-2060. Sacramento, CA: California Department of Finance, January 2013.
16. Klein RJ, Schoenborn CA. Age adjustment using the 2000 projected US population. Healthy People 2000 Stat Notes 2001(20):1-9.