1 Diabetes: The Burden of Disease Fall, 2007 NUR464.
31
1 Diabetes: The Burden of Disease Fall, 2007 NUR464
-
date post
20-Dec-2015 -
Category
Documents
-
view
216 -
download
1
Transcript of 1 Diabetes: The Burden of Disease Fall, 2007 NUR464.

1
Diabetes: The Burden of Disease
Fall, 2007
NUR464

2
Prevalence of Diabetes Is Escalating
2001
1990 1995
(Includes Gestational Diabetes)
Source: Mokdad A, et al. Diabetes Care. 2000;23:1278-1283; Mokdad A, et al. J Am Med Assoc. 2001;286:10; Mokdad A, et al. JAMA. 2003;289:76-79.
No Data < 4% 4%-6% 6%-8% 8%-10% > 10%
3
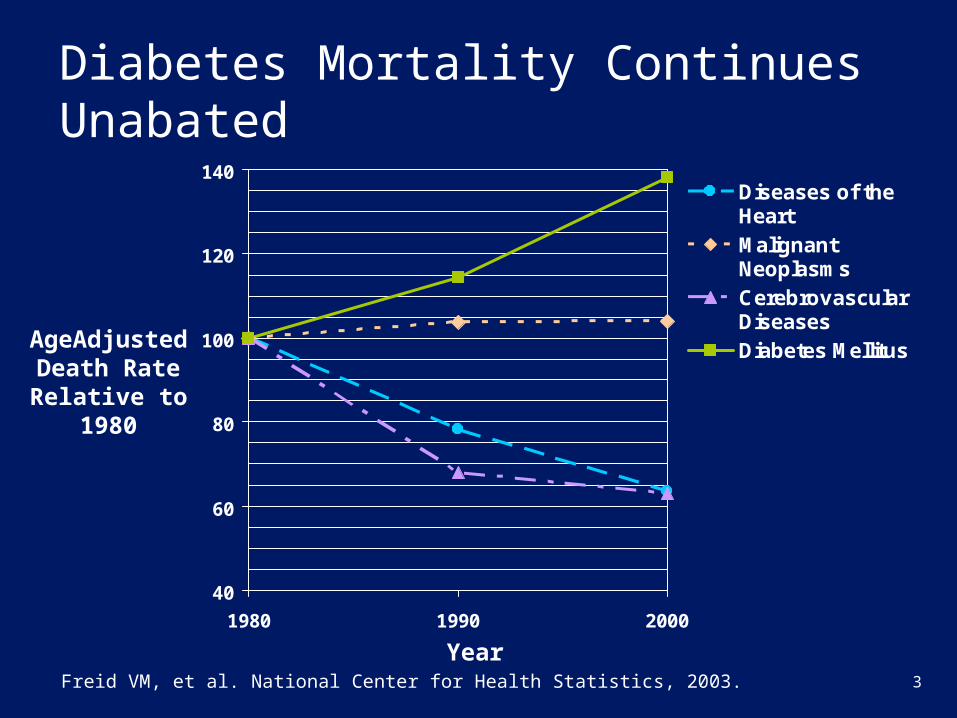
Diabetes Mortality Continues Unabated
YearFreid VM, et al. National Center for Health Statistics, 2003.
Age AdjustedDeath RateRelative to
1980
40
60
80
100
120
140
1980 1990 2000
Diseases of theHeartMalignantNeoplasmsCerebrovascularDiseasesDiabetes Mellitus
4
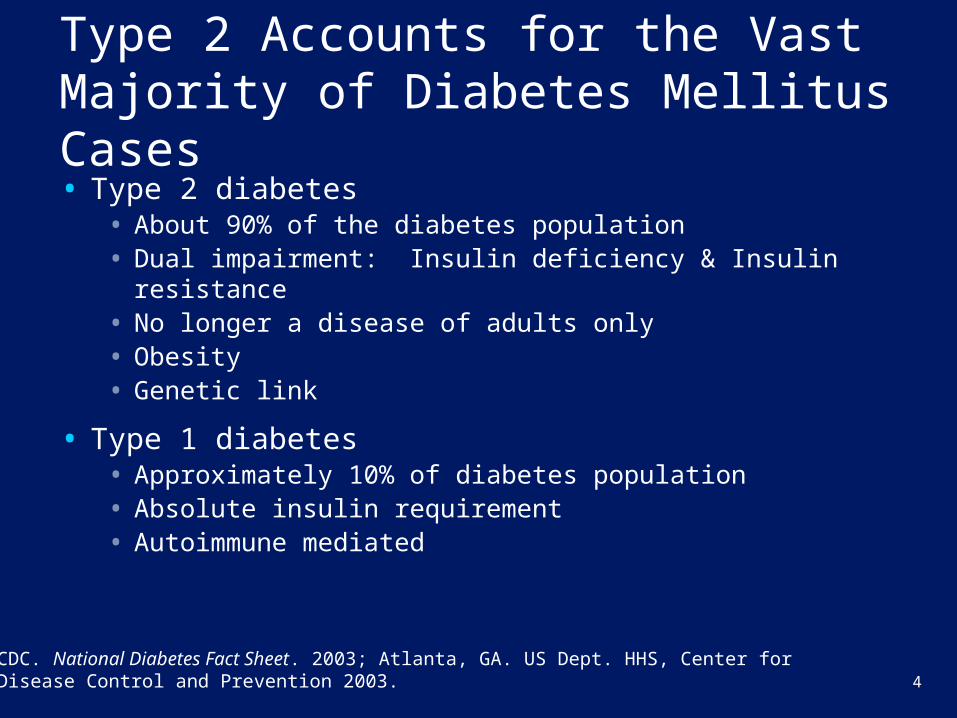
Type 2 Accounts for the Vast Majority of Diabetes Mellitus Cases• Type 2 diabetes
• About 90% of the diabetes population• Dual impairment: Insulin deficiency & Insulin resistance• No longer a disease of adults only• Obesity• Genetic link
• Type 1 diabetes• Approximately 10% of diabetes population• Absolute insulin requirement• Autoimmune mediated
CDC. National Diabetes Fact Sheet. 2003; Atlanta, GA. US Dept. HHS, Center for Disease Control and Prevention 2003.
5
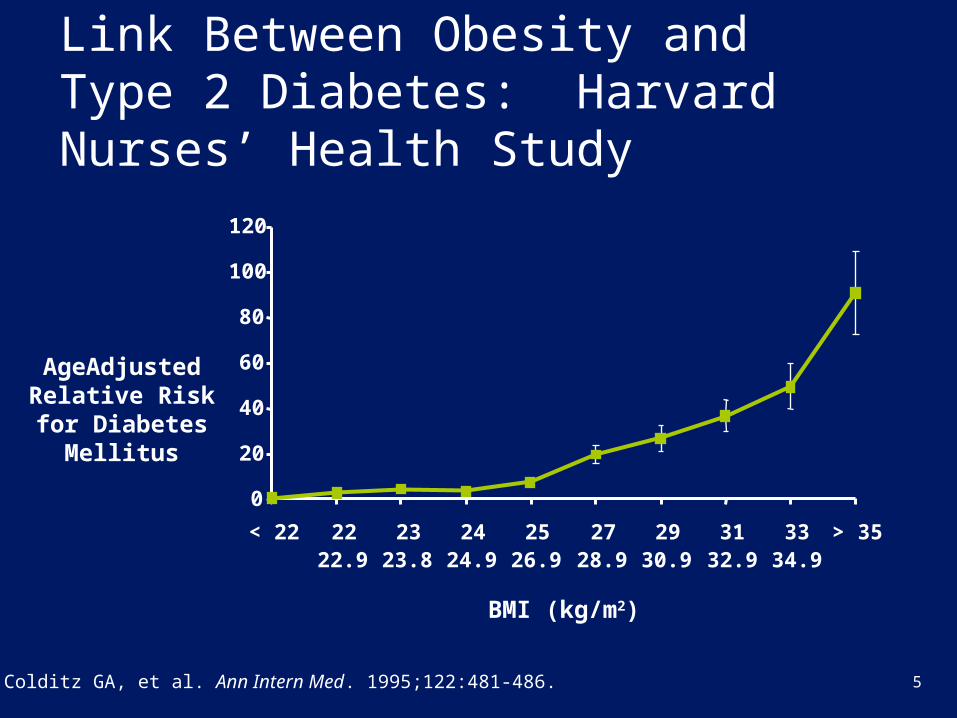
Link Between Obesity and Type 2 Diabetes: Harvard Nurses’ Health Study
Colditz GA, et al. Ann Intern Med. 1995;122:481-486.
0
20
40
60
80
100
120
< 22 22 22.9
23 23.8
24 24.9
25 26.9
27 28.9
29 30.9
31 32.9
33 34.9
> 35
BMI (kg/m2)
Age Adjusted Relative Risk for Diabetes Mellitus

6
2002 — Total Per Capita Health Care Expenditures
$13,243
$2,560
0
2,000
4,000
6,000
8,000
10,000
12,000
14,000
Dollars
Diabetes Without Diabetes
ADA. Diabetes Care. Mar. 2003;26(3):917-932.
7
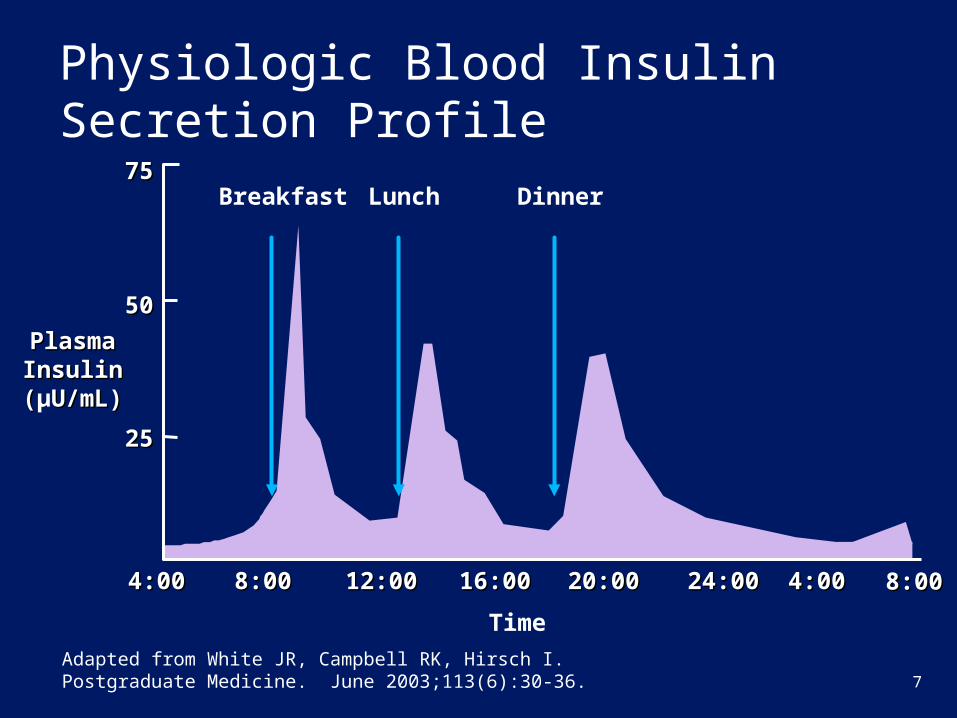
Physiologic Blood Insulin Secretion Profile
Plasma Plasma Insulin Insulin ((µU/mL) U/mL)
4:004:00
2525
5050
7575
8:008:00 12:0012:00 16:0016:00 20:00 20:00 24:0024:00 4:004:00
Breakfast Lunch Dinner
Time
8:008:00
Adapted from White JR, Campbell RK, Hirsch I. Postgraduate Medicine. June 2003;113(6):30-36.
8
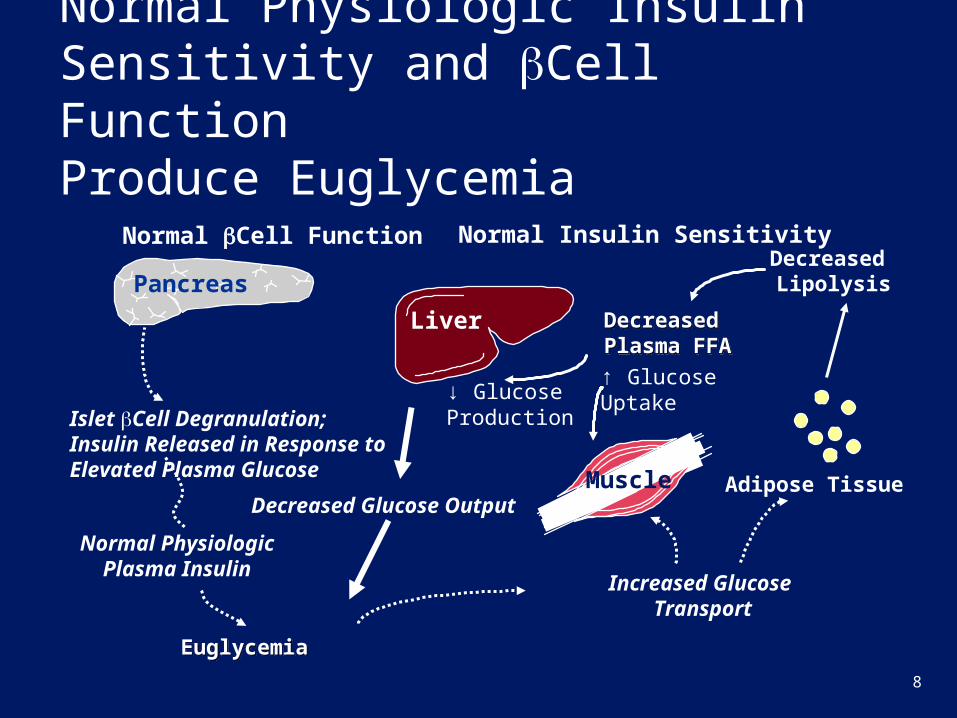
Normal Physiologic Insulin Sensitivity and Cell Function Produce Euglycemia
Pancreas
Normal Insulin Sensitivity
Liver
EuglycemiaEuglycemia
Islet Cell Degranulation;Insulin Released in Response to Elevated Plasma Glucose Muscle Adipose Tissue
Increased Glucose Transport
Decreased Lipolysis
↓ GlucoseProduction
↑ GlucoseUptake
Normal PhysiologicPlasma Insulin
Decreased Glucose Output
Normal Cell Function
Decreased Plasma FFADecreased Plasma FFA
9
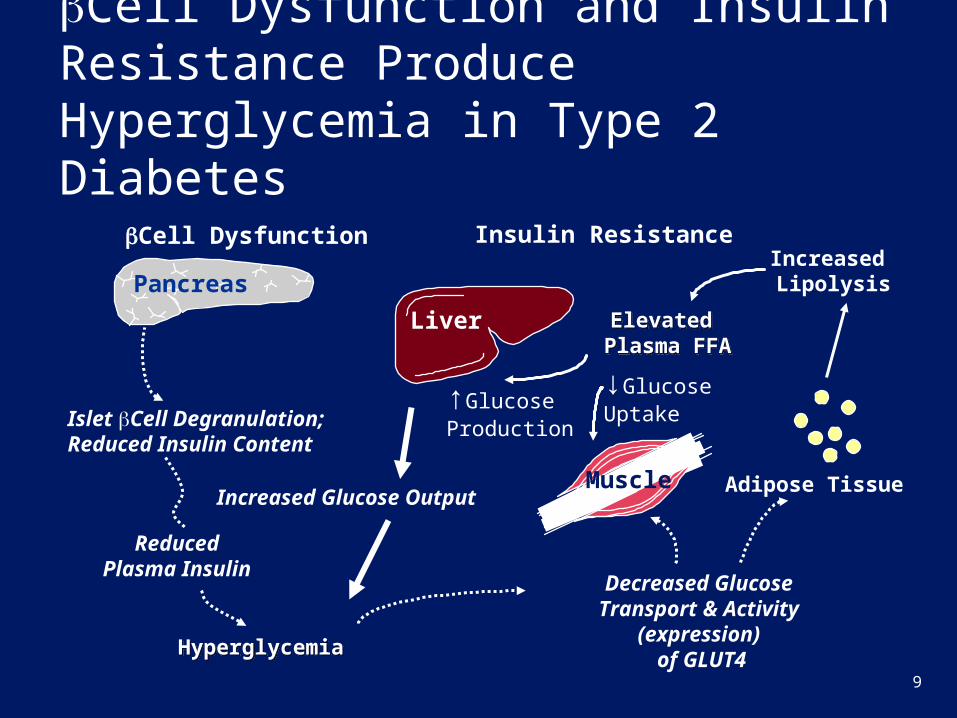
Cell Dysfunction and Insulin Resistance Produce Hyperglycemia in Type 2 Diabetes
Pancreas
Insulin Resistance
Liver
HyperglycemiaHyperglycemia
Islet Cell Degranulation;Reduced Insulin Content
Muscle Adipose Tissue
Decreased Glucose Transport & Activity
(expression) of GLUT4
Increased Lipolysis
↑GlucoseProduction
↓GlucoseUptake
ReducedPlasma Insulin
Increased Glucose Output
Cell Dysfunction
Elevated Plasma FFA
Elevated Plasma FFA
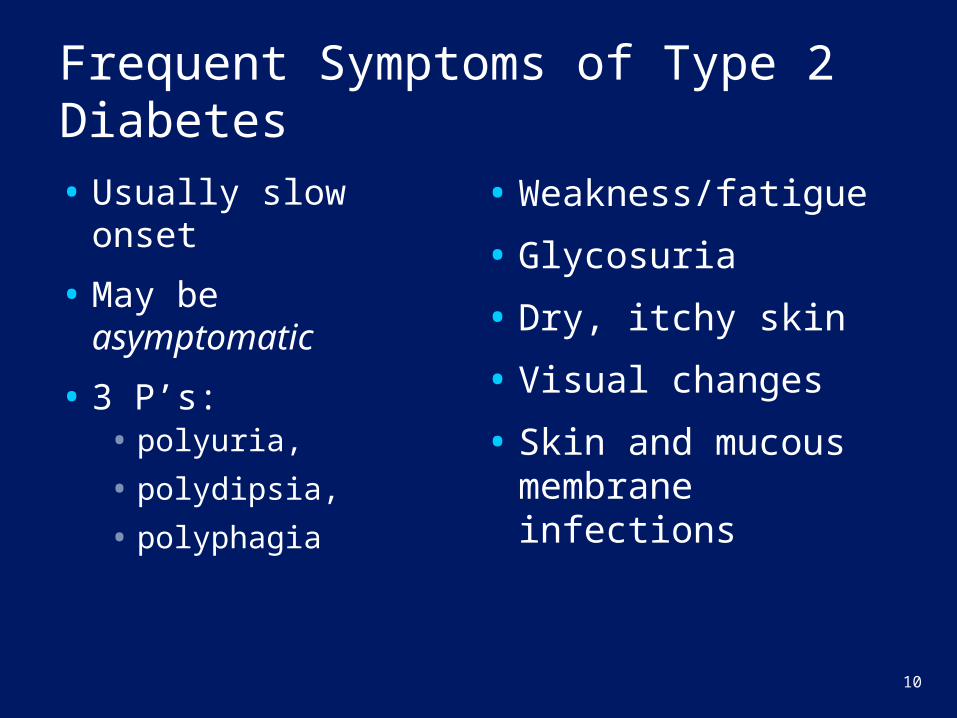
10
Frequent Symptoms of Type 2 Diabetes
• Usually slow onset
• May be asymptomatic
• 3 P’s: • polyuria,
• polydipsia,
• polyphagia
• Weakness/fatigue
• Glycosuria
• Dry, itchy skin
• Visual changes
• Skin and mucous membrane infections
11
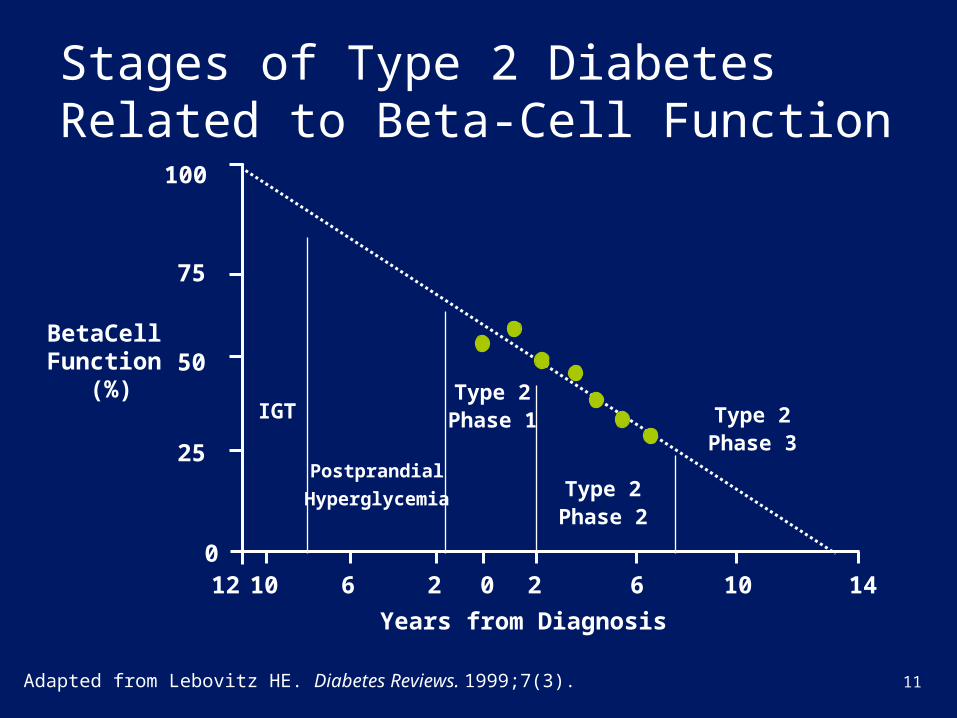
Stages of Type 2 Diabetes Related to Beta-Cell Function
Adapted from Lebovitz HE. Diabetes Reviews. 1999;7(3).
2 12 2 10 6 0 6 10 14
Beta Cell Function
(%)
0
50
100
75
25
Type 2Phase 1IGT
Years from Diagnosis
Type 2Phase 2
Type 2Phase 3
Postprandial
Hyperglycemia
12
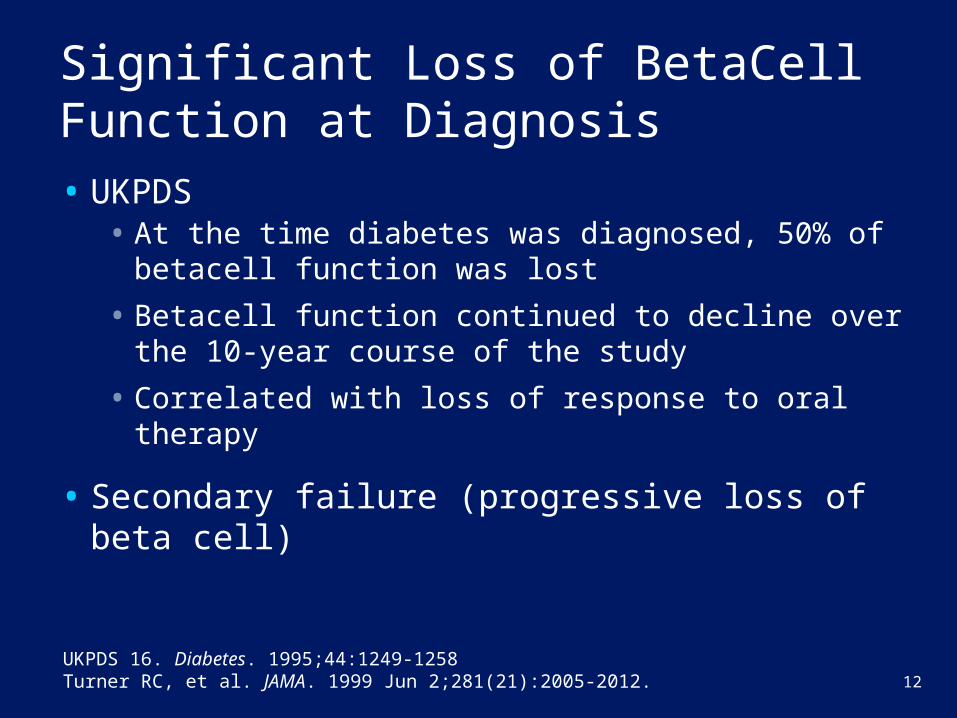
Significant Loss of Beta Cell Function at Diagnosis
• UKPDS• At the time diabetes was diagnosed, 50% of beta cell
function was lost
• Beta cell function continued to decline over the 10-year course of the study
• Correlated with loss of response to oral therapy
• Secondary failure (progressive loss of beta cell)
UKPDS 16. Diabetes. 1995;44:1249-1258 Turner RC, et al. JAMA. 1999 Jun 2;281(21):2005-2012.
13
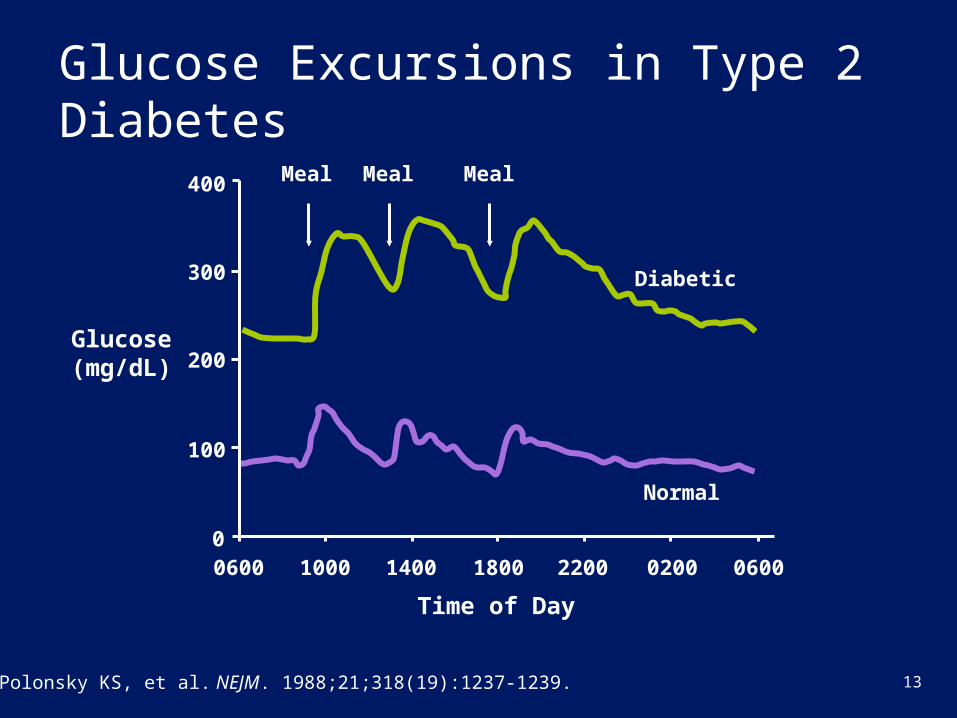
Glucose Excursions in Type 2 Diabetes
Time of Day
400
300
200
100
00600 06001000 1400 1800 2200 0200
Glucose(mg/dL)
Diabetic
Normal
Polonsky KS, et al. NEJM. 1988;21;318(19):1237-1239.
Meal Meal Meal
14
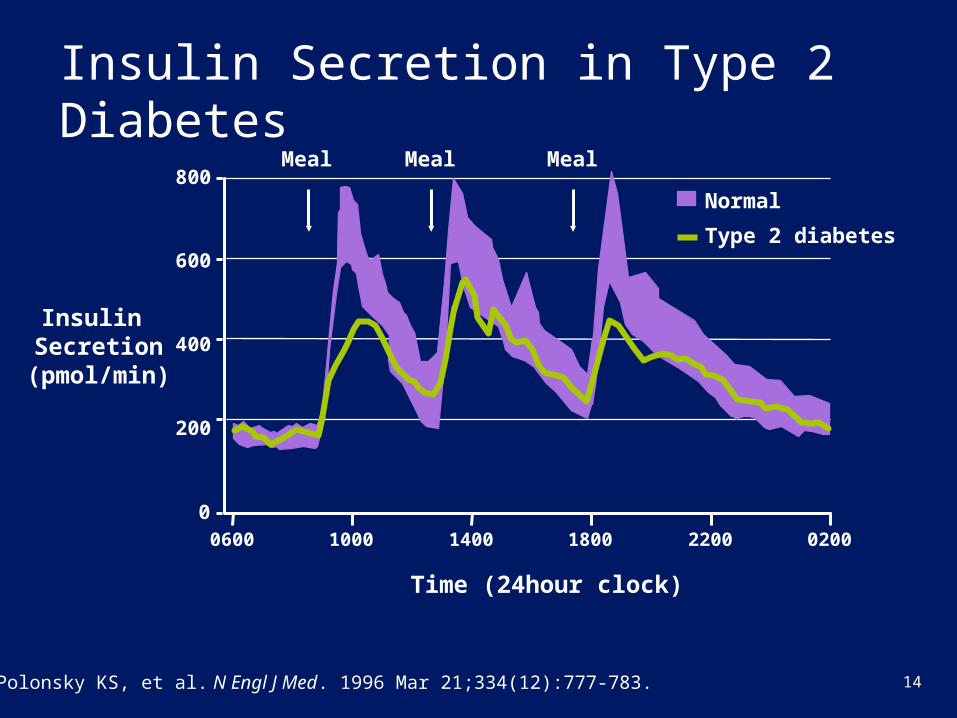
Insulin Secretion in Type 2 Diabetes
Polonsky KS, et al. N Engl J Med. 1996 Mar 21;334(12):777-783.
Normal
Type 2 diabetes
Time (24 hour clock)
0600 1000 1400 1800 2200 0200
800
600
400
200
0
Insulin Secretion
(pmol/min)
Meal Meal Meal
15
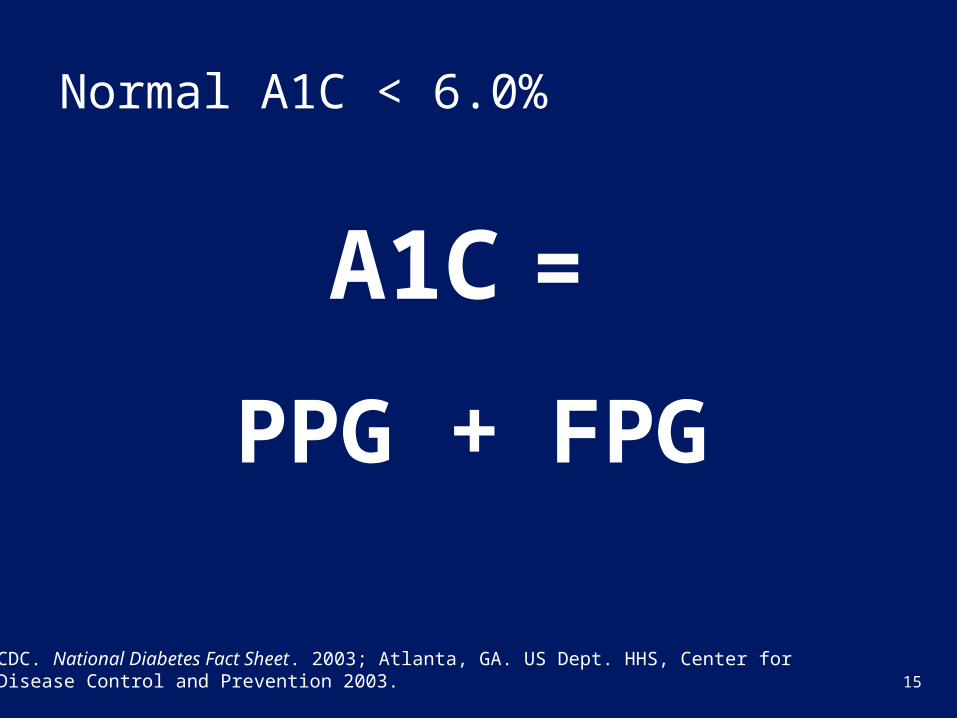
A1C
PPG FPG+
=
Normal A1C < 6.0%
CDC. National Diabetes Fact Sheet. 2003; Atlanta, GA. US Dept. HHS, Center for Disease Control and Prevention 2003.
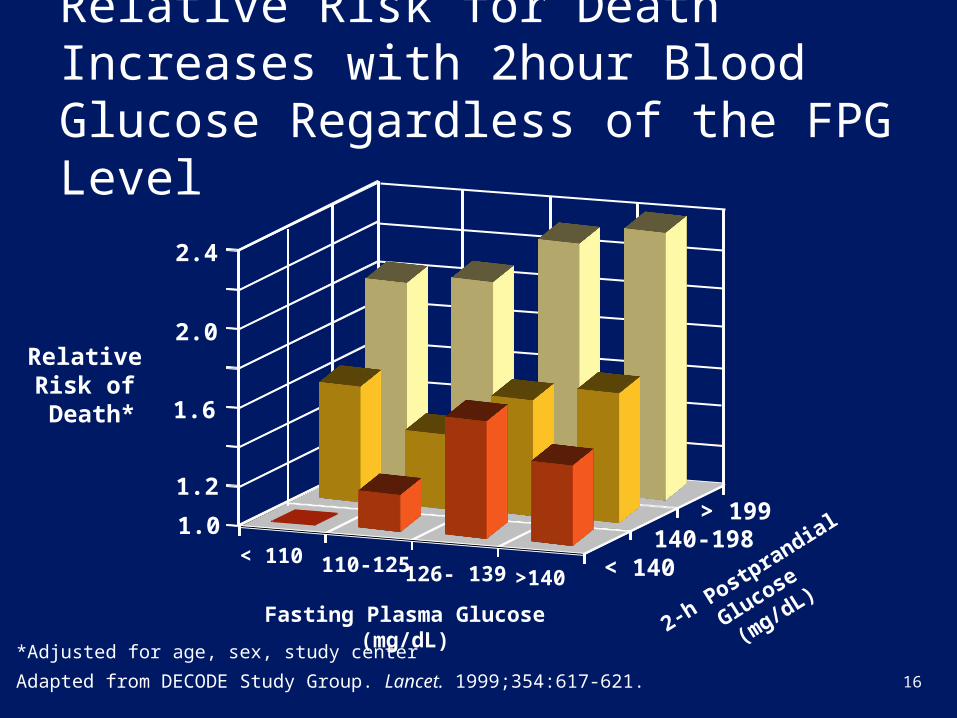
16
2.4
2.0
1.6
1.2
1.0
Relative Risk of Death*
< 140
> 199
< 110 110-125 126- 139 >140
140-198
2-h Postprandial Glucose
(mg/dL)
Fasting Plasma Glucose (mg/dL)
Relative Risk for Death Increases with 2 hour Blood Glucose Regardless of the FPG Level
*Adjusted for age, sex, study center
Adapted from DECODE Study Group. Lancet. 1999;354:617-621.
17
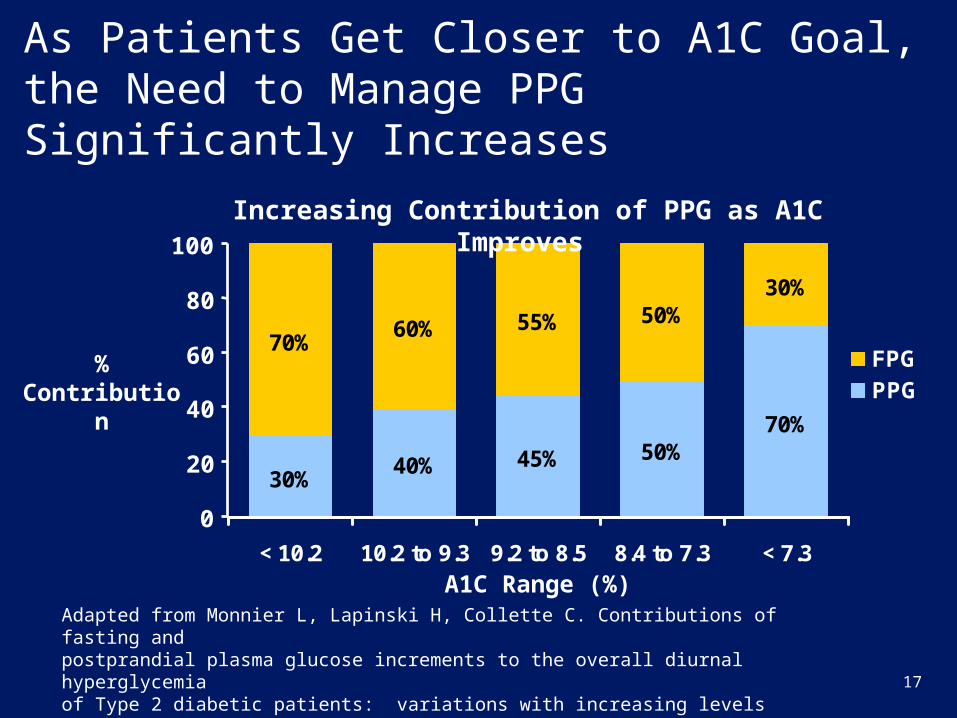
As Patients Get Closer to A1C Goal, the Need to Manage PPG Significantly Increases
Adapted from Monnier L, Lapinski H, Collette C. Contributions of fasting and postprandial plasma glucose increments to the overall diurnal hyperglycemia of Type 2 diabetic patients: variations with increasing levels of HBA(1c). Diabetes Care. 2003;26:881-885.
30%40% 45% 50%
70%
70%60% 55% 50%
30%
< 10.2 10.2 to 9.3 9.2 to 8.5 8.4 to 7.3 < 7.3
FPGPPG
Increasing Contribution of PPG as A1C Improves
% Contribution
0
20
40
60
80
100
A1C Range (%)
18
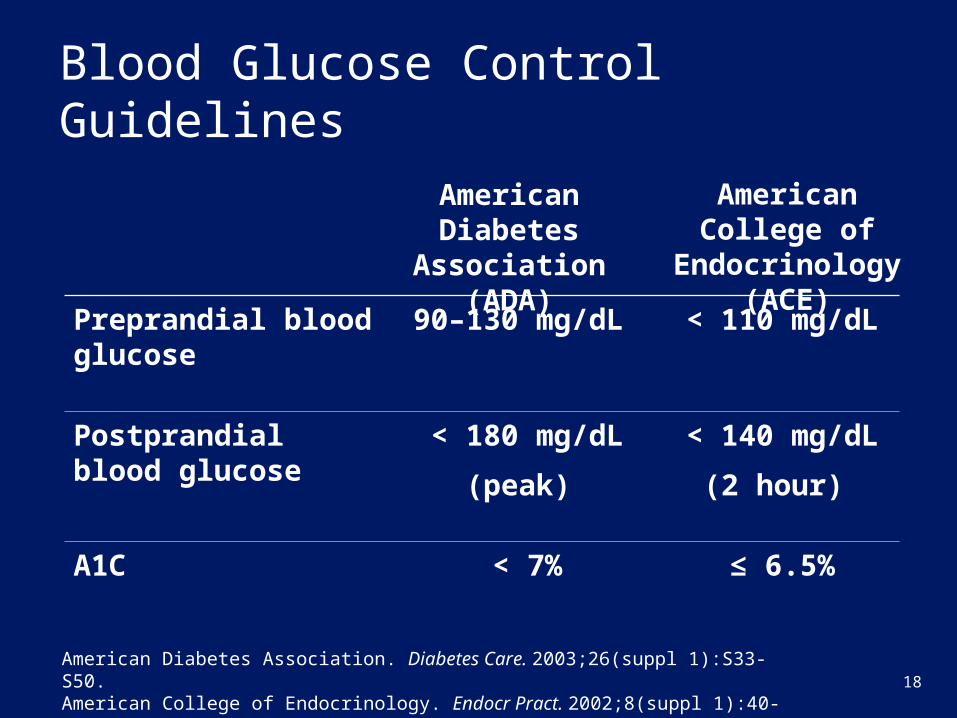
Blood Glucose Control Guidelines
American Diabetes Association. Diabetes Care. 2003;26(suppl 1):S33-S50.American College of Endocrinology. Endocr Pract. 2002;8(suppl 1):40-82.
Preprandial blood glucose
90–130 mg/dL < 110 mg/dL
Postprandial blood glucose
< 180 mg/dL
(peak)
< 140 mg/dL
(2 hour)
A1C < 7% ≤ 6.5%
American Diabetes Association
(ADA)
American College of Endocrinology
(ACE)
19
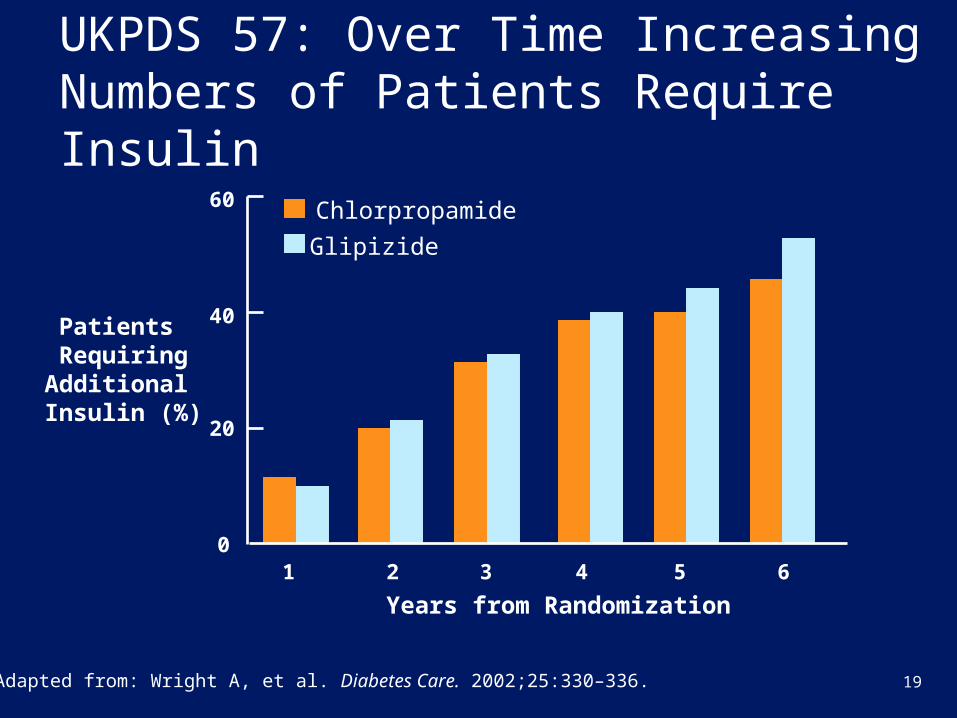
UKPDS 57: Over Time Increasing Numbers of Patients Require Insulin
Patients Requiring Additional Insulin (%)
Adapted from: Wright A, et al. Diabetes Care. 2002;25:330–336.
20
40
60
01 2 4 5
Years from Randomization
3 6
Chlorpropamide
Glipizide
20
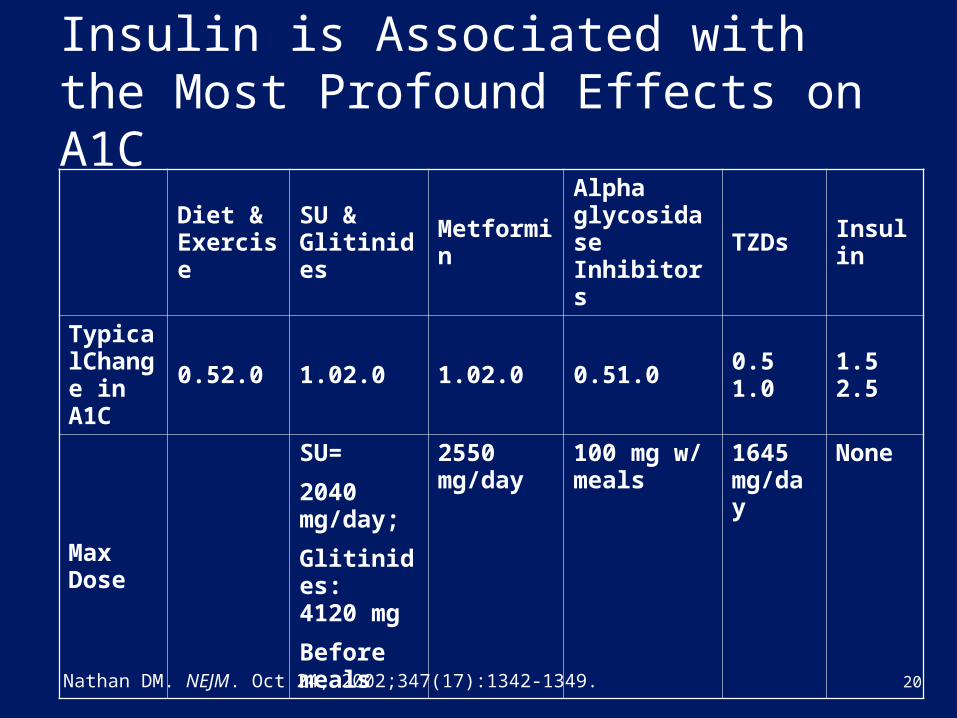
Insulin is Associated with the Most Profound Effects on A1C
Diet & Exercise
SU & Glitinides
MetforminAlpha glycosidase Inhibitors
TZDs Insulin
TypicalChange in A1C
0.5 2.0 1.0 2.0 1.0 2.0 0.5 1.0 0.5 1.0 1.5 2.5
Max Dose
SU=
20 40 mg/day;
Glitinides:4 120 mg
Before meals
2550mg/day
100 mg w/ meals
16 45 mg/day
None
Nathan DM. NEJM. Oct 24, 2002;347(17):1342-1349.
21
Human Insulins
• Regular
• Neutral Protamine Hagedorn (NPH)
• Premix 70/30 (70% NPH / 30% Regular)
22
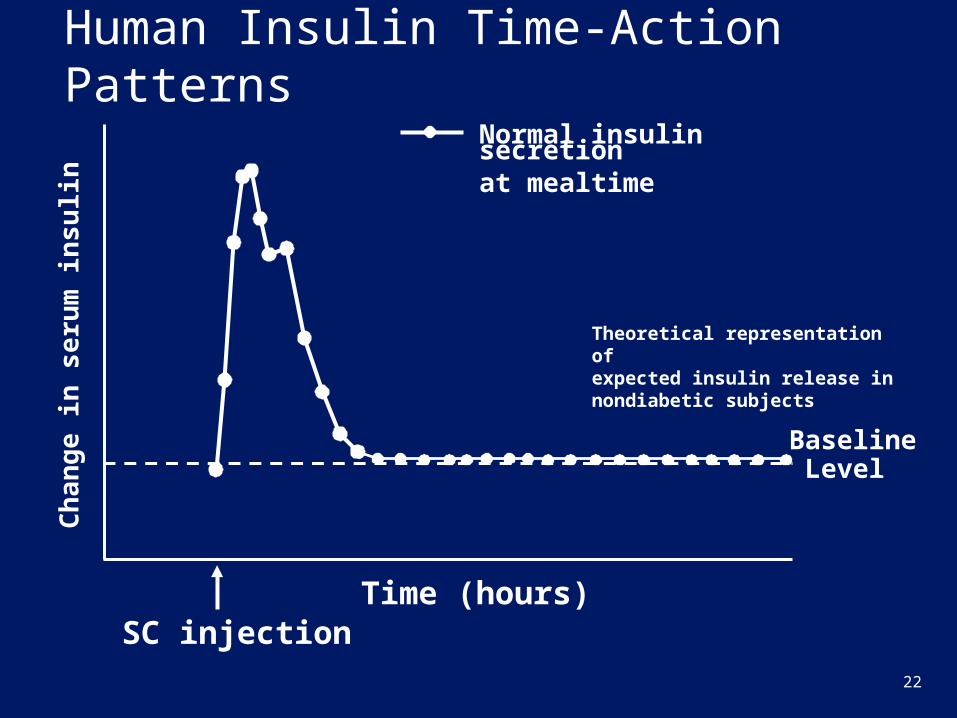
Human Insulin Time-Action Patterns
Time (hours) SC injection
Normal insulin secretionat mealtime
Ch
an
ge
in s
eru
m in
su
lin
Baseline Level
Theoretical representation of expected insulin release in nondiabetic subjects
23
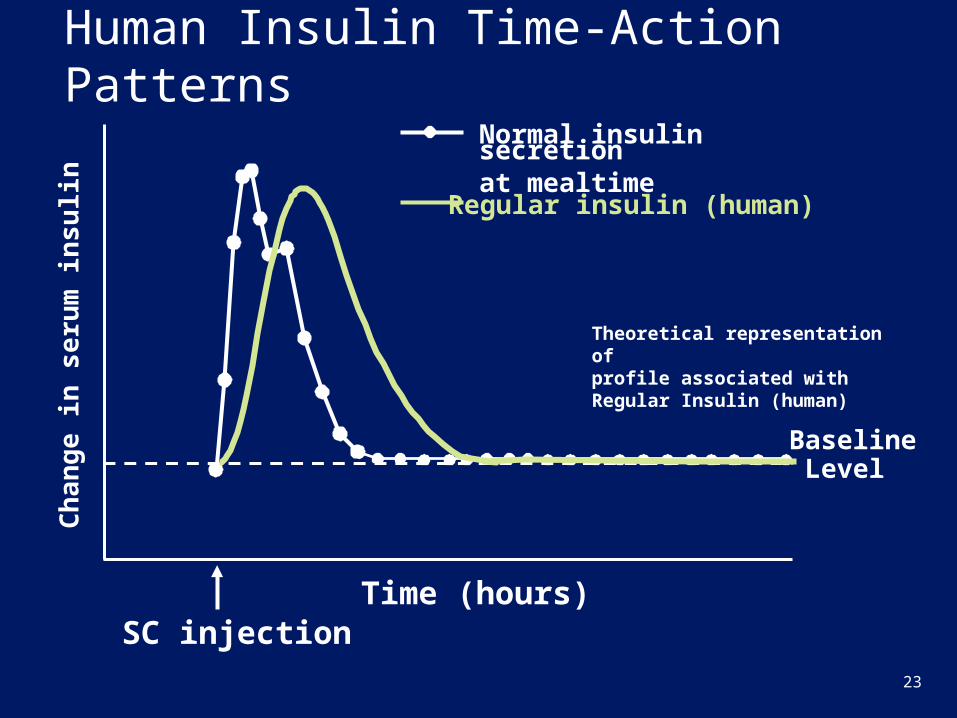
Human Insulin Time-Action Patterns
Time (hours) SC injection
Normal insulin secretionat mealtime
Regular insulin (human)
Baseline Level
Theoretical representation of profile associated with Regular Insulin (human)
Ch
an
ge
in s
eru
m in
su
lin
24
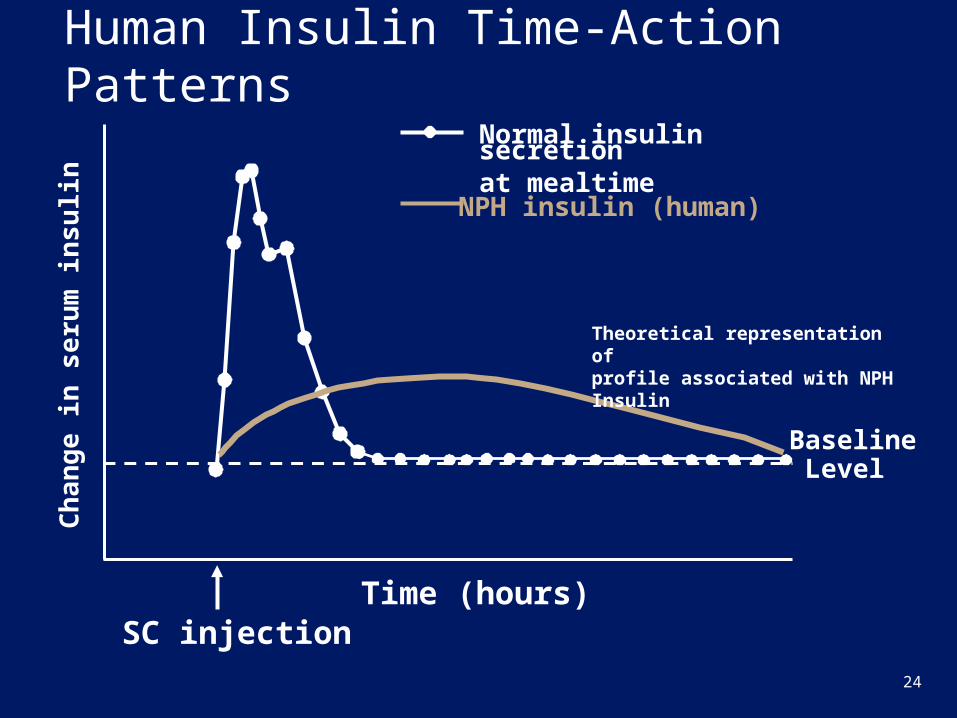
Human Insulin Time-Action Patterns
Time (hours) SC injection
Normal insulin secretionat mealtime
NPH insulin (human)
Baseline Level
Theoretical representation of profile associated with NPH Insulin
Ch
an
ge
in s
eru
m in
su
lin
25
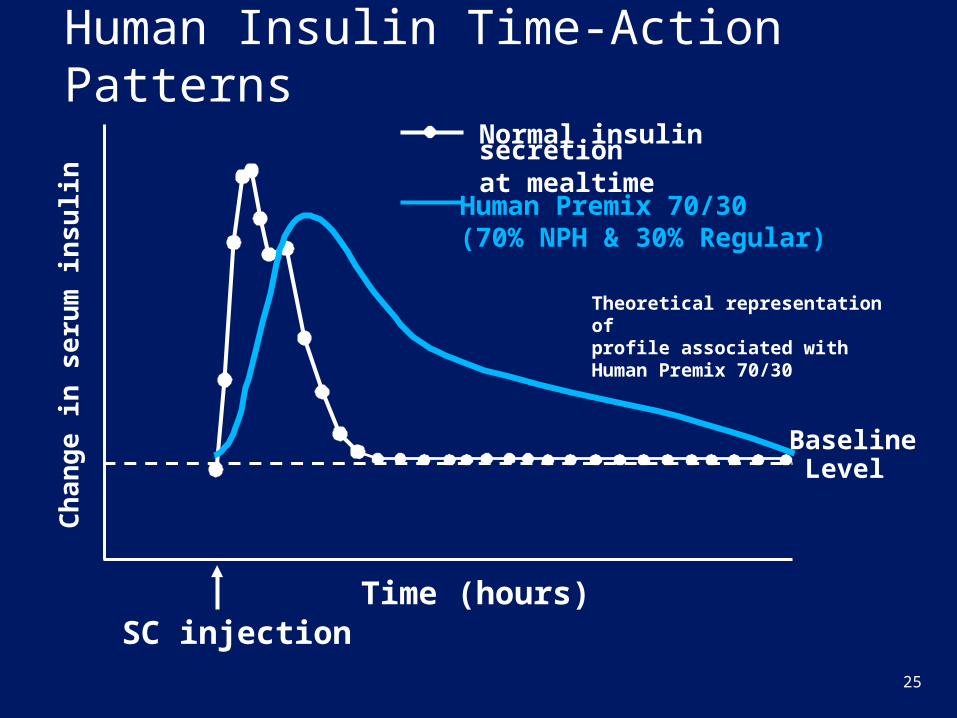
Human Insulin Time-Action Patterns
Time (hours) SC injection
Normal insulin secretionat mealtime
Human Premix 70/30 (70% NPH & 30% Regular)
Baseline Level
Theoretical representation of profile associated with Human Premix 70/30
Ch
an
ge
in s
eru
m in
su
lin
26
Analog Insulins
• Rapid-acting
• Basal
• Premix
27
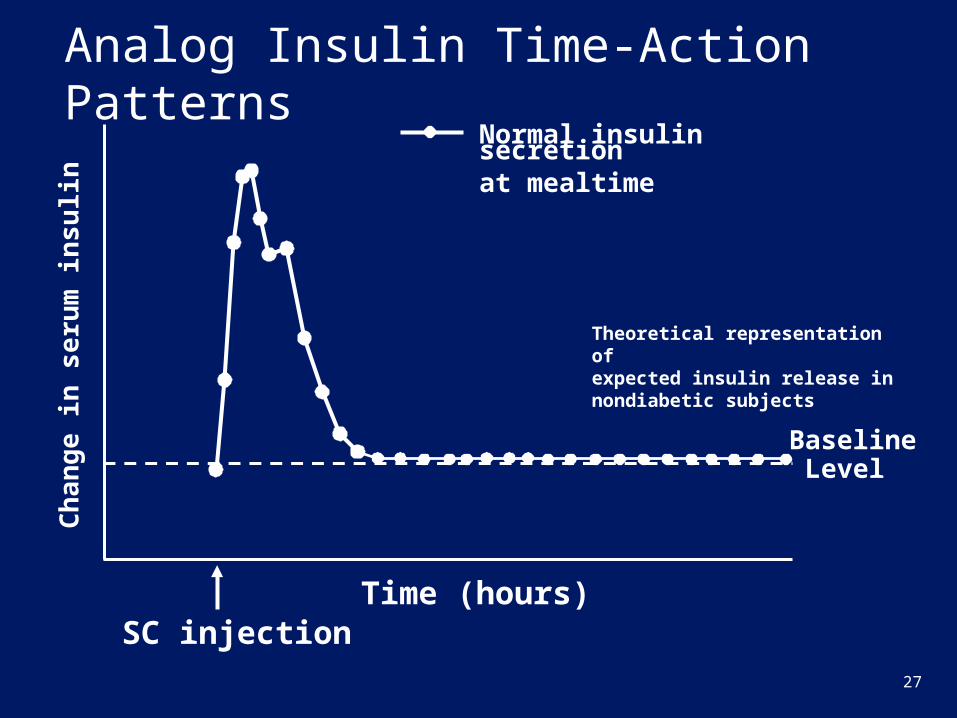
Analog Insulin Time-Action Patterns
Time (hours) SC injection
Normal insulin secretionat mealtime
Baseline Level
Theoretical representation of expected insulin release in nondiabetic subjects
Ch
an
ge
in s
eru
m in
su
lin

28
Analog Insulin Time-Action Patterns
Time (hours) SC injection
Normal insulin secretionat mealtime
Baseline Level
Theoretical representation of profile associated with rapid-acting Insulin Analog
Ch
an
ge
in s
eru
m in
su
lin
Rapid-Acting Insulin Analog

29
Analog Insulin Time-Action Patterns
Time (hours) SC injection
Normal insulin secretionat mealtime
QD (basal) Analog Insulin
Baseline Level
Theoretical representation of profile associated with Basal Analog Insulin
Ch
an
ge
in s
eru
m in
su
lin
30
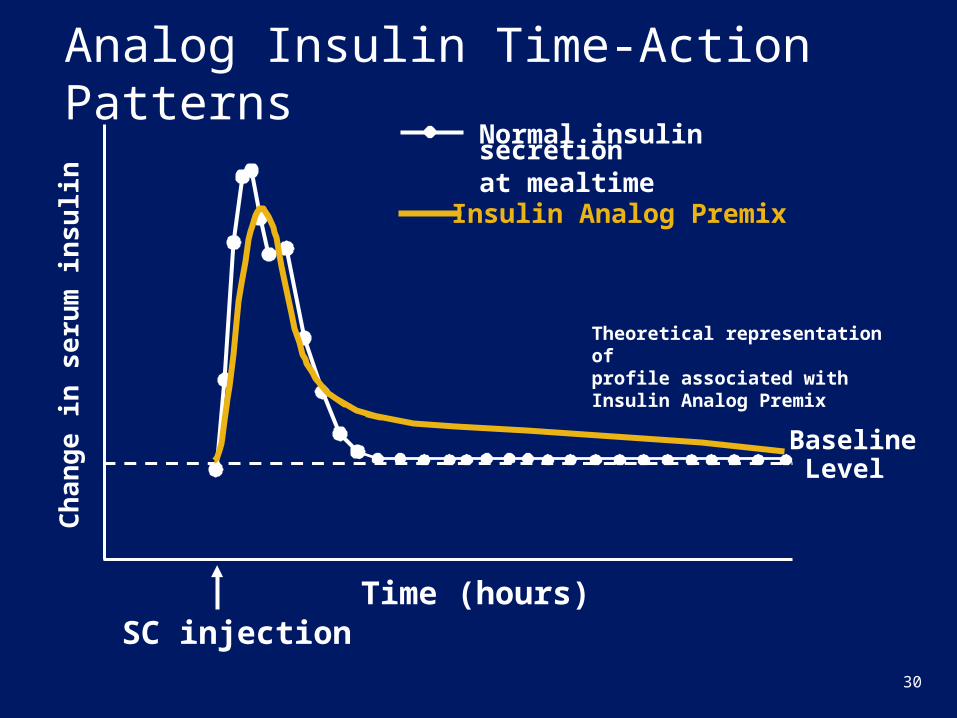
Analog Insulin Time-Action Patterns
Time (hours) SC injection
Normal insulin secretionat mealtime
Baseline Level
Theoretical representation of profile associated with Insulin Analog Premix
Ch
an
ge
in s
eru
m in
su
lin
Insulin Analog Premix
31
“Although insulin therapy has not traditionally been implemented early
in the course of Type 2 diabetes, there is no reason why it should not be…”
Nathan DM. NEJM. Oct 24, 2002;347(17):1342-1349.