The 2011 Burden of Diabetes in Wisconsin · The 2011 Burden of Diabetes in Wisconsin 2010...
99
The 2011 Burden of Diabetes in Wisconsin
-
Upload
phungkhanh -
Category
Documents
-
view
213 -
download
0
Transcript of The 2011 Burden of Diabetes in Wisconsin · The 2011 Burden of Diabetes in Wisconsin 2010...
The 2011 Burden
of Diabetes
in Wisconsin

DIVISION OF PUBLIC HEALTH 1 WEST WILSON STREET P O BOX 2659 Scott K. Walker MADISON WI 53701-2659 Governor State of Wisconsin 608-266-1251 Dennis G. Smith FAX: 608-267-2832 Secretary TTY: 888-701-1253 Department of Health Services dhs.wisconsin.gov
Wisconsin.gov
September 2011 Dear Diabetes Partner: The Wisconsin Diabetes Prevention and Control Program (DPCP), a program of the Wisconsin Department of Health Services, Division of Public Health, is pleased to provide your organization with the updated version of the Burden of Diabetes in Wisconsin. This resource is printed by DPCP partners: American Diabetes Association Wisconsin Area, National Kidney Foundation of Wisconsin, and Wisconsin Lions Foundation. This 2011 report provides key data for the entire state, with analysis by county, Department of Health Services region, race/ethnicity, and children and adolescents. COMPARED TO THREE YEARS AGO, THE NEW WISCONSIN DATA SHOW:
1) Overall prevalence of diabetes and pre-diabetes for Wisconsin has increased: • Adult prevalence increased more than 13% from 419,870 to 475,090 • The age-adjusted percentage of adults with diabetes increased from 9.6% to 10.1% • Pre-diabetes increased 37%, with an estimated 1.46 million Wisconsin adults 20 years and older having pre-
diabetes
2) Related societal costs have increased substantially as well: • Diabetes-related hospitalization charges increased more than 28% from $2.0 billion to $2.5 billion • Overall estimated costs of diabetes in adults has increased 17% from $5.19 billion to $6.10 billion
These dramatic increases over the past three years demonstrate the importance for each of us to renew our commitment to recognize, prevent, and control diabetes in Wisconsin. Questions regarding information contained in this report can be directed to Jenny Camponeschi, MS, Epidemiologist for the Wisconsin DPCP at (608) 267-1449 or [email protected].
Order additional copies of this report online at: http://4.selectsurvey.net/DHS/TakeSurvey.aspx?SurveyID=96ML49l4
Download and fax the Diabetes Prevention and Control Program Resource Materials Request: http://www.dhs.wisconsin.gov/forms/F4/F43008.pdf.
Our hope is that this report will guide efforts to reduce the burden of diabetes in Wisconsin and benefit you, the organization you represent, and all persons with diabetes in Wisconsin. Sincerely, Leah Ludlum, RN, BSN, CDE, Director William Weis, DPM, FACFAS, CWS Diabetes Prevention and Control Program Chair Wisconsin Department of Health Services Wisconsin Diabetes Advisory Group
Jenny Camponeschi, MS, Epidemiologist Diabetes Prevention and Control Program Wisconsin Department of Health Services
The 2011 Burden of Diabetes in
Wisconsin
2010 Hospitalizations - Wisconsin
Total Number
Number Diabetes-related (% of total)
Total Charges
Diabetes-related Charges (% of total charges)
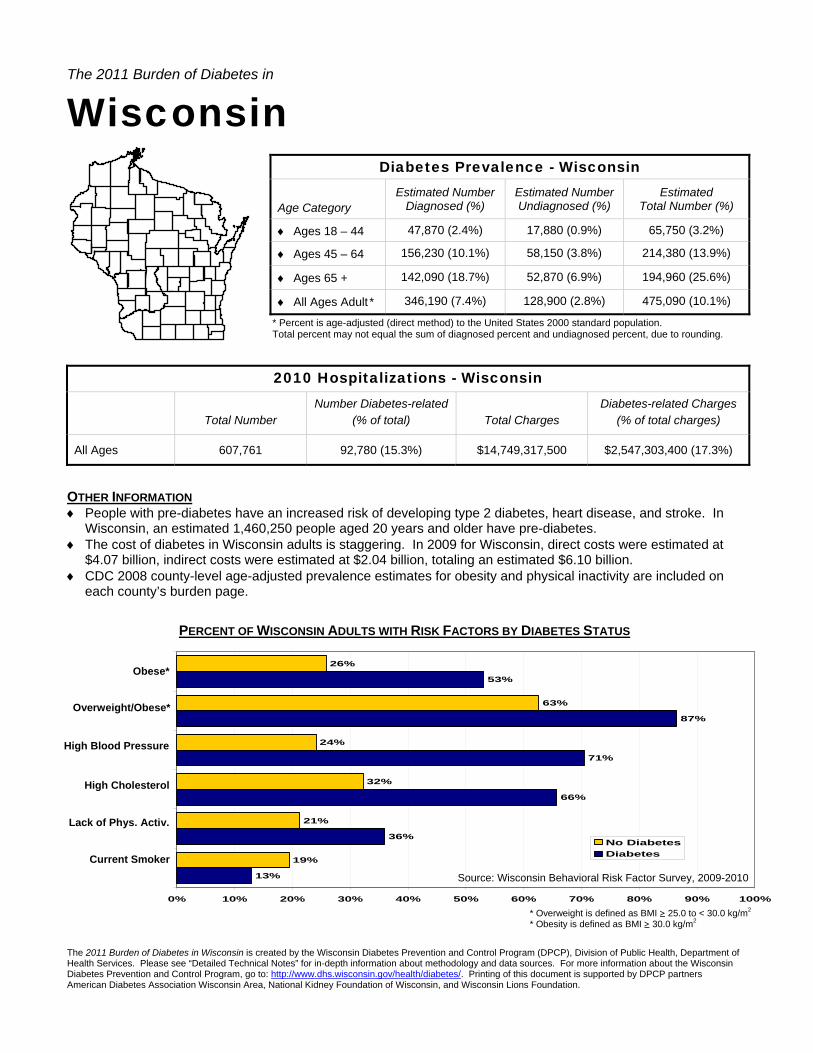
All Ages 607,761 92,780 (15.3%) $14,749,317,500 $2,547,303,400 (17.3%)
OTHER INFORMATION ♦ People with pre-diabetes have an increased risk of developing type 2 diabetes, heart disease, and stroke. In
Wisconsin, an estimated 1,460,250 people aged 20 years and older have pre-diabetes. ♦ The cost of diabetes in Wisconsin adults is staggering. In 2009 for Wisconsin, direct costs were estimated at
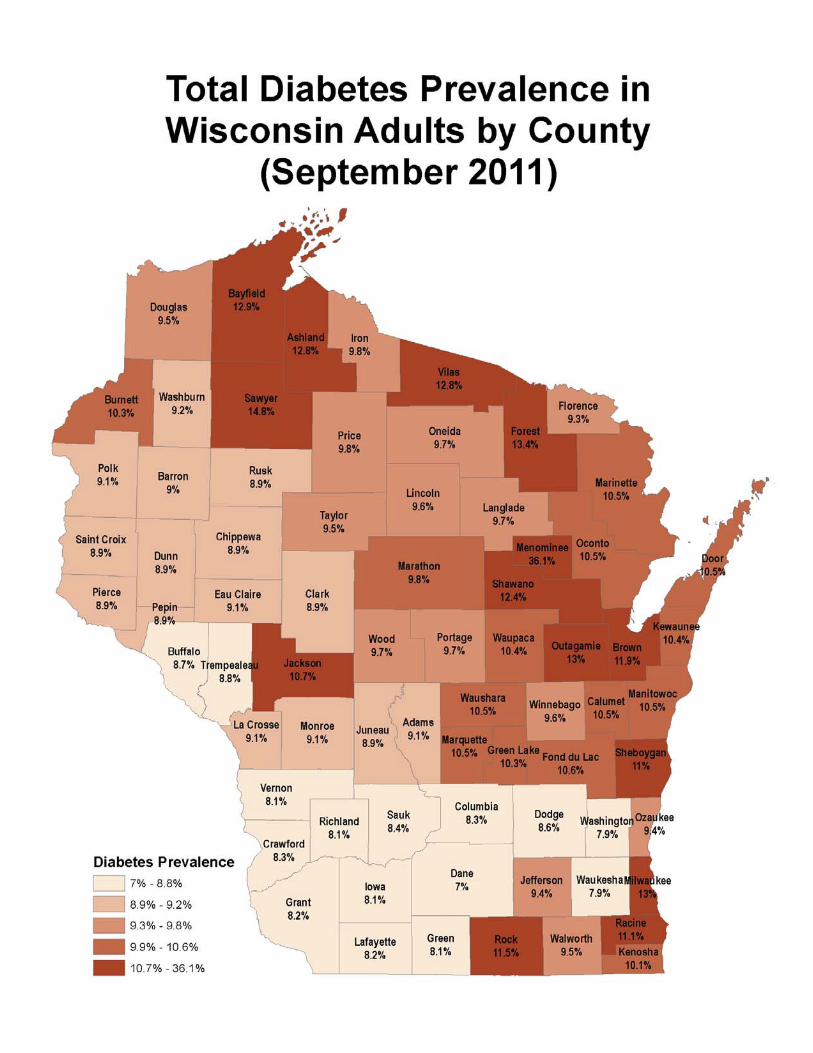
$4.07 billion, indirect costs were estimated at $2.04 billion, totaling an estimated $6.10 billion. ♦ CDC 2008 county-level age-adjusted prevalence estimates for obesity and physical inactivity are included on
each county’s burden page.
PERCENT OF WISCONSIN ADULTS WITH RISK FACTORS BY DIABETES STATUS
The 2011 Burden of Diabetes in Wisconsin is created by the Wisconsin Diabetes Prevention and Control Program (DPCP), Division of Public Health, Department of Health Services. Please see “Detailed Technical Notes” for in-depth information about methodology and data sources. For more information about the Wisconsin Diabetes Prevention and Control Program, go to: http://www.dhs.wisconsin.gov/health/diabetes/. Printing of this document is supported by DPCP partners American Diabetes Association Wisconsin Area, National Kidney Foundation of Wisconsin, and Wisconsin Lions Foundation.
Diabetes Prevalence - Wisconsin Age Category
Estimated Number Diagnosed (%)
Estimated Number Undiagnosed (%)
Estimated Total Number (%)
♦ Ages 18 – 44 47,870 (2.4%) 17,880 (0.9%) 65,750 (3.2%)
♦ Ages 45 – 64 156,230 (10.1%) 58,150 (3.8%) 214,380 (13.9%)
♦ Ages 65 + 142,090 (18.7%) 52,870 (6.9%) 194,960 (25.6%)
♦ All Ages Adult * 346,190 (7.4%) 128,900 (2.8%) 475,090 (10.1%)
* Percent is age-adjusted (direct method) to the United States 2000 standard population. Total percent may not equal the sum of diagnosed percent and undiagnosed percent, due to rounding.
* Overweight is defined as BMI ≥ 25.0 to < 30.0 kg/m2 * Obesity is defined as BMI ≥ 30.0 kg/m2
13%
36%
66%
71%
87%
53%
19%
21%
32%
24%
63%
26%
0% 10% 20% 30% 40% 50% 60% 70% 80% 90% 100%
6
5
4
3
2
1
No DiabetesDiabetes
Obese*
Overweight/Obese*
High Blood Pressure
High Cholesterol
Lack of Phys. Activ.
Current Smoker
Source: Wisconsin Behavioral Risk Factor Survey, 2009-2010
The 2011 Burden of Diabetes in
Northeastern Region
2010 Hospitalizations - Northeastern Region
Total Number
Number Diabetes-related (% of total)
Total Charges
Diabetes-related Charges (% of total charges)
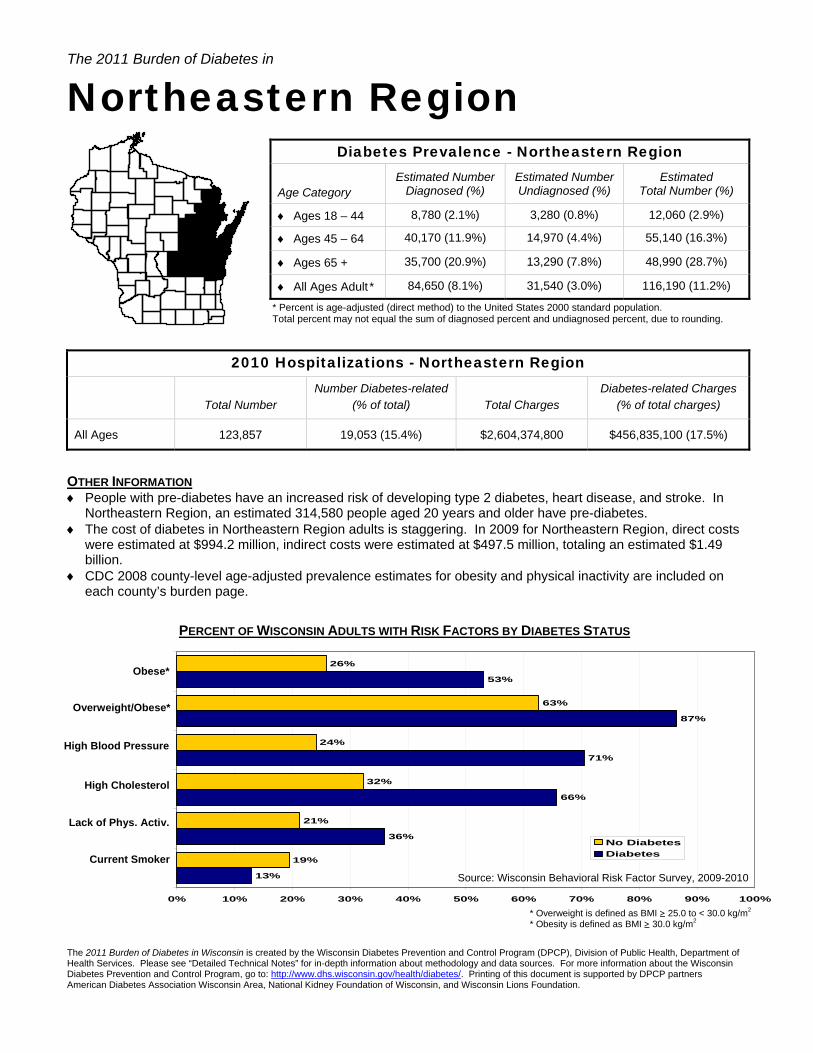
All Ages 123,857 19,053 (15.4%) $2,604,374,800 $456,835,100 (17.5%)
OTHER INFORMATION ♦ People with pre-diabetes have an increased risk of developing type 2 diabetes, heart disease, and stroke. In
Northeastern Region, an estimated 314,580 people aged 20 years and older have pre-diabetes. ♦ The cost of diabetes in Northeastern Region adults is staggering. In 2009 for Northeastern Region, direct costs
were estimated at $994.2 million, indirect costs were estimated at $497.5 million, totaling an estimated $1.49 billion.
♦ CDC 2008 county-level age-adjusted prevalence estimates for obesity and physical inactivity are included on each county’s burden page.
PERCENT OF WISCONSIN ADULTS WITH RISK FACTORS BY DIABETES STATUS
The 2011 Burden of Diabetes in Wisconsin is created by the Wisconsin Diabetes Prevention and Control Program (DPCP), Division of Public Health, Department of Health Services. Please see “Detailed Technical Notes” for in-depth information about methodology and data sources. For more information about the Wisconsin Diabetes Prevention and Control Program, go to: http://www.dhs.wisconsin.gov/health/diabetes/. Printing of this document is supported by DPCP partners American Diabetes Association Wisconsin Area, National Kidney Foundation of Wisconsin, and Wisconsin Lions Foundation.
Diabetes Prevalence - Northeastern Region Age Category
Estimated Number Diagnosed (%)
Estimated Number Undiagnosed (%)
Estimated Total Number (%)
♦ Ages 18 – 44 8,780 (2.1%) 3,280 (0.8%) 12,060 (2.9%)
♦ Ages 45 – 64 40,170 (11.9%) 14,970 (4.4%) 55,140 (16.3%)
♦ Ages 65 + 35,700 (20.9%) 13,290 (7.8%) 48,990 (28.7%)
♦ All Ages Adult * 84,650 (8.1%) 31,540 (3.0%) 116,190 (11.2%)
* Percent is age-adjusted (direct method) to the United States 2000 standard population. Total percent may not equal the sum of diagnosed percent and undiagnosed percent, due to rounding.
* Overweight is defined as BMI ≥ 25.0 to < 30.0 kg/m2 * Obesity is defined as BMI ≥ 30.0 kg/m2
13%
36%
66%
71%
87%
53%
19%
21%
32%
24%
63%
26%
0% 10% 20% 30% 40% 50% 60% 70% 80% 90% 100%
6
5
4
3
2
1
No DiabetesDiabetes
Obese*
Overweight/Obese*
High Blood Pressure
High Cholesterol
Lack of Phys. Activ.
Current Smoker
Source: Wisconsin Behavioral Risk Factor Survey, 2009-2010

The 2011 Burden of Diabetes in
Northern Region
2010 Hospitalizations - Northern Region
Total Number
Number Diabetes-related (% of total)
Total Charges
Diabetes-related Charges (% of total charges)
All Ages 56,229 9,257 (16.5%) $1,117,201,700 $222,279,700 (19.9%)
OTHER INFORMATION ♦ People with pre-diabetes have an increased risk of developing type 2 diabetes, heart disease, and stroke. In
Northern Region, an estimated 127,800 people aged 20 years and older have pre-diabetes. ♦ The cost of diabetes in Northern Region adults is staggering. In 2009 for Northern Region, direct costs were
estimated at $405.5 million, indirect costs were estimated at $203.0 million, totaling an estimated $608.5 million.
♦ CDC 2008 county-level age-adjusted prevalence estimates for obesity and physical inactivity are included on each county’s burden page.
PERCENT OF WISCONSIN ADULTS WITH RISK FACTORS BY DIABETES STATUS
The 2011 Burden of Diabetes in Wisconsin is created by the Wisconsin Diabetes Prevention and Control Program (DPCP), Division of Public Health, Department of Health Services. Please see “Detailed Technical Notes” for in-depth information about methodology and data sources. For more information about the Wisconsin Diabetes Prevention and Control Program, go to: http://www.dhs.wisconsin.gov/health/diabetes/. Printing of this document is supported by DPCP partners American Diabetes Association Wisconsin Area, National Kidney Foundation of Wisconsin, and Wisconsin Lions Foundation.
Diabetes Prevalence - Northern Region Age Category
Estimated Number Diagnosed (%)
Estimated Number Undiagnosed (%)
Estimated Total Number (%)
♦ Ages 18 – 44 2,640 (1.7%) 990 (0.7%) 3,630 (2.4%)
♦ Ages 45 – 64 15,830 (11.0%) 5,910 (4.1%) 21,740 (15.2%)
♦ Ages 65 + 16,070 (19.6%) 6,000 (7.3%) 22,070 (26.9%)
♦ All Ages Adult * 34,540 (7.5%) 12,900 (2.8%) 47,440 (10.3%)
* Percent is age-adjusted (direct method) to the United States 2000 standard population. Total percent may not equal the sum of diagnosed percent and undiagnosed percent, due to rounding.
* Overweight is defined as BMI ≥ 25.0 to < 30.0 kg/m2 * Obesity is defined as BMI ≥ 30.0 kg/m2
13%
36%
66%
71%
87%
53%
19%
21%
32%
24%
63%
26%
0% 10% 20% 30% 40% 50% 60% 70% 80% 90% 100%
6
5
4
3
2
1
No DiabetesDiabetes
Obese*
Overweight/Obese*
High Blood Pressure
High Cholesterol
Lack of Phys. Activ.
Current Smoker
Source: Wisconsin Behavioral Risk Factor Survey, 2009-2010

The 2011 Burden of Diabetes in
Southeastern Region
2010 Hospitalizations - Southeastern Region
Total Number
Number Diabetes-related (% of total)
Total Charges
Diabetes-related Charges (% of total charges)
All Ages 249,994 36,718 (14.7%) $7,070,829,600 $1,117,434,700 (15.8%)
OTHER INFORMATION ♦ People with pre-diabetes have an increased risk of developing type 2 diabetes, heart disease, and stroke. In
Southeastern Region, an estimated 535,570 people aged 20 years and older have pre-diabetes. ♦ The cost of diabetes in Southeastern Region adults is staggering. In 2009 for Southeastern Region, direct
costs were estimated at $1.54 billion, indirect costs were estimated at $771.6 million, totaling an estimated $2.31 billion.
♦ CDC 2008 county-level age-adjusted prevalence estimates for obesity and physical inactivity are included on each county’s burden page.
PERCENT OF WISCONSIN ADULTS WITH RISK FACTORS BY DIABETES STATUS
The 2011 Burden of Diabetes in Wisconsin is created by the Wisconsin Diabetes Prevention and Control Program (DPCP), Division of Public Health, Department of Health Services. Please see “Detailed Technical Notes” for in-depth information about methodology and data sources. For more information about the Wisconsin Diabetes Prevention and Control Program, go to: http://www.dhs.wisconsin.gov/health/diabetes/. Printing of this document is supported by DPCP partners American Diabetes Association Wisconsin Area, National Kidney Foundation of Wisconsin, and Wisconsin Lions Foundation.
Diabetes Prevalence - Southeastern Region Age Category
Estimated Number Diagnosed (%)
Estimated Number Undiagnosed (%)
Estimated Total Number (%)
♦ Ages 18 – 44 23,830 (3.1%) 8,890 (1.2%) 32,720 (4.3%)
♦ Ages 45 – 64 62,840 (11.2%) 23,410 (4.2%) 86,250 (15.3%)
♦ Ages 65 + 44,550 (17.0%) 16,580 (6.3%) 61,130 (23.3%)
♦ All Ages Adult * 131,220 (7.8%) 48,880 (2.9%) 180,100 (10.7%)
* Percent is age-adjusted (direct method) to the United States 2000 standard population. Total percent may not equal the sum of diagnosed percent and undiagnosed percent, due to rounding.
* Overweight is defined as BMI ≥ 25.0 to < 30.0 kg/m2 * Obesity is defined as BMI ≥ 30.0 kg/m2
13%
36%
66%
71%
87%
53%
19%
21%
32%
24%
63%
26%
0% 10% 20% 30% 40% 50% 60% 70% 80% 90% 100%
6
5
4
3
2
1
No DiabetesDiabetes
Obese*
Overweight/Obese*
High Blood Pressure
High Cholesterol
Lack of Phys. Activ.
Current Smoker
Source: Wisconsin Behavioral Risk Factor Survey, 2009-2010
The 2011 Burden of Diabetes in
Southern Region
2010 Hospitalizations - Southern Region
Total Number
Number Diabetes-related (% of total)
Total Charges
Diabetes-related Charges (% of total charges)
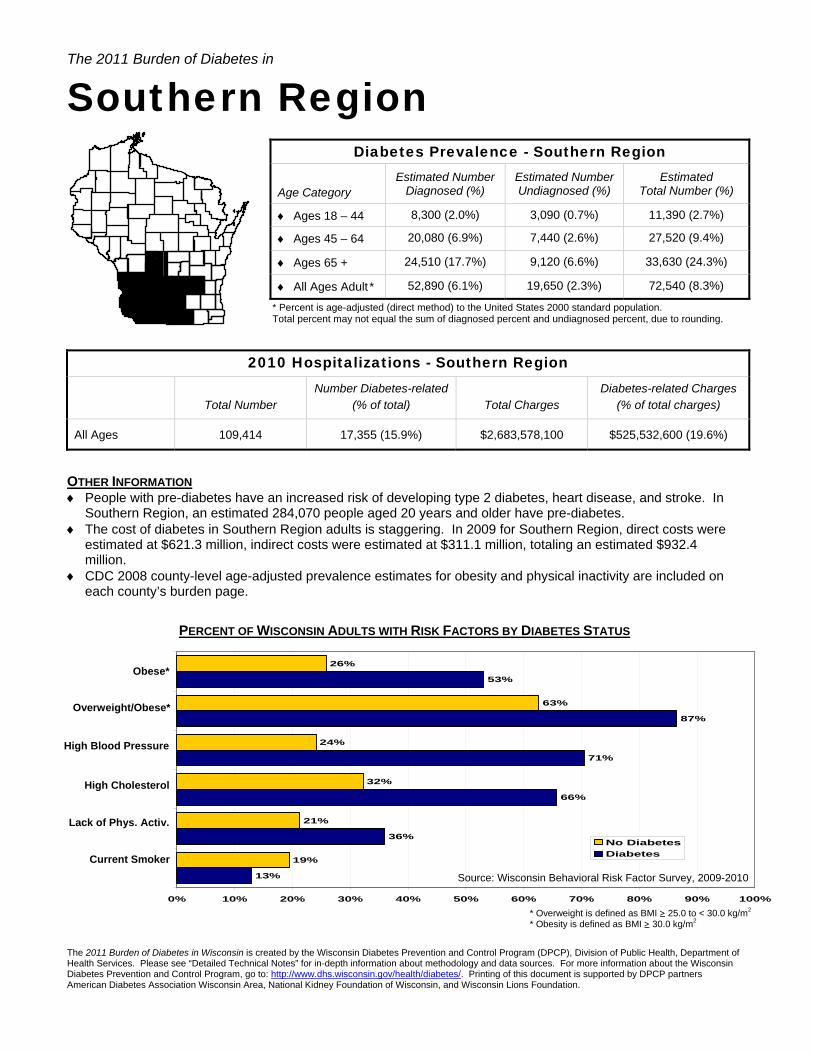
All Ages 109,414 17,355 (15.9%) $2,683,578,100 $525,532,600 (19.6%)
OTHER INFORMATION ♦ People with pre-diabetes have an increased risk of developing type 2 diabetes, heart disease, and stroke. In
Southern Region, an estimated 284,070 people aged 20 years and older have pre-diabetes. ♦ The cost of diabetes in Southern Region adults is staggering. In 2009 for Southern Region, direct costs were
estimated at $621.3 million, indirect costs were estimated at $311.1 million, totaling an estimated $932.4 million.
♦ CDC 2008 county-level age-adjusted prevalence estimates for obesity and physical inactivity are included on each county’s burden page.
PERCENT OF WISCONSIN ADULTS WITH RISK FACTORS BY DIABETES STATUS
The 2011 Burden of Diabetes in Wisconsin is created by the Wisconsin Diabetes Prevention and Control Program (DPCP), Division of Public Health, Department of Health Services. Please see “Detailed Technical Notes” for in-depth information about methodology and data sources. For more information about the Wisconsin Diabetes Prevention and Control Program, go to: http://www.dhs.wisconsin.gov/health/diabetes/. Printing of this document is supported by DPCP partners American Diabetes Association Wisconsin Area, National Kidney Foundation of Wisconsin, and Wisconsin Lions Foundation.
Diabetes Prevalence - Southern Region Age Category
Estimated Number Diagnosed (%)
Estimated Number Undiagnosed (%)
Estimated Total Number (%)
♦ Ages 18 – 44 8,300 (2.0%) 3,090 (0.7%) 11,390 (2.7%)
♦ Ages 45 – 64 20,080 (6.9%) 7,440 (2.6%) 27,520 (9.4%)
♦ Ages 65 + 24,510 (17.7%) 9,120 (6.6%) 33,630 (24.3%)
♦ All Ages Adult * 52,890 (6.1%) 19,650 (2.3%) 72,540 (8.3%)
* Percent is age-adjusted (direct method) to the United States 2000 standard population. Total percent may not equal the sum of diagnosed percent and undiagnosed percent, due to rounding.
* Overweight is defined as BMI ≥ 25.0 to < 30.0 kg/m2 * Obesity is defined as BMI ≥ 30.0 kg/m2
13%
36%
66%
71%
87%
53%
19%
21%
32%
24%
63%
26%
0% 10% 20% 30% 40% 50% 60% 70% 80% 90% 100%
6
5
4
3
2
1
No DiabetesDiabetes
Obese*
Overweight/Obese*
High Blood Pressure
High Cholesterol
Lack of Phys. Activ.
Current Smoker
Source: Wisconsin Behavioral Risk Factor Survey, 2009-2010
The 2011 Burden of Diabetes in
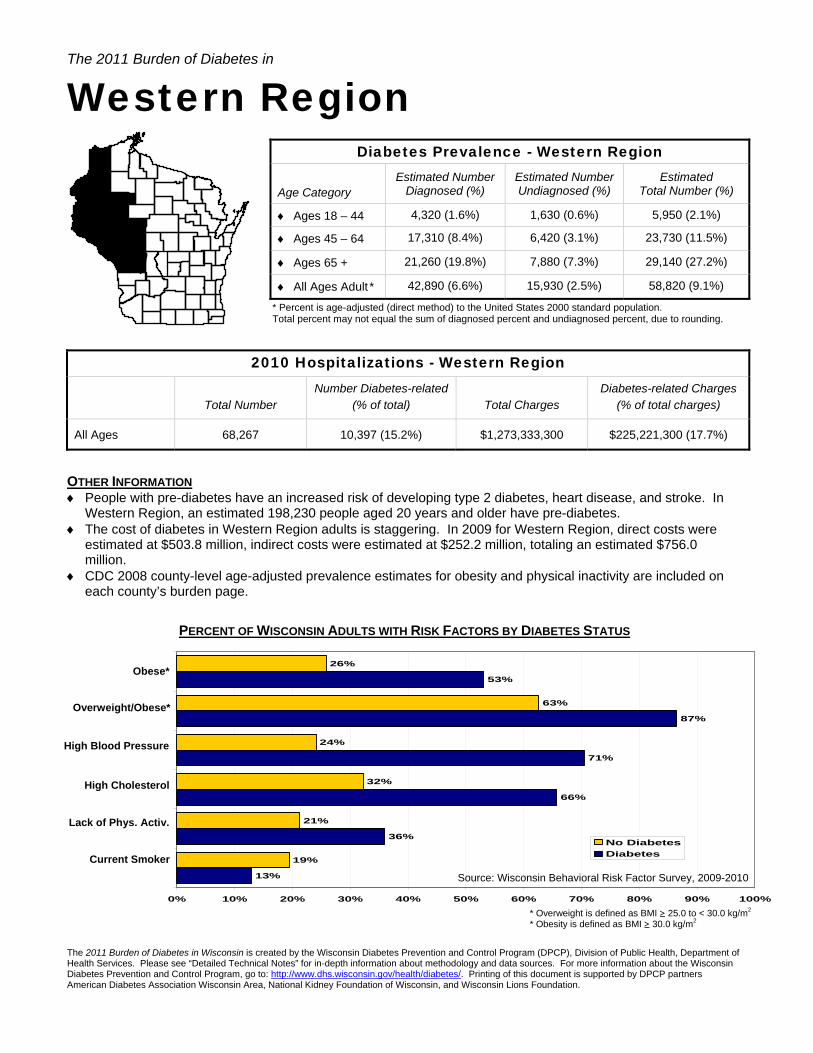
Western Region
2010 Hospitalizations - Western Region
Total Number
Number Diabetes-related (% of total)
Total Charges
Diabetes-related Charges (% of total charges)
All Ages 68,267 10,397 (15.2%) $1,273,333,300 $225,221,300 (17.7%)
OTHER INFORMATION ♦ People with pre-diabetes have an increased risk of developing type 2 diabetes, heart disease, and stroke. In
Western Region, an estimated 198,230 people aged 20 years and older have pre-diabetes. ♦ The cost of diabetes in Western Region adults is staggering. In 2009 for Western Region, direct costs were
estimated at $503.8 million, indirect costs were estimated at $252.2 million, totaling an estimated $756.0 million.
♦ CDC 2008 county-level age-adjusted prevalence estimates for obesity and physical inactivity are included on each county’s burden page.
PERCENT OF WISCONSIN ADULTS WITH RISK FACTORS BY DIABETES STATUS
The 2011 Burden of Diabetes in Wisconsin is created by the Wisconsin Diabetes Prevention and Control Program (DPCP), Division of Public Health, Department of Health Services. Please see “Detailed Technical Notes” for in-depth information about methodology and data sources. For more information about the Wisconsin Diabetes Prevention and Control Program, go to: http://www.dhs.wisconsin.gov/health/diabetes/. Printing of this document is supported by DPCP partners American Diabetes Association Wisconsin Area, National Kidney Foundation of Wisconsin, and Wisconsin Lions Foundation.
Diabetes Prevalence - Western Region Age Category
Estimated Number Diagnosed (%)
Estimated Number Undiagnosed (%)
Estimated Total Number (%)
♦ Ages 18 – 44 4,320 (1.6%) 1,630 (0.6%) 5,950 (2.1%)
♦ Ages 45 – 64 17,310 (8.4%) 6,420 (3.1%) 23,730 (11.5%)
♦ Ages 65 + 21,260 (19.8%) 7,880 (7.3%) 29,140 (27.2%)
♦ All Ages Adult * 42,890 (6.6%) 15,930 (2.5%) 58,820 (9.1%)
* Percent is age-adjusted (direct method) to the United States 2000 standard population. Total percent may not equal the sum of diagnosed percent and undiagnosed percent, due to rounding.
* Overweight is defined as BMI ≥ 25.0 to < 30.0 kg/m2 * Obesity is defined as BMI ≥ 30.0 kg/m2
13%
36%
66%
71%
87%
53%
19%
21%
32%
24%
63%
26%
0% 10% 20% 30% 40% 50% 60% 70% 80% 90% 100%
6
5
4
3
2
1
No DiabetesDiabetes
Obese*
Overweight/Obese*
High Blood Pressure
High Cholesterol
Lack of Phys. Activ.
Current Smoker
Source: Wisconsin Behavioral Risk Factor Survey, 2009-2010

The 2011 Burden of Diabetes in
Adams County
2010 Hospitalizations - Adams County
Total Number Number Diabetes-related
(% of total)
Total Charges Diabetes-related Charges
(% of total charges)
All Ages 1,695 369 (21.8%) $45,993,200 $12,414,600 (27.0%)
OTHER INFORMATION ♦ People with pre-diabetes have an increased risk of developing type 2 diabetes, heart disease, and stroke. In
Adams County, an estimated 5,710 people aged 20 years and older have pre-diabetes. ♦ The cost of diabetes in Adams County adults is staggering. In 2009 for Adams County, direct costs were
estimated at $16.9 million, indirect costs were estimated at $8.5 million, totaling an estimated $25.4 million. ♦ Recently, CDC released 2008 county-level age-adjusted prevalence estimates for obesity and physical
inactivity. In Adams County, 30.5% of people aged 20 years and older were obese and 22.0% of people aged 20 years and older were physically inactive.
PERCENT OF WISCONSIN ADULTS WITH RISK FACTORS BY DIABETES STATUS
The 2011 Burden of Diabetes in Wisconsin is created by the Wisconsin Diabetes Prevention and Control Program (DPCP), Division of Public Health, Department of Health Services. Please see “Detailed Technical Notes” for in-depth information about methodology and data sources. For more information about the Wisconsin Diabetes Prevention and Control Program, go to: http://www.dhs.wisconsin.gov/health/diabetes/. Printing of this document is supported by DPCP partners American Diabetes Association Wisconsin Area, National Kidney Foundation of Wisconsin, and Wisconsin Lions Foundation.
Diabetes Prevalence - Adams County Age Category
Estimated Number Diagnosed (%)
Estimated Number Undiagnosed (%)
Estimated Total Number (%)
♦ Ages 18 – 44 140 (2.5%) 50 (0.9%) 190 (3.3%)
♦ Ages 45 – 64 490 (7.4%) 180 (2.7%) 670 (10.1%)
♦ Ages 65 + 810 (18.7%) 300 (6.9%) 1,110 (25.6%)
♦ All Ages Adult * 1,440 (6.6%) 530 (2.4%) 1,970 (9.1%)
* Percent is age-adjusted (direct method) to the United States 2000 standard population. Total percent may not equal the sum of diagnosed percent and undiagnosed percent, due to rounding.
* Overweight is defined as BMI ≥ 25.0 to < 30.0 kg/m2 * Obesity is defined as BMI ≥ 30.0 kg/m2
13%
36%
66%
71%
87%
53%
19%
21%
32%
24%
63%
26%
0% 10% 20% 30% 40% 50% 60% 70% 80% 90% 100%
6
5
4
3
2
1
No DiabetesDiabetes
Obese*
Overweight/Obese*
High Blood Pressure
High Cholesterol
Lack of Phys. Activ.
Current Smoker
Source: Wisconsin Behavioral Risk Factor Survey, 2009-2010

The 2011 Burden of Diabetes in
Ashland County
2010 Hospitalizations - Ashland County
Total Number Number Diabetes-related
(% of total)
Total Charges Diabetes-related Charges
(% of total charges)
All Ages 1,752 294 (16.8%) $21,678,500 $4,158,300 (19.2%)
OTHER INFORMATION ♦ People with pre-diabetes have an increased risk of developing type 2 diabetes, heart disease, and stroke. In
Ashland County, an estimated 4,130 people aged 20 years and older have pre-diabetes. ♦ The cost of diabetes in Ashland County adults is staggering. In 2009 for Ashland County, direct costs were
estimated at $15.4 million, indirect costs were estimated at $7.7 million, totaling an estimated $23.1 million. ♦ Recently, CDC released 2008 county-level age-adjusted prevalence estimates for obesity and physical
inactivity. In Ashland County, 27.3% of people aged 20 years and older were obese and 20.8% of people aged 20 years and older were physically inactive.
PERCENT OF WISCONSIN ADULTS WITH RISK FACTORS BY DIABETES STATUS
The 2011 Burden of Diabetes in Wisconsin is created by the Wisconsin Diabetes Prevention and Control Program (DPCP), Division of Public Health, Department of Health Services. Please see “Detailed Technical Notes” for in-depth information about methodology and data sources. For more information about the Wisconsin Diabetes Prevention and Control Program, go to: http://www.dhs.wisconsin.gov/health/diabetes/. Printing of this document is supported by DPCP partners American Diabetes Association Wisconsin Area, National Kidney Foundation of Wisconsin, and Wisconsin Lions Foundation.
Diabetes Prevalence - Ashland County Age Category
Estimated Number Diagnosed (%)
Estimated Number Undiagnosed (%)
Estimated Total Number (%)
♦ Ages 18 – 44 190 (3.5%) 70 (1.3%) 260 (4.8%)
♦ Ages 45 – 64 620 (13.9%) 230 (5.2%) 850 (19.0%)
♦ Ages 65 + 500 (19.9%) 190 (7.5%) 690 (27.4%)
♦ All Ages Adult * 1,310 (9.3%) 490 (3.5%) 1,800 (12.8%)
* Percent is age-adjusted (direct method) to the United States 2000 standard population. Total percent may not equal the sum of diagnosed percent and undiagnosed percent, due to rounding.
* Overweight is defined as BMI ≥ 25.0 to < 30.0 kg/m2 * Obesity is defined as BMI ≥ 30.0 kg/m2
13%
36%
66%
71%
87%
53%
19%
21%
32%
24%
63%
26%
0% 10% 20% 30% 40% 50% 60% 70% 80% 90% 100%
6
5
4
3
2
1
No DiabetesDiabetes
Obese*
Overweight/Obese*
High Blood Pressure
High Cholesterol
Lack of Phys. Activ.
Current Smoker
Source: Wisconsin Behavioral Risk Factor Survey, 2009-2010

The 2011 Burden of Diabetes in
Barron County
2010 Hospitalizations - Barron County
Total Number Number Diabetes-related
(% of total)
Total Charges Diabetes-related Charges
(% of total charges)
All Ages 5,223 839 (16.1%) $99,535,100 $17,526,700 (17.6%)
OTHER INFORMATION ♦ People with pre-diabetes have an increased risk of developing type 2 diabetes, heart disease, and stroke. In
Barron County, an estimated 12,130 people aged 20 years and older have pre-diabetes. ♦ The cost of diabetes in Barron County adults is staggering. In 2009 for Barron County, direct costs were
estimated at $34.9 million, indirect costs were estimated at $17.5 million, totaling an estimated $52.4 million. ♦ Recently, CDC released 2008 county-level age-adjusted prevalence estimates for obesity and physical
inactivity. In Barron County, 28.4% of people aged 20 years and older were obese and 22.6% of people aged 20 years and older were physically inactive.
PERCENT OF WISCONSIN ADULTS WITH RISK FACTORS BY DIABETES STATUS
The 2011 Burden of Diabetes in Wisconsin is created by the Wisconsin Diabetes Prevention and Control Program (DPCP), Division of Public Health, Department of Health Services. Please see “Detailed Technical Notes” for in-depth information about methodology and data sources. For more information about the Wisconsin Diabetes Prevention and Control Program, go to: http://www.dhs.wisconsin.gov/health/diabetes/. Printing of this document is supported by DPCP partners American Diabetes Association Wisconsin Area, National Kidney Foundation of Wisconsin, and Wisconsin Lions Foundation.
Diabetes Prevalence - Barron County Age Category
Estimated Number Diagnosed (%)
Estimated Number Undiagnosed (%)
Estimated Total Number (%)
♦ Ages 18 – 44 210 (1.5%) 80 (0.6%) 290 (2.1%)
♦ Ages 45 – 64 1,130 (8.3%) 420 (3.1%) 1,550 (11.4%)
♦ Ages 65 + 1,630 (19.7%) 610 (7.4%) 2,240 (27.1%)
♦ All Ages Adult * 2,970 (6.6%) 1,110 (2.5%) 4,080 (9.0%)
* Percent is age-adjusted (direct method) to the United States 2000 standard population. Total percent may not equal the sum of diagnosed percent and undiagnosed percent, due to rounding.
* Overweight is defined as BMI ≥ 25.0 to < 30.0 kg/m2 * Obesity is defined as BMI ≥ 30.0 kg/m2
13%
36%
66%
71%
87%
53%
19%
21%
32%
24%
63%
26%
0% 10% 20% 30% 40% 50% 60% 70% 80% 90% 100%
6
5
4
3
2
1
No DiabetesDiabetes
Obese*
Overweight/Obese*
High Blood Pressure
High Cholesterol
Lack of Phys. Activ.
Current Smoker
Source: Wisconsin Behavioral Risk Factor Survey, 2009-2010

The 2011 Burden of Diabetes in
Bayfield County
2010 Hospitalizations - Bayfield County
Total Number Number Diabetes-related
(% of total)
Total Charges Diabetes-related Charges
(% of total charges)
All Ages 961 162 (16.9%) $11,397,100 $2,473,900 (21.7%)
OTHER INFORMATION ♦ People with pre-diabetes have an increased risk of developing type 2 diabetes, heart disease, and stroke. In
Bayfield County, an estimated 4,070 people aged 20 years and older have pre-diabetes. ♦ The cost of diabetes in Bayfield County adults is staggering. In 2009 for Bayfield County, direct costs were
estimated at $16.4 million, indirect costs were estimated at $8.2 million, totaling an estimated $24.6 million. ♦ Recently, CDC released 2008 county-level age-adjusted prevalence estimates for obesity and physical
inactivity. In Bayfield County, 27.9% of people aged 20 years and older were obese and 20.5% of people aged 20 years and older were physically inactive.
PERCENT OF WISCONSIN ADULTS WITH RISK FACTORS BY DIABETES STATUS
The 2011 Burden of Diabetes in Wisconsin is created by the Wisconsin Diabetes Prevention and Control Program (DPCP), Division of Public Health, Department of Health Services. Please see “Detailed Technical Notes” for in-depth information about methodology and data sources. For more information about the Wisconsin Diabetes Prevention and Control Program, go to: http://www.dhs.wisconsin.gov/health/diabetes/. Printing of this document is supported by DPCP partners American Diabetes Association Wisconsin Area, National Kidney Foundation of Wisconsin, and Wisconsin Lions Foundation.
Diabetes Prevalence - Bayfield County Age Category
Estimated Number Diagnosed (%)
Estimated Number Undiagnosed (%)
Estimated Total Number (%)
♦ Ages 18 – 44 160 (4.2%) 60 (1.6%) 220 (5.8%)
♦ Ages 45 – 64 680 (12.8%) 250 (4.7%) 930 (17.6%)
♦ Ages 65 + 560 (19.8%) 210 (7.4%) 770 (27.2%)
♦ All Ages Adult * 1,400 (9.4%) 520 (3.5%) 1,920 (12.9%)
* Percent is age-adjusted (direct method) to the United States 2000 standard population. Total percent may not equal the sum of diagnosed percent and undiagnosed percent, due to rounding.
* Overweight is defined as BMI ≥ 25.0 to < 30.0 kg/m2 * Obesity is defined as BMI ≥ 30.0 kg/m2
13%
36%
66%
71%
87%
53%
19%
21%
32%
24%
63%
26%
0% 10% 20% 30% 40% 50% 60% 70% 80% 90% 100%
6
5
4
3
2
1
No DiabetesDiabetes
Obese*
Overweight/Obese*
High Blood Pressure
High Cholesterol
Lack of Phys. Activ.
Current Smoker
Source: Wisconsin Behavioral Risk Factor Survey, 2009-2010

The 2011 Burden of Diabetes in
Brown County
2010 Hospitalizations - Brown County
Total Number Number Diabetes-related
(% of total)
Total Charges Diabetes-related Charges
(% of total charges)
All Ages 25,018 3,432 (13.7%) $530,881,900 $85,986,300 (16.2%)
OTHER INFORMATION ♦ People with pre-diabetes have an increased risk of developing type 2 diabetes, heart disease, and stroke. In
Brown County, an estimated 62,970 people aged 20 years and older have pre-diabetes. ♦ The cost of diabetes in Brown County adults is staggering. In 2009 for Brown County, direct costs were
estimated at $193.8 million, indirect costs were estimated at $97.0 million, totaling an estimated $290.8 million. ♦ Recently, CDC released 2008 county-level age-adjusted prevalence estimates for obesity and physical
inactivity. In Brown County, 27.3% of people aged 20 years and older were obese and 20.3% of people aged 20 years and older were physically inactive.
PERCENT OF WISCONSIN ADULTS WITH RISK FACTORS BY DIABETES STATUS
The 2011 Burden of Diabetes in Wisconsin is created by the Wisconsin Diabetes Prevention and Control Program (DPCP), Division of Public Health, Department of Health Services. Please see “Detailed Technical Notes” for in-depth information about methodology and data sources. For more information about the Wisconsin Diabetes Prevention and Control Program, go to: http://www.dhs.wisconsin.gov/health/diabetes/. Printing of this document is supported by DPCP partners American Diabetes Association Wisconsin Area, National Kidney Foundation of Wisconsin, and Wisconsin Lions Foundation.
Diabetes Prevalence - Brown County Age Category
Estimated Number Diagnosed (%)
Estimated Number Undiagnosed (%)
Estimated Total Number (%)
♦ Ages 18 – 44 1,780 (1.9%) 660 (0.7%) 2,440 (2.6%)
♦ Ages 45 – 64 7,970 (12.3%) 2,970 (4.6%) 10,940 (16.9%)
♦ Ages 65 + 6,750 (24.0%) 2,510 (8.9%) 9,260 (32.9%)
♦ All Ages Adult * 16,500 (8.7%) 6,140 (3.2%) 22,640 (11.9%)
* Percent is age-adjusted (direct method) to the United States 2000 standard population. Total percent may not equal the sum of diagnosed percent and undiagnosed percent, due to rounding.
* Overweight is defined as BMI ≥ 25.0 to < 30.0 kg/m2 * Obesity is defined as BMI ≥ 30.0 kg/m2
13%
36%
66%
71%
87%
53%
19%
21%
32%
24%
63%
26%
0% 10% 20% 30% 40% 50% 60% 70% 80% 90% 100%
6
5
4
3
2
1
No DiabetesDiabetes
Obese*
Overweight/Obese*
High Blood Pressure
High Cholesterol
Lack of Phys. Activ.
Current Smoker
Source: Wisconsin Behavioral Risk Factor Survey, 2009-2010
The 2011 Burden of Diabetes in
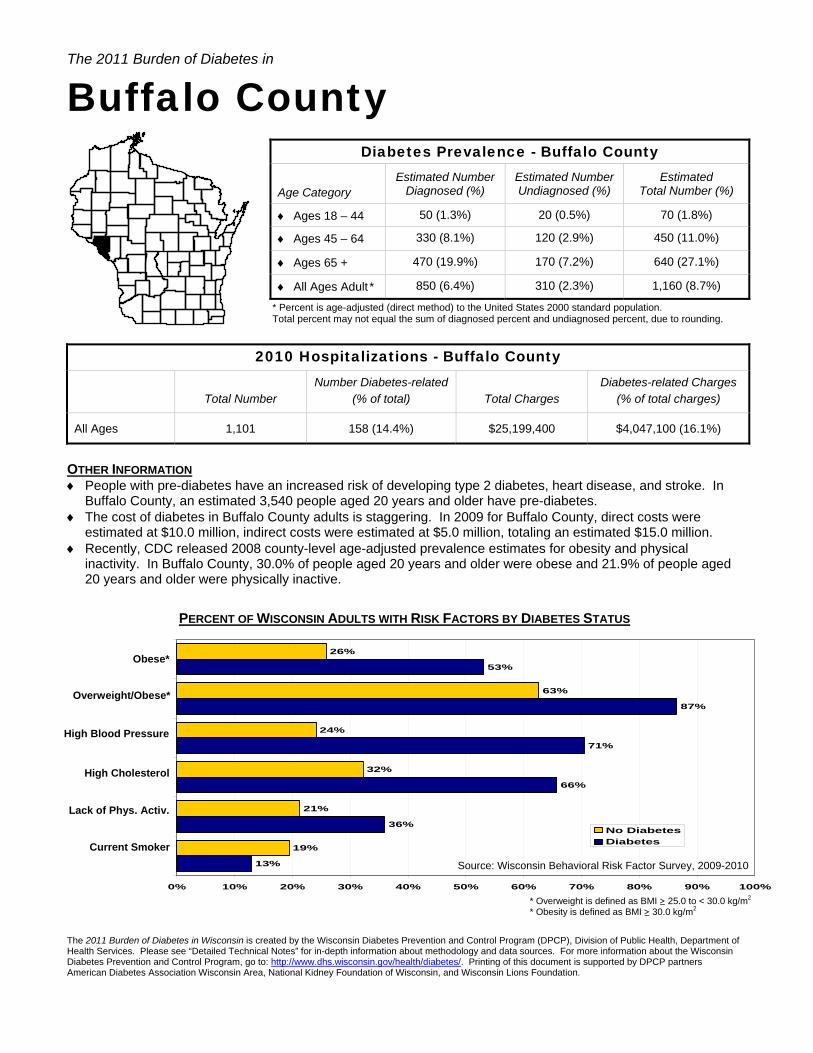
Buffalo County
2010 Hospitalizations - Buffalo County
Total Number Number Diabetes-related
(% of total)
Total Charges Diabetes-related Charges
(% of total charges)
All Ages 1,101 158 (14.4%) $25,199,400 $4,047,100 (16.1%)
OTHER INFORMATION ♦ People with pre-diabetes have an increased risk of developing type 2 diabetes, heart disease, and stroke. In
Buffalo County, an estimated 3,540 people aged 20 years and older have pre-diabetes. ♦ The cost of diabetes in Buffalo County adults is staggering. In 2009 for Buffalo County, direct costs were
estimated at $10.0 million, indirect costs were estimated at $5.0 million, totaling an estimated $15.0 million. ♦ Recently, CDC released 2008 county-level age-adjusted prevalence estimates for obesity and physical
inactivity. In Buffalo County, 30.0% of people aged 20 years and older were obese and 21.9% of people aged 20 years and older were physically inactive.
PERCENT OF WISCONSIN ADULTS WITH RISK FACTORS BY DIABETES STATUS
The 2011 Burden of Diabetes in Wisconsin is created by the Wisconsin Diabetes Prevention and Control Program (DPCP), Division of Public Health, Department of Health Services. Please see “Detailed Technical Notes” for in-depth information about methodology and data sources. For more information about the Wisconsin Diabetes Prevention and Control Program, go to: http://www.dhs.wisconsin.gov/health/diabetes/. Printing of this document is supported by DPCP partners American Diabetes Association Wisconsin Area, National Kidney Foundation of Wisconsin, and Wisconsin Lions Foundation.
Diabetes Prevalence - Buffalo County Age Category
Estimated Number Diagnosed (%)
Estimated Number Undiagnosed (%)
Estimated Total Number (%)
♦ Ages 18 – 44 50 (1.3%) 20 (0.5%) 70 (1.8%)
♦ Ages 45 – 64 330 (8.1%) 120 (2.9%) 450 (11.0%)
♦ Ages 65 + 470 (19.9%) 170 (7.2%) 640 (27.1%)
♦ All Ages Adult * 850 (6.4%) 310 (2.3%) 1,160 (8.7%)
* Percent is age-adjusted (direct method) to the United States 2000 standard population. Total percent may not equal the sum of diagnosed percent and undiagnosed percent, due to rounding.
* Overweight is defined as BMI ≥ 25.0 to < 30.0 kg/m2 * Obesity is defined as BMI ≥ 30.0 kg/m2
13%
36%
66%
71%
87%
53%
19%
21%
32%
24%
63%
26%
0% 10% 20% 30% 40% 50% 60% 70% 80% 90% 100%
6
5
4
3
2
1
No DiabetesDiabetes
Obese*
Overweight/Obese*
High Blood Pressure
High Cholesterol
Lack of Phys. Activ.
Current Smoker
Source: Wisconsin Behavioral Risk Factor Survey, 2009-2010

The 2011 Burden of Diabetes in
Burnett County
2010 Hospitalizations - Burnett County
Total Number Number Diabetes-related
(% of total)
Total Charges Diabetes-related Charges
(% of total charges)
All Ages 1,147 209 (18.2%) $12,557,200 $2,931,000 (23.3%)
OTHER INFORMATION ♦ People with pre-diabetes have an increased risk of developing type 2 diabetes, heart disease, and stroke. In
Burnett County, an estimated 4,380 people aged 20 years and older have pre-diabetes. ♦ The cost of diabetes in Burnett County adults is staggering. In 2009 for Burnett County, direct costs were
estimated at $15.3 million, indirect costs were estimated at $7.6 million, totaling an estimated $22.9 million. ♦ Recently, CDC released 2008 county-level age-adjusted prevalence estimates for obesity and physical
inactivity. In Burnett County, 29.1% of people aged 20 years and older were obese and 20.2% of people aged 20 years and older were physically inactive.
PERCENT OF WISCONSIN ADULTS WITH RISK FACTORS BY DIABETES STATUS
The 2011 Burden of Diabetes in Wisconsin is created by the Wisconsin Diabetes Prevention and Control Program (DPCP), Division of Public Health, Department of Health Services. Please see “Detailed Technical Notes” for in-depth information about methodology and data sources. For more information about the Wisconsin Diabetes Prevention and Control Program, go to: http://www.dhs.wisconsin.gov/health/diabetes/. Printing of this document is supported by DPCP partners American Diabetes Association Wisconsin Area, National Kidney Foundation of Wisconsin, and Wisconsin Lions Foundation.
Diabetes Prevalence - Burnett County Age Category
Estimated Number Diagnosed (%)
Estimated Number Undiagnosed (%)
Estimated Total Number (%)
♦ Ages 18 – 44 110 (2.7%) 40 (1.0%) 150 (3.6%)
♦ Ages 45 – 64 490 (9.4%) 180 (3.4%) 670 (12.8%)
♦ Ages 65 + 700 (19.9%) 260 (7.4%) 960 (27.4%)
♦ All Ages Adult * 1,300 (7.5%) 480 (2.8%) 1,780 (10.3%)
* Percent is age-adjusted (direct method) to the United States 2000 standard population. Total percent may not equal the sum of diagnosed percent and undiagnosed percent, due to rounding.
* Overweight is defined as BMI ≥ 25.0 to < 30.0 kg/m2 * Obesity is defined as BMI ≥ 30.0 kg/m2
13%
36%
66%
71%
87%
53%
19%
21%
32%
24%
63%
26%
0% 10% 20% 30% 40% 50% 60% 70% 80% 90% 100%
6
5
4
3
2
1
No DiabetesDiabetes
Obese*
Overweight/Obese*
High Blood Pressure
High Cholesterol
Lack of Phys. Activ.
Current Smoker
Source: Wisconsin Behavioral Risk Factor Survey, 2009-2010

The 2011 Burden of Diabetes in
Calumet County
2010 Hospitalizations - Calumet County
Total Number Number Diabetes-related
(% of total)
Total Charges Diabetes-related Charges
(% of total charges)
All Ages 2,287 351 (15.3%) $42,722,900 $6,437,100 (15.1%)
OTHER INFORMATION ♦ People with pre-diabetes have an increased risk of developing type 2 diabetes, heart disease, and stroke. In
Calumet County, an estimated 11,090 people aged 20 years and older have pre-diabetes. ♦ The cost of diabetes in Calumet County adults is staggering. In 2009 for Calumet County, direct costs were
estimated at $30.8 million, indirect costs were estimated at $15.4 million, totaling an estimated $46.2 million. ♦ Recently, CDC released 2008 county-level age-adjusted prevalence estimates for obesity and physical
inactivity. In Calumet County, 28.3% of people aged 20 years and older were obese and 19.4% of people aged 20 years and older were physically inactive.
PERCENT OF WISCONSIN ADULTS WITH RISK FACTORS BY DIABETES STATUS
The 2011 Burden of Diabetes in Wisconsin is created by the Wisconsin Diabetes Prevention and Control Program (DPCP), Division of Public Health, Department of Health Services. Please see “Detailed Technical Notes” for in-depth information about methodology and data sources. For more information about the Wisconsin Diabetes Prevention and Control Program, go to: http://www.dhs.wisconsin.gov/health/diabetes/. Printing of this document is supported by DPCP partners American Diabetes Association Wisconsin Area, National Kidney Foundation of Wisconsin, and Wisconsin Lions Foundation.
Diabetes Prevalence - Calumet County Age Category
Estimated Number Diagnosed (%)
Estimated Number Undiagnosed (%)
Estimated Total Number (%)
♦ Ages 18 – 44 290 (1.9%) 110 (0.7%) 400 (2.6%)
♦ Ages 45 – 64 1,370 (11.1%) 510 (4.1%) 1,880 (15.3%)
♦ Ages 65 + 960 (19.9%) 360 (7.4%) 1,320 (27.3%)
♦ All Ages Adult * 2,620 (7.6%) 980 (2.9%) 3,600 (10.5%)
* Percent is age-adjusted (direct method) to the United States 2000 standard population. Total percent may not equal the sum of diagnosed percent and undiagnosed percent, due to rounding.
* Overweight is defined as BMI ≥ 25.0 to < 30.0 kg/m2 * Obesity is defined as BMI ≥ 30.0 kg/m2
13%
36%
66%
71%
87%
53%
19%
21%
32%
24%
63%
26%
0% 10% 20% 30% 40% 50% 60% 70% 80% 90% 100%
6
5
4
3
2
1
No DiabetesDiabetes
Obese*
Overweight/Obese*
High Blood Pressure
High Cholesterol
Lack of Phys. Activ.
Current Smoker
Source: Wisconsin Behavioral Risk Factor Survey, 2009-2010

The 2011 Burden of Diabetes in
Chippewa County
2010 Hospitalizations - Chippewa County
Total Number Number Diabetes-related
(% of total)
Total Charges Diabetes-related Charges
(% of total charges)
All Ages 6,993 987 (14.1%) $151,268,100 $23,460,600 (15.5%)
OTHER INFORMATION ♦ People with pre-diabetes have an increased risk of developing type 2 diabetes, heart disease, and stroke. In
Chippewa County, an estimated 15,750 people aged 20 years and older have pre-diabetes. ♦ The cost of diabetes in Chippewa County adults is staggering. In 2009 for Chippewa County, direct costs were
estimated at $39.0 million, indirect costs were estimated at $19.5 million, totaling an estimated $58.5 million. ♦ Recently, CDC released 2008 county-level age-adjusted prevalence estimates for obesity and physical
inactivity. In Chippewa County, 27.9% of people aged 20 years and older were obese and 19.3% of people aged 20 years and older were physically inactive.
PERCENT OF WISCONSIN ADULTS WITH RISK FACTORS BY DIABETES STATUS
The 2011 Burden of Diabetes in Wisconsin is created by the Wisconsin Diabetes Prevention and Control Program (DPCP), Division of Public Health, Department of Health Services. Please see “Detailed Technical Notes” for in-depth information about methodology and data sources. For more information about the Wisconsin Diabetes Prevention and Control Program, go to: http://www.dhs.wisconsin.gov/health/diabetes/. Printing of this document is supported by DPCP partners American Diabetes Association Wisconsin Area, National Kidney Foundation of Wisconsin, and Wisconsin Lions Foundation.
Diabetes Prevalence - Chippewa County Age Category
Estimated Number Diagnosed (%)
Estimated Number Undiagnosed (%)
Estimated Total Number (%)
♦ Ages 18 – 44 290 (1.4%) 120 (0.6%) 410 (2.0%)
♦ Ages 45 – 64 1,380 (8.1%) 510 (3.0%) 1,890 (11.1%)
♦ Ages 65 + 1,650 (19.8%) 610 (7.3%) 2,260 (27.2%)
♦ All Ages Adult * 3,320 (6.5%) 1,240 (2.4%) 4,560 (8.9%)
* Percent is age-adjusted (direct method) to the United States 2000 standard population. Total percent may not equal the sum of diagnosed percent and undiagnosed percent, due to rounding.
* Overweight is defined as BMI ≥ 25.0 to < 30.0 kg/m2 * Obesity is defined as BMI ≥ 30.0 kg/m2
13%
36%
66%
71%
87%
53%
19%
21%
32%
24%
63%
26%
0% 10% 20% 30% 40% 50% 60% 70% 80% 90% 100%
6
5
4
3
2
1
No DiabetesDiabetes
Obese*
Overweight/Obese*
High Blood Pressure
High Cholesterol
Lack of Phys. Activ.
Current Smoker
Source: Wisconsin Behavioral Risk Factor Survey, 2009-2010
The 2011 Burden of Diabetes in
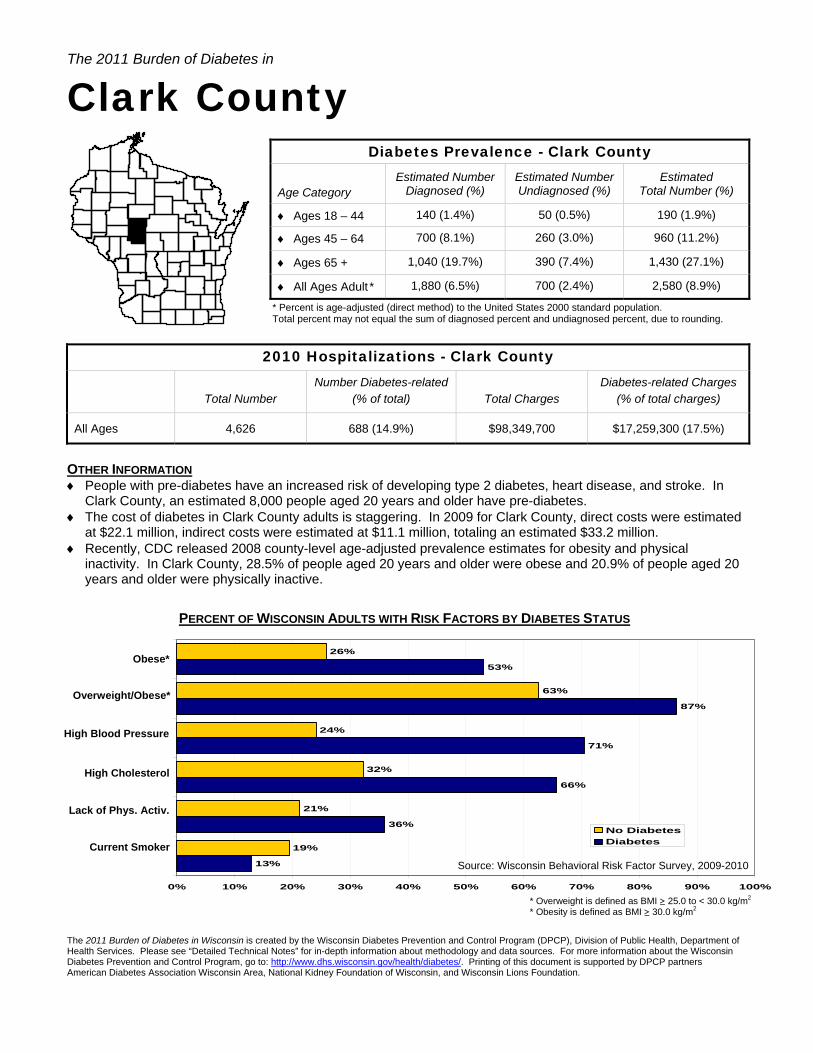
Clark County
2010 Hospitalizations - Clark County
Total Number Number Diabetes-related
(% of total)
Total Charges Diabetes-related Charges
(% of total charges)
All Ages 4,626 688 (14.9%) $98,349,700 $17,259,300 (17.5%)
OTHER INFORMATION ♦ People with pre-diabetes have an increased risk of developing type 2 diabetes, heart disease, and stroke. In
Clark County, an estimated 8,000 people aged 20 years and older have pre-diabetes. ♦ The cost of diabetes in Clark County adults is staggering. In 2009 for Clark County, direct costs were estimated
at $22.1 million, indirect costs were estimated at $11.1 million, totaling an estimated $33.2 million. ♦ Recently, CDC released 2008 county-level age-adjusted prevalence estimates for obesity and physical
inactivity. In Clark County, 28.5% of people aged 20 years and older were obese and 20.9% of people aged 20 years and older were physically inactive.
PERCENT OF WISCONSIN ADULTS WITH RISK FACTORS BY DIABETES STATUS
The 2011 Burden of Diabetes in Wisconsin is created by the Wisconsin Diabetes Prevention and Control Program (DPCP), Division of Public Health, Department of Health Services. Please see “Detailed Technical Notes” for in-depth information about methodology and data sources. For more information about the Wisconsin Diabetes Prevention and Control Program, go to: http://www.dhs.wisconsin.gov/health/diabetes/. Printing of this document is supported by DPCP partners American Diabetes Association Wisconsin Area, National Kidney Foundation of Wisconsin, and Wisconsin Lions Foundation.
Diabetes Prevalence - Clark County Age Category
Estimated Number Diagnosed (%)
Estimated Number Undiagnosed (%)
Estimated Total Number (%)
♦ Ages 18 – 44 140 (1.4%) 50 (0.5%) 190 (1.9%)
♦ Ages 45 – 64 700 (8.1%) 260 (3.0%) 960 (11.2%)
♦ Ages 65 + 1,040 (19.7%) 390 (7.4%) 1,430 (27.1%)
♦ All Ages Adult * 1,880 (6.5%) 700 (2.4%) 2,580 (8.9%)
* Percent is age-adjusted (direct method) to the United States 2000 standard population. Total percent may not equal the sum of diagnosed percent and undiagnosed percent, due to rounding.
* Overweight is defined as BMI ≥ 25.0 to < 30.0 kg/m2 * Obesity is defined as BMI ≥ 30.0 kg/m2
13%
36%
66%
71%
87%
53%
19%
21%
32%
24%
63%
26%
0% 10% 20% 30% 40% 50% 60% 70% 80% 90% 100%
6
5
4
3
2
1
No DiabetesDiabetes
Obese*
Overweight/Obese*
High Blood Pressure
High Cholesterol
Lack of Phys. Activ.
Current Smoker
Source: Wisconsin Behavioral Risk Factor Survey, 2009-2010

The 2011 Burden of Diabetes in
Columbia County
2010 Hospitalizations - Columbia County
Total Number Number Diabetes-related
(% of total)
Total Charges Diabetes-related Charges
(% of total charges)
All Ages 6,662 1,089 (16.3%) $160,122,900 $31,459,700 (19.6%)
OTHER INFORMATION ♦ People with pre-diabetes have an increased risk of developing type 2 diabetes, heart disease, and stroke. In
Columbia County, an estimated 14,510 people aged 20 years and older have pre-diabetes. ♦ The cost of diabetes in Columbia County adults is staggering. In 2009 for Columbia County, direct costs were
estimated at $35.1 million, indirect costs were estimated at $17.6 million, totaling an estimated $52.7 million. ♦ Recently, CDC released 2008 county-level age-adjusted prevalence estimates for obesity and physical
inactivity. In Columbia County, 27.4% of people aged 20 years and older were obese and 23.4% of people aged 20 years and older were physically inactive.
PERCENT OF WISCONSIN ADULTS WITH RISK FACTORS BY DIABETES STATUS
The 2011 Burden of Diabetes in Wisconsin is created by the Wisconsin Diabetes Prevention and Control Program (DPCP), Division of Public Health, Department of Health Services. Please see “Detailed Technical Notes” for in-depth information about methodology and data sources. For more information about the Wisconsin Diabetes Prevention and Control Program, go to: http://www.dhs.wisconsin.gov/health/diabetes/. Printing of this document is supported by DPCP partners American Diabetes Association Wisconsin Area, National Kidney Foundation of Wisconsin, and Wisconsin Lions Foundation.
Diabetes Prevalence - Columbia County Age Category
Estimated Number Diagnosed (%)
Estimated Number Undiagnosed (%)
Estimated Total Number (%)
♦ Ages 18 – 44 300 (1.7%) 110 (0.6%) 410 (2.3%)
♦ Ages 45 – 64 1,150 (7.0%) 430 (2.6%) 1,580 (9.7%)
♦ Ages 65 + 1,540 (18.6%) 570 (6.9%) 2,110 (25.5%)
♦ All Ages Adult * 2,990 (6.1%) 1,110 (2.3%) 4,100 (8.3%)
* Percent is age-adjusted (direct method) to the United States 2000 standard population. Total percent may not equal the sum of diagnosed percent and undiagnosed percent, due to rounding.
* Overweight is defined as BMI ≥ 25.0 to < 30.0 kg/m2 * Obesity is defined as BMI ≥ 30.0 kg/m2
13%
36%
66%
71%
87%
53%
19%
21%
32%
24%
63%
26%
0% 10% 20% 30% 40% 50% 60% 70% 80% 90% 100%
6
5
4
3
2
1
No DiabetesDiabetes
Obese*
Overweight/Obese*
High Blood Pressure
High Cholesterol
Lack of Phys. Activ.
Current Smoker
Source: Wisconsin Behavioral Risk Factor Survey, 2009-2010

The 2011 Burden of Diabetes in
Crawford County
2010 Hospitalizations - Crawford County
Total Number Number Diabetes-related
(% of total)
Total Charges Diabetes-related Charges
(% of total charges)
All Ages 1,760 345 (19.6%) $39,427,600 $9,487,100 (24.1%)
OTHER INFORMATION ♦ People with pre-diabetes have an increased risk of developing type 2 diabetes, heart disease, and stroke. In
Crawford County, an estimated 4,320 people aged 20 years and older have pre-diabetes. ♦ The cost of diabetes in Crawford County adults is staggering. In 2009 for Crawford County, direct costs were
estimated at $11.5 million, indirect costs were estimated at $5.8 million, totaling an estimated $17.3 million. ♦ Recently, CDC released 2008 county-level age-adjusted prevalence estimates for obesity and physical
inactivity. In Crawford County, 27.4% of people aged 20 years and older were obese and 20.7% of people aged 20 years and older were physically inactive.
PERCENT OF WISCONSIN ADULTS WITH RISK FACTORS BY DIABETES STATUS
The 2011 Burden of Diabetes in Wisconsin is created by the Wisconsin Diabetes Prevention and Control Program (DPCP), Division of Public Health, Department of Health Services. Please see “Detailed Technical Notes” for in-depth information about methodology and data sources. For more information about the Wisconsin Diabetes Prevention and Control Program, go to: http://www.dhs.wisconsin.gov/health/diabetes/. Printing of this document is supported by DPCP partners American Diabetes Association Wisconsin Area, National Kidney Foundation of Wisconsin, and Wisconsin Lions Foundation.
Diabetes Prevalence - Crawford County Age Category
Estimated Number Diagnosed (%)
Estimated Number Undiagnosed (%)
Estimated Total Number (%)
♦ Ages 18 – 44 80 (1.7%) 30 (0.6%) 110 (2.3%)
♦ Ages 45 – 64 360 (7.0%) 130 (2.5%) 490 (9.5%)
♦ Ages 65 + 540 (18.7%) 200 (6.9%) 740 (25.7%)
♦ All Ages Adult * 980 (6.1%) 360 (2.2%) 1,340 (8.3%)
* Percent is age-adjusted (direct method) to the United States 2000 standard population. Total percent may not equal the sum of diagnosed percent and undiagnosed percent, due to rounding.
* Overweight is defined as BMI ≥ 25.0 to < 30.0 kg/m2 * Obesity is defined as BMI ≥ 30.0 kg/m2
13%
36%
66%
71%
87%
53%
19%
21%
32%
24%
63%
26%
0% 10% 20% 30% 40% 50% 60% 70% 80% 90% 100%
6
5
4
3
2
1
No DiabetesDiabetes
Obese*
Overweight/Obese*
High Blood Pressure
High Cholesterol
Lack of Phys. Activ.
Current Smoker
Source: Wisconsin Behavioral Risk Factor Survey, 2009-2010
The 2011 Burden of Diabetes in
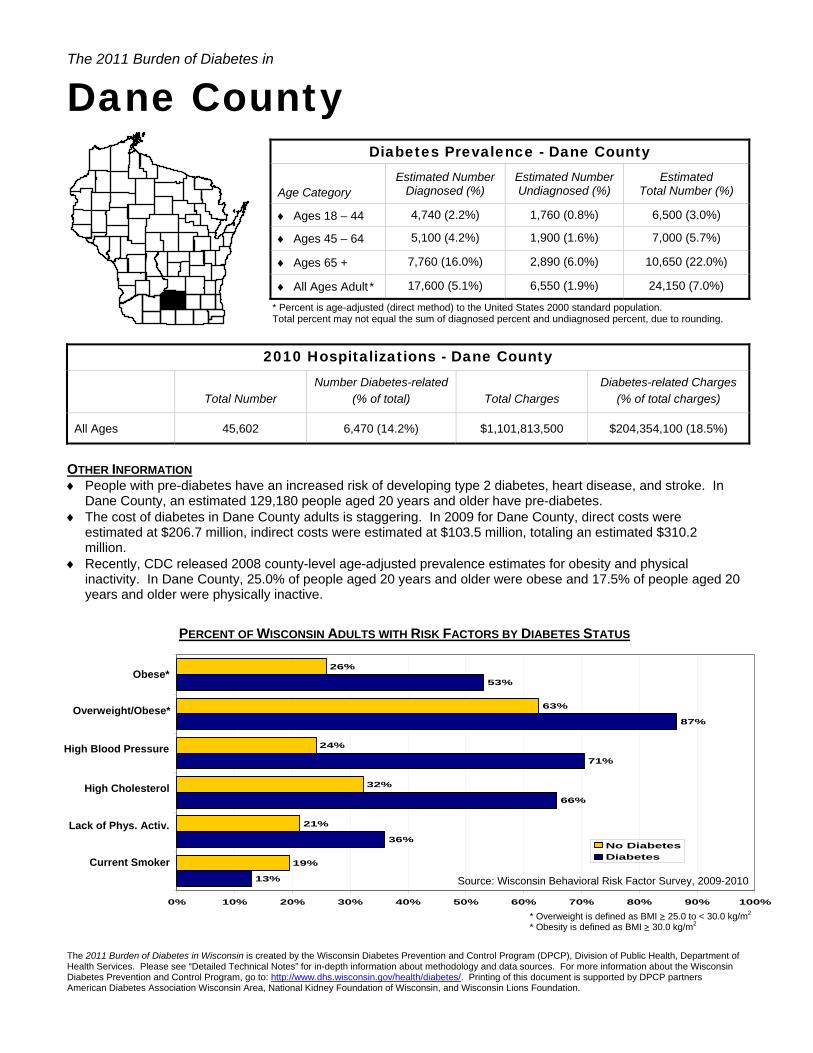
Dane County
2010 Hospitalizations - Dane County
Total Number Number Diabetes-related
(% of total)
Total Charges Diabetes-related Charges
(% of total charges)
All Ages 45,602 6,470 (14.2%) $1,101,813,500 $204,354,100 (18.5%)
OTHER INFORMATION ♦ People with pre-diabetes have an increased risk of developing type 2 diabetes, heart disease, and stroke. In
Dane County, an estimated 129,180 people aged 20 years and older have pre-diabetes. ♦ The cost of diabetes in Dane County adults is staggering. In 2009 for Dane County, direct costs were
estimated at $206.7 million, indirect costs were estimated at $103.5 million, totaling an estimated $310.2 million.
♦ Recently, CDC released 2008 county-level age-adjusted prevalence estimates for obesity and physical inactivity. In Dane County, 25.0% of people aged 20 years and older were obese and 17.5% of people aged 20 years and older were physically inactive.
PERCENT OF WISCONSIN ADULTS WITH RISK FACTORS BY DIABETES STATUS
The 2011 Burden of Diabetes in Wisconsin is created by the Wisconsin Diabetes Prevention and Control Program (DPCP), Division of Public Health, Department of Health Services. Please see “Detailed Technical Notes” for in-depth information about methodology and data sources. For more information about the Wisconsin Diabetes Prevention and Control Program, go to: http://www.dhs.wisconsin.gov/health/diabetes/. Printing of this document is supported by DPCP partners American Diabetes Association Wisconsin Area, National Kidney Foundation of Wisconsin, and Wisconsin Lions Foundation.
Diabetes Prevalence - Dane County Age Category
Estimated Number Diagnosed (%)
Estimated Number Undiagnosed (%)
Estimated Total Number (%)
♦ Ages 18 – 44 4,740 (2.2%) 1,760 (0.8%) 6,500 (3.0%)
♦ Ages 45 – 64 5,100 (4.2%) 1,900 (1.6%) 7,000 (5.7%)
♦ Ages 65 + 7,760 (16.0%) 2,890 (6.0%) 10,650 (22.0%)
♦ All Ages Adult * 17,600 (5.1%) 6,550 (1.9%) 24,150 (7.0%)
* Percent is age-adjusted (direct method) to the United States 2000 standard population. Total percent may not equal the sum of diagnosed percent and undiagnosed percent, due to rounding.
* Overweight is defined as BMI ≥ 25.0 to < 30.0 kg/m2 * Obesity is defined as BMI ≥ 30.0 kg/m2
13%
36%
66%
71%
87%
53%
19%
21%
32%
24%
63%
26%
0% 10% 20% 30% 40% 50% 60% 70% 80% 90% 100%
6
5
4
3
2
1
No DiabetesDiabetes
Obese*
Overweight/Obese*
High Blood Pressure
High Cholesterol
Lack of Phys. Activ.
Current Smoker
Source: Wisconsin Behavioral Risk Factor Survey, 2009-2010

The 2011 Burden of Diabetes in
Dodge County
2010 Hospitalizations - Dodge County
Total Number Number Diabetes-related
(% of total)
Total Charges Diabetes-related Charges
(% of total charges)
All Ages 9,194 1,403 (15.3%) $240,570,900 $40,247,100 (16.7%)
OTHER INFORMATION ♦ People with pre-diabetes have an increased risk of developing type 2 diabetes, heart disease, and stroke. In
Dodge County, an estimated 23,220 people aged 20 years and older have pre-diabetes. ♦ The cost of diabetes in Dodge County adults is staggering. In 2009 for Dodge County, direct costs were
estimated at $55.0 million, indirect costs were estimated at $27.5 million, totaling an estimated $82.5 million. ♦ Recently, CDC released 2008 county-level age-adjusted prevalence estimates for obesity and physical
inactivity. In Dodge County, 30.5% of people aged 20 years and older were obese and 21.6% of people aged 20 years and older were physically inactive.
PERCENT OF WISCONSIN ADULTS WITH RISK FACTORS BY DIABETES STATUS
The 2011 Burden of Diabetes in Wisconsin is created by the Wisconsin Diabetes Prevention and Control Program (DPCP), Division of Public Health, Department of Health Services. Please see “Detailed Technical Notes” for in-depth information about methodology and data sources. For more information about the Wisconsin Diabetes Prevention and Control Program, go to: http://www.dhs.wisconsin.gov/health/diabetes/. Printing of this document is supported by DPCP partners American Diabetes Association Wisconsin Area, National Kidney Foundation of Wisconsin, and Wisconsin Lions Foundation.
Diabetes Prevalence - Dodge County Age Category
Estimated Number Diagnosed (%)
Estimated Number Undiagnosed (%)
Estimated Total Number (%)
♦ Ages 18 – 44 610 (2.0%) 230 (0.7%) 840 (2.7%)
♦ Ages 45 – 64 1,780 (7.2%) 660 (2.7%) 2,440 (9.8%)
♦ Ages 65 + 2,290 (18.6%) 850 (6.9%) 3,140 (25.5%)
♦ All Ages Adult * 4,680 (6.3%) 1,740 (2.3%) 6,420 (8.6%)
* Percent is age-adjusted (direct method) to the United States 2000 standard population. Total percent may not equal the sum of diagnosed percent and undiagnosed percent, due to rounding.
* Overweight is defined as BMI ≥ 25.0 to < 30.0 kg/m2 * Obesity is defined as BMI ≥ 30.0 kg/m2
13%
36%
66%
71%
87%
53%
19%
21%
32%
24%
63%
26%
0% 10% 20% 30% 40% 50% 60% 70% 80% 90% 100%
6
5
4
3
2
1
No DiabetesDiabetes
Obese*
Overweight/Obese*
High Blood Pressure
High Cholesterol
Lack of Phys. Activ.
Current Smoker
Source: Wisconsin Behavioral Risk Factor Survey, 2009-2010

The 2011 Burden of Diabetes in
Door County
2010 Hospitalizations - Door County
Total Number Number Diabetes-related
(% of total)
Total Charges Diabetes-related Charges
(% of total charges)
All Ages 3,014 516 (17.1%) $70,513,400 $11,983,300 (17.0%)
OTHER INFORMATION ♦ People with pre-diabetes have an increased risk of developing type 2 diabetes, heart disease, and stroke. In
Door County, an estimated 7,760 people aged 20 years and older have pre-diabetes. ♦ The cost of diabetes in Door County adults is staggering. In 2009 for Door County, direct costs were estimated
at $28.5 million, indirect costs were estimated at $14.3 million, totaling an estimated $42.8 million. ♦ Recently, CDC released 2008 county-level age-adjusted prevalence estimates for obesity and physical
inactivity. In Door County, 27.0% of people aged 20 years and older were obese and 19.7% of people aged 20 years and older were physically inactive.
PERCENT OF WISCONSIN ADULTS WITH RISK FACTORS BY DIABETES STATUS
The 2011 Burden of Diabetes in Wisconsin is created by the Wisconsin Diabetes Prevention and Control Program (DPCP), Division of Public Health, Department of Health Services. Please see “Detailed Technical Notes” for in-depth information about methodology and data sources. For more information about the Wisconsin Diabetes Prevention and Control Program, go to: http://www.dhs.wisconsin.gov/health/diabetes/. Printing of this document is supported by DPCP partners American Diabetes Association Wisconsin Area, National Kidney Foundation of Wisconsin, and Wisconsin Lions Foundation.
Diabetes Prevalence - Door County Age Category
Estimated Number Diagnosed (%)
Estimated Number Undiagnosed (%)
Estimated Total Number (%)
♦ Ages 18 – 44 140 (2.0%) 50 (0.7%) 190 (2.8%)
♦ Ages 45 – 64 1,080 (11.2%) 400 (4.1%) 1,480 (15.3%)
♦ Ages 65 + 1,210 (19.7%) 450 (7.3%) 1,660 (27.0%)
♦ All Ages Adult * 2,430 (7.7%) 900 (2.8%) 3,330 (10.5%)
* Percent is age-adjusted (direct method) to the United States 2000 standard population. Total percent may not equal the sum of diagnosed percent and undiagnosed percent, due to rounding.
* Overweight is defined as BMI ≥ 25.0 to < 30.0 kg/m2 * Obesity is defined as BMI ≥ 30.0 kg/m2
13%
36%
66%
71%
87%
53%
19%
21%
32%
24%
63%
26%
0% 10% 20% 30% 40% 50% 60% 70% 80% 90% 100%
6
5
4
3
2
1
No DiabetesDiabetes
Obese*
Overweight/Obese*
High Blood Pressure
High Cholesterol
Lack of Phys. Activ.
Current Smoker
Source: Wisconsin Behavioral Risk Factor Survey, 2009-2010

The 2011 Burden of Diabetes in
Douglas County
2010 Hospitalizations - Douglas County
Total Number Number Diabetes-related
(% of total)
Total Charges Diabetes-related Charges
(% of total charges)
All Ages 390 95 (24.4%) $4,790,600 $807,100 (16.8%)
OTHER INFORMATION ♦ People with pre-diabetes have an increased risk of developing type 2 diabetes, heart disease, and stroke. In
Douglas County, an estimated 11,860 people aged 20 years and older have pre-diabetes. ♦ The cost of diabetes in Douglas County adults is staggering. In 2009 for Douglas County, direct costs were
estimated at $31.9 million, indirect costs were estimated at $16.0 million, totaling an estimated $47.9 million. ♦ Recently, CDC released 2008 county-level age-adjusted prevalence estimates for obesity and physical
inactivity. In Douglas County, 28.4% of people aged 20 years and older were obese and 20.8% of people aged 20 years and older were physically inactive.
PERCENT OF WISCONSIN ADULTS WITH RISK FACTORS BY DIABETES STATUS
The 2011 Burden of Diabetes in Wisconsin is created by the Wisconsin Diabetes Prevention and Control Program (DPCP), Division of Public Health, Department of Health Services. Please see “Detailed Technical Notes” for in-depth information about methodology and data sources. For more information about the Wisconsin Diabetes Prevention and Control Program, go to: http://www.dhs.wisconsin.gov/health/diabetes/. Printing of this document is supported by DPCP partners American Diabetes Association Wisconsin Area, National Kidney Foundation of Wisconsin, and Wisconsin Lions Foundation.
Diabetes Prevalence - Douglas County Age Category
Estimated Number Diagnosed (%)
Estimated Number Undiagnosed (%)
Estimated Total Number (%)
♦ Ages 18 – 44 290 (1.8%) 110 (0.7%) 400 (2.5%)
♦ Ages 45 – 64 1,110 (8.8%) 410 (3.3%) 1,520 (12.1%)
♦ Ages 65 + 1,320 (19.8%) 490 (7.4%) 1,810 (27.2%)
♦ All Ages Adult * 2,720 (6.9%) 1,010 (2.6%) 3,730 (9.5%)
* Percent is age-adjusted (direct method) to the United States 2000 standard population. Total percent may not equal the sum of diagnosed percent and undiagnosed percent, due to rounding.
* Overweight is defined as BMI ≥ 25.0 to < 30.0 kg/m2 * Obesity is defined as BMI ≥ 30.0 kg/m2
13%
36%
66%
71%
87%
53%
19%
21%
32%
24%
63%
26%
0% 10% 20% 30% 40% 50% 60% 70% 80% 90% 100%
6
5
4
3
2
1
No DiabetesDiabetes
Obese*
Overweight/Obese*
High Blood Pressure
High Cholesterol
Lack of Phys. Activ.
Current Smoker
Source: Wisconsin Behavioral Risk Factor Survey, 2009-2010

The 2011 Burden of Diabetes in
Dunn County
2010 Hospitalizations - Dunn County
Total Number Number Diabetes-related
(% of total)
Total Charges Diabetes-related Charges
(% of total charges)
All Ages 3,744 544 (14.5%) $64,935,300 $11,052,000 (17.0%)
OTHER INFORMATION ♦ People with pre-diabetes have an increased risk of developing type 2 diabetes, heart disease, and stroke. In
Dunn County, an estimated 11,030 people aged 20 years and older have pre-diabetes. ♦ The cost of diabetes in Dunn County adults is staggering. In 2009 for Dunn County, direct costs were
estimated at $25.1 million, indirect costs were estimated at $12.6 million, totaling an estimated $37.7 million. ♦ Recently, CDC released 2008 county-level age-adjusted prevalence estimates for obesity and physical
inactivity. In Dunn County, 27.8% of people aged 20 years and older were obese and 21.7% of people aged 20 years and older were physically inactive.
PERCENT OF WISCONSIN ADULTS WITH RISK FACTORS BY DIABETES STATUS
The 2011 Burden of Diabetes in Wisconsin is created by the Wisconsin Diabetes Prevention and Control Program (DPCP), Division of Public Health, Department of Health Services. Please see “Detailed Technical Notes” for in-depth information about methodology and data sources. For more information about the Wisconsin Diabetes Prevention and Control Program, go to: http://www.dhs.wisconsin.gov/health/diabetes/. Printing of this document is supported by DPCP partners American Diabetes Association Wisconsin Area, National Kidney Foundation of Wisconsin, and Wisconsin Lions Foundation.
Diabetes Prevalence - Dunn County Age Category
Estimated Number Diagnosed (%)
Estimated Number Undiagnosed (%)
Estimated Total Number (%)
♦ Ages 18 – 44 270 (1.5%) 110 (0.6%) 380 (2.1%)
♦ Ages 45 – 64 840 (8.1%) 310 (3.0%) 1,150 (11.1%)
♦ Ages 65 + 1,030 (19.8%) 380 (7.3%) 1,410 (27.1%)
♦ All Ages Adult * 2,140 (6.5%) 800 (2.4%) 2,940 (8.9%)
* Percent is age-adjusted (direct method) to the United States 2000 standard population. Total percent may not equal the sum of diagnosed percent and undiagnosed percent, due to rounding.
* Overweight is defined as BMI ≥ 25.0 to < 30.0 kg/m2 * Obesity is defined as BMI ≥ 30.0 kg/m2
13%
36%
66%
71%
87%
53%
19%
21%
32%
24%
63%
26%
0% 10% 20% 30% 40% 50% 60% 70% 80% 90% 100%
6
5
4
3
2
1
No DiabetesDiabetes
Obese*
Overweight/Obese*
High Blood Pressure
High Cholesterol
Lack of Phys. Activ.
Current Smoker
Source: Wisconsin Behavioral Risk Factor Survey, 2009-2010

The 2011 Burden of Diabetes in
Eau Claire County
2010 Hospitalizations - Eau Claire County
Total Number Number Diabetes-related
(% of total)
Total Charges Diabetes-related Charges
(% of total charges)
All Ages 10,627 1,502 (14.1%) $218,943,000 $34,766,800 (15.9%)
OTHER INFORMATION ♦ People with pre-diabetes have an increased risk of developing type 2 diabetes, heart disease, and stroke. In
Eau Claire County, an estimated 25,750 people aged 20 years and older have pre-diabetes. ♦ The cost of diabetes in Eau Claire County adults is staggering. In 2009 for Eau Claire County, direct costs
were estimated at $60.1 million, indirect costs were estimated at $30.1 million, totaling an estimated $90.2 million.
♦ Recently, CDC released 2008 county-level age-adjusted prevalence estimates for obesity and physical inactivity. In Eau Claire County, 26.3% of people aged 20 years and older were obese and 22.3% of people aged 20 years and older were physically inactive.
PERCENT OF WISCONSIN ADULTS WITH RISK FACTORS BY DIABETES STATUS
The 2011 Burden of Diabetes in Wisconsin is created by the Wisconsin Diabetes Prevention and Control Program (DPCP), Division of Public Health, Department of Health Services. Please see “Detailed Technical Notes” for in-depth information about methodology and data sources. For more information about the Wisconsin Diabetes Prevention and Control Program, go to: http://www.dhs.wisconsin.gov/health/diabetes/. Printing of this document is supported by DPCP partners American Diabetes Association Wisconsin Area, National Kidney Foundation of Wisconsin, and Wisconsin Lions Foundation.
Diabetes Prevalence - Eau Claire County Age Category
Estimated Number Diagnosed (%)
Estimated Number Undiagnosed (%)
Estimated Total Number (%)
♦ Ages 18 – 44 650 (1.5%) 240 (0.6%) 890 (2.1%)
♦ Ages 45 – 64 1,950 (8.3%) 720 (3.1%) 2,670 (11.4%)
♦ Ages 65 + 2,520 (19.8%) 940 (7.4%) 3,460 (27.2%)
♦ All Ages Adult * 5,120 (6.6%) 1,900 (2.5%) 7,020 (9.1%)
* Percent is age-adjusted (direct method) to the United States 2000 standard population. Total percent may not equal the sum of diagnosed percent and undiagnosed percent, due to rounding.
* Overweight is defined as BMI ≥ 25.0 to < 30.0 kg/m2 * Obesity is defined as BMI ≥ 30.0 kg/m2
13%
36%
66%
71%
87%
53%
19%
21%
32%
24%
63%
26%
0% 10% 20% 30% 40% 50% 60% 70% 80% 90% 100%
6
5
4
3
2
1
No DiabetesDiabetes
Obese*
Overweight/Obese*
High Blood Pressure
High Cholesterol
Lack of Phys. Activ.
Current Smoker
Source: Wisconsin Behavioral Risk Factor Survey, 2009-2010

The 2011 Burden of Diabetes in
Florence County
2010 Hospitalizations - Florence County
Total Number Number Diabetes-related
(% of total)
Total Charges Diabetes-related Charges
(% of total charges)
All Ages 134 12 (9.0%) $4,655,700 $641,700 (13.8%)
OTHER INFORMATION ♦ People with pre-diabetes have an increased risk of developing type 2 diabetes, heart disease, and stroke. In
Florence County, an estimated 1,290 people aged 20 years and older have pre-diabetes. ♦ The cost of diabetes in Florence County adults is staggering. In 2009 for Florence County, direct costs were
estimated at $4.3 million, indirect costs were estimated at $2.2 million, totaling an estimated $6.5 million. ♦ Recently, CDC released 2008 county-level age-adjusted prevalence estimates for obesity and physical
inactivity. In Florence County, 28.1% of people aged 20 years and older were obese and 22.2% of people aged 20 years and older were physically inactive.
PERCENT OF WISCONSIN ADULTS WITH RISK FACTORS BY DIABETES STATUS
The 2011 Burden of Diabetes in Wisconsin is created by the Wisconsin Diabetes Prevention and Control Program (DPCP), Division of Public Health, Department of Health Services. Please see “Detailed Technical Notes” for in-depth information about methodology and data sources. For more information about the Wisconsin Diabetes Prevention and Control Program, go to: http://www.dhs.wisconsin.gov/health/diabetes/. Printing of this document is supported by DPCP partners American Diabetes Association Wisconsin Area, National Kidney Foundation of Wisconsin, and Wisconsin Lions Foundation.
Diabetes Prevalence - Florence County Age Category
Estimated Number Diagnosed (%)
Estimated Number Undiagnosed (%)
Estimated Total Number (%)
♦ Ages 18 – 44 10 (0.9%) 10 (0.9%)
♦ Ages 45 – 64 180 (10.3%) 70 (4.0%) 250 (14.3%)
♦ Ages 65 + 180 (19.6%) 70 (7.6%) 250 (27.2%)
♦ All Ages Adult * 370 (6.8%) 140 (2.5%) 510 (9.3%)
Number and percent suppressed because count is <10. * Percent is age-adjusted (direct method) to the United States 2000 standard population. Total percent may not equal the sum of diagnosed percent and undiagnosed percent, due to rounding.
* Overweight is defined as BMI ≥ 25.0 to < 30.0 kg/m2 * Obesity is defined as BMI ≥ 30.0 kg/m2
13%
36%
66%
71%
87%
53%
19%
21%
32%
24%
63%
26%
0% 10% 20% 30% 40% 50% 60% 70% 80% 90% 100%
6
5
4
3
2
1
No DiabetesDiabetes
Obese*
Overweight/Obese*
High Blood Pressure
High Cholesterol
Lack of Phys. Activ.
Current Smoker
Source: Wisconsin Behavioral Risk Factor Survey, 2009-2010

The 2011 Burden of Diabetes in
Fond du Lac County
2010 Hospitalizations - Fond du Lac County
Total Number Number Diabetes-related
(% of total)
Total Charges Diabetes-related Charges
(% of total charges)
All Ages 9,868 1,482 (15.0%) $221,919,800 $38,503,900 (17.4%)
OTHER INFORMATION ♦ People with pre-diabetes have an increased risk of developing type 2 diabetes, heart disease, and stroke. In
Fond du Lac County, an estimated 26,040 people aged 20 years and older have pre-diabetes. ♦ The cost of diabetes in Fond du Lac County adults is staggering. In 2009 for Fond du Lac County, direct costs
were estimated at $79.3 million, indirect costs were estimated at $39.7 million, totaling an estimated $119.0 million.
♦ Recently, CDC released 2008 county-level age-adjusted prevalence estimates for obesity and physical inactivity. In Fond du Lac County, 29.2% of people aged 20 years and older were obese and 23.4% of people aged 20 years and older were physically inactive.
PERCENT OF WISCONSIN ADULTS WITH RISK FACTORS BY DIABETES STATUS
The 2011 Burden of Diabetes in Wisconsin is created by the Wisconsin Diabetes Prevention and Control Program (DPCP), Division of Public Health, Department of Health Services. Please see “Detailed Technical Notes” for in-depth information about methodology and data sources. For more information about the Wisconsin Diabetes Prevention and Control Program, go to: http://www.dhs.wisconsin.gov/health/diabetes/. Printing of this document is supported by DPCP partners American Diabetes Association Wisconsin Area, National Kidney Foundation of Wisconsin, and Wisconsin Lions Foundation.
Diabetes Prevalence - Fond du Lac County Age Category
Estimated Number Diagnosed (%)
Estimated Number Undiagnosed (%)
Estimated Total Number (%)
♦ Ages 18 – 44 690 (2.0%) 260 (0.8%) 950 (2.7%)
♦ Ages 45 – 64 3,150 (11.2%) 1,170 (4.2%) 4,320 (15.4%)
♦ Ages 65 + 2,910 (19.8%) 1,080 (7.4%) 3,990 (27.2%)
♦ All Ages Adult * 6,750 (7.7%) 2,510 (2.9%) 9,260 (10.6%)
* Percent is age-adjusted (direct method) to the United States 2000 standard population. Total percent may not equal the sum of diagnosed percent and undiagnosed percent, due to rounding.
* Overweight is defined as BMI ≥ 25.0 to < 30.0 kg/m2 * Obesity is defined as BMI ≥ 30.0 kg/m2
13%
36%
66%
71%
87%
53%
19%
21%
32%
24%
63%
26%
0% 10% 20% 30% 40% 50% 60% 70% 80% 90% 100%
6
5
4
3
2
1
No DiabetesDiabetes
Obese*
Overweight/Obese*
High Blood Pressure
High Cholesterol
Lack of Phys. Activ.
Current Smoker
Source: Wisconsin Behavioral Risk Factor Survey, 2009-2010

The 2011 Burden of Diabetes in
Forest County
2010 Hospitalizations - Forest County
Total Number Number Diabetes-related
(% of total)
Total Charges Diabetes-related Charges
(% of total charges)
All Ages 1,214 233 (19.2%) $26,682,100 $6,028,400 (22.6%)
OTHER INFORMATION ♦ People with pre-diabetes have an increased risk of developing type 2 diabetes, heart disease, and stroke. In
Forest County, an estimated 2,540 people aged 20 years and older have pre-diabetes. ♦ The cost of diabetes in Forest County adults is staggering. In 2009 for Forest County, direct costs were
estimated at $10.6 million, indirect costs were estimated at $5.3 million, totaling an estimated $15.9 million. ♦ Recently, CDC released 2008 county-level age-adjusted prevalence estimates for obesity and physical
inactivity. In Forest County, 29.7% of people aged 20 years and older were obese and 23.5% of people aged 20 years and older were physically inactive.
PERCENT OF WISCONSIN ADULTS WITH RISK FACTORS BY DIABETES STATUS
The 2011 Burden of Diabetes in Wisconsin is created by the Wisconsin Diabetes Prevention and Control Program (DPCP), Division of Public Health, Department of Health Services. Please see “Detailed Technical Notes” for in-depth information about methodology and data sources. For more information about the Wisconsin Diabetes Prevention and Control Program, go to: http://www.dhs.wisconsin.gov/health/diabetes/. Printing of this document is supported by DPCP partners American Diabetes Association Wisconsin Area, National Kidney Foundation of Wisconsin, and Wisconsin Lions Foundation.
Diabetes Prevalence - Forest County Age Category
Estimated Number Diagnosed (%)
Estimated Number Undiagnosed (%)
Estimated Total Number (%)
♦ Ages 18 – 44 120 (4.3%) 50 (1.8%) 170 (6.2%)
♦ Ages 45 – 64 370 (13.7%) 140 (5.2%) 510 (18.9%)
♦ Ages 65 + 410 (19.7%) 150 (7.2%) 560 (26.9%)
♦ All Ages Adult * 900 (9.7%) 340 (3.7%) 1,240 (13.4%)
* Percent is age-adjusted (direct method) to the United States 2000 standard population. Total percent may not equal the sum of diagnosed percent and undiagnosed percent, due to rounding.
* Overweight is defined as BMI ≥ 25.0 to < 30.0 kg/m2 * Obesity is defined as BMI ≥ 30.0 kg/m2
13%
36%
66%
71%
87%
53%
19%
21%
32%
24%
63%
26%
0% 10% 20% 30% 40% 50% 60% 70% 80% 90% 100%
6
5
4
3
2
1
No DiabetesDiabetes
Obese*
Overweight/Obese*
High Blood Pressure
High Cholesterol
Lack of Phys. Activ.
Current Smoker
Source: Wisconsin Behavioral Risk Factor Survey, 2009-2010

The 2011 Burden of Diabetes in
Grant County
2010 Hospitalizations - Grant County
Total Number Number Diabetes-related
(% of total)
Total Charges Diabetes-related Charges
(% of total charges)
All Ages 3,699 621 (16.8%) $76,742,500 $15,059,600 (19.6%)
OTHER INFORMATION ♦ People with pre-diabetes have an increased risk of developing type 2 diabetes, heart disease, and stroke. In
Grant County, an estimated 12,530 people aged 20 years and older have pre-diabetes. ♦ The cost of diabetes in Grant County adults is staggering. In 2009 for Grant County, direct costs were
estimated at $30.8 million, indirect costs were estimated at $15.4 million, totaling an estimated $46.2 million. ♦ Recently, CDC released 2008 county-level age-adjusted prevalence estimates for obesity and physical
inactivity. In Grant County, 27.3% of people aged 20 years and older were obese and 21.2% of people aged 20 years and older were physically inactive.
PERCENT OF WISCONSIN ADULTS WITH RISK FACTORS BY DIABETES STATUS
The 2011 Burden of Diabetes in Wisconsin is created by the Wisconsin Diabetes Prevention and Control Program (DPCP), Division of Public Health, Department of Health Services. Please see “Detailed Technical Notes” for in-depth information about methodology and data sources. For more information about the Wisconsin Diabetes Prevention and Control Program, go to: http://www.dhs.wisconsin.gov/health/diabetes/. Printing of this document is supported by DPCP partners American Diabetes Association Wisconsin Area, National Kidney Foundation of Wisconsin, and Wisconsin Lions Foundation.
Diabetes Prevalence - Grant County Age Category
Estimated Number Diagnosed (%)
Estimated Number Undiagnosed (%)
Estimated Total Number (%)
♦ Ages 18 – 44 280 (1.6%) 110 (0.6%) 390 (2.2%)
♦ Ages 45 – 64 870 (6.9%) 320 (2.5%) 1,190 (9.4%)
♦ Ages 65 + 1,470 (18.5%) 550 (6.9%) 2,020 (25.4%)
♦ All Ages Adult * 2,620 (6.0%) 980 (2.2%) 3,600 (8.2%)
* Percent is age-adjusted (direct method) to the United States 2000 standard population. Total percent may not equal the sum of diagnosed percent and undiagnosed percent, due to rounding.
* Overweight is defined as BMI ≥ 25.0 to < 30.0 kg/m2 * Obesity is defined as BMI ≥ 30.0 kg/m2
13%
36%
66%
71%
87%
53%
19%
21%
32%
24%
63%
26%
0% 10% 20% 30% 40% 50% 60% 70% 80% 90% 100%
6
5
4
3
2
1
No DiabetesDiabetes
Obese*
Overweight/Obese*
High Blood Pressure
High Cholesterol
Lack of Phys. Activ.
Current Smoker
Source: Wisconsin Behavioral Risk Factor Survey, 2009-2010
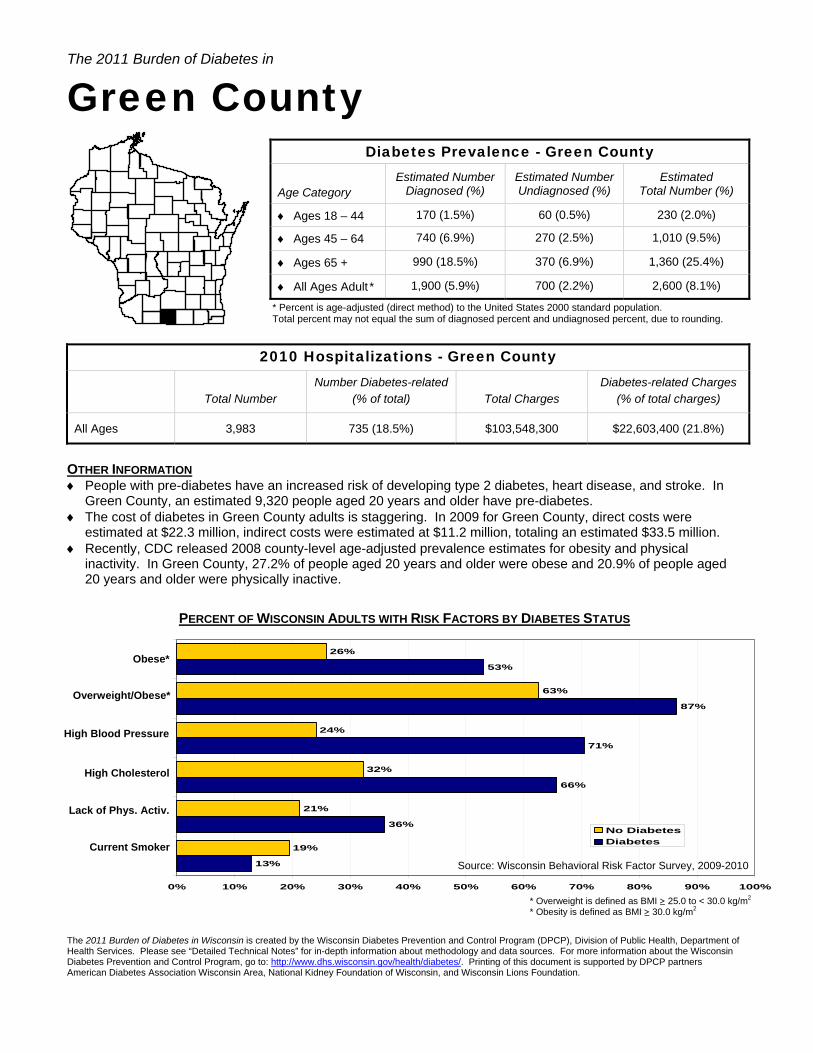
The 2011 Burden of Diabetes in
Green County
2010 Hospitalizations - Green County
Total Number Number Diabetes-related
(% of total)
Total Charges Diabetes-related Charges
(% of total charges)
All Ages 3,983 735 (18.5%) $103,548,300 $22,603,400 (21.8%)
OTHER INFORMATION ♦ People with pre-diabetes have an increased risk of developing type 2 diabetes, heart disease, and stroke. In
Green County, an estimated 9,320 people aged 20 years and older have pre-diabetes. ♦ The cost of diabetes in Green County adults is staggering. In 2009 for Green County, direct costs were
estimated at $22.3 million, indirect costs were estimated at $11.2 million, totaling an estimated $33.5 million. ♦ Recently, CDC released 2008 county-level age-adjusted prevalence estimates for obesity and physical
inactivity. In Green County, 27.2% of people aged 20 years and older were obese and 20.9% of people aged 20 years and older were physically inactive.
PERCENT OF WISCONSIN ADULTS WITH RISK FACTORS BY DIABETES STATUS
The 2011 Burden of Diabetes in Wisconsin is created by the Wisconsin Diabetes Prevention and Control Program (DPCP), Division of Public Health, Department of Health Services. Please see “Detailed Technical Notes” for in-depth information about methodology and data sources. For more information about the Wisconsin Diabetes Prevention and Control Program, go to: http://www.dhs.wisconsin.gov/health/diabetes/. Printing of this document is supported by DPCP partners American Diabetes Association Wisconsin Area, National Kidney Foundation of Wisconsin, and Wisconsin Lions Foundation.
Diabetes Prevalence - Green County Age Category
Estimated Number Diagnosed (%)
Estimated Number Undiagnosed (%)
Estimated Total Number (%)
♦ Ages 18 – 44 170 (1.5%) 60 (0.5%) 230 (2.0%)
♦ Ages 45 – 64 740 (6.9%) 270 (2.5%) 1,010 (9.5%)
♦ Ages 65 + 990 (18.5%) 370 (6.9%) 1,360 (25.4%)
♦ All Ages Adult * 1,900 (5.9%) 700 (2.2%) 2,600 (8.1%)
* Percent is age-adjusted (direct method) to the United States 2000 standard population. Total percent may not equal the sum of diagnosed percent and undiagnosed percent, due to rounding.
* Overweight is defined as BMI ≥ 25.0 to < 30.0 kg/m2 * Obesity is defined as BMI ≥ 30.0 kg/m2
13%
36%
66%
71%
87%
53%
19%
21%
32%
24%
63%
26%
0% 10% 20% 30% 40% 50% 60% 70% 80% 90% 100%
6
5
4
3
2
1
No DiabetesDiabetes
Obese*
Overweight/Obese*
High Blood Pressure
High Cholesterol
Lack of Phys. Activ.
Current Smoker
Source: Wisconsin Behavioral Risk Factor Survey, 2009-2010

The 2011 Burden of Diabetes in
Green Lake County
2010 Hospitalizations - Green Lake County
Total Number Number Diabetes-related
(% of total)
Total Charges Diabetes-related Charges
(% of total charges)
All Ages 2,329 462 (19.8%) $47,402,200 $10,158,400 (21.4%)
OTHER INFORMATION ♦ People with pre-diabetes have an increased risk of developing type 2 diabetes, heart disease, and stroke. In
Green Lake County, an estimated 4,870 people aged 20 years and older have pre-diabetes. ♦ The cost of diabetes in Green Lake County adults is staggering. In 2009 for Green Lake County, direct costs
were estimated at $16.7 million, indirect costs were estimated at $8.3 million, totaling an estimated $25.0 million.
♦ Recently, CDC released 2008 county-level age-adjusted prevalence estimates for obesity and physical inactivity. In Green Lake County, 26.8% of people aged 20 years and older were obese and 21.4% of people aged 20 years and older were physically inactive.
PERCENT OF WISCONSIN ADULTS WITH RISK FACTORS BY DIABETES STATUS
The 2011 Burden of Diabetes in Wisconsin is created by the Wisconsin Diabetes Prevention and Control Program (DPCP), Division of Public Health, Department of Health Services. Please see “Detailed Technical Notes” for in-depth information about methodology and data sources. For more information about the Wisconsin Diabetes Prevention and Control Program, go to: http://www.dhs.wisconsin.gov/health/diabetes/. Printing of this document is supported by DPCP partners American Diabetes Association Wisconsin Area, National Kidney Foundation of Wisconsin, and Wisconsin Lions Foundation.
Diabetes Prevalence - Green Lake County Age Category
Estimated Number Diagnosed (%)
Estimated Number Undiagnosed (%)
Estimated Total Number (%)
♦ Ages 18 – 44 90 (1.8%) 30 (0.6%) 120 (2.4%)
♦ Ages 45 – 64 630 (11.0%) 240 (4.2%) 870 (15.2%)
♦ Ages 65 + 700 (19.8%) 260 (7.4%) 960 (27.2%)
♦ All Ages Adult * 1,420 (7.5%) 530 (2.8%) 1,950 (10.3%)
* Percent is age-adjusted (direct method) to the United States 2000 standard population. Total percent may not equal the sum of diagnosed percent and undiagnosed percent, due to rounding.
* Overweight is defined as BMI ≥ 25.0 to < 30.0 kg/m2 * Obesity is defined as BMI ≥ 30.0 kg/m2
13%
36%
66%
71%
87%
53%
19%
21%
32%
24%
63%
26%
0% 10% 20% 30% 40% 50% 60% 70% 80% 90% 100%
6
5
4
3
2
1
No DiabetesDiabetes
Obese*
Overweight/Obese*
High Blood Pressure
High Cholesterol
Lack of Phys. Activ.
Current Smoker
Source: Wisconsin Behavioral Risk Factor Survey, 2009-2010

The 2011 Burden of Diabetes in
Iowa County
2010 Hospitalizations - Iowa County
Total Number Number Diabetes-related
(% of total)
Total Charges Diabetes-related Charges
(% of total charges)
All Ages 2,365 436 (18.4%) $55,840,300 $12,262,300 (22.0%)
OTHER INFORMATION ♦ People with pre-diabetes have an increased risk of developing type 2 diabetes, heart disease, and stroke. In
Iowa County, an estimated 6,060 people aged 20 years and older have pre-diabetes. ♦ The cost of diabetes in Iowa County adults is staggering. In 2009 for Iowa County, direct costs were estimated
at $14.0 million, indirect costs were estimated at $7.0 million, totaling an estimated $21.0 million. ♦ Recently, CDC released 2008 county-level age-adjusted prevalence estimates for obesity and physical
inactivity. In Iowa County, 28.7% of people aged 20 years and older were obese and 20.2% of people aged 20 years and older were physically inactive.
PERCENT OF WISCONSIN ADULTS WITH RISK FACTORS BY DIABETES STATUS
The 2011 Burden of Diabetes in Wisconsin is created by the Wisconsin Diabetes Prevention and Control Program (DPCP), Division of Public Health, Department of Health Services. Please see “Detailed Technical Notes” for in-depth information about methodology and data sources. For more information about the Wisconsin Diabetes Prevention and Control Program, go to: http://www.dhs.wisconsin.gov/health/diabetes/. Printing of this document is supported by DPCP partners American Diabetes Association Wisconsin Area, National Kidney Foundation of Wisconsin, and Wisconsin Lions Foundation.
Diabetes Prevalence - Iowa County Age Category
Estimated Number Diagnosed (%)
Estimated Number Undiagnosed (%)
Estimated Total Number (%)
♦ Ages 18 – 44 110 (1.5%) 40 (0.5%) 150 (2.0%)
♦ Ages 45 – 64 480 (6.8%) 180 (2.5%) 660 (9.3%)
♦ Ages 65 + 600 (18.6%) 220 (6.8%) 820 (25.4%)
♦ All Ages Adult * 1,190 (5.9%) 440 (2.2%) 1,630 (8.1%)
* Percent is age-adjusted (direct method) to the United States 2000 standard population. Total percent may not equal the sum of diagnosed percent and undiagnosed percent, due to rounding.
* Overweight is defined as BMI ≥ 25.0 to < 30.0 kg/m2 * Obesity is defined as BMI ≥ 30.0 kg/m2
13%
36%
66%
71%
87%
53%
19%
21%
32%
24%
63%
26%
0% 10% 20% 30% 40% 50% 60% 70% 80% 90% 100%
6
5
4
3
2
1
No DiabetesDiabetes
Obese*
Overweight/Obese*
High Blood Pressure
High Cholesterol
Lack of Phys. Activ.
Current Smoker
Source: Wisconsin Behavioral Risk Factor Survey, 2009-2010

The 2011 Burden of Diabetes in
Iron County
2010 Hospitalizations - Iron County
Total Number Number Diabetes-related
(% of total)
Total Charges Diabetes-related Charges
(% of total charges)
All Ages 390 58 (14.9%) $10,633,700 $1,567,500 (14.7%)
OTHER INFORMATION ♦ People with pre-diabetes have an increased risk of developing type 2 diabetes, heart disease, and stroke. In
Iron County, an estimated 1,750 people aged 20 years and older have pre-diabetes. ♦ The cost of diabetes in Iron County adults is staggering. In 2009 for Iron County, direct costs were estimated at
$6.2 million, indirect costs were estimated at $3.1 million, totaling an estimated $9.3 million. ♦ Recently, CDC released 2008 county-level age-adjusted prevalence estimates for obesity and physical
inactivity. In Iron County, 27.2% of people aged 20 years and older were obese and 20.1% of people aged 20 years and older were physically inactive.
PERCENT OF WISCONSIN ADULTS WITH RISK FACTORS BY DIABETES STATUS
The 2011 Burden of Diabetes in Wisconsin is created by the Wisconsin Diabetes Prevention and Control Program (DPCP), Division of Public Health, Department of Health Services. Please see “Detailed Technical Notes” for in-depth information about methodology and data sources. For more information about the Wisconsin Diabetes Prevention and Control Program, go to: http://www.dhs.wisconsin.gov/health/diabetes/. Printing of this document is supported by DPCP partners American Diabetes Association Wisconsin Area, National Kidney Foundation of Wisconsin, and Wisconsin Lions Foundation.
Diabetes Prevalence - Iron County Age Category
Estimated Number Diagnosed (%)
Estimated Number Undiagnosed (%)
Estimated Total Number (%)
♦ Ages 18 – 44 20 (1.3%) 10 (0.7%) 30 (2.0%)
♦ Ages 45 – 64 220 (10.5%) 80 (3.8%) 300 (14.3%)
♦ Ages 65 + 290 (19.4%) 110 (7.3%) 400 (26.7%)
♦ All Ages Adult * 530 (7.1%) 200 (2.7%) 730 (9.8%)
* Percent is age-adjusted (direct method) to the United States 2000 standard population. Total percent may not equal the sum of diagnosed percent and undiagnosed percent, due to rounding.
* Overweight is defined as BMI ≥ 25.0 to < 30.0 kg/m2 * Obesity is defined as BMI ≥ 30.0 kg/m2
13%
36%
66%
71%
87%
53%
19%
21%
32%
24%
63%
26%
0% 10% 20% 30% 40% 50% 60% 70% 80% 90% 100%
6
5
4
3
2
1
No DiabetesDiabetes
Obese*
Overweight/Obese*
High Blood Pressure
High Cholesterol
Lack of Phys. Activ.
Current Smoker
Source: Wisconsin Behavioral Risk Factor Survey, 2009-2010

The 2011 Burden of Diabetes in
Jackson County
2010 Hospitalizations - Jackson County
Total Number Number Diabetes-related
(% of total)
Total Charges Diabetes-related Charges
(% of total charges)
All Ages 1,938 346 (17.9%) $38,362,800 $7,884,300 (20.6%)
OTHER INFORMATION ♦ People with pre-diabetes have an increased risk of developing type 2 diabetes, heart disease, and stroke. In
Jackson County, an estimated 5,260 people aged 20 years and older have pre-diabetes. ♦ The cost of diabetes in Jackson County adults is staggering. In 2009 for Jackson County, direct costs were
estimated at $16.1 million, indirect costs were estimated at $8.1 million, totaling an estimated $24.2 million. ♦ Recently, CDC released 2008 county-level age-adjusted prevalence estimates for obesity and physical
inactivity. In Jackson County, 30.1% of people aged 20 years and older were obese and 23.6% of people aged 20 years and older were physically inactive.
PERCENT OF WISCONSIN ADULTS WITH RISK FACTORS BY DIABETES STATUS
The 2011 Burden of Diabetes in Wisconsin is created by the Wisconsin Diabetes Prevention and Control Program (DPCP), Division of Public Health, Department of Health Services. Please see “Detailed Technical Notes” for in-depth information about methodology and data sources. For more information about the Wisconsin Diabetes Prevention and Control Program, go to: http://www.dhs.wisconsin.gov/health/diabetes/. Printing of this document is supported by DPCP partners American Diabetes Association Wisconsin Area, National Kidney Foundation of Wisconsin, and Wisconsin Lions Foundation.
Diabetes Prevalence - Jackson County Age Category
Estimated Number Diagnosed (%)
Estimated Number Undiagnosed (%)
Estimated Total Number (%)
♦ Ages 18 – 44 210 (3.1%) 80 (1.2%) 290 (4.2%)
♦ Ages 45 – 64 570 (10.1%) 210 (3.7%) 780 (13.8%)
♦ Ages 65 + 590 (19.8%) 220 (7.4%) 810 (27.2%)
♦ All Ages Adult * 1,370 (7.9%) 510 (2.9%) 1,880 (10.7%)
* Percent is age-adjusted (direct method) to the United States 2000 standard population. Total percent may not equal the sum of diagnosed percent and undiagnosed percent, due to rounding.
* Overweight is defined as BMI ≥ 25.0 to < 30.0 kg/m2 * Obesity is defined as BMI ≥ 30.0 kg/m2
13%
36%
66%
71%
87%
53%
19%
21%
32%
24%
63%
26%
0% 10% 20% 30% 40% 50% 60% 70% 80% 90% 100%
6
5
4
3
2
1
No DiabetesDiabetes
Obese*
Overweight/Obese*
High Blood Pressure
High Cholesterol
Lack of Phys. Activ.
Current Smoker
Source: Wisconsin Behavioral Risk Factor Survey, 2009-2010

The 2011 Burden of Diabetes in
Jefferson County
2010 Hospitalizations - Jefferson County
Total Number Number Diabetes-related
(% of total)
Total Charges Diabetes-related Charges
(% of total charges)
All Ages 7,418 1,011 (13.6%) $180,052,100 $30,406,000 (16.9%)
OTHER INFORMATION ♦ People with pre-diabetes have an increased risk of developing type 2 diabetes, heart disease, and stroke. In
Jefferson County, an estimated 20,710 people aged 20 years and older have pre-diabetes. ♦ The cost of diabetes in Jefferson County adults is staggering. In 2009 for Jefferson County, direct costs were
estimated at $52.8 million, indirect costs were estimated at $26.5 million, totaling an estimated $79.3 million. ♦ Recently, CDC released 2008 county-level age-adjusted prevalence estimates for obesity and physical
inactivity. In Jefferson County, 29.8% of people aged 20 years and older were obese and 24.5% of people aged 20 years and older were physically inactive.
PERCENT OF WISCONSIN ADULTS WITH RISK FACTORS BY DIABETES STATUS
The 2011 Burden of Diabetes in Wisconsin is created by the Wisconsin Diabetes Prevention and Control Program (DPCP), Division of Public Health, Department of Health Services. Please see “Detailed Technical Notes” for in-depth information about methodology and data sources. For more information about the Wisconsin Diabetes Prevention and Control Program, go to: http://www.dhs.wisconsin.gov/health/diabetes/. Printing of this document is supported by DPCP partners American Diabetes Association Wisconsin Area, National Kidney Foundation of Wisconsin, and Wisconsin Lions Foundation.
Diabetes Prevalence - Jefferson County Age Category
Estimated Number Diagnosed (%)
Estimated Number Undiagnosed (%)
Estimated Total Number (%)
♦ Ages 18 – 44 720 (2.5%) 270 (0.9%) 990 (3.4%)
♦ Ages 45 – 64 2,020 (9.2%) 750 (3.4%) 2,770 (12.6%)
♦ Ages 65 + 1,760 (16.6%) 660 (6.2%) 2,420 (22.8%)
♦ All Ages Adult * 4,500 (6.8%) 1,680 (2.6%) 6,180 (9.4%)
* Percent is age-adjusted (direct method) to the United States 2000 standard population. Total percent may not equal the sum of diagnosed percent and undiagnosed percent, due to rounding.
* Overweight is defined as BMI ≥ 25.0 to < 30.0 kg/m2 * Obesity is defined as BMI ≥ 30.0 kg/m2
13%
36%
66%
71%
87%
53%
19%
21%
32%
24%
63%
26%
0% 10% 20% 30% 40% 50% 60% 70% 80% 90% 100%
6
5
4
3
2
1
No DiabetesDiabetes
Obese*
Overweight/Obese*
High Blood Pressure
High Cholesterol
Lack of Phys. Activ.
Current Smoker
Source: Wisconsin Behavioral Risk Factor Survey, 2009-2010

The 2011 Burden of Diabetes in
Juneau County
2010 Hospitalizations - Juneau County
Total Number Number Diabetes-related
(% of total)
Total Charges Diabetes-related Charges
(% of total charges)
All Ages 3,321 660 (19.9%) $83,609,400 $20,782,300 (24.9%)
OTHER INFORMATION ♦ People with pre-diabetes have an increased risk of developing type 2 diabetes, heart disease, and stroke. In
Juneau County, an estimated 7,030 people aged 20 years and older have pre-diabetes. ♦ The cost of diabetes in Juneau County adults is staggering. In 2009 for Juneau County, direct costs were
estimated at $18.6 million, indirect costs were estimated at $9.3 million, totaling an estimated $27.9 million. ♦ Recently, CDC released 2008 county-level age-adjusted prevalence estimates for obesity and physical
inactivity. In Juneau County, 28.9% of people aged 20 years and older were obese and 24.4% of people aged 20 years and older were physically inactive.
PERCENT OF WISCONSIN ADULTS WITH RISK FACTORS BY DIABETES STATUS
The 2011 Burden of Diabetes in Wisconsin is created by the Wisconsin Diabetes Prevention and Control Program (DPCP), Division of Public Health, Department of Health Services. Please see “Detailed Technical Notes” for in-depth information about methodology and data sources. For more information about the Wisconsin Diabetes Prevention and Control Program, go to: http://www.dhs.wisconsin.gov/health/diabetes/. Printing of this document is supported by DPCP partners American Diabetes Association Wisconsin Area, National Kidney Foundation of Wisconsin, and Wisconsin Lions Foundation.
Diabetes Prevalence - Juneau County Age Category
Estimated Number Diagnosed (%)
Estimated Number Undiagnosed (%)
Estimated Total Number (%)
♦ Ages 18 – 44 180 (2.1%) 70 (0.8%) 250 (2.9%)
♦ Ages 45 – 64 580 (7.5%) 210 (2.7%) 790 (10.2%)
♦ Ages 65 + 820 (18.6%) 310 (7.0%) 1,130 (25.7%)
♦ All Ages Adult * 1,580 (6.5%) 590 (2.4%) 2,170 (8.9%)
* Percent is age-adjusted (direct method) to the United States 2000 standard population. Total percent may not equal the sum of diagnosed percent and undiagnosed percent, due to rounding.
* Overweight is defined as BMI ≥ 25.0 to < 30.0 kg/m2 * Obesity is defined as BMI ≥ 30.0 kg/m2
13%
36%
66%
71%
87%
53%
19%
21%
32%
24%
63%
26%
0% 10% 20% 30% 40% 50% 60% 70% 80% 90% 100%
6
5
4
3
2
1
No DiabetesDiabetes
Obese*
Overweight/Obese*
High Blood Pressure
High Cholesterol
Lack of Phys. Activ.
Current Smoker
Source: Wisconsin Behavioral Risk Factor Survey, 2009-2010

The 2011 Burden of Diabetes in
Kenosha County
2010 Hospitalizations - Kenosha County
Total Number Number Diabetes-related
(% of total)
Total Charges Diabetes-related Charges
(% of total charges)
All Ages 19,031 3,158 (16.6%) $492,281,900 $86,304,100 (17.5%)
OTHER INFORMATION ♦ People with pre-diabetes have an increased risk of developing type 2 diabetes, heart disease, and stroke. In
Kenosha County, an estimated 41,330 people aged 20 years and older have pre-diabetes. ♦ The cost of diabetes in Kenosha County adults is staggering. In 2009 for Kenosha County, direct costs were
estimated at $107.6 million, indirect costs were estimated at $53.9 million, totaling an estimated $161.5 million. ♦ Recently, CDC released 2008 county-level age-adjusted prevalence estimates for obesity and physical
inactivity. In Kenosha County, 27.8% of people aged 20 years and older were obese and 23.0% of people aged 20 years and older were physically inactive.
PERCENT OF WISCONSIN ADULTS WITH RISK FACTORS BY DIABETES STATUS
The 2011 Burden of Diabetes in Wisconsin is created by the Wisconsin Diabetes Prevention and Control Program (DPCP), Division of Public Health, Department of Health Services. Please see “Detailed Technical Notes” for in-depth information about methodology and data sources. For more information about the Wisconsin Diabetes Prevention and Control Program, go to: http://www.dhs.wisconsin.gov/health/diabetes/. Printing of this document is supported by DPCP partners American Diabetes Association Wisconsin Area, National Kidney Foundation of Wisconsin, and Wisconsin Lions Foundation.
Diabetes Prevalence - Kenosha County Age Category
Estimated Number Diagnosed (%)
Estimated Number Undiagnosed (%)
Estimated Total Number (%)
♦ Ages 18 – 44 1,750 (2.8%) 650 (1.0%) 2,400 (3.9%)
♦ Ages 45 – 64 4,260 (9.9%) 1,590 (3.7%) 5,850 (13.6%)
♦ Ages 65 + 3,150 (17.2%) 1,170 (6.4%) 4,320 (23.5%)
♦ All Ages Adult * 9,160 (7.3%) 3,410 (2.7%) 12,570 (10.1%)
* Percent is age-adjusted (direct method) to the United States 2000 standard population. Total percent may not equal the sum of diagnosed percent and undiagnosed percent, due to rounding.
* Overweight is defined as BMI ≥ 25.0 to < 30.0 kg/m2 * Obesity is defined as BMI ≥ 30.0 kg/m2
13%
36%
66%
71%
87%
53%
19%
21%
32%
24%
63%
26%
0% 10% 20% 30% 40% 50% 60% 70% 80% 90% 100%
6
5
4
3
2
1
No DiabetesDiabetes
Obese*
Overweight/Obese*
High Blood Pressure
High Cholesterol
Lack of Phys. Activ.
Current Smoker
Source: Wisconsin Behavioral Risk Factor Survey, 2009-2010
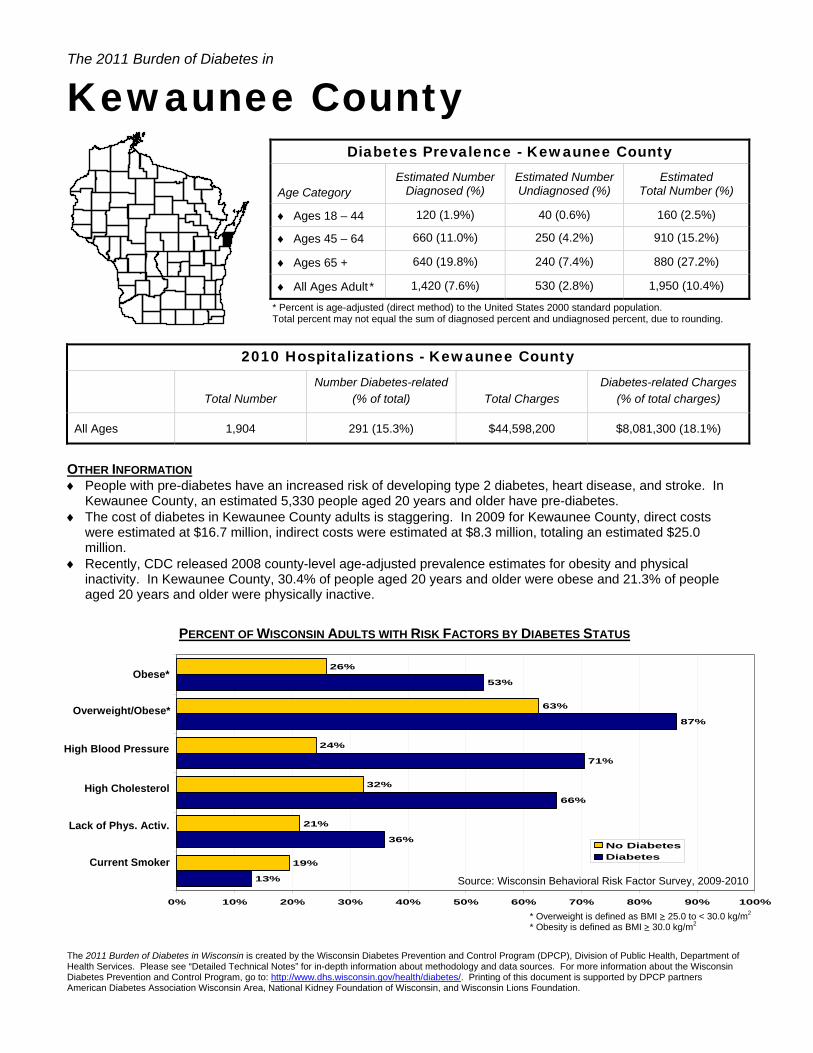
The 2011 Burden of Diabetes in
Kewaunee County
2010 Hospitalizations - Kewaunee County
Total Number Number Diabetes-related
(% of total)
Total Charges Diabetes-related Charges
(% of total charges)
All Ages 1,904 291 (15.3%) $44,598,200 $8,081,300 (18.1%)
OTHER INFORMATION ♦ People with pre-diabetes have an increased risk of developing type 2 diabetes, heart disease, and stroke. In
Kewaunee County, an estimated 5,330 people aged 20 years and older have pre-diabetes. ♦ The cost of diabetes in Kewaunee County adults is staggering. In 2009 for Kewaunee County, direct costs
were estimated at $16.7 million, indirect costs were estimated at $8.3 million, totaling an estimated $25.0 million.
♦ Recently, CDC released 2008 county-level age-adjusted prevalence estimates for obesity and physical inactivity. In Kewaunee County, 30.4% of people aged 20 years and older were obese and 21.3% of people aged 20 years and older were physically inactive.
PERCENT OF WISCONSIN ADULTS WITH RISK FACTORS BY DIABETES STATUS
The 2011 Burden of Diabetes in Wisconsin is created by the Wisconsin Diabetes Prevention and Control Program (DPCP), Division of Public Health, Department of Health Services. Please see “Detailed Technical Notes” for in-depth information about methodology and data sources. For more information about the Wisconsin Diabetes Prevention and Control Program, go to: http://www.dhs.wisconsin.gov/health/diabetes/. Printing of this document is supported by DPCP partners American Diabetes Association Wisconsin Area, National Kidney Foundation of Wisconsin, and Wisconsin Lions Foundation.
Diabetes Prevalence - Kewaunee County Age Category
Estimated Number Diagnosed (%)
Estimated Number Undiagnosed (%)
Estimated Total Number (%)
♦ Ages 18 – 44 120 (1.9%) 40 (0.6%) 160 (2.5%)
♦ Ages 45 – 64 660 (11.0%) 250 (4.2%) 910 (15.2%)
♦ Ages 65 + 640 (19.8%) 240 (7.4%) 880 (27.2%)
♦ All Ages Adult * 1,420 (7.6%) 530 (2.8%) 1,950 (10.4%)
* Percent is age-adjusted (direct method) to the United States 2000 standard population. Total percent may not equal the sum of diagnosed percent and undiagnosed percent, due to rounding.
* Overweight is defined as BMI ≥ 25.0 to < 30.0 kg/m2 * Obesity is defined as BMI ≥ 30.0 kg/m2
13%
36%
66%
71%
87%
53%
19%
21%
32%
24%
63%
26%
0% 10% 20% 30% 40% 50% 60% 70% 80% 90% 100%
6
5
4
3
2
1
No DiabetesDiabetes
Obese*
Overweight/Obese*
High Blood Pressure
High Cholesterol
Lack of Phys. Activ.
Current Smoker
Source: Wisconsin Behavioral Risk Factor Survey, 2009-2010

The 2011 Burden of Diabetes in
La Crosse County
2010 Hospitalizations - La Crosse County
Total Number Number Diabetes-related
(% of total)
Total Charges Diabetes-related Charges
(% of total charges)
All Ages 10,816 1,660 (15.3%) $215,435,300 $41,932,100 (19.5%)
OTHER INFORMATION ♦ People with pre-diabetes have an increased risk of developing type 2 diabetes, heart disease, and stroke. In
La Crosse County, an estimated 29,480 people aged 20 years and older have pre-diabetes. ♦ The cost of diabetes in La Crosse County adults is staggering. In 2009 for La Crosse County, direct costs were
estimated at $70.5 million, indirect costs were estimated at $35.3 million, totaling an estimated $105.8 million. ♦ Recently, CDC released 2008 county-level age-adjusted prevalence estimates for obesity and physical
inactivity. In La Crosse County, 26.3% of people aged 20 years and older were obese and 19.1% of people aged 20 years and older were physically inactive.
PERCENT OF WISCONSIN ADULTS WITH RISK FACTORS BY DIABETES STATUS
The 2011 Burden of Diabetes in Wisconsin is created by the Wisconsin Diabetes Prevention and Control Program (DPCP), Division of Public Health, Department of Health Services. Please see “Detailed Technical Notes” for in-depth information about methodology and data sources. For more information about the Wisconsin Diabetes Prevention and Control Program, go to: http://www.dhs.wisconsin.gov/health/diabetes/. Printing of this document is supported by DPCP partners American Diabetes Association Wisconsin Area, National Kidney Foundation of Wisconsin, and Wisconsin Lions Foundation.
Diabetes Prevalence - La Crosse County Age Category
Estimated Number Diagnosed (%)
Estimated Number Undiagnosed (%)
Estimated Total Number (%)
♦ Ages 18 – 44 710 (1.5%) 260 (0.6%) 970 (2.1%)
♦ Ages 45 – 64 2,390 (8.4%) 890 (3.1%) 3,280 (11.6%)
♦ Ages 65 + 2,900 (19.8%) 1,080 (7.4%) 3,980 (27.2%)
♦ All Ages Adult * 6,000 (6.6%) 2,230 (2.5%) 8,230 (9.1%)
* Percent is age-adjusted (direct method) to the United States 2000 standard population. Total percent may not equal the sum of diagnosed percent and undiagnosed percent, due to rounding.
* Overweight is defined as BMI ≥ 25.0 to < 30.0 kg/m2 * Obesity is defined as BMI ≥ 30.0 kg/m2
13%
36%
66%
71%
87%
53%
19%
21%
32%
24%
63%
26%
0% 10% 20% 30% 40% 50% 60% 70% 80% 90% 100%
6
5
4
3
2
1
No DiabetesDiabetes
Obese*
Overweight/Obese*
High Blood Pressure
High Cholesterol
Lack of Phys. Activ.
Current Smoker
Source: Wisconsin Behavioral Risk Factor Survey, 2009-2010

The 2011 Burden of Diabetes in
Lafayette County
2010 Hospitalizations - Lafayette County
Total Number Number Diabetes-related
(% of total)
Total Charges Diabetes-related Charges
(% of total charges)
All Ages 1,587 283 (17.8%) $35,491,900 $8,545,600 (24.1%)
OTHER INFORMATION ♦ People with pre-diabetes have an increased risk of developing type 2 diabetes, heart disease, and stroke. In
Lafayette County, an estimated 4,020 people aged 20 years and older have pre-diabetes. ♦ The cost of diabetes in Lafayette County adults is staggering. In 2009 for Lafayette County, direct costs were
estimated at $10.0 million, indirect costs were estimated at $5.0 million, totaling an estimated $15.0 million. ♦ Recently, CDC released 2008 county-level age-adjusted prevalence estimates for obesity and physical
inactivity. In Lafayette County, 29.7% of people aged 20 years and older were obese and 22.7% of people aged 20 years and older were physically inactive.
PERCENT OF WISCONSIN ADULTS WITH RISK FACTORS BY DIABETES STATUS
The 2011 Burden of Diabetes in Wisconsin is created by the Wisconsin Diabetes Prevention and Control Program (DPCP), Division of Public Health, Department of Health Services. Please see “Detailed Technical Notes” for in-depth information about methodology and data sources. For more information about the Wisconsin Diabetes Prevention and Control Program, go to: http://www.dhs.wisconsin.gov/health/diabetes/. Printing of this document is supported by DPCP partners American Diabetes Association Wisconsin Area, National Kidney Foundation of Wisconsin, and Wisconsin Lions Foundation.
Diabetes Prevalence - Lafayette County Age Category
Estimated Number Diagnosed (%)
Estimated Number Undiagnosed (%)
Estimated Total Number (%)
♦ Ages 18 – 44 70 (1.5%) 30 (0.6%) 100 (2.1%)
♦ Ages 45 – 64 320 (6.8%) 120 (2.5%) 440 (9.3%)
♦ Ages 65 + 460 (18.7%) 170 (6.9%) 630 (25.6%)
♦ All Ages Adult * 850 (5.9%) 320 (2.2%) 1,170 (8.2%)
* Percent is age-adjusted (direct method) to the United States 2000 standard population. Total percent may not equal the sum of diagnosed percent and undiagnosed percent, due to rounding.
* Overweight is defined as BMI ≥ 25.0 to < 30.0 kg/m2 * Obesity is defined as BMI ≥ 30.0 kg/m2
13%
36%
66%
71%
87%
53%
19%
21%
32%
24%
63%
26%
0% 10% 20% 30% 40% 50% 60% 70% 80% 90% 100%
6
5
4
3
2
1
No DiabetesDiabetes
Obese*
Overweight/Obese*
High Blood Pressure
High Cholesterol
Lack of Phys. Activ.
Current Smoker
Source: Wisconsin Behavioral Risk Factor Survey, 2009-2010

The 2011 Burden of Diabetes in
Langlade County
2010 Hospitalizations - Langlade County
Total Number Number Diabetes-related
(% of total)
Total Charges Diabetes-related Charges
(% of total charges)
All Ages 2,409 542 (22.5%) $48,682,200 $13,429,100 (27.6%)
OTHER INFORMATION ♦ People with pre-diabetes have an increased risk of developing type 2 diabetes, heart disease, and stroke. In
Langlade County, an estimated 5,370 people aged 20 years and older have pre-diabetes. ♦ The cost of diabetes in Langlade County adults is staggering. In 2009 for Langlade County, direct costs were
estimated at $17.5 million, indirect costs were estimated at $8.8 million, totaling an estimated $26.3 million. ♦ Recently, CDC released 2008 county-level age-adjusted prevalence estimates for obesity and physical
inactivity. In Langlade County, 29.9% of people aged 20 years and older were obese and 23.2% of people aged 20 years and older were physically inactive.
PERCENT OF WISCONSIN ADULTS WITH RISK FACTORS BY DIABETES STATUS
The 2011 Burden of Diabetes in Wisconsin is created by the Wisconsin Diabetes Prevention and Control Program (DPCP), Division of Public Health, Department of Health Services. Please see “Detailed Technical Notes” for in-depth information about methodology and data sources. For more information about the Wisconsin Diabetes Prevention and Control Program, go to: http://www.dhs.wisconsin.gov/health/diabetes/. Printing of this document is supported by DPCP partners American Diabetes Association Wisconsin Area, National Kidney Foundation of Wisconsin, and Wisconsin Lions Foundation.
Diabetes Prevalence - Langlade County Age Category
Estimated Number Diagnosed (%)
Estimated Number Undiagnosed (%)
Estimated Total Number (%)
♦ Ages 18 – 44 80 (1.4%) 30 (0.5%) 110 (2.0%)
♦ Ages 45 – 64 640 (10.4%) 240 (3.9%) 880 (14.3%)
♦ Ages 65 + 770 (19.4%) 290 (7.3%) 1,060 (26.7%)
♦ All Ages Adult * 1,490 (7.1%) 560 (2.7%) 2,050 (9.7%)
* Percent is age-adjusted (direct method) to the United States 2000 standard population. Total percent may not equal the sum of diagnosed percent and undiagnosed percent, due to rounding.
* Overweight is defined as BMI ≥ 25.0 to < 30.0 kg/m2 * Obesity is defined as BMI ≥ 30.0 kg/m2
13%
36%
66%
71%
87%
53%
19%
21%
32%
24%
63%
26%
0% 10% 20% 30% 40% 50% 60% 70% 80% 90% 100%
6
5
4
3
2
1
No DiabetesDiabetes
Obese*
Overweight/Obese*
High Blood Pressure
High Cholesterol
Lack of Phys. Activ.
Current Smoker
Source: Wisconsin Behavioral Risk Factor Survey, 2009-2010

The 2011 Burden of Diabetes in
Lincoln County
2010 Hospitalizations - Lincoln County
Total Number Number Diabetes-related
(% of total)
Total Charges Diabetes-related Charges
(% of total charges)
All Ages 3,832 642 (16.8%) $77,234,800 $15,566,200 (20.2%)
OTHER INFORMATION ♦ People with pre-diabetes have an increased risk of developing type 2 diabetes, heart disease, and stroke. In
Lincoln County, an estimated 7,780 people aged 20 years and older have pre-diabetes. ♦ The cost of diabetes in Lincoln County adults is staggering. In 2009 for Lincoln County, direct costs were
estimated at $24.4 million, indirect costs were estimated at $12.2 million, totaling an estimated $36.6 million. ♦ Recently, CDC released 2008 county-level age-adjusted prevalence estimates for obesity and physical
inactivity. In Lincoln County, 29.5% of people aged 20 years and older were obese and 22.2% of people aged 20 years and older were physically inactive.
PERCENT OF WISCONSIN ADULTS WITH RISK FACTORS BY DIABETES STATUS
The 2011 Burden of Diabetes in Wisconsin is created by the Wisconsin Diabetes Prevention and Control Program (DPCP), Division of Public Health, Department of Health Services. Please see “Detailed Technical Notes” for in-depth information about methodology and data sources. For more information about the Wisconsin Diabetes Prevention and Control Program, go to: http://www.dhs.wisconsin.gov/health/diabetes/. Printing of this document is supported by DPCP partners American Diabetes Association Wisconsin Area, National Kidney Foundation of Wisconsin, and Wisconsin Lions Foundation.
Diabetes Prevalence - Lincoln County Age Category
Estimated Number Diagnosed (%)
Estimated Number Undiagnosed (%)
Estimated Total Number (%)
♦ Ages 18 – 44 100 (1.2%) 40 (0.5%) 140 (1.6%)
♦ Ages 45 – 64 920 (10.3%) 340 (3.8%) 1,260 (14.2%)
♦ Ages 65 + 1,060 (19.4%) 400 (7.3%) 1,460 (26.8%)
♦ All Ages Adult * 2,080 (6.9%) 780 (2.6%) 2,860 (9.6%)
* Percent is age-adjusted (direct method) to the United States 2000 standard population. Total percent may not equal the sum of diagnosed percent and undiagnosed percent, due to rounding.
* Overweight is defined as BMI ≥ 25.0 to < 30.0 kg/m2 * Obesity is defined as BMI ≥ 30.0 kg/m2
13%
36%
66%
71%
87%
53%
19%
21%
32%
24%
63%
26%
0% 10% 20% 30% 40% 50% 60% 70% 80% 90% 100%
6
5
4
3
2
1
No DiabetesDiabetes
Obese*
Overweight/Obese*
High Blood Pressure
High Cholesterol
Lack of Phys. Activ.
Current Smoker
Source: Wisconsin Behavioral Risk Factor Survey, 2009-2010

The 2011 Burden of Diabetes in
Manitowoc County
2010 Hospitalizations - Manitowoc County
Total Number Number Diabetes-related
(% of total)
Total Charges Diabetes-related Charges
(% of total charges)
All Ages 9,311 1,460 (15.7%) $230,370,600 $35,765,200 (15.5%)
OTHER INFORMATION ♦ People with pre-diabetes have an increased risk of developing type 2 diabetes, heart disease, and stroke. In
Manitowoc County, an estimated 21,280 people aged 20 years and older have pre-diabetes. ♦ The cost of diabetes in Manitowoc County adults is staggering. In 2009 for Manitowoc County, direct costs
were estimated at $68.0 million, indirect costs were estimated at $34.0 million, totaling an estimated $102.0 million.
♦ Recently, CDC released 2008 county-level age-adjusted prevalence estimates for obesity and physical inactivity. In Manitowoc County, 29.7% of people aged 20 years and older were obese and 21.3% of people aged 20 years and older were physically inactive.
PERCENT OF WISCONSIN ADULTS WITH RISK FACTORS BY DIABETES STATUS
The 2011 Burden of Diabetes in Wisconsin is created by the Wisconsin Diabetes Prevention and Control Program (DPCP), Division of Public Health, Department of Health Services. Please see “Detailed Technical Notes” for in-depth information about methodology and data sources. For more information about the Wisconsin Diabetes Prevention and Control Program, go to: http://www.dhs.wisconsin.gov/health/diabetes/. Printing of this document is supported by DPCP partners American Diabetes Association Wisconsin Area, National Kidney Foundation of Wisconsin, and Wisconsin Lions Foundation.
Diabetes Prevalence - Manitowoc County Age Category
Estimated Number Diagnosed (%)
Estimated Number Undiagnosed (%)
Estimated Total Number (%)
♦ Ages 18 – 44 490 (1.9%) 190 (0.7%) 680 (2.7%)
♦ Ages 45 – 64 2,710 (11.2%) 1,010 (4.2%) 3,720 (15.3%)
♦ Ages 65 + 2,590 (19.8%) 960 (7.3%) 3,550 (27.2%)
♦ All Ages Adult * 5,790 (7.7%) 2,160 (2.9%) 7,950 (10.5%)
* Percent is age-adjusted (direct method) to the United States 2000 standard population. Total percent may not equal the sum of diagnosed percent and undiagnosed percent, due to rounding.
* Overweight is defined as BMI ≥ 25.0 to < 30.0 kg/m2 * Obesity is defined as BMI ≥ 30.0 kg/m2
13%
36%
66%
71%
87%
53%
19%
21%
32%
24%
63%
26%
0% 10% 20% 30% 40% 50% 60% 70% 80% 90% 100%
6
5
4
3
2
1
No DiabetesDiabetes
Obese*
Overweight/Obese*
High Blood Pressure
High Cholesterol
Lack of Phys. Activ.
Current Smoker
Source: Wisconsin Behavioral Risk Factor Survey, 2009-2010

The 2011 Burden of Diabetes in
Marathon County
2010 Hospitalizations - Marathon County
Total Number Number Diabetes-related
(% of total)
Total Charges Diabetes-related Charges
(% of total charges)
All Ages 14,984 2,456 (16.4%) $293,931,700 $61,605,900 (21.0%)
OTHER INFORMATION ♦ People with pre-diabetes have an increased risk of developing type 2 diabetes, heart disease, and stroke. In
Marathon County, an estimated 33,850 people aged 20 years and older have pre-diabetes. ♦ The cost of diabetes in Marathon County adults is staggering. In 2009 for Marathon County, direct costs were
estimated at $95.9 million, indirect costs were estimated at $48.0 million, totaling an estimated $143.9 million. ♦ Recently, CDC released 2008 county-level age-adjusted prevalence estimates for obesity and physical
inactivity. In Marathon County, 27.8% of people aged 20 years and older were obese and 23.5% of people aged 20 years and older were physically inactive.
PERCENT OF WISCONSIN ADULTS WITH RISK FACTORS BY DIABETES STATUS
The 2011 Burden of Diabetes in Wisconsin is created by the Wisconsin Diabetes Prevention and Control Program (DPCP), Division of Public Health, Department of Health Services. Please see “Detailed Technical Notes” for in-depth information about methodology and data sources. For more information about the Wisconsin Diabetes Prevention and Control Program, go to: http://www.dhs.wisconsin.gov/health/diabetes/. Printing of this document is supported by DPCP partners American Diabetes Association Wisconsin Area, National Kidney Foundation of Wisconsin, and Wisconsin Lions Foundation.
Diabetes Prevalence - Marathon County Age Category
Estimated Number Diagnosed (%)
Estimated Number Undiagnosed (%)
Estimated Total Number (%)
♦ Ages 18 – 44 600 (1.3%) 220 (0.5%) 820 (1.8%)
♦ Ages 45 – 64 3,940 (10.7%) 1,470 (4.0%) 5,410 (14.7%)
♦ Ages 65 + 3,630 (19.6%) 1,350 (7.3%) 4,980 (26.9%)
♦ All Ages Adult * 8,170 (7.2%) 3,040 (2.7%) 11,210 (9.8%)
* Percent is age-adjusted (direct method) to the United States 2000 standard population. Total percent may not equal the sum of diagnosed percent and undiagnosed percent, due to rounding.
* Overweight is defined as BMI ≥ 25.0 to < 30.0 kg/m2 * Obesity is defined as BMI ≥ 30.0 kg/m2
13%
36%
66%
71%
87%
53%
19%
21%
32%
24%
63%
26%
0% 10% 20% 30% 40% 50% 60% 70% 80% 90% 100%
6
5
4
3
2
1
No DiabetesDiabetes
Obese*
Overweight/Obese*
High Blood Pressure
High Cholesterol
Lack of Phys. Activ.
Current Smoker
Source: Wisconsin Behavioral Risk Factor Survey, 2009-2010

The 2011 Burden of Diabetes in
Marinette County
2010 Hospitalizations - Marinette County
Total Number Number Diabetes-related
(% of total)
Total Charges Diabetes-related Charges
(% of total charges)
All Ages 5,429 936 (17.2%) $139,152,700 $25,450,000 (18.3%)
OTHER INFORMATION ♦ People with pre-diabetes have an increased risk of developing type 2 diabetes, heart disease, and stroke. In
Marinette County, an estimated 11,340 people aged 20 years and older have pre-diabetes. ♦ The cost of diabetes in Marinette County adults is staggering. In 2009 for Marinette County, direct costs were
estimated at $39.0 million, indirect costs were estimated at $19.5 million, totaling an estimated $58.5 million. ♦ Recently, CDC released 2008 county-level age-adjusted prevalence estimates for obesity and physical
inactivity. In Marinette County, 28.1% of people aged 20 years and older were obese and 23.1% of people aged 20 years and older were physically inactive.
PERCENT OF WISCONSIN ADULTS WITH RISK FACTORS BY DIABETES STATUS
The 2011 Burden of Diabetes in Wisconsin is created by the Wisconsin Diabetes Prevention and Control Program (DPCP), Division of Public Health, Department of Health Services. Please see “Detailed Technical Notes” for in-depth information about methodology and data sources. For more information about the Wisconsin Diabetes Prevention and Control Program, go to: http://www.dhs.wisconsin.gov/health/diabetes/. Printing of this document is supported by DPCP partners American Diabetes Association Wisconsin Area, National Kidney Foundation of Wisconsin, and Wisconsin Lions Foundation.
Diabetes Prevalence - Marinette County Age Category
Estimated Number Diagnosed (%)
Estimated Number Undiagnosed (%)
Estimated Total Number (%)
♦ Ages 18 – 44 230 (1.9%) 90 (0.7%) 320 (2.7%)
♦ Ages 45 – 64 1,470 (11.1%) 550 (4.1%) 2,020 (15.2%)
♦ Ages 65 + 1,620 (19.7%) 600 (7.3%) 2,220 (27.0%)
♦ All Ages Adult * 3,320 (7.6%) 1,240 (2.9%) 4,560 (10.5%)
* Percent is age-adjusted (direct method) to the United States 2000 standard population. Total percent may not equal the sum of diagnosed percent and undiagnosed percent, due to rounding.
* Overweight is defined as BMI ≥ 25.0 to < 30.0 kg/m2 * Obesity is defined as BMI ≥ 30.0 kg/m2
13%
36%
66%
71%
87%
53%
19%
21%
32%
24%
63%
26%
0% 10% 20% 30% 40% 50% 60% 70% 80% 90% 100%
6
5
4
3
2
1
No DiabetesDiabetes
Obese*
Overweight/Obese*
High Blood Pressure
High Cholesterol
Lack of Phys. Activ.
Current Smoker
Source: Wisconsin Behavioral Risk Factor Survey, 2009-2010

The 2011 Burden of Diabetes in
Marquette County
2010 Hospitalizations - Marquette County
Total Number Number Diabetes-related
(% of total)
Total Charges Diabetes-related Charges
(% of total charges)
All Ages 2,008 374 (18.6%) $49,936,800 $10,400,000 (20.8%)
OTHER INFORMATION ♦ People with pre-diabetes have an increased risk of developing type 2 diabetes, heart disease, and stroke. In
Marquette County, an estimated 4,000 people aged 20 years and older have pre-diabetes. ♦ The cost of diabetes in Marquette County adults is staggering. In 2009 for Marquette County, direct costs were
estimated at $14.1 million, indirect costs were estimated at $7.1 million, totaling an estimated $21.2 million. ♦ Recently, CDC released 2008 county-level age-adjusted prevalence estimates for obesity and physical
inactivity. In Marquette County, 30.1% of people aged 20 years and older were obese and 24.2% of people aged 20 years and older were physically inactive.
PERCENT OF WISCONSIN ADULTS WITH RISK FACTORS BY DIABETES STATUS
The 2011 Burden of Diabetes in Wisconsin is created by the Wisconsin Diabetes Prevention and Control Program (DPCP), Division of Public Health, Department of Health Services. Please see “Detailed Technical Notes” for in-depth information about methodology and data sources. For more information about the Wisconsin Diabetes Prevention and Control Program, go to: http://www.dhs.wisconsin.gov/health/diabetes/. Printing of this document is supported by DPCP partners American Diabetes Association Wisconsin Area, National Kidney Foundation of Wisconsin, and Wisconsin Lions Foundation.
Diabetes Prevalence - Marquette County Age Category
Estimated Number Diagnosed (%)
Estimated Number Undiagnosed (%)
Estimated Total Number (%)
♦ Ages 18 – 44 70 (1.8%) 30 (0.8%) 100 (2.6%)
♦ Ages 45 – 64 520 (11.0%) 200 (4.2%) 720 (15.2%)
♦ Ages 65 + 610 (20.0%) 230 (7.5%) 840 (27.5%)
♦ All Ages Adult * 1,200 (7.6%) 460 (2.9%) 1,660 (10.5%)
* Percent is age-adjusted (direct method) to the United States 2000 standard population. Total percent may not equal the sum of diagnosed percent and undiagnosed percent, due to rounding.
* Overweight is defined as BMI ≥ 25.0 to < 30.0 kg/m2 * Obesity is defined as BMI ≥ 30.0 kg/m2
13%
36%
66%
71%
87%
53%
19%
21%
32%
24%
63%
26%
0% 10% 20% 30% 40% 50% 60% 70% 80% 90% 100%
6
5
4
3
2
1
No DiabetesDiabetes
Obese*
Overweight/Obese*
High Blood Pressure
High Cholesterol
Lack of Phys. Activ.
Current Smoker
Source: Wisconsin Behavioral Risk Factor Survey, 2009-2010

The 2011 Burden of Diabetes in
Menominee County
2010 Hospitalizations - Menominee County
Total Number Number Diabetes-related
(% of total)
Total Charges Diabetes-related Charges
(% of total charges)
All Ages 790 180 (22.8%) $12,313,600 $3,606,100 (29.3%)
OTHER INFORMATION ♦ People with pre-diabetes have an increased risk of developing type 2 diabetes, heart disease, and stroke. In
Menominee County, an estimated 990 people aged 20 years and older have pre-diabetes. ♦ The cost of diabetes in Menominee County adults is staggering. In 2009 for Menominee County, direct costs
were estimated at $9.4 million, indirect costs were estimated at $4.7 million, totaling an estimated $14.1 million. ♦ Recently, CDC released 2008 county-level age-adjusted prevalence estimates for obesity and physical
inactivity. In Menominee County, 31.1% of people aged 20 years and older were obese and 29.1% of people aged 20 years and older were physically inactive.
PERCENT OF WISCONSIN ADULTS WITH RISK FACTORS BY DIABETES STATUS
The 2011 Burden of Diabetes in Wisconsin is created by the Wisconsin Diabetes Prevention and Control Program (DPCP), Division of Public Health, Department of Health Services. Please see “Detailed Technical Notes” for in-depth information about methodology and data sources. For more information about the Wisconsin Diabetes Prevention and Control Program, go to: http://www.dhs.wisconsin.gov/health/diabetes/. Printing of this document is supported by DPCP partners American Diabetes Association Wisconsin Area, National Kidney Foundation of Wisconsin, and Wisconsin Lions Foundation.
Diabetes Prevalence - Menominee County Age Category
Estimated Number Diagnosed (%)
Estimated Number Undiagnosed (%)
Estimated Total Number (%)
♦ Ages 18 – 44 270 (17.6%) 100 (6.5%) 370 (24.1%)
♦ Ages 45 – 64 430 (43.9%) 160 (16.3%) 590 (60.2%)
♦ Ages 65 + 100 (22.9%) 40 (9.2%) 140 (32.0%)
♦ All Ages Adult * 800 (26.2%) 300 (9.9%) 1,100 (36.1%)
* Percent is age-adjusted (direct method) to the United States 2000 standard population. Total percent may not equal the sum of diagnosed percent and undiagnosed percent, due to rounding.
* Overweight is defined as BMI ≥ 25.0 to < 30.0 kg/m2 * Obesity is defined as BMI ≥ 30.0 kg/m2
13%
36%
66%
71%
87%
53%
19%
21%
32%
24%
63%
26%
0% 10% 20% 30% 40% 50% 60% 70% 80% 90% 100%
6
5
4
3
2
1
No DiabetesDiabetes
Obese*
Overweight/Obese*
High Blood Pressure
High Cholesterol
Lack of Phys. Activ.
Current Smoker
Source: Wisconsin Behavioral Risk Factor Survey, 2009-2010
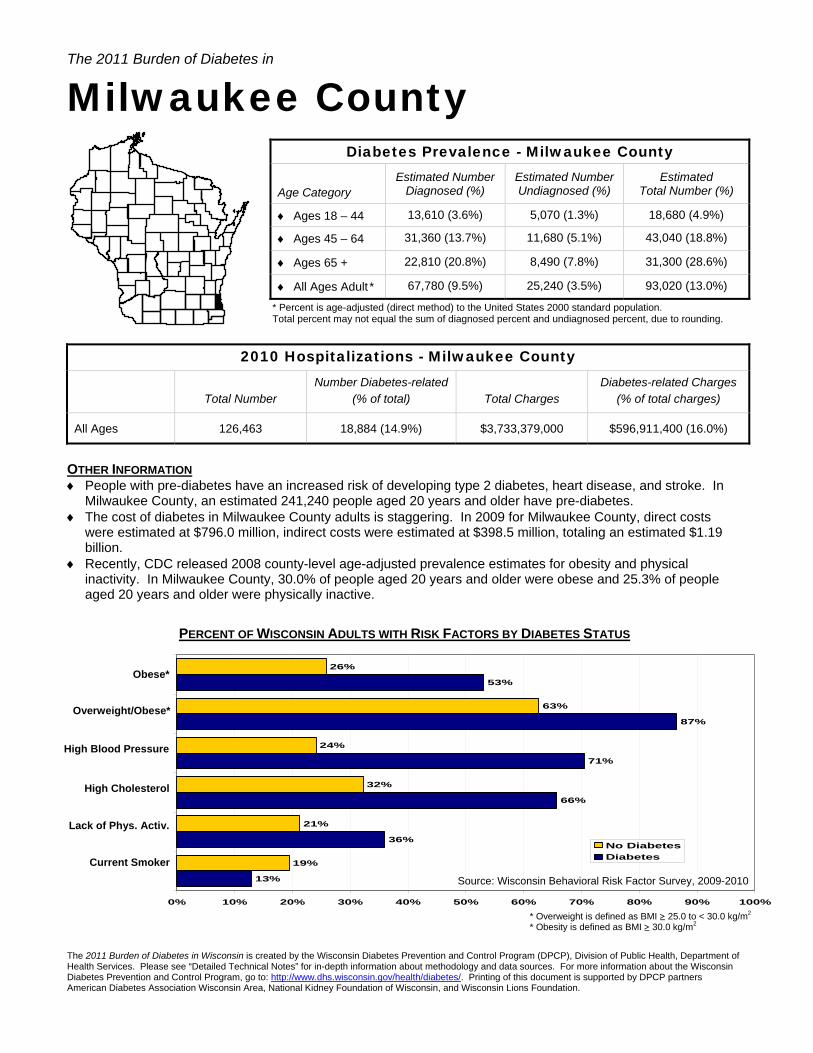
The 2011 Burden of Diabetes in
Milwaukee County
2010 Hospitalizations - Milwaukee County
Total Number Number Diabetes-related
(% of total)
Total Charges Diabetes-related Charges
(% of total charges)
All Ages 126,463 18,884 (14.9%) $3,733,379,000 $596,911,400 (16.0%)
OTHER INFORMATION ♦ People with pre-diabetes have an increased risk of developing type 2 diabetes, heart disease, and stroke. In
Milwaukee County, an estimated 241,240 people aged 20 years and older have pre-diabetes. ♦ The cost of diabetes in Milwaukee County adults is staggering. In 2009 for Milwaukee County, direct costs
were estimated at $796.0 million, indirect costs were estimated at $398.5 million, totaling an estimated $1.19 billion.
♦ Recently, CDC released 2008 county-level age-adjusted prevalence estimates for obesity and physical inactivity. In Milwaukee County, 30.0% of people aged 20 years and older were obese and 25.3% of people aged 20 years and older were physically inactive.
PERCENT OF WISCONSIN ADULTS WITH RISK FACTORS BY DIABETES STATUS
The 2011 Burden of Diabetes in Wisconsin is created by the Wisconsin Diabetes Prevention and Control Program (DPCP), Division of Public Health, Department of Health Services. Please see “Detailed Technical Notes” for in-depth information about methodology and data sources. For more information about the Wisconsin Diabetes Prevention and Control Program, go to: http://www.dhs.wisconsin.gov/health/diabetes/. Printing of this document is supported by DPCP partners American Diabetes Association Wisconsin Area, National Kidney Foundation of Wisconsin, and Wisconsin Lions Foundation.
Diabetes Prevalence - Milwaukee County Age Category
Estimated Number Diagnosed (%)
Estimated Number Undiagnosed (%)
Estimated Total Number (%)
♦ Ages 18 – 44 13,610 (3.6%) 5,070 (1.3%) 18,680 (4.9%)
♦ Ages 45 – 64 31,360 (13.7%) 11,680 (5.1%) 43,040 (18.8%)
♦ Ages 65 + 22,810 (20.8%) 8,490 (7.8%) 31,300 (28.6%)
♦ All Ages Adult * 67,780 (9.5%) 25,240 (3.5%) 93,020 (13.0%)
* Percent is age-adjusted (direct method) to the United States 2000 standard population. Total percent may not equal the sum of diagnosed percent and undiagnosed percent, due to rounding.
* Overweight is defined as BMI ≥ 25.0 to < 30.0 kg/m2 * Obesity is defined as BMI ≥ 30.0 kg/m2
13%
36%
66%
71%
87%
53%
19%
21%
32%
24%
63%
26%
0% 10% 20% 30% 40% 50% 60% 70% 80% 90% 100%
6
5
4
3
2
1
No DiabetesDiabetes
Obese*
Overweight/Obese*
High Blood Pressure
High Cholesterol
Lack of Phys. Activ.
Current Smoker
Source: Wisconsin Behavioral Risk Factor Survey, 2009-2010

The 2011 Burden of Diabetes in
Monroe County
2010 Hospitalizations - Monroe County
Total Number Number Diabetes-related
(% of total)
Total Charges Diabetes-related Charges
(% of total charges)
All Ages 4,189 638 (15.2%) $77,292,800 $15,575,500 (20.2%)
OTHER INFORMATION ♦ People with pre-diabetes have an increased risk of developing type 2 diabetes, heart disease, and stroke. In
Monroe County, an estimated 10,920 people aged 20 years and older have pre-diabetes. ♦ The cost of diabetes in Monroe County adults is staggering. In 2009 for Monroe County, direct costs were
estimated at $28.7 million, indirect costs were estimated at $14.3 million, totaling an estimated $43.0 million. ♦ Recently, CDC released 2008 county-level age-adjusted prevalence estimates for obesity and physical
inactivity. In Monroe County, 27.2% of people aged 20 years and older were obese and 25.2% of people aged 20 years and older were physically inactive.
PERCENT OF WISCONSIN ADULTS WITH RISK FACTORS BY DIABETES STATUS
The 2011 Burden of Diabetes in Wisconsin is created by the Wisconsin Diabetes Prevention and Control Program (DPCP), Division of Public Health, Department of Health Services. Please see “Detailed Technical Notes” for in-depth information about methodology and data sources. For more information about the Wisconsin Diabetes Prevention and Control Program, go to: http://www.dhs.wisconsin.gov/health/diabetes/. Printing of this document is supported by DPCP partners American Diabetes Association Wisconsin Area, National Kidney Foundation of Wisconsin, and Wisconsin Lions Foundation.
Diabetes Prevalence - Monroe County Age Category
Estimated Number Diagnosed (%)
Estimated Number Undiagnosed (%)
Estimated Total Number (%)
♦ Ages 18 – 44 220 (1.6%) 80 (0.6%) 300 (2.1%)
♦ Ages 45 – 64 1,030 (8.5%) 380 (3.1%) 1,410 (11.6%)
♦ Ages 65 + 1,190 (19.8%) 440 (7.3%) 1,630 (27.2%)
♦ All Ages Adult * 2,440 (6.7%) 900 (2.5%) 3,340 (9.1%)
* Percent is age-adjusted (direct method) to the United States 2000 standard population. Total percent may not equal the sum of diagnosed percent and undiagnosed percent, due to rounding.
* Overweight is defined as BMI ≥ 25.0 to < 30.0 kg/m2 * Obesity is defined as BMI ≥ 30.0 kg/m2
13%
36%
66%
71%
87%
53%
19%
21%
32%
24%
63%
26%
0% 10% 20% 30% 40% 50% 60% 70% 80% 90% 100%
6
5
4
3
2
1
No DiabetesDiabetes
Obese*
Overweight/Obese*
High Blood Pressure
High Cholesterol
Lack of Phys. Activ.
Current Smoker
Source: Wisconsin Behavioral Risk Factor Survey, 2009-2010

The 2011 Burden of Diabetes in
Oconto County
2010 Hospitalizations - Oconto County
Total Number Number Diabetes-related
(% of total)
Total Charges Diabetes-related Charges
(% of total charges)
All Ages 3,750 547 (14.6%) $89,401,500 $13,898,500 (15.5%)
OTHER INFORMATION ♦ People with pre-diabetes have an increased risk of developing type 2 diabetes, heart disease, and stroke. In
Oconto County, an estimated 9,890 people aged 20 years and older have pre-diabetes. ♦ The cost of diabetes in Oconto County adults is staggering. In 2009 for Oconto County, direct costs were
estimated at $31.7 million, indirect costs were estimated at $15.9 million, totaling an estimated $47.6 million. ♦ Recently, CDC released 2008 county-level age-adjusted prevalence estimates for obesity and physical
inactivity. In Oconto County, 27.2% of people aged 20 years and older were obese and 21.1% of people aged 20 years and older were physically inactive.
PERCENT OF WISCONSIN ADULTS WITH RISK FACTORS BY DIABETES STATUS
The 2011 Burden of Diabetes in Wisconsin is created by the Wisconsin Diabetes Prevention and Control Program (DPCP), Division of Public Health, Department of Health Services. Please see “Detailed Technical Notes” for in-depth information about methodology and data sources. For more information about the Wisconsin Diabetes Prevention and Control Program, go to: http://www.dhs.wisconsin.gov/health/diabetes/. Printing of this document is supported by DPCP partners American Diabetes Association Wisconsin Area, National Kidney Foundation of Wisconsin, and Wisconsin Lions Foundation.
Diabetes Prevalence - Oconto County Age Category
Estimated Number Diagnosed (%)
Estimated Number Undiagnosed (%)
Estimated Total Number (%)
♦ Ages 18 – 44 220 (1.9%) 80 (0.7%) 300 (2.7%)
♦ Ages 45 – 64 1,320 (11.1%) 490 (4.1%) 1,810 (15.3%)
♦ Ages 65 + 1,160 (19.8%) 430 (7.3%) 1,590 (27.1%)
♦ All Ages Adult * 2,700 (7.7%) 1,000 (2.8%) 3,700 (10.5%)
* Percent is age-adjusted (direct method) to the United States 2000 standard population. Total percent may not equal the sum of diagnosed percent and undiagnosed percent, due to rounding.
* Overweight is defined as BMI ≥ 25.0 to < 30.0 kg/m2 * Obesity is defined as BMI ≥ 30.0 kg/m2
13%
36%
66%
71%
87%
53%
19%
21%
32%
24%
63%
26%
0% 10% 20% 30% 40% 50% 60% 70% 80% 90% 100%
6
5
4
3
2
1
No DiabetesDiabetes
Obese*
Overweight/Obese*
High Blood Pressure
High Cholesterol
Lack of Phys. Activ.
Current Smoker
Source: Wisconsin Behavioral Risk Factor Survey, 2009-2010

The 2011 Burden of Diabetes in
Oneida County
2010 Hospitalizations - Oneida County
Total Number Number Diabetes-related
(% of total)
Total Charges Diabetes-related Charges
(% of total charges)
All Ages 3,941 669 (17.0%) $92,237,000 $18,829,900 (20.4%)
OTHER INFORMATION ♦ People with pre-diabetes have an increased risk of developing type 2 diabetes, heart disease, and stroke. In
Oneida County, an estimated 10,030 people aged 20 years and older have pre-diabetes. ♦ The cost of diabetes in Oneida County adults is staggering. In 2009 for Oneida County, direct costs were
estimated at $34.4 million, indirect costs were estimated at $17.2 million, totaling an estimated $51.6 million. ♦ Recently, CDC released 2008 county-level age-adjusted prevalence estimates for obesity and physical
inactivity. In Oneida County, 27.2% of people aged 20 years and older were obese and 21.2% of people aged 20 years and older were physically inactive.
PERCENT OF WISCONSIN ADULTS WITH RISK FACTORS BY DIABETES STATUS
The 2011 Burden of Diabetes in Wisconsin is created by the Wisconsin Diabetes Prevention and Control Program (DPCP), Division of Public Health, Department of Health Services. Please see “Detailed Technical Notes” for in-depth information about methodology and data sources. For more information about the Wisconsin Diabetes Prevention and Control Program, go to: http://www.dhs.wisconsin.gov/health/diabetes/. Printing of this document is supported by DPCP partners American Diabetes Association Wisconsin Area, National Kidney Foundation of Wisconsin, and Wisconsin Lions Foundation.
Diabetes Prevalence - Oneida County Age Category
Estimated Number Diagnosed (%)
Estimated Number Undiagnosed (%)
Estimated Total Number (%)
♦ Ages 18 – 44 120 (1.3%) 50 (0.5%) 170 (1.8%)
♦ Ages 45 – 64 1,260 (10.5%) 470 (3.9%) 1,730 (14.4%)
♦ Ages 65 + 1,550 (19.5%) 580 (7.3%) 2,130 (26.7%)
♦ All Ages Adult * 2,930 (7.1%) 1,100 (2.7%) 4,030 (9.7%)
* Percent is age-adjusted (direct method) to the United States 2000 standard population. Total percent may not equal the sum of diagnosed percent and undiagnosed percent, due to rounding.
* Overweight is defined as BMI ≥ 25.0 to < 30.0 kg/m2 * Obesity is defined as BMI ≥ 30.0 kg/m2
13%
36%
66%
71%
87%
53%
19%
21%
32%
24%
63%
26%
0% 10% 20% 30% 40% 50% 60% 70% 80% 90% 100%
6
5
4
3
2
1
No DiabetesDiabetes
Obese*
Overweight/Obese*
High Blood Pressure
High Cholesterol
Lack of Phys. Activ.
Current Smoker
Source: Wisconsin Behavioral Risk Factor Survey, 2009-2010

The 2011 Burden of Diabetes in
Outagamie County
2010 Hospitalizations - Outagamie County
Total Number Number Diabetes-related
(% of total)
Total Charges Diabetes-related Charges
(% of total charges)
All Ages 17,247 2,352 (13.6%) $270,435,700 $45,058,300 (16.7%)
OTHER INFORMATION ♦ People with pre-diabetes have an increased risk of developing type 2 diabetes, heart disease, and stroke. In
Outagamie County, an estimated 45,130 people aged 20 years and older have pre-diabetes. ♦ The cost of diabetes in Outagamie County adults is staggering. In 2009 for Outagamie County, direct costs
were estimated at $156.9 million, indirect costs were estimated at $78.5 million, totaling an estimated $235.4 million.
♦ Recently, CDC released 2008 county-level age-adjusted prevalence estimates for obesity and physical inactivity. In Outagamie County, 27.3% of people aged 20 years and older were obese and 21.3% of people aged 20 years and older were physically inactive.
PERCENT OF WISCONSIN ADULTS WITH RISK FACTORS BY DIABETES STATUS
The 2011 Burden of Diabetes in Wisconsin is created by the Wisconsin Diabetes Prevention and Control Program (DPCP), Division of Public Health, Department of Health Services. Please see “Detailed Technical Notes” for in-depth information about methodology and data sources. For more information about the Wisconsin Diabetes Prevention and Control Program, go to: http://www.dhs.wisconsin.gov/health/diabetes/. Printing of this document is supported by DPCP partners American Diabetes Association Wisconsin Area, National Kidney Foundation of Wisconsin, and Wisconsin Lions Foundation.
Diabetes Prevalence - Outagamie County Age Category
Estimated Number Diagnosed (%)
Estimated Number Undiagnosed (%)
Estimated Total Number (%)
♦ Ages 18 – 44 1,390 (2.1%) 520 (0.8%) 1,910 (2.9%)
♦ Ages 45 – 64 6,830 (14.6%) 2,540 (5.4%) 9,370 (20.1%)
♦ Ages 65 + 5,140 (23.7%) 1,920 (8.9%) 7,060 (32.6%)
♦ All Ages Adult * 13,360 (9.4%) 4,980 (3.5%) 18,340 (13.0%)
* Percent is age-adjusted (direct method) to the United States 2000 standard population. Total percent may not equal the sum of diagnosed percent and undiagnosed percent, due to rounding.
* Overweight is defined as BMI ≥ 25.0 to < 30.0 kg/m2 * Obesity is defined as BMI ≥ 30.0 kg/m2
13%
36%
66%
71%
87%
53%
19%
21%
32%
24%
63%
26%
0% 10% 20% 30% 40% 50% 60% 70% 80% 90% 100%
6
5
4
3
2
1
No DiabetesDiabetes
Obese*
Overweight/Obese*
High Blood Pressure
High Cholesterol
Lack of Phys. Activ.
Current Smoker
Source: Wisconsin Behavioral Risk Factor Survey, 2009-2010

The 2011 Burden of Diabetes in
Ozaukee County
2010 Hospitalizations - Ozaukee County
Total Number Number Diabetes-related
(% of total)
Total Charges Diabetes-related Charges
(% of total charges)
All Ages 8,391 1,227 (14.6%) $239,587,600 $38,286,400 (16.0%)
OTHER INFORMATION ♦ People with pre-diabetes have an increased risk of developing type 2 diabetes, heart disease, and stroke. In
Ozaukee County, an estimated 22,310 people aged 20 years and older have pre-diabetes. ♦ The cost of diabetes in Ozaukee County adults is staggering. In 2009 for Ozaukee County, direct costs were
estimated at $62.5 million, indirect costs were estimated at $31.3 million, totaling an estimated $93.8 million. ♦ Recently, CDC released 2008 county-level age-adjusted prevalence estimates for obesity and physical
inactivity. In Ozaukee County, 25.8% of people aged 20 years and older were obese and 17.9% of people aged 20 years and older were physically inactive.
PERCENT OF WISCONSIN ADULTS WITH RISK FACTORS BY DIABETES STATUS
The 2011 Burden of Diabetes in Wisconsin is created by the Wisconsin Diabetes Prevention and Control Program (DPCP), Division of Public Health, Department of Health Services. Please see “Detailed Technical Notes” for in-depth information about methodology and data sources. For more information about the Wisconsin Diabetes Prevention and Control Program, go to: http://www.dhs.wisconsin.gov/health/diabetes/. Printing of this document is supported by DPCP partners American Diabetes Association Wisconsin Area, National Kidney Foundation of Wisconsin, and Wisconsin Lions Foundation.
Diabetes Prevalence - Ozaukee County Age Category
Estimated Number Diagnosed (%)
Estimated Number Undiagnosed (%)
Estimated Total Number (%)
♦ Ages 18 – 44 640 (2.5%) 240 (0.9%) 880 (3.4%)
♦ Ages 45 – 64 2,520 (9.1%) 940 (3.4%) 3,460 (12.6%)
♦ Ages 65 + 2,160 (16.8%) 810 (6.3%) 2,970 (23.1%)
♦ All Ages Adult * 5,320 (6.9%) 1,990 (2.6%) 7,310 (9.4%)
* Percent is age-adjusted (direct method) to the United States 2000 standard population. Total percent may not equal the sum of diagnosed percent and undiagnosed percent, due to rounding.
* Overweight is defined as BMI ≥ 25.0 to < 30.0 kg/m2 * Obesity is defined as BMI ≥ 30.0 kg/m2
13%
36%
66%
71%
87%
53%
19%
21%
32%
24%
63%
26%
0% 10% 20% 30% 40% 50% 60% 70% 80% 90% 100%
6
5
4
3
2
1
No DiabetesDiabetes
Obese*
Overweight/Obese*
High Blood Pressure
High Cholesterol
Lack of Phys. Activ.
Current Smoker
Source: Wisconsin Behavioral Risk Factor Survey, 2009-2010

The 2011 Burden of Diabetes in
Pepin County
2010 Hospitalizations - Pepin County
Total Number Number Diabetes-related
(% of total)
Total Charges Diabetes-related Charges
(% of total charges)
All Ages 641 99 (15.4%) $13,113,000 $2,855,500 (21.8%)
OTHER INFORMATION ♦ People with pre-diabetes have an increased risk of developing type 2 diabetes, heart disease, and stroke. In
Pepin County, an estimated 1,920 people aged 20 years and older have pre-diabetes. ♦ The cost of diabetes in Pepin County adults is staggering. In 2009 for Pepin County, direct costs were
estimated at $5.4 million, indirect costs were estimated at $2.7 million, totaling an estimated $8.1 million. ♦ Recently, CDC released 2008 county-level age-adjusted prevalence estimates for obesity and physical
inactivity. In Pepin County, 28.9% of people aged 20 years and older were obese and 24.5% of people aged 20 years and older were physically inactive.
PERCENT OF WISCONSIN ADULTS WITH RISK FACTORS BY DIABETES STATUS
The 2011 Burden of Diabetes in Wisconsin is created by the Wisconsin Diabetes Prevention and Control Program (DPCP), Division of Public Health, Department of Health Services. Please see “Detailed Technical Notes” for in-depth information about methodology and data sources. For more information about the Wisconsin Diabetes Prevention and Control Program, go to: http://www.dhs.wisconsin.gov/health/diabetes/. Printing of this document is supported by DPCP partners American Diabetes Association Wisconsin Area, National Kidney Foundation of Wisconsin, and Wisconsin Lions Foundation.
Diabetes Prevalence - Pepin County Age Category
Estimated Number Diagnosed (%)
Estimated Number Undiagnosed (%)
Estimated Total Number (%)
♦ Ages 18 – 44 30 (1.4%) 10 (0.5%) 40 (1.8%)
♦ Ages 45 – 64 180 (8.2%) 70 (3.2%) 250 (11.5%)
♦ Ages 65 + 250 (19.9%) 90 (7.2%) 340 (27.1%)
♦ All Ages Adult * 460 (6.5%) 170 (2.4%) 630 (8.9%)
* Percent is age-adjusted (direct method) to the United States 2000 standard population. Total percent may not equal the sum of diagnosed percent and undiagnosed percent, due to rounding.
* Overweight is defined as BMI ≥ 25.0 to < 30.0 kg/m2 * Obesity is defined as BMI ≥ 30.0 kg/m2
13%
36%
66%
71%
87%
53%
19%
21%
32%
24%
63%
26%
0% 10% 20% 30% 40% 50% 60% 70% 80% 90% 100%
6
5
4
3
2
1
No DiabetesDiabetes
Obese*
Overweight/Obese*
High Blood Pressure
High Cholesterol
Lack of Phys. Activ.
Current Smoker
Source: Wisconsin Behavioral Risk Factor Survey, 2009-2010

The 2011 Burden of Diabetes in
Pierce County
2010 Hospitalizations - Pierce County
Total Number Number Diabetes-related
(% of total)
Total Charges Diabetes-related Charges
(% of total charges)
All Ages 2,299 288 (12.5%) $31,767,600 $4,650,100 (14.6%)
OTHER INFORMATION ♦ People with pre-diabetes have an increased risk of developing type 2 diabetes, heart disease, and stroke. In
Pierce County, an estimated 10,220 people aged 20 years and older have pre-diabetes. ♦ The cost of diabetes in Pierce County adults is staggering. In 2009 for Pierce County, direct costs were
estimated at $22.4 million, indirect costs were estimated at $11.2 million, totaling an estimated $33.6 million. ♦ Recently, CDC released 2008 county-level age-adjusted prevalence estimates for obesity and physical
inactivity. In Pierce County, 26.4% of people aged 20 years and older were obese and 19.9% of people aged 20 years and older were physically inactive.
PERCENT OF WISCONSIN ADULTS WITH RISK FACTORS BY DIABETES STATUS
The 2011 Burden of Diabetes in Wisconsin is created by the Wisconsin Diabetes Prevention and Control Program (DPCP), Division of Public Health, Department of Health Services. Please see “Detailed Technical Notes” for in-depth information about methodology and data sources. For more information about the Wisconsin Diabetes Prevention and Control Program, go to: http://www.dhs.wisconsin.gov/health/diabetes/. Printing of this document is supported by DPCP partners American Diabetes Association Wisconsin Area, National Kidney Foundation of Wisconsin, and Wisconsin Lions Foundation.
Diabetes Prevalence - Pierce County Age Category
Estimated Number Diagnosed (%)
Estimated Number Undiagnosed (%)
Estimated Total Number (%)
♦ Ages 18 – 44 230 (1.4%) 90 (0.5%) 320 (1.9%)
♦ Ages 45 – 64 860 (8.1%) 320 (3.0%) 1,180 (11.2%)
♦ Ages 65 + 820 (19.9%) 300 (7.3%) 1,120 (27.2%)
♦ All Ages Adult * 1,910 (6.5%) 710 (2.4%) 2,620 (8.9%)
* Percent is age-adjusted (direct method) to the United States 2000 standard population. Total percent may not equal the sum of diagnosed percent and undiagnosed percent, due to rounding.
* Overweight is defined as BMI ≥ 25.0 to < 30.0 kg/m2 * Obesity is defined as BMI ≥ 30.0 kg/m2
13%
36%
66%
71%
87%
53%
19%
21%
32%
24%
63%
26%
0% 10% 20% 30% 40% 50% 60% 70% 80% 90% 100%
6
5
4
3
2
1
No DiabetesDiabetes
Obese*
Overweight/Obese*
High Blood Pressure
High Cholesterol
Lack of Phys. Activ.
Current Smoker
Source: Wisconsin Behavioral Risk Factor Survey, 2009-2010

The 2011 Burden of Diabetes in
Polk County
2010 Hospitalizations - Polk County
Total Number Number Diabetes-related
(% of total)
Total Charges Diabetes-related Charges
(% of total charges)
All Ages 3,788 643 (17.0%) $43,475,900 $8,090,400 (18.6%)
OTHER INFORMATION ♦ People with pre-diabetes have an increased risk of developing type 2 diabetes, heart disease, and stroke. In
Polk County, an estimated 11,550 people aged 20 years and older have pre-diabetes. ♦ The cost of diabetes in Polk County adults is staggering. In 2009 for Polk County, direct costs were estimated
at $31.5 million, indirect costs were estimated at $15.8 million, totaling an estimated $47.3 million. ♦ Recently, CDC released 2008 county-level age-adjusted prevalence estimates for obesity and physical
inactivity. In Polk County, 26.3% of people aged 20 years and older were obese and 20.3% of people aged 20 years and older were physically inactive.
PERCENT OF WISCONSIN ADULTS WITH RISK FACTORS BY DIABETES STATUS
The 2011 Burden of Diabetes in Wisconsin is created by the Wisconsin Diabetes Prevention and Control Program (DPCP), Division of Public Health, Department of Health Services. Please see “Detailed Technical Notes” for in-depth information about methodology and data sources. For more information about the Wisconsin Diabetes Prevention and Control Program, go to: http://www.dhs.wisconsin.gov/health/diabetes/. Printing of this document is supported by DPCP partners American Diabetes Association Wisconsin Area, National Kidney Foundation of Wisconsin, and Wisconsin Lions Foundation.
Diabetes Prevalence - Polk County Age Category
Estimated Number Diagnosed (%)
Estimated Number Undiagnosed (%)
Estimated Total Number (%)
♦ Ages 18 – 44 220 (1.6%) 80 (0.6%) 300 (2.2%)
♦ Ages 45 – 64 1,100 (8.2%) 410 (3.1%) 1,510 (11.3%)
♦ Ages 65 + 1,360 (19.9%) 500 (7.3%) 1,860 (27.2%)
♦ All Ages Adult * 2,680 (6.6%) 990 (2.4%) 3,670 (9.1%)
* Percent is age-adjusted (direct method) to the United States 2000 standard population. Total percent may not equal the sum of diagnosed percent and undiagnosed percent, due to rounding.
* Overweight is defined as BMI ≥ 25.0 to < 30.0 kg/m2 * Obesity is defined as BMI ≥ 30.0 kg/m2
13%
36%
66%
71%
87%
53%
19%
21%
32%
24%
63%
26%
0% 10% 20% 30% 40% 50% 60% 70% 80% 90% 100%
6
5
4
3
2
1
No DiabetesDiabetes
Obese*
Overweight/Obese*
High Blood Pressure
High Cholesterol
Lack of Phys. Activ.
Current Smoker
Source: Wisconsin Behavioral Risk Factor Survey, 2009-2010

The 2011 Burden of Diabetes in
Portage County
2010 Hospitalizations - Portage County
Total Number Number Diabetes-related
(% of total)
Total Charges Diabetes-related Charges
(% of total charges)
All Ages 6,885 977 (14.2%) $124,947,500 $21,091,000 (16.9%)
OTHER INFORMATION ♦ People with pre-diabetes have an increased risk of developing type 2 diabetes, heart disease, and stroke. In
Portage County, an estimated 18,000 people aged 20 years and older have pre-diabetes. ♦ The cost of diabetes in Portage County adults is staggering. In 2009 for Portage County, direct costs were
estimated at $45.4 million, indirect costs were estimated at $22.8 million, totaling an estimated $68.2 million. ♦ Recently, CDC released 2008 county-level age-adjusted prevalence estimates for obesity and physical
inactivity. In Portage County, 27.9% of people aged 20 years and older were obese and 20.7% of people aged 20 years and older were physically inactive.
PERCENT OF WISCONSIN ADULTS WITH RISK FACTORS BY DIABETES STATUS
The 2011 Burden of Diabetes in Wisconsin is created by the Wisconsin Diabetes Prevention and Control Program (DPCP), Division of Public Health, Department of Health Services. Please see “Detailed Technical Notes” for in-depth information about methodology and data sources. For more information about the Wisconsin Diabetes Prevention and Control Program, go to: http://www.dhs.wisconsin.gov/health/diabetes/. Printing of this document is supported by DPCP partners American Diabetes Association Wisconsin Area, National Kidney Foundation of Wisconsin, and Wisconsin Lions Foundation.
Diabetes Prevalence - Portage County Age Category
Estimated Number Diagnosed (%)
Estimated Number Undiagnosed (%)
Estimated Total Number (%)
♦ Ages 18 – 44 360 (1.3%) 130 (0.5%) 490 (1.7%)
♦ Ages 45 – 64 1,900 (10.4%) 710 (3.9%) 2,610 (14.3%)
♦ Ages 65 + 1,610 (19.5%) 600 (7.3%) 2,210 (26.8%)
♦ All Ages Adult * 3,870 (7.0%) 1,440 (2.6%) 5,310 (9.7%)
* Percent is age-adjusted (direct method) to the United States 2000 standard population. Total percent may not equal the sum of diagnosed percent and undiagnosed percent, due to rounding.
* Overweight is defined as BMI ≥ 25.0 to < 30.0 kg/m2 * Obesity is defined as BMI ≥ 30.0 kg/m2
13%
36%
66%
71%
87%
53%
19%
21%
32%
24%
63%
26%
0% 10% 20% 30% 40% 50% 60% 70% 80% 90% 100%
6
5
4
3
2
1
No DiabetesDiabetes
Obese*
Overweight/Obese*
High Blood Pressure
High Cholesterol
Lack of Phys. Activ.
Current Smoker
Source: Wisconsin Behavioral Risk Factor Survey, 2009-2010

The 2011 Burden of Diabetes in
Price County
2010 Hospitalizations - Price County
Total Number Number Diabetes-related
(% of total)
Total Charges Diabetes-related Charges
(% of total charges)
All Ages 1,894 357 (18.8%) $37,828,800 $7,572,600 (20.0%)
OTHER INFORMATION ♦ People with pre-diabetes have an increased risk of developing type 2 diabetes, heart disease, and stroke. In
Price County, an estimated 3,910 people aged 20 years and older have pre-diabetes. ♦ The cost of diabetes in Price County adults is staggering. In 2009 for Price County, direct costs were estimated
at $13.4 million, indirect costs were estimated at $6.7 million, totaling an estimated $20.1 million. ♦ Recently, CDC released 2008 county-level age-adjusted prevalence estimates for obesity and physical
inactivity. In Price County, 29.2% of people aged 20 years and older were obese and 23.6% of people aged 20 years and older were physically inactive.
PERCENT OF WISCONSIN ADULTS WITH RISK FACTORS BY DIABETES STATUS
The 2011 Burden of Diabetes in Wisconsin is created by the Wisconsin Diabetes Prevention and Control Program (DPCP), Division of Public Health, Department of Health Services. Please see “Detailed Technical Notes” for in-depth information about methodology and data sources. For more information about the Wisconsin Diabetes Prevention and Control Program, go to: http://www.dhs.wisconsin.gov/health/diabetes/. Printing of this document is supported by DPCP partners American Diabetes Association Wisconsin Area, National Kidney Foundation of Wisconsin, and Wisconsin Lions Foundation.
Diabetes Prevalence - Price County Age Category
Estimated Number Diagnosed (%)
Estimated Number Undiagnosed (%)
Estimated Total Number (%)
♦ Ages 18 – 44 50 (1.4%) 20 (0.6%) 70 (2.0%)
♦ Ages 45 – 64 520 (10.4%) 190 (3.8%) 710 (14.3%)
♦ Ages 65 + 570 (19.6%) 210 (7.2%) 780 (26.8%)
♦ All Ages Adult * 1,140 (7.1%) 420 (2.6%) 1,560 (9.8%)
* Percent is age-adjusted (direct method) to the United States 2000 standard population. Total percent may not equal the sum of diagnosed percent and undiagnosed percent, due to rounding.
* Overweight is defined as BMI ≥ 25.0 to < 30.0 kg/m2 * Obesity is defined as BMI ≥ 30.0 kg/m2
13%
36%
66%
71%
87%
53%
19%
21%
32%
24%
63%
26%
0% 10% 20% 30% 40% 50% 60% 70% 80% 90% 100%
6
5
4
3
2
1
No DiabetesDiabetes
Obese*
Overweight/Obese*
High Blood Pressure
High Cholesterol
Lack of Phys. Activ.
Current Smoker
Source: Wisconsin Behavioral Risk Factor Survey, 2009-2010

The 2011 Burden of Diabetes in
Racine County
2010 Hospitalizations - Racine County
Total Number Number Diabetes-related
(% of total)
Total Charges Diabetes-related Charges
(% of total charges)
All Ages 24,602 3,823 (15.5%) $644,507,600 $103,535,300 (16.1%)
OTHER INFORMATION ♦ People with pre-diabetes have an increased risk of developing type 2 diabetes, heart disease, and stroke. In
Racine County, an estimated 50,980 people aged 20 years and older have pre-diabetes. ♦ The cost of diabetes in Racine County adults is staggering. In 2009 for Racine County, direct costs were
estimated at $155.0 million, indirect costs were estimated at $77.6 million, totaling an estimated $232.6 million. ♦ Recently, CDC released 2008 county-level age-adjusted prevalence estimates for obesity and physical
inactivity. In Racine County, 29.8% of people aged 20 years and older were obese and 23.7% of people aged 20 years and older were physically inactive.
PERCENT OF WISCONSIN ADULTS WITH RISK FACTORS BY DIABETES STATUS
The 2011 Burden of Diabetes in Wisconsin is created by the Wisconsin Diabetes Prevention and Control Program (DPCP), Division of Public Health, Department of Health Services. Please see “Detailed Technical Notes” for in-depth information about methodology and data sources. For more information about the Wisconsin Diabetes Prevention and Control Program, go to: http://www.dhs.wisconsin.gov/health/diabetes/. Printing of this document is supported by DPCP partners American Diabetes Association Wisconsin Area, National Kidney Foundation of Wisconsin, and Wisconsin Lions Foundation.
Diabetes Prevalence - Racine County Age Category
Estimated Number Diagnosed (%)
Estimated Number Undiagnosed (%)
Estimated Total Number (%)
♦ Ages 18 – 44 2,090 (3.0%) 780 (1.1%) 2,870 (4.2%)
♦ Ages 45 – 64 6,500 (11.5%) 2,420 (4.3%) 8,920 (15.8%)
♦ Ages 65 + 4,610 (18.0%) 1,710 (6.7%) 6,320 (24.7%)
♦ All Ages Adult * 13,200 (8.1%) 4,910 (3.0%) 18,110 (11.1%)
* Percent is age-adjusted (direct method) to the United States 2000 standard population. Total percent may not equal the sum of diagnosed percent and undiagnosed percent, due to rounding.
* Overweight is defined as BMI ≥ 25.0 to < 30.0 kg/m2 * Obesity is defined as BMI ≥ 30.0 kg/m2
13%
36%
66%
71%
87%
53%
19%
21%
32%
24%
63%
26%
0% 10% 20% 30% 40% 50% 60% 70% 80% 90% 100%
6
5
4
3
2
1
No DiabetesDiabetes
Obese*
Overweight/Obese*
High Blood Pressure
High Cholesterol
Lack of Phys. Activ.
Current Smoker
Source: Wisconsin Behavioral Risk Factor Survey, 2009-2010

The 2011 Burden of Diabetes in
Richland County
2010 Hospitalizations - Richland County
Total Number Number Diabetes-related
(% of total)
Total Charges Diabetes-related Charges
(% of total charges)
All Ages 2,036 390 (19.2%) $47,795,500 $13,517,600 (28.3%)
OTHER INFORMATION ♦ People with pre-diabetes have an increased risk of developing type 2 diabetes, heart disease, and stroke. In
Richland County, an estimated 4,670 people aged 20 years and older have pre-diabetes. ♦ The cost of diabetes in Richland County adults is staggering. In 2009 for Richland County, direct costs were
estimated at $12.0 million, indirect costs were estimated at $6.0 million, totaling an estimated $18.0 million. ♦ Recently, CDC released 2008 county-level age-adjusted prevalence estimates for obesity and physical
inactivity. In Richland County, 29.7% of people aged 20 years and older were obese and 22.0% of people aged 20 years and older were physically inactive.
PERCENT OF WISCONSIN ADULTS WITH RISK FACTORS BY DIABETES STATUS
The 2011 Burden of Diabetes in Wisconsin is created by the Wisconsin Diabetes Prevention and Control Program (DPCP), Division of Public Health, Department of Health Services. Please see “Detailed Technical Notes” for in-depth information about methodology and data sources. For more information about the Wisconsin Diabetes Prevention and Control Program, go to: http://www.dhs.wisconsin.gov/health/diabetes/. Printing of this document is supported by DPCP partners American Diabetes Association Wisconsin Area, National Kidney Foundation of Wisconsin, and Wisconsin Lions Foundation.
Diabetes Prevalence - Richland County Age Category
Estimated Number Diagnosed (%)
Estimated Number Undiagnosed (%)
Estimated Total Number (%)
♦ Ages 18 – 44 80 (1.5%) 30 (0.5%) 110 (2.0%)
♦ Ages 45 – 64 360 (6.9%) 130 (2.5%) 490 (9.3%)
♦ Ages 65 + 580 (18.7%) 210 (6.8%) 790 (25.5%)
♦ All Ages Adult * 1,020 (5.9%) 370 (2.2%) 1,390 (8.1%)
* Percent is age-adjusted (direct method) to the United States 2000 standard population. Total percent may not equal the sum of diagnosed percent and undiagnosed percent, due to rounding.
* Overweight is defined as BMI ≥ 25.0 to < 30.0 kg/m2 * Obesity is defined as BMI ≥ 30.0 kg/m2
13%
36%
66%
71%
87%
53%
19%
21%
32%
24%
63%
26%
0% 10% 20% 30% 40% 50% 60% 70% 80% 90% 100%
6
5
4
3
2
1
No DiabetesDiabetes
Obese*
Overweight/Obese*
High Blood Pressure
High Cholesterol
Lack of Phys. Activ.
Current Smoker
Source: Wisconsin Behavioral Risk Factor Survey, 2009-2010

The 2011 Burden of Diabetes in
Rock County
2010 Hospitalizations - Rock County
Total Number Number Diabetes-related
(% of total)
Total Charges Diabetes-related Charges
(% of total charges)
All Ages 17,744 2,928 (16.5%) $472,786,200 $92,010,000 (19.5%)
OTHER INFORMATION ♦ People with pre-diabetes have an increased risk of developing type 2 diabetes, heart disease, and stroke. In
Rock County, an estimated 40,830 people aged 20 years and older have pre-diabetes. ♦ The cost of diabetes in Rock County adults is staggering. In 2009 for Rock County, direct costs were estimated
at $132.4 million, indirect costs were estimated at $66.3 million, totaling an estimated $198.7 million. ♦ Recently, CDC released 2008 county-level age-adjusted prevalence estimates for obesity and physical
inactivity. In Rock County, 28.9% of people aged 20 years and older were obese and 22.8% of people aged 20 years and older were physically inactive.
PERCENT OF WISCONSIN ADULTS WITH RISK FACTORS BY DIABETES STATUS
The 2011 Burden of Diabetes in Wisconsin is created by the Wisconsin Diabetes Prevention and Control Program (DPCP), Division of Public Health, Department of Health Services. Please see “Detailed Technical Notes” for in-depth information about methodology and data sources. For more information about the Wisconsin Diabetes Prevention and Control Program, go to: http://www.dhs.wisconsin.gov/health/diabetes/. Printing of this document is supported by DPCP partners American Diabetes Association Wisconsin Area, National Kidney Foundation of Wisconsin, and Wisconsin Lions Foundation.
Diabetes Prevalence - Rock County Age Category
Estimated Number Diagnosed (%)
Estimated Number Undiagnosed (%)
Estimated Total Number (%)
♦ Ages 18 – 44 1,080 (1.9%) 400 (0.7%) 1,480 (2.6%)
♦ Ages 45 – 64 6,080 (14.2%) 2,260 (5.3%) 8,340 (19.4%)
♦ Ages 65 + 4,110 (19.0%) 1,530 (7.1%) 5,640 (26.1%)
♦ All Ages Adult * 11,270 (8.4%) 4,190 (3.1%) 15,460 (11.5%)
* Percent is age-adjusted (direct method) to the United States 2000 standard population. Total percent may not equal the sum of diagnosed percent and undiagnosed percent, due to rounding.
* Overweight is defined as BMI ≥ 25.0 to < 30.0 kg/m2 * Obesity is defined as BMI ≥ 30.0 kg/m2
13%
36%
66%
71%
87%
53%
19%
21%
32%
24%
63%
26%
0% 10% 20% 30% 40% 50% 60% 70% 80% 90% 100%
6
5
4
3
2
1
No DiabetesDiabetes
Obese*
Overweight/Obese*
High Blood Pressure
High Cholesterol
Lack of Phys. Activ.
Current Smoker
Source: Wisconsin Behavioral Risk Factor Survey, 2009-2010
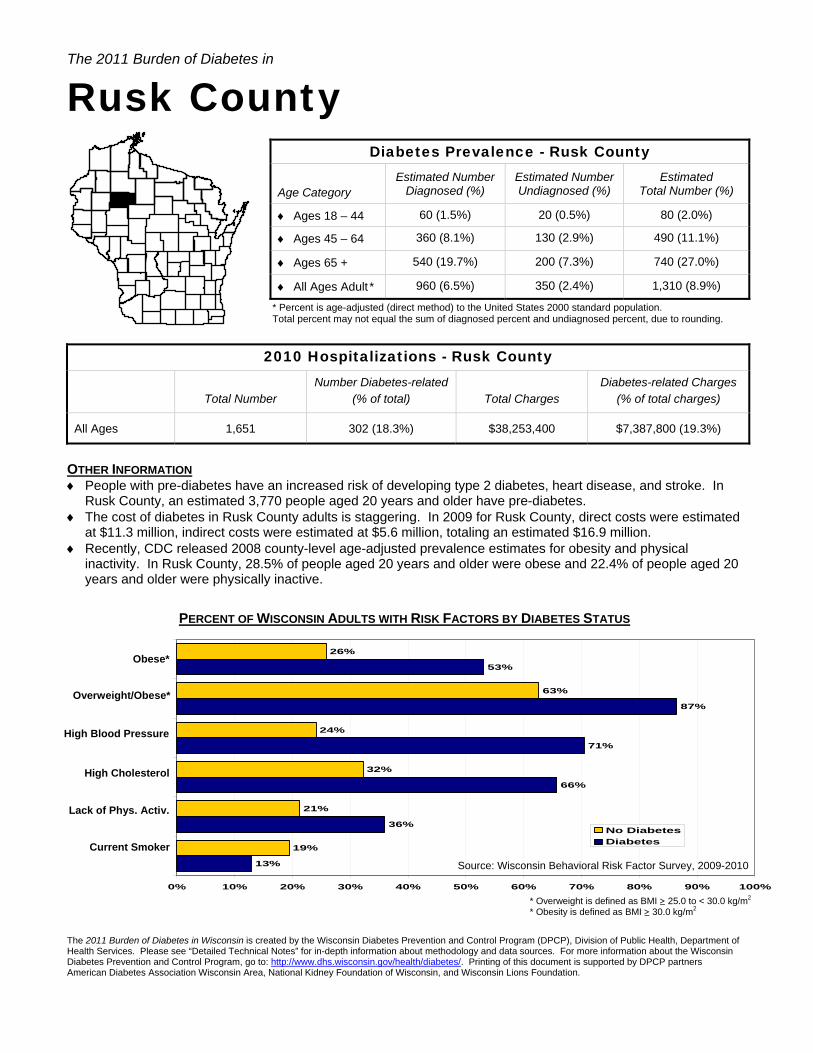
The 2011 Burden of Diabetes in
Rusk County
2010 Hospitalizations - Rusk County
Total Number Number Diabetes-related
(% of total)
Total Charges Diabetes-related Charges
(% of total charges)
All Ages 1,651 302 (18.3%) $38,253,400 $7,387,800 (19.3%)
OTHER INFORMATION ♦ People with pre-diabetes have an increased risk of developing type 2 diabetes, heart disease, and stroke. In
Rusk County, an estimated 3,770 people aged 20 years and older have pre-diabetes. ♦ The cost of diabetes in Rusk County adults is staggering. In 2009 for Rusk County, direct costs were estimated
at $11.3 million, indirect costs were estimated at $5.6 million, totaling an estimated $16.9 million. ♦ Recently, CDC released 2008 county-level age-adjusted prevalence estimates for obesity and physical
inactivity. In Rusk County, 28.5% of people aged 20 years and older were obese and 22.4% of people aged 20 years and older were physically inactive.
PERCENT OF WISCONSIN ADULTS WITH RISK FACTORS BY DIABETES STATUS
The 2011 Burden of Diabetes in Wisconsin is created by the Wisconsin Diabetes Prevention and Control Program (DPCP), Division of Public Health, Department of Health Services. Please see “Detailed Technical Notes” for in-depth information about methodology and data sources. For more information about the Wisconsin Diabetes Prevention and Control Program, go to: http://www.dhs.wisconsin.gov/health/diabetes/. Printing of this document is supported by DPCP partners American Diabetes Association Wisconsin Area, National Kidney Foundation of Wisconsin, and Wisconsin Lions Foundation.
Diabetes Prevalence - Rusk County Age Category
Estimated Number Diagnosed (%)
Estimated Number Undiagnosed (%)
Estimated Total Number (%)
♦ Ages 18 – 44 60 (1.5%) 20 (0.5%) 80 (2.0%)
♦ Ages 45 – 64 360 (8.1%) 130 (2.9%) 490 (11.1%)
♦ Ages 65 + 540 (19.7%) 200 (7.3%) 740 (27.0%)
♦ All Ages Adult * 960 (6.5%) 350 (2.4%) 1,310 (8.9%)
* Percent is age-adjusted (direct method) to the United States 2000 standard population. Total percent may not equal the sum of diagnosed percent and undiagnosed percent, due to rounding.
* Overweight is defined as BMI ≥ 25.0 to < 30.0 kg/m2 * Obesity is defined as BMI ≥ 30.0 kg/m2
13%
36%
66%
71%
87%
53%
19%
21%
32%
24%
63%
26%
0% 10% 20% 30% 40% 50% 60% 70% 80% 90% 100%
6
5
4
3
2
1
No DiabetesDiabetes
Obese*
Overweight/Obese*
High Blood Pressure
High Cholesterol
Lack of Phys. Activ.
Current Smoker
Source: Wisconsin Behavioral Risk Factor Survey, 2009-2010

The 2011 Burden of Diabetes in
St. Croix County
2010 Hospitalizations - St. Croix County
Total Number Number Diabetes-related
(% of total)
Total Charges Diabetes-related Charges
(% of total charges)
All Ages 4,034 531 (13.2%) $44,657,100 $6,935,100 (15.5%)
OTHER INFORMATION ♦ People with pre-diabetes have an increased risk of developing type 2 diabetes, heart disease, and stroke. In
St. Croix County, an estimated 20,970 people aged 20 years and older have pre-diabetes. ♦ The cost of diabetes in St. Croix County adults is staggering. In 2009 for St. Croix County, direct costs were
estimated at $45.8 million, indirect costs were estimated at $22.9 million, totaling an estimated $68.7 million. ♦ Recently, CDC released 2008 county-level age-adjusted prevalence estimates for obesity and physical
inactivity. In St. Croix County, 27.3% of people aged 20 years and older were obese and 19.0% of people aged 20 years and older were physically inactive.
PERCENT OF WISCONSIN ADULTS WITH RISK FACTORS BY DIABETES STATUS
The 2011 Burden of Diabetes in Wisconsin is created by the Wisconsin Diabetes Prevention and Control Program (DPCP), Division of Public Health, Department of Health Services. Please see “Detailed Technical Notes” for in-depth information about methodology and data sources. For more information about the Wisconsin Diabetes Prevention and Control Program, go to: http://www.dhs.wisconsin.gov/health/diabetes/. Printing of this document is supported by DPCP partners American Diabetes Association Wisconsin Area, National Kidney Foundation of Wisconsin, and Wisconsin Lions Foundation.
Diabetes Prevalence - St. Croix County Age Category
Estimated Number Diagnosed (%)
Estimated Number Undiagnosed (%)
Estimated Total Number (%)
♦ Ages 18 – 44 440 (1.4%) 170 (0.5%) 610 (2.0%)
♦ Ages 45 – 64 1,810 (8.1%) 670 (3.0%) 2,480 (11.1%)
♦ Ages 65 + 1,650 (19.8%) 610 (7.3%) 2,260 (27.1%)
♦ All Ages Adult * 3,900 (6.5%) 1,450 (2.4%) 5,350 (8.9%)
* Percent is age-adjusted (direct method) to the United States 2000 standard population. Total percent may not equal the sum of diagnosed percent and undiagnosed percent, due to rounding.
* Overweight is defined as BMI ≥ 25.0 to < 30.0 kg/m2 * Obesity is defined as BMI ≥ 30.0 kg/m2
13%
36%
66%
71%
87%
53%
19%
21%
32%
24%
63%
26%
0% 10% 20% 30% 40% 50% 60% 70% 80% 90% 100%
6
5
4
3
2
1
No DiabetesDiabetes
Obese*
Overweight/Obese*
High Blood Pressure
High Cholesterol
Lack of Phys. Activ.
Current Smoker
Source: Wisconsin Behavioral Risk Factor Survey, 2009-2010

The 2011 Burden of Diabetes in
Sauk County
2010 Hospitalizations - Sauk County
Total Number Number Diabetes-related
(% of total)
Total Charges Diabetes-related Charges
(% of total charges)
All Ages 6,793 1,129 (16.6%) $151,928,500 $28,572,200 (18.8%)
OTHER INFORMATION ♦ People with pre-diabetes have an increased risk of developing type 2 diabetes, heart disease, and stroke. In
Sauk County, an estimated 15,340 people aged 20 years and older have pre-diabetes. ♦ The cost of diabetes in Sauk County adults is staggering. In 2009 for Sauk County, direct costs were estimated
at $37.3 million, indirect costs were estimated at $18.7 million, totaling an estimated $56.0 million. ♦ Recently, CDC released 2008 county-level age-adjusted prevalence estimates for obesity and physical
inactivity. In Sauk County, 27.7% of people aged 20 years and older were obese and 23.0% of people aged 20 years and older were physically inactive.
PERCENT OF WISCONSIN ADULTS WITH RISK FACTORS BY DIABETES STATUS
The 2011 Burden of Diabetes in Wisconsin is created by the Wisconsin Diabetes Prevention and Control Program (DPCP), Division of Public Health, Department of Health Services. Please see “Detailed Technical Notes” for in-depth information about methodology and data sources. For more information about the Wisconsin Diabetes Prevention and Control Program, go to: http://www.dhs.wisconsin.gov/health/diabetes/. Printing of this document is supported by DPCP partners American Diabetes Association Wisconsin Area, National Kidney Foundation of Wisconsin, and Wisconsin Lions Foundation.
Diabetes Prevalence - Sauk County Age Category
Estimated Number Diagnosed (%)
Estimated Number Undiagnosed (%)
Estimated Total Number (%)
♦ Ages 18 – 44 340 (1.7%) 120 (0.6%) 460 (2.4%)
♦ Ages 45 – 64 1,190 (7.1%) 440 (2.6%) 1,630 (9.7%)
♦ Ages 65 + 1,650 (18.5%) 620 (7.0%) 2,270 (25.5%)
♦ All Ages Adult * 3,180 (6.1%) 1,180 (2.3%) 4,360 (8.4%)
* Percent is age-adjusted (direct method) to the United States 2000 standard population. Total percent may not equal the sum of diagnosed percent and undiagnosed percent, due to rounding.
* Overweight is defined as BMI ≥ 25.0 to < 30.0 kg/m2 * Obesity is defined as BMI ≥ 30.0 kg/m2
13%
36%
66%
71%
87%
53%
19%
21%
32%
24%
63%
26%
0% 10% 20% 30% 40% 50% 60% 70% 80% 90% 100%
6
5
4
3
2
1
No DiabetesDiabetes
Obese*
Overweight/Obese*
High Blood Pressure
High Cholesterol
Lack of Phys. Activ.
Current Smoker
Source: Wisconsin Behavioral Risk Factor Survey, 2009-2010

The 2011 Burden of Diabetes in
Sawyer County
2010 Hospitalizations - Sawyer County
Total Number Number Diabetes-related
(% of total)
Total Charges Diabetes-related Charges
(% of total charges)
All Ages 1,607 332 (20.7%) $24,977,700 $4,861,100 (19.5%)
OTHER INFORMATION ♦ People with pre-diabetes have an increased risk of developing type 2 diabetes, heart disease, and stroke. In
Sawyer County, an estimated 4,560 people aged 20 years and older have pre-diabetes. ♦ The cost of diabetes in Sawyer County adults is staggering. In 2009 for Sawyer County, direct costs were
estimated at $20.4 million, indirect costs were estimated at $10.2 million, totaling an estimated $30.6 million. ♦ Recently, CDC released 2008 county-level age-adjusted prevalence estimates for obesity and physical
inactivity. In Sawyer County, 27.9% of people aged 20 years and older were obese and 20.4% of people aged 20 years and older were physically inactive.
PERCENT OF WISCONSIN ADULTS WITH RISK FACTORS BY DIABETES STATUS
The 2011 Burden of Diabetes in Wisconsin is created by the Wisconsin Diabetes Prevention and Control Program (DPCP), Division of Public Health, Department of Health Services. Please see “Detailed Technical Notes” for in-depth information about methodology and data sources. For more information about the Wisconsin Diabetes Prevention and Control Program, go to: http://www.dhs.wisconsin.gov/health/diabetes/. Printing of this document is supported by DPCP partners American Diabetes Association Wisconsin Area, National Kidney Foundation of Wisconsin, and Wisconsin Lions Foundation.
Diabetes Prevalence - Sawyer County Age Category
Estimated Number Diagnosed (%)
Estimated Number Undiagnosed (%)
Estimated Total Number (%)
♦ Ages 18 – 44 260 (5.9%) 100 (2.3%) 360 (8.1%)
♦ Ages 45 – 64 820 (14.6%) 310 (5.5%) 1,130 (20.1%)
♦ Ages 65 + 660 (19.9%) 240 (7.2%) 900 (27.1%)
♦ All Ages Adult * 1,740 (10.8%) 650 (4.1%) 2,390 (14.8%)
* Percent is age-adjusted (direct method) to the United States 2000 standard population. Total percent may not equal the sum of diagnosed percent and undiagnosed percent, due to rounding.
* Overweight is defined as BMI ≥ 25.0 to < 30.0 kg/m2 * Obesity is defined as BMI ≥ 30.0 kg/m2
13%
36%
66%
71%
87%
53%
19%
21%
32%
24%
63%
26%
0% 10% 20% 30% 40% 50% 60% 70% 80% 90% 100%
6
5
4
3
2
1
No DiabetesDiabetes
Obese*
Overweight/Obese*
High Blood Pressure
High Cholesterol
Lack of Phys. Activ.
Current Smoker
Source: Wisconsin Behavioral Risk Factor Survey, 2009-2010

The 2011 Burden of Diabetes in
Shawano County
2010 Hospitalizations - Shawano County
Total Number Number Diabetes-related
(% of total)
Total Charges Diabetes-related Charges
(% of total charges)
All Ages 5,047 950 (18.8%) $100,780,700 $20,821,800 (20.7%)
OTHER INFORMATION ♦ People with pre-diabetes have an increased risk of developing type 2 diabetes, heart disease, and stroke. In
Shawano County, an estimated 10,760 people aged 20 years and older have pre-diabetes. ♦ The cost of diabetes in Shawano County adults is staggering. In 2009 for Shawano County, direct costs were
estimated at $40.4 million, indirect costs were estimated at $20.2 million, totaling an estimated $60.6 million. ♦ Recently, CDC released 2008 county-level age-adjusted prevalence estimates for obesity and physical
inactivity. In Shawano County, 28.2% of people aged 20 years and older were obese and 24.5% of people aged 20 years and older were physically inactive.
PERCENT OF WISCONSIN ADULTS WITH RISK FACTORS BY DIABETES STATUS
The 2011 Burden of Diabetes in Wisconsin is created by the Wisconsin Diabetes Prevention and Control Program (DPCP), Division of Public Health, Department of Health Services. Please see “Detailed Technical Notes” for in-depth information about methodology and data sources. For more information about the Wisconsin Diabetes Prevention and Control Program, go to: http://www.dhs.wisconsin.gov/health/diabetes/. Printing of this document is supported by DPCP partners American Diabetes Association Wisconsin Area, National Kidney Foundation of Wisconsin, and Wisconsin Lions Foundation.
Diabetes Prevalence - Shawano County Age Category
Estimated Number Diagnosed (%)
Estimated Number Undiagnosed (%)
Estimated Total Number (%)
♦ Ages 18 – 44 430 (3.5%) 160 (1.3%) 590 (4.8%)
♦ Ages 45 – 64 1,550 (13.1%) 580 (4.9%) 2,130 (18.0%)
♦ Ages 65 + 1,460 (20.0%) 540 (7.4%) 2,000 (27.3%)
♦ All Ages Adult * 3,440 (9.1%) 1,280 (3.4%) 4,720 (12.4%)
* Percent is age-adjusted (direct method) to the United States 2000 standard population. Total percent may not equal the sum of diagnosed percent and undiagnosed percent, due to rounding.
* Overweight is defined as BMI ≥ 25.0 to < 30.0 kg/m2 * Obesity is defined as BMI ≥ 30.0 kg/m2
13%
36%
66%
71%
87%
53%
19%
21%
32%
24%
63%
26%
0% 10% 20% 30% 40% 50% 60% 70% 80% 90% 100%
6
5
4
3
2
1
No DiabetesDiabetes
Obese*
Overweight/Obese*
High Blood Pressure
High Cholesterol
Lack of Phys. Activ.
Current Smoker
Source: Wisconsin Behavioral Risk Factor Survey, 2009-2010

The 2011 Burden of Diabetes in
Sheboygan County
2010 Hospitalizations - Sheboygan County
Total Number Number Diabetes-related
(% of total)
Total Charges Diabetes-related Charges
(% of total charges)
All Ages 10,939 1,497 (13.7%) $286,830,000 $47,774,900 (16.7%)
OTHER INFORMATION ♦ People with pre-diabetes have an increased risk of developing type 2 diabetes, heart disease, and stroke. In
Sheboygan County, an estimated 29,660 people aged 20 years and older have pre-diabetes. ♦ The cost of diabetes in Sheboygan County adults is staggering. In 2009 for Sheboygan County, direct costs
were estimated at $93.7 million, indirect costs were estimated at $46.9 million, totaling an estimated $140.6 million.
♦ Recently, CDC released 2008 county-level age-adjusted prevalence estimates for obesity and physical inactivity. In Sheboygan County, 27.8% of people aged 20 years and older were obese and 22.1% of people aged 20 years and older were physically inactive.
PERCENT OF WISCONSIN ADULTS WITH RISK FACTORS BY DIABETES STATUS
The 2011 Burden of Diabetes in Wisconsin is created by the Wisconsin Diabetes Prevention and Control Program (DPCP), Division of Public Health, Department of Health Services. Please see “Detailed Technical Notes” for in-depth information about methodology and data sources. For more information about the Wisconsin Diabetes Prevention and Control Program, go to: http://www.dhs.wisconsin.gov/health/diabetes/. Printing of this document is supported by DPCP partners American Diabetes Association Wisconsin Area, National Kidney Foundation of Wisconsin, and Wisconsin Lions Foundation.
Diabetes Prevalence - Sheboygan County Age Category
Estimated Number Diagnosed (%)
Estimated Number Undiagnosed (%)
Estimated Total Number (%)
♦ Ages 18 – 44 820 (2.1%) 310 (0.8%) 1,130 (2.9%)
♦ Ages 45 – 64 3,920 (12.0%) 1,460 (4.5%) 5,380 (16.5%)
♦ Ages 65 + 3,240 (19.8%) 1,210 (7.4%) 4,450 (27.2%)
♦ All Ages Adult * 7,980 (8.0%) 2,980 (3.0%) 10,960 (11.0%)
* Percent is age-adjusted (direct method) to the United States 2000 standard population. Total percent may not equal the sum of diagnosed percent and undiagnosed percent, due to rounding.
* Overweight is defined as BMI ≥ 25.0 to < 30.0 kg/m2 * Obesity is defined as BMI ≥ 30.0 kg/m2
13%
36%
66%
71%
87%
53%
19%
21%
32%
24%
63%
26%
0% 10% 20% 30% 40% 50% 60% 70% 80% 90% 100%
6
5
4
3
2
1
No DiabetesDiabetes
Obese*
Overweight/Obese*
High Blood Pressure
High Cholesterol
Lack of Phys. Activ.
Current Smoker
Source: Wisconsin Behavioral Risk Factor Survey, 2009-2010

The 2011 Burden of Diabetes in
Taylor County
2010 Hospitalizations - Taylor County
Total Number Number Diabetes-related
(% of total)
Total Charges Diabetes-related Charges
(% of total charges)
All Ages 2,023 334 (16.5%) $41,343,100 $8,494,500 (20.5%)
OTHER INFORMATION ♦ People with pre-diabetes have an increased risk of developing type 2 diabetes, heart disease, and stroke. In
Taylor County, an estimated 5,000 people aged 20 years and older have pre-diabetes. ♦ The cost of diabetes in Taylor County adults is staggering. In 2009 for Taylor County, direct costs were
estimated at $14.8 million, indirect costs were estimated at $7.4 million, totaling an estimated $22.2 million. ♦ Recently, CDC released 2008 county-level age-adjusted prevalence estimates for obesity and physical
inactivity. In Taylor County, 26.9% of people aged 20 years and older were obese and 24.0% of people aged 20 years and older were physically inactive.
PERCENT OF WISCONSIN ADULTS WITH RISK FACTORS BY DIABETES STATUS
The 2011 Burden of Diabetes in Wisconsin is created by the Wisconsin Diabetes Prevention and Control Program (DPCP), Division of Public Health, Department of Health Services. Please see “Detailed Technical Notes” for in-depth information about methodology and data sources. For more information about the Wisconsin Diabetes Prevention and Control Program, go to: http://www.dhs.wisconsin.gov/health/diabetes/. Printing of this document is supported by DPCP partners American Diabetes Association Wisconsin Area, National Kidney Foundation of Wisconsin, and Wisconsin Lions Foundation.
Diabetes Prevalence - Taylor County Age Category
Estimated Number Diagnosed (%)
Estimated Number Undiagnosed (%)
Estimated Total Number (%)
♦ Ages 18 – 44 70 (1.2%) 20 (0.3%) 90 (1.5%)
♦ Ages 45 – 64 580 (10.2%) 220 (3.9%) 800 (14.1%)
♦ Ages 65 + 610 (19.6%) 230 (7.4%) 840 (27.0%)
♦ All Ages Adult * 1,260 (7.0%) 470 (2.6%) 1,730 (9.5%)
* Percent is age-adjusted (direct method) to the United States 2000 standard population. Total percent may not equal the sum of diagnosed percent and undiagnosed percent, due to rounding.
* Overweight is defined as BMI ≥ 25.0 to < 30.0 kg/m2 * Obesity is defined as BMI ≥ 30.0 kg/m2
13%
36%
66%
71%
87%
53%
19%
21%
32%
24%
63%
26%
0% 10% 20% 30% 40% 50% 60% 70% 80% 90% 100%
6
5
4
3
2
1
No DiabetesDiabetes
Obese*
Overweight/Obese*
High Blood Pressure
High Cholesterol
Lack of Phys. Activ.
Current Smoker
Source: Wisconsin Behavioral Risk Factor Survey, 2009-2010

The 2011 Burden of Diabetes in
Trempealeau County
2010 Hospitalizations - Trempealeau County
Total Number Number Diabetes-related
(% of total)
Total Charges Diabetes-related Charges
(% of total charges)
All Ages 3,132 546 (17.4%) $64,944,300 $12,782,400 (19.7%)
OTHER INFORMATION ♦ People with pre-diabetes have an increased risk of developing type 2 diabetes, heart disease, and stroke. In
Trempealeau County, an estimated 7,170 people aged 20 years and older have pre-diabetes. ♦ The cost of diabetes in Trempealeau County adults is staggering. In 2009 for Trempealeau County, direct
costs were estimated at $19.4 million, indirect costs were estimated at $9.7 million, totaling an estimated $29.1 million.
♦ Recently, CDC released 2008 county-level age-adjusted prevalence estimates for obesity and physical inactivity. In Trempealeau County, 29.9% of people aged 20 years and older were obese and 23.0% of people aged 20 years and older were physically inactive.
PERCENT OF WISCONSIN ADULTS WITH RISK FACTORS BY DIABETES STATUS
The 2011 Burden of Diabetes in Wisconsin is created by the Wisconsin Diabetes Prevention and Control Program (DPCP), Division of Public Health, Department of Health Services. Please see “Detailed Technical Notes” for in-depth information about methodology and data sources. For more information about the Wisconsin Diabetes Prevention and Control Program, go to: http://www.dhs.wisconsin.gov/health/diabetes/. Printing of this document is supported by DPCP partners American Diabetes Association Wisconsin Area, National Kidney Foundation of Wisconsin, and Wisconsin Lions Foundation.
Diabetes Prevalence - Trempealeau County Age Category
Estimated Number Diagnosed (%)
Estimated Number Undiagnosed (%)
Estimated Total Number (%)
♦ Ages 18 – 44 120 (1.4%) 40 (0.5%) 160 (1.9%)
♦ Ages 45 – 64 630 (7.9%) 240 (3.0%) 870 (11.0%)
♦ Ages 65 + 900 (19.8%) 330 (7.3%) 1,230 (27.1%)
♦ All Ages Adult * 1,650 (6.4%) 610 (2.4%) 2,260 (8.8%)
* Percent is age-adjusted (direct method) to the United States 2000 standard population. Total percent may not equal the sum of diagnosed percent and undiagnosed percent, due to rounding.
* Overweight is defined as BMI ≥ 25.0 to < 30.0 kg/m2 * Obesity is defined as BMI ≥ 30.0 kg/m2
13%
36%
66%
71%
87%
53%
19%
21%
32%
24%
63%
26%
0% 10% 20% 30% 40% 50% 60% 70% 80% 90% 100%
6
5
4
3
2
1
No DiabetesDiabetes
Obese*
Overweight/Obese*
High Blood Pressure
High Cholesterol
Lack of Phys. Activ.
Current Smoker
Source: Wisconsin Behavioral Risk Factor Survey, 2009-2010

The 2011 Burden of Diabetes in
Vernon County
2010 Hospitalizations - Vernon County
Total Number Number Diabetes-related
(% of total)
Total Charges Diabetes-related Charges
(% of total charges)
All Ages 2,973 497 (16.7%) $67,907,400 $14,217,000 (20.9%)
OTHER INFORMATION ♦ People with pre-diabetes have an increased risk of developing type 2 diabetes, heart disease, and stroke. In
Vernon County, an estimated 7,330 people aged 20 years and older have pre-diabetes. ♦ The cost of diabetes in Vernon County adults is staggering. In 2009 for Vernon County, direct costs were
estimated at $18.7 million, indirect costs were estimated at $9.3 million, totaling an estimated $28.0 million. ♦ Recently, CDC released 2008 county-level age-adjusted prevalence estimates for obesity and physical
inactivity. In Vernon County, 27.4% of people aged 20 years and older were obese and 21.8% of people aged 20 years and older were physically inactive.
PERCENT OF WISCONSIN ADULTS WITH RISK FACTORS BY DIABETES STATUS
The 2011 Burden of Diabetes in Wisconsin is created by the Wisconsin Diabetes Prevention and Control Program (DPCP), Division of Public Health, Department of Health Services. Please see “Detailed Technical Notes” for in-depth information about methodology and data sources. For more information about the Wisconsin Diabetes Prevention and Control Program, go to: http://www.dhs.wisconsin.gov/health/diabetes/. Printing of this document is supported by DPCP partners American Diabetes Association Wisconsin Area, National Kidney Foundation of Wisconsin, and Wisconsin Lions Foundation.
Diabetes Prevalence - Vernon County Age Category
Estimated Number Diagnosed (%)
Estimated Number Undiagnosed (%)
Estimated Total Number (%)
♦ Ages 18 – 44 120 (1.4%) 50 (0.6%) 170 (2.0%)
♦ Ages 45 – 64 580 (6.9%) 210 (2.5%) 790 (9.4%)
♦ Ages 65 + 890 (18.4%) 330 (6.8%) 1,220 (25.3%)
♦ All Ages Adult * 1,590 (5.9%) 590 (2.2%) 2,180 (8.1%)
* Percent is age-adjusted (direct method) to the United States 2000 standard population. Total percent may not equal the sum of diagnosed percent and undiagnosed percent, due to rounding.
* Overweight is defined as BMI ≥ 25.0 to < 30.0 kg/m2 * Obesity is defined as BMI ≥ 30.0 kg/m2
13%
36%
66%
71%
87%
53%
19%
21%
32%
24%
63%
26%
0% 10% 20% 30% 40% 50% 60% 70% 80% 90% 100%
6
5
4
3
2
1
No DiabetesDiabetes
Obese*
Overweight/Obese*
High Blood Pressure
High Cholesterol
Lack of Phys. Activ.
Current Smoker
Source: Wisconsin Behavioral Risk Factor Survey, 2009-2010

The 2011 Burden of Diabetes in
Vilas County
2010 Hospitalizations - Vilas County
Total Number Number Diabetes-related
(% of total)
Total Charges Diabetes-related Charges
(% of total charges)
All Ages 3,433 563 (16.4%) $79,114,300 $14,998,500 (19.0%)
OTHER INFORMATION ♦ People with pre-diabetes have an increased risk of developing type 2 diabetes, heart disease, and stroke. In
Vilas County, an estimated 6,070 people aged 20 years and older have pre-diabetes. ♦ The cost of diabetes in Vilas County adults is staggering. In 2009 for Vilas County, direct costs were estimated
at $26.0 million, indirect costs were estimated at $13.0 million, totaling an estimated $39.0 million. ♦ Recently, CDC released 2008 county-level age-adjusted prevalence estimates for obesity and physical
inactivity. In Vilas County, 27.5% of people aged 20 years and older were obese and 22.4% of people aged 20 years and older were physically inactive.
PERCENT OF WISCONSIN ADULTS WITH RISK FACTORS BY DIABETES STATUS
The 2011 Burden of Diabetes in Wisconsin is created by the Wisconsin Diabetes Prevention and Control Program (DPCP), Division of Public Health, Department of Health Services. Please see “Detailed Technical Notes” for in-depth information about methodology and data sources. For more information about the Wisconsin Diabetes Prevention and Control Program, go to: http://www.dhs.wisconsin.gov/health/diabetes/. Printing of this document is supported by DPCP partners American Diabetes Association Wisconsin Area, National Kidney Foundation of Wisconsin, and Wisconsin Lions Foundation.
Diabetes Prevalence - Vilas County Age Category
Estimated Number Diagnosed (%)
Estimated Number Undiagnosed (%)
Estimated Total Number (%)
♦ Ages 18 – 44 210 (4.2%) 80 (1.6%) 290 (5.8%)
♦ Ages 45 – 64 900 (12.7%) 340 (4.8%) 1,240 (17.5%)
♦ Ages 65 + 1,100 (19.6%) 410 (7.3%) 1,510 (27.0%)
♦ All Ages Adult * 2,210 (9.3%) 830 (3.5%) 3,040 (12.8%)
* Percent is age-adjusted (direct method) to the United States 2000 standard population. Total percent may not equal the sum of diagnosed percent and undiagnosed percent, due to rounding.
* Overweight is defined as BMI ≥ 25.0 to < 30.0 kg/m2 * Obesity is defined as BMI ≥ 30.0 kg/m2
13%
36%
66%
71%
87%
53%
19%
21%
32%
24%
63%
26%
0% 10% 20% 30% 40% 50% 60% 70% 80% 90% 100%
6
5
4
3
2
1
No DiabetesDiabetes
Obese*
Overweight/Obese*
High Blood Pressure
High Cholesterol
Lack of Phys. Activ.
Current Smoker
Source: Wisconsin Behavioral Risk Factor Survey, 2009-2010

The 2011 Burden of Diabetes in
Walworth County
2010 Hospitalizations - Walworth County
Total Number Number Diabetes-related
(% of total)
Total Charges Diabetes-related Charges
(% of total charges)
All Ages 9,898 1,385 (14.0%) $286,946,400 $43,846,400 (15.3%)
OTHER INFORMATION ♦ People with pre-diabetes have an increased risk of developing type 2 diabetes, heart disease, and stroke. In
Walworth County, an estimated 25,950 people aged 20 years and older have pre-diabetes. ♦ The cost of diabetes in Walworth County adults is staggering. In 2009 for Walworth County, direct costs were
estimated at $67.6 million, indirect costs were estimated at $33.9 million, totaling an estimated $101.5 million. ♦ Recently, CDC released 2008 county-level age-adjusted prevalence estimates for obesity and physical
inactivity. In Walworth County, 26.7% of people aged 20 years and older were obese and 21.1% of people aged 20 years and older were physically inactive.
PERCENT OF WISCONSIN ADULTS WITH RISK FACTORS BY DIABETES STATUS
The 2011 Burden of Diabetes in Wisconsin is created by the Wisconsin Diabetes Prevention and Control Program (DPCP), Division of Public Health, Department of Health Services. Please see “Detailed Technical Notes” for in-depth information about methodology and data sources. For more information about the Wisconsin Diabetes Prevention and Control Program, go to: http://www.dhs.wisconsin.gov/health/diabetes/. Printing of this document is supported by DPCP partners American Diabetes Association Wisconsin Area, National Kidney Foundation of Wisconsin, and Wisconsin Lions Foundation.
Diabetes Prevalence - Walworth County Age Category
Estimated Number Diagnosed (%)
Estimated Number Undiagnosed (%)
Estimated Total Number (%)
♦ Ages 18 – 44 950 (2.5%) 360 (1.0%) 1,310 (3.5%)
♦ Ages 45 – 64 2,550 (9.3%) 950 (3.5%) 3,500 (12.8%)
♦ Ages 65 + 2,260 (16.8%) 840 (6.2%) 3,100 (23.1%)
♦ All Ages Adult * 5,760 (6.9%) 2,150 (2.6%) 7,910 (9.5%)
* Percent is age-adjusted (direct method) to the United States 2000 standard population. Total percent may not equal the sum of diagnosed percent and undiagnosed percent, due to rounding.
* Overweight is defined as BMI ≥ 25.0 to < 30.0 kg/m2 * Obesity is defined as BMI ≥ 30.0 kg/m2
13%
36%
66%
71%
87%
53%
19%
21%
32%
24%
63%
26%
0% 10% 20% 30% 40% 50% 60% 70% 80% 90% 100%
6
5
4
3
2
1
No DiabetesDiabetes
Obese*
Overweight/Obese*
High Blood Pressure
High Cholesterol
Lack of Phys. Activ.
Current Smoker
Source: Wisconsin Behavioral Risk Factor Survey, 2009-2010

The 2011 Burden of Diabetes in
Washburn County
2010 Hospitalizations - Washburn County
Total Number Number Diabetes-related
(% of total)
Total Charges Diabetes-related Charges
(% of total charges)
All Ages 1,928 322 (16.7%) $30,452,700 $5,277,500 (17.3%)
OTHER INFORMATION ♦ People with pre-diabetes have an increased risk of developing type 2 diabetes, heart disease, and stroke. In
Washburn County, an estimated 4,530 people aged 20 years and older have pre-diabetes. ♦ The cost of diabetes in Washburn County adults is staggering. In 2009 for Washburn County, direct costs were
estimated at $14.3 million, indirect costs were estimated at $7.2 million, totaling an estimated $21.5 million. ♦ Recently, CDC released 2008 county-level age-adjusted prevalence estimates for obesity and physical
inactivity. In Washburn County, 28.1% of people aged 20 years and older were obese and 20.7% of people aged 20 years and older were physically inactive.
PERCENT OF WISCONSIN ADULTS WITH RISK FACTORS BY DIABETES STATUS
The 2011 Burden of Diabetes in Wisconsin is created by the Wisconsin Diabetes Prevention and Control Program (DPCP), Division of Public Health, Department of Health Services. Please see “Detailed Technical Notes” for in-depth information about methodology and data sources. For more information about the Wisconsin Diabetes Prevention and Control Program, go to: http://www.dhs.wisconsin.gov/health/diabetes/. Printing of this document is supported by DPCP partners American Diabetes Association Wisconsin Area, National Kidney Foundation of Wisconsin, and Wisconsin Lions Foundation.
Diabetes Prevalence - Washburn County Age Category
Estimated Number Diagnosed (%)
Estimated Number Undiagnosed (%)
Estimated Total Number (%)
♦ Ages 18 – 44 70 (1.6%) 30 (0.7%) 100 (2.3%)
♦ Ages 45 – 64 450 (8.4%) 170 (3.2%) 620 (11.6%)
♦ Ages 65 + 700 (19.7%) 260 (7.3%) 960 (27.0%)
♦ All Ages Adult * 1,220 (6.6%) 460 (2.5%) 1,680 (9.2%)
* Percent is age-adjusted (direct method) to the United States 2000 standard population. Total percent may not equal the sum of diagnosed percent and undiagnosed percent, due to rounding.
* Overweight is defined as BMI ≥ 25.0 to < 30.0 kg/m2 * Obesity is defined as BMI ≥ 30.0 kg/m2
13%
36%
66%
71%
87%
53%
19%
21%
32%
24%
63%
26%
0% 10% 20% 30% 40% 50% 60% 70% 80% 90% 100%
6
5
4
3
2
1
No DiabetesDiabetes
Obese*
Overweight/Obese*
High Blood Pressure
High Cholesterol
Lack of Phys. Activ.
Current Smoker
Source: Wisconsin Behavioral Risk Factor Survey, 2009-2010

The 2011 Burden of Diabetes in
Washington County
2010 Hospitalizations - Washington County
Total Number Number Diabetes-related
(% of total)
Total Charges Diabetes-related Charges
(% of total charges)
All Ages 13,096 1,755 (13.4%) $341,143,500 $50,477,900 (14.8%)
OTHER INFORMATION ♦ People with pre-diabetes have an increased risk of developing type 2 diabetes, heart disease, and stroke. In
Washington County, an estimated 33,820 people aged 20 years and older have pre-diabetes. ♦ The cost of diabetes in Washington County adults is staggering. In 2009 for Washington County, direct costs
were estimated at $71.3 million, indirect costs were estimated at $35.7 million, totaling an estimated $107.0 million.
♦ Recently, CDC released 2008 county-level age-adjusted prevalence estimates for obesity and physical inactivity. In Washington County, 26.7% of people aged 20 years and older were obese and 20.5% of people aged 20 years and older were physically inactive.
PERCENT OF WISCONSIN ADULTS WITH RISK FACTORS BY DIABETES STATUS
The 2011 Burden of Diabetes in Wisconsin is created by the Wisconsin Diabetes Prevention and Control Program (DPCP), Division of Public Health, Department of Health Services. Please see “Detailed Technical Notes” for in-depth information about methodology and data sources. For more information about the Wisconsin Diabetes Prevention and Control Program, go to: http://www.dhs.wisconsin.gov/health/diabetes/. Printing of this document is supported by DPCP partners American Diabetes Association Wisconsin Area, National Kidney Foundation of Wisconsin, and Wisconsin Lions Foundation.
Diabetes Prevalence - Washington County Age Category
Estimated Number Diagnosed (%)
Estimated Number Undiagnosed (%)
Estimated Total Number (%)
♦ Ages 18 – 44 1,070 (2.5%) 400 (0.9%) 1,470 (3.4%)
♦ Ages 45 – 64 2,120 (5.5%) 790 (2.0%) 2,910 (7.5%)
♦ Ages 65 + 2,880 (16.6%) 1,070 (6.2%) 3,950 (22.8%)
♦ All Ages Adult * 6,070 (5.7%) 2,260 (2.1%) 8,330 (7.9%)
* Percent is age-adjusted (direct method) to the United States 2000 standard population. Total percent may not equal the sum of diagnosed percent and undiagnosed percent, due to rounding.
* Overweight is defined as BMI ≥ 25.0 to < 30.0 kg/m2 * Obesity is defined as BMI ≥ 30.0 kg/m2
13%
36%
66%
71%
87%
53%
19%
21%
32%
24%
63%
26%
0% 10% 20% 30% 40% 50% 60% 70% 80% 90% 100%
6
5
4
3
2
1
No DiabetesDiabetes
Obese*
Overweight/Obese*
High Blood Pressure
High Cholesterol
Lack of Phys. Activ.
Current Smoker
Source: Wisconsin Behavioral Risk Factor Survey, 2009-2010

The 2011 Burden of Diabetes in
Waukesha County
2010 Hospitalizations - Waukesha County
Total Number Number Diabetes-related
(% of total)
Total Charges Diabetes-related Charges
(% of total charges)
All Ages 41,095 5,475 (13.3%) $1,152,931,500 $167,667,200 (14.5%)
OTHER INFORMATION ♦ People with pre-diabetes have an increased risk of developing type 2 diabetes, heart disease, and stroke. In
Waukesha County, an estimated 99,230 people aged 20 years and older have pre-diabetes. ♦ The cost of diabetes in Waukesha County adults is staggering. In 2009 for Waukesha County, direct costs
were estimated at $228.2 million, indirect costs were estimated at $114.2 million, totaling an estimated $342.4 million.
♦ Recently, CDC released 2008 county-level age-adjusted prevalence estimates for obesity and physical inactivity. In Waukesha County, 26.6% of people aged 20 years and older were obese and 18.7% of people aged 20 years and older were physically inactive.
PERCENT OF WISCONSIN ADULTS WITH RISK FACTORS BY DIABETES STATUS
The 2011 Burden of Diabetes in Wisconsin is created by the Wisconsin Diabetes Prevention and Control Program (DPCP), Division of Public Health, Department of Health Services. Please see “Detailed Technical Notes” for in-depth information about methodology and data sources. For more information about the Wisconsin Diabetes Prevention and Control Program, go to: http://www.dhs.wisconsin.gov/health/diabetes/. Printing of this document is supported by DPCP partners American Diabetes Association Wisconsin Area, National Kidney Foundation of Wisconsin, and Wisconsin Lions Foundation.
Diabetes Prevalence - Waukesha County Age Category
Estimated Number Diagnosed (%)
Estimated Number Undiagnosed (%)
Estimated Total Number (%)
♦ Ages 18 – 44 3,000 (2.5%) 1,120 (0.9%) 4,120 (3.5%)
♦ Ages 45 – 64 11,510 (9.7%) 4,290 (3.6%) 15,800 (13.3%)
♦ Ages 65 + 4,920 (8.9%) 1,830 (3.3%) 6,750 (12.3%)
♦ All Ages Adult * 19,430 (5.7%) 7,240 (2.1%) 26,670 (7.9%)
* Percent is age-adjusted (direct method) to the United States 2000 standard population. Total percent may not equal the sum of diagnosed percent and undiagnosed percent, due to rounding.
* Overweight is defined as BMI ≥ 25.0 to < 30.0 kg/m2 * Obesity is defined as BMI ≥ 30.0 kg/m2
13%
36%
66%
71%
87%
53%
19%
21%
32%
24%
63%
26%
0% 10% 20% 30% 40% 50% 60% 70% 80% 90% 100%
6
5
4
3
2
1
No DiabetesDiabetes
Obese*
Overweight/Obese*
High Blood Pressure
High Cholesterol
Lack of Phys. Activ.
Current Smoker
Source: Wisconsin Behavioral Risk Factor Survey, 2009-2010

The 2011 Burden of Diabetes in
Waupaca County
2010 Hospitalizations - Waupaca County
Total Number Number Diabetes-related
(% of total)
Total Charges Diabetes-related Charges
(% of total charges)
All Ages 6,299 1,293 (20.5%) $110,996,800 $25,220,800 (22.7%)
OTHER INFORMATION ♦ People with pre-diabetes have an increased risk of developing type 2 diabetes, heart disease, and stroke. In
Waupaca County, an estimated 13,580 people aged 20 years and older have pre-diabetes. ♦ The cost of diabetes in Waupaca County adults is staggering. In 2009 for Waupaca County, direct costs were
estimated at $44.2 million, indirect costs were estimated at $22.1 million, totaling an estimated $66.3 million. ♦ Recently, CDC released 2008 county-level age-adjusted prevalence estimates for obesity and physical
inactivity. In Waupaca County, 28.3% of people aged 20 years and older were obese and 21.3% of people aged 20 years and older were physically inactive.
PERCENT OF WISCONSIN ADULTS WITH RISK FACTORS BY DIABETES STATUS
The 2011 Burden of Diabetes in Wisconsin is created by the Wisconsin Diabetes Prevention and Control Program (DPCP), Division of Public Health, Department of Health Services. Please see “Detailed Technical Notes” for in-depth information about methodology and data sources. For more information about the Wisconsin Diabetes Prevention and Control Program, go to: http://www.dhs.wisconsin.gov/health/diabetes/. Printing of this document is supported by DPCP partners American Diabetes Association Wisconsin Area, National Kidney Foundation of Wisconsin, and Wisconsin Lions Foundation.
Diabetes Prevalence - Waupaca County Age Category
Estimated Number Diagnosed (%)
Estimated Number Undiagnosed (%)
Estimated Total Number (%)
♦ Ages 18 – 44 290 (1.9%) 110 (0.7%) 400 (2.6%)
♦ Ages 45 – 64 1,720 (11.0%) 640 (4.1%) 2,360 (15.1%)
♦ Ages 65 + 1,750 (19.8%) 650 (7.4%) 2,400 (27.2%)
♦ All Ages Adult * 3,760 (7.6%) 1,400 (2.8%) 5,160 (10.4%)
* Percent is age-adjusted (direct method) to the United States 2000 standard population. Total percent may not equal the sum of diagnosed percent and undiagnosed percent, due to rounding.
* Overweight is defined as BMI ≥ 25.0 to < 30.0 kg/m2 * Obesity is defined as BMI ≥ 30.0 kg/m2
13%
36%
66%
71%
87%
53%
19%
21%
32%
24%
63%
26%
0% 10% 20% 30% 40% 50% 60% 70% 80% 90% 100%
6
5
4
3
2
1
No DiabetesDiabetes
Obese*
Overweight/Obese*
High Blood Pressure
High Cholesterol
Lack of Phys. Activ.
Current Smoker
Source: Wisconsin Behavioral Risk Factor Survey, 2009-2010

The 2011 Burden of Diabetes in
Waushara County
2010 Hospitalizations - Washara County
Total Number Number Diabetes-related
(% of total)
Total Charges Diabetes-related Charges
(% of total charges)
All Ages 2,503 514 (20.5%) $51,431,800 $11,529,600 (22.4%)
OTHER INFORMATION ♦ People with pre-diabetes have an increased risk of developing type 2 diabetes, heart disease, and stroke. In
Waushara County, an estimated 6,650 people aged 20 years and older have pre-diabetes. ♦ The cost of diabetes in Waushara County adults is staggering. In 2009 for Waushara County, direct costs were
estimated at $22.5 million, indirect costs were estimated at $11.3 million, totaling an estimated $33.8 million. ♦ Recently, CDC released 2008 county-level age-adjusted prevalence estimates for obesity and physical
inactivity. In Waushara County, 28.8% of people aged 20 years and older were obese and 21.6% of people aged 20 years and older were physically inactive.
PERCENT OF WISCONSIN ADULTS WITH RISK FACTORS BY DIABETES STATUS
The 2011 Burden of Diabetes in Wisconsin is created by the Wisconsin Diabetes Prevention and Control Program (DPCP), Division of Public Health, Department of Health Services. Please see “Detailed Technical Notes” for in-depth information about methodology and data sources. For more information about the Wisconsin Diabetes Prevention and Control Program, go to: http://www.dhs.wisconsin.gov/health/diabetes/. Printing of this document is supported by DPCP partners American Diabetes Association Wisconsin Area, National Kidney Foundation of Wisconsin, and Wisconsin Lions Foundation.
Diabetes Prevalence - Washara County Age Category
Estimated Number Diagnosed (%)
Estimated Number Undiagnosed (%)
Estimated Total Number (%)
♦ Ages 18 – 44 140 (1.9%) 50 (0.7%) 190 (2.6%)
♦ Ages 45 – 64 860 (11.3%) 320 (4.2%) 1,180 (15.5%)
♦ Ages 65 + 920 (19.9%) 340 (7.4%) 1,260 (27.2%)
♦ All Ages Adult * 1,920 (7.7%) 710 (2.8%) 2,630 (10.5%)
* Percent is age-adjusted (direct method) to the United States 2000 standard population. Total percent may not equal the sum of diagnosed percent and undiagnosed percent, due to rounding.
* Overweight is defined as BMI ≥ 25.0 to < 30.0 kg/m2 * Obesity is defined as BMI ≥ 30.0 kg/m2
13%
36%
66%
71%
87%
53%
19%
21%
32%
24%
63%
26%
0% 10% 20% 30% 40% 50% 60% 70% 80% 90% 100%
6
5
4
3
2
1
No DiabetesDiabetes
Obese*
Overweight/Obese*
High Blood Pressure
High Cholesterol
Lack of Phys. Activ.
Current Smoker
Source: Wisconsin Behavioral Risk Factor Survey, 2009-2010

The 2011 Burden of Diabetes in
Winnebago County
2010 Hospitalizations - Winnebago County
Total Number Number Diabetes-related
(% of total)
Total Charges Diabetes-related Charges
(% of total charges)
All Ages 16,114 2,416 (15.0%) $304,686,200 $56,159,600 (18.4%)
OTHER INFORMATION ♦ People with pre-diabetes have an increased risk of developing type 2 diabetes, heart disease, and stroke. In
Winnebago County, an estimated 43,240 people aged 20 years and older have pre-diabetes. ♦ The cost of diabetes in Winnebago County adults is staggering. In 2009 for Winnebago County, direct costs
were estimated at $108.5 million, indirect costs were estimated at $54.3 million, totaling an estimated $162.8 million.
♦ Recently, CDC released 2008 county-level age-adjusted prevalence estimates for obesity and physical inactivity. In Winnebago County, 27.4% of people aged 20 years and older were obese and 19.5% of people aged 20 years and older were physically inactive.
PERCENT OF WISCONSIN ADULTS WITH RISK FACTORS BY DIABETES STATUS
The 2011 Burden of Diabetes in Wisconsin is created by the Wisconsin Diabetes Prevention and Control Program (DPCP), Division of Public Health, Department of Health Services. Please see “Detailed Technical Notes” for in-depth information about methodology and data sources. For more information about the Wisconsin Diabetes Prevention and Control Program, go to: http://www.dhs.wisconsin.gov/health/diabetes/. Printing of this document is supported by DPCP partners American Diabetes Association Wisconsin Area, National Kidney Foundation of Wisconsin, and Wisconsin Lions Foundation.
Diabetes Prevalence - Winnebago County Age Category
Estimated Number Diagnosed (%)
Estimated Number Undiagnosed (%)
Estimated Total Number (%)
♦ Ages 18 – 44 1,320 (2.0%) 490 (0.8%) 1,810 (2.8%)
♦ Ages 45 – 64 3,980 (9.3%) 1,480 (3.4%) 5,460 (12.7%)
♦ Ages 65 + 3,940 (18.8%) 1,470 (7.0%) 5,410 (25.8%)
♦ All Ages Adult * 9,240 (7.0%) 3,440 (2.6%) 12,680 (9.6%)
* Percent is age-adjusted (direct method) to the United States 2000 standard population. Total percent may not equal the sum of diagnosed percent and undiagnosed percent, due to rounding.
* Overweight is defined as BMI ≥ 25.0 to < 30.0 kg/m2 * Obesity is defined as BMI ≥ 30.0 kg/m2
13%
36%
66%
71%
87%
53%
19%
21%
32%
24%
63%
26%
0% 10% 20% 30% 40% 50% 60% 70% 80% 90% 100%
6
5
4
3
2
1
No DiabetesDiabetes
Obese*
Overweight/Obese*
High Blood Pressure
High Cholesterol
Lack of Phys. Activ.
Current Smoker
Source: Wisconsin Behavioral Risk Factor Survey, 2009-2010

The 2011 Burden of Diabetes in
Wood County
2010 Hospitalizations - Wood County
Total Number Number Diabetes-related
(% of total)
Total Charges Diabetes-related Charges
(% of total charges)
All Ages 10,770 1,626 (15.1%) $221,857,500 $40,961,100 (18.5%)
OTHER INFORMATION ♦ People with pre-diabetes have an increased risk of developing type 2 diabetes, heart disease, and stroke. In
Wood County, an estimated 19,450 people aged 20 years and older have pre-diabetes. ♦ The cost of diabetes in Wood County adults is staggering. In 2009 for Wood County, direct costs were
estimated at $60.4 million, indirect costs were estimated at $30.2 million, totaling an estimated $90.6 million. ♦ Recently, CDC released 2008 county-level age-adjusted prevalence estimates for obesity and physical
inactivity. In Wood County, 27.2% of people aged 20 years and older were obese and 19.6% of people aged 20 years and older were physically inactive.
PERCENT OF WISCONSIN ADULTS WITH RISK FACTORS BY DIABETES STATUS
The 2011 Burden of Diabetes in Wisconsin is created by the Wisconsin Diabetes Prevention and Control Program (DPCP), Division of Public Health, Department of Health Services. Please see “Detailed Technical Notes” for in-depth information about methodology and data sources. For more information about the Wisconsin Diabetes Prevention and Control Program, go to: http://www.dhs.wisconsin.gov/health/diabetes/. Printing of this document is supported by DPCP partners American Diabetes Association Wisconsin Area, National Kidney Foundation of Wisconsin, and Wisconsin Lions Foundation.
Diabetes Prevalence - Wood County Age Category
Estimated Number Diagnosed (%)
Estimated Number Undiagnosed (%)
Estimated Total Number (%)
♦ Ages 18 – 44 290 (1.3%) 110 (0.5%) 400 (1.8%)
♦ Ages 45 – 64 2,280 (10.5%) 850 (3.9%) 3,130 (14.4%)
♦ Ages 65 + 2,570 (19.6%) 960 (7.3%) 3,530 (26.9%)
♦ All Ages Adult * 5,140 (7.1%) 1,920 (2.6%) 7,060 (9.7%)
* Percent is age-adjusted (direct method) to the United States 2000 standard population. Total percent may not equal the sum of diagnosed percent and undiagnosed percent, due to rounding.
* Overweight is defined as BMI ≥ 25.0 to < 30.0 kg/m2 * Obesity is defined as BMI ≥ 30.0 kg/m2
13%
36%
66%
71%
87%
53%
19%
21%
32%
24%
63%
26%
0% 10% 20% 30% 40% 50% 60% 70% 80% 90% 100%
6
5
4
3
2
1
No DiabetesDiabetes
Obese*
Overweight/Obese*
High Blood Pressure
High Cholesterol
Lack of Phys. Activ.
Current Smoker
Source: Wisconsin Behavioral Risk Factor Survey, 2009-2010

The 2011 Burden of Diabetes in
African Americans
2010 Hospitalizations - African Americans
Total Number
Number Diabetes-related (% of total)
Total Charges
Diabetes-related Charges (% of total charges)
All Ages 52,720 9,110 (17.3%) $1,369,038,000 $256,449,000 (18.7%)
OTHER INFORMATION ♦ People with pre-diabetes have an increased risk of developing type 2 diabetes, heart disease, and stroke. An
estimated 73,400 African Americans aged 20 years and older have pre-diabetes. ♦ The cost of diabetes in African Americans adults is staggering. In 2009 for African Americans, direct costs
were estimated at $355.4 million, indirect costs were estimated at $177.9 million, totaling an estimated $533.3 million.
♦ CDC 2008 county-level age-adjusted prevalence estimates for obesity and physical inactivity are included on each county’s burden page.
PERCENT OF WISCONSIN ADULTS WITH RISK FACTORS BY DIABETES STATUS
The 2011 Burden of Diabetes in Wisconsin is created by the Wisconsin Diabetes Prevention and Control Program (DPCP), Division of Public Health, Department of Health Services. Please see “Detailed Technical Notes” for in-depth information about methodology and data sources. For more information about the Wisconsin Diabetes Prevention and Control Program, go to: http://www.dhs.wisconsin.gov/health/diabetes/. Printing of this document is supported by DPCP partners American Diabetes Association Wisconsin Area, National Kidney Foundation of Wisconsin, and Wisconsin Lions Foundation.
Diabetes Prevalence - African Americans Age Category
Estimated Number Diagnosed (%)
Estimated Number Undiagnosed (%)
Estimated Total Number (%)
♦ Ages 18 – 44 8,490 (6.1%) 3,180 (2.3%) 11,670 (8.4%)
♦ Ages 45 – 64 14,940 (23.0%) 5,560 (8.6%) 20,500 (31.6%)
♦ Ages 65 + 6,830 (34.4%) 2,540 (12.8%) 9,370 (47.3%)
♦ All Ages Adult * 30,260 (15.9%) 11,280 (5.9%) 41,540 (21.8%)
* Percent is age-adjusted (direct method) to the United States 2000 standard population. Total percent may not equal the sum of diagnosed percent and undiagnosed percent, due to rounding.
* Overweight is defined as BMI ≥ 25.0 to < 30.0 kg/m2 * Obesity is defined as BMI ≥ 30.0 kg/m2
13%
36%
66%
71%
87%
53%
19%
21%
32%
24%
63%
26%
0% 10% 20% 30% 40% 50% 60% 70% 80% 90% 100%
6
5
4
3
2
1
No DiabetesDiabetes
Obese*
Overweight/Obese*
High Blood Pressure
High Cholesterol
Lack of Phys. Activ.
Current Smoker
Source: Wisconsin Behavioral Risk Factor Survey, 2009-2010

The 2011 Burden of Diabetes in
American Indians
2010 Hospitalizations - American Indians
Total Number
Number Diabetes-related (% of total)
Total Charges
Diabetes-related Charges (% of total charges)
All Ages 5,439 1,349 (24.8%) $102,423,900 $30,947,900 (30.2%)
OTHER INFORMATION ♦ People with pre-diabetes have an increased risk of developing type 2 diabetes, heart disease, and stroke. An
estimated 11,520 American Indians aged 20 years and older have pre-diabetes. ♦ The cost of diabetes in American Indians adults is staggering. In 2009 for American Indians, direct costs were
estimated at $129.9 million, indirect costs were estimated at $65.0 million, totaling an estimated $194.9 million. ♦ CDC 2008 county-level age-adjusted prevalence estimates for obesity and physical inactivity are included on
each county’s burden page.
PERCENT OF WISCONSIN ADULTS WITH RISK FACTORS BY DIABETES STATUS
The 2011 Burden of Diabetes in Wisconsin is created by the Wisconsin Diabetes Prevention and Control Program (DPCP), Division of Public Health, Department of Health Services. Please see “Detailed Technical Notes” for in-depth information about methodology and data sources. For more information about the Wisconsin Diabetes Prevention and Control Program, go to: http://www.dhs.wisconsin.gov/health/diabetes/. Printing of this document is supported by DPCP partners American Diabetes Association Wisconsin Area, National Kidney Foundation of Wisconsin, and Wisconsin Lions Foundation.
Diabetes Prevalence - American Indians Age Category
Estimated Number Diagnosed (%)
Estimated Number Undiagnosed (%)
Estimated Total Number (%)
♦ Ages 18 – 44 4,310 (21.5%) 1,610 (8.0%) 5,920 (29.5%)
♦ Ages 45 – 64 5,870 (53.3%) 2,180 (19.8%) 8,050 (73.1%)
♦ Ages 65 + 880 (25.1%) 320 (9.1%) 1,200 (34.2%)
♦ All Ages Adult * 11,060 (31.5%) 4,110 (11.7%) 15,170 (43.2%)
* Percent is age-adjusted (direct method) to the United States 2000 standard population. Total percent may not equal the sum of diagnosed percent and undiagnosed percent, due to rounding.
* Overweight is defined as BMI ≥ 25.0 to < 30.0 kg/m2 * Obesity is defined as BMI ≥ 30.0 kg/m2
13%
36%
66%
71%
87%
53%
19%
21%
32%
24%
63%
26%
0% 10% 20% 30% 40% 50% 60% 70% 80% 90% 100%
6
5
4
3
2
1
No DiabetesDiabetes
Obese*
Overweight/Obese*
High Blood Pressure
High Cholesterol
Lack of Phys. Activ.
Current Smoker
Source: Wisconsin Behavioral Risk Factor Survey, 2009-2010

The 2011 Burden of Diabetes in
Asian Americans
2010 Hospitalizations - Asian Americans
Total Number
Number Diabetes-related (% of total)
Total Charges
Diabetes-related Charges (% of total charges)
All Ages 7,143 676 (9.5%) $128,917,700 $18,934,900 (14.7%)
OTHER INFORMATION ♦ People with pre-diabetes have an increased risk of developing type 2 diabetes, heart disease, and stroke. An
estimated 26,790 Asian Americans aged 20 years and older have pre-diabetes. ♦ The cost of diabetes in Asian Americans adults is staggering. In 2009 for Asian Americans, direct costs were
estimated at $77.9 million, indirect costs were estimated at $39.0 million, totaling an estimated $116.9 million. ♦ CDC 2008 county-level age-adjusted prevalence estimates for obesity and physical inactivity are included on
each county’s burden page.
PERCENT OF WISCONSIN ADULTS WITH RISK FACTORS BY DIABETES STATUS
The 2011 Burden of Diabetes in Wisconsin is created by the Wisconsin Diabetes Prevention and Control Program (DPCP), Division of Public Health, Department of Health Services. Please see “Detailed Technical Notes” for in-depth information about methodology and data sources. For more information about the Wisconsin Diabetes Prevention and Control Program, go to: http://www.dhs.wisconsin.gov/health/diabetes/. Printing of this document is supported by DPCP partners American Diabetes Association Wisconsin Area, National Kidney Foundation of Wisconsin, and Wisconsin Lions Foundation.
Diabetes Prevalence - Asian Americans Age Category
Estimated Number Diagnosed (%)
Estimated Number Undiagnosed (%)
Estimated Total Number (%)
♦ Ages 18 – 44 2,340 (4.1%) 880 (1.5%) 3,220 (5.6%)
♦ Ages 45 – 64 2,850 (15.6%) 1,060 (5.8%) 3,910 (21.4%)
♦ Ages 65 + 1,440 (25.1%) 530 (9.2%) 1,970 (34.3%)
♦ All Ages Adult * 6,630 (11.0%) 2,470 (4.1%) 9,100 (15.1%)
* Percent is age-adjusted (direct method) to the United States 2000 standard population. Total percent may not equal the sum of diagnosed percent and undiagnosed percent, due to rounding.
* Overweight is defined as BMI ≥ 25.0 to < 30.0 kg/m2 * Obesity is defined as BMI ≥ 30.0 kg/m2
13%
36%
66%
71%
87%
53%
19%
21%
32%
24%
63%
26%
0% 10% 20% 30% 40% 50% 60% 70% 80% 90% 100%
6
5
4
3
2
1
No DiabetesDiabetes
Obese*
Overweight/Obese*
High Blood Pressure
High Cholesterol
Lack of Phys. Activ.
Current Smoker
Source: Wisconsin Behavioral Risk Factor Survey, 2009-2010

The 2011 Burden of Diabetes in
Hispanic/Latino Americans
2010 Hospitalizations - Hispanic/Latino Americans
Total Number
Number Diabetes-related (% of total)
Total Charges
Diabetes-related Charges (% of total charges)
All Ages 24,104 3,019 (12.5%) $500,102,700 $87,767,000 (17.5%)
OTHER INFORMATION ♦ People with pre-diabetes have an increased risk of developing type 2 diabetes, heart disease, and stroke. An
estimated 59,730 Hispanic/Latino Americans aged 20 years and older have pre-diabetes. ♦ The cost of diabetes in Hispanic/Latino Americans adults is staggering. In 2009 for Hispanic/Latino Americans,
direct costs were estimated at $172.6 million, indirect costs were estimated at $86.4 million, totaling an estimated $259.0 million.
♦ CDC 2008 county-level age-adjusted prevalence estimates for obesity and physical inactivity are included on each county’s burden page.
PERCENT OF WISCONSIN ADULTS WITH RISK FACTORS BY DIABETES STATUS
The 2011 Burden of Diabetes in Wisconsin is created by the Wisconsin Diabetes Prevention and Control Program (DPCP), Division of Public Health, Department of Health Services. Please see “Detailed Technical Notes” for in-depth information about methodology and data sources. For more information about the Wisconsin Diabetes Prevention and Control Program, go to: http://www.dhs.wisconsin.gov/health/diabetes/. Printing of this document is supported by DPCP partners American Diabetes Association Wisconsin Area, National Kidney Foundation of Wisconsin, and Wisconsin Lions Foundation.
Diabetes Prevalence - Hispanic/Latino Americans Age Category
Estimated Number Diagnosed (%)
Estimated Number Undiagnosed (%)
Estimated Total Number (%)
♦ Ages 18 – 44 4,780 (3.7%) 1,790 (1.4%) 6,570 (5.0%)
♦ Ages 45 – 64 7,310 (18.2%) 2,720 (6.8%) 10,030 (25.0%)
♦ Ages 65 + 2,610 (24.0%) 970 (8.9%) 3,580 (32.9%)
♦ All Ages Adult * 14,700 (11.4%) 5,480 (4.2%) 20,180 (15.6%)
* Percent is age-adjusted (direct method) to the United States 2000 standard population. Total percent may not equal the sum of diagnosed percent and undiagnosed percent, due to rounding.
* Overweight is defined as BMI ≥ 25.0 to < 30.0 kg/m2 * Obesity is defined as BMI ≥ 30.0 kg/m2
13%
36%
66%
71%
87%
53%
19%
21%
32%
24%
63%
26%
0% 10% 20% 30% 40% 50% 60% 70% 80% 90% 100%
6
5
4
3
2
1
No DiabetesDiabetes
Obese*
Overweight/Obese*
High Blood Pressure
High Cholesterol
Lack of Phys. Activ.
Current Smoker
Source: Wisconsin Behavioral Risk Factor Survey, 2009-2010
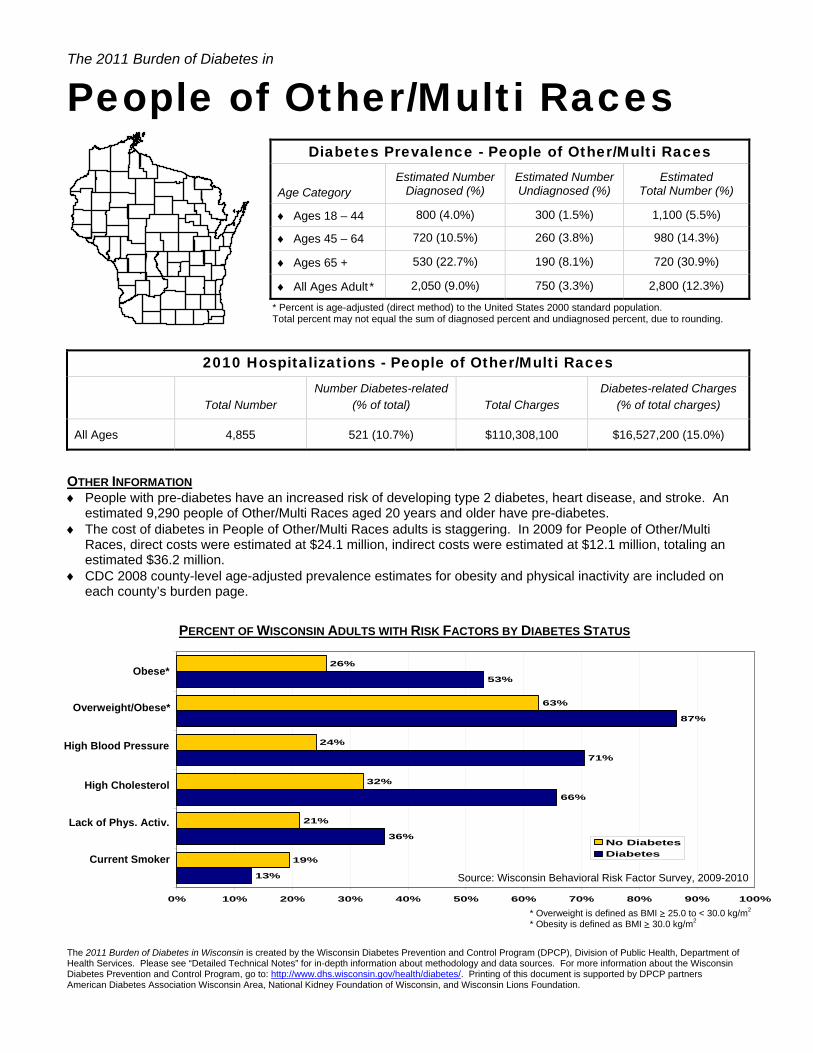
The 2011 Burden of Diabetes in
People of Other/Multi Races
2010 Hospitalizations - People of Other/Multi Races
Total Number
Number Diabetes-related (% of total)
Total Charges
Diabetes-related Charges (% of total charges)
All Ages 4,855 521 (10.7%) $110,308,100 $16,527,200 (15.0%)
OTHER INFORMATION ♦ People with pre-diabetes have an increased risk of developing type 2 diabetes, heart disease, and stroke. An
estimated 9,290 people of Other/Multi Races aged 20 years and older have pre-diabetes. ♦ The cost of diabetes in People of Other/Multi Races adults is staggering. In 2009 for People of Other/Multi
Races, direct costs were estimated at $24.1 million, indirect costs were estimated at $12.1 million, totaling an estimated $36.2 million.
♦ CDC 2008 county-level age-adjusted prevalence estimates for obesity and physical inactivity are included on each county’s burden page.
PERCENT OF WISCONSIN ADULTS WITH RISK FACTORS BY DIABETES STATUS
The 2011 Burden of Diabetes in Wisconsin is created by the Wisconsin Diabetes Prevention and Control Program (DPCP), Division of Public Health, Department of Health Services. Please see “Detailed Technical Notes” for in-depth information about methodology and data sources. For more information about the Wisconsin Diabetes Prevention and Control Program, go to: http://www.dhs.wisconsin.gov/health/diabetes/. Printing of this document is supported by DPCP partners American Diabetes Association Wisconsin Area, National Kidney Foundation of Wisconsin, and Wisconsin Lions Foundation.
Diabetes Prevalence - People of Other/Multi Races Age Category
Estimated Number Diagnosed (%)
Estimated Number Undiagnosed (%)
Estimated Total Number (%)
♦ Ages 18 – 44 800 (4.0%) 300 (1.5%) 1,100 (5.5%)
♦ Ages 45 – 64 720 (10.5%) 260 (3.8%) 980 (14.3%)
♦ Ages 65 + 530 (22.7%) 190 (8.1%) 720 (30.9%)
♦ All Ages Adult * 2,050 (9.0%) 750 (3.3%) 2,800 (12.3%)
* Percent is age-adjusted (direct method) to the United States 2000 standard population. Total percent may not equal the sum of diagnosed percent and undiagnosed percent, due to rounding.
* Overweight is defined as BMI ≥ 25.0 to < 30.0 kg/m2 * Obesity is defined as BMI ≥ 30.0 kg/m2
13%
36%
66%
71%
87%
53%
19%
21%
32%
24%
63%
26%
0% 10% 20% 30% 40% 50% 60% 70% 80% 90% 100%
6
5
4
3
2
1
No DiabetesDiabetes
Obese*
Overweight/Obese*
High Blood Pressure
High Cholesterol
Lack of Phys. Activ.
Current Smoker
Source: Wisconsin Behavioral Risk Factor Survey, 2009-2010

The 2011 Burden of Diabetes in
Whites
2010 Hospitalizations - Whites
Total Number
Number Diabetes-related (% of total)
Total Charges
Diabetes-related Charges (% of total charges)
All Ages 479,449 75,055 (15.7%) $11,907,708,100 $2,054,960,500 (17.3%)
OTHER INFORMATION ♦ People with pre-diabetes have an increased risk of developing type 2 diabetes, heart disease, and stroke. An
estimated 1,279,470 whites aged 20 years and older have pre-diabetes. ♦ The cost of diabetes in whites adults is staggering. In 2009 for whites, direct costs were estimated at $3.31
billion, indirect costs were estimated at $1.65 billion, totaling an estimated $4.96 billion. ♦ CDC 2008 county-level age-adjusted prevalence estimates for obesity and physical inactivity are included on
each county’s burden page.
PERCENT OF WISCONSIN ADULTS WITH RISK FACTORS BY DIABETES STATUS
The 2011 Burden of Diabetes in Wisconsin is created by the Wisconsin Diabetes Prevention and Control Program (DPCP), Division of Public Health, Department of Health Services. Please see “Detailed Technical Notes” for in-depth information about methodology and data sources. For more information about the Wisconsin Diabetes Prevention and Control Program, go to: http://www.dhs.wisconsin.gov/health/diabetes/. Printing of this document is supported by DPCP partners American Diabetes Association Wisconsin Area, National Kidney Foundation of Wisconsin, and Wisconsin Lions Foundation.
Diabetes Prevalence - Whites Age Category
Estimated Number Diagnosed (%)
Estimated Number Undiagnosed (%)
Estimated Total Number (%)
♦ Ages 18 – 44 27,150 (1.6%) 10,120 (0.6%) 37,270 (2.2%)
♦ Ages 45 – 64 124,540 (8.9%) 46,370 (3.3%) 170,910 (12.2%)
♦ Ages 65 + 129,800 (18.1%) 48,320 (6.7%) 178,120 (24.8%)
♦ All Ages Adult * 281,490 (6.5%) 104,810 (2.4%) 386,300 (9.0%)
* Percent is age-adjusted (direct method) to the United States 2000 standard population. Total percent may not equal the sum of diagnosed percent and undiagnosed percent, due to rounding.
* Overweight is defined as BMI ≥ 25.0 to < 30.0 kg/m2 * Obesity is defined as BMI ≥ 30.0 kg/m2
13%
36%
66%
71%
87%
53%
19%
21%
32%
24%
63%
26%
0% 10% 20% 30% 40% 50% 60% 70% 80% 90% 100%
6
5
4
3
2
1
No DiabetesDiabetes
Obese*
Overweight/Obese*
High Blood Pressure
High Cholesterol
Lack of Phys. Activ.
Current Smoker
Source: Wisconsin Behavioral Risk Factor Survey, 2009-2010

The 2011 Burden of Diabetes in Wisconsin’s
Children and Adolescents
Diabetes Prevalence - Children and Adolescents
Age Category 2009 Population
Estimate Estimated
Number Diagnosed (%)
♦ Ages 0 – 9 720,886 1,100 (0.15%)
♦ Ages 10 – 17 589,364 3,400 (0.58%)
♦ All Ages Children and Adolescents 1,310,250 4,500 (0.34%)
2010 Hospitalizations - Children and Adolescents
Total Number Number Diabetes-related
(% of total)
Total Charges Diabetes-related Charges
(% of total charges)
Ages 0 – 17 100,291 504 (0.50%) $ 1,280,339,200 $ 7,346,300 (0.57%)
PERCENT OF WISCONSIN ADOLESCENTS (GRADES 9-12) WITH SELECTED RISK FACTORS
23%
52%
17%23%
81%
0%
20%
40%
60%
80%
100%
Overweight/obese Does not meetphysical activity
recommendations
Smoked cigaretteson one/more of
past 30 days
Drank one/moreservings non-diet
soda per day
Does not eat 5+fruits/vegetables
per day
Perc
ent
OTHER INFORMATION ♦ The majority of children and adolescents with diabetes have type 1, but clinically-based reports and regional
studies suggest that type 2 diabetes, although still rare, is being diagnosed more frequently in children and adolescents, particularly in African Americans, American Indians, and Hispanic/Latino Americans. Healthy lifestyle choices may help reduce the risk of children and adolescents developing type 2 diabetes.
♦ For more information about the care of children and adolescents with diabetes, please refer to the document Students with Diabetes: A Resource Guide for Wisconsin Schools and Families, which can be found at: http://www.dhs.wisconsin.gov/health/diabetes/srg.HTM.
♦ The cost of diabetes in children and adolescents is staggering. In 2008-2009 for children and adolescents, direct costs were estimated at $52.8 million in Wisconsin.
The 2011 Burden of Diabetes in Wisconsin is created by the Wisconsin Diabetes Prevention and Control Program (DPCP), Division of Public Health, Department of Health Services. Please see “Detailed Technical Notes” for in-depth information about methodology and data sources. For more information about the Wisconsin Diabetes Prevention and Control Program, go to: http://www.dhs.wisconsin.gov/health/diabetes/. Printing of this document is supported by DPCP partners American Diabetes Association Wisconsin Area, National Kidney Foundation of Wisconsin, and Wisconsin Lions Foundation.
Source: 2009 Youth Risk Behavior Survey
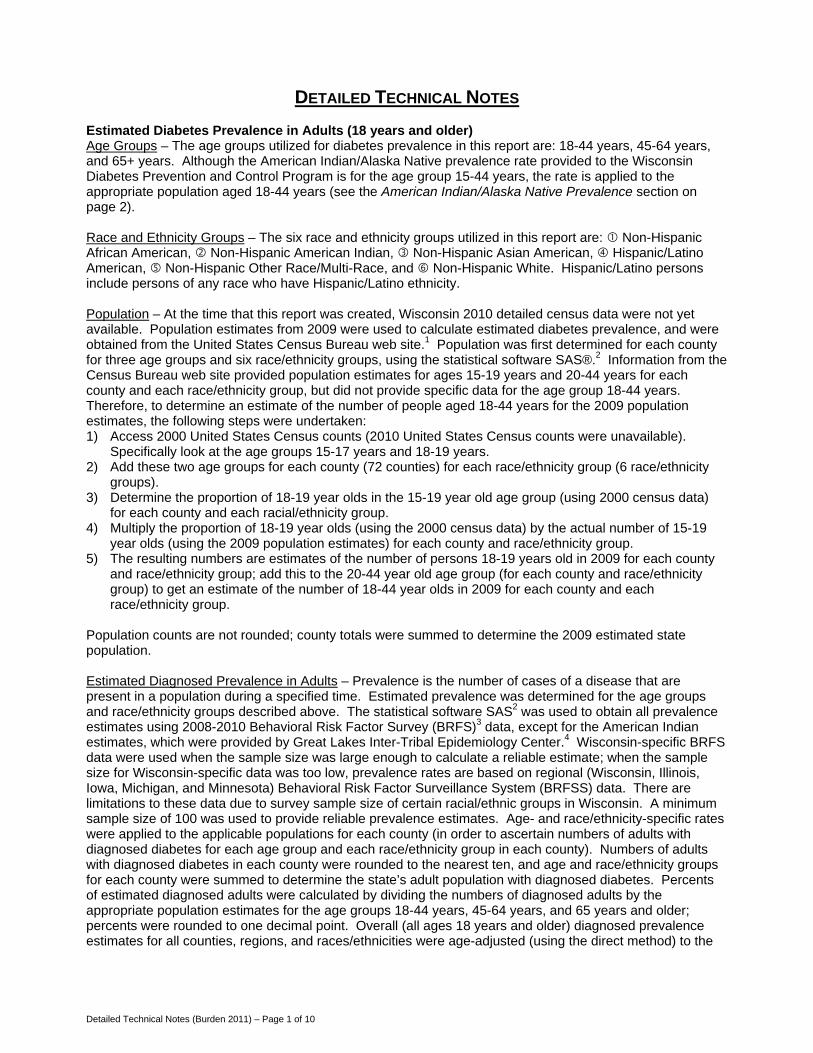
Detailed Technical Notes (Burden 2011) – Page 1 of 10
DETAILED TECHNICAL NOTES Estimated Diabetes Prevalence in Adults (18 years and older) Age Groups – The age groups utilized for diabetes prevalence in this report are: 18-44 years, 45-64 years, and 65+ years. Although the American Indian/Alaska Native prevalence rate provided to the Wisconsin Diabetes Prevention and Control Program is for the age group 15-44 years, the rate is applied to the appropriate population aged 18-44 years (see the American Indian/Alaska Native Prevalence section on page 2). Race and Ethnicity Groups – The six race and ethnicity groups utilized in this report are: Non-Hispanic African American, Non-Hispanic American Indian, Non-Hispanic Asian American, Hispanic/Latino American, Non-Hispanic Other Race/Multi-Race, and Non-Hispanic White. Hispanic/Latino persons include persons of any race who have Hispanic/Latino ethnicity. Population – At the time that this report was created, Wisconsin 2010 detailed census data were not yet available. Population estimates from 2009 were used to calculate estimated diabetes prevalence, and were obtained from the United States Census Bureau web site.1 Population was first determined for each county for three age groups and six race/ethnicity groups, using the statistical software SAS®.2 Information from the Census Bureau web site provided population estimates for ages 15-19 years and 20-44 years for each county and each race/ethnicity group, but did not provide specific data for the age group 18-44 years. Therefore, to determine an estimate of the number of people aged 18-44 years for the 2009 population estimates, the following steps were undertaken: 1) Access 2000 United States Census counts (2010 United States Census counts were unavailable).
Specifically look at the age groups 15-17 years and 18-19 years. 2) Add these two age groups for each county (72 counties) for each race/ethnicity group (6 race/ethnicity
groups). 3) Determine the proportion of 18-19 year olds in the 15-19 year old age group (using 2000 census data)
for each county and each racial/ethnicity group. 4) Multiply the proportion of 18-19 year olds (using the 2000 census data) by the actual number of 15-19
year olds (using the 2009 population estimates) for each county and race/ethnicity group. 5) The resulting numbers are estimates of the number of persons 18-19 years old in 2009 for each county
and race/ethnicity group; add this to the 20-44 year old age group (for each county and race/ethnicity group) to get an estimate of the number of 18-44 year olds in 2009 for each county and each race/ethnicity group.
Population counts are not rounded; county totals were summed to determine the 2009 estimated state population. Estimated Diagnosed Prevalence in Adults – Prevalence is the number of cases of a disease that are present in a population during a specified time. Estimated prevalence was determined for the age groups and race/ethnicity groups described above. The statistical software SAS2 was used to obtain all prevalence estimates using 2008-2010 Behavioral Risk Factor Survey (BRFS)3 data, except for the American Indian estimates, which were provided by Great Lakes Inter-Tribal Epidemiology Center.4 Wisconsin-specific BRFS data were used when the sample size was large enough to calculate a reliable estimate; when the sample size for Wisconsin-specific data was too low, prevalence rates are based on regional (Wisconsin, Illinois, Iowa, Michigan, and Minnesota) Behavioral Risk Factor Surveillance System (BRFSS) data. There are limitations to these data due to survey sample size of certain racial/ethnic groups in Wisconsin. A minimum sample size of 100 was used to provide reliable prevalence estimates. Age- and race/ethnicity-specific rates were applied to the applicable populations for each county (in order to ascertain numbers of adults with diagnosed diabetes for each age group and each race/ethnicity group in each county). Numbers of adults with diagnosed diabetes in each county were rounded to the nearest ten, and age and race/ethnicity groups for each county were summed to determine the state’s adult population with diagnosed diabetes. Percents of estimated diagnosed adults were calculated by dividing the numbers of diagnosed adults by the appropriate population estimates for the age groups 18-44 years, 45-64 years, and 65 years and older; percents were rounded to one decimal point. Overall (all ages 18 years and older) diagnosed prevalence estimates for all counties, regions, and races/ethnicities were age-adjusted (using the direct method) to the
Detailed Technical Notes (Burden 2011) – Page 2 of 10
2000 United States standard population and presented as percents rounded to one decimal point. Age-adjustment is explained in further detail on page 4 of the Detailed Technical Notes. Included below is further information on the specific data sources utilized for each of the age groups within each of the racial/ethnic groups. It should be noted that different sources were used to obtain prevalence data, based on sample size constraints for certain age and race/ethnicity groups. However, an attempt was made to select similar data sources to provide consistency in data analysis. ♦ Non-Hispanic African American Prevalence
Prevalence rates for Non-Hispanic African American adults are from the Wisconsin Behavioral Risk Factor Survey (BRFS), 2008-2010.3 Milwaukee County Non-Hispanic African American rates for 2008-2010 were applied to the appropriate populations in Milwaukee County (for all three age groups). Specific Southeastern Region Non-Hispanic African American rates for 2008-2010 were applied to the appropriate populations in counties found in the Southeastern Region, except for Milwaukee County (Jefferson, Kenosha, Ozaukee, Racine, Walworth, Washington, and Waukesha Counties) for all three age groups. Non-Hispanic African American 2008-2010 Wisconsin BRFS rates were applied to the appropriate populations for all other counties. State rates were used for all counties not in the Southeastern Region because sample sizes for the other four regions were not large enough to provide a reliable prevalence estimate for their appropriate counties. Application of these rates allowed determination of an estimated number of Non-Hispanic African American adults diagnosed with diabetes in each of the three age groups for each county.
♦ Non-Hispanic American Indian/Alaska Native Prevalence Prevalence rates for Non-Hispanic American Indian/Alaska Native adults are 2009 rates from the publication titled “Community Health Data Profile: Minnesota, Wisconsin, and Michigan Tribal Communities, 2010.”4 This publication was produced by Great Lakes Inter-Tribal Epidemiology Center, Great Lakes Inter-Tribal Council, Inc. in 2011. Data from the diabetes audit is a sample of the overall diabetes user population in Wisconsin and unfortunately there is no information for undiagnosed individuals or for American Indian/Alaska Native individuals who do not visit an Indian Health Service (HIS) facility, and there are incomplete and missing reports. The sample size for the 2009 diabetes audit was 1,135. Prevalence rates were applied to the appropriate populations in each county to determine an estimated number of Non-Hispanic American Indian/Alaska Native adults diagnosed with diabetes in each of the three age groups for each county. The specific rate for the 18-44 year age group was not available for the American Indian/Alaska Native population; the rate for the 15-44 year age group was applied to the appropriate population 18-44 years of age. This group of people is collectively referred to as Non-Hispanic American Indians throughout the burden report, but this group does including Non-Hispanic Alaska Natives as well.
♦ Non-Hispanic Asian, Native Hawaiian, and Other Pacific Islander Prevalence Prevalence rates for Non-Hispanic Asian, Native Hawaiian, and Other Pacific Islander adults for all three age groups were obtained from the 2008-2010 Behavioral Risk Factor Surveillance System (BRFSS)5 from the following states: Wisconsin, Illinois, Iowa, Michigan, and Minnesota. The reason for the use of multiple states is because the sample sizes for Wisconsin were not large enough to provide reliable prevalence estimates. These rates were applied to the appropriate populations in each county to determine an estimated number of Non-Hispanic Asian, Native Hawaiian, and Other Pacific Islander adults diagnosed with diabetes in each of the three age groups for each county. This group of people is collectively referred to as Non-Hispanic Asian Americans throughout the burden report.
♦ Hispanic/Latino American Prevalence Prevalence rates for Hispanic/Latino American adults for all three age groups were obtained from the 2008-2010 Behavioral Risk Factor Surveillance System (BRFSS)5 from the following states: Wisconsin, Illinois, Iowa, Michigan, and Minnesota. The reason for the use of multiple states is because the sample sizes for Wisconsin (for 45-64 and 65+ age groups) were not large enough to provide reliable prevalence estimates for these age groups. Upon examination, the sample size for the age group 18-44 years using only Wisconsin Behavioral Risk Factor Survey (BRFS) data was technically large enough with 122 persons. However, the weighted prevalence for this age group was unusually and unexpectedly low and we did not feel comfortable Wisconsin BRFS data for this age group as we believed it would produce a

Detailed Technical Notes (Burden 2011) – Page 3 of 10
falsely low prevalence estimate for Wisconsin Hispanic/Latino adults, especially given the relatively large population of 18-44 year olds compared to other age groups. Therefore, we used Hispanic/Latino data for the five states mentioned above to provide a more reliable estimate for this age group. These rates were applied to the appropriate populations in each county to determine an estimated number of Hispanic/Latino American adults diagnosed with diabetes in each of the three age groups for each county.
♦ Non-Hispanic Some Other Race and Multi-Race
It is estimated that over 29,000 adults in Wisconsin 18 years and above are “Non-Hispanic Some Other Race” or “Non-Hispanic Multi-Race.” The prevalence rate for Non-Hispanic Some Other Race and Non-Hispanic Multi-Race for the age group 45-64 years was obtained from the 2008-2010 Wisconsin Behavioral Risk Factor Survey (BRFS).3 Prevalence rates for Non-Hispanic Some Other Race and Non-Hispanic Multi-Race for the age groups 18-44 years and 65 years and above were obtained from the 2008-2010 Behavioral Risk Factor Surveillance System (BRFSS) 5 from the following states: Wisconsin, Illinois, Iowa, Michigan, and Minnesota. The reason for the use of multiple states for these age groups is because the sample size for Wisconsin was not large enough to provide a reliable prevalence estimate for these age groups. These rates were applied to the appropriate populations in each county to determine an estimated number of Non-Hispanic Some Other Race or Non-Hispanic Multi-Race adults diagnosed with diabetes in each of the three age groups for each county.
♦ Non-Hispanic White Prevalence rates for Non-Hispanic white adults are from the 2008-2010 Wisconsin Behavioral Risk Factor Survey (BRFS).3 For the 18-44 year age group, the following counties had a large enough sample size for county-specific rates for the Non-Hispanic White population: Brown, Dane, and Milwaukee. For the 45-64 year age group, the following counties had a large enough sample size for county-specific rates for the Non-Hispanic White population: Brown, Dane, Fond du Lac, La Crosse, Marathon, Milwaukee, Outagamie, Ozaukee, Racine, Rock, Sheboygan, Washington, Waukesha, and Winnebago. For the 65 years and older age group, the following counties had a large enough sample size for county-specific rates for the Non-Hispanic White population: Brown, Dane, Milwaukee, Outagamie, Waukesha, and Winnebago. For counties not mentioned above, rates for the three age groups within each of the five Department of Health Services regions were determined. These region-specific rates were applied to the appropriate county’s population (except as described above) to determine an estimated number of Non-Hispanic White adults diagnosed with diabetes in each of the three age groups for each county. The map on page 10 of the Detailed Technical Notes displays regions and their corresponding counties. In addition, there is a listing of the regions and their corresponding counties on page 4 of the Detailed Technical Notes.
Undiagnosed Prevalence – In the United States, an estimated 18.8 million persons have been diagnosed with diabetes, and 7.0 million persons have diabetes that has not been diagnosed.6 This ratio of undiagnosed to diagnosed (7.0 million:18.8 million or 37.2340426%) was used in determining the estimated number of adults in Wisconsin who have undiagnosed diabetes. Unrounded numbers of diagnosed adults were multiplied by the above percentage to determine the estimated number of adults who have undiagnosed diabetes in each age group and each race/ethnicity group for each county. Rounded county estimates of undiagnosed adults were summed to determine state estimates for the three age groups for each race/ethnicity and all races/ethnicities combined. Percents of estimated undiagnosed adults were calculated by dividing the numbers of undiagnosed adults by the appropriate population for the age groups 18-44 years, 45-64 years, and 65 years and older; percents were rounded to one decimal point. Overall (all ages 18 years and older) undiagnosed prevalence estimates for all counties, regions, and race/ethnicity groups were age-adjusted (using the direct method) to the 2000 United States standard population and presented as percents rounded to one decimal point. Age-adjustment is explained in further detail on page 4 of the Detailed Technical Notes. Total Prevalence – County-specific rounded numbers of diagnosed adults and rounded numbers of undiagnosed adults were summed for each of the three age groups to determine the total estimated number of adults with diabetes by county. Rounded estimates were summed to determine state estimates. Percents of estimated totals were calculated by dividing the numbers of total adults by the appropriate population for the age groups 18-44 years, 45-64 years, and 65 years and older; percents were rounded to one decimal

Detailed Technical Notes (Burden 2011) – Page 4 of 10
point. Overall (all ages 18 years and older) diagnosed prevalence estimates for all counties were age-adjusted (using the direct method) to the 2000 United States standard population and presented as percents rounded to one decimal point. Age-adjustment is explained in further detail on page 4 of the Detailed Technical Notes. In some cases, the total percents may not equal the sum of diagnosed percents and undiagnosed percents, due to rounding. Estimated Diabetes Prevalence in Adults by Region Counties were placed into regions using the Department of Health Services, Division of Public Health regions. The Northeastern Region consists of 17 counties: Brown, Calumet, Door, Fond du Lac, Green Lake, Kewaunee, Manitowoc, Marinette, Marquette, Menominee, Oconto, Outagamie, Shawano, Sheboygan, Waupaca, Waushara, and Winnebago. The Northern Region consists of 15 counties: Ashland, Bayfield, Florence, Forest, Iron, Langlade, Lincoln, Marathon, Oneida, Portage, Price, Sawyer, Taylor, Vilas, and Wood. The Southeastern Region consists of 8 counties: Jefferson, Kenosha, Milwaukee, Ozaukee, Racine, Walworth, Washington, and Waukesha. The Southern Region consists of 14 counties: Adams, Columbia, Crawford, Dane, Dodge, Grant, Green, Iowa, Juneau, Lafayette, Richland, Rock, Sauk, and Vernon. The Western Region consists of 18 counties: Barron, Buffalo, Burnett, Chippewa, Clark, Douglas, Dunn, Eau Claire, Jackson, La Crosse, Monroe, Pepin, Pierce, Polk, Rusk, St. Croix, Trempealeau, and Washburn. Age-specific estimated diabetes prevalence by region – County estimates in each of the three age groups for each region were summed to determine region-wide estimates of the number of adults with diabetes for each of the three age groups. This applies to diagnosed, undiagnosed, and total prevalence. Age-adjusted estimated diabetes prevalence rates by region – Overall (all ages 18 years and older) prevalence estimates for all regions were age-adjusted (using the direct method) to the 2000 United States standard population and presented as percents rounded to one decimal point for diagnosed, undiagnosed, and total estimates. Age-adjustment is explained in further detail below. Estimated Diabetes Prevalence in Adults by Race/Ethnicity Age-specific estimated diabetes prevalence by race/ethnicity – County estimates in each of the three age groups for each race/ethnicity group were summed to determine a state-wide estimate of the number of adults with diabetes in each of the six racial/ethnic groups for each of the three age groups. This applies to diagnosed, undiagnosed, and total prevalence. Age-adjusted estimated diabetes prevalence rates by race/ethnicity – Overall (all ages 18 years and older) prevalence estimates for all racial/ethnic groups were age-adjusted (using the direct method) to the 2000 United States standard population and presented as percents rounded to one decimal point for diagnosed, undiagnosed, and total estimates. Age-adjustment is explained in further detail below.
Comparison of “2008 Burden” with “2011 Burden” In both The 2008 Burden of Diabetes in Wisconsin7 and The 2011 Burden of Diabetes in Wisconsin, the overall (all ages 18 years and older) diagnosed, undiagnosed, and total prevalence estimates were age-adjusted. The two Burden documents were also completed using identical methodologies with slight differences in data sources (based on sample size limitations). Because of this, overall percentages (for Wisconsin, by county, and by race/ethnicity) can be directly compared between the two documents.
Age-adjustment
Age-adjustment allows the ability to remove differences in rates between groups while controlling for differences in the age variations of the populations. Differences in population distribution can cause to misleading overall prevalence estimates (especially for different racial/ethnic groups, some of which have very different population distributions). For example, according to 2009 population estimates, 71.9% of the adult Hispanic/Latino population is aged 18-44 years, compared to 44.0% of the Non-Hispanic White population. Due to this difference in age distribution and the fact that the prevalence of diabetes is lower for younger age groups, the prevalence estimate for the “All ages” group for the Hispanic/Latino population would be an underestimate if it were presented in crude percent format (not age-adjusted).
Detailed Technical Notes (Burden 2011) – Page 5 of 10
However, the purpose of the Burden documents is to provide point-in-time estimates and they should not be used chiefly to examine trends in diabetes prevalence over time. Estimated Diabetes Prevalence in Children and Adolescents (17 years and younger) Population – At the time that this report was created, Wisconsin 2010 detailed census data were not yet available. Population estimates from 2009 were used to calculate the estimated diabetes prevalence, and were obtained from the United States Census Bureau web site.1 Estimated Diagnosed Prevalence – Prevalence is the number of cases of a disease that are present in a population during a specified time. Prevalence rates were obtained for the age groups 0-9 years and 10-17 years from the Wisconsin Family Health Survey 2008-2009.8 Weighting for the 2010 Wisconsin Family Health Survey data was not complete at the time this report was produced, so 2010 data are not included. The Office of Informatics, Division of Public Health, Wisconsin Department of Health Services provided the estimates for this report. Diabetes-related Inpatient Hospitalization Discharges All hospitalization discharge data are from the 2010 Wisconsin Inpatient Hospitalization Discharge Database9 and the statistical software SAS was used to analyze all data.2 Data on diabetes-related inpatient hospitalization discharges include all ages (children and adults) when data is provided by state, region, county, or race/ethnicity group, but only include children and adolescents (ages 0-17) when data is provided for children and adolescents. Data do not include hospitalization discharges at any Veteran’s Administration (VA) hospitals, which are exempt from the state reporting requirements. Due to this, numbers and charges of hospitalization discharges, as well as diabetes-related hospitalization discharges presented are an underestimate of the true numbers and charges. Hospitalization discharges for non-Wisconsin residents and for Wisconsin residents hospitalized outside of Wisconsin are not included. It should be noted that users who intend to use hospitalization discharge data should be aware that for many counties along Wisconsin borders, hospitalizations may be occurring in a neighboring state. In fact, for some counties, more hospitalizations occur in the neighboring state than occur in Wisconsin. The data presented in this report only includes hospitalization discharges occurring in Wisconsin hospitals. This information should be considered when observing hospitalization discharges for this report, especially for border counties. Data on hospitalization discharges (including diabetes-related hospitalization discharges) as well as associated charges likely represents an underestimate of the true number and this should be considered when evaluating the data. For this report, diabetes-related hospitalization discharges are defined as the reporting of one of more ICD-9 codes for diabetes (250.0 – 250.93) in “Principal Diagnosis Code” or “Other Diagnosis Code” (eight separate lines). Those hospitalization discharges that report more than one diabetes code for one hospitalization discharge are not counted twice. By County When data is presented by county, hospitalization discharge records are based upon the county of residence of the person hospitalized – not the county where the person is hospitalized. The total number of hospitalization discharges in Wisconsin is the sum of the county totals, and the total number of diabetes-related hospitalization discharges in Wisconsin is the sum of the county totals of diabetes-related hospitalization discharges. Percents of diabetes-related hospitalization discharges (of total hospitalization discharges) are calculated for each county and for the state by dividing the number of diabetes-related hospitalization discharges by the total number of hospitalization discharges; percents are rounded to one decimal point. Charges (rounded to the nearest $100) for the total number of hospitalization discharges are presented for each county. The total amount of charges for Wisconsin hospitalization discharges is the sum of the rounded county charges. Charges (rounded to the nearest $100) for the total number of diabetes-related hospitalization discharges are presented for each county. The total amount of charges for Wisconsin diabetes-related hospitalization discharges is the sum of the county charges. Percents of diabetes-related charges (of total hospitalization charges) are calculated for each county and for the state by dividing the diabetes-related charges by the total charges; percents are rounded to one decimal point.

Detailed Technical Notes (Burden 2011) – Page 6 of 10
By Region The total number of hospitalization discharges for each region is the sum of the county totals in that region, and the total number of diabetes-related hospitalization discharges for each region is the sum of the county totals in that region. Percents of diabetes-related hospitalization discharges (of total hospitalization discharges) are calculated for each region by dividing the number of diabetes-related hospitalization discharges by the total number of hospitalization discharges; percents are rounded to one decimal point. Total charges for hospitalization discharges in each region are the sum of the rounded charges for counties in that region. Total charges for diabetes-related hospitalization discharges in each region are the sum of the rounded charges for counties in that region. Percents of diabetes-related charges (of total hospital charges) are calculated for each region by dividing the diabetes-related charges by the total charges; percents are rounded to one decimal point. By Race/Ethnicity There are limitations in using race and ethnicity data for inpatient hospitalization discharges. Race and ethnicity information is based on self-identification. These data can only be obtained from a patient, a relative, or a friend. A facility may not categorize a patient based on facility personnel judgment. In some cases, a person at a facility may not ask a patient to self-identify his or her race/ethnicity. In other cases, a patient may choose not to answer when asked about his or her race/ethnicity. For example, of 607,751 hospitalization discharges (Wisconsin residents) in 2010, 34,051 people either were not asked to indicate their race/ethnicity or they chose not to answer regarding their race/ethnicity. Of the 92,780 diabetes-related hospitalization discharges (Wisconsin residents) in 2010, 3,050 people either were not asked to indicate their race/ethnicity or they chose not to answer regarding their race/ethnicity. Because people are either not asked their race/ethnicity or because people choose to not answer regarding their race/ethnicity, the total hospitalization discharges and diabetes-related hospitalization discharges for the racial/ethnic groups presented do not sum to the total (statewide) numbers. Percents of diabetes-related hospitalization discharges are calculated for each race/ethnic group by dividing the number of diabetes-related hospitalization discharges (of total hospitalization discharges) by the total number of hospitalization discharges; percents are rounded to one decimal point. Charges (rounded to the nearest $100) for the total number of hospitalization discharges are presented for each race/ethnic group. Charges (rounded to the nearest $100) for the total number of diabetes-related hospitalization discharges are presented for each race/ethnic group. Percents of diabetes-related charges are calculated for each race/ethnic group by dividing the diabetes-related charges by the total charges; percents are rounded to one decimal point. As explained in the above paragraph, because people either are not asked for their race/ethnicity or can choose to not provide information on race/ethnicity, the charges for total hospitalization discharges and charges for diabetes-related hospitalization discharges for the race/ethnicity groups presented do not sum to the total (statewide) charges. CDC County-Level Prevalence Estimates for Obesity and Physical Inactivity In late 2009, the Centers for Disease Control and Prevention (CDC) released county-level obesity and physical inactivity prevalence estimates10 for each county in the United States. CDC estimated the prevalence of obesity and physical inactivity using data from CDC’s Behavioral Risk Factor Surveillance System (BRFSS) and data from the U.S. Census Bureau’s Population Estimates Program. Estimates were restricted to adults 20 years of age or older to be consistent with population estimates from the U.S. Census Bureau. Additional details about the data and the methodology that CDC used can be found at the following website: http://apps.nccd.cdc.gov/DDTSTRS/default.aspx. Age-adjusted prevalence estimates for obesity and physical inactivity are included for county-specific pages, but are not provided on state, regional, or race/ethnicity-related pages. Pre-diabetes Estimates Pre-diabetes is a condition in which individuals have blood glucose or A1C levels higher than normal but not high enough to be classified as diabetes. People with pre-diabetes have an increased risk of developing type 2 diabetes, heart disease, and stroke. Studies have shown that people with pre-diabetes who lose weight and increase their physical activity may prevent or delay type 2 diabetes and in some cases return their blood glucose levels to normal.6

Detailed Technical Notes (Burden 2011) – Page 7 of 10
Information from the Centers for Disease Control and Prevention (CDC) National Diabetes Fact Sheet states that a 2005-2008 study found that among U.S. adults aged 20 years and older, 35% had pre-diabetes (based on fasting glucose or A1C). Applying this percentage to the entire U.S. population 20 years and older in 2010 leads to an estimated 79 million Americans aged 20 years and older with pre-diabetes.6 An estimate of the number of people aged 20 years and older with pre-diabetes in each county, in each region, and for each race/ethnicity group in Wisconsin was determined using U.S Census 2009 population estimates data for this age group. (Population estimates for pre-diabetes prevalence estimates were obtained from the same data file as population estimates for the diabetes prevalence estimates.1) County population estimates, regional population estimates, and race/ethnicity population estimates (for ages 20 years and older) were separately multiplied by 0.35 to determine the estimated number of persons aged 20 years and older with pre-diabetes. County estimates were rounded to the nearest 10 and county totals were summed to determine state estimates. Regional estimates were sums of the counties in that particular region. Totals of pre-diabetes estimates for all race/ethnicity groups will not match state totals exactly, due to rounding. Data from the CDC National Diabetes Fact Sheet suggests that the percentage of U.S. adults aged 20 years or older with pre-diabetes in 2005-2008 was similar for Non-Hispanic whites (35%), non-Hispanic African Americans (35%), and Mexican Americans (36%).6 Based on this, an assumption is made that each county, each region, and each race/ethnicity group has an equal estimated pre-diabetes prevalence of 35%. Though there may be some variations in the prevalence of pre-diabetes among different counties, regions, and racial/ethnic groups, using a pre-diabetes prevalence of 35% allows the ability to provide a rough estimate of the number of adults 20 years and older with pre-diabetes for all counties, regions, and race/ethnicity groups. Economic Costs of Diabetes The American Diabetes Association published an article in the March 2008 edition of Diabetes Care, entitled “Economic Costs of Diabetes in the U.S. in 2007.”11 Although this article is outdated, we learned that new estimates on the economic costs of diabetes would not be out until 2012; therefore, we used these data and applied it to current prevalence estimates. Per capita figures for this report were obtained from this article and applied to the estimated population with diagnosed diabetes in Wisconsin to determine the estimated costs of diabetes in Wisconsin. The article found that the per capita cost of medical expenditures for a person with diabetes was $11,744.11 Table 10 in the article indicated that total (direct) health care expenditures for the United States were $116.257 billion and Table 14 indicated that total (indirect) costs attributed to diabetes for the United States were $58.2 billion, for a total of $174.457 billion. These figures were used to calculate percentages of direct (66.63934379%) and indirect (33.36065621%). The percentages, along with the figure of $11,744 for per capital direct costs allowed the calculation of $5,879 for a per capita indirect cost. The direct and indirect per capita figures were used to calculate the estimated costs for those diagnosed with diabetes in Wisconsin. It should be noted that total costs may not equal the sum of direct and indirect costs, due to rounding. An example of this is direct, indirect, and total costs for Wisconsin. Direct costs are $4.0658 billion (rounded off to $4.07 billion), indirect costs are $2.0354 billion (rounded off to $2.04 billion), and total costs are $6.1012 billion (rounded off to $6.10 billion). By County Direct medical expenditures for adults by county were calculated by multiplying the estimated number of adults with diagnosed diabetes in each county by $11,744. Indirect costs due to lost productivity for adults by county were calculated by multiplying the estimated number of adults with diagnosed diabetes in each county by $5,879. Direct and indirect costs were rounded to the nearest $100,000 and were summed to determine total costs for each county. County totals for direct, indirect, and total costs were summed to determine state totals. By Region Direct medical expenditures for adults by region are the sum of county medical expenditures for that region. Indirect costs due to lost productivity for adults by region are the sum of county indirect costs for that region. By Race/Ethnicity Direct medical expenditures for adults by race/ethnicity were calculated by multiplying the estimated number of adults with diagnosed diabetes for each racial/ethnic group by $11,744. Indirect costs due to lost productivity for adults by race/ethnicity were calculated by multiplying the estimated number of adults with
Detailed Technical Notes (Burden 2011) – Page 8 of 10
diagnosed diabetes for each race/ethnicity by $5,879. Direct and indirect costs were rounded to the nearest $100,000 and were summed to determine total costs for race/ethnicity group. It should be noted that the sum of the costs for the six race/ethnicity groups may be slightly different from the state cost totals, due to rounding. For Children/Adolescents Direct medical expenditures for children and adolescents were calculated by multiplying the estimated number of children/adolescents with diabetes in Wisconsin (4,500) by $11,744, totaling $52,848,000. For this analysis, an estimate of indirect costs for children/adolescents is not included, as children/adolescents are generally not members of the workforce (there are some exceptions). Total Economic Costs (Children/Adolescents and Adults) The total estimated economic cost of diabetes is $6.15 billion. This includes the estimated total for adults ($6.10 billion) and the estimated total for children and adolescents ($52.8 million). It must be noted that these estimates only include persons diagnosed with diabetes. Persons with diabetes that is undiagnosed arguably don’t incur the same costs as those diagnosed with diabetes; however, the total figure of $6.15 billion is likely an underestimate, as it considers none of the direct or indirect costs for persons with undiagnosed diabetes. Furthermore, the figure does not include persons with pre-diabetes. Risk Factors – Adults All risk factor data presented for adults are from the 2009-2010 Wisconsin Behavioral Risk Factor Survey (BRFS),3 except for high blood pressure and high cholesterol, which are from the 2009 Wisconsin BRFS. The Wisconsin BRFS is a part of the national Centers for Disease Control and Prevention (CDC) Behavioral Risk Factor Surveillance System (BRFSS), which is the world’s largest on-going telephone health survey system, tracking health conditions and risk behaviors in the United States yearly since 1984. The statistical software SAS was used to analyze all data.2 All percentages are weighted and representative of the entire adult population of Wisconsin. Missing values, refusals, and responses of “don't know” are not included in the denominator for that particular question. Information on risk factors includes only those persons 18 years and older and does not include institutionalized persons (college, nursing homes, prisons). Body mass index (BMI) is defined as weight in kilograms divided by height in meters squared (kg/m2). For this report, “obese” is defined as a BMI of 30.0 kg/m2 or above and “overweight” is defined as a BMI of 25.0 kg/m2 to a BMI <30.0 kg/m2. For the specific item termed “overweight/obese,” this includes all people with a BMI of 25.0 kg/m2 or above. For this report, the definition of “high blood pressure” is the percentage of adults who responded “yes” to the question “Have you ever been told by a doctor, nurse, or other health professional that you have high blood pressure?” The definition of “high cholesterol” is the percentage of adults who responded “yes” to the question “Have you ever been told by a doctor or other health professional that your blood cholesterol is high?” The definition of “lack of physical activity” is the percentage of adults who responded “no” to the question “During the past month, other than your regular job, did you participate in any physical activities or exercises, such as running, calisthenics, golf, gardening, or walking for exercise?” The definition of current smoker is the percentage of adults who responded that they had ever smoked 100 cigarettes in their lifetime and reported smoking every day or some days. All percentages are rounded to the nearest whole percent. For this report, the risk factors listed above (obese, overweight and obese, high blood pressure, high cholesterol, lack of physical activity, and current smoker) are provided in a graph showing differences between those who have diabetes and those who do not. Risk Factors – Adolescents All risk factor data (presented for children/adolescents) are from the 2009 Wisconsin Youth Risk Behavior Survey (YRBS).12 Some of the measures and related questions have changed from the 2007 Wisconsin YRBS data that were presented in the 2008 Burden of Diabetes in Wisconsin,7 so results are not directly comparable to the 2008 Burden of Diabetes in Wisconsin for some measures. It must be noted that this survey is only asked of adolescents in grades 9-12, and all percentages are weighted and representative of this specific population for the entire state of Wisconsin. For this report, “overweight/obese” is defined as a self-reported weight and height that places a student in the “overweight” or “obese” category. Overweight is defined as “at or above the 85th percentile but below the 95th percentile for body mass index by age and sex.” Obesity is defined as “at or above the 95th percentile for body mass index by age and sex.” For this report, the definition of “does not meet physical activity recommendations” is the percentage of students who responded “four” or a smaller number for the question “During the past seven days, on how many days were

Detailed Technical Notes (Burden 2011) – Page 9 of 10
you physically active for a total of at least 60 minutes per day?” The definition of “smoked cigarettes on one/more of past 30 days” is the percentage of students that responded “one” or a higher number for the question “During the past 30 days, on how many days did you smoke cigarettes?” The definition of “drank one/more servings of non-diet soda per day” is the percentage of students that responded “one per day” or a higher number to the question “During the past seven days, how many times did you drink a can, bottle, or glass of soda or pop, such as Coke, Pepsi, or Sprite. (Do not include diet soda.)” The question addressing frequency of students eating breakfast was not included in the 2009 YRBS. Due to this question not being included, we added a question on fruit and vegetable consumption in the 2011 Burden of Diabetes in Wisconsin. The definition of “does not eat 5 or more fruits/vegetables per day” is the percentage of students that responded they did not eat fruits and vegetables five or more times per day for the past seven days.” All data were obtained from the Wisconsin Department of Public Instruction website, (main page located at: http://dpi.state.wi.us/sspw/yrbsindx.html). Specifically, the 2009 Wisconsin YRBS PowerPoint Presentation was used to gather the data (website: http://dpi.state.wi.us/sspw/ppt/yrbs09ppt.ppt). All percentages are rounded to the nearest whole percent. Other Information The Diabetes Prevention and Control Program, Bureau of Community Health Promotion, Division of Public Health, Department of Health Services compiled data and information for this report May 2011 through August 2011. Questions regarding information contained in The 2011 Burden of Diabetes in Wisconsin or in the Detailed Technical Notes section can be directed to Jenny Camponeschi, MS, Epidemiologist for the Wisconsin Diabetes Prevention and Control Program at (608) 267-1449 or [email protected]. Suggested Citation: Wisconsin Diabetes Prevention and Control Program, Division of Public Health, Department of Health Services. The 2011 Burden of Diabetes in Wisconsin. September 2011. References 1 United States Census Bureau. U.S. Census Bureau Population Estimates, Dataset for All Geographies. Available at: http://www.census.gov/popest/datasets.html. Retrieved May 31, 2011. 2 SAS software, Version 9.2 of the SAS System for Windows. Copyright © 2002-2008, SAS Institute Inc. SAS and all other SAS Institute Inc. product or service names are registered trademarks or trademarks of SAS Institute Inc., Cary, NC, USA. All Rights Reserved. 3 Wisconsin Behavioral Risk Factor Survey, Wisconsin Division of Public Health, Wisconsin Department of Health Services. United States Centers for Disease Control and Prevention (CDC), 2008-2010. 4 Community Health Data Profile: Minnesota, Wisconsin, and Michigan Tribal Communities, 2010. Great Lakes Inter-Tribal Epidemiology Center. Great Lakes Inter-Tribal Cuoncil, Inc. 2011. 5 Centers for Disease Control and Prevention (CDC). Behavioral Risk Factor Surveillance System Survey Data. Atlanta, Georgia: U.S. Department of Health and Human Services, Centers for Disease Control and Prevention, 2008-2010. 6 Centers for Disease Control and Prevention. National diabetes fact sheet: national estimates and general information on diabetes and prediabetes in the United States, 2011. Atlanta, GA: U.S. Department of Health and Human Services, Centers for Disease Control and Prevention, 2011. Available at: http://www.cdc.gov/diabetes/pubs/pdf/ndfs_2011.pdf. Retrieved June 28, 2011. 7 National Kidney Foundation of Wisconsin and Wisconsin Lions Foundation. The 2008 Burden of Diabetes in Wisconsin. January 2008. 8 Office of Informatics, Division of Public Health, Wisconsin Department of Health Services. Combined 2008-2009 Family Health Surveys. Madison, WI, July 27, 2011. 9 Inpatient hospitalization discharge file, Office of Health Informatics, Division of Public Health, Wisconsin Department of Health Services; prepared from data collected by the Department of Health Services through September 30, 2003 and thereafter by the Wisconsin Hospital Association Information Center, Inc. 10 Centers for Disease Control and Prevention: National Diabetes Surveillance System. Available online at: http://apps.nccd.cdc.gov/ddtstrs/default.aspx. Retrieved August 2, 2011. 11 American Diabetes Association. Economic Costs of Diabetes in the U.S. in 2007. Diabetes Care 2008; 31:1-20. 12 Wisconsin Youth Risk Behavior Survey (YRBS), Wisconsin Department of Public Instruction. United States Centers for Disease Control and Prevention (CDC), 2009.
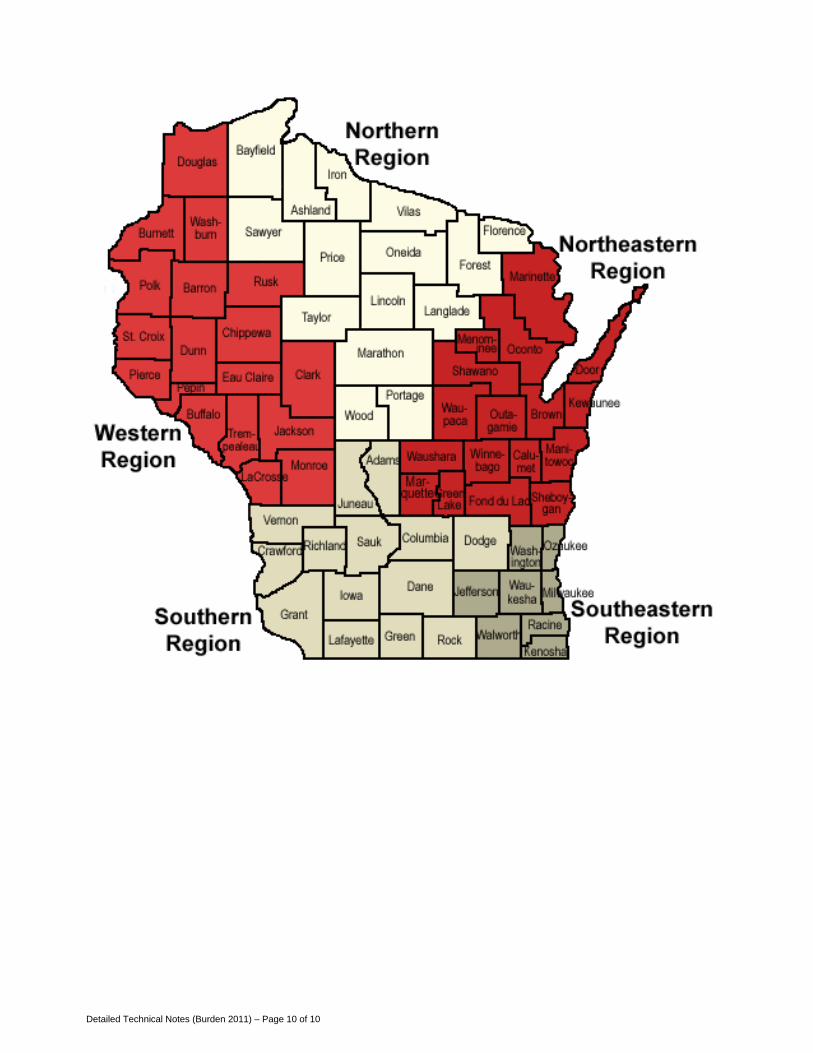
Detailed Technical Notes (Burden 2011) – Page 10 of 10

Wisconsin Diabetes Prevention and Control Program Bureau of Community Health Promotion
Division of Public Health Department of Health Services
PO Box 2659
Madison, WI 53701-2659
Phone: (608) 261-6855
Fax: (608) 266-8925
Email: [email protected]
Visit our website at: http://www.dhs.wisconsin.gov/health/diabetes
This document is in the public domain and may be downloaded, copied, and/or reprinted. The Wisconsin Diabetes Prevention and Control Program appreciates citation and
notification of use. P-00284 (09/11)
Thank you to our partners American Diabetes Association Wisconsin Area, National Kidney Foundation of Wisconsin, and Wisconsin Lions Foundation for the support in
printing this document.