National Diabetes Statistics Report, · PDF fileNational Diabetes Statistics Report, 2017...
20
National Diabetes Statistics Report, 2017 Estimates of Diabetes and Its Burden in the United States Background The National Diabetes Statistics Report is a periodic publication of the Centers for Disease Control and Prevention (CDC) that provides updated statistics about diabetes in the United States for a scientific audience. It includes information on prevalence and incidence of diabetes, prediabetes, risk factors for complications, acute and long-term complications, deaths, and costs. These data can help focus efforts to prevent and control diabetes across the United States. This report was previously known as the National Diabetes Fact Sheet. Methods The estimates in this document (unless otherwise noted) were derived from various data systems of CDC, the Indian Health Service (IHS), the Agency for Healthcare Research and Quality (AHRQ), the U.S. Census Bureau, and published studies. The estimated percentages and the total number of people with diabetes and prediabetes were derived from the National Health and Nutrition Examination Survey (NHANES), National Health Interview Survey (NHIS), IHS National Data Warehouse (NDW), Behavioral Risk Factor Surveillance System (BRFSS), United States Diabetes Surveillance System (USDSS), and U.S. resident population estimates. Numbers and rates for acute and long-term complications of diabetes were derived from the National Inpatient Sample (NIS) and National Emergency Department Sample (NEDS), as well as NHIS. Diagnosed diabetes was determined by self-report among survey respondents and by diagnostic codes for American Indians and Alaska Natives who accessed IHS, tribal, or Urban Indian health facilities that submitted data to the IHS NDW. Both fasting glucose and hemoglobin A1C (A1C) levels were used to derive estimates for undiagnosed diabetes and prediabetes. An alpha level of 0.05 was used when assessing statistical differences between groups. Most estimates of diabetes in this report do not differentiate between type 1 and type 2 diabetes. However, because type 2 diabetes accounts for 90% to 95% of all diabetes cases, the data presented are likely to be more characteristic of type 2 diabetes. More detailed information about data sources and methods is available in the Appendix. Fast Facts on Diabetes 30.3 million people have diabetes (9.4% of the U.S. population) Diagnosed 23.1 million people Undiagnosed 7.2 million (23.8% of people with diabetes are undiagnosed) National Center for Chronic Disease Prevention and Health Promotion Division of Diabetes Translation CS279910-A
Transcript of National Diabetes Statistics Report, · PDF fileNational Diabetes Statistics Report, 2017...

National Diabetes Statistics Report, 2017Estimates of Diabetes and Its Burden in the United States
BackgroundThe National Diabetes Statistics Report is a periodic publication of the Centers for Disease Control and Prevention (CDC) that provides updated statistics about diabetes in the United States for a scientific audience. It includes information on prevalence and incidence of diabetes, prediabetes, risk factors for complications, acute and long-term complications, deaths, and costs. These data can help focus efforts to prevent and control diabetes across the United States. This report was previously known as the National Diabetes Fact Sheet.
MethodsThe estimates in this document (unless otherwise noted) were derived from various data systems of CDC, the Indian Health Service (IHS), the Agency for Healthcare Research and Quality (AHRQ), the U.S. Census Bureau, and published studies. The estimated percentages and the total number of people with diabetes and prediabetes were derived from the National Health and Nutrition Examination Survey (NHANES), National Health Interview Survey (NHIS), IHS National Data Warehouse (NDW), Behavioral Risk Factor Surveillance System (BRFSS), United States Diabetes Surveillance System (USDSS), and U.S. resident population estimates.
Numbers and rates for acute and long-term complications of diabetes were derived from the National Inpatient Sample (NIS) and National Emergency Department Sample (NEDS), as well as NHIS. Diagnosed diabetes was determined by self-report among survey respondents and by diagnostic codes for American Indians and Alaska Natives who accessed IHS, tribal, or Urban Indian health facilities that submitted data to the IHS NDW.
Both fasting glucose and hemoglobin A1C (A1C) levels were used to derive estimates for undiagnosed diabetes and prediabetes. An alpha level of 0.05 was used when assessing statistical differences between groups.
Most estimates of diabetes in this report do not differentiate between type 1 and type 2 diabetes. However, because type 2 diabetes accounts for 90% to 95% of all diabetes cases, the data presented are likely to be more characteristic of type 2 diabetes. More detailed information about data sources and methods is available in the Appendix.
Fast Facts on Diabetes
30.3 million people have diabetes
(9.4% of the U.S. population)
Diagnosed23.1 million people
Undiagnosed 7.2 million
(23.8% of people with diabetes are undiagnosed)
National Center for Chronic Disease Prevention and Health Promotion Division of Diabetes Translation
CS2
7991
0-A

2 | National Diabetes Statistics Report, 2017
ResultsPrevalence of Both Diagnosed and Undiagnosed Diabetes
• An estimated 30.3 million people of all ages—or 9.4% of the U.S. population—had diabetes in 2015 (Methods).
• This total included 30.2 million adults aged 18 years or older (12.2% of all U.S. adults), of which 7.2 million (23.8%) were not aware of or did not report having diabetes (Table 1) (Methods).
• The percentage of adults with diabetes increased with age, reaching a high of 25.2% among those aged 65 years or older (Table 1).
• Compared to non-Hispanic whites, the age-adjusted prevalence of diagnosed and undiagnosed diabetes was higher among Asians, non-Hispanic blacks, and Hispanics during 2011–2014 (see Table 1a in the Appendix for more details).
Table 1. Estimated number and percentage of diagnosed and undiagnosed diabetes among adults aged ≥18 years, United States, 2015
CharacteristicDiagnosed diabetes
No. in millions (95% CI)a
Undiagnosed diabetes No. in millions
(95% CI)a
Total diabetes No. in millions
(95% CI)a
Total 23.0 (21.1–25.1) 7.2 (6.0–8.6) 30.2 (27.9–32.7)
Age in years
18–44 3.0 (2.6–3.6) 1.6 (1.1–2.3) 4.6 (3.8–5.5)
45–64 10.7 (9.3–12.2) 3.6 (2.8–4.6) 14.3 (12.7–16.1)
≥65 9.9 (9.0–11.0) 2.1 (1.4–3.0) 12.0 (10.7–13.4)
Sex
Women 11.7 (10.5–13.1) 3.1 (2.4–4.1) 14.9 (13.5–16.4)
Men 11.3 (10.2–12.4) 4.0 (3.0–5.5) 15.3 (13.8–17.0)
Percentage (95% CI)b
Percentage (95% CI)b
Percentage (95% CI)b
Total 9.3 (8.5–10.1) 2.9 (2.4–3.5) 12.2 (11.3–13.2)
Age in years
18–44 2.6 (2.2–3.1) 1.3 (0.9–2.0) 4.0 (3.3–4.8)
45–64 12.7 (11.1–14.5) 4.3 (3.3–5.5) 17.0 (15.1–19.1)
≥65 20.8 (18.8–23.0) 4.4 (3.1–6.3) 25.2 (22.5–28.1)
Sex
Women 9.2 (8.2–10.3) 2.5 (1.9–3.2) 11.7 (10.6–12.9)
Men 9.4 (8.5–10.3) 3.4 (2.5–4.6) 12.7 (11.5–14.1)
CI = confidence interval.a Numbers for subgroups may not add up to the total because of rounding.b Data are crude, not age-adjusted.Data source: 2011–2014 National Health and Nutrition Examination Survey and 2015 U.S. Census Bureau data.

National Diabetes Statistics Report, 2017 | 3
Prevalence of Diagnosed DiabetesAmong people of all ages, 2015 data indicated the following: • An estimated 23.1 million people—or 7.2% of the
U.S. population—had diagnosed diabetes (Methods) (see Table 1b in the Appendix for more details).
• This total included:
» 132,000 children and adolescents younger than age 18 years (0.18% of the total U.S. population younger than age 18 years).
» 193,000 children and adolescents younger than age 20 years (0.24% of the total U.S. population younger than age 20 years).
• About 5% of people with diabetes are estimated to have type 1 diabetes (Methods).
Among U.S. adults aged 18 years or older, age-adjusted data for 2013–2015 indicated the following:• American Indians/Alaska Natives had the highest prevalence
of diagnosed diabetes for both men (14.9%) and women (15.3%) (Figure 1) (Methods). Prevalence varied by region, from 6.0% among Alaska Natives to 22.2% among American Indians in certain areas of the Southwest.
• Overall, prevalence was higher among American Indians/Alaska Natives (15.1%), non-Hispanic blacks (12.7%), and people of Hispanic ethnicity (12.1%) than among non-Hispanic whites (7.4%) and Asians (8.0%) (see Table 1c in the Appendix for more details).
• Among people of Hispanic ethnicity, Mexicans had the highest prevalence (13.8%), followed by Puerto Ricans (12.0%), Cubans (9.0%), and Central/South Americans (8.5%) (see Table 1c in the Appendix for more details).
• Among Asians, Asian Indians had the highest prevalence (11.2%), followed by Filipinos (8.9%), and Chinese (4.3%). Other Asian groups had a prevalence of 8.5% (see Table 1c in the Appendix for more details).
• Prevalence varied significantly by education level, which is an indicator of socioeconomic status. Specifically, 12.6% of adults with less than a high school education had diagnosed diabetes versus 9.5% of those with a high school education and 7.2% of those with more than a high school education (see Table 1c in the Appendix for more details).

4 | National Diabetes Statistics Report, 2017
Figure 1. Estimated age-adjusted prevalence of diagnosed diabetes by race/ethnicity and sex among adults aged ≥18 years, United States, 2013–2015
0
5
10
15
Perc
enta
ge
Race/Ethnicity
AI/AN
15.3%14.9%
Asian
9.0%
7.3%
Black, non-Hispanic
12.2%13.2%
Hispanic
12.6%11.7%
White, non-Hispanic
8.1%
6.%
Men
Women
AI/AN = American Indian/Alaska Native.
Note: Error bars represent upper and lower bounds of the 95% confidence interval.
Data source: 2013–2015 National Health Interview Survey, except American Indian/Alaska Native data, which are from the 2015 Indian Health Service National Data Warehouse.
Figure 2 shows model-based county-level estimates of the age-adjusted prevalence of diagnosed diabetes among U.S. adults aged 20 years or older in 2013 (Methods). Specifically, this figure shows that:
• The median age-adjusted county-level prevalence of diagnosed diabetes was 9.4%, with a range of 3.8% to 20.8%.
• Counties in the southern and Appalachian regions of the United States tended to have the highest prevalence of diagnosed diabetes.
Figure 2. Age-adjusted, county-level prevalence of diagnosed diabetes among adults aged ≥20 years, United States, 2013
Data source: United States Diabetes Surveillance System.

National Diabetes Statistics Report, 2017 | 5
Incidence of Diagnosed Diabetes Incidence Among Adults• In 2015, an estimated 1.5 million new cases of
diabetes (6.7 per 1,000 persons) were diagnosed among U.S. adults aged 18 years or older (Table 2) (Methods).
• More than half of these new cases were among adults aged 45 to 64 years, and the numbers were about equal for men and women (Table 2).
• Non-Hispanic blacks (9.0 per 1,000 persons) and people of Hispanic origin (8.4 per 1,000 persons) had a higher age-adjusted incidence compared to non-Hispanic whites (5.7 per 1,000 persons) during 2013–2015 (see Table 2a in the Appendix for more details).
• Age-adjusted incidence was about 2 times higher for people with less than a high school education (10.4 per 1,000 persons) compared to those with more than a high school education (5.3 per 1,000 persons) during 2013–2015 (see Table 2a in the Appendix for more details).
Table 2. Estimated incidence of diabetes among adults aged ≥18 years, United States, 2015
Characteristic No. in thousands (95% CI)a Rate per 1,000 (95% CI)b
Total 1,530 (1,402–1,658) 6.7 (6.2–7.3)
Age in years
18–44 355 (289–420) 3.1 (2.6–3.8)
45–64 809 (714–905) 10.9 (9.6–12.2)
≥65 366 (310–422) 9.4 (8.0–10.9)
Sex
Women 787 (694–880) 6.8 (6.0–7.6)
Men 743 (645–840) 6.7 (5.9–7.7)
CI = confidence interval.a Numbers for subgroups may not add up to the total because of rounding.b Rates are crude, not age-adjusted.Data source: 2013–2015 National Health Interview Survey, 2011–2014 National Health and Nutrition Examination Survey, and 2015 U.S. Census Bureau data.
Figure 3 shows model-based county-level estimates of the age-adjusted incidence of diagnosed diabetes among U.S. adults aged 20 years or older in 2013 (Methods). Specifically, this figure shows that:
• The median age-adjusted county-level incidence of diagnosed diabetes was 8.2 per 1,000 persons, with a range of 3.1 to 21.9 per 1,000 persons.
• Similar to the geographic pattern of the prevalence of diagnosed diabetes, counties in the southern and Appalachian regions of the United States tended to have the highest incidence.

6 | National Diabetes Statistics Report, 2017
Figure 3. Age-adjusted, county-level incidence of diagnosed diabetes among adults aged ≥20 years, United States, 2013
Note: Data unavailable for U.S. territories.Data source: United States Diabetes Surveillance System.
Incidence Among Children and AdolescentsData from the SEARCH for Diabetes in Youth Study1 indicated that:
• During 2011–2012, the estimated annual number of newly diagnosed cases in the United States included:
» 17,900 children and adolescents younger than age 20 years with type 1 diabetes.
» 5,300 children and adolescents age 10 to 19 years with type 2 diabetes.
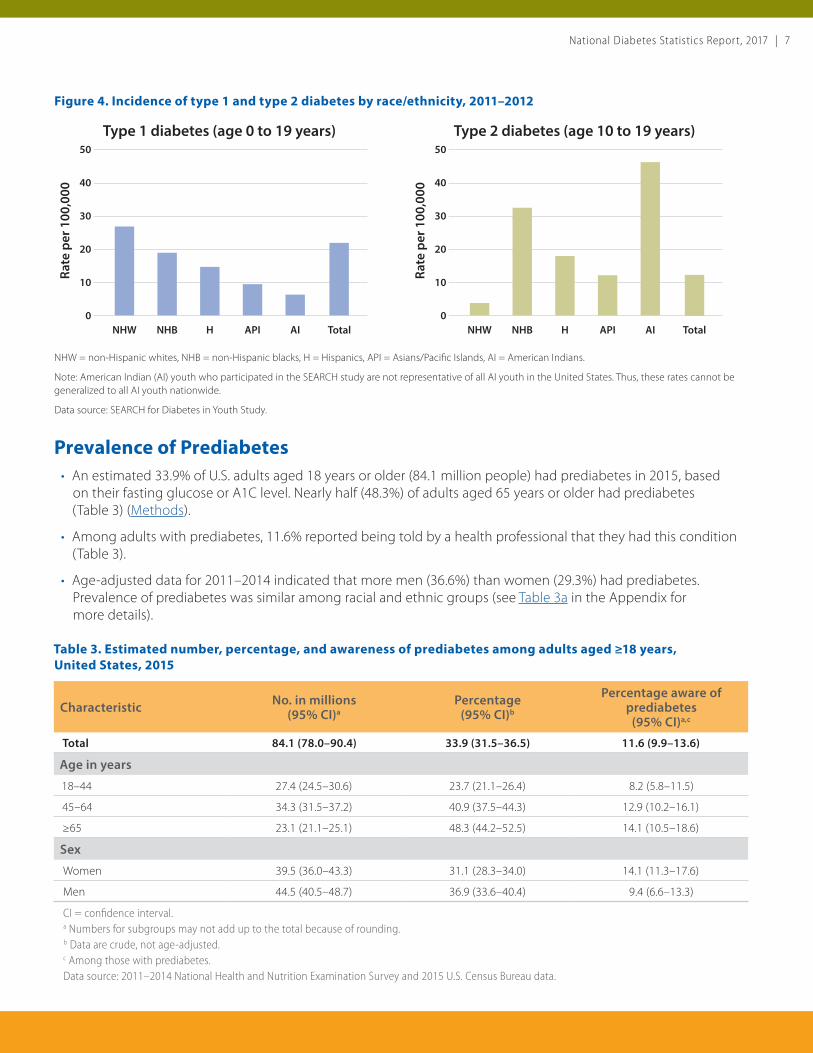
• Among children and adolescents younger than age 20 years, non-Hispanic whites had the highest rate of new cases of type 1 diabetes compared to members of other U.S. racial and ethnic groups (Figure 4).
• Among children and adolescents aged 10 to 19 years, U.S. minority populations had higher rates of new cases of type 2 diabetes compared to non-Hispanic whites (Figure 4).
National Diabetes Statistics Report, 2017 | 7
Figure 4. Incidence of type 1 and type 2 diabetes by race/ethnicity, 2011–2012
Rate
per
100
,000
0
20
30
50
40
10
NHW NHB H API AI Total
Type 1 diabetes (age 0 to 19 years)
Rate
per
100
,000
0
20
30
50
40
10
NHW NHB H API AI Total
Type 2 diabetes (age 10 to 19 years)
NHW = non-Hispanic whites, NHB = non-Hispanic blacks, H = Hispanics, API = Asians/Pacific Islands, AI = American Indians.
Note: American Indian (AI) youth who participated in the SEARCH study are not representative of all AI youth in the United States. Thus, these rates cannot be generalized to all AI youth nationwide.
Data source: SEARCH for Diabetes in Youth Study.
Prevalence of Prediabetes• An estimated 33.9% of U.S. adults aged 18 years or older (84.1 million people) had prediabetes in 2015, based
on their fasting glucose or A1C level. Nearly half (48.3%) of adults aged 65 years or older had prediabetes (Table 3) (Methods).
• Among adults with prediabetes, 11.6% reported being told by a health professional that they had this condition (Table 3).
• Age-adjusted data for 2011–2014 indicated that more men (36.6%) than women (29.3%) had prediabetes. Prevalence of prediabetes was similar among racial and ethnic groups (see Table 3a in the Appendix for more details).
Table 3. Estimated number, percentage, and awareness of prediabetes among adults aged ≥18 years, United States, 2015
Characteristic No. in millions (95% CI)a
Percentage (95% CI)b
Percentage aware of prediabetes
(95% CI)a,c
Total 84.1 (78.0–90.4) 33.9 (31.5–36.5) 11.6 (9.9–13.6)
Age in years
18–44 27.4 (24.5–30.6) 23.7 (21.1–26.4) 8.2 (5.8–11.5)
45–64 34.3 (31.5–37.2) 40.9 (37.5–44.3) 12.9 (10.2–16.1)
≥65 23.1 (21.1–25.1) 48.3 (44.2–52.5) 14.1 (10.5–18.6)
Sex
Women 39.5 (36.0–43.3) 31.1 (28.3–34.0) 14.1 (11.3–17.6)
Men 44.5 (40.5–48.7) 36.9 (33.6–40.4) 9.4 (6.6–13.3)
CI = confidence interval.a Numbers for subgroups may not add up to the total because of rounding.b Data are crude, not age-adjusted.c Among those with prediabetes.Data source: 2011–2014 National Health and Nutrition Examination Survey and 2015 U.S. Census Bureau data.

8 | National Diabetes Statistics Report, 2017
Risk Factors for Complications Risk factor data for 2011–2014 for U.S. adults aged 18 years or older with diagnosed diabetes indicated the following (Methods):
Smoking• 15.9% (95% confidence interval [CI], 13.9%–18.1%) of adults
were current smokers, and 34.5% (95% CI, 31.7%–37.3%) had quit smoking but had a history of smoking at least 100 cigarettes in their lifetime.
Overweight and Obesity• 87.5% (95% CI, 84.8%–89.7%) of adults were overweight or
obese, defined as a body mass index (BMI) of 25 kg/m2 or higher. Specifically:
» 26.1% (95% CI, 23.2%–29.3%) of adults were overweight (BMI of 25.0 to less than 30.0 kg/m2).
» 43.5% (95% CI, 39.6%–47.6%) of adults had obesity (BMI of 30.0 to less than 40.0 kg/m2).
» 17.8% (95% CI, 14.8%–21.3%) of adults had severe obesity (BMI of 40.0 kg/m2 or higher).
Physical Inactivity• 40.8% (95% CI, 36.8%–45.0%) of adults were physically inactive, defined as getting less than 10 minutes a week of
moderate or vigorous activity in each of the physical activity categories of work, leisure time, and transportation.
High Blood Pressure• 73.6% (95% CI, 69.9%–77.1%) of adults had systolic blood pressure of 140 mm Hg or higher or diastolic blood
pressure of 90 mm Hg or higher, or they were on prescription medication for high blood pressure.
High Cholesterol (Hyperlipidemia)• 58.2% (95% CI, 49.7%–66.3%) of adults aged 21 years or older with no self-reported cardiovascular disease but who
were eligible for statin therapy were on a lipid-lowering medication (see Table 4a in the Appendix for more details).
• 66.9% (95% CI, 58.5%–74.4%) of adults aged 21 years or older with self-reported cardiovascular disease who were thus eligible for statin therapy were on a lipid-lowering medication.
High Blood Glucose (Hyperglycemia)• 15.6% (95% CI, 13.2%–18.3%) of adults had an A1C value higher than 9%.

National Diabetes Statistics Report, 2017 | 9
Coexisting Conditions and Complications HospitalizationsIn 2014, a total of 7.2 million hospital discharges were reported with diabetes as any listed diagnosis among U.S. adults aged 18 years or older (Table 4) (Methods). These discharges included the following:
• 1.5 million for major cardiovascular diseases (70.4 per 1,000 persons with diabetes), including:
» 400,000 for ischemic heart disease (18.3 per 1,000 persons with diabetes).
» 251,000 for stroke (11.5 per 1,000 persons with diabetes).
• 108,000 for a lower-extremity amputation (5.0 per 1,000 persons with diabetes).
• 168,000 for diabetic ketoacidosis (7.7 per 1,000 persons with diabetes).
Table 4. Number and rate of hospitalizations among adults aged ≥18 years with diagnosed diabetes for selected causes, United States, 2014
Cause of hospitalization No. in thousands Crude rate per 1,000 persons with diabetes (95% CI)
Diabetes as any listed diagnosis 7,155 327.2 (311.3–343.1)
Major cardiovascular disease 1,539 70.4 (66.8–73.9)
Ischemic heart disease 400 18.3 (17.3–19.3)
Stroke 251 11.5 (10.9–12.1)
Lower-extremity amputation 108 5.0 (4.7–5.2)
Diabetic ketoacidosis 168 7.7 (7.3–8.1)
CI = confidence interval.Data source: United States Diabetes Surveillance System.
Emergency Department VisitsIn 2014, a total of 14.2 million emergency department visits were reported with diabetes as any listed diagnosis among adults aged 18 years or older (Table 5), including:
• 245,000 for hypoglycemia (11.2 per 1,000 persons with diabetes).
• 207,000 for hyperglycemic crisis (9.5 per 1,000 persons with diabetes).

10 | National Diabetes Statistics Report, 2017
Table 5. Number and rate of emergency department visits among adults aged ≥18 years with diagnosed diabetes, United States, 2014
Cause of emergency department visit No. in thousands Crude rate per 1,000 persons with diabetes (95% CI)
Diabetes as any listed diagnosis 14,192 648.9 (600.9–696.9)
Hypoglycemia 245 11.2 (10.4–12.1)
Hyperglycemic crisis 207 9.5 (8.8–10.2)
CI = confidence interval. Data source: United States Diabetes Surveillance System.
Kidney Disease• Among U.S. adults aged 20 years or older with diagnosed diabetes, the estimated crude prevalence of chronic
kidney disease (stages 1–4) was 36.5% (95% CI, 32.2%–40.8%) during 2011–2012.2
• Among those with diabetes and moderate to severe kidney disease (stage 3 or 4), 19.4% (95% CI, 15.5%–23.2%)were aware of their kidney disease during 1999–2012.3
• In 2014, a total of 52,159 people developed end-stage renal disease with diabetes as the primary cause. Adjustedfor age group, sex, and racial or ethnic group, the rate was 154.4 per 1 million persons.4
Deaths• Diabetes was the seventh leading cause of death in the United
States in 2015. This finding is based on 79,535 death certificatesin which diabetes was listed as the underlying cause of death(crude rate, 24.7 per 100,000 persons).5
• Diabetes was listed as any cause of death on 252,806 deathcertificates in 2015 (crude rate, 78.7 per 100,000 persons).5
Cost• The total direct and indirect estimated cost of diagnosed
diabetes in the United States in 2012 was $245 billion.6
• Average medical expenditures for people with diagnoseddiabetes were about $13,700 per year. About $7,900 of thisamount was attributed to diabetes.6
• After adjusting for age group and sex, average medicalexpenditures among people with diagnosed diabetes wereabout 2.3 times higher than expenditures for people withoutdiabetes.6

National Diabetes Statistics Report, 2017 | 11
AcknowledgmentsThe following organizations provided content and helped compile data for this report:
• Centers for Disease Control and Prevention, National Center for Chronic Disease Prevention and Health Promotion, Division of Diabetes Translation
• Indian Health Service, Division of Diabetes Treatment and Prevention
• National Institutes of Health, National Institute of Diabetes and Digestive and Kidney Diseases
The following organizations collaborated on the content of this report:
• American Diabetes Association
• JDRF
References1. Mayer-Davis EJ, Lawrence JM, Dabelea D, et al. Incidence trends of type 1 and type 2 diabetes among youths, 2002–2012.
N Engl J Med. 2017;376:1419–1429.
2. Murphy D, McCulloch CE, Lin F, et al. Trends in prevalence of chronic kidney disease in the United States. Ann Intern Med. 2016;165:473–481.
3. Centers for Disease Control and Prevention. Chronic Kidney Disease (CKD) Surveillance Project website. https://nccd.cdc.gov/CKD/default.aspx. Accessed June 16, 2017.
4. United States Renal Data System. 2016 USRDS Annual Data Report: Epidemiology of Kidney Disease in the United States. Bethesda, MD: National Institute of Diabetes and Digestive and Kidney Diseases, National Institutes of Health; 2016.
5. Centers for Disease Control and Prevention. About Underlying Cause of Death 1999–2015. CDC WONDER Database. http://wonder.cdc.gov/ucd-icd10.html. Updated December 2016. Accessed April 4, 2017.
6. American Diabetes Association. Economic costs of diabetes in the U.S. in 2012. Diabetes Care. 2013;36(4):1033–1046.
Suggested CitationCenters for Disease Control and Prevention. National Diabetes Statistics Report, 2017. Atlanta, GA: Centers for Disease Control and Prevention, U.S. Dept of Health and Human Services; 2017.

12 | National Diabetes Statistics Report, 2017
AppendixDetailed TablesThis section provides additional data for Tables 1–3, Figure 1, and the High Cholesterol (Hyperlipidemia) section under Risk Factors for Complications of the National Diabetes Statistics Report, 2017.
Table 1a. Age-adjusted prevalence of diagnosed and undiagnosed diabetes among adults aged ≥18 years, United States, 2011–2014
Characteristic Diagnosed diabetes Percentage (95% CI)
Undiagnosed diabetes Percentage (95% CI)
Total Percentage (95% CI)
Total 8.7 (8.1–9.4) 2.7 (2.3–3.3) 11.5 (10.7–12.4)
Sex
Women 8.5 (7.5–9.5) 2.3 (1.8–3.1) 10.8 (9.8–11.9)
Men 9.1 (8.4–9.9) 3.2 (2.4–4.3) 12.3 (11.3–13.4)
Race/Ethnicity
Asian, non-Hispanic 10.3 (8.6–12.4) 5.7 (4.0–8.2) 16.0 (13.6–18.9)
Black, non-Hispanic 13.4 (12.2–14.6) 4.4 (3.0–6.2) 17.7 (15.8–19.9)
Hispanic 11.9 (10.3–13.7) 4.5 (3.2–6.2) 16.4 (14.1–18.9)
White, non-Hispanic 7.3 (6.6–8.1) 2.0 (1.5–2.6) 9.3 (8.4–10.2)
Education
Less than high school 11.4 (9.9–13.1) 4.1 (3.0–5.6) 15.5 (13.5–17.7)
High school 10.3 (8.8–12.0) 3.2 (2.4–4.2) 13.5 (11.9–15.2)
More than high school 7.4 (6.6–8.4) 2.2 (1.6–3.0) 9.6 (8.6–10.7)
CI = confidence interval.Data source: 2011–2014 National Health and Nutrition Examination Survey.
Table 1b. Estimated prevalence of diagnosed diabetes among the total population and among children and adolescents, United States, 2015
Characteristic No. (95% CI) Percentage (95% CI)
Total 23,131,000 (22,555,000–23,706,000) 7.20 (7.02–7.38)
Age in years
<18 132,000 (92,000–172,000) 0.18 (0.13–0.24)
<20 193,000 (140,000–246,000) 0.24 (0.18–0.31)
CI = confidence interval.Note: Data rounded to nearest thousand and not age-adjusted.Data source: 2013–2015 National Health Interview Survey and 2015 U.S. Census Bureau data.

National Diabetes Statistics Report, 2017 | 13
Table 1c. Age-adjusted prevalence of diagnosed diabetes by race/ethnicity, education level, and sex among adults aged ≥18 years, United States, 2013–2015
Characteristic Total Percentage (95% CI)
Men Percentage (95% CI)
Women Percentage (95% CI)
Race/Ethnicity
American Indian/Alaska Native 15.1 (15.0–15.2) 14.9 (14.8–15.0) 15.3 (15.2–15.3)
Asian, non-Hispanic, overall 8.0 (7.3–8.9) 9.0 (7.6–10.5) 7.3 (6.4 –8.3)
Asian Indian 11.2 (9.1–13.7) 12.2 (9.1–16.2) 10.0 (7.4–13.3)
Chinese 4.3 (3.2–5.9) 6.2 (4.1–9.1) 2.8 (1.8–4.4)
Filipino 8.9 (7.4–10.8) 9.1 (6.8–11.9) 8.9 (7.1–11.2)
Other Asian 8.5 (7.1–10.0) 8.9 (6.9–11.4) 8.2 (6.5–10.2)
Black, non-Hispanic 12.7 (12.1–13.4) 12.2 (11.3–13.1) 13.2 (12.4–14.0)
Hispanic, overall 12.1 (11.4–12.7) 12.6 (11.6–13.5) 11.7 (10.9–12.5)
Central/South American 8.5 (7.3–10.0) 8.5 (6.6–10.8) 8.8 (7.2–10.7)
Cuban 9.0 (7.1–11.4) 11.6 (8.0–16.5) 5.9 (3.7–9.3)
Mexican 13.8 (13.0–14.8) 14.2 (12.9–15.7) 13.5 (12.5–14.7)
Puerto Rican 12.0 (10.5–13.7) 12.2 (10.0–14.9) 11.8 (9.8–14.1)
White, non-Hispanic 7.4 (7.2–7.6) 8.1 (7.8–8.5) 6.8 (6.5–7.1)
Education
Less than high school 12.6 (11.9–13.2) 12.2 (11.3–13.1) 13.0 (12.2–13.9)
High school 9.5 (9.1–10.0) 10.1 (9.5–10.8) 9.2 (8.6–9.8)
More than high school 7.2 (7.0–7.5) 7.9 (7.5–8.3) 6.6 (6.3–6.9)
CI = confidence interval.Data source: 2013–2015 National Health Interview Survey, except American Indian/Alaska Native data, which were from the 2015 Indian Health Service National Data Warehouse.
Table 2a. Age-adjusted incidence of diagnosed diabetes among adults aged ≥18 years, United States, 2013–2015
Characteristic Rate per 1,000 (95% CI)
Race/Ethnicity
Asian, non-Hispanic 6.0 (4.2–8.6)
Black, non-Hispanic 9.0 (7.4–10.9)
Hispanic 8.4 (7.2–9.8)
White, non-Hispanic 5.7 (5.0–6.4)
Education
Less than high school 10.4 (8.8–12.4)
High school 7.8 (6.6–9.2)
More than high school 5.3 (4.7–5.9)
CI = confidence interval.Data source: 2013–2015 National Health Interview Survey and 2015 U.S. Census Bureau data.

14 | National Diabetes Statistics Report, 2017
Table 3a. Age-adjusted prevalence of prediabetes among adults aged ≥18 years, United States, 2011–2014
Characteristic Percentage with prediabetes (95% CI)
Percentage reporting awareness of prediabetes (95% CI)
Total 33.0 (30.6–35.5) 10.6 (9.0–12.6)
Sex
Women 29.3 (26.8–31.8) 13.3 (10.0–17.4)
Men 36.6 (33.2–40.0) 8.9 (6.2–12.4)
Race/Ethnicity
Asian, non-Hispanic 35.7 (33.0–38.5) 9.0 (5.9–13.6)
Black, non-Hispanic 36.3 (33.3–39.4) 10.5 (7.9–13.9)
Hispanic 31.7 (28.4–35.2) 7.5 (4.4–12.5)
White, non-Hispanic 31.5 (28.3–34.9) 11.3 (8.9–14.1)
Education
Less than high school 37.6 (33.2–42.3) 9.3 (6.7–12.9)
High school 37.0 (33.8–40.3) 12.4 (8.0–18.8)
More than high school 30.4 (27.6-33.4) 10.4 (8.2–13.0)
CI = confidence interval.Note: Percentage reporting awareness is a subset of adults with prediabetes.Data source: 2011–2014 National Health and Nutrition Examination Survey.
Table 4a. Rates of eligibility for statin therapy and treatment with lipid-lowering medication by cardiovascular disease prevention stage among adults aged ≥21 years with diagnosed diabetes, United States, 2011–2014
Cardiovascular disease prevention stage
Percentage (95% CI) of adults who were eligible for statin therapy
Among eligible adults, percentage (95% CI) on lipid-lowering therapy
Primarya 75.2 (68.7–80.8) 58.2 (49.7–66.3)
Secondaryb 23.3 (18.9–28.3) 66.9 (58.5–74.4)
CI = confidence interval.a Defined as adults aged 40–75 years with no self-reported cardiovascular disease or adults aged 21–39 years with no self-reported cardiovascular disease and a low-density lipoprotein cholesterol level ≥190 mg/dL, according to 2013 guidelines from the American College of Cardiology and American Heart Association.b Defined as adults with self-reported cardiovascular disease, according to 2013 guidelines from the American College of Cardiology and American Heart Association.Data source: 2011–2014 National Health and Nutrition Examination Survey.

National Diabetes Statistics Report, 2017 | 15
Data Sources and Methods This section provides additional details about data sources and methods used in the National Diabetes Statistics Report, 2017.
Prevalence of Both Diagnosed and Undiagnosed Diabetes Among People of All Ages, United States, 2015 Data Sources
• 2011–2014 National Health and Nutrition Examination Survey (NHANES), National Center for Health Statistics, Centers for Disease Control and Prevention.
• 2013–2015 National Health Interview Survey (NHIS), National Center for Health Statistics, Centers for Disease Control and Prevention.
• Annual Estimates of the Resident Population by Single Year of Age and Sex for the United States: April 1, 2010 to July 1, 2015, Population Division, U.S. Census Bureau.
Methods The total number of people with diabetes is the sum of the number of those aged 18 years or older with diagnosed or undiagnosed diabetes and the number of those younger than age 18 years with diagnosed diabetes. Estimates of undiagnosed diabetes for children and adolescents younger than age 18 years are not available. The 2011–2014 NHANES was used to calculate the percentage of adults aged 18 years or older with diagnosed and undiagnosed diabetes (see next section for detail). The 2013–2015 NHIS was used to calculate the percentage of children and adolescents younger than 18 years with diagnosed diabetes. These percentages were then applied to the corresponding July 1, 2015 U.S. resident population estimates from the U.S. Census Bureau to derive the total number of people with diabetes.
Applying 2011–2014 NHANES estimates to the 2015 U.S. resident population estimates has limitations. This methodology assumes that the prevalence of diabetes in 2015 was the same as it was in earlier periods (2011–2014) and that the prevalence of diabetes in the resident population was identical to those in the civilian, noninstitutionalized population (from NHANES). Deviations from these assumptions may result in overestimated or underestimated numbers and rates.
Prevalence of Both Diagnosed and Undiagnosed Diabetes Among Adults Aged 18 Years or Older, United States, 2015 Data Sources
• 2011–2014 National Health and Nutrition Examination Survey (NHANES), National Center for Health Statistics, Centers for Disease Control and Prevention.
• Annual Estimates of the Resident Population by Single Year of Age and Sex for the United States: April 1, 2010 to July 1, 2015, Population Division, U.S. Census Bureau.
Methods The percentage of adults aged 18 years or older with diabetes (diagnosed or undiagnosed) was obtained using 2011–2014 NHANES data. People who self-reported being told by a doctor or health professional that they had diabetes (other than during pregnancy) were classified as having diagnosed diabetes. Those not reporting a history of diagnosed diabetes but who had either a fasting plasma glucose greater than or equal to 126 mg/dl or an A1C level greater than or equal to 6.5% were classified as having undiagnosed diabetes. For consistency with earlier

16 | National Diabetes Statistics Report, 2017
estimates, fasting glucose values were adjusted using recommended regression equations. People with missing values for either fasting glucose or A1C and pregnant women were excluded. People with diagnosed diabetes from the interviewed sample were combined with people with undiagnosed diabetes from the fasting plasma glucose subsample. Appropriate sampling weights were used so that the sum of the weights added to the total U.S. population.
The age-specific percentages of diagnosed and undiagnosed diabetes for age groups 18–44, 45–64, and 65 years or older were then applied to the corresponding July 1, 2015 U.S. resident population estimates from the U.S. Census Bureau to derive the age-specific numbers of adults with diagnosed and undiagnosed diabetes. These age-specific numbers of adults were added to obtain the estimated total number of adults with diagnosed and undiagnosed diabetes. The same procedure was used to obtain the total number of adults with diagnosed and undiagnosed diabetes by sex. Age-adjusted percentages of diagnosed and undiagnosed diabetes were calculated among adults aged 18 years or older by sex, race/ethnicity, and education level by the direct method to the 2000 U.S. Census standard population, using age groups 18–44, 45–64, and 65 years or older.
Prevalence of Diagnosed Diabetes, United States, 2015 Data Sources
• 2013–2015 National Health Interview Survey (NHIS), National Center for Health Statistics, Centers for Disease Control and Prevention.
• Annual Estimates of the Resident Population by Single Year of Age and Sex for the United States: April 1, 2010 to July 1, 2015, Population Division, U.S. Census Bureau.
Methods The percentage of people with diagnosed diabetes was obtained from 2013–2015 NHIS data. Information on diagnosed diabetes (other than during pregnancy) was obtained from a knowledgeable adult family member residing in the household for children and adolescents younger than age 18 years and was self-reported for people aged 18 years or older. The estimate of diagnosed diabetes was applied to the July 1, 2015 U.S. resident population estimates from the U.S. Census Bureau to derive the number of people with diagnosed diabetes for all age groups and for children and adolescents younger than age 18 years and age 20 years.
No validated method exists to distinguish between types of diabetes in surveys. The proportion of type 1 diabetes was estimated from findings reported in the following journal articles:
• Dall TM, Mann SE, Zhang Y, et al. Distinguishing the economic costs associated with type 1 and type 2 diabetes. Popul Health Manag. 2009;12:103–110.
• Fitch K, Weisman T, Engel T, et al. Longitudinal commercial claims-based cost analysis of diabetic retinopathy screening patterns. Am Health Drug Benefits. 2015;8(6):300–308.
• Johnson JA, Pohar SL, Majumdar SR. Health care use and costs in the decade after identification of type 1 and type 2 diabetes: a population-based study. Diabetes Care. 2006;29:2403–2408.
• Menke A, Orchard TJ, Imperatore G, Bullard KM, Mayer-Davis E, Cowie CC. The prevalence of type 1 diabetes in the United States. Epidemiology. 2013;24(5):773–774.
• Ng E, Dasgupta K, Johnson JA. An algorithm to differentiate diabetic respondents in the Canadian Community Health Survey. Health Rep. 2008;19:71–79.

National Diabetes Statistics Report, 2017 | 17
Prevalence of Diagnosed Diabetes by Race/Ethnicity Among Adults Aged 18 Years or Older, United States, 2013–2015 Data Sources
• 2013–2015 National Health Interview Survey (NHIS), National Center for Health Statistics, Centers for Disease Control and Prevention.
• National Data Warehouse (NDW), Indian Health Service (IHS).
Methods With the exception of American Indian/Alaska Native (AI/AN) people, who are not well-represented in national surveys because of small population size, race/ethnicity-specific estimates of diagnosed diabetes by sex were calculated using 2013–2015 NHIS data. Adults aged 18 years or older who self-reported being told by a doctor or health professional that they had diabetes were classified as having diagnosed diabetes. The estimate of diagnosed diabetes for Native Hawaiians and Other Pacific Islanders was not included because of small sample size.
Prevalence of diagnosed diabetes among AI/AN people was calculated using fiscal year 2015 data from the IHS NDW. This data system includes patient registration and encounter data that are received from IHS facilities, tribally operated programs, and urban and contract health systems (I/T/U). These health care facilities serve about 2.2 million AI/AN people who belong to 567 federally recognized tribes in 36 states. Data for active patients (i.e., those with at least one visit to an I/T/U facility during the preceding 3 years) aged 18 years or older were used to calculate these estimates. Diabetes cases among these patients were identified using International Classification of Diseases, Ninth Revision, Clinical Modification (ICD-9-CM) diagnostic codes 250.0–250.93 from patient visit data. Patients were considered to have a diagnosis of diabetes if they had at least two visits with an ICD 250 diagnosis code reported during fiscal year 2015. Estimates may not be comparable because of differences in the methods used to define diabetes in NHIS and IHS NDW.
Percentages for all U.S. racial and ethnic groups estimated using NHIS and IHS NDW data were age-adjusted, using age groups 18−44, 45−64, and 65 years or older, by the direct method to the 2000 U.S. Census standard population.
County-Level Prevalence and Incidence of Diagnosed Diabetes Among Adults Aged 20 Years or Older, United States, 2013Data Sources
• 2012–2014 Behavioral Risk Factor Surveillance System (BRFSS), National Center for Chronic Disease Prevention and Health Promotion, Centers for Disease Control and Prevention.
• Annual Estimates of the Resident Population for Selected Age Groups by Sex for the United States, States, Counties, and Puerto Rico Commonwealth and Municipios: April 1, 2010 to July 1, 2014, Population Division, U.S. Census Bureau.
• United States Diabetes Surveillance System (USDSS), National Center for Chronic Disease Prevention and Health Promotion, Centers for Disease Control and Prevention.
MethodsData from the BRFSS and the U.S. Census Bureau’s Population Estimates Program were used to obtain county-level estimates of prevalence and incidence of diagnosed diabetes among adults aged 20 years or older. Three years of data were used to improve the precision of the estimates. For 2013, BRFSS survey data for 2012, 2013, and 2014 were used. County-level estimates for the over 3,200 counties or county equivalents (e.g., parish, borough, municipality) in the 50 U.S. states, Puerto Rico, and the District of Columbia were based on indirect model-dependent estimates using Bayesian multilevel modeling techniques. This model-dependent approach uses a statistical model that “borrows strength” in making an estimate for one county from BRFSS data collected in other

18 | National Diabetes Statistics Report, 2017
counties. Multilevel Poisson regression models with random effects of demographic variables (age groups 20–44, 45–64, and 65 years or older; race; and sex) at the county level were developed. State was included as a county-level covariate. Rates were age adjusted to the 2000 U.S. Census standard population using age groups 20–44, 45–64, and 65 years or older. More detailed methods are available online at www.cdc.gov/diabetes/pdfs/data/calculating-methods-references-county-level-estimates-ranks.pdf. Maps and data are posted on the USDSS website.
Incidence of Diagnosed Diabetes Among Adults Aged 18 Years or Older, United States, 2015 Data Sources
• 2013–2015 National Health Interview Survey (NHIS), National Center for Health Statistics, Centers for Disease Control and Prevention.
• 2011–2014 National Health and Nutrition Examination Survey (NHANES), National Center for Health Statistics, Centers for Disease Control and Prevention.
• Annual Estimates of the Resident Population by Single Year of Age and Sex for the United States: April 1, 2010 to July 1, 2015, Population Division, U.S. Census Bureau.
MethodsThe rate of new cases of diabetes was calculated using 2013–2015 NHIS data on respondents’ age at diagnosis and age at interview. Adults who reported being diagnosed with diabetes were asked at what age they were diagnosed. The number of years since diagnosis was calculated by subtracting the person’s age at diagnosis from the person’s current age. Adults who had a value of zero were identified as having been diagnosed with diabetes within the last year. In addition, half of the adults who had a value of one were classified as having been diagnosed within the last year. To calculate the rate, the numerator included the number of adults who were diagnosed with diabetes within the last year. The denominator was the estimate of the adult population, excluding those who had been diagnosed for more than 1 year and those who were categorized on the NHIS as “refused” or “don’t know” or who had missing values on the diabetes status question.
To estimate the number of new cases of diabetes for adults in each age group in 2015, the age-specific rates of new cases from NHIS were applied to the corresponding July 1, 2015 U.S. resident population estimates from the U.S. Census Bureau after excluding the number of adults who had been diagnosed with diabetes for more than 1 year, estimated from NHANES. Age-adjusted incidence of diagnosed diabetes was calculated among adults aged 18 years or older by race/ethnicity and education level by the direct method to the 2000 U.S. Census standard population, using age groups 18–44, 45–64, and 65 years or older.
Prevalence of Prediabetes Among People Aged 18 Years or Older, United States, 2015 Data Sources
• 2011–2014 National Health and Nutrition Examination Survey (NHANES), National Center for Health Statistics, Centers for Disease Control and Prevention.
• Annual Estimates of the Resident Population by Single Year of Age and Sex for the United States: April 1, 2010 to July 1, 2015, Population Division, U.S. Census Bureau.
Methods The percentage of adults aged 18 years or older with prediabetes was estimated using 2011–2014 NHANES data. People without diabetes were classified as having prediabetes if they had fasting plasma glucose values of 100 to 125 mg/dL or A1C values of 5.7% to 6.4%. For consistency with earlier estimates, fasting glucose values were

National Diabetes Statistics Report, 2017 | 19
adjusted using recommended regression equations. People with missing values for either fasting glucose or A1C and pregnant women were excluded. The age-specific percentages of prediabetes for age groups 18–44, 45–64, and 65 years or older were then applied to the corresponding July 1, 2015 U.S. resident population estimates from the U.S. Census Bureau to derive the age-specific numbers of adults with prediabetes. These age-specific numbers of adults were added to obtain the estimated total number of adults with prediabetes. The same method was used for sex-specific numbers.
In addition, age-adjusted percentages were calculated by sex, race/ethnicity (non-Hispanic white, non-Hispanic black, Hispanic, and Asian), and education level. Age adjustment was done with age groups 18−44, 45−64, and 65 years or older by the direct method to the 2000 U.S. Census standard population. Among those who tested positive for prediabetes, awareness was defined as (1) answered “yes” to the question, “Have you ever been told by a doctor or other health professional that you have any of the following: prediabetes, impaired fasting glucose, impaired glucose tolerance, borderline diabetes or that your blood sugar is higher than normal but not high enough to be called diabetes or sugar diabetes?” or (2) reported having prediabetes when asked whether they had diabetes.
Reference American Diabetes Association. Classification and diagnosis of diabetes. Diabetes Care. 2017;40(suppl 1):S11–S24.
Risk Factors for Complications Among Adults Aged 18 Years or Older with Diagnosed Diabetes, United States, 2011–2014Data Source
• 2011–2014 National Health and Nutrition Examination Survey (NHANES), National Center for Health Statistics, Centers for Disease Control and Prevention.
MethodsSmokingThe percentage of adults aged 18 years or older with diagnosed diabetes who had a history of smoking was estimated on the basis of self-reported current smoking or a history of smoking at least 100 cigarettes in a lifetime.
ObesityThe percentage of adults aged 18 years or older with diagnosed diabetes who were overweight or obese was estimated on the basis of a measured body mass index (BMI) of 25.0 to less than 30.0 kg/m2 (overweight), 30.0 to less than 40.0 kg/m2 (obese), or 40.0 kg/m2 or higher (severely obese).
Physical InactivityThe percentage of adults aged 18 years or older with diagnosed diabetes who were physically inactive was estimated on the basis of self-report of less than 10 minutes per week of moderate or vigorous activity in each of the physical activity categories of work, leisure time, and transportation.
High Blood Pressure The percentage of adults aged 18 years or older with diagnosed diabetes who had high blood pressure was estimated on the basis of the average measured systolic blood pressure of 140 mm Hg or higher or the average diastolic blood pressure of 90 mm Hg or higher or self-reported current use of prescription medication for high blood pressure.
High Cholesterol (Hyperlipidemia)The percentage of adults aged 21 years or older with diagnosed diabetes who were eligible for and being treated with a statin was estimated on the basis of the 2013 cholesterol guidelines from the American College of Cardiology and American Heart Association. People with diabetes who were eligible for primary prevention statin therapy were

20 | National Diabetes Statistics Report, 2017
defined as those aged 40 to 75 years with no history of cardiovascular disease or those aged 21 to 39 years with no history of cardiovascular disease and a low-density lipoprotein cholesterol level of 190 mg/dL or higher. People with diabetes and cardiovascular disease were eligible for secondary prevention statin therapy.
High Blood Glucose (Hyperglycemia) The percentage of adults aged 18 years or older with diagnosed diabetes who had high blood glucose was estimated on the basis of an A1C value higher than 9%.
Coexisting Conditions and Complications Among Adults Aged 18 Years or Older with DiabetesData Sources
• 2014 National Inpatient Sample (NIS), Agency for Healthcare Research and Quality.
• 2014 Nationwide Emergency Department Sample (NEDS), Agency for Healthcare Research and Quality.
• 2013–2015 National Health Interview Survey (NHIS), National Center for Health Statistics, Centers for Disease Control and Prevention.
• Chronic Kidney Disease Surveillance System, Centers for Disease Control and Prevention.
• 2015 United States Renal Data System (USRDS) Annual Report.
MethodsThe number of hospitalizations for major cardiovascular diseases, lower-extremity amputation, and diabetic ketoacidosis in 2014 were calculated using NIS. The number of emergency department visits for hypoglycemia and hyperglycemic crisis in 2014 were calculated using NEDS. Crude rates were calculated using the proportion of the population with diabetes from NHIS. Prevalence data for chronic kidney disease awareness were from CDC’s Chronic Kidney Disease Surveillance System using NHANES data.