
Bulletin No 165 - Croatian National...
101
Year XVI • December 2010 165
Transcript of Bulletin No 165 - Croatian National...
Year XVI • December 2010
165


BULLETIN 165

PUBLISHER
Croatian National BankPublishing DepartmentTrg hrvatskih velikana 3, 10002 ZagrebPhone: +385 1 45 64 555Contact phone: +385 1 45 65 006Fax: +385 1 45 64 687
www.hnb.hr
Release dates are disseminated on the advance release calendar posted for Croatia on the IMF’s DSBB (http://dsbb.imf.org).Those using data from this publication are requested to cite the source.Any additional corrections that might be required will be made in the website version.
Printed in 450 copies
ISSN 1331-6028 (print)ISSN 1334-0050 (online)
Zagreb, December 2010
BULLETIN 165
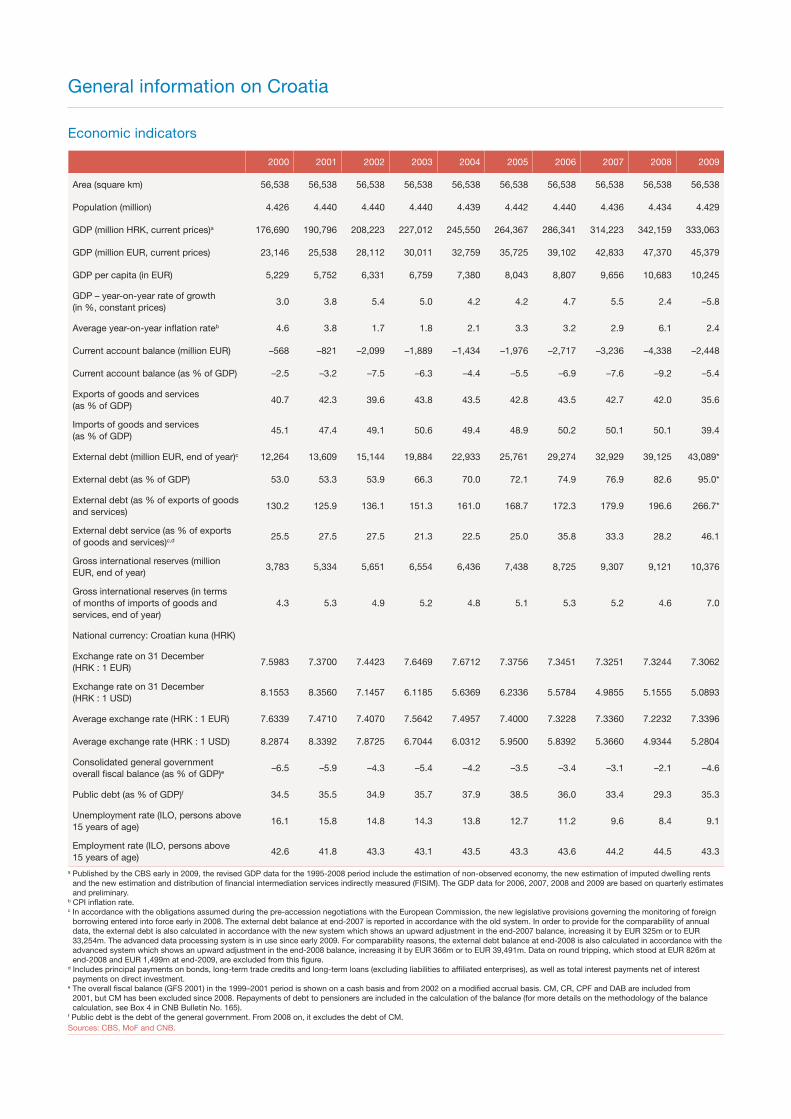
General information on Croatia
Economic indicators
2000 2001 2002 2003 2004 2005 2006 2007 2008 2009
Area (square km) 56,538 56,538 56,538 56,538 56,538 56,538 56,538 56,538 56,538 56,538
Population (million) 4.426 4.440 4.440 4.440 4.439 4.442 4.440 4.436 4.434 4.429
GDP (million HRK, current prices)a 176,690 190,796 208,223 227,012 245,550 264,367 286,341 314,223 342,159 333,063
GDP (million EUR, current prices) 23,146 25,538 28,112 30,011 32,759 35,725 39,102 42,833 47,370 45,379
GDP per capita (in EUR) 5,229 5,752 6,331 6,759 7,380 8,043 8,807 9,656 10,683 10,245
GDP – year-on-year rate of growth (in %, constant prices)
3.0 3.8 5.4 5.0 4.2 4.2 4.7 5.5 2.4 –5.8
Average year-on-year inflation rateb 4.6 3.8 1.7 1.8 2.1 3.3 3.2 2.9 6.1 2.4
Current account balance (million EUR) –568 –821 –2,099 –1,889 –1,434 –1,976 –2,717 –3,236 –4,338 –2,448
Current account balance (as % of GDP) –2.5 –3.2 –7.5 –6.3 –4.4 –5.5 –6.9 –7.6 –9.2 –5.4
Exports of goods and services (as % of GDP)
40.7 42.3 39.6 43.8 43.5 42.8 43.5 42.7 42.0 35.6
Imports of goods and services (as % of GDP)
45.1 47.4 49.1 50.6 49.4 48.9 50.2 50.1 50.1 39.4
External debt (million EUR, end of year)c 12,264 13,609 15,144 19,884 22,933 25,761 29,274 32,929 39,125 43,089*
External debt (as % of GDP) 53.0 53.3 53.9 66.3 70.0 72.1 74.9 76.9 82.6 95.0*
External debt (as % of exports of goods and services)
130.2 125.9 136.1 151.3 161.0 168.7 172.3 179.9 196.6 266.7*
External debt service (as % of exports of goods and services)c,d 25.5 27.5 27.5 21.3 22.5 25.0 35.8 33.3 28.2 46.1
Gross international reserves (million EUR, end of year)
3,783 5,334 5,651 6,554 6,436 7,438 8,725 9,307 9,121 10,376
Gross international reserves (in terms of months of imports of goods and services, end of year)
4.3 5.3 4.9 5.2 4.8 5.1 5.3 5.2 4.6 7.0
National currency: Croatian kuna (HRK)
Exchange rate on 31 December (HRK : 1 EUR)
7.5983 7.3700 7.4423 7.6469 7.6712 7.3756 7.3451 7.3251 7.3244 7.3062
Exchange rate on 31 December (HRK : 1 USD)
8.1553 8.3560 7.1457 6.1185 5.6369 6.2336 5.5784 4.9855 5.1555 5.0893
Average exchange rate (HRK : 1 EUR) 7.6339 7.4710 7.4070 7.5642 7.4957 7.4000 7.3228 7.3360 7.2232 7.3396
Average exchange rate (HRK : 1 USD) 8.2874 8.3392 7.8725 6.7044 6.0312 5.9500 5.8392 5.3660 4.9344 5.2804
Consolidated general government overall fiscal balance (as % of GDP)e
–6.5 –5.9 –4.3 –5.4 –4.2 –3.5 –3.4 –3.1 –2.1 –4.6
Public debt (as % of GDP)f 34.5 35.5 34.9 35.7 37.9 38.5 36.0 33.4 29.3 35.3
Unemployment rate (ILO, persons above 15 years of age)
16.1 15.8 14.8 14.3 13.8 12.7 11.2 9.6 8.4 9.1
Employment rate (ILO, persons above 15 years of age)
42.6 41.8 43.3 43.1 43.5 43.3 43.6 44.2 44.5 43.3
a Published by the CBS early in 2009, the revised GDP data for the 1995-2008 period include the estimation of non-observed economy, the new estimation of imputed dwelling rents and the new estimation and distribution of financial intermediation services indirectly measured (FISIM). The GDP data for 2006, 2007, 2008 and 2009 are based on quarterly estimates and preliminary.
b CPI inflation rate.c In accordance with the obligations assumed during the pre-accession negotiations with the European Commission, the new legislative provisions governing the monitoring of foreign
borrowing entered into force early in 2008. The external debt balance at end-2007 is reported in accordance with the old system. In order to provide for the comparability of annual data, the external debt is also calculated in accordance with the new system which shows an upward adjustment in the end-2007 balance, increasing it by EUR 325m or to EUR 33,254m. The advanced data processing system is in use since early 2009. For comparability reasons, the external debt balance at end-2008 is also calculated in accordance with the advanced system which shows an upward adjustment in the end-2008 balance, increasing it by EUR 366m or to EUR 39,491m. Data on round tripping, which stood at EUR 826m at end-2008 and EUR 1,499m at end-2009, are excluded from this figure.
d Includes principal payments on bonds, long-term trade credits and long-term loans (excluding liabilities to affiliated enterprises), as well as total interest payments net of interest payments on direct investment.
e The overall fiscal balance (GFS 2001) in the 1999–2001 period is shown on a cash basis and from 2002 on a modified accrual basis. CM, CR, CPF and DAB are included from 2001, but CM has been excluded since 2008. Repayments of debt to pensioners are included in the calculation of the balance (for more details on the methodology of the balance calculation, see Box 4 in CNB Bulletin No. 165).
f Public debt is the debt of the general government. From 2008 on, it excludes the debt of CM.Sources: CBS, MoF and CNB.
Contents
Information on economic trends and forecasts
1 Summary 3
2 Developments in the environment 5International environment 5Croatia’s main trading partners 6Exchange rates and price developments 7
3 Aggregate demand and supply 7Aggregate demand 7Aggregate supply 10Box 1 Forecast risks presented in the form of a fan chart 11
4 Labour market 12
5 Inflation 13
6 Foreign trade and competitiveness 15Box 2 Improvement of the methodology for calculating
effective kuna exchange rates 17
7 Financing conditions and capital flows 19Financing conditions 19Foreign capital flows 21
8 Monetary policy 25Box 3 How much is the domestic economy burdened by
foreign borrowing costs? 23
9 Public finance 27Revenues, expenditures and transactions in non-financial
assets of general government 27Consolidated general government deficit and debt 28Box 4 Measures of Croatia’s fiscal balance 29
10 Models used to prepare estimated and/or projected values 30
Statical survey
Classification and presentation of data on claims and liabilities 35A Monetary and credit aggregates 36Table A1 Monetary and credit aggregates 36
B Monetary institutions 37Table B1 Monetary survey 37Table B2 Number of reporting banks and savings banks and their
classification by total assets 38
C Monetary authorities 39Table C1 Monetary authorities accounts 39
D Banks 41Table D1 Banks’ accounts 41Table D2 Banks’ foreign assets 42Table D3 Banks’ claims on the central government and funds 43Table D4 Banks’ claims on other domestic sectors 43Table D5 Distribution of banks’ loans by domestic institutional
sectors 44
Table D6 Demand deposits with banks 44Table D7 Time and savings deposits with banks 45Table D8 Foreign currency deposits with banks 45Table D9 Bonds and money market instruments 46Table D10 Banks’ foreign liabilities 46Table D11 Central government and funds’ deposits with banks 47Table D12 Restricted and blocked deposits with banks 47
E Housing savings banks 49Table E1 Housing savings banks’ accounts 49
F Monetary policy instruments and liquidity 50Table F1 Credit rates of the Croatian National Bank 50Table F2 Deposit rates of the Croatian National Bank 51Table F3 Banks’ reserve requirements 52Table F4 Banks’ liquidity indicators 53
G Financial markets 54Table G1 Banks’ interest rates on kuna credits not indexed to
foreign currency 54Table G2 Banks’ interest rates on kuna credits indexed to foreign
currency and on credits in euros 55Table G3 Banks’ interest rates on kuna deposits not indexed to
foreign currency 56Table G4a Banks’ interest rates on kuna deposits indexed to
foreign currency and on foreign currency deposits 57Table G4b Banks’ interest rates on kuna deposits indexed to
foreign currency and on foreign currency deposits 58Table G5 Banks’ trade with foreign exchange 59
H International economic relations 60Table H1 Balance of payments – summary 60Table H2 Balance of payments – goods and services 61Table H3 Balance of payments – income and current transfers 62Table H4 Balance of payments – direct and portfolio invstments 63Table H5 Balance of payments – other investment 64Table H6 Balance of payments – summary 66Table H7 International reserves and banks’ foreign currency
reserves 67Table H8 International reserves and foreign currency liquidity 68Table H9 Midpoint exchange rates of the Croatian National
Bank (period average) 70Table H10 Midpoint exchange rates of the Croatian National
Bank (end of period) 71Table H11 Indices of the effective exchange rate of the kuna 72Table H12 Gross external debt by domestic sectors 73Table H13 Public sector gross external debt, and publicly
guaranteed and non-publicly guaranteed private sector gross external debt 75
Table H14 Gross external debt by domestic sectors and projected future payments 76
Table H15 Gross external debt by other sectors 78Table H16 International investment position – summary 80Table H17 International investment position – direct investment 81Table H18 International investment position – portfolio
investment 81Table H19 International investment position – other investment 82
I Government finance – selected data 83Table I1 Consolidated central government according to the
government level 83

Table I2 Budgetary central government operations 84Table I3 Central government debt 85
J Non-financial statistics – selected data 86Table J1 Consumer price and producer price indices 86Table J2 Core consumer price indices 87Table J3 Average monthly net wages 87
Table J4 Consumer confidence index, consumer expectations index and consumer sentiment index 88
List of banks and savings banks 89Management of the Croatian National Bank 90Abbreviations and symbols 91
Information on economic trends and forecasts


CNB BULELTIN • INFORMATION ON ECONOMIC TRENDS AND FORECASTS • NUMBER 165 • 1 SUMMARY 3
After falling for eight consecutive quarters, real GDP started to grow only in the third quarter of 2010, lagging considerably behind the recovery in trading partners. Economic growth in 2010, particularly in Germany, noticeably exceeded expectations, positively af-fecting European economies with exports oriented to the German market. The growth was aided by historically low benchmark rates in the eurozone and the US. Nevertheless, the financial terms for some eurozone countries and most Central and Eastern European coun-tries have remained much harsher than before the eruption of the global crisis. Available macroeconomic forecasts suggest that the gradual global recovery will continue, but also that the recovery will be the slowest in the eurozone. Central bank interest rates are expect-ed to stay low, which will provide a boost to economic activity in 2011. However, uncertain-ties remain high, particularly in view of fiscal sustainability problems in several eurozone countries.
With the recovery of the global economy and international trade under way, develop-ments in the Croatian economy were influenced primarily by a strong upturn in exports. Af-ter a plunge in the first quarter of 2010, domestic demand recorded slightly more favourable trends in the remainder of the year. This is why estimates say that aggregate demand could record an increase in the second half of 2010 after a two-year downturn. Nevertheless, a 1.5% GDP decline is projected for the entire 2010 due to adverse developments in the first half of the year. A slight recovery in aggregate demand is expected to continue in 2011. As exports are still much below the pre-crisis level, their growth is expected to continue provided that the recovery in global trade continues at a similar pace. Within domestic de-mand, a marginal increase could be seen in investment, coupled with a continued recovery in personal consumption. Still, due to the low increase in projected disposable income and a mild growth in household loans, personal consumption growth could be weak. Investment growth will primarily come from the replacement of worn out fixed capital and the increase in inventories in the revival stage of the business cycle, while developments in construction will continue to exert a negative impact, due among other things to a large stock of unsold flats. The high corporate debt-to-equity ratio and excess capacities will also tend to slow down any rise in investment. Due to the high dependence on imports, the increase in ex-ports and the mentioned domestic demand components will trigger a gradual recovery of imports this year. In view of the small share of exports in GDP and the slow recovery of do-mestic demand, real GDP growth in 2011 is forecast at only 1.4%.
Labour market developments show that employers adjusted themselves to reduced pro-duction primarily by dismissing workers. In the first nine months of 2010, the number of employed persons fell sharply in all sectors apart from public administration, with construc-tion experiencing the largest number of jobs lost. The fall in the number of job vacancies also returned the unemployment rate to its high 2006 level. The fall in employment affected also wage developments, though with a time lag. Looking forward, since unit labour costs in Croatia grew faster than in trading partners in the pre-crisis years and since they are still relatively high, the projected economic growth is likely to boost employment only late in the year.
The current inflation rate is exceptionally low, due among other things to the slow recov-ery in personal consumption and the drop in unit labour costs. Statistics on import prices show that they also had a moderating impact on domestic inflation, despite the rise in raw material prices. Moreover, observing annualised monthly rates of change, the core CPI was mostly negative from mid-2009, while the overall CPI was positive due to the increase in energy prices. In light of the slow economic recovery and adverse conditions in the labour market, inflation should remain low. The average inflation rate is projected at 1.1% and 2.5% in 2010 and 2011 respectively. The rate increase actually implies that inflation should return to its normal level after being extremely low.
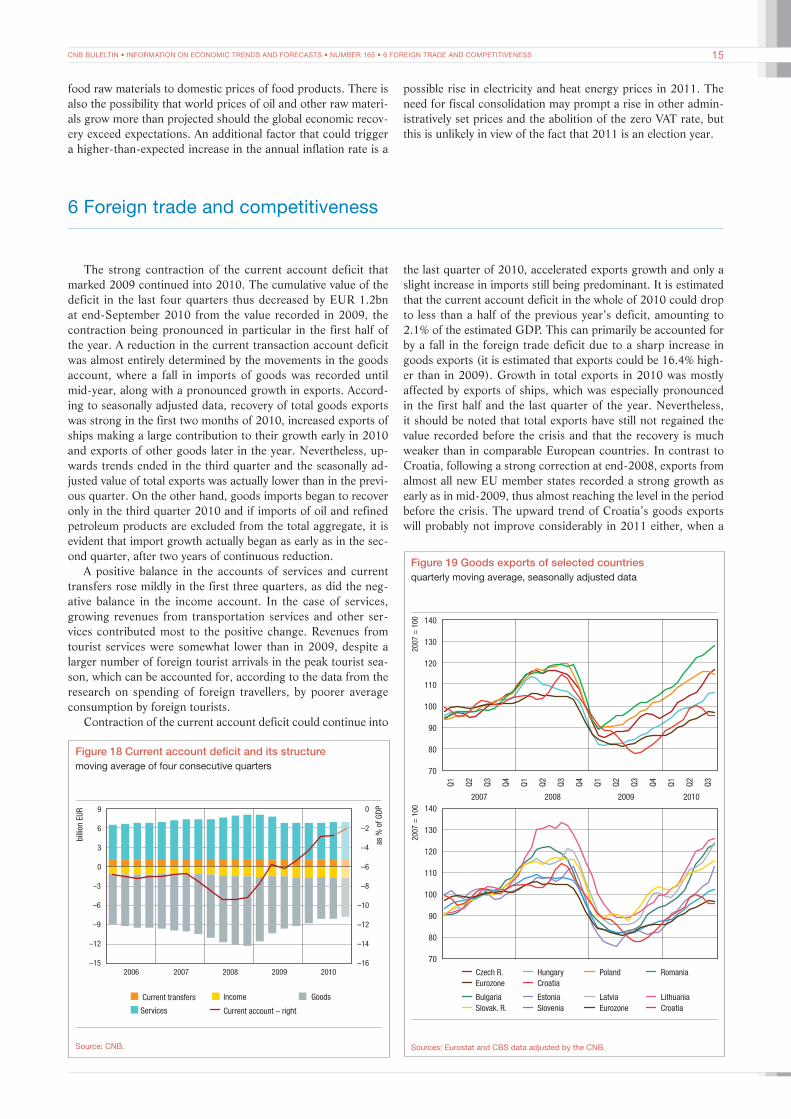
The contraction in the current account deficit began in 2009 and continued into 2010. This was largely due to developments in the goods account, which recorded a noticeable recovery in exports and an even sharper decline in imports. The sharpest growth in ex-ports was recorded by exports of other transport equipment (accounting for around 10% of total exports and mostly related to exports of ships). The forecast showing that exports will continue growing in 2011 is based on the assumption that state-owned shipyards will continue operating and deliver the ships ordered by foreign buyers. Imports are also pro-jected to grow more rapidly, due to imports of raw and production materials for export purposes, as well as imports of capital investment equipment. In such conditions, the cur-rent account deficit could widen slightly in 2011, but will probably stay below 3% of GDP, as in 2010.
The domestic economic recovery in the third quarter softened the fall in estimated Croatian real GDP for 2010.
A 1.4% economic growth is expected in 2011.
Unfavourable real developments had a profound impact on the labour market, which recorded declining employment and rising unemployment.
Real developments and labour market trends ease imported inflationary pressures and support low estimated inflation of 1.1% in 2010 and 2.5% expected in 2011.
The current account deficit has been reduced sharply.
1 Summary
CNB BULELTIN • INFORMATION ON ECONOMIC TRENDS AND FORECASTS • NUMBER 165 • 1 SUMMARY4
Although foreign borrowing costs decreased sharply in the last 18 months, bank inter-est rates fell only slightly. Corporate foreign financing has levelled off after growing slightly in the first half of 2010, when the bulk of foreign borrowing was accounted for by public enterprises.
As the banking system liquidity was very high, the overnight interest rate in the inter-bank market was constantly below 1% in the first eleven months of 2010. Nevertheless, the fall in bank interest rates was only marginal and came to a stop in the third quarter. The rise in bank placements was modest, particularly in the second half of the year. This rise was not spurred as much as expected by the special incentive measures of the government aimed at stimulating corporate lending, which provide for the government to shoulder part of the credit risk associated with new placements. In view of the comfortable level of inter-national reserves, CNB objectives will be similar in the forthcoming period – it will support the high liquidity of banks as long as it does not threaten the stability of the kuna/euro exchange rate, which is the main factor in the stability of prices and the overall banking system. Although it has turned out that banks will not be easily induced to increase lending, the economic recovery should result in renewed credit growth in 2011; in addition to cor-porate loans, banks could increase their lending to households.
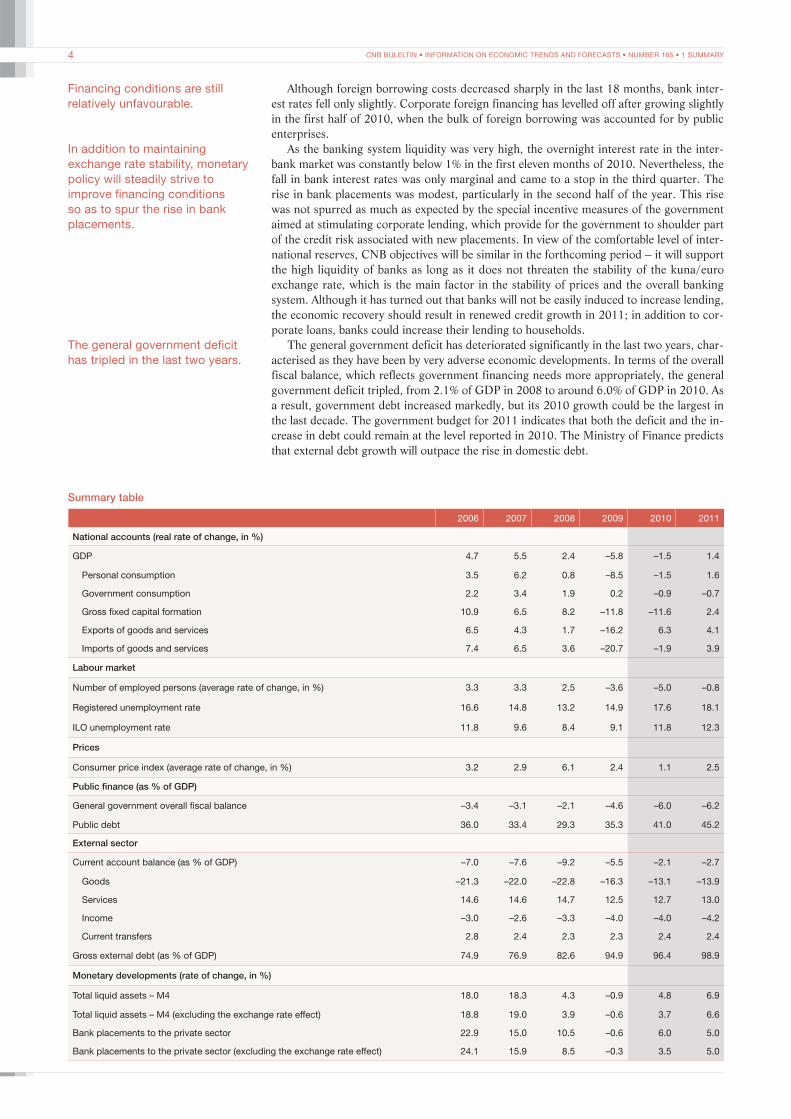
The general government deficit has deteriorated significantly in the last two years, char-acterised as they have been by very adverse economic developments. In terms of the overall fiscal balance, which reflects government financing needs more appropriately, the general government deficit tripled, from 2.1% of GDP in 2008 to around 6.0% of GDP in 2010. As a result, government debt increased markedly, but its 2010 growth could be the largest in the last decade. The government budget for 2011 indicates that both the deficit and the in-crease in debt could remain at the level reported in 2010. The Ministry of Finance predicts that external debt growth will outpace the rise in domestic debt.
In addition to maintaining exchange rate stability, monetary policy will steadily strive to improve financing conditions so as to spur the rise in bank placements.
The general government deficit has tripled in the last two years.
Summary table
2006 2007 2008 2009 2010 2011
National accounts (real rate of change, in %)
GDP 4.7 5.5 2.4 –5.8 –1.5 1.4
Personal consumption 3.5 6.2 0.8 –8.5 –1.5 1.6
Government consumption 2.2 3.4 1.9 0.2 –0.9 –0.7
Gross fixed capital formation 10.9 6.5 8.2 –11.8 –11.6 2.4
Exports of goods and services 6.5 4.3 1.7 –16.2 6.3 4.1
Imports of goods and services 7.4 6.5 3.6 –20.7 –1.9 3.9
Labour market
Number of employed persons (average rate of change, in %) 3.3 3.3 2.5 –3.6 –5.0 –0.8
Registered unemployment rate 16.6 14.8 13.2 14.9 17.6 18.1
ILO unemployment rate 11.8 9.6 8.4 9.1 11.8 12.3
Prices
Consumer price index (average rate of change, in %) 3.2 2.9 6.1 2.4 1.1 2.5
Public finance (as % of GDP)
General government overall fiscal balance –3.4 –3.1 –2.1 –4.6 –6.0 –6.2
Public debt 36.0 33.4 29.3 35.3 41.0 45.2
External sector
Current account balance (as % of GDP) –7.0 –7.6 –9.2 –5.5 –2.1 –2.7
Goods –21.3 –22.0 –22.8 –16.3 –13.1 –13.9
Services 14.6 14.6 14.7 12.5 12.7 13.0
Income –3.0 –2.6 –3.3 –4.0 –4.0 –4.2
Current transfers 2.8 2.4 2.3 2.3 2.4 2.4
Gross external debt (as % of GDP) 74.9 76.9 82.6 94.9 96.4 98.9
Monetary developments (rate of change, in %)
Total liquid assets – M4 18.0 18.3 4.3 –0.9 4.8 6.9
Total liquid assets – M4 (excluding the exchange rate effect) 18.8 19.0 3.9 –0.6 3.7 6.6
Bank placements to the private sector 22.9 15.0 10.5 –0.6 6.0 5.0
Bank placements to the private sector (excluding the exchange rate effect) 24.1 15.9 8.5 –0.3 3.5 5.0
Financing conditions are still relatively unfavourable.

5CNB BULELTIN • INFORMATION ON ECONOMIC TRENDS AND FORECASTS • NUMBER 165 • 2 DEVELOPMENTS IN THE ENVIRONMENT
It should be noted that the quantifications presented are central projections of individual macroeconomic aggregates, time series and/or their changes derived from available infor-mation and assumptions included in the projection.
Downside risks to economic growth are primarily associated with developments in for-eign demand, adverse financing conditions for enterprises and households and large needs for government financing. Instability in European financial markets has given rise to the fear that the sharp increase in risk premiums, which has affected peripheral eurozone econ-omies and strongly increased funding costs not only for governments but also for enter-prises in these economies, could spread to other European countries. Eventually, this could slow down economic growth in the countries that are Croatia’s trading partners. A less favourable international environment could retard the rise in Croatian exports and, bear-ing in mind that exports are projected to contribute most to real GDP growth, slow down the economic growth expected in 2011. In addition, bank interest rates on long-term loans decreased only slightly during the period when the CNB strove to spur bank lending. This suggests that banks have been hit hard by the deterioration of their credit portfolios and need time to adjust their lending policies to new circumstances. Against this background, lending dynamics could be an impediment to stronger economic growth. Finally, the down-side risk to economic growth is also associated with substantial government financial needs in 2011. If the government fails to obtain the planned amount of foreign loans, it may turn to the domestic financial market and crowd-out the private sector from the credit market.
The main risk of inflation arises primarily from a sharper growth in administratively set prices and raw material prices in the world market. Electricity and gas belong to the group of products whose prices are controlled by the government. The government should, but seems reluctant to, adjust their prices to market levels in 2011. The tax burden on products that may be zero VAT rated until EU accession is unlikely to increase. With regard to raw material prices in the world market, one should remember that prices of food products and metals grew sharply in 2010. The rise in raw material prices has not yet passed through to retail prices, but this may happen once domestic demand rebounds.
The summary table provides an overview of central projections for individual aggregates, series and/or their changes, with central projections of individual macroeconomic variables being more exposed to negative risks.
2 Developments in the environment1
The global economy recovered in the first half of 2010. Fa-vourable developments could be attributed more to the dynamic growth in developing countries,for positive trends in developed economies were much less noticeable. In mid-year, most inter-national institutions and market participants revised up global growth estimates for 2010, though considerable risks remained and were even more pronounced than before. Particularly note-worthy was concern about the sustainability of budget deficits and public debt levels in some eurozone countries, which re-newed turbulence in financial markets. The global economic recovery is expected to continue in 2011, although at a slower pace than in the previous year.
International environmentAvailable indicators suggest that among developed econo-
mies, the eurozone experienced the weakest and most uneven the real GDP growth estimate for 2010 being 1.7%. At the mon-etary union level, GDP growth began as early as in the third quarter of 2009, spurred by developments in the largest econo-mies, Germany in particular, but it was relatively weak – quar-ter-on-quarter growth rates were up to 1%. The main impetus to growth was provided by the recovery of global demand and trade, so that exports contributed most to GDP growth, while economic revival was also driven in no small part by expansive fiscal and monetary policy measures. The acceleration of eco-nomic activity in the forthcoming period will mostly depend on the strengthening of exports. Fiscal consolidation, which is
necessary and is being implemented to stabilise the ultimately unsustainable paths of public debt in some EU member coun-tries and to restore confidence in financial markets, will not have a favourable impact on real developments in the short run. In addition, stability was again threatened in late 2010 by the situ-ation in Ireland, which had to seek financial assistance from the IMF and EU. This renewed fears of the spread of the debt crisis to other eurozone countries in similar difficulties. The fragile re-covery of countries associated with the monetary union is also reflected in the steady fall in investments, which evidences the still pervasive lack of confidence in markets and tightened lend-ing conditions. Though personal consumption is expected to pick up in 2011, it will grow very slightly, due to high unemploy-ment. As a result, GDP growth in 2011 could be even somewhat lower than GDP growth estimated for 2010.
The US economy, the world’s largest, began to recover in the third quarter of 2009, when the first positive quarter-on-quarter rate of change in real GDP was recorded after four consecu-tive quarters of contraction. The recovery trend continued in the first three quarters of 2010, though it lost steam steadily. As a slightly weaker growth rate is expected in the last quar-ter of 2010, the US economic growth in 2011 could be 2.3% instead of the previously expected 2.6%. In 2010, growth was largely driven by the rising domestic demand so that recovery up to now has been mostly supported by comprehensive fiscal stimuli and inventories movements, the effects of which should be much weaker in the future. A gradual improvement in the la-bour market situation is expected with a time lag. Coupled with the expected increase in disposable income and better lending conditions, this could spur consumption. The expected further
Inflation risks are balanced around the central projection.
1 Described developments and projections are based on data available as at 30 November 2010.
CNB BULELTIN • INFORMATION ON ECONOMIC TRENDS AND FORECASTS • NUMBER 165 • 2 DEVELOPMENTS IN THE ENVIRONMENT16
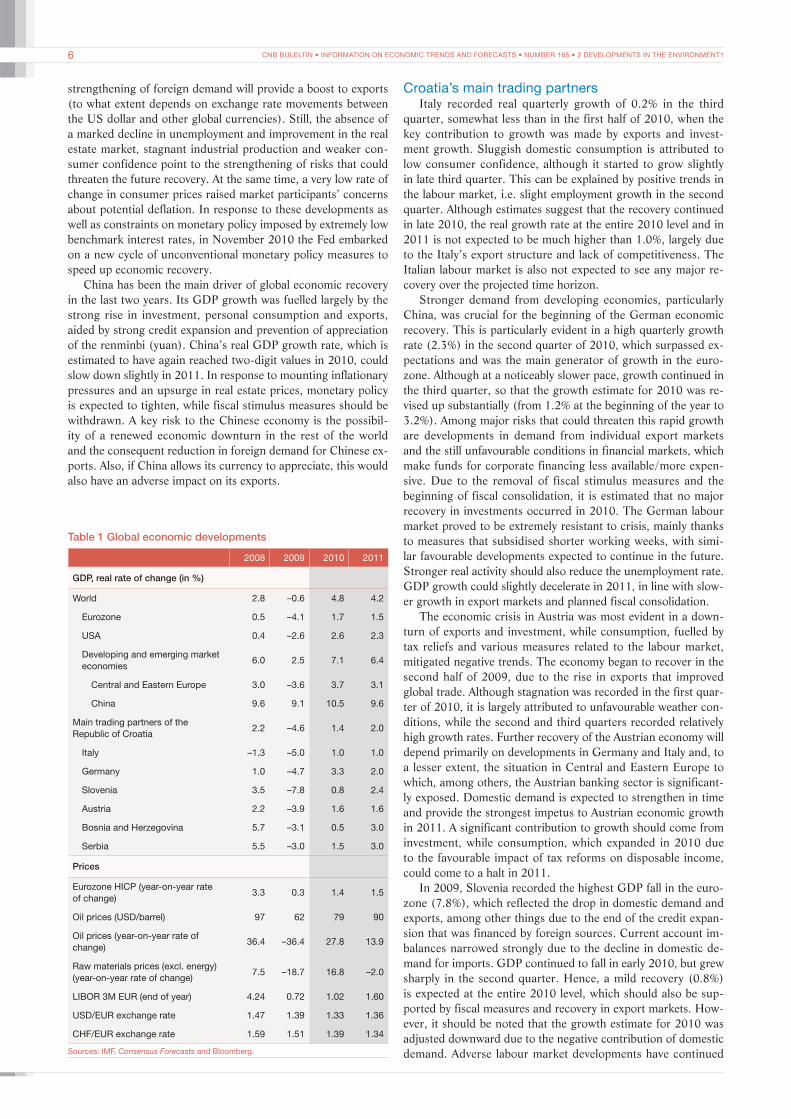
Table 1 Global economic developments
2008 2009 2010 2011
GDP, real rate of change (in %)
World 2.8 –0.6 4.8 4.2
Eurozone 0.5 –4.1 1.7 1.5
USA 0.4 –2.6 2.6 2.3
Developing and emerging market economies
6.0 2.5 7.1 6.4
Central and Eastern Europe 3.0 –3.6 3.7 3.1
China 9.6 9.1 10.5 9.6
Main trading partners of the Republic of Croatia
2.2 –4.6 1.4 2.0
Italy –1.3 –5.0 1.0 1.0
Germany 1.0 –4.7 3.3 2.0
Slovenia 3.5 –7.8 0.8 2.4
Austria 2.2 –3.9 1.6 1.6
Bosnia and Herzegovina 5.7 –3.1 0.5 3.0
Serbia 5.5 –3.0 1.5 3.0
Prices
Eurozone HICP (year-on-year rate of change)
3.3 0.3 1.4 1.5
Oil prices (USD/barrel) 97 62 79 90
Oil prices (year-on-year rate of change)
36.4 –36.4 27.8 13.9
Raw materials prices (excl. energy) (year-on-year rate of change)
7.5 –18.7 16.8 –2.0
LIBOR 3M EUR (end of year) 4.24 0.72 1.02 1.60
USD/EUR exchange rate 1.47 1.39 1.33 1.36
CHF/EUR exchange rate 1.59 1.51 1.39 1.34
Sources: IMF, Consensus Forecasts and Bloomberg.
strengthening of foreign demand will provide a boost to exports (to what extent depends on exchange rate movements between the US dollar and other global currencies). Still, the absence of a marked decline in unemployment and improvement in the real estate market, stagnant industrial production and weaker con-sumer confidence point to the strengthening of risks that could threaten the future recovery. At the same time, a very low rate of change in consumer prices raised market participants’ concerns about potential deflation. In response to these developments as well as constraints on monetary policy imposed by extremely low benchmark interest rates, in November 2010 the Fed embarked on a new cycle of unconventional monetary policy measures to speed up economic recovery.
China has been the main driver of global economic recovery in the last two years. Its GDP growth was fuelled largely by the strong rise in investment, personal consumption and exports, aided by strong credit expansion and prevention of appreciation of the renminbi (yuan). China’s real GDP growth rate, which is estimated to have again reached two-digit values in 2010, could slow down slightly in 2011. In response to mounting inflationary pressures and an upsurge in real estate prices, monetary policy is expected to tighten, while fiscal stimulus measures should be withdrawn. A key risk to the Chinese economy is the possibil-ity of a renewed economic downturn in the rest of the world and the consequent reduction in foreign demand for Chinese ex-ports. Also, if China allows its currency to appreciate, this would also have an adverse impact on its exports.
Croatia’s main trading partnersItaly recorded real quarterly growth of 0.2% in the third
quarter, somewhat less than in the first half of 2010, when the key contribution to growth was made by exports and invest-ment growth. Sluggish domestic consumption is attributed to low consumer confidence, although it started to grow slightly in late third quarter. This can be explained by positive trends in the labour market, i.e. slight employment growth in the second quarter. Although estimates suggest that the recovery continued in late 2010, the real growth rate at the entire 2010 level and in 2011 is not expected to be much higher than 1.0%, largely due to the Italy’s export structure and lack of competitiveness. The Italian labour market is also not expected to see any major re-covery over the projected time horizon.
Stronger demand from developing economies, particularly China, was crucial for the beginning of the German economic recovery. This is particularly evident in a high quarterly growth rate (2.3%) in the second quarter of 2010, which surpassed ex-pectations and was the main generator of growth in the euro-zone. Although at a noticeably slower pace, growth continued in the third quarter, so that the growth estimate for 2010 was re-vised up substantially (from 1.2% at the beginning of the year to 3.2%). Among major risks that could threaten this rapid growth are developments in demand from individual export markets and the still unfavourable conditions in financial markets, which make funds for corporate financing less available/more expen-sive. Due to the removal of fiscal stimulus measures and the beginning of fiscal consolidation, it is estimated that no major recovery in investments occurred in 2010. The German labour market proved to be extremely resistant to crisis, mainly thanks to measures that subsidised shorter working weeks, with simi-lar favourable developments expected to continue in the future. Stronger real activity should also reduce the unemployment rate. GDP growth could slightly decelerate in 2011, in line with slow-er growth in export markets and planned fiscal consolidation.
The economic crisis in Austria was most evident in a down-turn of exports and investment, while consumption, fuelled by tax reliefs and various measures related to the labour market, mitigated negative trends. The economy began to recover in the second half of 2009, due to the rise in exports that improved global trade. Although stagnation was recorded in the first quar-ter of 2010, it is largely attributed to unfavourable weather con-ditions, while the second and third quarters recorded relatively high growth rates. Further recovery of the Austrian economy will depend primarily on developments in Germany and Italy and, to a lesser extent, the situation in Central and Eastern Europe to which, among others, the Austrian banking sector is significant-ly exposed. Domestic demand is expected to strengthen in time and provide the strongest impetus to Austrian economic growth in 2011. A significant contribution to growth should come from investment, while consumption, which expanded in 2010 due to the favourable impact of tax reforms on disposable income, could come to a halt in 2011.
In 2009, Slovenia recorded the highest GDP fall in the euro-zone (7.8%), which reflected the drop in domestic demand and exports, among other things due to the end of the credit expan-sion that was financed by foreign sources. Current account im-balances narrowed strongly due to the decline in domestic de-mand for imports. GDP continued to fall in early 2010, but grew sharply in the second quarter. Hence, a mild recovery (0.8%) is expected at the entire 2010 level, which should also be sup-ported by fiscal measures and recovery in export markets. How-ever, it should be noted that the growth estimate for 2010 was adjusted downward due to the negative contribution of domestic demand. Adverse labour market developments have continued
CNB BULELTIN • INFORMATION ON ECONOMIC TRENDS AND FORECASTS • NUMBER 165 • 3 AGGREGATE DEMAND AND SUPPLY 7
and no major improvement is expected in 2011. Still, econom-ic recovery should pick up steam in 2011 (2.4%) and could be spurred by investment and consumption, while, in contrast with 2010, net exports could negatively affect the change in GDP due to growth in imports.
Among major trading partners outside the eurozone, Bosnia and Herzegovina and Serbia should be particularly noted. Both countries recorded a decline in economic activity in 2009, but it was smaller than in most European countries (– 3.1% in Bosnia and Herzegovina and – 3.0% in Serbia). This was mainly due to the fall in domestic demand, which, despite the parallel drop in exports, reduced substantial external imbalances. Economic de-velopments were also affected by a much smaller volume of for-eign capital inflows, which resulted in a sharp decline in invest-ment. In such conditions, both countries sought IMF assistance in the form of a stand-by arrangement. Bosnia and Herzego-vina’s GDP growth is estimated at 0.5% in 2010, which is much below projections. Due to reduced domestic demand, which was partly a result of fiscal consolidation and a fall in bank lending, no major improvement in import demand is expected. The es-timate for GDP growth in Serbia of 1.5% in 2010 is also lower than expected. To some extent this was due to fears about the spillover effects of the Greek crisis that broke out in mid-2010. In addition, inflation was substantial in the second half of 2010, due to soaring food prices and the depreciation of the dinar. Economic trends in both countries are expected to strengthen in 2011, while real GDP growth is projected at 3.0%.
Exchange rates and price developmentsHaving depreciated markedly in the first half of 2010, the ex-
change rate of the euro against the US dollar became stable in mid-2010. As the US economy recorded poorer than expected results, the dollar slightly weakened against the euro in Septem-ber. This trend gained steam in the fourth quarter when the Fed embarked on a new cycle of expansive measures. The average exchange rate of the US dollar against the euro could appreciate by 4.0% in 2010 relative to 2009, with no major changes be-ing expected in 2011. One should bear in mind that forecasts of market movements of bilateral exchange rates are often unreli-able. The Swiss franc also appreciated strongly against the euro in the first half of 2010 because it was seen as a safe haven by
investors at the time of renewed concerns regarding the situation in some eurozone countries. The trend of this bilateral exchange rate was reinforced by favourable economic results in Switzer-land. Late in the third quarter of 2010, the Swiss franc/euro ex-change rate stabilised and no significant changes are expected over the rest of the projection horizon.
The sluggish economic recovery determined expectations about developments in benchmark rates in the US and the euro-zone, which were extremely low in late 2010. As no major ac-celeration of economic activity is expected in 2011, benchmark rates may begin to increase only late in the year. Their move-ments will be followed by market rates, so that the 3-month EU-RIBOR rate, which stood at around 1.0% at end-2010, could gradually rise in 2011. Inflation has been very moderate in de-veloped economies and should not exceed the target of below, but close to, 2.0% in the eurozone.
Contrary to expectations, the upward trend in raw mate-rial prices in the world market, which prevailed in the first six months of 2010, continued in the second half of the year. This was largely the result of increased metal prices spurred by strong demand from developing countries, particularly China, while food prices grew only slightly less. In the last quarter of 2010, the weakening of the US dollar made a significant contribution to the rise in prices of most raw materials. These prices could continue to rise mildly in 2011. The major risks to this projec-tion are the possible renewed strengthening of the US dollar and slower economic recovery, which would diminish upward pres-sures on raw material prices.
Stability of crude oil prices from the last quarter of 2009 was due to the beginning of economic recovery and an increase in demand on the one hand and, on the other hand, growing pro-duction. Prices largely moved within the range of USD 70-80 per barrel, while they exceeded the upper bound of that range in the last quarter of 2010. Similar trends should determine price developments in the forthcoming period. The rise in demand for oil should stay in line with economic recovery, while demand-side pressures should be somewhat mitigated by increased pro-duction by OPEC and other oil-exporting countries. The aver-age crude oil price could grow from USD 78.9 per barrel, esti-mated for 2010, to USD 89.9 per barrel in 2011.
3 Aggregate demand and supply
Seasonally and calendar-adjusted GDP data suggest that the downturn in the domestic economy, which began in mid-2008, continued in the first half of 2010. Such developments primarily reflect a steady plunge in gross fixed capital forma-tion. Total economic activity increased somewhat at the onset of the second half of the year, predominantly due to stronger do-mestic demand, while the year-end will probably be marked by its renewed weakening. GDP growth is expected to be relatively low in 2011 and largely driven by foreign demand for domestic goods and services. At the same time, the expected increase in household consumption and gross fixed capital formation will provide a boost to both domestic activity and imports.
Aggregate demandIn line with the economic recovery in the majority of main
export markets, total exports had a positive impact on domes-tic real economic activity in the first and second quarters of 2010. Nominal data on international trade suggest that such
developments were also due to growing demand for domestic goods coupled with the rise in demand for services.
Estimates say that exports of goods and services nearly held steady in real terms in the third quarter of 2010. This was largely due to an adverse base effect (exports of ships were exception-ally high in the preceding quarter), as well as the fact that total tourism revenues were somewhat lower than in 2009 due to a decrease in foreign tourist spending. The increase in exports of goods and services could be particularly sharp in the last quarter of 2010, due also to increased exports of ships. Exports of goods and services could grow by 6.3% in real terms at the entire 2010 level.
The continued economic recovery in major Croatian export markets should lead to an increase in exports of goods and ser-vices of around 4.1% in 2011. Both exports of goods and ser-vices are expected to grow.
In contrast with foreign demand, components of domestic demand were mostly marked by negative trends in the first half

CNB BULELTIN • INFORMATION ON ECONOMIC TRENDS AND FORECASTS • NUMBER 165 • 3 AGGREGATE DEMAND AND SUPPLY8
–35
–28
–21
–14
–7
0
7
14
21
28
35
2006 2007 2008 2009 2010
Exports of goods Exports of services
year
-on-y
ear
rate
of
chan
ge,
in %
%
100
110
120
130
140
150
160
–20
–15
–10
–5
0
5
10
15
20
2001 2002 2003 2004 2005 2006 2007 2008 2009 2010
index
,20
00
= 1
00
Year-on-year rate of change in total exports (original values) – left
Level of total exports (seasonally and calendar adjusted values) – right
Figure 1 Exports of goods and servicesreal values
Source: CBS data adjusted by the CNB.
Figure 2 Exports of goods and servicesin EUR, nominal values taken from the balance of payments
Source: CNB.
of 2010. Household consumption continued to contract early in the year largely under the influence of negative labour market trends, which were characterised by a fall in employment and average real wages, while the still high level of consumer pes-simism also had a negative impact. Nevertheless, this domestic demand component grew in the second quarter.
Personal consumption continued to trend up in the third quarter, due to the rise in consumer disposable income follow-ing the abolishment of the special tax on salaries, pensions and other income and the introduction of changes in the income tax system. It should be noted that recent consumer confidence sur-veys (the last was carried out in November) point to the renewed strengthening of consumer pessimism, which could weaken this component of domestic demand in the last quarter. At the entire 2010 level, household consumption is expected to fall by some 1.5%, which is less than the expected decrease in disposable in-come. In view of the above and the fact that consumer loans re-corded a negative growth rate while deposits recorded a positive growth rate, personal consumption in 2010 was probably partly financed from previously accumulated financial assets outside banks and from income from the grey economy.
Personal consumption is expected to grow by 1.6% in 2011. This is based on the assumption that disposable income will in-crease due to relatively favourable developments in the export sector and the favourable base effect of the repeal of the cri-sis tax and changes in the income tax system. An additional as-sumption is the expected marginal increase in household loans, which should result from an improvement in consumer optimism and more favourable lending conditions of banks. By contrast, a decrease in the average number of employed persons will ad-versely affect disposable income on a whole year basis. Although total economic activity is expected to grow relatively steadily in 2011, it should be said that this increase will be very slow and probably insufficient to contribute significantly to changes in the labour market. Therefore, another slight decrease in the number of employed persons is expected in the first half of 2011, while a somewhat stronger employment growth could occur late in the year.
Capital investment continued to fall in the first two quarters of 2010. Enterprises continued to reduce capital investment due to low demand and uncertainties about its developments in the near future. Faced with substantial uncertainties regarding fu-ture income, as well as relatively unfavourable costs of housing
%
100
105
110
115
120
125
130
135
140
145
150
–10
–8
–6
–4
–2
0
2
4
6
8
10
2001 2002 2003 2004 2005 2006 2007 2008 2009 2010
index
,20
00
= 1
00
Year-on-year rate of change in personal consumption (original values) – left
Level of personal consumption (seasonally adjusted values) – right
Figure 3 Personal consumptionreal values
Source: CBS data adjusted by the CNB.
–15
–10
–5
0
5
10
15
20
–50
–45
–40
–35
–30
–25
–20
–15
–10
–5
0
2006 2007 2008 2009 2010
year
-on-y
ear
rate
of
chan
ge,
in %
bal
ance
of
resp
onse
s
Real disposable income – left Balance of consumer loans – left
Personal consumption – left Consumer confidence indicator – right
Figure 4 Determinants of personal consumption
Note: The presented values of the consumer confidence indicator are calculated as three-member moving averages of monthly data.Sources: CBS and CNB.
CNB BULELTIN • INFORMATION ON ECONOMIC TRENDS AND FORECASTS • NUMBER 165 • 3 AGGREGATE DEMAND AND SUPPLY 9
%
–20
–15
–10
–5
0
5
10
15
20
25
30
100
120
140
160
180
200
220
240
2001 2002 2003 2004 2005 2006 2007 2008 2009 2010
index
,20
00
= 1
00
Year-on-year rate of change in capital investment (original values) – left
Level of capital investment (seasonally adjusted values) – right
Figure 5 Gross fixed capital formationreal values
Source: CBS data adjusted by the CNB.
%
–25
–20
–15
–10
–5
0
5
15
20
100
110
120
130
140
150
160
170
180
190
20025
2001 2002 2003 2004 2005 2006 2007 2008 2009 2010
index
,2000 =
100
Year-on-year rate of change in total imports (original values) – left
Level of total imports (seasonally adjusted values) – right
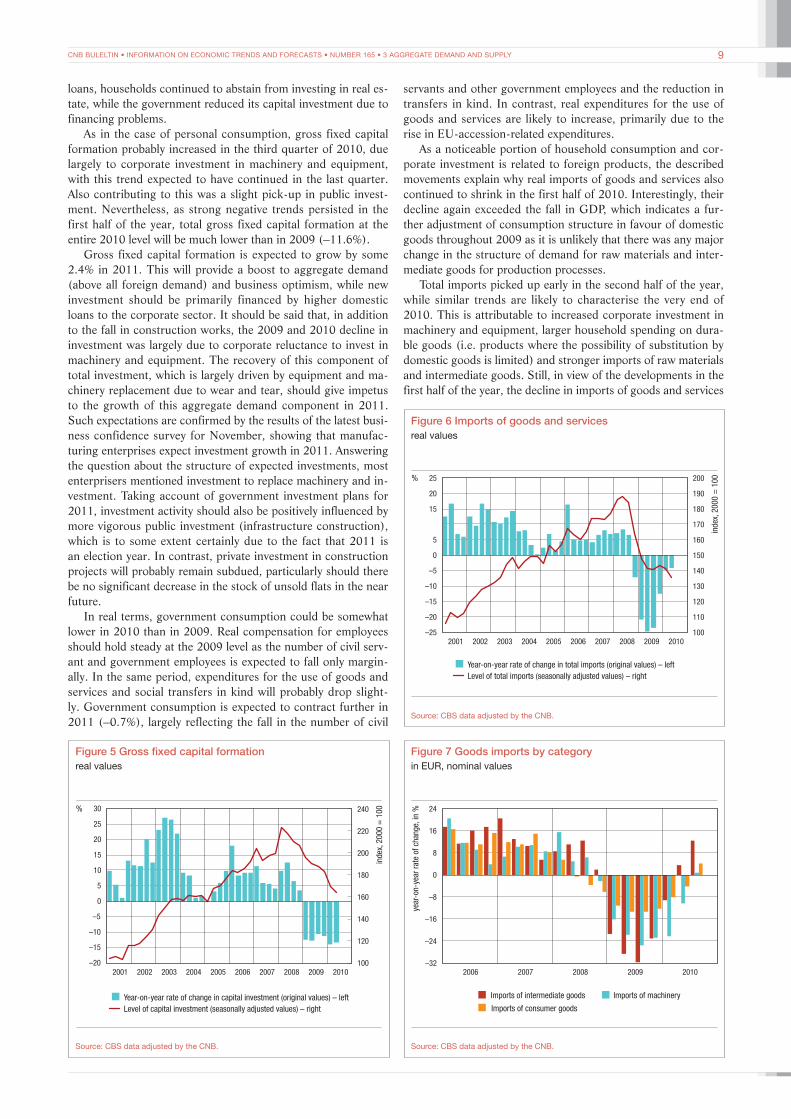
Figure 6 Imports of goods and servicesreal values
Source: CBS data adjusted by the CNB.
servants and other government employees and the reduction in transfers in kind. In contrast, real expenditures for the use of goods and services are likely to increase, primarily due to the rise in EU-accession-related expenditures.
As a noticeable portion of household consumption and cor-porate investment is related to foreign products, the described movements explain why real imports of goods and services also continued to shrink in the first half of 2010. Interestingly, their decline again exceeded the fall in GDP, which indicates a fur-ther adjustment of consumption structure in favour of domestic goods throughout 2009 as it is unlikely that there was any major change in the structure of demand for raw materials and inter-mediate goods for production processes.
Total imports picked up early in the second half of the year, while similar trends are likely to characterise the very end of 2010. This is attributable to increased corporate investment in machinery and equipment, larger household spending on dura-ble goods (i.e. products where the possibility of substitution by domestic goods is limited) and stronger imports of raw materials and intermediate goods. Still, in view of the developments in the first half of the year, the decline in imports of goods and services
loans, households continued to abstain from investing in real es-tate, while the government reduced its capital investment due to financing problems.
As in the case of personal consumption, gross fixed capital formation probably increased in the third quarter of 2010, due largely to corporate investment in machinery and equipment, with this trend expected to have continued in the last quarter. Also contributing to this was a slight pick-up in public invest-ment. Nevertheless, as strong negative trends persisted in the first half of the year, total gross fixed capital formation at the entire 2010 level will be much lower than in 2009 (–11.6%).
Gross fixed capital formation is expected to grow by some 2.4% in 2011. This will provide a boost to aggregate demand (above all foreign demand) and business optimism, while new investment should be primarily financed by higher domestic loans to the corporate sector. It should be said that, in addition to the fall in construction works, the 2009 and 2010 decline in investment was largely due to corporate reluctance to invest in machinery and equipment. The recovery of this component of total investment, which is largely driven by equipment and ma-chinery replacement due to wear and tear, should give impetus to the growth of this aggregate demand component in 2011. Such expectations are confirmed by the results of the latest busi-ness confidence survey for November, showing that manufac-turing enterprises expect investment growth in 2011. Answering the question about the structure of expected investments, most enterprisers mentioned investment to replace machinery and in-vestment. Taking account of government investment plans for 2011, investment activity should also be positively influenced by more vigorous public investment (infrastructure construction), which is to some extent certainly due to the fact that 2011 is an election year. In contrast, private investment in construction projects will probably remain subdued, particularly should there be no significant decrease in the stock of unsold flats in the near future.
In real terms, government consumption could be somewhat lower in 2010 than in 2009. Real compensation for employees should hold steady at the 2009 level as the number of civil serv-ant and government employees is expected to fall only margin-ally. In the same period, expenditures for the use of goods and services and social transfers in kind will probably drop slight-ly. Government consumption is expected to contract further in 2011 (–0.7%), largely reflecting the fall in the number of civil
–32
–24
–16
–8
0
8
16
24
2006 2007 2008 2009 2010
Imports of intermediate goods Imports of machinery
Imports of consumer goods
year
-on-y
ear
rate
of
chan
ge,
in %
Figure 7 Goods imports by categoryin EUR, nominal values
Source: CBS data adjusted by the CNB.
CNB BULELTIN • INFORMATION ON ECONOMIC TRENDS AND FORECASTS • NUMBER 165 • 3 AGGREGATE DEMAND AND SUPPLY10
could be 1.9% in real terms at the entire 2010 level. As positive trends in aggregate demand components are expected to contin-ue, imports of goods and services should grow in 2011 (3.9%).
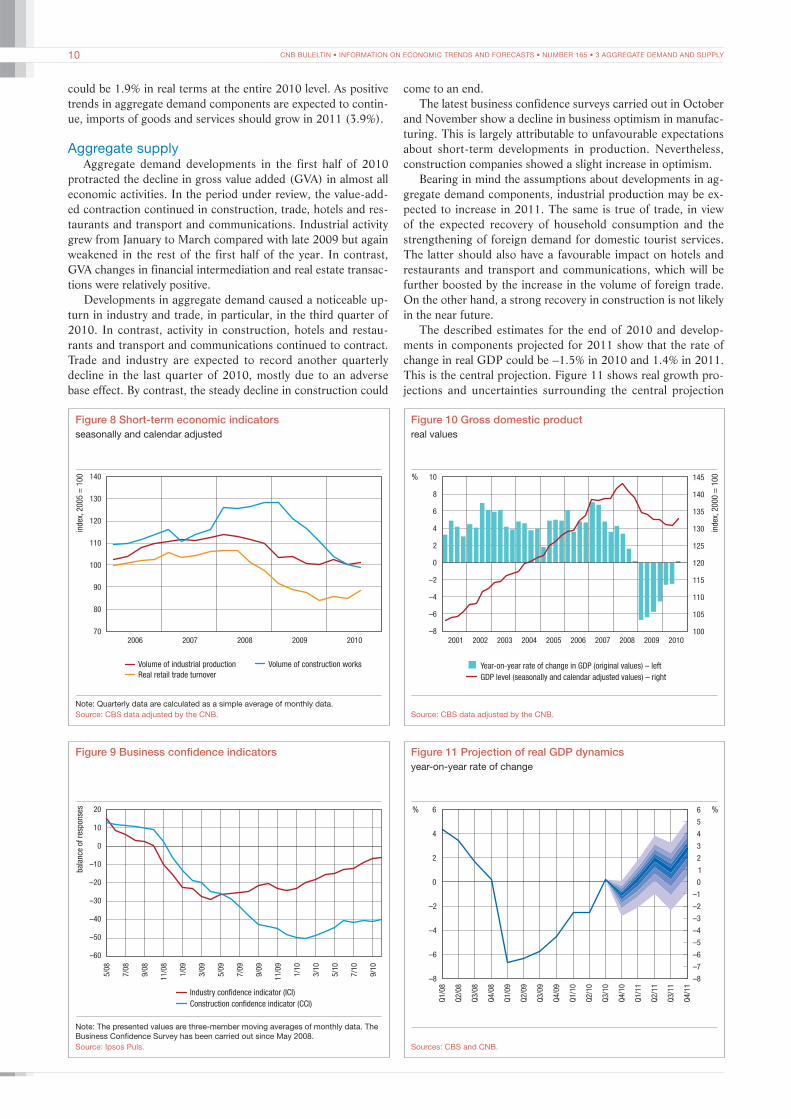
Aggregate supplyAggregate demand developments in the first half of 2010
protracted the decline in gross value added (GVA) in almost all economic activities. In the period under review, the value-add-ed contraction continued in construction, trade, hotels and res-taurants and transport and communications. Industrial activity grew from January to March compared with late 2009 but again weakened in the rest of the first half of the year. In contrast, GVA changes in financial intermediation and real estate transac-tions were relatively positive.
Developments in aggregate demand caused a noticeable up-turn in industry and trade, in particular, in the third quarter of 2010. In contrast, activity in construction, hotels and restau-rants and transport and communications continued to contract. Trade and industry are expected to record another quarterly decline in the last quarter of 2010, mostly due to an adverse base effect. By contrast, the steady decline in construction could
70
80
90
100
110
120
130
140
2006 2007 2008 2009 2010
index
,2005 =
100
Volume of industrial production Volume of construction works
Real retail trade turnover
Figure 8 Short-term economic indicatorsseasonally and calendar adjusted
Note: Quarterly data are calculated as a simple average of monthly data.Source: CBS data adjusted by the CNB.
–60
–50
–40
–30
–20
–10
0
10
20
5/0
8
7/0
8
9/0
8
11/0
8
1/0
9
3/0
9
5/0
9
7/0
9
9/0
9
11/0
9
1/1
0
3/1
0
5/1
0
7/1
0
9/1
0
Industry confidence indicator (ICI)
Construction confidence indicator (CCI)
bal
ance
of
resp
onse
s
Figure 9 Business confidence indicators
Note: The presented values are three-member moving averages of monthly data. The Business Confidence Survey has been carried out since May 2008.Source: Ipsos Puls.
come to an end.The latest business confidence surveys carried out in October
and November show a decline in business optimism in manufac-turing. This is largely attributable to unfavourable expectations about short-term developments in production. Nevertheless, construction companies showed a slight increase in optimism.
Bearing in mind the assumptions about developments in ag-gregate demand components, industrial production may be ex-pected to increase in 2011. The same is true of trade, in view of the expected recovery of household consumption and the strengthening of foreign demand for domestic tourist services. The latter should also have a favourable impact on hotels and restaurants and transport and communications, which will be further boosted by the increase in the volume of foreign trade. On the other hand, a strong recovery in construction is not likely in the near future.
The described estimates for the end of 2010 and develop-ments in components projected for 2011 show that the rate of change in real GDP could be –1.5% in 2010 and 1.4% in 2011. This is the central projection. Figure 11 shows real growth pro-jections and uncertainties surrounding the central projection
%
100
105
110
115
120
125
130
135
140
145
–8
–6
–4
–2
0
2
4
6
8
10
2001 2002 2003 2004 2005 2006 2007 2008 2009 2010
index
,2000 =
100
Year-on-year rate of change in GDP (original values) – left
GDP level (seasonally and calendar adjusted values) – right
Figure 10 Gross domestic productreal values
Source: CBS data adjusted by the CNB.
–8
–7
–6
–5
–4
–3
–2
–1
0
1
2
3
4
5
6
–8
–6
–4
–2
0
2
4
6% %
Q1/0
8
Q2/0
8
Q3/0
8
Q4/0
8
Q1/0
9
Q2/0
9
Q3/0
9
Q4/0
9
Q1/1
0
Q2/1
0
Q3/1
0
Q4/1
0
Q1/1
1
Q2/1
1
Q3/1
1
Q4/1
1
Figure 11 Projection of real GDP dynamicsyear-on-year rate of change
Sources: CBS and CNB.
CNB BULELTIN • INFORMATION ON ECONOMIC TRENDS AND FORECASTS • NUMBER 165 • 3 AGGREGATE DEMAND AND SUPPLY 11
(the deepest blue area) by means of a fan chart in the period from the second quarter of 2010 to the fourth quarter of 2011.
It should be noted that an assumption of an asymmetric error distribution was used in making a 90% confidence interval. In other words, according to information available when closing the projections, it was probable that realised GDP growth in 2011 would be lower than the central projection rather than higher.2 In view of the uncertainty and instability of foreign market re-covery, the rise in imports by Croatia’s most important trading partners could be lower than expected. In that case, Croatian exports growth would be slower than projected. As it is assumed that exports will contribute most to total economic growth in 2011, this would result in a lower rate of change in real GDP. Furthermore, the increase in effective domestic loans to the pri-vate sector may fall short of expectations. One should bear in mind that the projected growth in gross fixed capital formation
of the private sector assumes that it will be financed mainly by borrowing from domestic banks, while the projected growth in personal consumption also assumes that households will in-creasingly rely on financing in the form of loans. Assumed devel-opments in placements should, among other things, be strong-ly supported by the fall in the cost of borrowing from banks. Should lending rates not fall due to the deterioration of banks’ loan portfolios and/or should the government need to finance its liabilities in 2011 mostly in the domestic market, growth in pri-vate sector lending could be slower than projected, which would also result in a poorer recovery of aggregate demand. On the other hand, growth in 2011 could exceed projections if the an-nounced infrastructure investment of public enterprises takes off or if confidence of economic entities grows more than expected. The latter could be boosted by the end of negotiations and sign-ing of the EU accession agreement.
2 The lower and upper bounds for the interval are set based on past forecast error variances for particular quarters. The said variances were further adjusted by correction factors whose value reflects the CNB’s perception about changes in potential risks to the central projection. A more detailed explanation of the meth-odology for preparing the projection and of the way to interpret the projection is given in Box 1 Forecast risks presented in the form of a fan chart.
3 Fan charts are described in more detail in Britton, E., and J. Whitley (1998), The Inflation Report projections: understanding the fan chart, Bank of England Quarterly Bulletin, Vol. 1, pp. 30-37.
4 In case of a continuous distribution, it is the point at which the probability density function attains its maximum.
Box 1 Forecast risks presented in the form of a fan chart
In recent years, central banks have paid great attention to the way in which they present their forecasts to the broader public. Forecasts for certain variables that are important in monetary policy decision-making were previously most often published in the form of point estimates that, based on information available, presented the expected future outcome for relevant variables. It should be noted that the usefulness of point estimates was lim-ited when this indicator was not accompanied by a certain meas-ure of the imprecision associated with the uncertainty of the out-come. Forecasts of an economic variable are much more useful to final users if they know the probability of a variable outcome being below or above the forecasted point estimate. Institutions publishing forecasts for key macroeconomic variables, particu-larly for variables for which they are directly or indirectly respon-sible, now quite often publish forecast confidence levels as well. By doing this, they want to warn users that the total economy is faced with numerous risks on a daily basis, and that therefore the economic policy is being implemented in highly uncertain con-ditions. Forecast values themselves are thus accompanied with a smaller or larger symmetric or asymmetric uncertainty, and should not be adopted or interpreted mechanically.
Though uncertainty (risks) may be documented and present-ed in various ways, many central banks publish their forecasts in the form of fan charts.3 This type of projection focuses not only on a single point forecast, but also portrays an overall forecast distribution.
The fan chart given in Figure 11 should be read as follows: the probability of the GDP growth rate in a particular quarter from October 2010 through to the end of 2011 being within the deepest blue band (including the central projection) is 10%. The area coloured in the next deepest shade of blue (immediately above and below the deepest blue band) takes the distribution out to 20%. The fan thus covers 90% of the probability, while there is a 10% probability that the outcome for GDP growth is outside the shaded area.
The process used to produce a fan chart is based on three values: the central projection, expected forecast error (the vari-ance) and the degree of projection asymmetry.
The central projection for a given time horizon is a single point value that is believed to be the most likely outcome. How-ever, the chance of it matching the actual outcome is very small. In other words, the single point value is the mode of the forecast distribution.4 The central projection is derived by combining the results of quantitative models and expert knowledge.
Forecast errors are measured by variance and represent a measure of forecast uncertainty. The forecast variance is esti-mated in line with past forecast errors, but the variance used in preparing the current fan chart may also be adjusted if current developments contain uncertainty that is greater or less than in the past.
Since the risks affecting the outcome of the forecasted se-ries are not always symmetrical the normal (Gaussian) distribu-tion does not satisfactorily describe the risk to the forecast. For example, an evaluation of potential risks may lead to the con-clusion that the probability that the outcome of the forecasted variable exceeds the forecast is less than 50%. This possibility is shown in a fan chart in such a way that probability bands above the central projection are narrower than the same colour bands below the central projection. In practice, this asymmetry is mod-elled by assuming a “two-piece” normal distribution instead of a normal distribution.
A two-piece normal distribution assumes that risks to the forecast are modelled by using two normal distributions with ex-pected values and variances being ( , 1
2n v ) and ( , 22n v ), respec-
tively. The forecast for the variable x is then a two-piece nor-mal distribution with parameters ( ,, 1 2n v v ) and has a probability density function:
( ),
,f x Ae x
Ae x
( )
( )
x
x2
2
12
2
22
2
#
$
n
n=
v
n
v
n
-
-*
where: A 2 11 2r v v
=+
.
A distribution obtained in this way is formed by taking the left-hand side of the normal distribution with parameters ( , 1
2n v ) and the right-hand side of the normal distribution with parameters

CNB BULELTIN • INFORMATION ON ECONOMIC TRENDS AND FORECASTS • NUMBER 165 • 4 LABOUR MARKET12
The degree of asymmetry of the distribution may also be pre-sented by the probability of the outcome being below the central projection, ( )Pp X # n= , where the direct relationship between parameters c and p may be presented by the following formula:
p pp
1 2 21 2
2c =- +
-
After deriving the central projection, computing the past fore-cast error variance and determining the asymmetry parameter by evaluating current risks, the required quantiles of the two-piece normal distribution determining the fan chart bands are computed.
–7
–5
–3
–1
1
3
5
2006 2007 2008 2009 2010
Agriculture, forestry and fishing Industry
Construction Services
Public administration
per
centa
ge
poi
nts
Figure 12 Contribution to employment growth by sector
Sources: CBS and CNB calculations.
( , 22n v ) with an adjustment that results in the common value
( )f An = in the mode (i.e. the central projection point).The two-piece normal distribution is a convenient way of
representing departures from the symmetry of the normal dis-tribution and may be appropriately represented by parameters ( , ,n c v ), as follows:
( ),
,f x Ae x
Ae x
( ) (1 )
( ) (1 )
x
x2
2
12
2
22
2
#
$
n
n=
v
n c
v
n c
- +
- -*
where n is the mode of the distribution, c is a degree of asym-metry (skewness) (it may lie between –1 and 1, where positive values indicate a positive bias and vice versa), and v2 is the past error variance.
4 Labour market
In the first ten months of 2010, the number of employed per-sons steadily decreased, while the number of unemployed per-sons trended upward, as indicated by the seasonally adjusted da-ta. In the same period, gross wages dropped only slightly, which indicates that employers adjusted to reduced demand primarily by dismissing workers. The decline in employment on an annual level was mostly due to changes in construction, industry and trade, while only public administration recorded a slight increase in employment.
The loss of jobs pushed up the level of registered unemploy-ment, which again surpassed 300 thousand in the first four months of 2010 and at end-October. Unemployment in the Croatian labour market thus returned to the high level of 2006. Unemployment growth was the outcome of a strong increase in inflows of unemployed persons into the CES register, paired with reduced or insufficiently higher outflows from the register. As a result of these movements, the average registered unem-ployment rate stood at 17.4% from January to October 2010 (it was 14.6% in the same period of 2009), and is expected to increase slightly in November and December. According to the latest findings, the Labour Force Survey unemployment rate was 11.2% and 12.4% in the first and second quarters of 2010
respectively. Not only did unemployment rise, but the fall in de-mand for labour created a downward trend in the activity rate, primarily due to the exit of discouraged workers from the labour market and the increase in early retirement.
The downward trend in employment figures is expected to continue in the first half of 2011, while positive changes could become noticeable late in the year. However, they will be insuf-ficient to offset the negative impact of the previous periods, so that a mild fall in employment (–0.8%) is expected in 2011 on an annual basis. Unemployment will thus stay high throughout this year, while the average registered unemployment rate could reach 18.1%.
Unfavourable economic movements started to have an in-creasingly strong impact on wages at the end of 2009, much later than on employment and unemployment. This trend continued in the first half of 2010; nominal wages decreased by 1.0% and 0.9% in gross and net terms, respectively, relative to the same period of 2009. Including the impact of the special tax, nominal net wages fell by 3.6%. Developments in nominal gross wages in the reference period, coupled with a somewhat higher annual consumer price level, led to a substantial reduction in real gross wages. The beginning of the third quarter saw a deceleration of
6
8
10
12
14
16
18
20 %%
2006 2007 2008 2009 201046.0
46.5
47.0
47.5
48.0
48.5
49.0
49.5
50.0
Activity rate – righta
Registered unemployment rate – left
ILO unemployment rate – left
Figure 13 Unemployment and activity rates
a The labour force as a percentage of working age population (15+).Note: The Labour Force Survey has been published quarterly since the beginning of 2007.Source: CBS

CNB BULELTIN • INFORMATION ON ECONOMIC TRENDS AND FORECASTS • NUMBER 165 • 5 INFLATION 13
the fall in nominal gross wages, coupled with the first annual increase in net wages recorded in 2010. Not only were there
90
95
100
105
110
115
120
125
–6
–3
0
3
6
9
12
2006 2007 2008 2009 2010
year
-on-y
ear
rate
of
chan
ge,
in %
index
,20
05
= 1
00
Average nominal gross wage in industry
Average nominal gross wage in public administration
Unit labour costs in the economy, seasonally adjusted – right
Real unit labour costs in the economy, seasonally adjusted – right
Figure 14 Gross wages and unit labour costs
Sources: CBS and CNB calculations.
changes in tax brackets and income tax rates, but the decision to repeal the special tax of 2% charged on monthly incomes in the HRK 3000 to HRK 6000 range entered into force in July, which affected net wages by 2.0%, according to CBS calculations (this impact was 2.8% before the enforcement of this decision). As a result, net wages paid in the third quarter (excluding the impact of the special tax) increased by 1.0%.
The most dominant negative contribution to nominal gross wage movements in the first half of 2010 was made by public sector activities, which may be attributed to the strong base ef-fect in that period. In the same way as in employment, the most significant negative contributions to wage developments in pri-vate sector activities came from construction and manufactur-ing. Public sector wages recorded a year-on-year growth in the third quarter, while wages in the majority of private sector ac-tivities were smaller than in the same period of 2009. Although output measured by GDP decreased, the fall in total employ-ment in the economy was even sharper, which led to an increase in labour productivity compared with the last quarter of 2009. Adding to this the fall in nominal gross wages, year-on-year unit labour costs decreased from the end of 2009. It should be noted that employment data for 2010 are preliminary and that a cor-rection of them will also be reflected in figures on labour pro-ductivity and unit labour costs.
5 Inflation
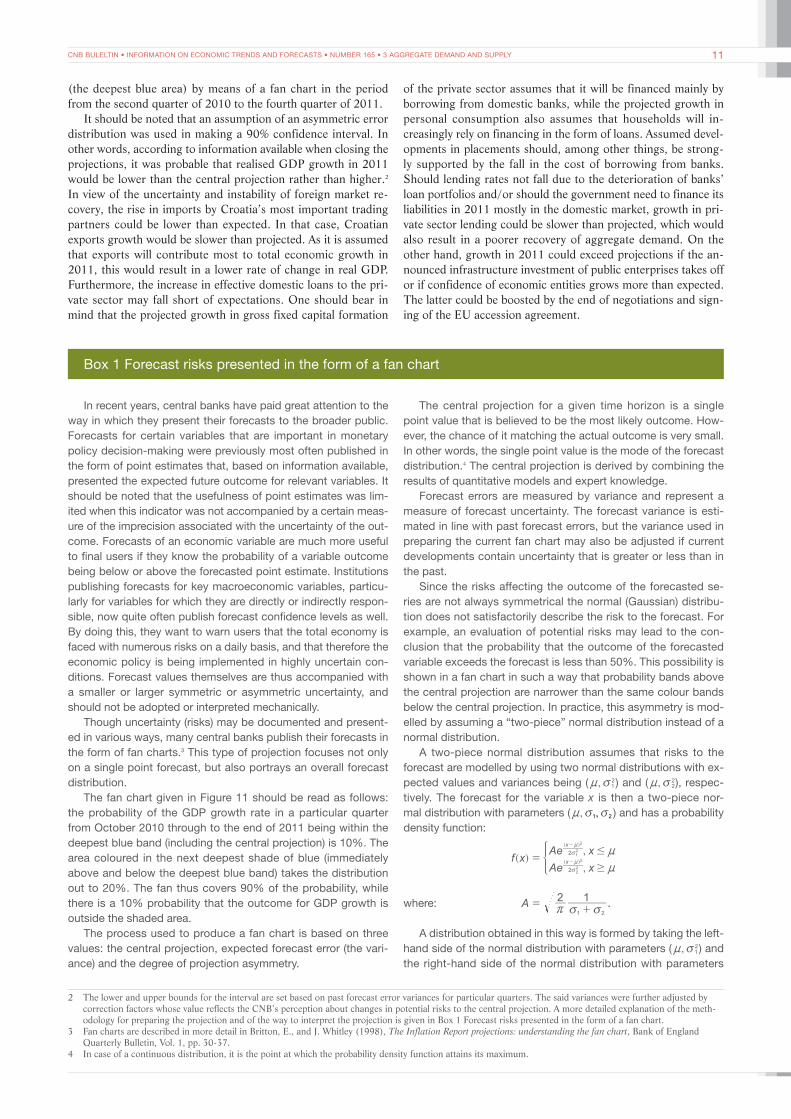
Consumer price developments in the first ten months of 2010 indicate that inflation in Croatia was low and stable, and remained predominantly influenced by domestic factors, above all by weak domestic demand. This is evidenced by the still rela-tively low rates of indicators of short-term inflation dynamics, particularly core inflation, whose annualised monthly rate of change was negative for most of the period under review. How-ever, an upward trend in these indicators of overall and core in-flation was evident in the same period, which can mainly be at-tributed to pressures from the external environment, above all the rising prices of energy products and other raw materials in the world market.
The annual consumer price inflation rate varied within the range of 0.6% to 1.4% in the first ten months of 2010. Such a trend occurred in conditions of reduced domestic demand and unit labour costs, as employment decreased more than produc-tion, while compensation per employee dropped on an annual basis. Furthermore, the implicit deflator of imports of goods and services was negative in the first half of 2010, despite the rise in raw material prices, which had a positive impact on domestic inflation. In the observed period, consumer price inflation trends were also influenced by the base-period effect as the impact of the substantial increase in administratively regulated prices (gas, tobacco products, health care and hospital services) in the same period of 2009 disappeared. Nevertheless, low annual rates of change in producer prices of durable and non-durable consumer goods confirm that producers refrained from transferring the price increases in energy and other raw materials to consumers. Instead, they adjusted to higher import costs by reducing oth-er costs and/or their profit margins. Still, the increase in world prices of raw materials affected developments in particular com-ponents of the CPI.
Prices of energy (in particular, refined petroleum products and gas) provided the largest contribution to the overall annual
inflation rate in the first ten months of 2010. Annual rates of change in prices of food products also began to grow in mid-year, mostly due to the rise in world prices of food raw materials (in particular, cereals, oilseeds and sugar) and energy products. In addition to the monthly increase in prices of processed food products in the last four months, the rise in their annual rate of change was due to the base effect deriving from the decrease in these prices in the same period of 2009.
The annual consumer price inflation rate could grow slightly in the last two months of 2010, when all the figures are known, primarily due to the base effect related to a lower than usual sea-sonal increase in agricultural product prices and a larger than usual seasonal fall in prices of clothing and footwear in Decem-ber 2009. At the entire 2010 level, it is estimated that the aver-age annual inflation rate could fall from 2.4% in 2009 to 1.1% in 2010 due to the decrease in the average annual rate of change in food prices and prices of industrial products, excluding food and energy, which was in part due to the negative carry-over ef-fect from 2009. In contrast, the average annual rate of change of CPI energy prices could be higher in 2010 than in 2009 due to the increase in world crude oil prices and the rise in gas prices early in 2010.
The average annual CPI inflation rate is expected to acceler-ate to 2.5% in 2010. The projected rate reflects relatively mild in-flationary pressures stemming from the recovery in domestic de-mand, while domestic cost pressures could be reduced thanks to the projected further decline in unit labour costs in 2011 (though smaller than in 2010). Inflationary pressures coming from the global increase in prices of oil and other raw materials are expect-ed to be lower than in 2010. Also, the average kuna/US dollar exchange rate, which steadily depreciated in 2010 and thus add-ed to imported inflationary pressures, is expected to slightly ap-preciate in 2011. Broken down by components, inflation projec-tions indicate that the annual increase in energy prices, reflected
CNB BULELTIN • INFORMATION ON ECONOMIC TRENDS AND FORECASTS • NUMBER 165 • 5 INFLATION14
% %
–2 –2
–1 –1
0 0
1 1
2 2
3 3
4 4
5 5
6 6
7 7
8 8
Q2/0
8
Q3/0
8
Q4/0
8
Q1/0
9
Q2/0
9
Q3/0
9
Q4/0
9
Q1/1
0
Q2/1
0
Q3/1
0
Q4/1
0
Q1/1
1
Q2/1
1
Q3/1
1
Q4/1
1
Figure 17 Projection of consumer price inflationyear-on-year rate of change
Sources: CBS and CNB calculations.
2006 2007 2008 2009 2010–3.0
–1.5
0.0
1.5
3.0
4.5
6.0
7.5
9.0
per
centa
ge
poi
nts
/in %
Energy Unprocessed food
Processed food Industrial non-food without energy
Services Consumer price inflation
Core inflation
Figure 16 Year-on-year inflation rates and contribution of components to consumer price inflation
Sources: CBS and CNB calculations.
–6
–4
–2
0
2
4
6
8
10
12%
2006 2007 2008 2009 2010
Consumer price index Core inflation
Figure 15 Consumer price index and core inflationa
annualised month-on-month rate of changeb
a Core inflation does not include agricultural product prices and administrative prices. b The month-on-month rate of change is calculated from the quarterly moving average of seasonally adjusted price indices.Sources: CBS and CNB calculations.
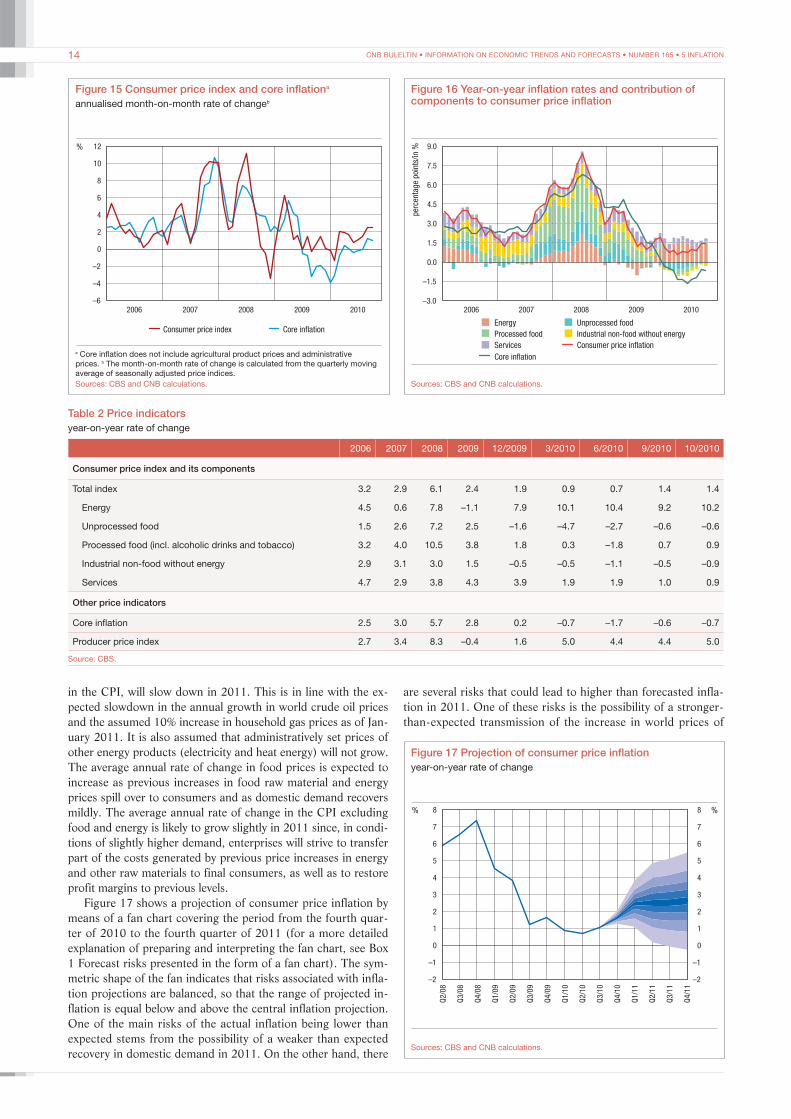
in the CPI, will slow down in 2011. This is in line with the ex-pected slowdown in the annual growth in world crude oil prices and the assumed 10% increase in household gas prices as of Jan-uary 2011. It is also assumed that administratively set prices of other energy products (electricity and heat energy) will not grow. The average annual rate of change in food prices is expected to increase as previous increases in food raw material and energy prices spill over to consumers and as domestic demand recovers mildly. The average annual rate of change in the CPI excluding food and energy is likely to grow slightly in 2011 since, in condi-tions of slightly higher demand, enterprises will strive to transfer part of the costs generated by previous price increases in energy and other raw materials to final consumers, as well as to restore profit margins to previous levels.
Figure 17 shows a projection of consumer price inflation by means of a fan chart covering the period from the fourth quar-ter of 2010 to the fourth quarter of 2011 (for a more detailed explanation of preparing and interpreting the fan chart, see Box 1 Forecast risks presented in the form of a fan chart). The sym-metric shape of the fan indicates that risks associated with infla-tion projections are balanced, so that the range of projected in-flation is equal below and above the central inflation projection. One of the main risks of the actual inflation being lower than expected stems from the possibility of a weaker than expected recovery in domestic demand in 2011. On the other hand, there
Table 2 Price indicatorsyear-on-year rate of change
2006 2007 2008 2009 12/2009 3/2010 6/2010 9/2010 10/2010
Consumer price index and its components
Total index 3.2 2.9 6.1 2.4 1.9 0.9 0.7 1.4 1.4
Energy 4.5 0.6 7.8 –1.1 7.9 10.1 10.4 9.2 10.2
Unprocessed food 1.5 2.6 7.2 2.5 –1.6 –4.7 –2.7 –0.6 –0.6
Processed food (incl. alcoholic drinks and tobacco) 3.2 4.0 10.5 3.8 1.8 0.3 –1.8 0.7 0.9
Industrial non-food without energy 2.9 3.1 3.0 1.5 –0.5 –0.5 –1.1 –0.5 –0.9
Services 4.7 2.9 3.8 4.3 3.9 1.9 1.9 1.0 0.9
Other price indicators
Core inflation 2.5 3.0 5.7 2.8 0.2 –0.7 –1.7 –0.6 –0.7
Producer price index 2.7 3.4 8.3 –0.4 1.6 5.0 4.4 4.4 5.0
Source: CBS.
are several risks that could lead to higher than forecasted infla-tion in 2011. One of these risks is the possibility of a stronger-than-expected transmission of the increase in world prices of
CNB BULELTIN • INFORMATION ON ECONOMIC TRENDS AND FORECASTS • NUMBER 165 • 6 FOREIGN TRADE AND COMPETITIVENESS 15
possible rise in electricity and heat energy prices in 2011. The need for fiscal consolidation may prompt a rise in other admin-istratively set prices and the abolition of the zero VAT rate, but this is unlikely in view of the fact that 2011 is an election year.
6 Foreign trade and competitiveness
The strong contraction of the current account deficit that marked 2009 continued into 2010. The cumulative value of the deficit in the last four quarters thus decreased by EUR 1.2bn at end-September 2010 from the value recorded in 2009, the contraction being pronounced in particular in the first half of the year. A reduction in the current transaction account deficit was almost entirely determined by the movements in the goods account, where a fall in imports of goods was recorded until mid-year, along with a pronounced growth in exports. Accord-ing to seasonally adjusted data, recovery of total goods exports was strong in the first two months of 2010, increased exports of ships making a large contribution to their growth early in 2010 and exports of other goods later in the year. Nevertheless, up-wards trends ended in the third quarter and the seasonally ad-justed value of total exports was actually lower than in the previ-ous quarter. On the other hand, goods imports began to recover only in the third quarter 2010 and if imports of oil and refined petroleum products are excluded from the total aggregate, it is evident that import growth actually began as early as in the sec-ond quarter, after two years of continuous reduction.
A positive balance in the accounts of services and current transfers rose mildly in the first three quarters, as did the neg-ative balance in the income account. In the case of services, growing revenues from transportation services and other ser-vices contributed most to the positive change. Revenues from tourist services were somewhat lower than in 2009, despite a larger number of foreign tourist arrivals in the peak tourist sea-son, which can be accounted for, according to the data from the research on spending of foreign travellers, by poorer average consumption by foreign tourists.
Contraction of the current account deficit could continue into
the last quarter of 2010, accelerated exports growth and only a slight increase in imports still being predominant. It is estimated that the current account deficit in the whole of 2010 could drop to less than a half of the previous year’s deficit, amounting to 2.1% of the estimated GDP. This can primarily be accounted for by a fall in the foreign trade deficit due to a sharp increase in goods exports (it is estimated that exports could be 16.4% high-er than in 2009). Growth in total exports in 2010 was mostly affected by exports of ships, which was especially pronounced in the first half and the last quarter of the year. Nevertheless, it should be noted that total exports have still not regained the value recorded before the crisis and that the recovery is much weaker than in comparable European countries. In contrast to Croatia, following a strong correction at end-2008, exports from almost all new EU member states recorded a strong growth as early as in mid-2009, thus almost reaching the level in the period before the crisis. The upward trend of Croatia’s goods exports will probably not improve considerably in 2011 either, when a
food raw materials to domestic prices of food products. There is also the possibility that world prices of oil and other raw materi-als grow more than projected should the global economic recov-ery exceed expectations. An additional factor that could trigger a higher-than-expected increase in the annual inflation rate is a
–15
–12
–9
–6
–3
0
3
6
9
–16
–14
–12
–10
–8
–6
–4
–2
0
2006 2007 2008 2009 2010
bill
ion E
UR
as %
of
GD
P
Current transfers Income Goods
Services Current account – right
Figure 18 Current account deficit and its structuremoving average of four consecutive quarters
Source: CNB.
70
70
80
80
90
90
100
100
110
110
120
120
130
130
140
140
Q1
Q2
Q3
Q4
Q1
Q2
Q3
Q4
Q1
Q2
Q3
Q4
Q1
Q2
Q3
2007 2008 2009 2010
20
07
= 1
00
Czech R. Hungary Poland Romania
Eurozone Croatia
20
07
= 1
00
Bulgaria Estonia Latvia Lithuania
Slovak. R. Slovenia Eurozone Croatia
Figure 19 Goods exports of selected countriesquarterly moving average, seasonally adjusted data
Sources: Eurostat and CBS data adjusted by the CNB.
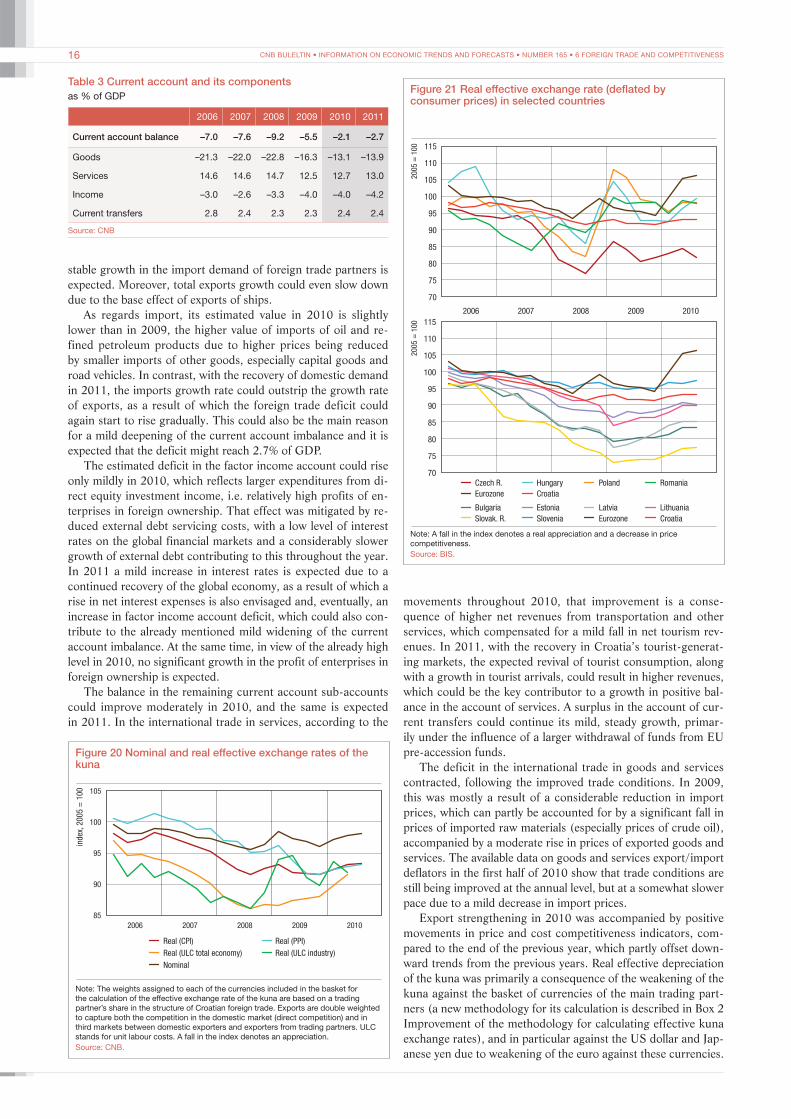
CNB BULELTIN • INFORMATION ON ECONOMIC TRENDS AND FORECASTS • NUMBER 165 • 6 FOREIGN TRADE AND COMPETITIVENESS16
movements throughout 2010, that improvement is a conse-quence of higher net revenues from transportation and other services, which compensated for a mild fall in net tourism rev-enues. In 2011, with the recovery in Croatia’s tourist-generat-ing markets, the expected revival of tourist consumption, along with a growth in tourist arrivals, could result in higher revenues, which could be the key contributor to a growth in positive bal-ance in the account of services. A surplus in the account of cur-rent transfers could continue its mild, steady growth, primar-ily under the influence of a larger withdrawal of funds from EU pre-accession funds.
The deficit in the international trade in goods and services contracted, following the improved trade conditions. In 2009, this was mostly a result of a considerable reduction in import prices, which can partly be accounted for by a significant fall in prices of imported raw materials (especially prices of crude oil), accompanied by a moderate rise in prices of exported goods and services. The available data on goods and services export/import deflators in the first half of 2010 show that trade conditions are still being improved at the annual level, but at a somewhat slower pace due to a mild decrease in import prices.
Export strengthening in 2010 was accompanied by positive movements in price and cost competitiveness indicators, com-pared to the end of the previous year, which partly offset down-ward trends from the previous years. Real effective depreciation of the kuna was primarily a consequence of the weakening of the kuna against the basket of currencies of the main trading part-ners (a new methodology for its calculation is described in Box 2 Improvement of the methodology for calculating effective kuna exchange rates), and in particular against the US dollar and Jap-anese yen due to weakening of the euro against these currencies.
stable growth in the import demand of foreign trade partners is expected. Moreover, total exports growth could even slow down due to the base effect of exports of ships.
As regards import, its estimated value in 2010 is slightly lower than in 2009, the higher value of imports of oil and re-fined petroleum products due to higher prices being reduced by smaller imports of other goods, especially capital goods and road vehicles. In contrast, with the recovery of domestic demand in 2011, the imports growth rate could outstrip the growth rate of exports, as a result of which the foreign trade deficit could again start to rise gradually. This could also be the main reason for a mild deepening of the current account imbalance and it is expected that the deficit might reach 2.7% of GDP.
The estimated deficit in the factor income account could rise only mildly in 2010, which reflects larger expenditures from di-rect equity investment income, i.e. relatively high profits of en-terprises in foreign ownership. That effect was mitigated by re-duced external debt servicing costs, with a low level of interest rates on the global financial markets and a considerably slower growth of external debt contributing to this throughout the year. In 2011 a mild increase in interest rates is expected due to a continued recovery of the global economy, as a result of which a rise in net interest expenses is also envisaged and, eventually, an increase in factor income account deficit, which could also con-tribute to the already mentioned mild widening of the current account imbalance. At the same time, in view of the already high level in 2010, no significant growth in the profit of enterprises in foreign ownership is expected.
The balance in the remaining current account sub-accounts could improve moderately in 2010, and the same is expected in 2011. In the international trade in services, according to the
70
70
75
75
80
80
85
85
90
90
95
95
100
100
105
105
110
110
115
115
2006 2007 2008 2009 2010
20
05
= 1
00
20
05
= 1
00
Czech R. Hungary Poland Romania
Eurozone Croatia
Bulgaria Estonia Latvia Lithuania
Slovak. R. Slovenia Eurozone Croatia
Figure 21 Real effective exchange rate (deflated by consumer prices) in selected countries
Note: A fall in the index denotes a real appreciation and a decrease in price competitiveness.Source: BIS.
85
90
95
100
105
2006 2007 2008 2009 2010
index
,20
05
= 1
00
Real (CPI) Real (PPI)
Real (ULC total economy) Real (ULC industry)
Nominal
Figure 20 Nominal and real effective exchange rates of the kuna
Note: The weights assigned to each of the currencies included in the basket for the calculation of the effective exchange rate of the kuna are based on a trading partner’s share in the structure of Croatian foreign trade. Exports are double weighted to capture both the competition in the domestic market (direct competition) and in third markets between domestic exporters and exporters from trading partners. ULC stands for unit labour costs. A fall in the index denotes an appreciation.Source: CNB.
Table 3 Current account and its componentsas % of GDP
2006 2007 2008 2009 2010 2011
Current account balance –7.0 –7.6 –9.2 –5.5 –2.1 –2.7
Goods –21.3 –22.0 –22.8 –16.3 –13.1 –13.9
Services 14.6 14.6 14.7 12.5 12.7 13.0
Income –3.0 –2.6 –3.3 –4.0 –4.0 –4.2
Current transfers 2.8 2.4 2.3 2.3 2.4 2.4
Source: CNB
CNB BULELTIN • INFORMATION ON ECONOMIC TRENDS AND FORECASTS • NUMBER 165 • 6 FOREIGN TRADE AND COMPETITIVENESS 17
Such exchange rate movements in the first three quarters were accompanied by a growth of domestic consumer and producer prices, which was faster than in the majority of trading partners. On the other hand, in the first half of 2010, the adjustment of unit labour costs in Croatia was more pronounced than in the main trading partners, at the level of the economy as a whole and at the level of industry. A decrease in unit labour costs is a result of a fall in employment stronger than that in GDP.
Except in Croatia, price competitiveness was improved in the majority of the new EU member states and in the eurozone in the first nine months of 2010, where the real effective exchange rate deflated by consumer prices depreciated compared to the end of the previous year. Nominal depreciation of the national currencies against the basket of currencies of the main trading
partners contributed most to these movements. In contrast to other observed countries, Poland and Romania did not record real effective depreciation, but this did not unfavourably affect the dynamics of their exports.
In accordance with the data for the first three quarters, a de-preciation of the real effective exchange rate of the kuna deflated by consumer prices could also be recorded in Croatia at the lev-el of the whole of 2010, in comparison with the previous year, mostly due to the nominal effective depreciation of the kuna. In 2011, a continuation of the depreciation of the real effective exchange rate of the kuna deflated by consumer prices is ex-pected, taking into account the Consensus Forecast projections concerning the exchange rate and price movements in the main trading partners.
Box 2 Improvement of the methodology for calculating effective kuna exchange rates
Both the nominal and real exchange rates of the kuna are monitored in the analysis of effective exchange rates. The nomi-nal effective exchange rate of the kuna reflects developments in the value of the domestic currency against the basket of se-lected currencies. The real effective exchange rate is the nominal exchange rate adjusted by the ratio of prices and/or costs be-tween Croatia and its main trading partners and is an indicator of the competitiveness of the domestic economy. It should be borne in mind that competitiveness also depends on numerous other factors. Some of them are: the quality of export products, the ability to adjust to changes in foreign demand and invest-ment in technological improvement of production processes.
This publication includes new indices of the nominal and real effective exchange rates of the kuna that differ from previously published effective exchange rates in the method used to de-termine the relative importance (weights) of individual curren-cies, i.e. countries included in their calculation. Under the former methodology, the weights assigned to bilateral exchange rates, i.e. relative prices and costs, were determined according to the average shares of individual foreign currencies in the structure of total foreign currency inflows into and outflows from the cur-rent account (ITRS data). The calculation of the indices of the ef-fective exchange rates thus included bilateral exchange rates of the kuna versus the euro, the US dollar, the Swiss franc and the pound sterling. By contrast, the International Monetary Fund, the Bank for International Settlements, the European Central Bank and many other central banks determine the weights based on a country’s trade relations with foreign countries. This method has now been adopted by the Croatian National Bank.
Under the new methodology, the weights for calculating ef-fective exchange rates of the kuna are based on the structure of imports and exports of manufactured goods.5 The weights reflect direct import competition, direct export competition and export competition in third markets.6 The calculation of overall weights is thus based on a matrix of very detailed foreign trade data. The formulas used in the calculation are explained below.
The import weight (Wijm ) is the share of a partner i in imports of
a country j (Croatia) from the group of selected partners, that is:
(1) W MM
ijm
j
ji
= .
In other words, the import weight measures the relative im-portance of a particular country from which Croatia imports. The export weight (Wij
x ) is actually a double weight which cap-tures both direct export competition and third-market competi-tion. Assuming that there are k export markets where country j competes with h foreign producers, the double-weighted export weight can be written as:7
(2) W XX
Y XY
XX
Y XX
ijx
j
ji
i hi
h
i
j
jk
k i k hk
h
ik
$ $=+
++!
cf
cf
mp
mp/ / /
where X denotes exports of a country indicated by the lower in-dex to a country indicated by the upper index, and Y denotes the value of domestically produced manufactured goods intend-ed for the domestic market. The usual practice is to assess Y by increasing value added in manufacturing industry by imports of manufactured goods (to approximate input factors in the pro-duction process, i.e. inputs in manufacturing that are imported or produced by enterprises outside the manufacturing industry) and reducing it by their exports. The first term on the right-hand side of expression (2) measures the direct competition between j’s exports to i and the domestic manufacturers in i’s market. The direct export weight is a bilateral export share multiplied by a measure of the openness of economy i (the share of domestic manufacturers of i in the total supply of manufacturing sector products in the domestic market of i). Accordingly, the weight of country i in the basket for calculating the effective exchange rate of country j will be higher if i is a more important export mar-ket for j and/or if economy i is relatively less open, which means that a larger portion of the supply of manufactured goods relates to domestic manufacturers of country i so that j’s exporters are faced with stronger competition from i’s domestic manufactur-ers. The second term on the right-hand side of expression (2) measures the third-market competition. If third market k is an important market for j’s exports and/or if i’s exports account for a large share in total imports to k market, this would imply that i
5 Included are commodities that are classified in the following sections of the Standard International Trade Classification (SITC): 5 (Chemicals and related prod-ucts), 6 (Manufactured goods classified chiefly by material), 7 (Machinery and transport equipment) and 8 (Miscellaneous manufactured articles), while food and energy products are excluded.
6 For more details on the calculation of weights, see Turner, P., and J. Van’t dack (1993): Measuring international price and cost competitiveness, BIS Economic paper No. 39; Klau, M., and S. Fung (2006): The New BIS Effective Exchange Rate Indices, BIS Quarterly Review; and Buldorini, L., S. Makrydakis, and C. Thimann, (2002): The effective exchange rates of the euro, Occasional Paper Series, European Central Bank.
7 It is assumed that countries included in the reference group for the calculation of the effective exchange rate are the only suppliers in k foreign markets, while exports and domestic production of manufactured goods by countries not included in the reference group do not compete with the countries included in that group.
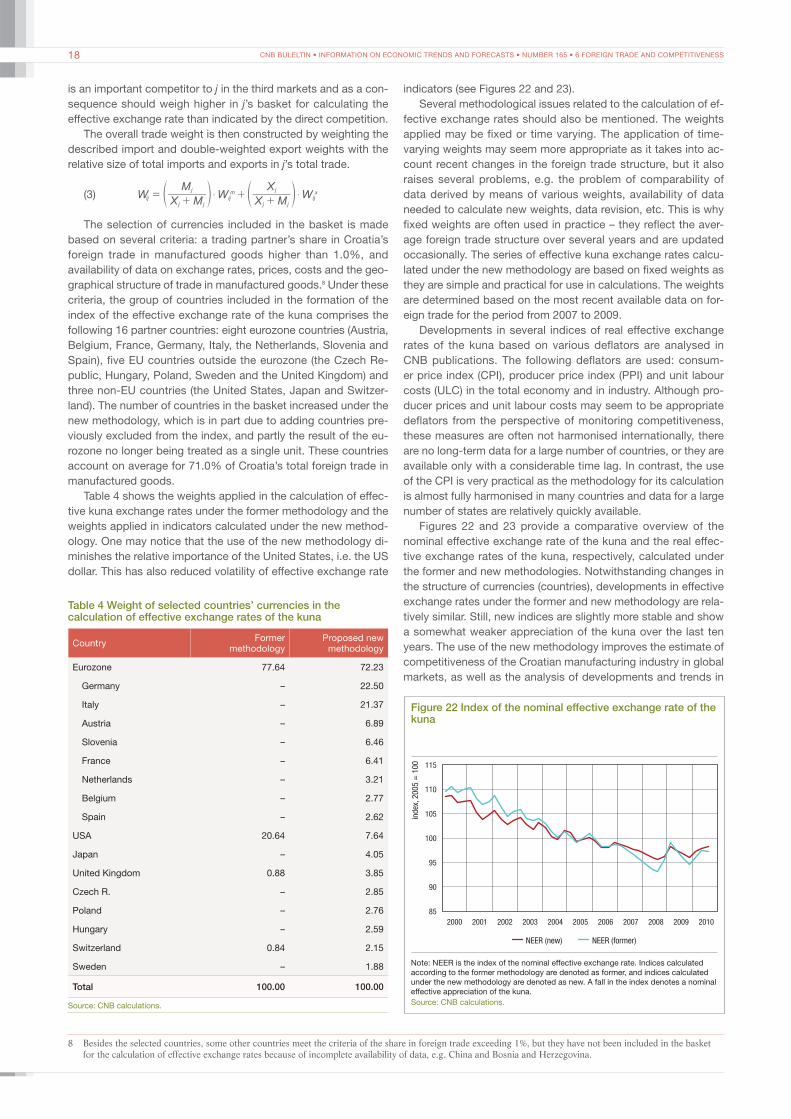
CNB BULELTIN • INFORMATION ON ECONOMIC TRENDS AND FORECASTS • NUMBER 165 • 6 FOREIGN TRADE AND COMPETITIVENESS18
is an important competitor to j in the third markets and as a con-sequence should weigh higher in j’s basket for calculating the effective exchange rate than indicated by the direct competition.
The overall trade weight is then constructed by weighting the described import and double-weighted export weights with the relative size of total imports and exports in j’s total trade.
(3) W X MM
W X MX
Wijj j
jijm
j j
jijx$ $=
++
+e eo o
The selection of currencies included in the basket is made based on several criteria: a trading partner’s share in Croatia’s foreign trade in manufactured goods higher than 1.0%, and availability of data on exchange rates, prices, costs and the geo-graphical structure of trade in manufactured goods.8 Under these criteria, the group of countries included in the formation of the index of the effective exchange rate of the kuna comprises the following 16 partner countries: eight eurozone countries (Austria, Belgium, France, Germany, Italy, the Netherlands, Slovenia and Spain), five EU countries outside the eurozone (the Czech Re-public, Hungary, Poland, Sweden and the United Kingdom) and three non-EU countries (the United States, Japan and Switzer-land). The number of countries in the basket increased under the new methodology, which is in part due to adding countries pre-viously excluded from the index, and partly the result of the eu-rozone no longer being treated as a single unit. These countries account on average for 71.0% of Croatia’s total foreign trade in manufactured goods.
Table 4 shows the weights applied in the calculation of effec-tive kuna exchange rates under the former methodology and the weights applied in indicators calculated under the new method-ology. One may notice that the use of the new methodology di-minishes the relative importance of the United States, i.e. the US dollar. This has also reduced volatility of effective exchange rate
indicators (see Figures 22 and 23).Several methodological issues related to the calculation of ef-
fective exchange rates should also be mentioned. The weights applied may be fixed or time varying. The application of time-varying weights may seem more appropriate as it takes into ac-count recent changes in the foreign trade structure, but it also raises several problems, e.g. the problem of comparability of data derived by means of various weights, availability of data needed to calculate new weights, data revision, etc. This is why fixed weights are often used in practice – they reflect the aver-age foreign trade structure over several years and are updated occasionally. The series of effective kuna exchange rates calcu-lated under the new methodology are based on fixed weights as they are simple and practical for use in calculations. The weights are determined based on the most recent available data on for-eign trade for the period from 2007 to 2009.
Developments in several indices of real effective exchange rates of the kuna based on various deflators are analysed in CNB publications. The following deflators are used: consum-er price index (CPI), producer price index (PPI) and unit labour costs (ULC) in the total economy and in industry. Although pro-ducer prices and unit labour costs may seem to be appropriate deflators from the perspective of monitoring competitiveness, these measures are often not harmonised internationally, there are no long-term data for a large number of countries, or they are available only with a considerable time lag. In contrast, the use of the CPI is very practical as the methodology for its calculation is almost fully harmonised in many countries and data for a large number of states are relatively quickly available.
Figures 22 and 23 provide a comparative overview of the nominal effective exchange rate of the kuna and the real effec-tive exchange rates of the kuna, respectively, calculated under the former and new methodologies. Notwithstanding changes in the structure of currencies (countries), developments in effective exchange rates under the former and new methodology are rela-tively similar. Still, new indices are slightly more stable and show a somewhat weaker appreciation of the kuna over the last ten years. The use of the new methodology improves the estimate of competitiveness of the Croatian manufacturing industry in global markets, as well as the analysis of developments and trends in
Table 4 Weight of selected countries’ currencies in the calculation of effective exchange rates of the kuna
Country Former methodology
Proposed new methodology
Eurozone 77.64 72.23
Germany – 22.50
Italy – 21.37
Austria – 6.89
Slovenia – 6.46
France – 6.41
Netherlands – 3.21
Belgium – 2.77
Spain – 2.62
USA 20.64 7.64
Japan – 4.05
United Kingdom 0.88 3.85
Czech R. – 2.85
Poland – 2.76
Hungary – 2.59
Switzerland 0.84 2.15
Sweden – 1.88
Total 100.00 100.00
Source: CNB calculations.
8 Besides the selected countries, some other countries meet the criteria of the share in foreign trade exceeding 1%, but they have not been included in the basket for the calculation of effective exchange rates because of incomplete availability of data, e.g. China and Bosnia and Herzegovina.
85
90
95
100
105
110
115
2000 2001 2002 2003 2004 2005 2006 2007 2008 2009 2010
ind
,20
05
= 1
00
ex
NEER (new) NEER (former)
Figure 22 Index of the nominal effective exchange rate of the kuna
Note: NEER is the index of the nominal effective exchange rate. Indices calculated according to the former methodology are denoted as former, and indices calculated under the new methodology are denoted as new. A fall in the index denotes a nominal effective appreciation of the kuna.Source: CNB calculations.
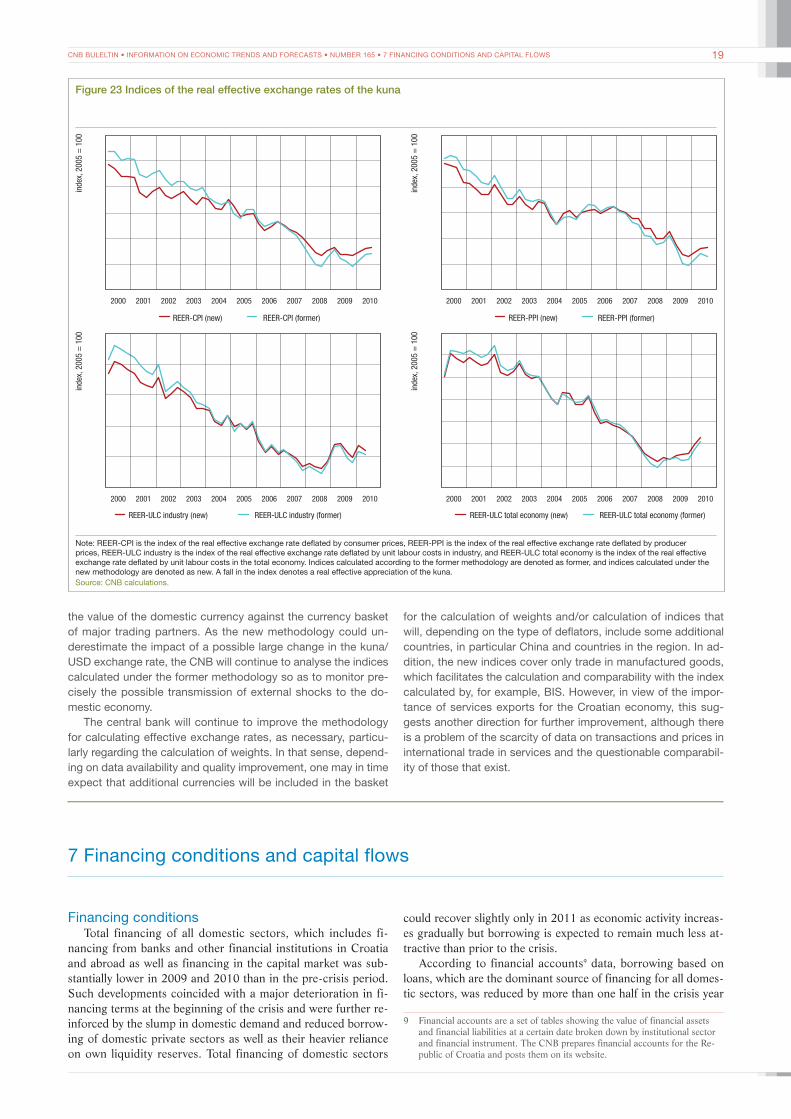
CNB BULELTIN • INFORMATION ON ECONOMIC TRENDS AND FORECASTS • NUMBER 165 • 7 FINANCING CONDITIONS AND CAPITAL FLOWS 19
2000 20002001 20012002 20022003 20032004 20042005 20052006 20062007 20072008 20082009 20092010 2010
2000 20002001 20012002 20022003 20032004 20042005 20052006 20062007 20072008 20082009 20092010 2010
index
,20
05
= 1
00
REER-CPI (new) REER-CPI (former) REER-PPI (former)
index
,2
00
5 =
10
0
REER-PPI (new)
index
,2
00
5 =
10
0
REER-ULC industry (new) REER-ULC industry (former) REER-ULC total economy (former)
index
,2
00
5 =
10
0
REER-ULC total economy (new)
the value of the domestic currency against the currency basket of major trading partners. As the new methodology could un-derestimate the impact of a possible large change in the kuna/USD exchange rate, the CNB will continue to analyse the indices calculated under the former methodology so as to monitor pre-cisely the possible transmission of external shocks to the do-mestic economy.
The central bank will continue to improve the methodology for calculating effective exchange rates, as necessary, particu-larly regarding the calculation of weights. In that sense, depend-ing on data availability and quality improvement, one may in time expect that additional currencies will be included in the basket
for the calculation of weights and/or calculation of indices that will, depending on the type of deflators, include some additional countries, in particular China and countries in the region. In ad-dition, the new indices cover only trade in manufactured goods, which facilitates the calculation and comparability with the index calculated by, for example, BIS. However, in view of the impor-tance of services exports for the Croatian economy, this sug-gests another direction for further improvement, although there is a problem of the scarcity of data on transactions and prices in international trade in services and the questionable comparabil-ity of those that exist.
Figure 23 Indices of the real effective exchange rates of the kuna
Note: REER-CPI is the index of the real effective exchange rate deflated by consumer prices, REER-PPI is the index of the real effective exchange rate deflated by producer prices, REER-ULC industry is the index of the real effective exchange rate deflated by unit labour costs in industry, and REER-ULC total economy is the index of the real effective exchange rate deflated by unit labour costs in the total economy. Indices calculated according to the former methodology are denoted as former, and indices calculated under the new methodology are denoted as new. A fall in the index denotes a real effective appreciation of the kuna.Source: CNB calculations.
7 Financing conditions and capital flows
Financing conditionsTotal financing of all domestic sectors, which includes fi-
nancing from banks and other financial institutions in Croatia and abroad as well as financing in the capital market was sub-stantially lower in 2009 and 2010 than in the pre-crisis period. Such developments coincided with a major deterioration in fi-nancing terms at the beginning of the crisis and were further re-inforced by the slump in domestic demand and reduced borrow-ing of domestic private sectors as well as their heavier reliance on own liquidity reserves. Total financing of domestic sectors
could recover slightly only in 2011 as economic activity increas-es gradually but borrowing is expected to remain much less at-tractive than prior to the crisis.
According to financial accounts9 data, borrowing based on loans, which are the dominant source of financing for all domes-tic sectors, was reduced by more than one half in the crisis year
9 Financial accounts are a set of tables showing the value of financial assets and financial liabilities at a certain date broken down by institutional sector and financial instrument. The CNB prepares financial accounts for the Re-public of Croatia and posts them on its website.
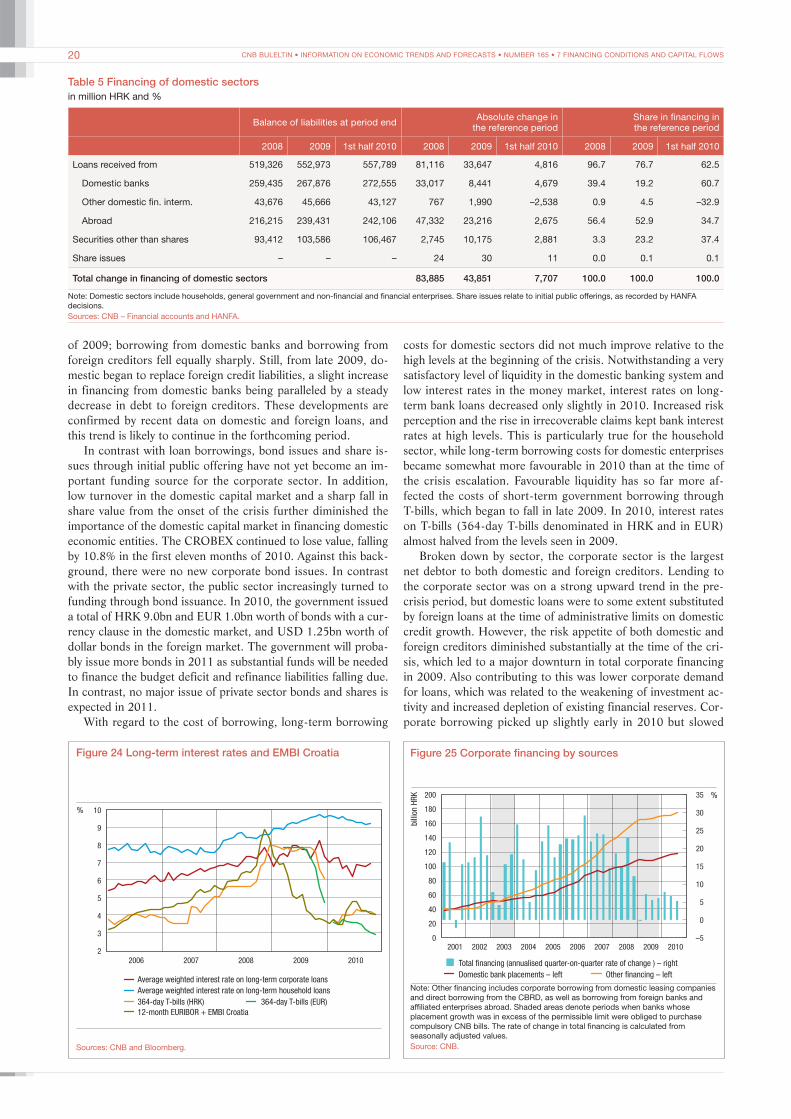
CNB BULELTIN • INFORMATION ON ECONOMIC TRENDS AND FORECASTS • NUMBER 165 • 7 FINANCING CONDITIONS AND CAPITAL FLOWS20
2
3
4
5
6
7
8
9
10%
2006 2007 2008 2009 2010
Average weighted interest rate on long-term corporate loans
Average weighted interest rate on long-term household loans
364-day T-bills (HRK) 364-day T-bills (EUR)
12-month EURIBOR + EMBI Croatia
Figure 24 Long-term interest rates and EMBI Croatia
Sources: CNB and Bloomberg.
%
0
20
40
60
80
100
120
140
160
180
200
–5
0
5
10
15
20
25
30
35
2001 2002 2003 2004 2005 2006 2007 2008 2009 2010
Total financing (annualised quarter-on-quarter rate of change ) – right
Domestic bank placements – left Other financing – left
bill
ion H
RK
Figure 25 Corporate financing by sources
Note: Other financing includes corporate borrowing from domestic leasing companies and direct borrowing from the CBRD, as well as borrowing from foreign banks and affiliated enterprises abroad. Shaded areas denote periods when banks whose placement growth was in excess of the permissible limit were obliged to purchase compulsory CNB bills. The rate of change in total financing is calculated from seasonally adjusted values.Source: CNB.
of 2009; borrowing from domestic banks and borrowing from foreign creditors fell equally sharply. Still, from late 2009, do-mestic began to replace foreign credit liabilities, a slight increase in financing from domestic banks being paralleled by a steady decrease in debt to foreign creditors. These developments are confirmed by recent data on domestic and foreign loans, and this trend is likely to continue in the forthcoming period.
In contrast with loan borrowings, bond issues and share is-sues through initial public offering have not yet become an im-portant funding source for the corporate sector. In addition, low turnover in the domestic capital market and a sharp fall in share value from the onset of the crisis further diminished the importance of the domestic capital market in financing domestic economic entities. The CROBEX continued to lose value, falling by 10.8% in the first eleven months of 2010. Against this back-ground, there were no new corporate bond issues. In contrast with the private sector, the public sector increasingly turned to funding through bond issuance. In 2010, the government issued a total of HRK 9.0bn and EUR 1.0bn worth of bonds with a cur-rency clause in the domestic market, and USD 1.25bn worth of dollar bonds in the foreign market. The government will proba-bly issue more bonds in 2011 as substantial funds will be needed to finance the budget deficit and refinance liabilities falling due. In contrast, no major issue of private sector bonds and shares is expected in 2011.
With regard to the cost of borrowing, long-term borrowing
Table 5 Financing of domestic sectorsin million HRK and %
Balance of liabilities at period end Absolute change in the reference period
Share in financing in the reference period
2008 2009 1st half 2010 2008 2009 1st half 2010 2008 2009 1st half 2010
Loans received from 519,326 552,973 557,789 81,116 33,647 4,816 96.7 76.7 62.5
Domestic banks 259,435 267,876 272,555 33,017 8,441 4,679 39.4 19.2 60.7
Other domestic fin. interm. 43,676 45,666 43,127 767 1,990 –2,538 0.9 4.5 –32.9
Abroad 216,215 239,431 242,106 47,332 23,216 2,675 56.4 52.9 34.7
Securities other than shares 93,412 103,586 106,467 2,745 10,175 2,881 3.3 23.2 37.4
Share issues – – – 24 30 11 0.0 0.1 0.1
Total change in financing of domestic sectors 83,885 43,851 7,707 100.0 100.0 100.0
Note: Domestic sectors include households, general government and non-financial and financial enterprises. Share issues relate to initial public offerings, as recorded by HANFA decisions.Sources: CNB – Financial accounts and HANFA.
costs for domestic sectors did not much improve relative to the high levels at the beginning of the crisis. Notwithstanding a very satisfactory level of liquidity in the domestic banking system and low interest rates in the money market, interest rates on long-term bank loans decreased only slightly in 2010. Increased risk perception and the rise in irrecoverable claims kept bank interest rates at high levels. This is particularly true for the household sector, while long-term borrowing costs for domestic enter prises became somewhat more favourable in 2010 than at the time of the crisis escalation. Favourable liquidity has so far more af-fected the costs of short-term government borrowing through T-bills, which began to fall in late 2009. In 2010, interest rates on T-bills (364-day T-bills denominated in HRK and in EUR) almost halved from the levels seen in 2009.
Broken down by sector, the corporate sector is the largest net debtor to both domestic and foreign creditors. Lending to the corporate sector was on a strong upward trend in the pre-crisis period, but domestic loans were to some extent substituted by foreign loans at the time of administrative limits on domestic credit growth. However, the risk appetite of both domestic and foreign creditors diminished substantially at the time of the cri-sis, which led to a major downturn in total corporate financing in 2009. Also contributing to this was lower corporate demand for loans, which was related to the weakening of investment ac-tivity and increased depletion of existing financial reserves. Cor-porate borrowing picked up slightly early in 2010 but slowed

CNB BULELTIN • INFORMATION ON ECONOMIC TRENDS AND FORECASTS • NUMBER 165 • 7 FINANCING CONDITIONS AND CAPITAL FLOWS 21
10 The private sector includes all sectors of the economy with the exception of general government. Therefore, it also includes a part of the public sector, i.e. public enterprises.
down gradually over the year. A major upturn in total corporate financing is not expected in 2011 as corporate funding needs will remain limited, particularly in light of the still weak invest-ment cycle.
The contraction in bank lending was even more evident in the household sector. Having decreased slightly in 2009, the balance of total household loans remained almost unchanged in the first ten months of 2010. Within the structure of household loans, car loans and credit card loans recorded a decrease. On the other hand, the increase in the balance of housing loans is fully attributable to changes in the kuna exchange rate against the Swiss franc, the currency to which a substantial portion of housing loans is indexed. Along with the fall in consumption, the described trends were strongly affected by supply side factors. Interest rates on household loans remained very high, at above 10% for short-term loans, while only interest rates on car loans dropped somewhat more, by around 2 percentage points on av-erage throughout 2010.
By cutting the reserve requirement rate in 2010, the CNB did not only lower funding costs for banks and provide a boost to the banking system liquidity but it also released the funds needed to finance the government’s incentive programme to spur corpo-rate lending (model A). Though the central bank thus attempted to induce the banks to reduce funding costs for final users, the impact of this was limited in 2010. Should circumstances in the domestic financial market allow, the CNB will continue to sup-port the high liquidity in the forthcoming period, which should add to the lowering of interest rates in 2011. Coupled with the expected increase in demand for loans, this could contribute to the recovery in bank lending. The rise in bank placements to the private sector is expected to be more rapid in 2011 than in the year before (excluding the exchange rate effect, it could be some 5.0%, compared with 3.5% expected in 2010).
At the time of limited access to foreign financial markets, the recovery of domestic lending is necessary to fuel overall eco-nomic recovery. However, it should be borne in mind that the gap between developments in private sector lending and real GDP widened during the crisis, with the contraction in real ac-tivity being much stronger than in credit aggregates, and that the fall in the level of placements occurred with a time lag rel-ative to the fall in real GDP and personal consumption. This means that even a more moderate credit growth than that in the pre-crisis period could be sufficient to finance the recovery in
real economic activity in 2011. It is also possible that a stronger credit recovery occurs with a time lag relative to developments in the real sector.
With regard to the expected growth in placements, downside risks prevail. This is due to factors both on the loan supply side (the rise in non-performing loans and the consequent increase in aversion to new risks) and on the demand side (negative trends in the labour market, lack of corporate investment projects). With regard to the use of funds earmarked for corporate financ-ing through model A, the most recent auction results and trends in approving funds within this model suggest the possibility that not all available funds will be drawn. This is also due to the lack of adequate collateral that enterprises have to provide to obtain credit lines within model A. Finally, should foreign borrowing of the government be impeded, the private sector could be crowded out from the domestic loan market.
Foreign capital flowsThe first three quarters of 2010 were marked by the nar-
rowing of the domestic savings-investment gap, as evident from the contraction of both the Croatian current account deficit and foreign capital inflows. An analysis of the gap’s sectoral distri-bution shows that this was mostly due to the continued decline in the savings-investment gap of the private sector10 which, in times of reduced capital availability, increased uncertainty and negative expectations regarding future economic developments,
%
0
40
80
120
160
–10
–5
0
5
10
15
20
25
30
bill
ion H
RK
2005 2006 2007 2008 2009 2010
Car loans – left Other consumer loans – left
Housing and mortgage loans – left
Household loans (annualised quarter-on-quarter rate of change) – right
Figure 26 Household loans by purpose
Note: Quarter-on-quarter rates of change in loans are calculated from seasonally adjusted values excluding the exchange rate effect.Source: CNB.
100
110
120
130
140
150
100
150
200
250
300
350
100
110
120
130
140
150
160
100
170
240
310
380
450
520
20
01
20
02
20
03
20
04
20
05
20
06
20
07
20
08
20
09
20
10
Bank placements to the private sector – right
Household loans – right
GDP – left
Personal consumption – left
index
,20
00
= 1
00
index
,20
00
= 1
00
Figure 27 Relation between bank lending and real sector developmentsreal seasonally adjusted values
Note: Placements to the private sector and household loans were deflated by the consumer price index.Source: CNB.

CNB BULELTIN • INFORMATION ON ECONOMIC TRENDS AND FORECASTS • NUMBER 165 • 7 FINANCING CONDITIONS AND CAPITAL FLOWS22
considerably reduced its investments and spending, while slight-ly increasing its savings. In the same period, the savings-invest-ment gap of general government remained mostly unchanged from the previous year. The private sector gap could continue to narrow in the last quarter of 2010, while the negative gap of the public sector could continue to grow due to the sharp increase in expenditures and the resultant decline in savings.
The cut in the current account deficit, which fell to below 3% of GDP in the third quarter of 2010, was accompanied by lower foreign capital inflows. Excluding the change in international re-serves, which increased by EUR 0.6bn, the capital and finan-cial account saw only small net inflows of foreign capital (EUR 0.6bn) in the first three quarters. This clearly reflects the current reluctance of foreign investors to finance investment projects as well as the reduced funding needs of the domestic economy. These trends are likely to continue in the last quarter of 2010, particularly regarding borrowing, which could cease completely. The absence of foreign capital inflows will be compensated by a slightly larger decrease in international reserves, which will par-tially offset their growth over the summer months.
Foreign borrowing costs for domestic entities steadily
decreased from the second half of 2009 and stayed relatively low in the first half of 2010 thanks to extremely low interest rates in the European and world financial markets. However, a new wave of uncertainty in financial markets, initially triggered by the Greek debt crisis and followed by negative developments in Ireland that raised fears about the spread of the debt crisis to other eurozone countries, could have a negative impact on risk perception in the forthcoming period and raise the costs of new foreign borrowing. Should projections regarding the eurozone economic recovery in 2011 hold true, benchmark interest rates in the European market will certainly increase mildly. Without a major reduction in risk premiums, this could also adversely af-fect foreign borrowing costs for domestic entities.
Against the background of unfavourable conditions in the domestic and foreign markets, inflows of FDI into Croatia aver-aged EUR 0.4bn in the last few quarters, far below those record-ed in the pre-crisis period. The bulk of investment in the first three quarters of 2010 related to direct equity investment, while some came from the transformation of a part of the debt to af-filiated enterprises (among others, that related to round-tripping transactions) into capital. The remaining part was accounted for
–3
0
3
6
9
12
15
18
21
24
27
30
–11
–10
–9
–8
–7
–6
–5
–4
–3
–2
–1
0
2006 2007 2008 2009 2010
Savings-investment gap – right
Private investment
Private savings
General government investment
General government savings
as %
of
GD
P
as %
of
GD
P
Figure 28 Savings-investment balanceas % of GDP, four-quarter moving average
Source: CNB.
bill
ion E
UR
2006 2007 2008 2009 2010
Foreign equity liabilities Foreign debt liabilities
Change in international reserves Foreign assets
Total capital inflows
–1.2
–0.8
–0.4
0.0
0.4
0.8
1.2
1.6
2.0
2.4
Figure 29 Current account deficit financingfour-quarter moving average
Note: A negative change in foreign assets and international reserves denotes their growth. Round tripping is excluded from capital inflows.Source: CNB.
%
0
100
200
300
400
500
600
0
1
2
3
4
5
6
2006 2007 2008 2009 2010
bas
is p
oints
EMBI – Croatia
EMBI – Europea
One-year EURIBOR – right
Figure 30 Emerging Market Bond Index and EURIBOR
a Poland, Hungary, Turkey, Lithuania, Croatia and Bulgaria.Source: Bloomberg.
0
5
10
15
20
25
30
35
40
45
50
0
10
20
30
40
50
60
70
80
90
100
2006 2007 2008 2009 2010
bill
ion E
UR
External debt
Net external debt – right
Foreign claims
External debt – right
as %
of
GD
P
Figure 31 Gross and net external debt
Note: Foreign claims include international reserves and foreign assets of banks and other domestic sectors based on debt instruments. Net external debt is calculated as the difference between external debt and foreign claims. The lighter shaded columns denote projected values.Source: CNB.

CNB BULELTIN • INFORMATION ON ECONOMIC TRENDS AND FORECASTS • NUMBER 165 • 7 FINANCING CONDITIONS AND CAPITAL FLOWS 23
by reinvested earnings, which increased compared with the pre-vious year due to the profit made in the production of oil as well as the reduction of losses in the non-banking financial industry (leasing companies). No significant improvement in the invest-ment climate or major changes in Croatia’s competitiveness with regard to attracting foreign investment are to be expected in the short run. This is why foreign direct investment in 2011 could be only marginally larger than in 2010. Apart from risks associ-ated with new investment inflows, there are serious risks associ-ated with a potential withdrawal of a major portion of current or accumulated profit by foreign owners of domestic enterprises and banks.
As regards financing by borrowing abroad, domestic sectors used these sources only marginally in the first three quarters of 2010, since their needs were lower due to weaker economic ac-tivity. Domestic funding sources thus allowed domestic banks even to decrease their debt to foreign creditors in the first nine months of 2010, while domestic enterprises borrowed abroad up to the amount sufficient only for the refinancing of due liabilities to banks and affiliated enterprises abroad. Only the government raised additional funds by issuing USD 1.25bn worth of bonds in the US financial market in July.
According to the recorded net transactions, foreign liabili-ties of domestic sectors declined by EUR 0.2bn in the first three
quarters, but their gross external debt grew by a slightly larger amount because of the negative effect of cross-currency chang-es. As a result, gross external debt stood at EUR 43.4bn at end-September 2010. In contrast, net external debt decreased in the same period due to the growth in foreign assets of domestic sec-tors, banks in particular, and the rise in international reserves after the tourist season.
As external debt should not grow substantially in late 2010, its ratio to GDP could remain at 96%. Notwithstanding the ex-pected slight economic recovery in 2011, a new cycle of strong foreign borrowing will probably not begin, at least on the part of enterprises, the debt of which could continue growing at a very slow pace. However, central government needs could certainly be higher due to the rising budget deficit. Also, banks will prob-ably support somewhat stronger lending in the country, particu-larly to the corporate sector, by a somewhat higher use of for-eign funds. Overall, the growth rate of total external debt could be somewhat faster in 2011 than in 2010. Apart from slightly larger needs of domestic sectors for foreign funding, there is a risk of the negative impact of cross-currency changes in case the euro weakens substantially against other world currencies. Not-withstanding a somewhat faster debt increase, the relative indi-cator of external debt should not deteriorate strongly thanks to expected nominal GDP growth.
Box 3 How much is the domestic economy burdened by foreign borrowing costs?
The high level of accumulated external debt and uncertainties about financing conditions and options in international markets raise the question of how much the domestic economy is bur-dened by interest costs on foreign borrowing. Interest expenses on foreign borrowing by domestic debtors steadily increased in absolute terms until the end of 2008, while at the peak of the crisis they stood at EUR 1.7bn on an annual level (3.6% of GDP and 8.5% of exports of goods and services). Owing to a grad-ual decrease in interest rates in the foreign market and slow-er external debt growth, interest expenses fell slightly in 2009 and somewhat more prominently in 2010. These developments largely reflect the drop in interest expenses of domestic banks, whose borrowing from foreign banks was mostly determined by
trends in benchmark interest rates on the European market. In contrast, corporate borrowing costs, which are more dependent on the country’s risk perception, decreased much slower, while the negative impact of risk was even more powerful with regard to the central government, whose interest expenses continued to increase.
The high level of interest expenses is the outcome of the increase in external debt, the annual growth rate of which av-eraged around 12% in the period before the economic crisis. However, for a comprehensive analysis of factors contributing to the rise in interest expenses, it is necessary to determine the influence of changes in financing conditions, i.e. interest rates on the foreign borrowing of domestic sectors. It is difficult to
0.0
0.5
1.0
1.5
2.0
2.5
3.0
3.5
4.0
0.0
1.5
3.0
4.5
6.0
7.5
9.0
10.5
12.0
as %
of
GD
P
as %
of
expor
ts o
f goo
ds
and s
ervi
ces
2001 2002 2003 2004 2005 2006 2007 2008 2009 2010a
Government expenditures Bank expenditures
Total interest expenses – right
Corporate expenditures
Corporate expenditures – right
Figure 32 Relative indicators of foreign borrowing costs
a CNB estimate.Note: Cost indicators relate only to interest payments on foreign borrowing, while principal payments on external debt are not included.Source: CNB.
–50
–40
–30
–20
–10
0
10
20
30
20062005200420032002 2007 2008 2009 2010
Impact of change in debt stock
Impact of change in implicit interest rate
Quarterly change in interest expenses
mill
ion E
UR
Figure 33 Contributions of changes in debt stock and implicit interest rates to growth in interest expensesfour-quarter moving average
Source: CNB.

CNB BULELTIN • INFORMATION ON ECONOMIC TRENDS AND FORECASTS • NUMBER 165 • 7 FINANCING CONDITIONS AND CAPITAL FLOWS24
analyse liabilities as they are in practice contracted at different terms and based on different benchmark rates. For the purposes of this analysis, the average indicator of borrowing costs was calculated as the ratio of interest expenses in a certain period to the external debt balance at the end of the previous period (im-plicit interest rate).11
A separate analysis of the impact of debt growth and chang-es in the implicit interest rate on developments in interest ex-penses over the past years yields the conclusion that the in-crease in expenses was more correlated with the debt growth, particularly during the period of vigorous borrowing from 2005 to 2008. Still, an additional negative influence in that period came from the rise in average borrowing costs. Although a slight ex-ternal debt increase generated new expenditures in 2009 and 2010, total interest expenses decreased thanks to the lower av-erage cost of debt.
Viewing implicit interest rate movements broken down by sectors, one may notice considerable differences, particularly during the economic crisis (Figure 34). Prior to analysing these differences, it should be noted that the calculated implicit inter-est rate for a particular sector does not reflect only current fi-nancing terms (the burden of new debt), but also the burden of interest payments on the total accumulated external debt. This is the reason why implicit interest rates for the government sector differ strongly from those for other sectors; the central govern-ment’s total debt is long-term and mostly contracted at a fixed rate, so its interest costs do not follow current conditions in the international market. However, this is not the case with banks and enterprises, which predominantly borrow at variable interest rates and for shorter terms. Accordingly, during the crisis years of 2009 and 2010, when benchmark interest rates were at ex-tremely low levels and when corporates and banks took on al-most no new debt burdens but merely rescheduled their existing due debts, their implicit interest rates fell sharply. In contrast, the implicit interest rate for the government was rising in that pe-riod, reflecting the high yields that, in high-risk conditions, were needed to induce foreign investors to buy new issues of govern-ment bonds and thus provide the funding needed to finance the growing budget deficit.
Movements in the implicit interest rate for domestic sectors can thus be linked to general financing conditions in the bench-mark (European) market, as well as the foreign creditors’ risk perception of the Croatian economy. EURIBOR reflects general financing conditions in the European market, while EMBI12 is one of the risk premium indicators. A comparison of these two in-dicators with movements in the implicit interest rate yields the conclusion that the cost of foreign borrowing up to 2006 was un-der a favourable impact of the parallel decline in European mar-ket interest rates and the risk premium. Then followed a gradual increase in interest rates, which was fuelled by inflation growth until the escalation of the crisis, when the ECB began to pursue an expansionary monetary policy that led to the sharp decrease in interest rates. However, financial market turbulence also af-fected risk premiums, which peaked in late 2008, and raised bor-rowing costs for Croatian economic entities at the turn of 2008-2009. Due to the decrease in benchmark interest rates and risk perception, borrowing costs began to decline gradually later on.
It is unlikely that implicit interest rates will stay long at the relatively low levels recorded in 2010. In general, an increase in them could be brought about by a mild EURIBOR growth
%
20062005200420032002 2007 2008 2009 2010
Government Banks Enterprises Total debt
2.0
2.5
3.0
3.5
4.0
4.5
5.0
5.5
6.0
Figure 34 Implicit interest rates on external debt of domestic sectors
Source: CNB.
0
1
2
3
4
5
6
0
100
200
300
400
500
in %
,fou
r-quar
ter
mov
ing a
vera
ge
EMBI Croatia – right
GDBR5
One-year EURIBOR (EUR)
Implicit interest rate
bas
is p
oints
,quar
terl
y av
erag
e
2002 2003 2004 2005 2006 2007 2008 2009 2010
Figure 35 Financing conditions in the European market
Note: GDBR5 (Generic German government bonds rate) represents the cost of five-year borrowing for the German government, which financial markets perceive as minimum risk.Sources: CNB and Bloomberg.
0
1
2
3
4
5
6
SC 1 (impl. int. rate = 5.0%; stronger growth in debt-to-GDP ratio)
SC 2 (impl. int. rate = 3.5%; fall in debt-to-GDP ratio)
Baseline scenario (impl. int. rate = 4.0%; mild growth in debt-to-GDP ratio)
as %
of
GD
P
2006
2005
2004
2003
2001
2002
2007
2008
2009
2010
2011
2012
2013
2014
2015
Figure 36 Future developments in interest expenses on external debt
Source: CNB.
11 Implicit interest ratet = Interest expensest /External debt balancet–1
12 EMBI (Emerging Market Bond Index) is the spread between yields on government securities of emerging markets, including Croatia, and risk-free securities of developed countries.

CNB BULELTIN • INFORMATION ON ECONOMIC TRENDS AND FORECASTS • NUMBER 165 • 8 MONETARY POLICY 25
associated with the expected stronger recovery of the eurozone. In the case of Croatia, an increase could be enhanced by a pos-sible increase in the risk premium. Interest rate growth will cer-tainly speed up the pace of growth in interest expenses of do-mestic entities. In this context, an additional reason for concern is the steady borrowing trend of the central government, which is expected to continue in the forthcoming period.
Several scenarios were run to analyse expected movements in interest expenses over the following five-year period (Figure 36). The baseline scenario assumes a continued slight deteriora-tion in both the relative indicator of external debt (the debt-to-GDP ratio increases from the current 96% to 102% at the end of
2015) and in financing terms (the implicit interest rate grows from 3.5% to 4.0% on average). Under these assumptions, one may expect that the interest payments-to-GDP ratio will exceed 4% (baseline scenario). Assuming a more severe deterioration in ex-ternal debt due to the faster increase in debt than in GDP, and a higher level of implicit interest rates (5%), the interest payments-to-GDP ratio could reach 6% by 2015 (scenario 1). Only a major adjustment, in the form of a faster growth in GDP than in exter-nal debt by the end of 2015, coupled with favourable financing terms (scenario 2), would enable the stabilisation of the interest payments-to-GDP ratio at the current level.
8 Monetary policy
The Croatian National Bank achieves its main objective – maintenance of price stability – primarily by maintaining the sta-bility of the exchange rate of the kuna against the euro as the main nominal anchor. The choice of such an exchange rate pol-icy reflects the conditions in which the central bank operates, above all the openness of the Croatian economy and an extreme-ly high degree of euroisation. In such conditions, developments in the nominal exchange rate of the domestic currency strongly influence domestic price movements, inflationary expectations, the financial stability of the domestic banking system, and over-all economic activity.
In the context of maintaining kuna stability, foreign capital inflows are one of the key factors determining the use of mon-etary policy instruments. Although the intensity of inflows was much weaker in 2010 than in the period preceding the global financial crisis, the central bank continued to use its main mon-etary policy instrument – foreign exchange interventions. De-mand and supply in the foreign exchange market were relatively balanced in the first five months of 2010, but appreciation pres-sures on the domestic currency strengthened in June. The CNB purchased a total of EUR 363.7m from banks through foreign exchange interventions in June and July, successfully putting an end to the upward trend of the kuna.
Depreciation pressures were more pronounced in the rest of 2010, particularly in the fourth quarter, which witnessed an in-crease in demand for foreign exchange from the banking sector (repayments of foreign liabilities and profit allocations to foreign owners) and the corporate sector (payments for imports). The central bank intervened again, selling a total of EUR 350.1m in two foreign exchange interventions in November, thus easing depreciation pressures.
With regard to the bilateral exchange rate of the kuna against other currencies, whose movements are not influenced by the CNB but reflect cross-currency movements in the global foreign exchange market, the kuna weakened against major global cur-rencies in 2010. The problems of public debt sustainability of some eurozone countries triggered strong fluctuations in the exchange rate of the euro against most other currencies in the global foreign exchange market. Due to the strengthening of the Swiss franc vs. the euro, the kuna weakened against the franc by 14.5% from the beginning of 2010 through to end-November,
which considerably increased the loan repayment burden for debtors whose liabilities are indexed to that currency.13 As the US dollar also strengthened against the euro, the kuna weak-ened versus the US dollar, by 10.5% in the first eleven months of 2010.
The kuna/euro exchange rate is expected to remain stable in 2011, with seasonal fluctuations, while the central bank will sup-port exchange rate stability by foreign exchange interventions, as necessary. Appreciation pressures could stem from expect-ed foreign currency inflows from government foreign borrow-ing and seasonal demand for the kuna during summer. On the other hand, depreciation pressures on the kuna could be fuelled by demand for euro funds required for external debt repayment, and potential outflows of funds due to full liberalisation of capi-tal movements, which will come into effect at the beginning of 2011.14 It should be noted that, apart from foreign exchange in-terventions, the central bank is ready to use other monetary poli-cy instruments to preserve exchange rate stability, which particu-larly refers to the possible change in the reserve requirement rate.
13 More than 20% of total household loans and around 5% of corporate loans are indexed to the Swiss franc; the share of these loans is the largest in car loans (around 50%) and housing loans (over 40%).
14 Capital flows will be fully liberalised as from 1 January 2011, which means that domestic legal and natural persons will be allowed to open accounts abroad.
4
5
6
7
8
9
20062005200420032001 2002 2007 2008 2009 2010
HRK/EUR HRK/CHF HRK/USD
CN
B m
idpoi
nt
exch
ange
rate
Figure 37 Nominal exchange rates HRK/EUR, HRK/USD and HRK/CHF
Source: CNB.
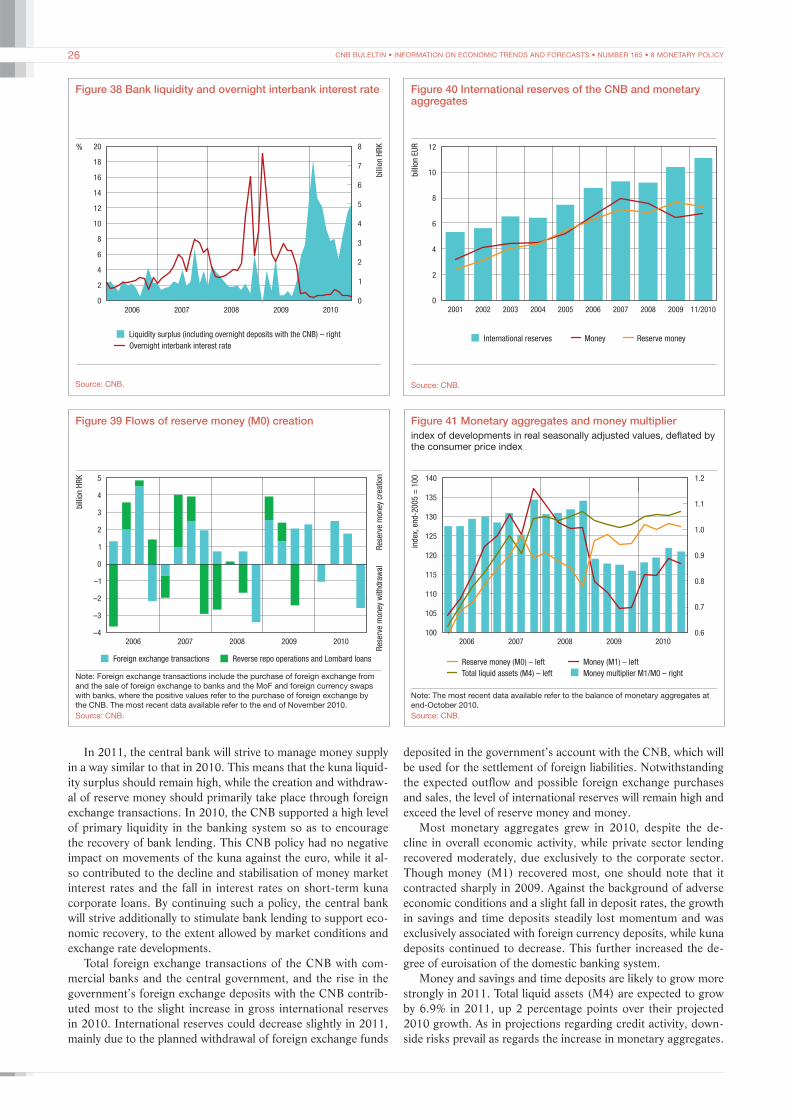
CNB BULELTIN • INFORMATION ON ECONOMIC TRENDS AND FORECASTS • NUMBER 165 • 8 MONETARY POLICY26
In 2011, the central bank will strive to manage money supply in a way similar to that in 2010. This means that the kuna liquid-ity surplus should remain high, while the creation and withdraw-al of reserve money should primarily take place through foreign exchange transactions. In 2010, the CNB supported a high level of primary liquidity in the banking system so as to encourage the recovery of bank lending. This CNB policy had no negative impact on movements of the kuna against the euro, while it al-so contributed to the decline and stabilisation of money market interest rates and the fall in interest rates on short-term kuna corporate loans. By continuing such a policy, the central bank will strive additionally to stimulate bank lending to support eco-nomic recovery, to the extent allowed by market conditions and exchange rate developments.
Total foreign exchange transactions of the CNB with com-mercial banks and the central government, and the rise in the government’s foreign exchange deposits with the CNB contrib-uted most to the slight increase in gross international reserves in 2010. International reserves could decrease slightly in 2011, mainly due to the planned withdrawal of foreign exchange funds
0
2
4
6
8
10
12
bill
ion E
UR
2001 2002 2003 2004 2005 2006 2007 2008 2009 11/2010
International reserves Reserve moneyMoney
Figure 40 International reserves of the CNB and monetary aggregates
Source: CNB.
–4
–3
–2
–1
0
1
2
3
4
5
bill
ion H
RK
Res
erve
mon
ey c
reat
ion
Res
erve
mon
ey w
ithdra
wal
2006 2007 2008 2009 2010
Foreign exchange transactions Reverse repo operations and Lombard loans
Figure 39 Flows of reserve money (M0) creation
Note: Foreign exchange transactions include the purchase of foreign exchange from and the sale of foreign exchange to banks and the MoF and foreign currency swaps with banks, where the positive values refer to the purchase of foreign exchange by the CNB. The most recent data available refer to the end of November 2010.Source: CNB.
0
2
4
6
8
10
12
14
16
18
20
0
1
2
3
4
5
6
7
8%
bill
ion H
RK
Liquidity surplus (including overnight deposits with the CNB) – right
Overnight interbank interest rate
2006 2007 2008 2009 2010
Figure 38 Bank liquidity and overnight interbank interest rate
Source: CNB.
100
105
110
115
120
125
130
135
140
2006 2007 2008 2009 20100.6
0.7
0.8
0.9
1.0
1.1
1.2
index
,end-2
005 =
100
Money multiplier M1/M0 – right
Money (M1) – leftReserve money (M0) – left
Total liquid assets (M4) – left
Figure 41 Monetary aggregates and money multiplierindex of developments in real seasonally adjusted values, deflated by the consumer price index
Note: The most recent data available refer to the balance of monetary aggregates at end-October 2010.Source: CNB.
deposited in the government’s account with the CNB, which will be used for the settlement of foreign liabilities. Notwithstanding the expected outflow and possible foreign exchange purchases and sales, the level of international reserves will remain high and exceed the level of reserve money and money.
Most monetary aggregates grew in 2010, despite the de-cline in overall economic activity, while private sector lending recovered moderately, due exclusively to the corporate sector. Though money (M1) recovered most, one should note that it contracted sharply in 2009. Against the background of adverse economic conditions and a slight fall in deposit rates, the growth in savings and time deposits steadily lost momentum and was exclusively associated with foreign currency deposits, while kuna deposits continued to decrease. This further increased the de-gree of euroisation of the domestic banking system.
Money and savings and time deposits are likely to grow more strongly in 2011. Total liquid assets (M4) are expected to grow by 6.9% in 2011, up 2 percentage points over their projected 2010 growth. As in projections regarding credit activity, down-side risks prevail as regards the increase in monetary aggregates.
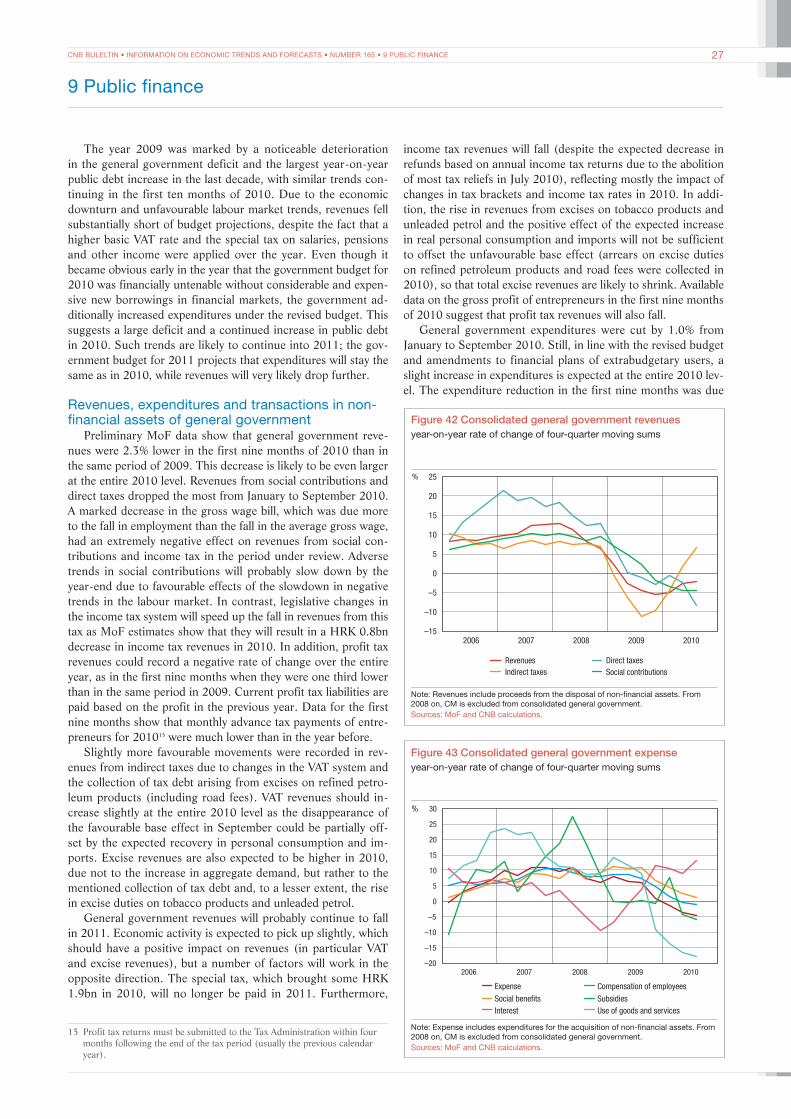
CNB BULELTIN • INFORMATION ON ECONOMIC TRENDS AND FORECASTS • NUMBER 165 • 9 PUBLIC FINANCE 27
15 Profit tax returns must be submitted to the Tax Administration within four months following the end of the tax period (usually the previous calendar year).
9 Public finance
The year 2009 was marked by a noticeable deterioration in the general government deficit and the largest year-on-year public debt increase in the last decade, with similar trends con-tinuing in the first ten months of 2010. Due to the economic downturn and unfavourable labour market trends, revenues fell substantially short of budget projections, despite the fact that a higher basic VAT rate and the special tax on salaries, pensions and other income were applied over the year. Even though it became obvious early in the year that the government budget for 2010 was financially untenable without considerable and expen-sive new borrowings in financial markets, the government ad-ditionally increased expenditures under the revised budget. This suggests a large deficit and a continued increase in public debt in 2010. Such trends are likely to continue into 2011; the gov-ernment budget for 2011 projects that expenditures will stay the same as in 2010, while revenues will very likely drop further.
Revenues, expenditures and transactions in non-financial assets of general government
Preliminary MoF data show that general government reve-nues were 2.3% lower in the first nine months of 2010 than in the same period of 2009. This decrease is likely to be even larger at the entire 2010 level. Revenues from social contributions and direct taxes dropped the most from January to September 2010. A marked decrease in the gross wage bill, which was due more to the fall in employment than the fall in the average gross wage, had an extremely negative effect on revenues from social con-tributions and income tax in the period under review. Adverse trends in social contributions will probably slow down by the year-end due to favourable effects of the slowdown in negative trends in the labour market. In contrast, legislative changes in the income tax system will speed up the fall in revenues from this tax as MoF estimates show that they will result in a HRK 0.8bn decrease in income tax revenues in 2010. In addition, profit tax revenues could record a negative rate of change over the entire year, as in the first nine months when they were one third lower than in the same period in 2009. Current profit tax liabilities are paid based on the profit in the previous year. Data for the first nine months show that monthly advance tax payments of entre-preneurs for 201015 were much lower than in the year before.
Slightly more favourable movements were recorded in rev-enues from indirect taxes due to changes in the VAT system and the collection of tax debt arising from excises on refined petro-leum products (including road fees). VAT revenues should in-crease slightly at the entire 2010 level as the disappearance of the favourable base effect in September could be partially off-set by the expected recovery in personal consumption and im-ports. Excise revenues are also expected to be higher in 2010, due not to the increase in aggregate demand, but rather to the mentioned collection of tax debt and, to a lesser extent, the rise in excise duties on tobacco products and unleaded petrol.
General government revenues will probably continue to fall in 2011. Economic activity is expected to pick up slightly, which should have a positive impact on revenues (in particular VAT and excise revenues), but a number of factors will work in the opposite direction. The special tax, which brought some HRK 1.9bn in 2010, will no longer be paid in 2011. Furthermore,
income tax revenues will fall (despite the expected decrease in refunds based on annual income tax returns due to the abolition of most tax reliefs in July 2010), reflecting mostly the impact of changes in tax brackets and income tax rates in 2010. In addi-tion, the rise in revenues from excises on tobacco products and unleaded petrol and the positive effect of the expected increase in real personal consumption and imports will not be sufficient to offset the unfavourable base effect (arrears on excise duties on refined petroleum products and road fees were collected in 2010), so that total excise revenues are likely to shrink. Available data on the gross profit of entrepreneurs in the first nine months of 2010 suggest that profit tax revenues will also fall.
General government expenditures were cut by 1.0% from January to September 2010. Still, in line with the revised budget and amendments to financial plans of extrabudgetary users, a slight increase in expenditures is expected at the entire 2010 lev-el. The expenditure reduction in the first nine months was due
%
–15
–10
–5
0
5
10
15
20
25
2006 2007 2008 2009 2010
Revenues Direct taxes
Social contributionsIndirect taxes
Figure 42 Consolidated general government revenuesyear-on-year rate of change of four-quarter moving sums
Note: Revenues include proceeds from the disposal of non-financial assets. From 2008 on, CM is excluded from consolidated general government.Sources: MoF and CNB calculations.
%
–20
–15
–10
–5
0
5
10
15
20
25
30
2006 2007 2008 2009 2010
Expense Compensation of employees
Social benefits Subsidies
Interest Use of goods and services
Figure 43 Consolidated general government expenseyear-on-year rate of change of four-quarter moving sums
Note: Expense includes expenditures for the acquisition of non-financial assets. From 2008 on, CM is excluded from consolidated general government.Sources: MoF and CNB calculations.
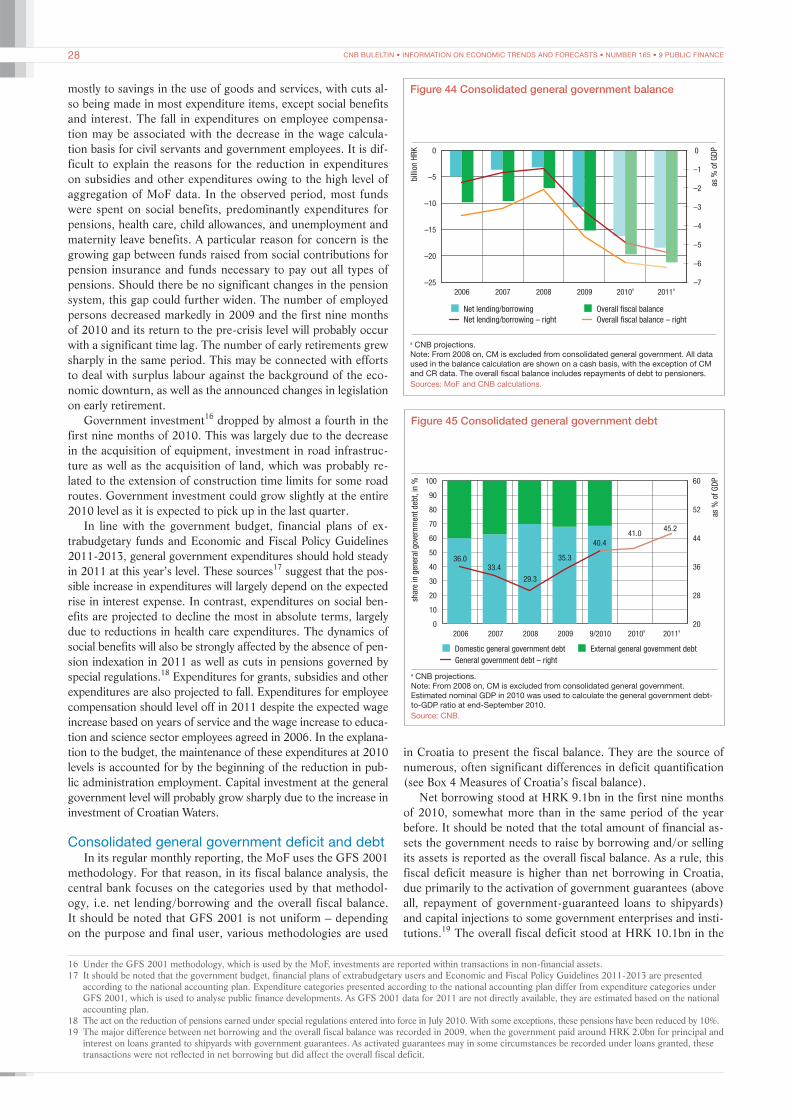
CNB BULELTIN • INFORMATION ON ECONOMIC TRENDS AND FORECASTS • NUMBER 165 • 9 PUBLIC FINANCE28
mostly to savings in the use of goods and services, with cuts al-so being made in most expenditure items, except social benefits and interest. The fall in expenditures on employee compensa-tion may be associated with the decrease in the wage calcula-tion basis for civil servants and government employees. It is dif-ficult to explain the reasons for the reduction in expenditures on subsidies and other expenditures owing to the high level of aggregation of MoF data. In the observed period, most funds were spent on social benefits, predominantly expenditures for pensions, health care, child allowances, and unemployment and maternity leave benefits. A particular reason for concern is the growing gap between funds raised from social contributions for pension insurance and funds necessary to pay out all types of pensions. Should there be no significant changes in the pension system, this gap could further widen. The number of employed persons decreased markedly in 2009 and the first nine months of 2010 and its return to the pre-crisis level will probably occur with a significant time lag. The number of early retirements grew sharply in the same period. This may be connected with efforts to deal with surplus labour against the background of the eco-nomic downturn, as well as the announced changes in legislation on early retirement.
Government investment16 dropped by almost a fourth in the first nine months of 2010. This was largely due to the decrease in the acquisition of equipment, investment in road infrastruc-ture as well as the acquisition of land, which was probably re-lated to the extension of construction time limits for some road routes. Government investment could grow slightly at the entire 2010 level as it is expected to pick up in the last quarter.
In line with the government budget, financial plans of ex-trabudgetary funds and Economic and Fiscal Policy Guidelines 2011-2013, general government expenditures should hold steady in 2011 at this year’s level. These sources17 suggest that the pos-sible increase in expenditures will largely depend on the expected rise in interest expense. In contrast, expenditures on social ben-efits are projected to decline the most in absolute terms, largely due to reductions in health care expenditures. The dynamics of social benefits will also be strongly affected by the absence of pen-sion indexation in 2011 as well as cuts in pensions governed by special regulations.18 Expenditures for grants, subsidies and other expenditures are also projected to fall. Expenditures for employee compensation should level off in 2011 despite the expected wage increase based on years of service and the wage increase to educa-tion and science sector employees agreed in 2006. In the explana-tion to the budget, the maintenance of these expenditures at 2010 levels is accounted for by the beginning of the reduction in pub-lic administration employment. Capital investment at the general government level will probably grow sharply due to the increase in investment of Croatian Waters.
Consolidated general government deficit and debtIn its regular monthly reporting, the MoF uses the GFS 2001
methodology. For that reason, in its fiscal balance analysis, the central bank focuses on the categories used by that methodol-ogy, i.e. net lending/borrowing and the overall fiscal balance. It should be noted that GFS 2001 is not uniform – depending on the purpose and final user, various methodologies are used
in Croatia to present the fiscal balance. They are the source of numerous, often significant differences in deficit quantification (see Box 4 Measures of Croatia’s fiscal balance).
Net borrowing stood at HRK 9.1bn in the first nine months of 2010, somewhat more than in the same period of the year before. It should be noted that the total amount of financial as-sets the government needs to raise by borrowing and/or selling its assets is reported as the overall fiscal balance. As a rule, this fiscal deficit measure is higher than net borrowing in Croatia, due primarily to the activation of government guarantees (above all, repayment of government-guaranteed loans to shipyards) and capital injections to some government enterprises and insti-tutions.19 The overall fiscal deficit stood at HRK 10.1bn in the
–25
0
–7
0
–20
–15
–10
–5
–6
–5
–4
–3
–2
–1
bill
ion H
RK
as %
of
GD
P
Net lending/borrowing
Net lending/borrowing – right
Overall fiscal balance
Overall fiscal balance – right
2006 2007 2008 2009 2010a
2011a
Figure 44 Consolidated general government balance
a CNB projections.Note: From 2008 on, CM is excluded from consolidated general government. All data used in the balance calculation are shown on a cash basis, with the exception of CM and CR data. The overall fiscal balance includes repayments of debt to pensioners.Sources: MoF and CNB calculations.
0
100
20
60
10
20
30
40
50
60
70
80
90
28
36
44
52
shar
e in
gen
eral
gov
ernm
ent
deb
t,in
%
as %
of
GD
P
45.2
36.033.4
29.3
35.3
41.0
40.4
Domestic general government debt
General government debt – right
External general government debt
2006 2007 2008 2009 2010a
2011a
9/2010
Figure 45 Consolidated general government debt
a CNB projections.Note: From 2008 on, CM is excluded from consolidated general government. Estimated nominal GDP in 2010 was used to calculate the general government debt-to-GDP ratio at end-September 2010.Source: CNB.
16 Under the GFS 2001 methodology, which is used by the MoF, investments are reported within transactions in non-financial assets.17 It should be noted that the government budget, financial plans of extrabudgetary users and Economic and Fiscal Policy Guidelines 2011-2013 are presented
according to the national accounting plan. Expenditure categories presented according to the national accounting plan differ from expenditure categories under GFS 2001, which is used to analyse public finance developments. As GFS 2001 data for 2011 are not directly available, they are estimated based on the national accounting plan.
18 The act on the reduction of pensions earned under special regulations entered into force in July 2010. With some exceptions, these pensions have been reduced by 10%.19 The major difference between net borrowing and the overall fiscal balance was recorded in 2009, when the government paid around HRK 2.0bn for principal and
interest on loans granted to shipyards with government guarantees. As activated guarantees may in some circumstances be recorded under loans granted, these transactions were not reflected in net borrowing but did affect the overall fiscal deficit.

CNB BULELTIN • INFORMATION ON ECONOMIC TRENDS AND FORECASTS • NUMBER 165 • 9 PUBLIC FINANCE 29
period from January to September 2010 and was entirely gener-ated at the state budget level. The government raised the bulk of the funds needed to finance the deficit and refinance liabilities in the domestic and foreign capital markets. In addition, it used the funds deposited with the CNB raised through bond issues in the US market in late 2009.
Apart from projected movements in revenues and expendi-tures, deficit trends to the end of 2010 will be largely affected by the expected activation of guarantees (mostly those issued to shipyards) and planned outlays for shares. Accordingly, the gen-eral government overall fiscal deficit could reach HRK 19.7bn or 6.0% of GDP estimated for 2010 (of which HRK 0.8bn or 0.2% of GDP relates to this year’s debt repayment to pensioners). The government secured most of the funds needed in the last quar-ter of 2010 to finance the deficit and refinance the obligations (excluding liabilities arising from T-bills) already in July, when it again tapped the foreign capital market for funds. The govern-ment also issued HRK 4bn worth of kuna bonds in the domestic
capital market in late November. Public debt is expected to be some 41.0% of GDP at the end of 2010.
In 2011, the general government deficit could reach HRK 21.2bn, or 6.2% of the projected GDP. In contrast to 2010, the deficit should grow at all levels of the general government. The risk to the realisation of projected values is primarily associated with the extent to which the peak of the political cycle affects the expenditure dynamics. An increase in expenditures could largely be generated by local government units as the increase in central government expenditures should be constrained by the adopted conclusion to maintain total expenditures of the gov-ernment budget and extrabudgetary users in 2011 at the 2010 level. Regardless of these risks, public debt will certainly con-tinue to grow and could exceed 45% of the projected nominal GDP at the end of 2011. It should be noted that the projected debt balance excludes the potential assumption of shipyards’ li-abilities guaranteed by the state.
Box 4 Measures of Croatia’s fiscal balance
Efforts are made to present statistical data on the basis of a uniform international statistical methodology so as to enable their meaningful comparison. The most often-used statistical methodology in the area of government finance is the Interna-tional Monetary Fund’s methodology Government Finance Sta-tistics from 2001 (GFS 2001), while some countries, and even the IMF itself, in some situations still use the former IMF meth-odology from 1986 (GFS 1986). The European Union has devel-oped its own statistical standard entitled the European System of Accounts (ESA 95). Statistical methodologies ESA 95 and GFS 2001 are in essence identical. Still, ESA 95 defines more precisely the recording of some specific transactions to achieve better comparability of EU member states statistics.
GFS 2001 defines several possible measures of the fiscal bal-ance. To keep as close as possible to national accounting princi-ples, GFS 2001 takes the category net lending/borrowing as the main fiscal balance measure, which is calculated by subtracting expenditures and net acquisitions of non-financial assets from revenues. Other measures of the fiscal balance are also used for
analytical purposes. For example, a broader measure of the fis-cal balance is the overall fiscal balance, which shows the total amount of funds the government needs to raise by the dispos-al of financial and non-financial assets and/or borrowing. The overall fiscal balance is calculated by including expenditures for shares and other securities and outlays for net loans granted in total expenditures and by reducing total revenues by proceeds from the disposal of non-financial assets.
As the institution responsible for maintaining statistics and reporting on fiscal results, the Ministry of Finance has reported fiscal data in line with the GFS 2001 methodology from 2004 on, while in its regular publications (monthly statistical reviews and annual reports) it uses net lending/borrowing as the meas-ure of the fiscal balance. As accrual accounting is not applied to monthly and quarterly data, which is required under GFS 2001, on an annual level data are adjusted by the change in arrears.20 In addition to this measure of the fiscal balance, the MoF pre-pares annual fiscal data in accordance with ESA 9521 for the purposes of reporting to Eurostat and the European Commis-sion. The main difference between data reported under ESA 95 and net lending/borrowing reported in regular MoF publications is that the deficit calculation includes activated guarantees and
20 Only data for Croatian Roads (CR) are currently available under both the accrual and cash basis.
21 Thus presented data may be found in the Pre-accession Economic Pro-gramme of the Croatian government.
Table 6 Overall fiscal balance calculation
1 Revenues
2 Expense
3 Net operating balance (1–2)
4 Acquisition of non-financial assets
5 Disposal of non-financial assets
6 Change in non-financial assets (4–5)
7 Net lending (+) / borrowing (–) (3–6)
8 Disposal of non-financial assets
9 Net acquisition of loans
10 Shares and other equities: acquisitions
11 Securities other than shares: acquisitions
12 Other accounts receivable: acquisition
13 Repayment of debt to pensioners
14 Change in arrears
15 Overall fiscal balance (7–8–9–10–11–12–13–14)
Source: CNB.
Table 7 Consolidated general government balanceas % of GDP
2005 2006 2007 2008 2009
Ministry of Finance
GFS 2001 methodology Net lending/borrowing
–2.7 –1.7 –1.2 –0.9 –3.2
ESA 95 metholodogy Net lending/borrowing
–4.0 –3.0 –2.5 –1.4 –4.1
Croatian National Bank
GFS 2001 methodologyOverall fiscal balance
–3.5 –3.4 –3.1 –2.1 –4.6
Note: From 2008 on, CM is excluded from consolidated general government. All data used in the balance calculation are shown on a cash basis, with the exception of CM and CR data.Sources: MoF, CNB and Eurostat.

CNB BULELTIN • INFORMATION ON ECONOMIC TRENDS AND FORECASTS • NUMBER 165 • 10 MODELS USED TO PREPARE ESTIMATED AND/OR PROJECTED VALUES30
repayments of debt to pensioners. Interestingly, in its regular re-ports on Article IV consultations, the IMF uses ESA 95, but sepa-rately reports on debt repayments to pensioners.
The CNB holds that the overall fiscal balance is the meas-ure that best captures real government financing needs as it shows the amount of funds the government needs to raise by borrowing and/or the disposal of non-financial and financial as-sets, which is crucial for monetary policy implementation. This is why this measure is used in preparing CNB projections of the consolidated general government balance and its financing. This measure is further adjusted by outlays for debt repayment to pensioners, in line with Eurostat rules and, on an annual level, by the change in arrears of the government and local government units, subject to data availability. The balance calculation used
by the CNB is given in Table 6. It should be noted that the cal-culation of the overall balance is not in full compliance with GFS 2001. In particular, revenues should include the regular disposal of non-financial assets, such as the sale of government and mili-tary flats in Croatia. However, as available data are not sufficient-ly disaggregated, the CNB excludes from the overall balance all revenues from the disposal of non-financial assets.
The substantial difference between net lending/borrowing and the overall fiscal balance used by the CNB results from the categories that are definitely included in the fiscal balance ac-cording to ESA 95 (activated government guarantees for loans granted mostly to shipyards22 and repayments of debt to pen-sioners).
22 Under GFS 2001, principal and interest payments arising from activated government guarantees may be recorded as loans granted, i.e. increase in financial as-sets (not included in expenditures) as long as there is a real probability that the government will be able to collect from the original debtor. The MoF believes that all payments arising from activated guarantees will be collected and so excludes them from expenditures.
23 The significant influence of external variables on the Croatian economy has been established in a number of studies. For example, see Krznar, I., and D. Kunovac (2010): Impact of External Shocks on Domestic Inflation and GDP, Croatian National Bank Working Papers, W-26, December 2010.
24 Consensus Economics collects forecasts for individual economic variables for a large number of countries that are being prepared by numerous professional institutions (investment banks, institutes of economics, international organisations, etc.) and calculates and publishes their average in the publication entitled Consensus Forecasts.
25 SARIMA models are described in Pufnik, A., and D. Kunovac (2006): Short-Term Forecasting of Inflation in Croatia with Seasonal ARIMA Processes, Croatian National Bank Working Papers, W-16, December 2006.
10 Models used to prepare estimated and/or projected values
The Croatian National Bank uses a number of economic and econometric models to prepare estimated and/or projected val-ues of particular macroeconomic variables. The models used are the results of the work of CNB researchers that continuously develop and improve the models to meet central bank needs as well as possible. Estimations and projections derived from these models together with expert judgement by CNB researchers are the basis for preparing specialised publications. The text below provides a brief overview of the models used. Particular models will be described in more detail in the following issues of this publication to present their characteristics, advantages and limi-tations to the (professional) public in the best possible way.
Forecast models start from the fact that a small open econo-my such as Croatia is strongly affected by developments in the environment.23 It should be borne in mind that projections are partly based on assumptions about external developments that are taken over from projections of the International Monetary Fund, European Commission, Consensus Economics24 and other sources. They primarily cover prices of raw materials (crude oil and food), interest rates and other key variables to estimate EU and global economic growth.
All models were assessed based on available time series for Croatia, which is a limitation as these series are short and sub-ject to structural changes. A particular problem is the entry into recession in 2008, when correlations between macroeconomic variables considerably changed relative to the period before the escalation of the crisis. Such circumstances require that existing models be constantly modified to make them as reliable and ef-ficient as possible.
The models used may be roughly divided into those for short-term forecasts, forecasts for several quarters and for medium-term forecasts. Short-term forecasting models are often atheo-retical and rely on statistical regularities of changes in individual variables. In contrast, medium-term forecasting models are most
often based on economic theory, which provides for consistent forecasts for a large number of macroeconomic variables.
The system of forecasting models for consumer price inflation stands apart among short-term forecasting models because of its complexity. The first type of inflation forecasting models are SA-RIMA (seasonal ARIMA) models, which are used for forecast-ing the overall aggregate of consumer prices, i.e. for forecasting individual components of consumer prices and for their subse-quent aggregation.25 To capture the assumptions about trends in the environment, the simple SARIMA model is expanded by several exogenous variables – oil and food prices on the world market. Apart from the described univariate models, multivariate VAR models are used to model interactions among several vari-ables simultaneously. In addition to simple VAR models, VAR models with block-exogenous restrictions are applied because of their suitability to describe a small open economy such as Croa-tia, where the restrictions imposed prevent the influence of do-mestic variables on exogenous variables. Factor-augmented VAR (FAVAR) models are applied so as to use additional information comprised in a large number of series since they cannot be cap-tured directly by the models due to the shortness of the series. In the first step of these models, the main components method is used to estimate a few factors from a large group of available inflation indicators; these factors are then included in the VAR model and used for forecasting. The final inflation forecast is calculated by combining all these models into a unified inflation forecast by use of a simple arithmetic mean.
Particular attention is paid to estimating current values of variables that are as yet unpublished in the official statistics (nowcasting). This particularly refers to GDP figures, which are published two months after the end of the quarter to which they relate. Using previously available information on the series (most often higher frequency series), which are strongly cor-related with the series being estimated, it is possible to derive

CNB BULELTIN • INFORMATION ON ECONOMIC TRENDS AND FORECASTS • NUMBER 165 • 10 MODELS USED TO PREPARE ESTIMATED AND/OR PROJECTED VALUES 31
as a tool for analysing alternative scenarios based on various as-sumptions. In addition to medium-term forecasts, it has been used to analyse a potential impact of external and domestic shocks on the Croatian economy. It includes many sectors and enables an estimation of numerous shocks, which makes it suit-able for an analysis of the largest possible range of scenarios. Because of its complexity, the model has not been estimated but calibrated.
Results of various models obtained on the basis of assump-tions about developments in the environment are compared and combined, and serve as a foundation for preparing estimated and/or projected values. Projections obtained are most often in the form of point estimate forecasts, while a wider forecast prob-ability distribution in the form of a fan chart27 is prepared for GDP and inflation.
an estimation of a subsequently available series. The CNB uses bridge and factor models for current estimates of Croatian gross domestic product based on high-frequency data available before the publication of GDP figures.
Medium-term forecasts (projection horizon of more than six months) use models that, based on economic theory, cor-relate movements of different economic variables, which ensures consistency of projections. Several structural economic models are used for this purpose. The simplest SVAR models include a small number of main series: the main external (foreign inflation and foreign demand) and domestic variables (domestic inflation, loan growth, domestic demand).
The most complex model that has been developed and used in the CNB is the dynamic stochastic general equilibrium model (DSGE model), whose structure has been adjusted to the Croa-tian economy.26 The DSGE model has primarily been designed
26 For more details on the model, see Bokan, N., L. Grgurić., I. Krznar, and M. Lang (2009): The Impact of the Financial Crisis and Policy Responses in Croatia, Croatian National Bank Working Papers, W-22, December 2009.
27 For more details, see Box 1 Forecast risks presented in the form of a fan chart.

Statistical survey

CNB BULLETIN • NUMBER 165 • STATISTICAL SURVEY • CLASSIFICATION AND PRESENTATION OF DATA ON CLAIMS AND LIABILITIES 35
Data on financial institutions’ claims and liabilities are classi-fied according to institutional sectors and financial instruments. Institutional sectors are: financial institutions, central govern-ment and funds, other domestic sectors and foreign sector.
The financial institutions sector includes the following sub-sectors: monetary authorities (the central bank), banks, other banking institutions and non-banking financial institutions. The central bank is the Croatian National Bank (CNB). Banks are institutions to which the Croatian National Bank has issued a license to perform banking business services in accordance with the Banking Act, including savings banks during a transition period. Data on banks do not include claims and liabilities of banks undergoing bankruptcy proceedings, nor former branches of banks headquartered outside the Republic of Croatia. Other banking institutions comprise housing savings banks, savings and loan cooperatives and investment funds. Non-banking fi-nancial institutions are financial institutions not classified as banks or other banking institutions (e.g. insurance companies, pension funds).
The central government and funds consists of two subsec-tors, the Republic of Croatia and central government funds. Until December 2003, the subsector Republic of Croatia in-cluded government authorities, comprising the Croatian Roads, the Croatian Motorways and the State Agency for Deposit
Insurance and Bank Rehabilitation. The subsector central gov-ernment funds includes the Croatian Institute for Health Insur-ance, the Croatian Pension Insurance Administration, the Croa-tian Employment Service, the Croatian Privatisation Fund, the Croatian Waters and the Croatian Bank for Reconstruction and Development.
Since January 2004, the Croatian Roads, the Croatian Mo-torways, and the State Agency for Deposit Insurance and Bank Rehabilitation have been reclassified, from the subsector Repub-lic of Croatia to the subsector central government funds.
Other domestic sectors include local government authorities, public and other enterprises and households, including crafts-men and non-profit institutions providing services to house-holds. The subsector other enterprises also comprises banks undergoing bankruptcy proceedings. In some tables other do-mestic sectors are divided into the following subsectors: local government (which comprises units of local and regional self-government), public and other enterprises, and households (in-cluding craftsmen and non-profit institutions).
Foreign sector includes foreign legal and natural persons.All data on claims and liabilities refer to balances at the end
of the reporting period. Foreign currency items are reported in their kuna equivalent at the CNB’s midpoint exchange rate at the end of the reporting period.
Classification and presentation of data on claims and liabilities
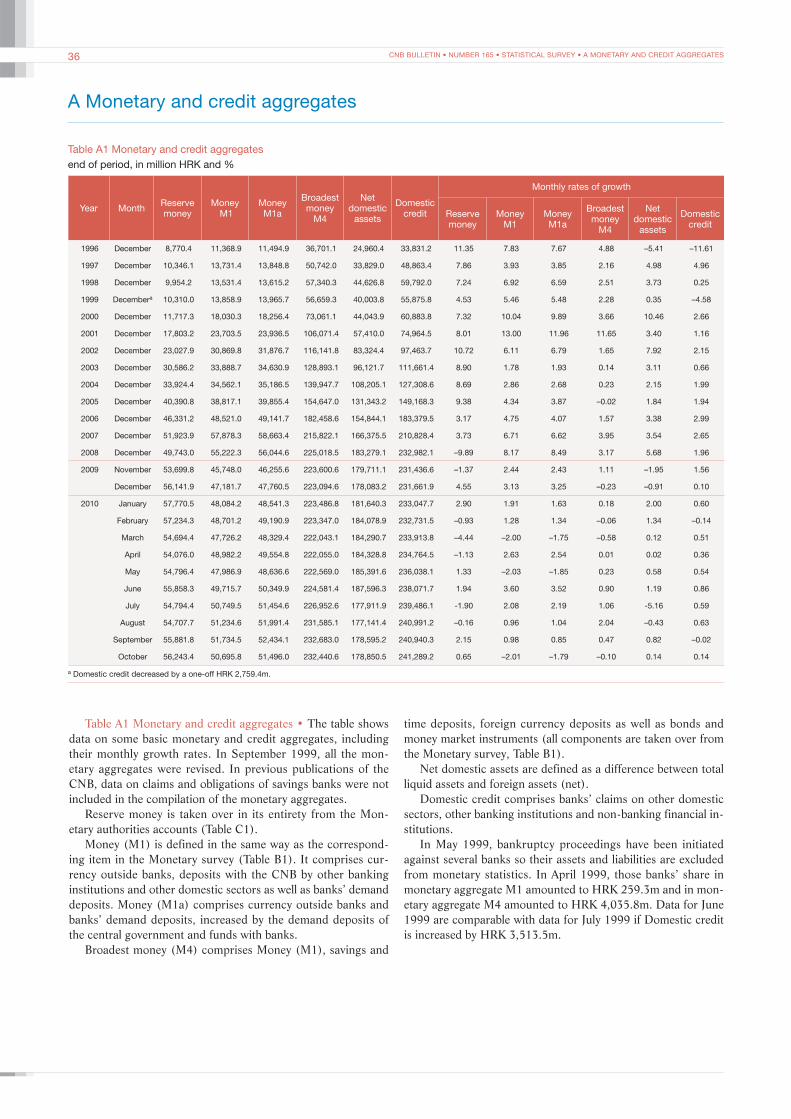
CNB BULLETIN • NUMBER 165 • STATISTICAL SURVEY • A MONETARY AND CREDIT AGGREGATES36
A Monetary and credit aggregates
Table A1 Monetary and credit aggregatesend of period, in million HRK and %
Year Month Reserve money
Money M1
Money M1a
Broadest money
M4
Net domestic
assets
Domestic credit
Monthly rates of growth
Reserve money
Money M1
Money M1a
Broadest money
M4
Net domestic
assets
Domestic credit
1996 December 8,770.4 11,368.9 11,494.9 36,701.1 24,960.4 33,831.2 11.35 7.83 7.67 4.88 –5.41 –11.61
1997 December 10,346.1 13,731.4 13,848.8 50,742.0 33,829.0 48,863.4 7.86 3.93 3.85 2.16 4.98 4.96
1998 December 9,954.2 13,531.4 13,615.2 57,340.3 44,626.8 59,792.0 7.24 6.92 6.59 2.51 3.73 0.25
1999 Decembera 10,310.0 13,858.9 13,965.7 56,659.3 40,003.8 55,875.8 4.53 5.46 5.48 2.28 0.35 –4.58
2000 December 11,717.3 18,030.3 18,256.4 73,061.1 44,043.9 60,883.8 7.32 10.04 9.89 3.66 10.46 2.66
2001 December 17,803.2 23,703.5 23,936.5 106,071.4 57,410.0 74,964.5 8.01 13.00 11.96 11.65 3.40 1.16
2002 December 23,027.9 30,869.8 31,876.7 116,141.8 83,324.4 97,463.7 10.72 6.11 6.79 1.65 7.92 2.15
2003 December 30,586.2 33,888.7 34,630.9 128,893.1 96,121.7 111,661.4 8.90 1.78 1.93 0.14 3.11 0.66
2004 December 33,924.4 34,562.1 35,186.5 139,947.7 108,205.1 127,308.6 8.69 2.86 2.68 0.23 2.15 1.99
2005 December 40,390.8 38,817.1 39,855.4 154,647.0 131,343.2 149,168.3 9.38 4.34 3.87 –0.02 1.84 1.94
2006 December 46,331.2 48,521.0 49,141.7 182,458.6 154,844.1 183,379.5 3.17 4.75 4.07 1.57 3.38 2.99
2007 December 51,923.9 57,878.3 58,663.4 215,822.1 166,375.5 210,828.4 3.73 6.71 6.62 3.95 3.54 2.65
2008 December 49,743.0 55,222.3 56,044.6 225,018.5 183,279.1 232,982.1 –9.89 8.17 8.49 3.17 5.68 1.96
2009 November 53,699.8 45,748.0 46,255.6 223,600.6 179,711.1 231,436.6 –1.37 2.44 2.43 1.11 –1.95 1.56
December 56,141.9 47,181.7 47,760.5 223,094.6 178,083.2 231,661.9 4.55 3.13 3.25 –0.23 –0.91 0.10
2010 January 57,770.5 48,084.2 48,541.3 223,486.8 181,640.3 233,047.7 2.90 1.91 1.63 0.18 2.00 0.60
February 57,234.3 48,701.2 49,190.9 223,347.0 184,078.9 232,731.5 –0.93 1.28 1.34 –0.06 1.34 –0.14
March 54,694.4 47,726.2 48,329.4 222,043.1 184,290.7 233,913.8 –4.44 –2.00 –1.75 –0.58 0.12 0.51
April 54,076.0 48,982.2 49,554.8 222,055.0 184,328.8 234,764.5 –1.13 2.63 2.54 0.01 0.02 0.36
May 54,796.4 47,986.9 48,636.6 222,569.0 185,391.6 236,038.1 1.33 –2.03 –1.85 0.23 0.58 0.54
June 55,858.3 49,715.7 50,349.9 224,581.4 187,596.3 238,071.7 1.94 3.60 3.52 0.90 1.19 0.86
July 54,794.4 50,749.5 51,454.6 226,952.6 177,911.9 239,486.1 -1.90 2.08 2.19 1.06 -5.16 0.59
August 54,707.7 51,234.6 51,991.4 231,585.1 177,141.4 240,991.2 –0.16 0.96 1.04 2.04 –0.43 0.63
September 55,881.8 51,734.5 52,434.1 232,683.0 178,595.2 240,940.3 2.15 0.98 0.85 0.47 0.82 –0.02
October 56,243.4 50,695.8 51,496.0 232,440.6 178,850.5 241,289.2 0.65 –2.01 –1.79 –0.10 0.14 0.14
a Domestic credit decreased by a one-off HRK 2,759.4m.
Table A1 Monetary and credit aggregates • The table shows data on some basic monetary and credit aggregates, including their monthly growth rates. In September 1999, all the mon-etary aggregates were revised. In previous publications of the CNB, data on claims and obligations of savings banks were not included in the compilation of the monetary aggregates.
Reserve money is taken over in its entirety from the Mon-etary authorities accounts (Table C1).
Money (M1) is defined in the same way as the correspond-ing item in the Monetary survey (Table B1). It comprises cur-rency outside banks, deposits with the CNB by other banking institutions and other domestic sectors as well as banks’ demand deposits. Money (M1a) comprises currency outside banks and banks’ demand deposits, increased by the demand deposits of the central government and funds with banks.
Broadest money (M4) comprises Money (M1), savings and
time deposits, foreign currency deposits as well as bonds and money market instruments (all components are taken over from the Monetary survey, Table B1).
Net domestic assets are defined as a difference between total liquid assets and foreign assets (net).
Domestic credit comprises banks’ claims on other domestic sectors, other banking institutions and non-banking financial in-stitutions.
In May 1999, bankruptcy proceedings have been initiated against several banks so their assets and liabilities are excluded from monetary statistics. In April 1999, those banks’ share in monetary aggregate M1 amounted to HRK 259.3m and in mon-etary aggregate M4 amounted to HRK 4,035.8m. Data for June 1999 are comparable with data for July 1999 if Domestic credit is increased by HRK 3,513.5m.
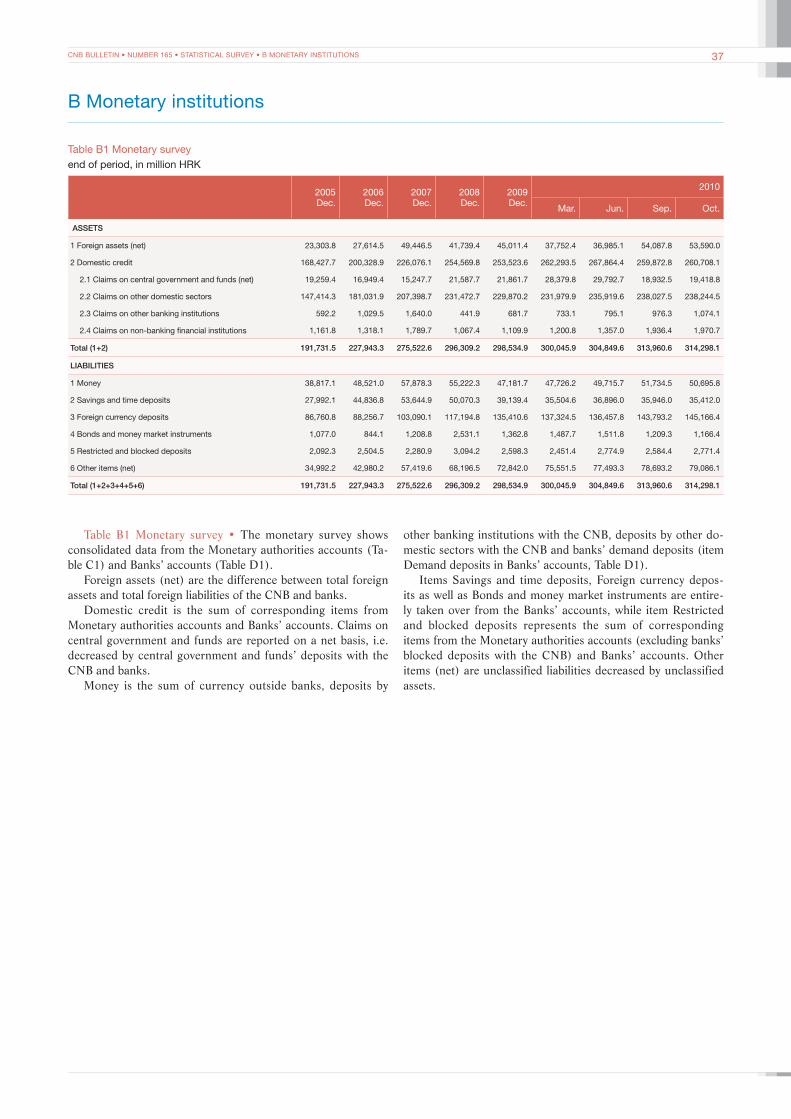
CNB BULLETIN • NUMBER 165 • STATISTICAL SURVEY • B MONETARY INSTITUTIONS 37
B Monetary institutions
Table B1 Monetary surveyend of period, in million HRK
2005Dec.
2006Dec.
2007Dec.
2008Dec.
2009Dec.
2010
Mar. Jun. Sep. Oct.
ASSETS
1 Foreign assets (net) 23,303.8 27,614.5 49,446.5 41,739.4 45,011.4 37,752.4 36,985.1 54,087.8 53,590.0
2 Domestic credit 168,427.7 200,328.9 226,076.1 254,569.8 253,523.6 262,293.5 267,864.4 259,872.8 260,708.1
2.1 Claims on central government and funds (net) 19,259.4 16,949.4 15,247.7 21,587.7 21,861.7 28,379.8 29,792.7 18,932.5 19,418.8
2.2 Claims on other domestic sectors 147,414.3 181,031.9 207,398.7 231,472.7 229,870.2 231,979.9 235,919.6 238,027.5 238,244.5
2.3 Claims on other banking institutions 592.2 1,029.5 1,640.0 441.9 681.7 733.1 795.1 976.3 1,074.1
2.4 Claims on non-banking financial institutions 1,161.8 1,318.1 1,789.7 1,067.4 1,109.9 1,200.8 1,357.0 1,936.4 1,970.7
Total (1+2) 191,731.5 227,943.3 275,522.6 296,309.2 298,534.9 300,045.9 304,849.6 313,960.6 314,298.1
LIABILITIES
1 Money 38,817.1 48,521.0 57,878.3 55,222.3 47,181.7 47,726.2 49,715.7 51,734.5 50,695.8
2 Savings and time deposits 27,992.1 44,836.8 53,644.9 50,070.3 39,139.4 35,504.6 36,896.0 35,946.0 35,412.0
3 Foreign currency deposits 86,760.8 88,256.7 103,090.1 117,194.8 135,410.6 137,324.5 136,457.8 143,793.2 145,166.4
4 Bonds and money market instruments 1,077.0 844.1 1,208.8 2,531.1 1,362.8 1,487.7 1,511.8 1,209.3 1,166.4
5 Restricted and blocked deposits 2,092.3 2,504.5 2,280.9 3,094.2 2,598.3 2,451.4 2,774.9 2,584.4 2,771.4
6 Other items (net) 34,992.2 42,980.2 57,419.6 68,196.5 72,842.0 75,551.5 77,493.3 78,693.2 79,086.1
Total (1+2+3+4+5+6) 191,731.5 227,943.3 275,522.6 296,309.2 298,534.9 300,045.9 304,849.6 313,960.6 314,298.1
Table B1 Monetary survey • The monetary survey shows consolidated data from the Monetary authorities accounts (Ta-ble C1) and Banks’ accounts (Table D1).
Foreign assets (net) are the difference between total foreign assets and total foreign liabilities of the CNB and banks.
Domestic credit is the sum of corresponding items from Monetary authorities accounts and Banks’ accounts. Claims on central government and funds are reported on a net basis, i.e. decreased by central government and funds’ deposits with the CNB and banks.
Money is the sum of currency outside banks, deposits by
other banking institutions with the CNB, deposits by other do-mestic sectors with the CNB and banks’ demand deposits (item Demand deposits in Banks’ accounts, Table D1).
Items Savings and time deposits, Foreign currency depos-its as well as Bonds and money market instruments are entire-ly taken over from the Banks’ accounts, while item Restricted and blocked deposits represents the sum of corresponding items from the Monetary authorities accounts (excluding banks’ blocked deposits with the CNB) and Banks’ accounts. Other items (net) are unclassified liabilities decreased by unclassified assets.
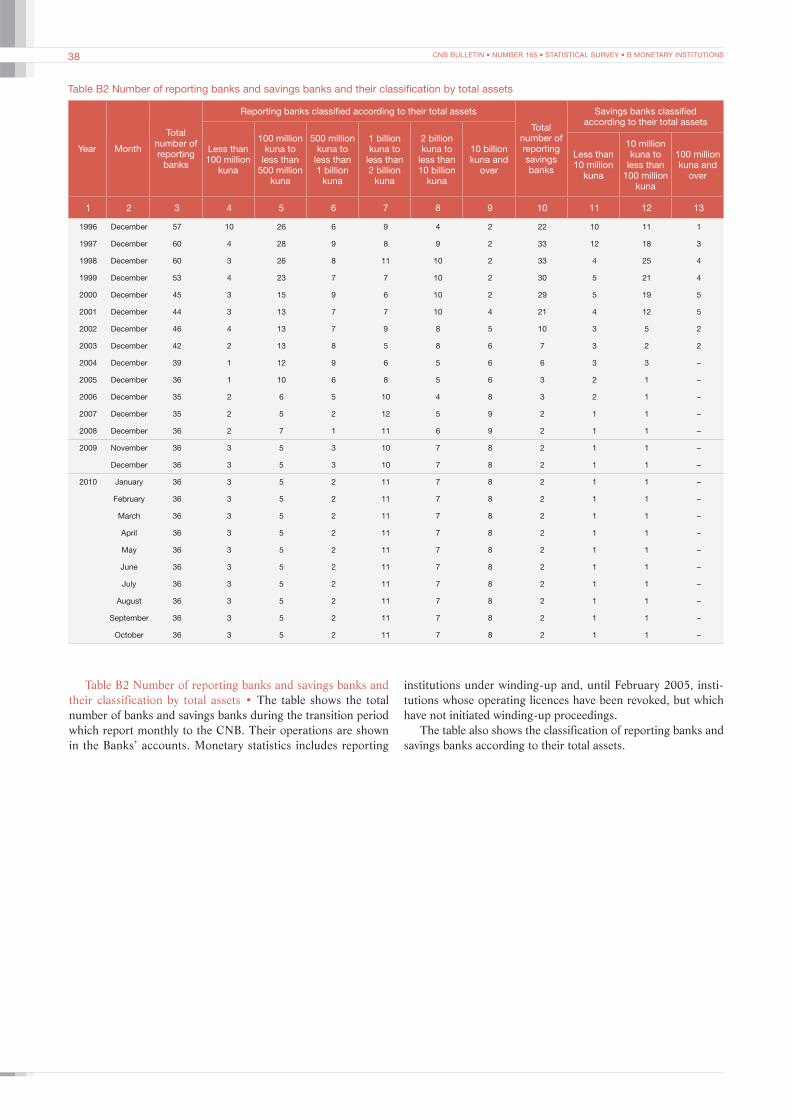
CNB BULLETIN • NUMBER 165 • STATISTICAL SURVEY • B MONETARY INSTITUTIONS38
Table B2 Number of reporting banks and savings banks and their classification by total assets
Year Month
Total number of reporting
banks
Reporting banks classified according to their total assets
Total number of reporting savings banks
Savings banks classified according to their total assets
Less than 100 million
kuna
100 million kuna to
less than 500 million
kuna
500 million kuna to
less than 1 billion
kuna
1 billion kuna to
less than 2 billion
kuna
2 billion kuna to
less than 10 billion
kuna
10 billion kuna and
over
Less than 10 million
kuna
10 million kuna to
less than 100 million
kuna
100 million kuna and
over
1 2 3 4 5 6 7 8 9 10 11 12 13
1996 December 57 10 26 6 9 4 2 22 10 11 1
1997 December 60 4 28 9 8 9 2 33 12 18 3
1998 December 60 3 26 8 11 10 2 33 4 25 4
1999 December 53 4 23 7 7 10 2 30 5 21 4
2000 December 45 3 15 9 6 10 2 29 5 19 5
2001 December 44 3 13 7 7 10 4 21 4 12 5
2002 December 46 4 13 7 9 8 5 10 3 5 2
2003 December 42 2 13 8 5 8 6 7 3 2 2
2004 December 39 1 12 9 6 5 6 6 3 3 –
2005 December 36 1 10 6 8 5 6 3 2 1 –
2006 December 35 2 6 5 10 4 8 3 2 1 –
2007 December 35 2 5 2 12 5 9 2 1 1 –
2008 December 36 2 7 1 11 6 9 2 1 1 –
2009 November 36 3 5 3 10 7 8 2 1 1 –
December 36 3 5 3 10 7 8 2 1 1 –
2010 January 36 3 5 2 11 7 8 2 1 1 –
February 36 3 5 2 11 7 8 2 1 1 –
March 36 3 5 2 11 7 8 2 1 1 –
April 36 3 5 2 11 7 8 2 1 1 –
May 36 3 5 2 11 7 8 2 1 1 –
June 36 3 5 2 11 7 8 2 1 1 –
July 36 3 5 2 11 7 8 2 1 1 –
August 36 3 5 2 11 7 8 2 1 1 –
September 36 3 5 2 11 7 8 2 1 1 –
October 36 3 5 2 11 7 8 2 1 1 –
Table B2 Number of reporting banks and savings banks and their classification by total assets • The table shows the total number of banks and savings banks during the transition period which report monthly to the CNB. Their operations are shown in the Banks’ accounts. Monetary statistics includes reporting
institutions under winding-up and, until February 2005, insti-tutions whose operating licences have been revoked, but which have not initiated winding-up proceedings.
The table also shows the classification of reporting banks and savings banks according to their total assets.

CNB BULLETIN • NUMBER 165 • STATISTICAL SURVEY • C MONETARY AUTHORITIES 39
C Monetary authorities
Table C1 Monetary authorities accountsend of period, in million HRK
2005Dec.
2006Dec.
2007Dec.
2008Dec.
2009Dec.
2010
Mar. Jun. Sep. Oct.
ASSETS
1 Foreign assets 54,862.5 64,088.2 68,177.8 66,805.5 75,807.8 72,652.2 74,129.8 81,346.1 81,296.5
1.1 Gold – – – – – – – – –
1.2 Holdings of SDRs 6.3 5.3 5.6 5.3 2,423.7 2,486.2 2,649.1 2,534.0 2,534.2
1.3 Reserve position in the IMF 1.4 1.3 1.3 1.3 1.3 1.3 1.4 1.3 1.3
1.4 Currency and demand deposits with foreign banks 7.7 7.2 7.2 1,472.7 1,763.8 1,815.5 1,750.3 1,499.7 1,474.1
1.5 Time deposits with foreign banks 28,274.1 33,243.0 33,204.4 13,189.3 17,534.5 17,910.6 20,625.8 25,015.5 25,744.9
1.6 Securities in f/c 26,573.0 30,831.2 34,959.3 52,136.9 54,084.5 50,438.7 49,103.3 52,295.4 51,541.8
1.7 Non-convertible foreign exchange 0.0 0.0 0.0 0.0 0.0 0.0 0.0 0.0 0.0
2 Claims on central government and funds 1.4 0.9 1.0 2.2 2.9 – – – –
2.1 Claims in kuna 1.4 0.9 1.0 2.2 2.9 – – – –
2.2 Claims in f/c – – – – – – – – –
3 Claims on other domestic sectors 73.4 64.0 67.9 64.2 4.2 4.0 4.0 3.9 3.9
4 Claims on banks 4,215.6 3,911.5 4,178.3 13.9 13.5 13.2 13.0 12.8 12.9
4.1 Credits to banks 4,215.6 3,911.5 4,178.3 13.9 13.5 13.2 13.0 12.8 12.9
Lombard credits – – 1,349.1 – – – – – –
Short-term liquidity credits – – – – – – – – –
Other credits 14.5 14.5 14.7 13.9 13.5 13.2 13.0 12.8 12.9
Reverse repo transactions 4,201.1 3,897.0 2,814.5 – – – – – –
4.2 Overdue claims – – – – – – – – –
5 Claims on other banking institutions – – – – – – – – –
Total (1+2+3+4+5) 59,153.0 68,064.6 72,425.1 66,885.8 75,828.3 72,669.5 74,146.7 81,362.8 81,313.2
LIABILITIES
1 Reserve money 40,390.8 46,331.2 51,923.9 49,743.0 56,141.9 54,694.4 55,858.3 55,881.8 56,243.4
1.1 Currency outside banks 12,163.8 14,609.3 16,007.5 17,051.0 15,282.1 14,774.8 16,048.3 16,000.8 15,701.7
1.2 Banks' cash in vaults 2,210.7 2,698.0 3,305.8 3,428.3 3,659.6 3,100.1 4,569.6 4,233.5 3,952.3
1.3 Banks' deposits 26,016.3 29,023.9 32,610.6 29,263.7 37,200.1 36,819.1 35,240.3 35,647.5 36,589.4
Settlement accounts 8,411.1 8,535.7 7,553.9 9,520.3 12,024.6 10,630.1 9,881.5 8,982.1 8,924.2
Statutory reserves 17,605.2 20,478.2 22,275.6 19,222.7 23,600.6 22,054.5 22,089.1 22,407.0 22,552.0
CNB bills on obligatory basis – – 1,991.1 460.6 – – – 0.0 –
Overnight deposits – 10.0 790.0 60.0 1,575.0 4,134.5 3,269.7 4,258.4 5,113.2
1.4 Deposits of other banking institutions – – – – – – – – –
1.5 Deposits of other domestic sectorsa – – – – – 0.3 0.0 0.0 0.0
2 Restricted and blocked deposits 13,551.8 16,633.5 14,286.0 8,064.1 5,091.6 4,766.4 4,702.1 4,672.5 4,806.1
2.1 Statutory reserve in f/c 13,495.9 16,576.7 14,257.5 8,008.3 5,041.7 4,710.7 4,647.8 4,617.6 4,746.4
2.2 Restricted deposits 55.9 56.9 28.6 55.8 49.9 55.8 54.3 54.9 59.7
2.3 Escrow deposits – – – – – – – – –
3 Foreign liabilities 18.9 18.9 17.2 16.6 8.1 8.5 9.3 8.4 8.3
3.1 Use of IMF credit – – – – – – – – –
3.2 Liabilities to international organisations 18.9 18.9 17.2 16.6 8.1 8.5 9.3 8.4 8.3
3.3 Liabilities to foreign banksb – – – – – 0.0 – – –
4 Central government and funds' deposits 332.2 188.0 199.1 206.9 4,171.4 2,188.1 1,977.6 9,756.5 9,040.4
4.1 Demand deposits 319.0 174.5 125.8 171.1 1,839.2 2,155.3 1,958.1 3,822.6 3,518.1
Central government demand deposits 246.3 138.6 100.3 43.0 1,772.9 140.4 136.4 2,389.5 2,168.4
Central government funds' demand deposits 72.7 35.9 25.4 128.2 66.2 2,014.9 1,821.7 1,433.1 1,349.8
4.2 Central government f/c deposits 13.2 13.5 73.3 35.8 2,332.2 32.8 19.5 5,933.9 5,522.3
4.3 CNB bills – – – – – – – – –
5 CNB bills – – – – – – – – –
5.1 CNB bills in kuna – – – – – – – – –

CNB BULLETIN • NUMBER 165 • STATISTICAL SURVEY • C MONETARY AUTHORITIES40
2005Dec.
2006Dec.
2007Dec.
2008Dec.
2009Dec.
2010
Mar. Jun. Sep. Oct.
5.2 CNB bills in f/c – – – – – – – – –
6 Capital accounts 5,357.4 5,408.8 6,664.5 9,562.4 11,151.3 11,749.0 12,343.9 11,836.0 12,023.6
7 Other items (net) –498.2 –515.8 –665.6 –707.1 –735.9 –736.9 –744.5 –792.4 –808.6
Total (1+2+3+4+5+6+7) 59,153.0 68,064.6 72,425.1 66,885.8 75,828.3 72,669.5 74,146.7 81,362.8 81,313.2
a The CDA accounts with the CNB for the gross and net settlement of purchased securities are reclassified from the central government sector to other domestic sectors from December 2002 onwards. b From October 2001 to May 2003, Liabilities to foreign banks include also liabilities based on CNB bills subscribed by non-residents.
Table C1 Monetary authorities accounts • The table reports data on claims and liabilities by monetary authorities.
Foreign assets include the following forms of foreign cur-rency and kuna claims on foreign legal and natural persons: monetary gold, holdings of special drawing rights, foreign cash in vault, reserve position in the International Monetary Fund, current account balances with foreign banks, time deposits with foreign banks and accrued interest, foreign currency security in-vestments and other claims.
Claims on central government and funds are loans and over-due claims on the budget of the Republic of Croatia. In accord-ance with the Croatian National Bank Act that entered into force in April 2001, the Croatian National Bank may not extend cred-it to the Republic of Croatia. Hence, this item comprises only overdue claims on the budget of the Republic of Croatia based on the payment system operations and the liabilities to the IMF and foreign banks. Until April 2001, Claims in kuna were short-term loans granted for the purpose of overcoming timing differ-ences between incoming revenues and execution of budgetary expenditures, long-term loans granted by special regulations by the government of the Republic of Croatia, and overdue claims on the budgetary central government, while Claims in foreign currency was a counter-entry to the liability to the IMF based on the succession of membership in that institution.
Claims on other domestic sectors are loans and overdue claims on other domestic sectors, including banks in bankruptcy proceedings.
Claims on banks are credits to banks and overdue claims on banks. Credits to banks comprise Lombard credits, short-term liquidity credits, other credits and reverse repo transactions. Item Lombard credits comprises credits to banks for regular maintaining of the day-to-day liquidity, which were replaced by Lombard credits in December 1994. Short-term liquidity cred-its, which have been granted since the beginning of 1999, also serve to bridge liquidity problems. Other credits include inter-vention credits, special credits for bridging liquidity problems granted in the past (initial credits, prerehabilitation credits), due but unpaid credits and deposits of the CNB with banks. From April 2005 on, reverse repo transactions are conducted on a weekly basis. Overdue claims on banks comprise settlement ac-count overdrafts (until mid-1994) and banks’ failure to correctly and promptly allocate and maintain statutory reserve require-ments.
Since May 1999, Claims on other domestic sectors include overdue claims on banks against which bankruptcy proceedings have been initiated. Due to the reclassification of savings banks from the subsector other banking institutions to the subsector
banks, data for Claims on banks and Claims on other banking institutions have been revised.
Reserve money consists of currency outside banks, cash in banks’ vaults, banks’ deposits with the CNB, other banking in-stitutions’ deposits and other domestic sectors’ deposits with the CNB. Banks’ deposits are: settlement account balances, statu-tory reserves deposited on a special account with the CNB (in-cluding, from March 2006, special reserve requirement on li-abilities arising from issued securities), CNB bills on an oblig-atory basis and overnight deposits. Deposits by other banking institutions included, until September 2003, settlement account balances of housing savings banks. Deposits by other domestic sectors are other domestic sectors’ giro account balances which are deposited with the Croatian National Bank in accordance with law or other regulation.
Restricted and blocked deposits include required foreign currency reserves and accrued interest, restricted deposits and blocked foreign currency deposits. Banks are required to set aside the reserve requirements against certain foreign currency sources of funds and the marginal reserve requirements (from August 2004 to October 2008) in special accounts at the Croa-tian National Bank. Restricted deposits are kuna funds set aside on the basis of a court order or regulations, kuna funds set aside in the period between May 1999 and April 2002 and deposits of banks against which bankruptcy proceedings have been initi-ated. Blocked foreign currency deposits are funds that were set aside in special accounts at the Croatian National Bank for re-paying unpaid amounts due to foreign creditors.
Foreign liabilities include use of IMF credits, liabilities to in-ternational financial institutions and foreign banks and accrued interest.
Central government and funds’ deposits are demand depos-its and foreign currency deposits of the Republic of Croatia and central government funds with the CNB, and CNB bills pur-chased by central government institutions.
CNB bills are kuna and f/c CNB bills on a voluntary basis, excluding CNB bills voluntarily purchased by central govern-ment institutions.
Capital accounts include reserves, provisions and the income and cost accounts.
Other items (net) are unclassified liabilities decreased by un-classified assets of the Monetary authorities accounts.
Due to the reclassification of savings banks from the subsec-tor other banking institutions to the subsector banks, data for Currency outside banks, Banks’ cash in vaults, Banks’ deposits and Deposits of other banking institutions were revised.
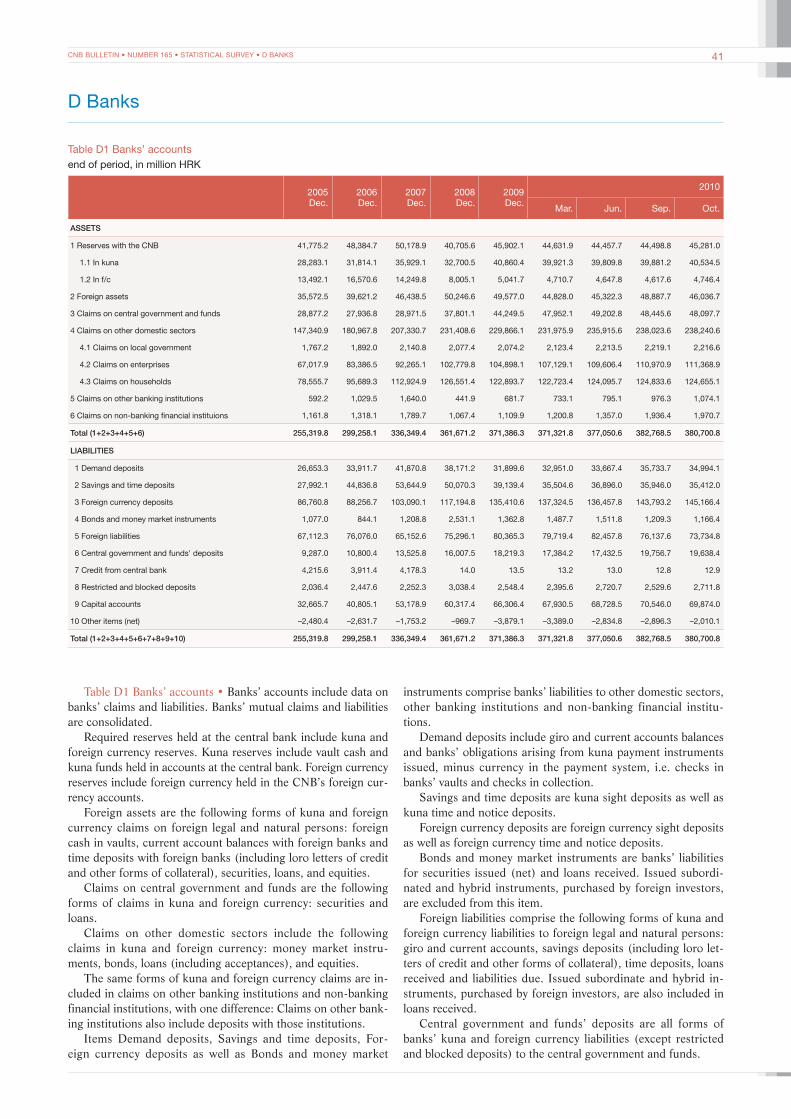
CNB BULLETIN • NUMBER 165 • STATISTICAL SURVEY • D BANKS 41
D Banks
Table D1 Banks’ accountsend of period, in million HRK
2005Dec.
2006Dec.
2007Dec.
2008Dec.
2009Dec.
2010
Mar. Jun. Sep. Oct.
ASSETS
1 Reserves with the CNB 41,775.2 48,384.7 50,178.9 40,705.6 45,902.1 44,631.9 44,457.7 44,498.8 45,281.0
1.1 In kuna 28,283.1 31,814.1 35,929.1 32,700.5 40,860.4 39,921.3 39,809.8 39,881.2 40,534.5
1.2 In f/c 13,492.1 16,570.6 14,249.8 8,005.1 5,041.7 4,710.7 4,647.8 4,617.6 4,746.4
2 Foreign assets 35,572.5 39,621.2 46,438.5 50,246.6 49,577.0 44,828.0 45,322.3 48,887.7 46,036.7
3 Claims on central government and funds 28,877.2 27,936.8 28,971.5 37,801.1 44,249.5 47,952.1 49,202.8 48,445.6 48,097.7
4 Claims on other domestic sectors 147,340.9 180,967.8 207,330.7 231,408.6 229,866.1 231,975.9 235,915.6 238,023.6 238,240.6
4.1 Claims on local government 1,767.2 1,892.0 2,140.8 2,077.4 2,074.2 2,123.4 2,213.5 2,219.1 2,216.6
4.2 Claims on enterprises 67,017.9 83,386.5 92,265.1 102,779.8 104,898.1 107,129.1 109,606.4 110,970.9 111,368.9
4.3 Claims on households 78,555.7 95,689.3 112,924.9 126,551.4 122,893.7 122,723.4 124,095.7 124,833.6 124,655.1
5 Claims on other banking institutions 592.2 1,029.5 1,640.0 441.9 681.7 733.1 795.1 976.3 1,074.1
6 Claims on non-banking financial instituions 1,161.8 1,318.1 1,789.7 1,067.4 1,109.9 1,200.8 1,357.0 1,936.4 1,970.7
Total (1+2+3+4+5+6) 255,319.8 299,258.1 336,349.4 361,671.2 371,386.3 371,321.8 377,050.6 382,768.5 380,700.8
LIABILITIES
1 Demand deposits 26,653.3 33,911.7 41,870.8 38,171.2 31,899.6 32,951.0 33,667.4 35,733.7 34,994.1
2 Savings and time deposits 27,992.1 44,836.8 53,644.9 50,070.3 39,139.4 35,504.6 36,896.0 35,946.0 35,412.0
3 Foreign currency deposits 86,760.8 88,256.7 103,090.1 117,194.8 135,410.6 137,324.5 136,457.8 143,793.2 145,166.4
4 Bonds and money market instruments 1,077.0 844.1 1,208.8 2,531.1 1,362.8 1,487.7 1,511.8 1,209.3 1,166.4
5 Foreign liabilities 67,112.3 76,076.0 65,152.6 75,296.1 80,365.3 79,719.4 82,457.8 76,137.6 73,734.8
6 Central government and funds' deposits 9,287.0 10,800.4 13,525.8 16,007.5 18,219.3 17,384.2 17,432.5 19,756.7 19,638.4
7 Credit from central bank 4,215.6 3,911.4 4,178.3 14.0 13.5 13.2 13.0 12.8 12.9
8 Restricted and blocked deposits 2,036.4 2,447.6 2,252.3 3,038.4 2,548.4 2,395.6 2,720.7 2,529.6 2,711.8
9 Capital accounts 32,665.7 40,805.1 53,178.9 60,317.4 66,306.4 67,930.5 68,728.5 70,546.0 69,874.0
10 Other items (net) –2,480.4 –2,631.7 –1,753.2 –969.7 –3,879.1 –3,389.0 –2,834.8 –2,896.3 –2,010.1
Total (1+2+3+4+5+6+7+8+9+10) 255,319.8 299,258.1 336,349.4 361,671.2 371,386.3 371,321.8 377,050.6 382,768.5 380,700.8
Table D1 Banks’ accounts • Banks’ accounts include data on banks’ claims and liabilities. Banks’ mutual claims and liabilities are consolidated.
Required reserves held at the central bank include kuna and foreign currency reserves. Kuna reserves include vault cash and kuna funds held in accounts at the central bank. Foreign currency reserves include foreign currency held in the CNB’s foreign cur-rency accounts.
Foreign assets are the following forms of kuna and foreign currency claims on foreign legal and natural persons: foreign cash in vaults, current account balances with foreign banks and time deposits with foreign banks (including loro letters of credit and other forms of collateral), securities, loans, and equities.
Claims on central government and funds are the following forms of claims in kuna and foreign currency: securities and loans.
Claims on other domestic sectors include the following claims in kuna and foreign currency: money market instru-ments, bonds, loans (including acceptances), and equities.
The same forms of kuna and foreign currency claims are in-cluded in claims on other banking institutions and non-banking financial institutions, with one difference: Claims on other bank-ing institutions also include deposits with those institutions.
Items Demand deposits, Savings and time deposits, For-eign currency deposits as well as Bonds and money market
instruments comprise banks’ liabilities to other domestic sectors, other banking institutions and non-banking financial institu-tions.
Demand deposits include giro and current accounts balances and banks’ obligations arising from kuna payment instruments issued, minus currency in the payment system, i.e. checks in banks’ vaults and checks in collection.
Savings and time deposits are kuna sight deposits as well as kuna time and notice deposits.
Foreign currency deposits are foreign currency sight deposits as well as foreign currency time and notice deposits.
Bonds and money market instruments are banks’ liabilities for securities issued (net) and loans received. Issued subordi-nated and hybrid instruments, purchased by foreign investors, are excluded from this item.
Foreign liabilities comprise the following forms of kuna and foreign currency liabilities to foreign legal and natural persons: giro and current accounts, savings deposits (including loro let-ters of credit and other forms of collateral), time deposits, loans received and liabilities due. Issued subordinate and hybrid in-struments, purchased by foreign investors, are also included in loans received.
Central government and funds’ deposits are all forms of banks’ kuna and foreign currency liabilities (except restricted and blocked deposits) to the central government and funds.
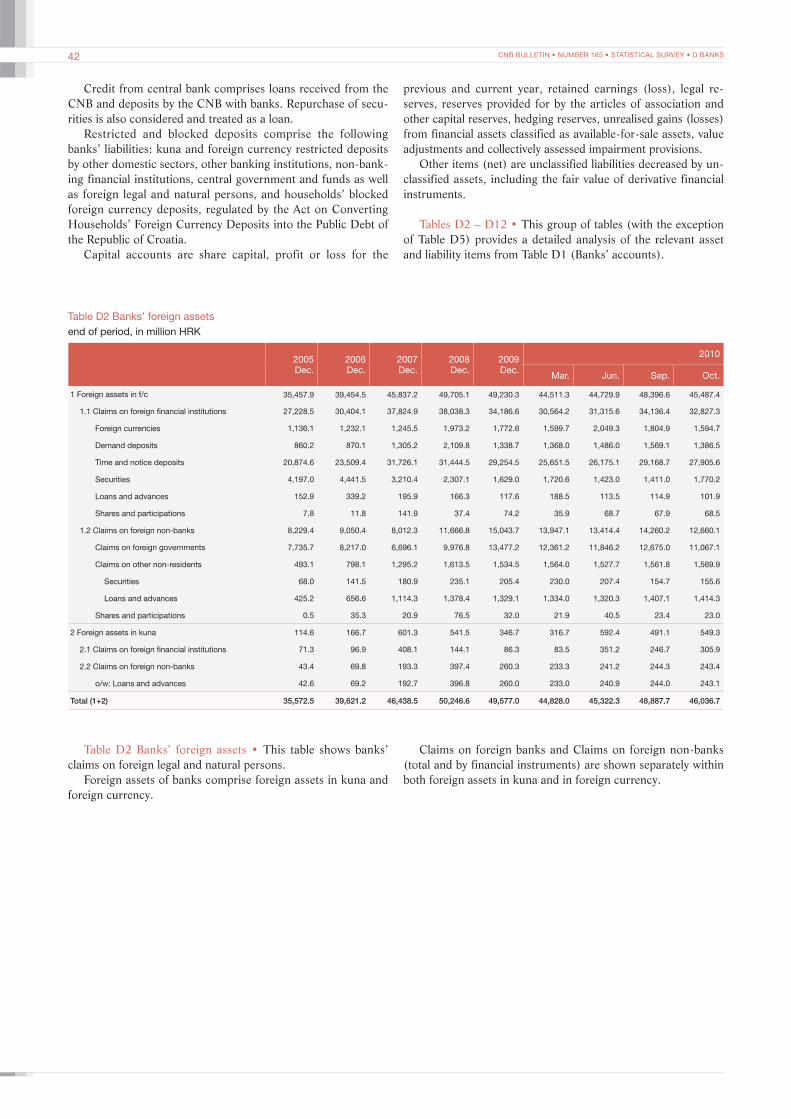
CNB BULLETIN • NUMBER 165 • STATISTICAL SURVEY • D BANKS42
Table D2 Banks’ foreign assetsend of period, in million HRK
2005Dec.
2006Dec.
2007Dec.
2008Dec.
2009Dec.
2010
Mar. Jun. Sep. Oct.
1 Foreign assets in f/c 35,457.9 39,454.5 45,837.2 49,705.1 49,230.3 44,511.3 44,729.9 48,396.6 45,487.4
1.1 Claims on foreign financial institutions 27,228.5 30,404.1 37,824.9 38,038.3 34,186.6 30,564.2 31,315.6 34,136.4 32,827.3
Foreign currencies 1,136.1 1,232.1 1,245.5 1,973.2 1,772.6 1,599.7 2,049.3 1,804.9 1,594.7
Demand deposits 860.2 870.1 1,305.2 2,109.8 1,338.7 1,368.0 1,486.0 1,569.1 1,386.5
Time and notice deposits 20,874.6 23,509.4 31,726.1 31,444.5 29,254.5 25,651.5 26,175.1 29,168.7 27,905.6
Securities 4,197.0 4,441.5 3,210.4 2,307.1 1,629.0 1,720.6 1,423.0 1,411.0 1,770.2
Loans and advances 152.9 339.2 195.9 166.3 117.6 188.5 113.5 114.9 101.9
Shares and participations 7.8 11.8 141.9 37.4 74.2 35.9 68.7 67.9 68.5
1.2 Claims on foreign non-banks 8,229.4 9,050.4 8,012.3 11,666.8 15,043.7 13,947.1 13,414.4 14,260.2 12,660.1
Claims on foreign governments 7,735.7 8,217.0 6,696.1 9,976.8 13,477.2 12,361.2 11,846.2 12,675.0 11,067.1
Claims on other non-residents 493.1 798.1 1,295.2 1,613.5 1,534.5 1,564.0 1,527.7 1,561.8 1,569.9
Securities 68.0 141.5 180.9 235.1 205.4 230.0 207.4 154.7 155.6
Loans and advances 425.2 656.6 1,114.3 1,378.4 1,329.1 1,334.0 1,320.3 1,407.1 1,414.3
Shares and participations 0.5 35.3 20.9 76.5 32.0 21.9 40.5 23.4 23.0
2 Foreign assets in kuna 114.6 166.7 601.3 541.5 346.7 316.7 592.4 491.1 549.3
2.1 Claims on foreign financial institutions 71.3 96.9 408.1 144.1 86.3 83.5 351.2 246.7 305.9
2.2 Claims on foreign non-banks 43.4 69.8 193.3 397.4 260.3 233.3 241.2 244.3 243.4
o/w: Loans and advances 42.6 69.2 192.7 396.8 260.0 233.0 240.9 244.0 243.1
Total (1+2) 35,572.5 39,621.2 46,438.5 50,246.6 49,577.0 44,828.0 45,322.3 48,887.7 46,036.7
Credit from central bank comprises loans received from the CNB and deposits by the CNB with banks. Repurchase of secu-rities is also considered and treated as a loan.
Restricted and blocked deposits comprise the following banks’ liabilities: kuna and foreign currency restricted deposits by other domestic sectors, other banking institutions, non-bank-ing financial institutions, central government and funds as well as foreign legal and natural persons, and households’ blocked foreign currency deposits, regulated by the Act on Converting Households’ Foreign Currency Deposits into the Public Debt of the Republic of Croatia.
Capital accounts are share capital, profit or loss for the
previous and current year, retained earnings (loss), legal re-serves, reserves provided for by the articles of association and other capital reserves, hedging reserves, unrealised gains (losses) from financial assets classified as available-for-sale assets, value adjustments and collectively assessed impairment provisions.
Other items (net) are unclassified liabilities decreased by un-classified assets, including the fair value of derivative financial instruments.
Tables D2 – D12 • This group of tables (with the exception of Table D5) provides a detailed analysis of the relevant asset and liability items from Table D1 (Banks’ accounts).
Table D2 Banks’ foreign assets • This table shows banks’ claims on foreign legal and natural persons.
Foreign assets of banks comprise foreign assets in kuna and foreign currency.
Claims on foreign banks and Claims on foreign non-banks (total and by financial instruments) are shown separately within both foreign assets in kuna and in foreign currency.
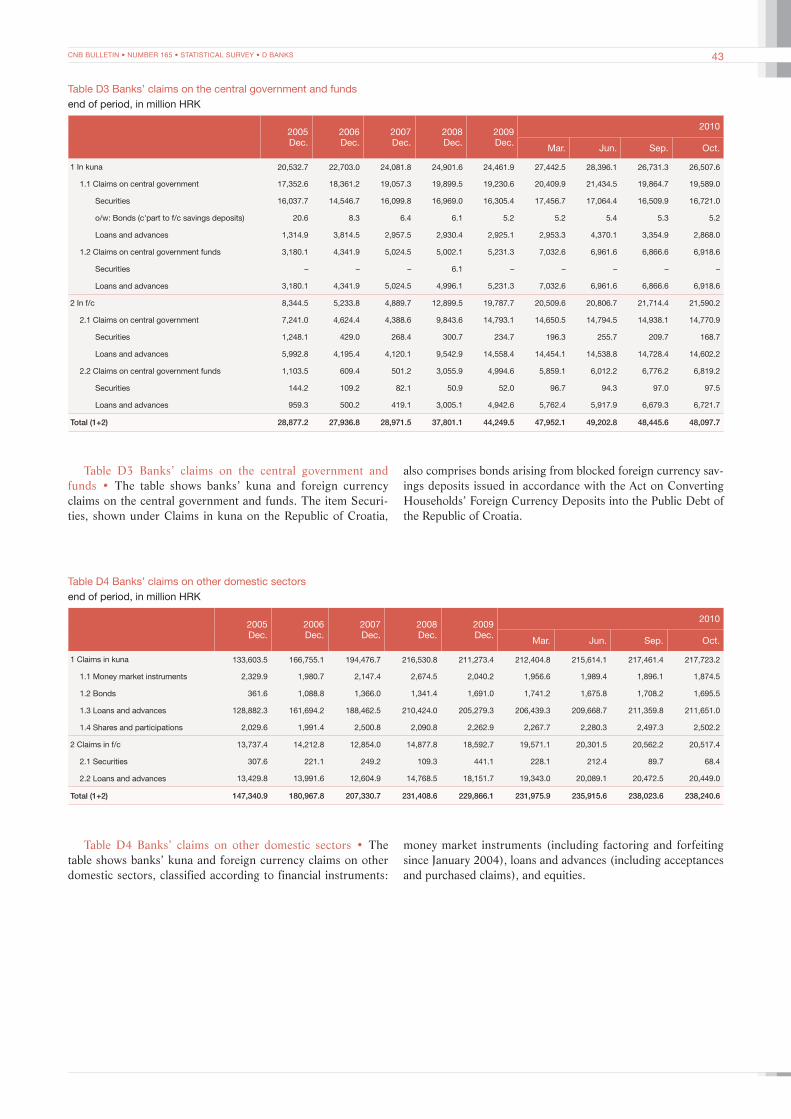
CNB BULLETIN • NUMBER 165 • STATISTICAL SURVEY • D BANKS 43
Table D3 Banks’ claims on the central government and fundsend of period, in million HRK
2005Dec.
2006Dec.
2007Dec.
2008Dec.
2009Dec.
2010
Mar. Jun. Sep. Oct.
1 In kuna 20,532.7 22,703.0 24,081.8 24,901.6 24,461.9 27,442.5 28,396.1 26,731.3 26,507.6
1.1 Claims on central government 17,352.6 18,361.2 19,057.3 19,899.5 19,230.6 20,409.9 21,434.5 19,864.7 19,589.0
Securities 16,037.7 14,546.7 16,099.8 16,969.0 16,305.4 17,456.7 17,064.4 16,509.9 16,721.0
o/w: Bonds (c'part to f/c savings deposits) 20.6 8.3 6.4 6.1 5.2 5.2 5.4 5.3 5.2
Loans and advances 1,314.9 3,814.5 2,957.5 2,930.4 2,925.1 2,953.3 4,370.1 3,354.9 2,868.0
1.2 Claims on central government funds 3,180.1 4,341.9 5,024.5 5,002.1 5,231.3 7,032.6 6,961.6 6,866.6 6,918.6
Securities – – – 6.1 – – – – –
Loans and advances 3,180.1 4,341.9 5,024.5 4,996.1 5,231.3 7,032.6 6,961.6 6,866.6 6,918.6
2 In f/c 8,344.5 5,233.8 4,889.7 12,899.5 19,787.7 20,509.6 20,806.7 21,714.4 21,590.2
2.1 Claims on central government 7,241.0 4,624.4 4,388.6 9,843.6 14,793.1 14,650.5 14,794.5 14,938.1 14,770.9
Securities 1,248.1 429.0 268.4 300.7 234.7 196.3 255.7 209.7 168.7
Loans and advances 5,992.8 4,195.4 4,120.1 9,542.9 14,558.4 14,454.1 14,538.8 14,728.4 14,602.2
2.2 Claims on central government funds 1,103.5 609.4 501.2 3,055.9 4,994.6 5,859.1 6,012.2 6,776.2 6,819.2
Securities 144.2 109.2 82.1 50.9 52.0 96.7 94.3 97.0 97.5
Loans and advances 959.3 500.2 419.1 3,005.1 4,942.6 5,762.4 5,917.9 6,679.3 6,721.7
Total (1+2) 28,877.2 27,936.8 28,971.5 37,801.1 44,249.5 47,952.1 49,202.8 48,445.6 48,097.7
Table D4 Banks’ claims on other domestic sectorsend of period, in million HRK
2005Dec.
2006Dec.
2007Dec.
2008Dec.
2009Dec.
2010
Mar. Jun. Sep. Oct.
1 Claims in kuna 133,603.5 166,755.1 194,476.7 216,530.8 211,273.4 212,404.8 215,614.1 217,461.4 217,723.2
1.1 Money market instruments 2,329.9 1,980.7 2,147.4 2,674.5 2,040.2 1,956.6 1,989.4 1,896.1 1,874.5
1.2 Bonds 361.6 1,088.8 1,366.0 1,341.4 1,691.0 1,741.2 1,675.8 1,708.2 1,695.5
1.3 Loans and advances 128,882.3 161,694.2 188,462.5 210,424.0 205,279.3 206,439.3 209,668.7 211,359.8 211,651.0
1.4 Shares and participations 2,029.6 1,991.4 2,500.8 2,090.8 2,262.9 2,267.7 2,280.3 2,497.3 2,502.2
2 Claims in f/c 13,737.4 14,212.8 12,854.0 14,877.8 18,592.7 19,571.1 20,301.5 20,562.2 20,517.4
2.1 Securities 307.6 221.1 249.2 109.3 441.1 228.1 212.4 89.7 68.4
2.2 Loans and advances 13,429.8 13,991.6 12,604.9 14,768.5 18,151.7 19,343.0 20,089.1 20,472.5 20,449.0
Total (1+2) 147,340.9 180,967.8 207,330.7 231,408.6 229,866.1 231,975.9 235,915.6 238,023.6 238,240.6
Table D3 Banks’ claims on the central government and funds • The table shows banks’ kuna and foreign currency claims on the central government and funds. The item Securi-ties, shown under Claims in kuna on the Republic of Croatia,
also comprises bonds arising from blocked foreign currency sav-ings deposits issued in accordance with the Act on Converting Households’ Foreign Currency Deposits into the Public Debt of the Republic of Croatia.
Table D4 Banks’ claims on other domestic sectors • The table shows banks’ kuna and foreign currency claims on other domestic sectors, classified according to financial instruments:
money market instruments (including factoring and forfeiting since January 2004), loans and advances (including acceptances and purchased claims), and equities.
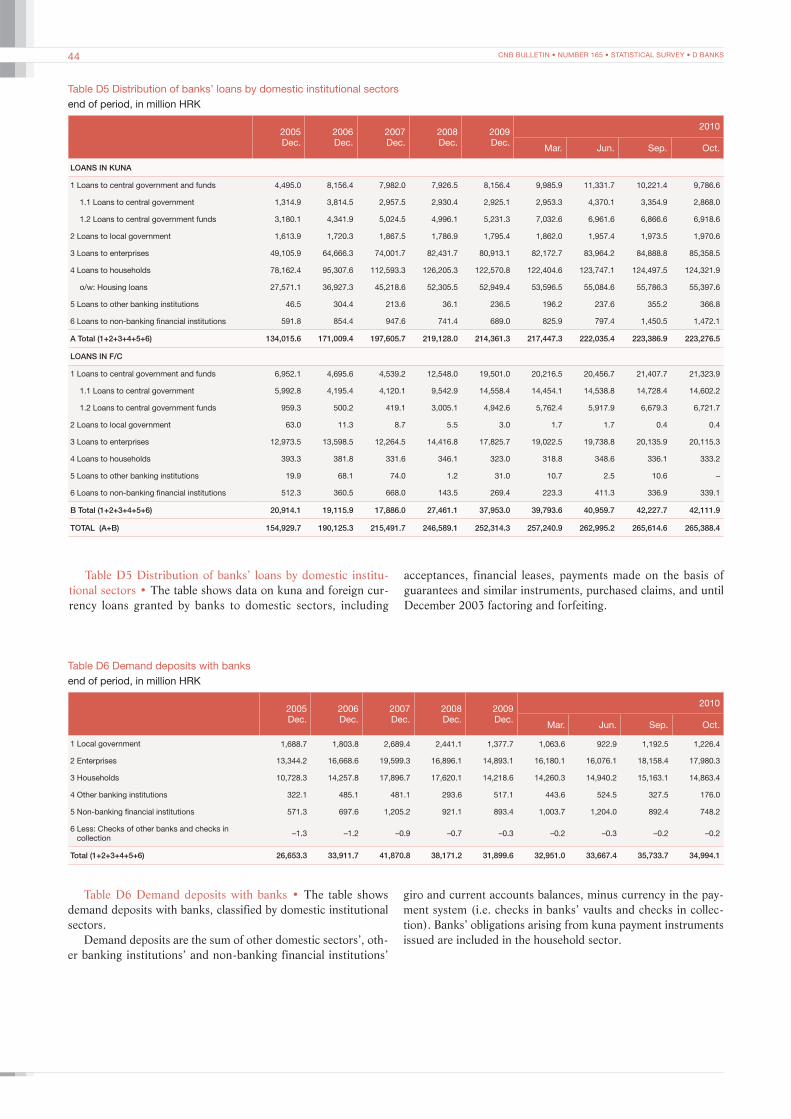
CNB BULLETIN • NUMBER 165 • STATISTICAL SURVEY • D BANKS44
Table D5 Distribution of banks’ loans by domestic institutional sectorsend of period, in million HRK
2005Dec.
2006Dec.
2007Dec.
2008Dec.
2009Dec.
2010
Mar. Jun. Sep. Oct.
LOANS IN KUNA
1 Loans to central government and funds 4,495.0 8,156.4 7,982.0 7,926.5 8,156.4 9,985.9 11,331.7 10,221.4 9,786.6
1.1 Loans to central government 1,314.9 3,814.5 2,957.5 2,930.4 2,925.1 2,953.3 4,370.1 3,354.9 2,868.0
1.2 Loans to central government funds 3,180.1 4,341.9 5,024.5 4,996.1 5,231.3 7,032.6 6,961.6 6,866.6 6,918.6
2 Loans to local government 1,613.9 1,720.3 1,867.5 1,786.9 1,795.4 1,862.0 1,957.4 1,973.5 1,970.6
3 Loans to enterprises 49,105.9 64,666.3 74,001.7 82,431.7 80,913.1 82,172.7 83,964.2 84,888.8 85,358.5
4 Loans to households 78,162.4 95,307.6 112,593.3 126,205.3 122,570.8 122,404.6 123,747.1 124,497.5 124,321.9
o/w: Housing loans 27,571.1 36,927.3 45,218.6 52,305.5 52,949.4 53,596.5 55,084.6 55,786.3 55,397.6
5 Loans to other banking institutions 46.5 304.4 213.6 36.1 236.5 196.2 237.6 355.2 366.8
6 Loans to non-banking financial institutions 591.8 854.4 947.6 741.4 689.0 825.9 797.4 1,450.5 1,472.1
A Total (1+2+3+4+5+6) 134,015.6 171,009.4 197,605.7 219,128.0 214,361.3 217,447.3 222,035.4 223,386.9 223,276.5
LOANS IN F/C
1 Loans to central government and funds 6,952.1 4,695.6 4,539.2 12,548.0 19,501.0 20,216.5 20,456.7 21,407.7 21,323.9
1.1 Loans to central government 5,992.8 4,195.4 4,120.1 9,542.9 14,558.4 14,454.1 14,538.8 14,728.4 14,602.2
1.2 Loans to central government funds 959.3 500.2 419.1 3,005.1 4,942.6 5,762.4 5,917.9 6,679.3 6,721.7
2 Loans to local government 63.0 11.3 8.7 5.5 3.0 1.7 1.7 0.4 0.4
3 Loans to enterprises 12,973.5 13,598.5 12,264.5 14,416.8 17,825.7 19,022.5 19,738.8 20,135.9 20,115.3
4 Loans to households 393.3 381.8 331.6 346.1 323.0 318.8 348.6 336.1 333.2
5 Loans to other banking institutions 19.9 68.1 74.0 1.2 31.0 10.7 2.5 10.6 –
6 Loans to non-banking financial institutions 512.3 360.5 668.0 143.5 269.4 223.3 411.3 336.9 339.1
B Total (1+2+3+4+5+6) 20,914.1 19,115.9 17,886.0 27,461.1 37,953.0 39,793.6 40,959.7 42,227.7 42,111.9
TOTAL (A+B) 154,929.7 190,125.3 215,491.7 246,589.1 252,314.3 257,240.9 262,995.2 265,614.6 265,388.4
Table D6 Demand deposits with banksend of period, in million HRK
2005Dec.
2006Dec.
2007Dec.
2008Dec.
2009Dec.
2010
Mar. Jun. Sep. Oct.
1 Local government 1,688.7 1,803.8 2,689.4 2,441.1 1,377.7 1,063.6 922.9 1,192.5 1,226.4
2 Enterprises 13,344.2 16,668.6 19,599.3 16,896.1 14,893.1 16,180.1 16,076.1 18,158.4 17,980.3
3 Households 10,728.3 14,257.8 17,896.7 17,620.1 14,218.6 14,260.3 14,940.2 15,163.1 14,863.4
4 Other banking institutions 322.1 485.1 481.1 293.6 517.1 443.6 524.5 327.5 176.0
5 Non-banking financial institutions 571.3 697.6 1,205.2 921.1 893.4 1,003.7 1,204.0 892.4 748.2
6 Less: Checks of other banks and checks in collection
–1.3 –1.2 –0.9 –0.7 –0.3 –0.2 –0.3 –0.2 –0.2
Total (1+2+3+4+5+6) 26,653.3 33,911.7 41,870.8 38,171.2 31,899.6 32,951.0 33,667.4 35,733.7 34,994.1
Table D5 Distribution of banks’ loans by domestic institu-tional sectors • The table shows data on kuna and foreign cur-rency loans granted by banks to domestic sectors, including
acceptances, financial leases, payments made on the basis of guarantees and similar instruments, purchased claims, and until December 2003 factoring and forfeiting.
Table D6 Demand deposits with banks • The table shows demand deposits with banks, classified by domestic institutional sectors.
Demand deposits are the sum of other domestic sectors’, oth-er banking institutions’ and non-banking financial institutions’
giro and current accounts balances, minus currency in the pay-ment system (i.e. checks in banks’ vaults and checks in collec-tion). Banks’ obligations arising from kuna payment instruments issued are included in the household sector.

CNB BULLETIN • NUMBER 165 • STATISTICAL SURVEY • D BANKS 45
Table D7 Time and savings deposits with banksend of period, in million HRK
2005Dec.
2006Dec.
2007Dec.
2008Dec.
2009Dec.
2010
Mar. Jun. Sep. Oct.
1 Savings deposits 2,493.6 2,905.6 3,086.1 2,770.3 2,523.1 2,490.9 2,592.3 2,508.6 2,475.3
1.1 Local government 2.7 2.8 2.5 0.0 0.0 0.1 0.1 0.1 0.1
1.2 Enterprises 101.6 110.3 154.7 108.8 203.7 226.4 180.3 266.6 303.9
1.3 Households 2,388.3 2,792.4 2,929.0 2,657.7 2,268.9 2,247.6 2,400.0 2,221.1 2,162.3
1.4 Other banking institutions – – – – 5.0 8.5 – – –
1.5 Non-banking financial institutions 1.0 0.0 – 3.7 45.5 8.2 11.9 20.9 9.0
2 Time and notice deposits 25,498.4 41,931.3 50,558.8 47,300.1 36,616.3 33,013.8 34,303.7 33,437.4 32,936.7
2.1 Local government 508.7 491.8 549.5 726.0 498.8 850.4 881.7 856.4 856.6
2.2 Enterprises 8,222.5 14,715.4 18,414.8 16,268.0 11,559.0 9,328.5 8,690.8 9,449.9 9,093.3
2.3 Households 13,254.9 20,755.0 20,479.1 22,721.6 16,910.7 17,199.9 17,439.1 17,190.8 17,203.1
2.4 Other banking institutions 931.9 2,697.9 6,386.5 2,563.4 3,039.8 2,266.0 3,495.7 2,618.5 2,298.9
2.5 Non-banking financial institutions 2,580.4 3,271.3 4,728.9 5,021.1 4,608.1 3,369.0 3,796.4 3,321.8 3,484.9
Total (1+2) 27,992.1 44,836.8 53,644.9 50,070.3 39,139.4 35,504.6 36,896.0 35,946.0 35,412.0
Table D8 Foreign currency deposits with banksend of period, in million HRK
2005Dec.
2006Dec.
2007Dec.
2008Dec.
2009Dec.
2010
Mar. Jun. Sep. Oct.
1 Savings deposits 22,641.0 22,698.6 22,845.0 21,262.2 20,781.0 20,942.3 21,588.6 23,768.0 23,127.4
1.1 Local government 11.9 30.8 27.5 22.1 25.5 13.1 23.7 10.6 12.7
1.2 Enterprises 4,408.3 4,589.7 5,543.6 5,132.0 5,053.6 5,299.6 5,338.0 6,112.2 5,931.3
1.3 Households 17,933.6 17,609.9 16,720.8 15,682.8 15,148.7 15,086.5 15,665.1 17,052.0 16,547.0
1.4 Other banking institutions 116.0 276.7 251.7 121.4 150.4 170.9 171.9 141.5 176.7
1.5 Non-banking financial institutions 171.3 191.4 301.5 303.9 402.9 372.2 389.9 451.7 459.7
2 Time deposits 64,119.7 65,558.1 80,245.1 95,932.6 114,629.6 116,382.2 114,869.2 120,025.2 122,039.0
2.1 Local government 3.2 1.9 2.1 2.3 2.5 6.3 12.4 13.7 11.6
2.2 Enterprises 8,154.2 7,086.2 10,391.9 11,215.5 13,516.9 13,117.6 12,010.1 14,316.9 14,698.8
2.3 Households 55,036.1 57,210.8 66,465.7 80,419.6 95,598.0 97,008.2 97,053.0 99,995.7 101,327.7
2.4 Other banking institutions 242.0 366.2 1,038.6 808.2 663.0 659.6 788.9 1,111.3 1,310.4
2.5 Non-banking financial institutions 684.2 892.9 2,346.8 3,487.0 4,849.1 5,590.5 5,004.8 4,587.7 4,690.5
Total (1+2) 86,760.8 88,256.7 103,090.1 117,194.8 135,410.6 137,324.5 136,457.8 143,793.2 145,166.4
Table D7 Time and savings deposits with banks • The table shows kuna savings and time deposits by other domestic sectors,
other banking institutions and non-banking financial institutions with banks.
Table D8 Foreign currency deposits with banks • The ta-ble shows foreign currency savings and time deposits by oth-er domestic sectors, other banking institutions and non-bank-ing financial institutions with banks. Foreign currency savings
deposits are all foreign currency sight deposits and foreign cur-rency payment instruments issued, while foreign currency time deposits also include foreign currency notice deposits.
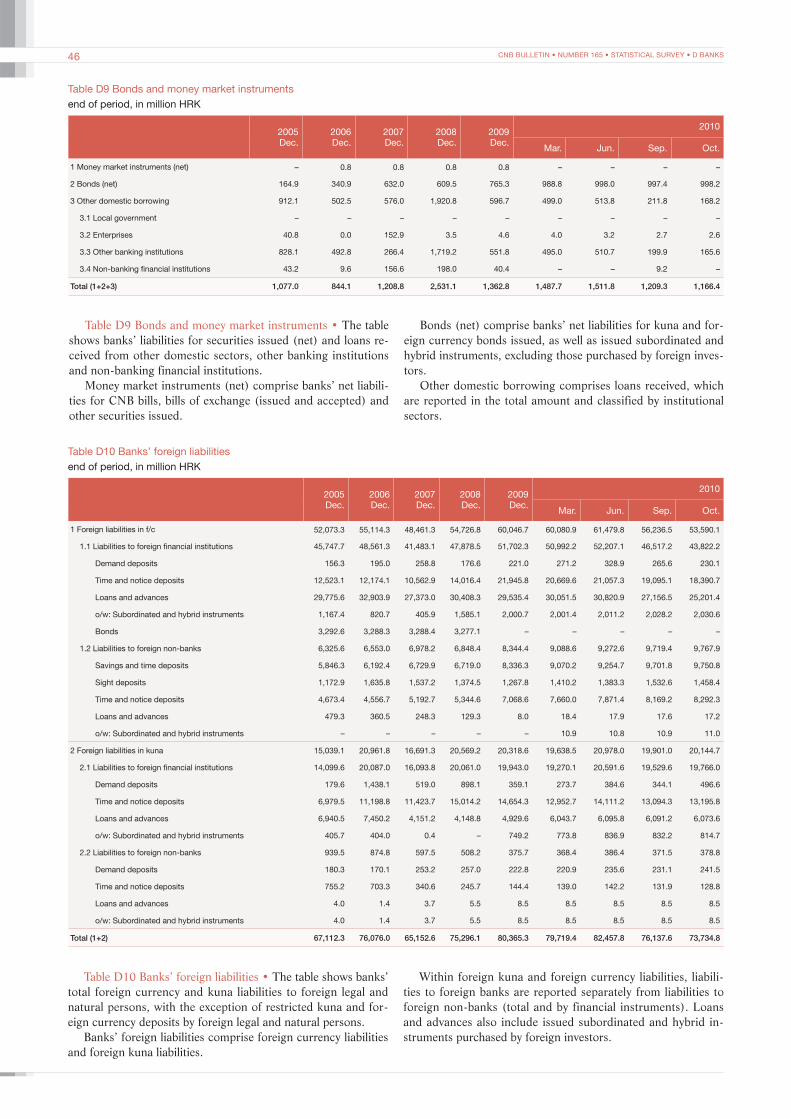
CNB BULLETIN • NUMBER 165 • STATISTICAL SURVEY • D BANKS46
Table D9 Bonds and money market instrumentsend of period, in million HRK
2005Dec.
2006Dec.
2007Dec.
2008Dec.
2009Dec.
2010
Mar. Jun. Sep. Oct.
1 Money market instruments (net) – 0.8 0.8 0.8 0.8 – – – –
2 Bonds (net) 164.9 340.9 632.0 609.5 765.3 988.8 998.0 997.4 998.2
3 Other domestic borrowing 912.1 502.5 576.0 1,920.8 596.7 499.0 513.8 211.8 168.2
3.1 Local government – – – – – – – – –
3.2 Enterprises 40.8 0.0 152.9 3.5 4.6 4.0 3.2 2.7 2.6
3.3 Other banking institutions 828.1 492.8 266.4 1,719.2 551.8 495.0 510.7 199.9 165.6
3.4 Non-banking financial institutions 43.2 9.6 156.6 198.0 40.4 – – 9.2 –
Total (1+2+3) 1,077.0 844.1 1,208.8 2,531.1 1,362.8 1,487.7 1,511.8 1,209.3 1,166.4
Table D10 Banks’ foreign liabilitiesend of period, in million HRK
2005Dec.
2006Dec.
2007Dec.
2008Dec.
2009Dec.
2010
Mar. Jun. Sep. Oct.
1 Foreign liabilities in f/c 52,073.3 55,114.3 48,461.3 54,726.8 60,046.7 60,080.9 61,479.8 56,236.5 53,590.1
1.1 Liabilities to foreign financial institutions 45,747.7 48,561.3 41,483.1 47,878.5 51,702.3 50,992.2 52,207.1 46,517.2 43,822.2
Demand deposits 156.3 195.0 258.8 176.6 221.0 271.2 328.9 265.6 230.1
Time and notice deposits 12,523.1 12,174.1 10,562.9 14,016.4 21,945.8 20,669.6 21,057.3 19,095.1 18,390.7
Loans and advances 29,775.6 32,903.9 27,373.0 30,408.3 29,535.4 30,051.5 30,820.9 27,156.5 25,201.4
o/w: Subordinated and hybrid instruments 1,167.4 820.7 405.9 1,585.1 2,000.7 2,001.4 2,011.2 2,028.2 2,030.6
Bonds 3,292.6 3,288.3 3,288.4 3,277.1 – – – – –
1.2 Liabilities to foreign non-banks 6,325.6 6,553.0 6,978.2 6,848.4 8,344.4 9,088.6 9,272.6 9,719.4 9,767.9
Savings and time deposits 5,846.3 6,192.4 6,729.9 6,719.0 8,336.3 9,070.2 9,254.7 9,701.8 9,750.8
Sight deposits 1,172.9 1,635.8 1,537.2 1,374.5 1,267.8 1,410.2 1,383.3 1,532.6 1,458.4
Time and notice deposits 4,673.4 4,556.7 5,192.7 5,344.6 7,068.6 7,660.0 7,871.4 8,169.2 8,292.3
Loans and advances 479.3 360.5 248.3 129.3 8.0 18.4 17.9 17.6 17.2
o/w: Subordinated and hybrid instruments – – – – – 10.9 10.8 10.9 11.0
2 Foreign liabilities in kuna 15,039.1 20,961.8 16,691.3 20,569.2 20,318.6 19,638.5 20,978.0 19,901.0 20,144.7
2.1 Liabilities to foreign financial institutions 14,099.6 20,087.0 16,093.8 20,061.0 19,943.0 19,270.1 20,591.6 19,529.6 19,766.0
Demand deposits 179.6 1,438.1 519.0 898.1 359.1 273.7 384.6 344.1 496.6
Time and notice deposits 6,979.5 11,198.8 11,423.7 15,014.2 14,654.3 12,952.7 14,111.2 13,094.3 13,195.8
Loans and advances 6,940.5 7,450.2 4,151.2 4,148.8 4,929.6 6,043.7 6,095.8 6,091.2 6,073.6
o/w: Subordinated and hybrid instruments 405.7 404.0 0.4 – 749.2 773.8 836.9 832.2 814.7
2.2 Liabilities to foreign non-banks 939.5 874.8 597.5 508.2 375.7 368.4 386.4 371.5 378.8
Demand deposits 180.3 170.1 253.2 257.0 222.8 220.9 235.6 231.1 241.5
Time and notice deposits 755.2 703.3 340.6 245.7 144.4 139.0 142.2 131.9 128.8
Loans and advances 4.0 1.4 3.7 5.5 8.5 8.5 8.5 8.5 8.5
o/w: Subordinated and hybrid instruments 4.0 1.4 3.7 5.5 8.5 8.5 8.5 8.5 8.5
Total (1+2) 67,112.3 76,076.0 65,152.6 75,296.1 80,365.3 79,719.4 82,457.8 76,137.6 73,734.8
Table D9 Bonds and money market instruments • The table shows banks’ liabilities for securities issued (net) and loans re-ceived from other domestic sectors, other banking institutions and non-banking financial institutions.
Money market instruments (net) comprise banks’ net liabili-ties for CNB bills, bills of exchange (issued and accepted) and other securities issued.
Bonds (net) comprise banks’ net liabilities for kuna and for-eign currency bonds issued, as well as issued subordinated and hybrid instruments, excluding those purchased by foreign inves-tors.
Other domestic borrowing comprises loans received, which are reported in the total amount and classified by institutional sectors.
Table D10 Banks’ foreign liabilities • The table shows banks’ total foreign currency and kuna liabilities to foreign legal and natural persons, with the exception of restricted kuna and for-eign currency deposits by foreign legal and natural persons.
Banks’ foreign liabilities comprise foreign currency liabilities and foreign kuna liabilities.
Within foreign kuna and foreign currency liabilities, liabili-ties to foreign banks are reported separately from liabilities to foreign non-banks (total and by financial instruments). Loans and advances also include issued subordinated and hybrid in-struments purchased by foreign investors.

CNB BULLETIN • NUMBER 165 • STATISTICAL SURVEY • D BANKS 47
Table D12 Restricted and blocked deposits with banksend of period, in million HRK
2005Dec.
2006Dec.
2007Dec.
2008Dec.
2009Dec.
2010
Mar. Jun. Sep. Oct.
1 Restricted deposits 2,036.4 2,447.6 2,252.3 3,038.4 2,548.4 2,395.6 2,720.7 2,529.6 2,711.8
1.1 In kuna 1,277.1 1,427.0 1,322.8 1,478.8 1,366.0 1,403.2 1,398.5 1,398.2 1,408.6
1.2 In f/c 759.3 1,020.5 929.5 1,559.6 1,182.5 992.3 1,322.2 1,131.4 1,303.1
2 Blocked f/c deposits of housholds – – – – – – – – –
Total (1+2) 2,036.4 2,447.6 2,252.3 3,038.4 2,548.4 2,395.6 2,720.7 2,529.6 2,711.8
Table D11 Central government and funds’ deposits with banksend of period, in million HRK
2005Dec.
2006Dec.
2007Dec.
2008Dec.
2009Dec.
2010
Mar. Jun. Sep. Oct.
1 In kuna 7,596.1 9,030.0 11,535.0 14,185.1 15,124.1 15,681.5 15,946.1 16,529.2 16,700.9
1.1 Central government deposits 605.0 497.5 666.4 429.5 356.6 449.9 539.6 757.5 824.7
Demand deposits 458.1 366.2 454.9 176.7 189.3 155.4 184.7 173.7 164.6
Savings deposits 1.8 2.1 1.2 1.1 0.6 0.5 0.6 0.6 0.5
Time and notice deposits 144.0 128.1 209.3 251.6 166.7 294.0 354.3 583.3 659.5
Loans and advances 1.0 1.0 1.0 – – – – – –
1.2 Central government funds' deposits 6,991.1 8,532.6 10,868.6 13,755.5 14,767.5 15,231.5 15,406.5 15,771.7 15,876.3
Demand deposits 580.2 254.6 330.1 645.6 389.5 448.1 449.5 526.0 635.7
Savings deposits 1.9 14.6 2.4 0.0 0.3 0.1 0.0 0.1 0.0
Time and notice deposits 251.7 496.7 413.6 385.8 410.8 649.4 414.8 372.8 523.4
Loans and advances 6,157.3 7,766.7 10,122.4 12,724.1 13,966.9 14,133.9 14,542.2 14,872.9 14,717.2
2 In f/c 1,690.9 1,770.4 1,990.8 1,822.5 3,095.2 1,702.8 1,486.4 3,227.5 2,937.5
2.1 Central government deposits 906.2 811.7 759.4 1,122.5 1,088.3 1,024.7 1,219.3 1,481.4 1,471.4
Savings deposits 340.6 264.8 527.4 666.8 716.8 459.3 514.2 851.4 828.7
Time and notice deposits 38.7 275.0 49.7 330.0 309.4 532.4 669.0 629.9 642.5
Refinanced loans and advances 527.0 271.9 182.3 125.7 62.2 33.0 36.1 0.2 0.2
2.2 Central government funds' deposits 784.7 958.6 1,231.4 699.9 2,006.9 678.0 267.1 1,746.0 1,466.1
Savings deposits 139.4 93.4 85.7 107.1 106.6 54.6 102.3 219.9 102.0
Time and notice deposits 25.8 356.2 153.8 519.6 256.4 260.5 92.8 1,159.1 1,070.5
Loans and advances 619.6 509.0 991.8 73.2 1,643.9 363.0 71.9 367.0 293.6
Total (1+2) 9,287.0 10,800.4 13,525.8 16,007.5 18,219.3 17,384.2 17,432.5 19,756.7 19,638.4
Table D11 Central government and funds’ deposits with banks • The table reports total banks’ kuna and foreign cur-rency liabilities to the central government and funds, with the exception of restricted (kuna and foreign currency) deposits by the central government and funds with banks.
Kuna and foreign currency deposits by the Republic of
Croatia and central government funds are shown separately. Kuna deposits comprise demand deposits, savings deposits, time and notice deposits, and loans received from the central gov-ernment and funds. Foreign currency deposits comprise savings deposits, time and notice deposits, and refinanced loans and ad-vances.
Table D12 Restricted and blocked deposits with banks • The table shows households’ restricted (kuna and foreign currency) deposits and blocked deposits.
Blocked foreign currency deposits include households’
foreign currency deposits, regulated by the Act on Converting Households’ Foreign Currency Deposits into the Public Debt of the Republic of Croatia.

CNB BULLETIN • NUMBER 165 • STATISTICAL SURVEY • D BANKS48
October 2010
October 2010
Distribution of banks loans by
domestic institutional sectors
’
Distribution of banks deposits
by domestic institutional sectors
’
Figure D1
Figure D2
Non-monetary
financial
institutions
Government
Households
Enterprises
Non-monetary
financial
institutions
Government
Enterprises
Households
Note:Sector “Non-monetary financial institutions” includes other banking institutions and non-banking financial institutions.Sector “Government” includes the central government and funds and local government.
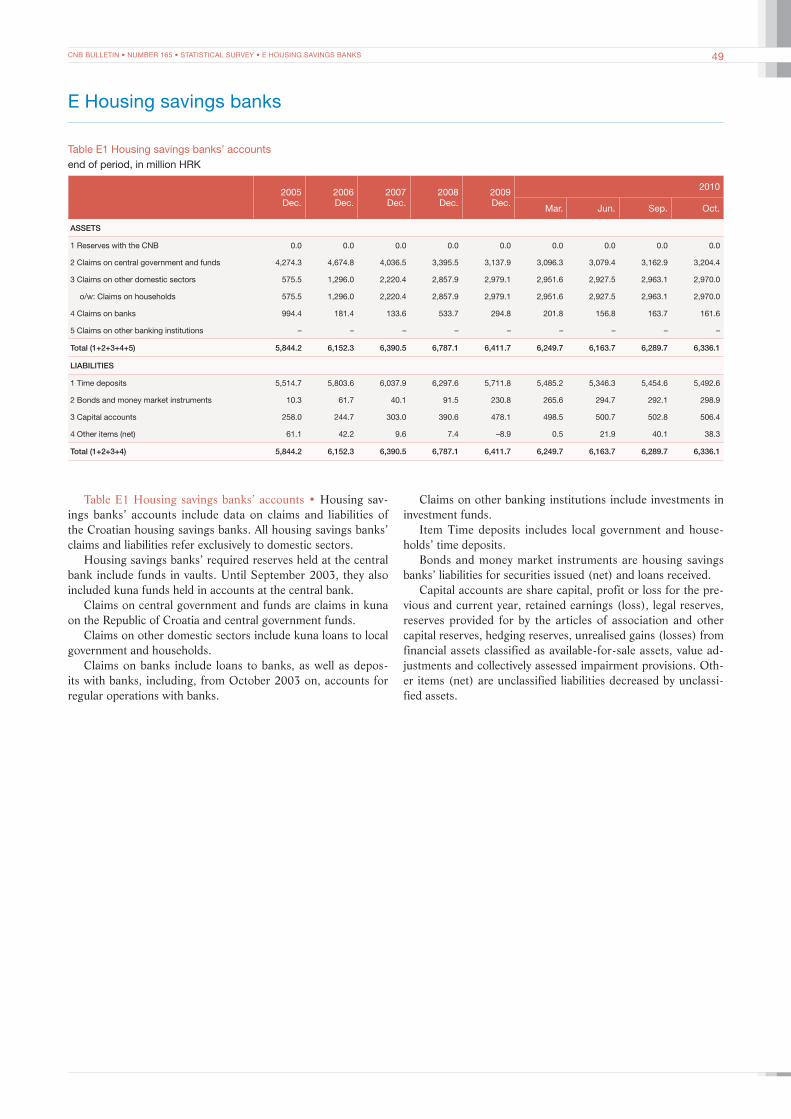
CNB BULLETIN • NUMBER 165 • STATISTICAL SURVEY • E HOUSING SAVINGS BANKS 49
E Housing savings banks
Table E1 Housing savings banks’ accountsend of period, in million HRK
2005Dec.
2006Dec.
2007Dec.
2008Dec.
2009Dec.
2010
Mar. Jun. Sep. Oct.
ASSETS
1 Reserves with the CNB 0.0 0.0 0.0 0.0 0.0 0.0 0.0 0.0 0.0
2 Claims on central government and funds 4,274.3 4,674.8 4,036.5 3,395.5 3,137.9 3,096.3 3,079.4 3,162.9 3,204.4
3 Claims on other domestic sectors 575.5 1,296.0 2,220.4 2,857.9 2,979.1 2,951.6 2,927.5 2,963.1 2,970.0
o/w: Claims on households 575.5 1,296.0 2,220.4 2,857.9 2,979.1 2,951.6 2,927.5 2,963.1 2,970.0
4 Claims on banks 994.4 181.4 133.6 533.7 294.8 201.8 156.8 163.7 161.6
5 Claims on other banking institutions – – – – – – – – –
Total (1+2+3+4+5) 5,844.2 6,152.3 6,390.5 6,787.1 6,411.7 6,249.7 6,163.7 6,289.7 6,336.1
LIABILITIES
1 Time deposits 5,514.7 5,803.6 6,037.9 6,297.6 5,711.8 5,485.2 5,346.3 5,454.6 5,492.6
2 Bonds and money market instruments 10.3 61.7 40.1 91.5 230.8 265.6 294.7 292.1 298.9
3 Capital accounts 258.0 244.7 303.0 390.6 478.1 498.5 500.7 502.8 506.4
4 Other items (net) 61.1 42.2 9.6 7.4 –8.9 0.5 21.9 40.1 38.3
Total (1+2+3+4) 5,844.2 6,152.3 6,390.5 6,787.1 6,411.7 6,249.7 6,163.7 6,289.7 6,336.1
Table E1 Housing savings banks’ accounts • Housing sav-ings banks’ accounts include data on claims and liabilities of the Croatian housing savings banks. All housing savings banks’ claims and liabilities refer exclusively to domestic sectors.
Housing savings banks’ required reserves held at the central bank include funds in vaults. Until September 2003, they also included kuna funds held in accounts at the central bank.
Claims on central government and funds are claims in kuna on the Republic of Croatia and central government funds.
Claims on other domestic sectors include kuna loans to local government and households.
Claims on banks include loans to banks, as well as depos-its with banks, including, from October 2003 on, accounts for regular operations with banks.
Claims on other banking institutions include investments in investment funds.
Item Time deposits includes local government and house-holds’ time deposits.
Bonds and money market instruments are housing savings banks’ liabilities for securities issued (net) and loans received.
Capital accounts are share capital, profit or loss for the pre-vious and current year, retained earnings (loss), legal reserves, reserves provided for by the articles of association and other capital reserves, hedging reserves, unrealised gains (losses) from financial assets classified as available-for-sale assets, value ad-justments and collectively assessed impairment provisions. Oth-er items (net) are unclassified liabilities decreased by unclassi-fied assets.
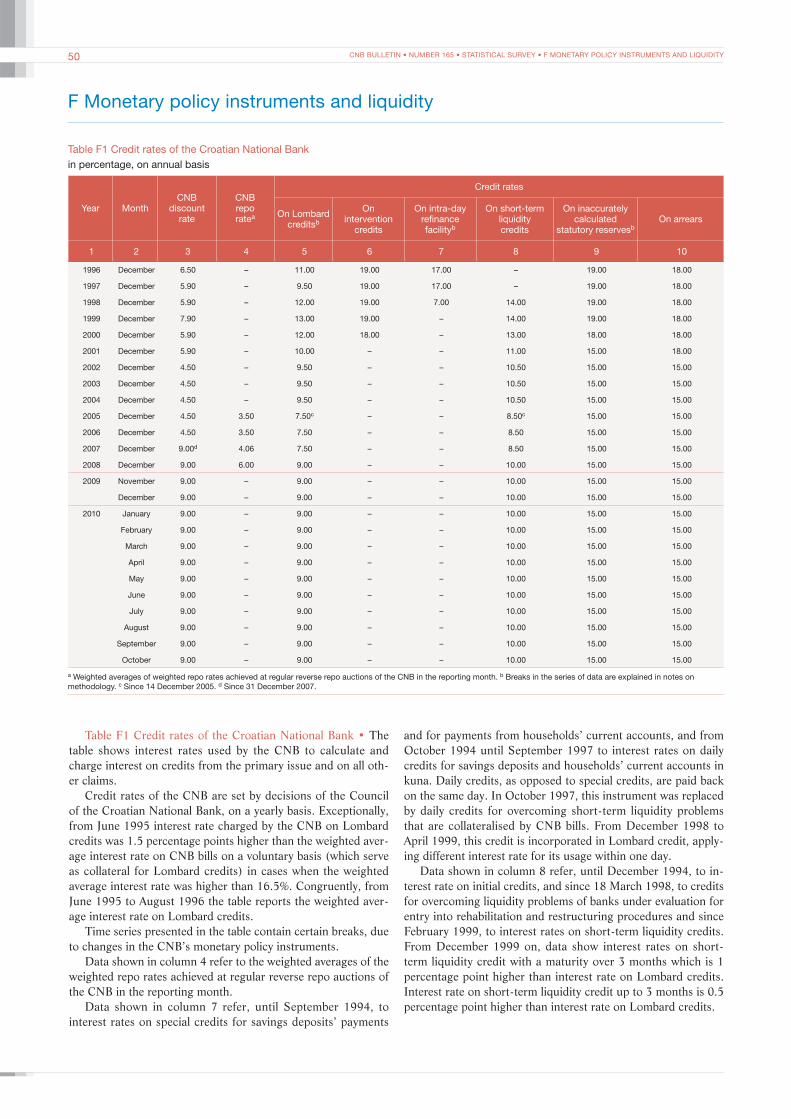
CNB BULLETIN • NUMBER 165 • STATISTICAL SURVEY • F MONETARY POLICY INSTRUMENTS AND LIQUIDITY50
F Monetary policy instruments and liquidity
Table F1 Credit rates of the Croatian National Bankin percentage, on annual basis
Year MonthCNB
discount rate
CNB repo ratea
Credit rates
On Lombard creditsb
On intervention
credits
On intra-day refinance facilityb
On short-term liquidity credits
On inaccurately calculated
statutory reservesbOn arrears
1 2 3 4 5 6 7 8 9 10
1996 December 6.50 – 11.00 19.00 17.00 – 19.00 18.00
1997 December 5.90 – 9.50 19.00 17.00 – 19.00 18.00
1998 December 5.90 – 12.00 19.00 7.00 14.00 19.00 18.00
1999 December 7.90 – 13.00 19.00 – 14.00 19.00 18.00
2000 December 5.90 – 12.00 18.00 – 13.00 18.00 18.00
2001 December 5.90 – 10.00 – – 11.00 15.00 18.00
2002 December 4.50 – 9.50 – – 10.50 15.00 15.00
2003 December 4.50 – 9.50 – – 10.50 15.00 15.00
2004 December 4.50 – 9.50 – – 10.50 15.00 15.00
2005 December 4.50 3.50 7.50c – – 8.50c 15.00 15.00
2006 December 4.50 3.50 7.50 – – 8.50 15.00 15.00
2007 December 9.00d 4.06 7.50 – – 8.50 15.00 15.00
2008 December 9.00 6.00 9.00 – – 10.00 15.00 15.00
2009 November 9.00 – 9.00 – – 10.00 15.00 15.00
December 9.00 – 9.00 – – 10.00 15.00 15.00
2010 January 9.00 – 9.00 – – 10.00 15.00 15.00
February 9.00 – 9.00 – – 10.00 15.00 15.00
March 9.00 – 9.00 – – 10.00 15.00 15.00
April 9.00 – 9.00 – – 10.00 15.00 15.00
May 9.00 – 9.00 – – 10.00 15.00 15.00
June 9.00 – 9.00 – – 10.00 15.00 15.00
July 9.00 – 9.00 – – 10.00 15.00 15.00
August 9.00 – 9.00 – – 10.00 15.00 15.00
September 9.00 – 9.00 – – 10.00 15.00 15.00
October 9.00 – 9.00 – – 10.00 15.00 15.00
a Weighted averages of weighted repo rates achieved at regular reverse repo auctions of the CNB in the reporting month. b Breaks in the series of data are explained in notes on methodology. c Since 14 December 2005. d Since 31 December 2007.
Table F1 Credit rates of the Croatian National Bank • The table shows interest rates used by the CNB to calculate and charge interest on credits from the primary issue and on all oth-er claims.
Credit rates of the CNB are set by decisions of the Council of the Croatian National Bank, on a yearly basis. Exceptionally, from June 1995 interest rate charged by the CNB on Lombard credits was 1.5 percentage points higher than the weighted aver-age interest rate on CNB bills on a voluntary basis (which serve as collateral for Lombard credits) in cases when the weighted average interest rate was higher than 16.5%. Congruently, from June 1995 to August 1996 the table reports the weighted aver-age interest rate on Lombard credits.
Time series presented in the table contain certain breaks, due to changes in the CNB’s monetary policy instruments.
Data shown in column 4 refer to the weighted averages of the weighted repo rates achieved at regular reverse repo auctions of the CNB in the reporting month.
Data shown in column 7 refer, until September 1994, to interest rates on special credits for savings deposits’ payments
and for payments from households’ current accounts, and from October 1994 until September 1997 to interest rates on daily credits for savings deposits and households’ current accounts in kuna. Daily credits, as opposed to special credits, are paid back on the same day. In October 1997, this instrument was replaced by daily credits for overcoming short-term liquidity problems that are collateralised by CNB bills. From December 1998 to April 1999, this credit is incorporated in Lombard credit, apply-ing different interest rate for its usage within one day.
Data shown in column 8 refer, until December 1994, to in-terest rate on initial credits, and since 18 March 1998, to credits for overcoming liquidity problems of banks under evaluation for entry into rehabilitation and restructuring procedures and since February 1999, to interest rates on short-term liquidity credits. From December 1999 on, data show interest rates on short-term liquidity credit with a maturity over 3 months which is 1 percentage point higher than interest rate on Lombard credits. Interest rate on short-term liquidity credit up to 3 months is 0.5 percentage point higher than interest rate on Lombard credits.

CNB BULLETIN • NUMBER 165 • STATISTICAL SURVEY • F MONETARY POLICY INSTRUMENTS AND LIQUIDITY 51
Table F2 Deposit rates of the Croatian National Bankin percentage, on annual basis
Year Month
Interest rates on statutory
reserves dep. with the CNB
Interest rates on CNB bills
on an obligatory
basis
Interest rates on CNB bills on a voluntary basisa Interest rates on f/c CNB bills on a voluntary basis Interest
rates on overnight depositsDue in
7 daysDue in
35 daysDue in
70 daysDue in
105 daysDue in
35 daysDue in
63 daysDue in
91 daysDue in
182 daysDue in
364 days
1 2 3 4 5 6 7 8 9 10 11 12 13 14
1996 December 5.50 – – 8.00 9.50 – – – – – – –
1997 December 4.50 – – 8.00 9.00 10.00 – – – – – –
1998 December 5.90 – – 9.50 10.50 11.00 – 4.60 3.12 3.08 – –
1999 December 5.90 – – 10.50 11.55 12.50 – 4.83 3.56 – – –
2000 December 4.50 – – 6.65 7.00 7.70 – 5.51 4.83 – – –
2001 December 2.00 – – 3.36 4.26 4.85 – 2.62 3.06 – – –
2002 December 1.75 – – 2.08 – – 2.30 2.68 – – – –
2003 December 1.25 0.50 – – – – 1.75 1.48 – – – –
2004 December 1.25 – – – – – – – – – – –
2005 December 0.75 – – – – – – – – – – 0.50
2006 December 0.75 – – – – – – – – – – 0.50
2007 December 0.75 0.75 – – – – – – – – – 0.50
2008 December 0.75 0.25 – – – – – – – – – 0.50
2009 November 0.75 0.25 – – – – – – – – – 0.50
December 0.75 0.25 – – – – – – – – – 0.50
2010 January 0.75 – – – – – – – – – – 0.50
February 0.75 – – – – – – – – – – 0.50
March 0.75 – – – – – – – – – – 0.50
April 0.75 – – – – – – – – – – 0.50
May 0.75 – – – – – – – – – – 0.50
June 0.75 – – – – – – – – – – 0.50
July 0.75 – – – – – – – – – – 0.50
August 0.75 – – – – – – – – – – 0.50
September 0.75 – – – – – – – – – – 0.50
October 0.75 – – – – – – – – – – 0.50
a Breaks in the series of data are explained in notes on methodology.
Table F2 Deposit rates of the Croatian National Bank • The table shows interest rates used by the CNB to calculate and pay interest on funds deposited with the CNB and on issued securi-ties.
Interest rates paid by the CNB for appropriated statutory re-serve funds are set by a decision of the Council of the Croa-tian National Bank. Until April 2005, the appropriated statutory reserve funds included the calculated statutory reserve funds that were deposit in a special statutory reserve account with the CNB, or maintained (in average) in banks’ settlement accounts, or deposited in a special account with the CNB for the settle-ment of net positions in the National Clearing System (NCS). From April 2005, they include the calculated statutory reserve funds allocated to a special statutory reserve account with the CNB (column 3).
Interest rates on CNB bills on an obligatory basis are set by a decision of the Council of the Croatian National Bank.
Interest rates on CNB bills on a voluntary basis are set at CNB bills’ auction sales. Congruently, columns 5, 6 and 7 report the weighted average interest rates attained at auctions of CNB bills. From November 1994 through January 2001, columns 7 and 8 report interest rates on CNB bills on a voluntary basis due in 91 and 182 days respectively.
From April 1998 on, columns 9 through 13 report the weighted average interest rates on CNB bills on a voluntary basis in EUR and USD (until December 1998, in DEM and USD) attained at CNB bills’ auctions as a weighted average of sub-scribed amounts in those two currencies.
Column 14 reports the interest rate on overnight deposits with the CNB.
Table F3 Banks’ reserve requirements • This table shows da-ta on monthly averages of day-to-day balances of banks’ kuna and foreign currency reserve requirements with the CNB. Sav-ings banks are included beginning in July 1999.
Column 3 shows the weighted average reserve requirement ratio as a percentage of the kuna and foreign currency reserve requirements (column 4) in the reserve base.
Reserve requirement (column 4) represents the prescribed amount of funds banks are required to deposit in a special stat-utory reserve account with the CNB, or to maintain (in aver-age) in their settlement accounts and in vaults, or in accounts of liquid foreign currency claims (which include foreign cash and checks in foreign currency, liquid foreign currency claims main-tained in the accounts with the high-grade foreign banks and foreign currency CNB bills).
Column 5 shows the amount of kuna reserve requirements. Between January 1995 and December 2000, this amount cor-responded with the statutory reserve requirement instrument, while until December 1994 it comprised two instruments: statu-tory reserves and liquid assets requirement – LAR (except for the part in which banks were conforming to this requirement by registering CNB bills on a voluntary basis). In December 2000, reserve requirements in kuna and in foreign currency were uni-fied, i.e. reserve requirements rate, periods for calculating, al-locating and maintaining reserve requirements were unified, as
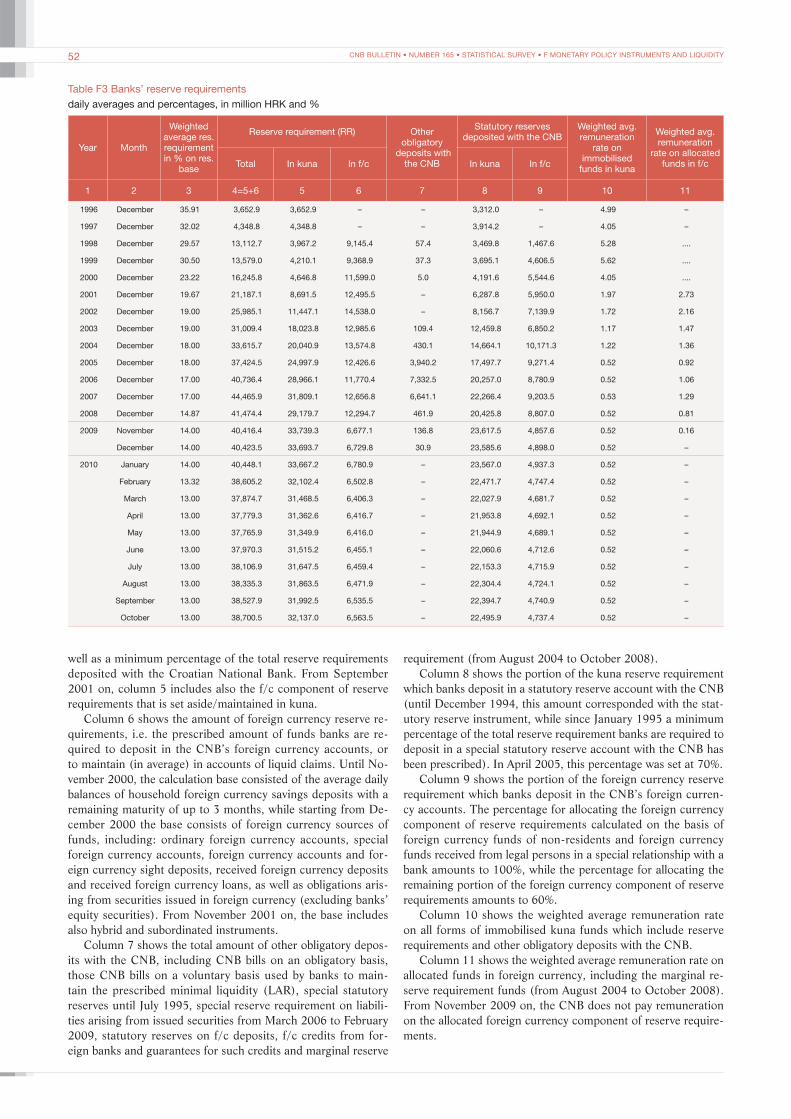
CNB BULLETIN • NUMBER 165 • STATISTICAL SURVEY • F MONETARY POLICY INSTRUMENTS AND LIQUIDITY52
Table F3 Banks’ reserve requirementsdaily averages and percentages, in million HRK and %
Year Month
Weighted average res. requirement in % on res.
base
Reserve requirement (RR) Other obligatory
deposits with the CNB
Statutory reserves deposited with the CNB
Weighted avg. remuneration
rate on immobilised
funds in kuna
Weighted avg. remuneration
rate on allocated funds in f/cTotal In kuna In f/c In kuna In f/c
1 2 3 4=5+6 5 6 7 8 9 10 11
1996 December 35.91 3,652.9 3,652.9 – – 3,312.0 – 4.99 –
1997 December 32.02 4,348.8 4,348.8 – – 3,914.2 – 4.05 –
1998 December 29.57 13,112.7 3,967.2 9,145.4 57.4 3,469.8 1,467.6 5.28 ....
1999 December 30.50 13,579.0 4,210.1 9,368.9 37.3 3,695.1 4,606.5 5.62 ....
2000 December 23.22 16,245.8 4,646.8 11,599.0 5.0 4,191.6 5,544.6 4.05 ....
2001 December 19.67 21,187.1 8,691.5 12,495.5 – 6,287.8 5,950.0 1.97 2.73
2002 December 19.00 25,985.1 11,447.1 14,538.0 – 8,156.7 7,139.9 1.72 2.16
2003 December 19.00 31,009.4 18,023.8 12,985.6 109.4 12,459.8 6,850.2 1.17 1.47
2004 December 18.00 33,615.7 20,040.9 13,574.8 430.1 14,664.1 10,171.3 1.22 1.36
2005 December 18.00 37,424.5 24,997.9 12,426.6 3,940.2 17,497.7 9,271.4 0.52 0.92
2006 December 17.00 40,736.4 28,966.1 11,770.4 7,332.5 20,257.0 8,780.9 0.52 1.06
2007 December 17.00 44,465.9 31,809.1 12,656.8 6,641.1 22,266.4 9,203.5 0.53 1.29
2008 December 14.87 41,474.4 29,179.7 12,294.7 461.9 20,425.8 8,807.0 0.52 0.81
2009 November 14.00 40,416.4 33,739.3 6,677.1 136.8 23,617.5 4,857.6 0.52 0.16
December 14.00 40,423.5 33,693.7 6,729.8 30.9 23,585.6 4,898.0 0.52 –
2010 January 14.00 40,448.1 33,667.2 6,780.9 – 23,567.0 4,937.3 0.52 –
February 13.32 38,605.2 32,102.4 6,502.8 – 22,471.7 4,747.4 0.52 –
March 13.00 37,874.7 31,468.5 6,406.3 – 22,027.9 4,681.7 0.52 –
April 13.00 37,779.3 31,362.6 6,416.7 – 21,953.8 4,692.1 0.52 –
May 13.00 37,765.9 31,349.9 6,416.0 – 21,944.9 4,689.1 0.52 –
June 13.00 37,970.3 31,515.2 6,455.1 – 22,060.6 4,712.6 0.52 –
July 13.00 38,106.9 31,647.5 6,459.4 – 22,153.3 4,715.9 0.52 –
August 13.00 38,335.3 31,863.5 6,471.9 – 22,304.4 4,724.1 0.52 –
September 13.00 38,527.9 31,992.5 6,535.5 – 22,394.7 4,740.9 0.52 –
October 13.00 38,700.5 32,137.0 6,563.5 – 22,495.9 4,737.4 0.52 –
well as a minimum percentage of the total reserve requirements deposited with the Croatian National Bank. From September 2001 on, column 5 includes also the f/c component of reserve requirements that is set aside/maintained in kuna.
Column 6 shows the amount of foreign currency reserve re-quirements, i.e. the prescribed amount of funds banks are re-quired to deposit in the CNB’s foreign currency accounts, or to maintain (in average) in accounts of liquid claims. Until No-vember 2000, the calculation base consisted of the average daily balances of household foreign currency savings deposits with a remaining maturity of up to 3 months, while starting from De-cember 2000 the base consists of foreign currency sources of funds, including: ordinary foreign currency accounts, special foreign currency accounts, foreign currency accounts and for-eign currency sight deposits, received foreign currency deposits and received foreign currency loans, as well as obligations aris-ing from securities issued in foreign currency (excluding banks’ equity securities). From November 2001 on, the base includes also hybrid and subordinated instruments.
Column 7 shows the total amount of other obligatory depos-its with the CNB, including CNB bills on an obligatory basis, those CNB bills on a voluntary basis used by banks to main-tain the prescribed minimal liquidity (LAR), special statutory reserves until July 1995, special reserve requirement on liabili-ties arising from issued securities from March 2006 to February 2009, statutory reserves on f/c deposits, f/c credits from for-eign banks and guarantees for such credits and marginal reserve
requirement (from August 2004 to October 2008).Column 8 shows the portion of the kuna reserve requirement
which banks deposit in a statutory reserve account with the CNB (until December 1994, this amount corresponded with the stat-utory reserve instrument, while since January 1995 a minimum percentage of the total reserve requirement banks are required to deposit in a special statutory reserve account with the CNB has been prescribed). In April 2005, this percentage was set at 70%.
Column 9 shows the portion of the foreign currency reserve requirement which banks deposit in the CNB’s foreign curren-cy accounts. The percentage for allocating the foreign currency component of reserve requirements calculated on the basis of foreign currency funds of non-residents and foreign currency funds received from legal persons in a special relationship with a bank amounts to 100%, while the percentage for allocating the remaining portion of the foreign currency component of reserve requirements amounts to 60%.
Column 10 shows the weighted average remuneration rate on all forms of immobilised kuna funds which include reserve requirements and other obligatory deposits with the CNB.
Column 11 shows the weighted average remuneration rate on allocated funds in foreign currency, including the marginal re-serve requirement funds (from August 2004 to October 2008). From November 2009 on, the CNB does not pay remuneration on the allocated foreign currency component of reserve require-ments.
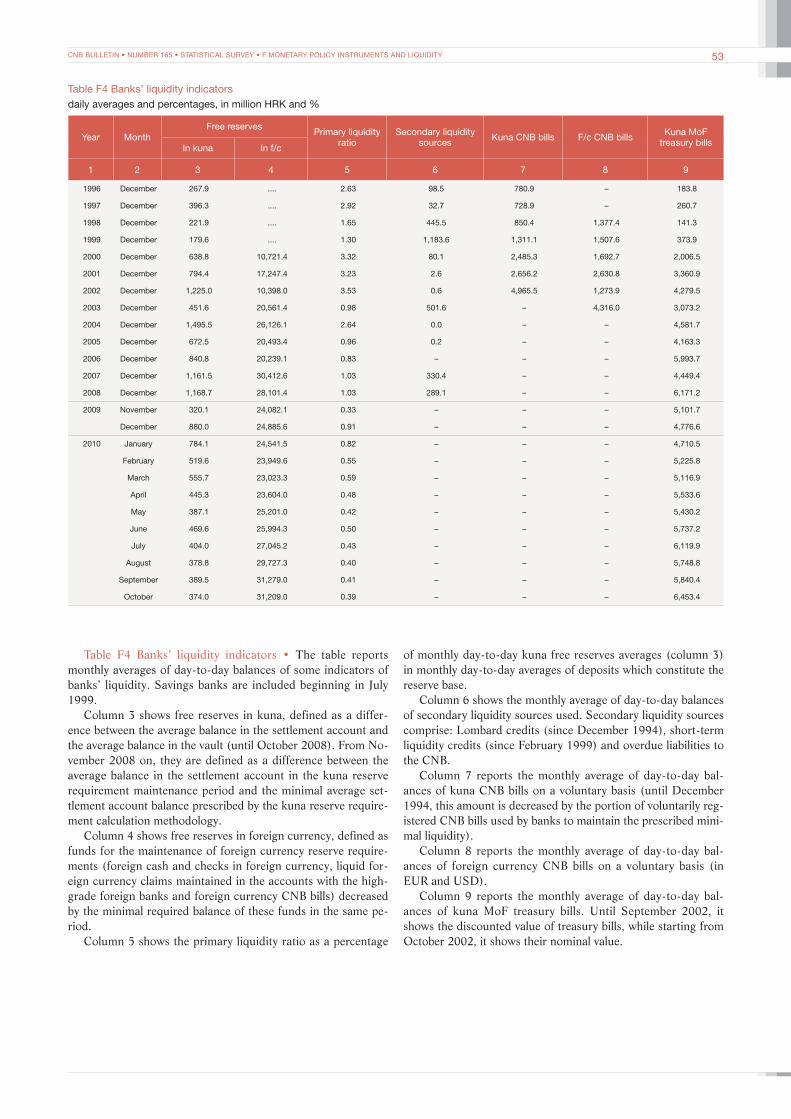
CNB BULLETIN • NUMBER 165 • STATISTICAL SURVEY • F MONETARY POLICY INSTRUMENTS AND LIQUIDITY 53
Table F4 Banks’ liquidity indicatorsdaily averages and percentages, in million HRK and %
Year MonthFree reserves
Primary liquidity ratio
Secondary liquidity sources Kuna CNB bills F/c CNB bills Kuna MoF
treasury billsIn kuna In f/c
1 2 3 4 5 6 7 8 9
1996 December 267.9 .... 2.63 98.5 780.9 – 183.8
1997 December 396.3 .... 2.92 32.7 728.9 – 260.7
1998 December 221.9 .... 1.65 445.5 850.4 1,377.4 141.3
1999 December 179.6 .... 1.30 1,183.6 1,311.1 1,507.6 373.9
2000 December 638.8 10,721.4 3.32 80.1 2,485.3 1,692.7 2,006.5
2001 December 794.4 17,247.4 3.23 2.6 2,656.2 2,630.8 3,360.9
2002 December 1,225.0 10,398.0 3.53 0.6 4,965.5 1,273.9 4,279.5
2003 December 451.6 20,561.4 0.98 501.6 – 4,316.0 3,073.2
2004 December 1,495.5 26,126.1 2.64 0.0 – – 4,581.7
2005 December 672.5 20,493.4 0.96 0.2 – – 4,163.3
2006 December 840.8 20,239.1 0.83 – – – 5,993.7
2007 December 1,161.5 30,412.6 1.03 330.4 – – 4,449.4
2008 December 1,168.7 28,101.4 1.03 289.1 – – 6,171.2
2009 November 320.1 24,082.1 0.33 – – – 5,101.7
December 880.0 24,885.6 0.91 – – – 4,776.6
2010 January 784.1 24,541.5 0.82 – – – 4,710.5
February 519.6 23,949.6 0.55 – – – 5,225.8
March 555.7 23,023.3 0.59 – – – 5,116.9
April 445.3 23,604.0 0.48 – – – 5,533.6
May 387.1 25,201.0 0.42 – – – 5,430.2
June 469.6 25,994.3 0.50 – – – 5,737.2
July 404.0 27,045.2 0.43 – – – 6,119.9
August 378.8 29,727.3 0.40 – – – 5,748.8
September 389.5 31,279.0 0.41 – – – 5,840.4
October 374.0 31,209.0 0.39 – – – 6,453.4
Table F4 Banks’ liquidity indicators • The table reports monthly averages of day-to-day balances of some indicators of banks’ liquidity. Savings banks are included beginning in July 1999.
Column 3 shows free reserves in kuna, defined as a differ-ence between the average balance in the settlement account and the average balance in the vault (until October 2008). From No-vember 2008 on, they are defined as a difference between the average balance in the settlement account in the kuna reserve requirement maintenance period and the minimal average set-tlement account balance prescribed by the kuna reserve require-ment calculation methodology.
Column 4 shows free reserves in foreign currency, defined as funds for the maintenance of foreign currency reserve require-ments (foreign cash and checks in foreign currency, liquid for-eign currency claims maintained in the accounts with the high-grade foreign banks and foreign currency CNB bills) decreased by the minimal required balance of these funds in the same pe-riod.
Column 5 shows the primary liquidity ratio as a percentage
of monthly day-to-day kuna free reserves averages (column 3) in monthly day-to-day averages of deposits which constitute the reserve base.
Column 6 shows the monthly average of day-to-day balances of secondary liquidity sources used. Secondary liquidity sources comprise: Lombard credits (since December 1994), short-term liquidity credits (since February 1999) and overdue liabilities to the CNB.
Column 7 reports the monthly average of day-to-day bal-ances of kuna CNB bills on a voluntary basis (until December 1994, this amount is decreased by the portion of voluntarily reg-istered CNB bills used by banks to maintain the prescribed mini-mal liquidity).
Column 8 reports the monthly average of day-to-day bal-ances of foreign currency CNB bills on a voluntary basis (in EUR and USD).
Column 9 reports the monthly average of day-to-day bal-ances of kuna MoF treasury bills. Until September 2002, it shows the discounted value of treasury bills, while starting from October 2002, it shows their nominal value.
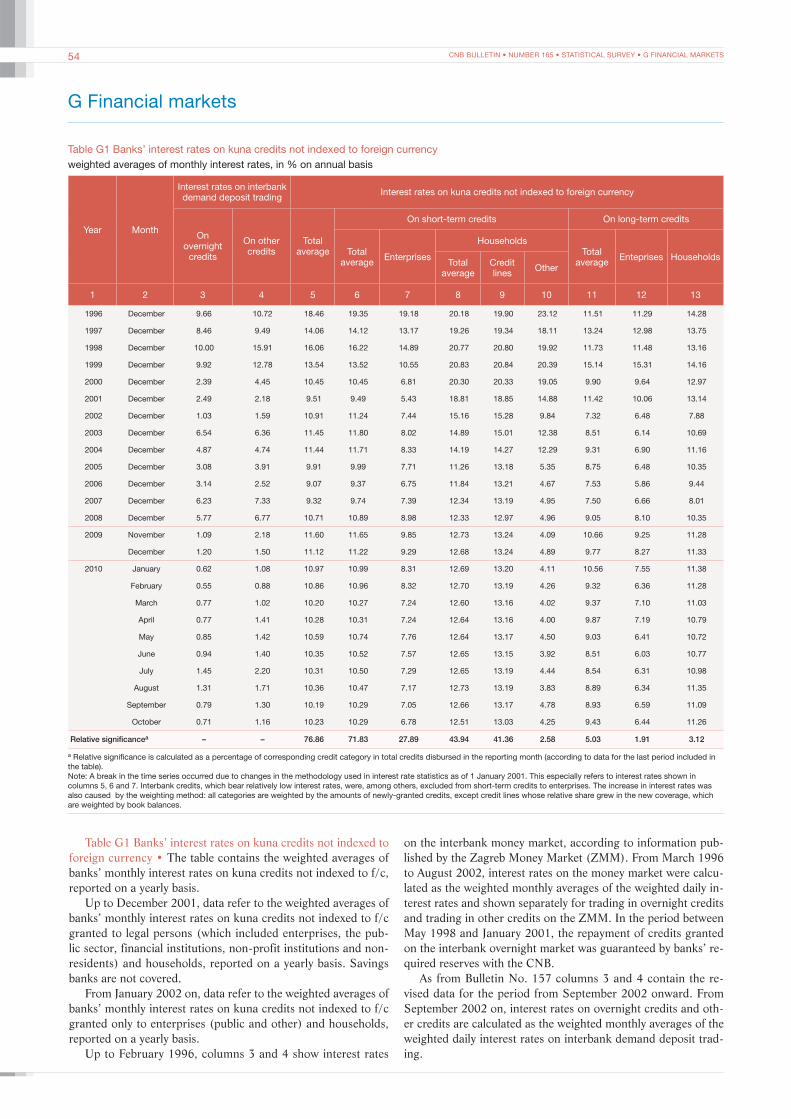
CNB BULLETIN • NUMBER 165 • STATISTICAL SURVEY • G FINANCIAL MARKETS54
G Financial markets
Table G1 Banks’ interest rates on kuna credits not indexed to foreign currencyweighted averages of monthly interest rates, in % on annual basis
Year Month
Interest rates on interbank demand deposit trading Interest rates on kuna credits not indexed to foreign currency
On overnight
credits
On other credits
Total average
On short-term credits On long-term credits
Total average Enterprises
HouseholdsTotal
average Enteprises HouseholdsTotal
averageCredit lines Other
1 2 3 4 5 6 7 8 9 10 11 12 13
1996 December 9.66 10.72 18.46 19.35 19.18 20.18 19.90 23.12 11.51 11.29 14.28
1997 December 8.46 9.49 14.06 14.12 13.17 19.26 19.34 18.11 13.24 12.98 13.75
1998 December 10.00 15.91 16.06 16.22 14.89 20.77 20.80 19.92 11.73 11.48 13.16
1999 December 9.92 12.78 13.54 13.52 10.55 20.83 20.84 20.39 15.14 15.31 14.16
2000 December 2.39 4.45 10.45 10.45 6.81 20.30 20.33 19.05 9.90 9.64 12.97
2001 December 2.49 2.18 9.51 9.49 5.43 18.81 18.85 14.88 11.42 10.06 13.14
2002 December 1.03 1.59 10.91 11.24 7.44 15.16 15.28 9.84 7.32 6.48 7.88
2003 December 6.54 6.36 11.45 11.80 8.02 14.89 15.01 12.38 8.51 6.14 10.69
2004 December 4.87 4.74 11.44 11.71 8.33 14.19 14.27 12.29 9.31 6.90 11.16
2005 December 3.08 3.91 9.91 9.99 7.71 11.26 13.18 5.35 8.75 6.48 10.35
2006 December 3.14 2.52 9.07 9.37 6.75 11.84 13.21 4.67 7.53 5.86 9.44
2007 December 6.23 7.33 9.32 9.74 7.39 12.34 13.19 4.95 7.50 6.66 8.01
2008 December 5.77 6.77 10.71 10.89 8.98 12.33 12.97 4.96 9.05 8.10 10.35
2009 November 1.09 2.18 11.60 11.65 9.85 12.73 13.24 4.09 10.66 9.25 11.28
December 1.20 1.50 11.12 11.22 9.29 12.68 13.24 4.89 9.77 8.27 11.33
2010 January 0.62 1.08 10.97 10.99 8.31 12.69 13.20 4.11 10.56 7.55 11.38
February 0.55 0.88 10.86 10.96 8.32 12.70 13.19 4.26 9.32 6.36 11.28
March 0.77 1.02 10.20 10.27 7.24 12.60 13.16 4.02 9.37 7.10 11.03
April 0.77 1.41 10.28 10.31 7.24 12.64 13.16 4.00 9.87 7.19 10.79
May 0.85 1.42 10.59 10.74 7.76 12.64 13.17 4.50 9.03 6.41 10.72
June 0.94 1.40 10.35 10.52 7.57 12.65 13.15 3.92 8.51 6.03 10.77
July 1.45 2.20 10.31 10.50 7.29 12.65 13.19 4.44 8.54 6.31 10.98
August 1.31 1.71 10.36 10.47 7.17 12.73 13.19 3.83 8.89 6.34 11.35
September 0.79 1.30 10.19 10.29 7.05 12.66 13.17 4.78 8.93 6.59 11.09
October 0.71 1.16 10.23 10.29 6.78 12.51 13.03 4.25 9.43 6.44 11.26
Relative significancea – – 76.86 71.83 27.89 43.94 41.36 2.58 5.03 1.91 3.12
a Relative significance is calculated as a percentage of corresponding credit category in total credits disbursed in the reporting month (according to data for the last period included in the table).Note: A break in the time series occurred due to changes in the methodology used in interest rate statistics as of 1 January 2001. This especially refers to interest rates shown in columns 5, 6 and 7. Interbank credits, which bear relatively low interest rates, were, among others, excluded from short-term credits to enterprises. The increase in interest rates was also caused by the weighting method: all categories are weighted by the amounts of newly-granted credits, except credit lines whose relative share grew in the new coverage, which are weighted by book balances.
Table G1 Banks’ interest rates on kuna credits not indexed to foreign currency • The table contains the weighted averages of banks’ monthly interest rates on kuna credits not indexed to f/c, reported on a yearly basis.
Up to December 2001, data refer to the weighted averages of banks’ monthly interest rates on kuna credits not indexed to f/c granted to legal persons (which included enterprises, the pub-lic sector, financial institutions, non-profit institutions and non-residents) and households, reported on a yearly basis. Savings banks are not covered.
From January 2002 on, data refer to the weighted averages of banks’ monthly interest rates on kuna credits not indexed to f/c granted only to enterprises (public and other) and households, reported on a yearly basis.
Up to February 1996, columns 3 and 4 show interest rates
on the interbank money market, according to information pub-lished by the Zagreb Money Market (ZMM). From March 1996 to August 2002, interest rates on the money market were calcu-lated as the weighted monthly averages of the weighted daily in-terest rates and shown separately for trading in overnight credits and trading in other credits on the ZMM. In the period between May 1998 and January 2001, the repayment of credits granted on the interbank overnight market was guaranteed by banks’ re-quired reserves with the CNB.
As from Bulletin No. 157 columns 3 and 4 contain the re-vised data for the period from September 2002 onward. From September 2002 on, interest rates on overnight credits and oth-er credits are calculated as the weighted monthly averages of the weighted daily interest rates on interbank demand deposit trad-ing.
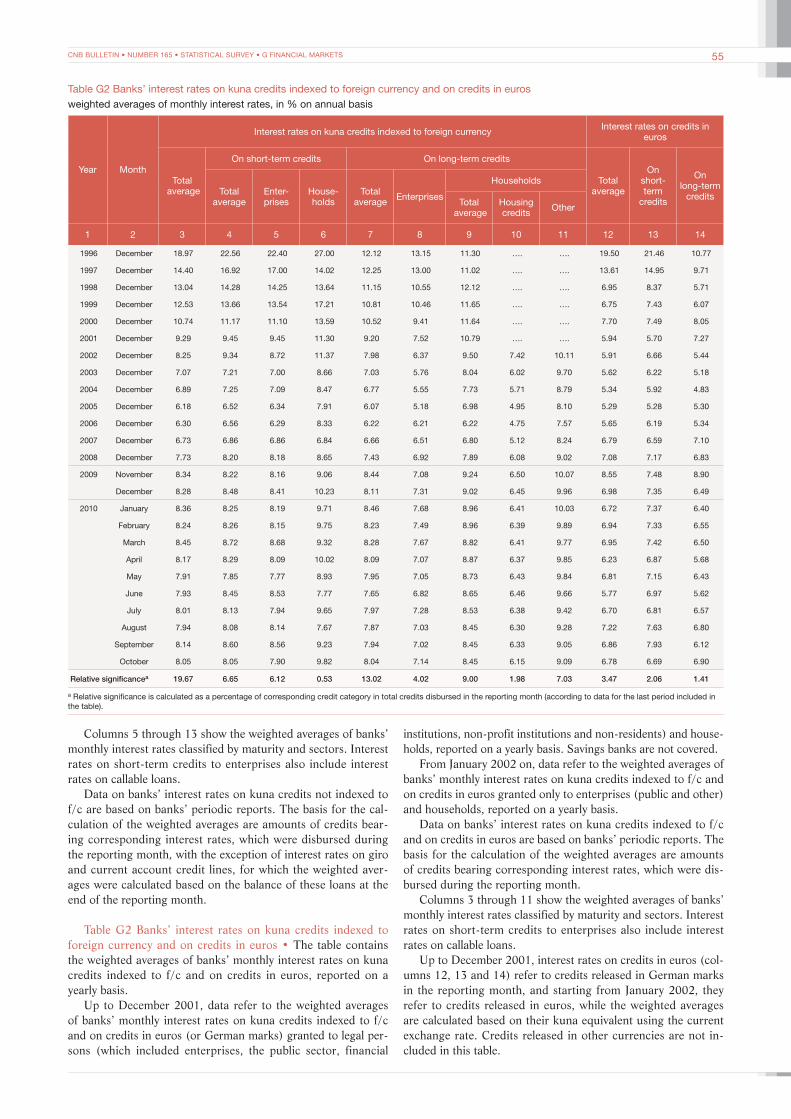
CNB BULLETIN • NUMBER 165 • STATISTICAL SURVEY • G FINANCIAL MARKETS 55
Table G2 Banks’ interest rates on kuna credits indexed to foreign currency and on credits in eurosweighted averages of monthly interest rates, in % on annual basis
Year Month
Interest rates on kuna credits indexed to foreign currency Interest rates on credits in euros
Total average
On short-term credits On long-term credits
Total average
On short-term
credits
On long-term
creditsTotal average
Enter-prises
House-holds
Total average Enterprises
Households
Total average
Housing credits Other
1 2 3 4 5 6 7 8 9 10 11 12 13 14
1996 December 18.97 22.56 22.40 27.00 12.12 13.15 11.30 …. …. 19.50 21.46 10.77
1997 December 14.40 16.92 17.00 14.02 12.25 13.00 11.02 …. …. 13.61 14.95 9.71
1998 December 13.04 14.28 14.25 13.64 11.15 10.55 12.12 …. …. 6.95 8.37 5.71
1999 December 12.53 13.66 13.54 17.21 10.81 10.46 11.65 …. …. 6.75 7.43 6.07
2000 December 10.74 11.17 11.10 13.59 10.52 9.41 11.64 …. …. 7.70 7.49 8.05
2001 December 9.29 9.45 9.45 11.30 9.20 7.52 10.79 …. …. 5.94 5.70 7.27
2002 December 8.25 9.34 8.72 11.37 7.98 6.37 9.50 7.42 10.11 5.91 6.66 5.44
2003 December 7.07 7.21 7.00 8.66 7.03 5.76 8.04 6.02 9.70 5.62 6.22 5.18
2004 December 6.89 7.25 7.09 8.47 6.77 5.55 7.73 5.71 8.79 5.34 5.92 4.83
2005 December 6.18 6.52 6.34 7.91 6.07 5.18 6.98 4.95 8.10 5.29 5.28 5.30
2006 December 6.30 6.56 6.29 8.33 6.22 6.21 6.22 4.75 7.57 5.65 6.19 5.34
2007 December 6.73 6.86 6.86 6.84 6.66 6.51 6.80 5.12 8.24 6.79 6.59 7.10
2008 December 7.73 8.20 8.18 8.65 7.43 6.92 7.89 6.08 9.02 7.08 7.17 6.83
2009 November 8.34 8.22 8.16 9.06 8.44 7.08 9.24 6.50 10.07 8.55 7.48 8.90
December 8.28 8.48 8.41 10.23 8.11 7.31 9.02 6.45 9.96 6.98 7.35 6.49
2010 January 8.36 8.25 8.19 9.71 8.46 7.68 8.96 6.41 10.03 6.72 7.37 6.40
February 8.24 8.26 8.15 9.75 8.23 7.49 8.96 6.39 9.89 6.94 7.33 6.55
March 8.45 8.72 8.68 9.32 8.28 7.67 8.82 6.41 9.77 6.95 7.42 6.50
April 8.17 8.29 8.09 10.02 8.09 7.07 8.87 6.37 9.85 6.23 6.87 5.68
May 7.91 7.85 7.77 8.93 7.95 7.05 8.73 6.43 9.84 6.81 7.15 6.43
June 7.93 8.45 8.53 7.77 7.65 6.82 8.65 6.46 9.66 5.77 6.97 5.62
July 8.01 8.13 7.94 9.65 7.97 7.28 8.53 6.38 9.42 6.70 6.81 6.57
August 7.94 8.08 8.14 7.67 7.87 7.03 8.45 6.30 9.28 7.22 7.63 6.80
September 8.14 8.60 8.56 9.23 7.94 7.02 8.45 6.33 9.05 6.86 7.93 6.12
October 8.05 8.05 7.90 9.82 8.04 7.14 8.45 6.15 9.09 6.78 6.69 6.90
Relative significancea 19.67 6.65 6.12 0.53 13.02 4.02 9.00 1.98 7.03 3.47 2.06 1.41
a Relative significance is calculated as a percentage of corresponding credit category in total credits disbursed in the reporting month (according to data for the last period included in the table).
Columns 5 through 13 show the weighted averages of banks’ monthly interest rates classified by maturity and sectors. Interest rates on short-term credits to enterprises also include interest rates on callable loans.
Data on banks’ interest rates on kuna credits not indexed to f/c are based on banks’ periodic reports. The basis for the cal-culation of the weighted averages are amounts of credits bear-ing corresponding interest rates, which were disbursed during the reporting month, with the exception of interest rates on giro and current account credit lines, for which the weighted aver-ages were calculated based on the balance of these loans at the end of the reporting month.
Table G2 Banks’ interest rates on kuna credits indexed to foreign currency and on credits in euros • The table contains the weighted averages of banks’ monthly interest rates on kuna credits indexed to f/c and on credits in euros, reported on a yearly basis.
Up to December 2001, data refer to the weighted averages of banks’ monthly interest rates on kuna credits indexed to f/c and on credits in euros (or German marks) granted to legal per-sons (which included enterprises, the public sector, financial
institutions, non-profit institutions and non-residents) and house-holds, reported on a yearly basis. Savings banks are not covered.
From January 2002 on, data refer to the weighted averages of banks’ monthly interest rates on kuna credits indexed to f/c and on credits in euros granted only to enterprises (public and other) and households, reported on a yearly basis.
Data on banks’ interest rates on kuna credits indexed to f/c and on credits in euros are based on banks’ periodic reports. The basis for the calculation of the weighted averages are amounts of credits bearing corresponding interest rates, which were dis-bursed during the reporting month.
Columns 3 through 11 show the weighted averages of banks’ monthly interest rates classified by maturity and sectors. Interest rates on short-term credits to enterprises also include interest rates on callable loans.
Up to December 2001, interest rates on credits in euros (col-umns 12, 13 and 14) refer to credits released in German marks in the reporting month, and starting from January 2002, they refer to credits released in euros, while the weighted averages are calculated based on their kuna equivalent using the current exchange rate. Credits released in other currencies are not in-cluded in this table.
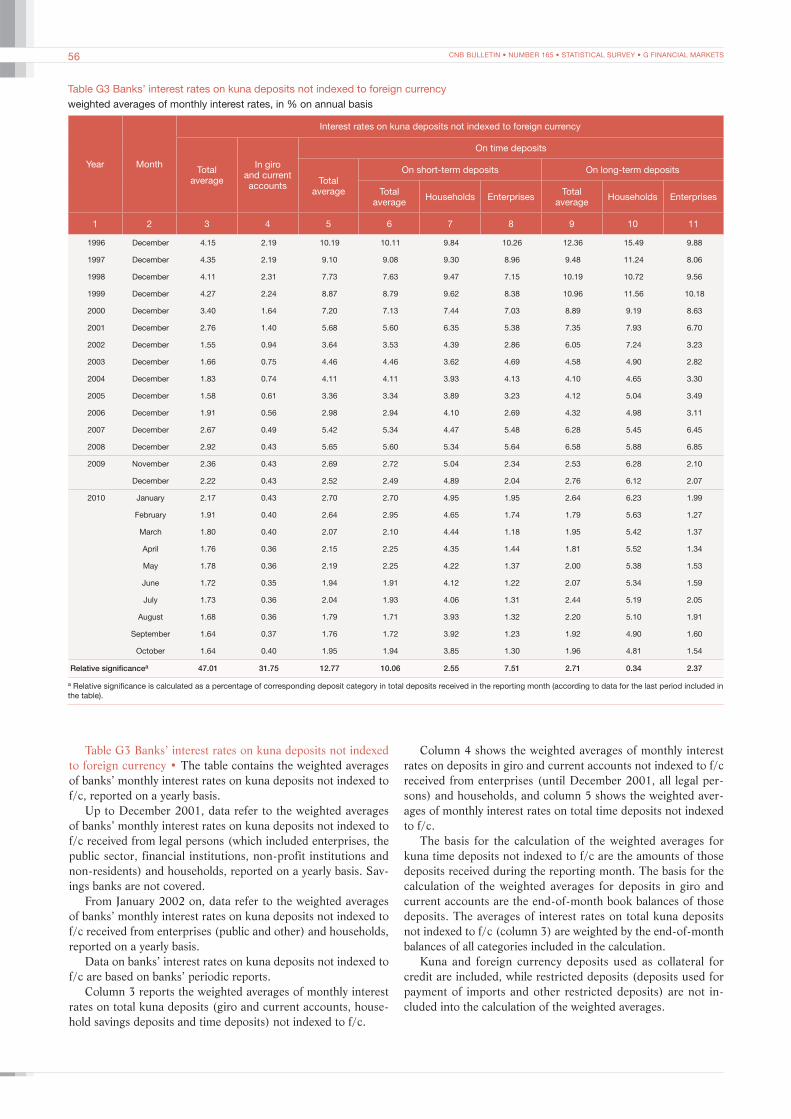
CNB BULLETIN • NUMBER 165 • STATISTICAL SURVEY • G FINANCIAL MARKETS56
Table G3 Banks’ interest rates on kuna deposits not indexed to foreign currencyweighted averages of monthly interest rates, in % on annual basis
Year Month
Interest rates on kuna deposits not indexed to foreign currency
Total average
In giro and current accounts
On time deposits
Total average
On short-term deposits On long-term deposits
Total average Households Enterprises Total
average Households Enterprises
1 2 3 4 5 6 7 8 9 10 11
1996 December 4.15 2.19 10.19 10.11 9.84 10.26 12.36 15.49 9.88
1997 December 4.35 2.19 9.10 9.08 9.30 8.96 9.48 11.24 8.06
1998 December 4.11 2.31 7.73 7.63 9.47 7.15 10.19 10.72 9.56
1999 December 4.27 2.24 8.87 8.79 9.62 8.38 10.96 11.56 10.18
2000 December 3.40 1.64 7.20 7.13 7.44 7.03 8.89 9.19 8.63
2001 December 2.76 1.40 5.68 5.60 6.35 5.38 7.35 7.93 6.70
2002 December 1.55 0.94 3.64 3.53 4.39 2.86 6.05 7.24 3.23
2003 December 1.66 0.75 4.46 4.46 3.62 4.69 4.58 4.90 2.82
2004 December 1.83 0.74 4.11 4.11 3.93 4.13 4.10 4.65 3.30
2005 December 1.58 0.61 3.36 3.34 3.89 3.23 4.12 5.04 3.49
2006 December 1.91 0.56 2.98 2.94 4.10 2.69 4.32 4.98 3.11
2007 December 2.67 0.49 5.42 5.34 4.47 5.48 6.28 5.45 6.45
2008 December 2.92 0.43 5.65 5.60 5.34 5.64 6.58 5.88 6.85
2009 November 2.36 0.43 2.69 2.72 5.04 2.34 2.53 6.28 2.10
December 2.22 0.43 2.52 2.49 4.89 2.04 2.76 6.12 2.07
2010 January 2.17 0.43 2.70 2.70 4.95 1.95 2.64 6.23 1.99
February 1.91 0.40 2.64 2.95 4.65 1.74 1.79 5.63 1.27
March 1.80 0.40 2.07 2.10 4.44 1.18 1.95 5.42 1.37
April 1.76 0.36 2.15 2.25 4.35 1.44 1.81 5.52 1.34
May 1.78 0.36 2.19 2.25 4.22 1.37 2.00 5.38 1.53
June 1.72 0.35 1.94 1.91 4.12 1.22 2.07 5.34 1.59
July 1.73 0.36 2.04 1.93 4.06 1.31 2.44 5.19 2.05
August 1.68 0.36 1.79 1.71 3.93 1.32 2.20 5.10 1.91
September 1.64 0.37 1.76 1.72 3.92 1.23 1.92 4.90 1.60
October 1.64 0.40 1.95 1.94 3.85 1.30 1.96 4.81 1.54
Relative significancea 47.01 31.75 12.77 10.06 2.55 7.51 2.71 0.34 2.37
a Relative significance is calculated as a percentage of corresponding deposit category in total deposits received in the reporting month (according to data for the last period included in the table).
Table G3 Banks’ interest rates on kuna deposits not indexed to foreign currency • The table contains the weighted averages of banks’ monthly interest rates on kuna deposits not indexed to f/c, reported on a yearly basis.
Up to December 2001, data refer to the weighted averages of banks’ monthly interest rates on kuna deposits not indexed to f/c received from legal persons (which included enterprises, the public sector, financial institutions, non-profit institutions and non-residents) and households, reported on a yearly basis. Sav-ings banks are not covered.
From January 2002 on, data refer to the weighted averages of banks’ monthly interest rates on kuna deposits not indexed to f/c received from enterprises (public and other) and households, reported on a yearly basis.
Data on banks’ interest rates on kuna deposits not indexed to f/c are based on banks’ periodic reports.
Column 3 reports the weighted averages of monthly interest rates on total kuna deposits (giro and current accounts, house-hold savings deposits and time deposits) not indexed to f/c.
Column 4 shows the weighted averages of monthly interest rates on deposits in giro and current accounts not indexed to f/c received from enterprises (until December 2001, all legal per-sons) and households, and column 5 shows the weighted aver-ages of monthly interest rates on total time deposits not indexed to f/c.
The basis for the calculation of the weighted averages for kuna time deposits not indexed to f/c are the amounts of those deposits received during the reporting month. The basis for the calculation of the weighted averages for deposits in giro and current accounts are the end-of-month book balances of those deposits. The averages of interest rates on total kuna deposits not indexed to f/c (column 3) are weighted by the end-of-month balances of all categories included in the calculation.
Kuna and foreign currency deposits used as collateral for credit are included, while restricted deposits (deposits used for payment of imports and other restricted deposits) are not in-cluded into the calculation of the weighted averages.

CNB BULLETIN • NUMBER 165 • STATISTICAL SURVEY • G FINANCIAL MARKETS 57
Table G4a Banks’ interest rates on kuna deposits indexed to foreign currency and on foreign currency depositsweighted averages of monthly interest rates, in % on annual basis
Year Month
Interest rates on savings and time deposits indexed to f/c
Interest rates on foreign currency deposits
Total average
Savings deposits
Total average
On short-term deposits
On long-term deposits
Total average
Households Enterprises
EUR USD EUR USD
1 2 3 4 5 6 7 8 9 10 11
1996 December 9.46 9.56 8.80 5.09 1.44 1.32 1.95 1.47 1.39
1997 December 7.63 7.24 11.77 4.77 1.75 1.89 2.43 0.83 1.40
1998 December 7.47 7.67 5.58 3.98 2.09 2.38 2.40 0.72 0.74
1999 December 6.62 6.91 1.10 4.23 1.80 1.95 2.04 0.78 1.30
2000 December 5.54 5.94 2.16 3.47 1.03 0.99 1.23 0.65 1.29
2001 December 4.58 4.92 2.56 2.60 0.71 0.71 0.81 0.82 0.40
2002 December 2.92 3.45 1.48 2.55 0.50 0.52 0.41 0.52 0.38
2003 December 3.48 3.74 5.55 2.22 0.31 0.35 0.23 0.23 0.15
2004 December 4.17 3.61 5.19 2.65 0.31 0.34 0.22 0.22 0.21
2005 December 3.99 3.63 4.77 2.61 0.27 0.27 0.17 0.27 0.76
2006 December 3.67 3.30 4.07 2.94 0.25 0.23 0.17 0.32 0.44
2007 December 3.98 3.76 4.35 3.44 0.25 0.22 0.15 0.36 0.43
2008 December 4.09 4.05 4.42 3.97 0.21 0.20 0.15 0.26 0.13
2009 November 3.39 3.16 4.08 3.99 0.18 0.21 0.15 0.11 0.08
December 3.01 3.12 3.31 3.98 0.18 0.22 0.16 0.10 0.07
2010 January 3.50 3.07 3.33 3.88 0.19 0.22 0.16 0.11 0.07
February 3.40 2.78 4.39 3.71 0.18 0.22 0.16 0.10 0.07
March 3.52 2.73 2.63 3.57 0.18 0.21 0.16 0.09 0.07
April 3.63 2.99 5.46 3.51 0.17 0.20 0.16 0.09 0.09
May 3.21 2.78 2.54 3.37 0.17 0.20 0.16 0.09 0.07
June 3.32 2.79 3.82 3.26 0.18 0.22 0.16 0.10 0.08
July 3.57 3.02 4.06 3.26 0.19 0.21 0.16 0.11 0.08
August 2.68 2.84 3.85 3.20 0.20 0.21 0.17 0.23 0.06
September 3.38 2.57 3.89 3.13 0.20 0.19 0.17 0.27 0.06
October 2.66b 2.47 3.19 3.13 0.23 0.24 0.17 0.25 0.07
Relative significancea 0.57 0.55 0.01 52.42 20.78 13.98 1.65 4.75 0.40
a Relative significance is calculated as a percentage of corresponding deposit category in total deposits received in the reporting month (according to data for the last period included in the table). b Of the total amount of deposits to which this interest rate refers, 46.76% refers to enterprises.
Tables G4a – G4b Banks’ interest rates on kuna deposits indexed to foreign currency and on foreign currency depos-its • The table contains the weighted averages of banks’ monthly interest rates on kuna deposits indexed to f/c and on foreign currency deposits, reported on a yearly basis.
Up to December 2001, data refer to the weighted averages of banks’ monthly interest rates on kuna deposits indexed to f/c and on foreign currency deposits received from legal persons (which included enterprises, the public sector, financial insti-tutions, non-profit institutions and non-residents) and house-holds, reported on a yearly basis. Savings banks are not covered.
From January 2002 on, data refer to the weighted averag-es of banks’ monthly interest rates on kuna deposits indexed to f/c and on foreign currency deposits received from enterprises (public and other) and households, reported on a yearly basis.
Data on banks’ interest rates on kuna deposits indexed to f/c and on foreign currency deposits are based on banks’ periodic reports.
Column 3 reports the weighted averages of monthly interest rates on total kuna savings and time deposits indexed to f/c re-ceived from enterprises (until December 2001, all legal persons)
and households, whereas the weighted averages of monthly in-terest rates on time deposits are shown in column 4 (short-term deposits) and column 5 (long-term deposits) respectively.
Up to December 2001, interest rates on foreign currency de-posits refer to deposits received in German marks or US dollars, and starting from January 2002, they refer to deposits received in euros and US dollars, while the weighted averages are calcu-lated based on their kuna equivalent using the current exchange rate. Deposits received in other currencies are not included in this table.
The basis for the calculation of the weighted averages for kuna time deposits indexed to f/c and foreign currency time deposits are the amounts of those deposits received during the report ing month. The basis for the calculation of the weighted averages for savings deposits indexed to f/c are the end-of-month book balances of those deposits. From January 2002 on, the averages of interest rates on total kuna deposits indexed to f/c (column 3) are weighted by the end-of-month balances of all categories included in the calculation.
The average interest rate on total foreign currency deposits (column 6) refers to the weighted average of monthly interest
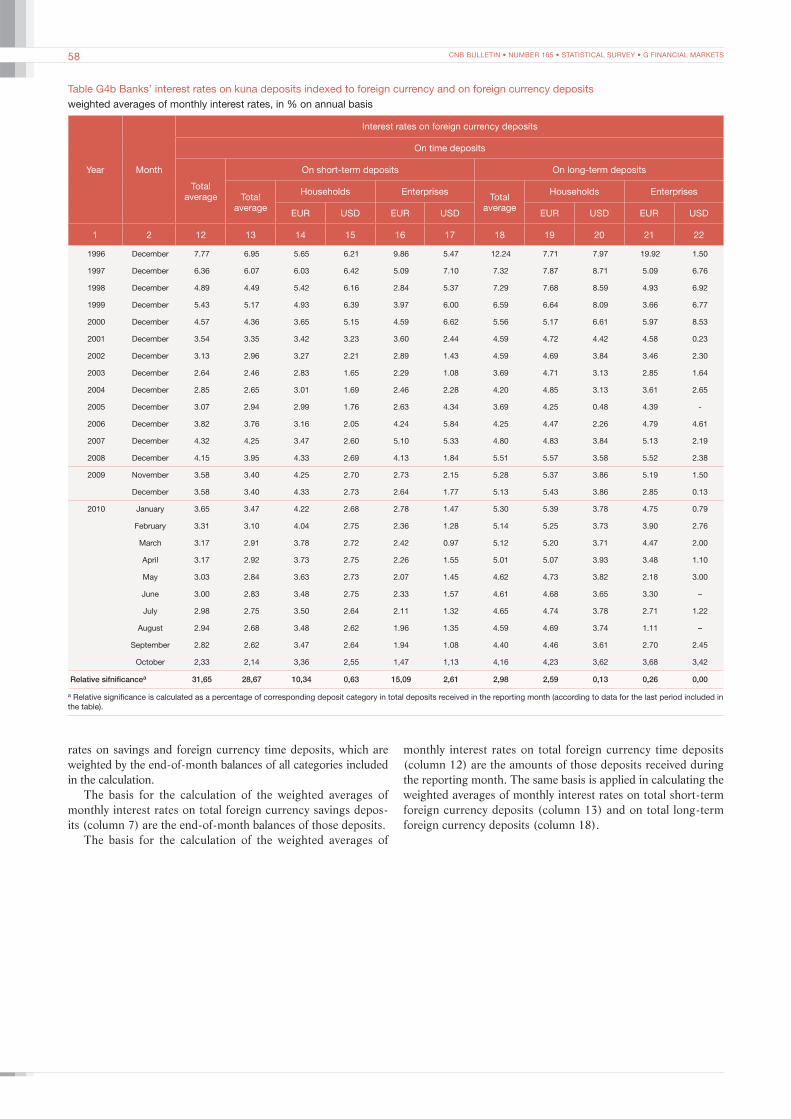
CNB BULLETIN • NUMBER 165 • STATISTICAL SURVEY • G FINANCIAL MARKETS58
Table G4b Banks’ interest rates on kuna deposits indexed to foreign currency and on foreign currency depositsweighted averages of monthly interest rates, in % on annual basis
Year Month
Interest rates on foreign currency deposits
On time deposits
Total average
On short-term deposits On long-term deposits
Total average
Households EnterprisesTotal
average
Households Enterprises
EUR USD EUR USD EUR USD EUR USD
1 2 12 13 14 15 16 17 18 19 20 21 22
1996 December 7.77 6.95 5.65 6.21 9.86 5.47 12.24 7.71 7.97 19.92 1.50
1997 December 6.36 6.07 6.03 6.42 5.09 7.10 7.32 7.87 8.71 5.09 6.76
1998 December 4.89 4.49 5.42 6.16 2.84 5.37 7.29 7.68 8.59 4.93 6.92
1999 December 5.43 5.17 4.93 6.39 3.97 6.00 6.59 6.64 8.09 3.66 6.77
2000 December 4.57 4.36 3.65 5.15 4.59 6.62 5.56 5.17 6.61 5.97 8.53
2001 December 3.54 3.35 3.42 3.23 3.60 2.44 4.59 4.72 4.42 4.58 0.23
2002 December 3.13 2.96 3.27 2.21 2.89 1.43 4.59 4.69 3.84 3.46 2.30
2003 December 2.64 2.46 2.83 1.65 2.29 1.08 3.69 4.71 3.13 2.85 1.64
2004 December 2.85 2.65 3.01 1.69 2.46 2.28 4.20 4.85 3.13 3.61 2.65
2005 December 3.07 2.94 2.99 1.76 2.63 4.34 3.69 4.25 0.48 4.39 -
2006 December 3.82 3.76 3.16 2.05 4.24 5.84 4.25 4.47 2.26 4.79 4.61
2007 December 4.32 4.25 3.47 2.60 5.10 5.33 4.80 4.83 3.84 5.13 2.19
2008 December 4.15 3.95 4.33 2.69 4.13 1.84 5.51 5.57 3.58 5.52 2.38
2009 November 3.58 3.40 4.25 2.70 2.73 2.15 5.28 5.37 3.86 5.19 1.50
December 3.58 3.40 4.33 2.73 2.64 1.77 5.13 5.43 3.86 2.85 0.13
2010 January 3.65 3.47 4.22 2.68 2.78 1.47 5.30 5.39 3.78 4.75 0.79
February 3.31 3.10 4.04 2.75 2.36 1.28 5.14 5.25 3.73 3.90 2.76
March 3.17 2.91 3.78 2.72 2.42 0.97 5.12 5.20 3.71 4.47 2.00
April 3.17 2.92 3.73 2.75 2.26 1.55 5.01 5.07 3.93 3.48 1.10
May 3.03 2.84 3.63 2.73 2.07 1.45 4.62 4.73 3.82 2.18 3.00
June 3.00 2.83 3.48 2.75 2.33 1.57 4.61 4.68 3.65 3.30 –
July 2.98 2.75 3.50 2.64 2.11 1.32 4.65 4.74 3.78 2.71 1.22
August 2.94 2.68 3.48 2.62 1.96 1.35 4.59 4.69 3.74 1.11 –
September 2.82 2.62 3.47 2.64 1.94 1.08 4.40 4.46 3.61 2.70 2.45
October 2,33 2,14 3,36 2,55 1,47 1,13 4,16 4,23 3,62 3,68 3,42
Relative sifnificancea 31,65 28,67 10,34 0,63 15,09 2,61 2,98 2,59 0,13 0,26 0,00
a Relative significance is calculated as a percentage of corresponding deposit category in total deposits received in the reporting month (according to data for the last period included in the table).
rates on savings and foreign currency time deposits, which are weighted by the end-of-month balances of all categories included in the calculation.
The basis for the calculation of the weighted averages of monthly interest rates on total foreign currency savings depos-its (column 7) are the end-of-month balances of those deposits.
The basis for the calculation of the weighted averages of
monthly interest rates on total foreign currency time deposits (column 12) are the amounts of those deposits received during the reporting month. The same basis is applied in calculating the weighted averages of monthly interest rates on total short-term foreign currency deposits (column 13) and on total long-term foreign currency deposits (column 18).
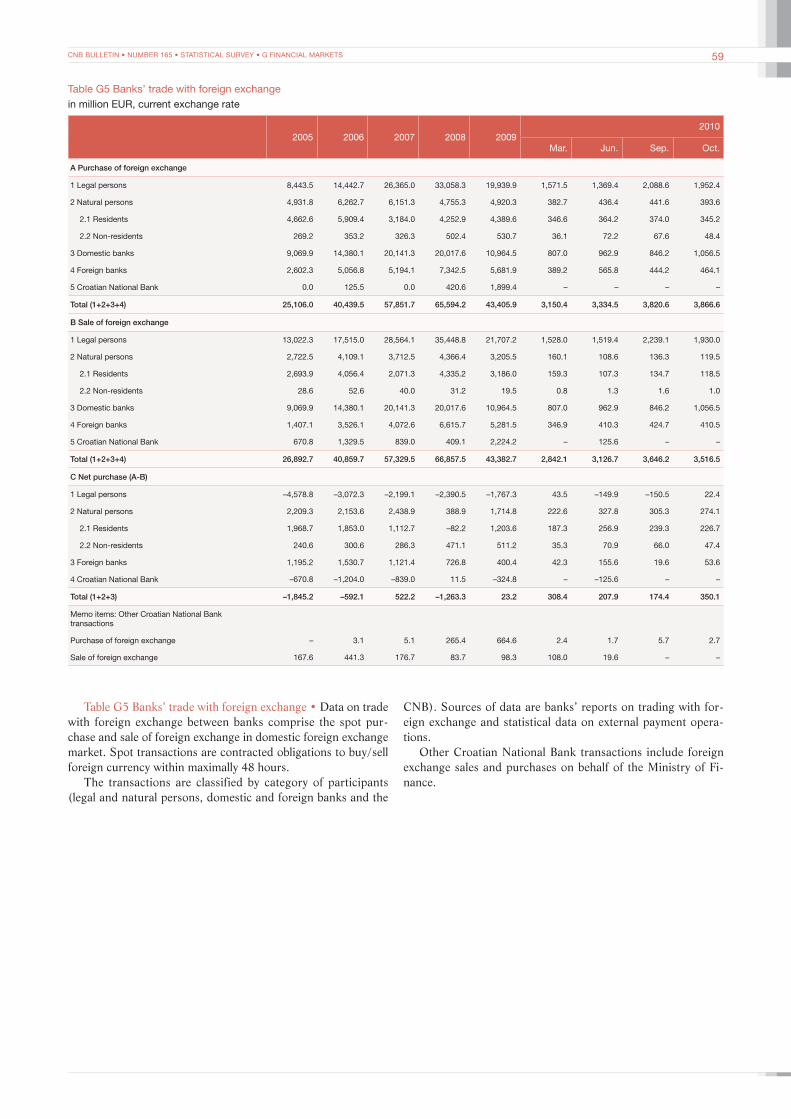
CNB BULLETIN • NUMBER 165 • STATISTICAL SURVEY • G FINANCIAL MARKETS 59
Table G5 Banks’ trade with foreign exchangein million EUR, current exchange rate
2005 2006 2007 2008 20092010
Mar. Jun. Sep. Oct.
A Purchase of foreign exchange
1 Legal persons 8,443.5 14,442.7 26,365.0 33,058.3 19,939.9 1,571.5 1,369.4 2,088.6 1,952.4
2 Natural persons 4,931.8 6,262.7 6,151.3 4,755.3 4,920.3 382.7 436.4 441.6 393.6
2.1 Residents 4,662.6 5,909.4 3,184.0 4,252.9 4,389.6 346.6 364.2 374.0 345.2
2.2 Non-residents 269.2 353.2 326.3 502.4 530.7 36.1 72.2 67.6 48.4
3 Domestic banks 9,069.9 14,380.1 20,141.3 20,017.6 10,964.5 807.0 962.9 846.2 1,056.5
4 Foreign banks 2,602.3 5,056.8 5,194.1 7,342.5 5,681.9 389.2 565.8 444.2 464.1
5 Croatian National Bank 0.0 125.5 0.0 420.6 1,899.4 – – – –
Total (1+2+3+4) 25,106.0 40,439.5 57,851.7 65,594.2 43,405.9 3,150.4 3,334.5 3,820.6 3,866.6
B Sale of foreign exchange
1 Legal persons 13,022.3 17,515.0 28,564.1 35,448.8 21,707.2 1,528.0 1,519.4 2,239.1 1,930.0
2 Natural persons 2,722.5 4,109.1 3,712.5 4,366.4 3,205.5 160.1 108.6 136.3 119.5
2.1 Residents 2,693.9 4,056.4 2,071.3 4,335.2 3,186.0 159.3 107.3 134.7 118.5
2.2 Non-residents 28.6 52.6 40.0 31.2 19.5 0.8 1.3 1.6 1.0
3 Domestic banks 9,069.9 14,380.1 20,141.3 20,017.6 10,964.5 807.0 962.9 846.2 1,056.5
4 Foreign banks 1,407.1 3,526.1 4,072.6 6,615.7 5,281.5 346.9 410.3 424.7 410.5
5 Croatian National Bank 670.8 1,329.5 839.0 409.1 2,224.2 – 125.6 – –
Total (1+2+3+4) 26,892.7 40,859.7 57,329.5 66,857.5 43,382.7 2,842.1 3,126.7 3,646.2 3,516.5
C Net purchase (A-B)
1 Legal persons –4,578.8 –3,072.3 –2,199.1 –2,390.5 –1,767.3 43.5 –149.9 –150.5 22.4
2 Natural persons 2,209.3 2,153.6 2,438.9 388.9 1,714.8 222.6 327.8 305.3 274.1
2.1 Residents 1,968.7 1,853.0 1,112.7 –82.2 1,203.6 187.3 256.9 239.3 226.7
2.2 Non-residents 240.6 300.6 286.3 471.1 511.2 35.3 70.9 66.0 47.4
3 Foreign banks 1,195.2 1,530.7 1,121.4 726.8 400.4 42.3 155.6 19.6 53.6
4 Croatian National Bank –670.8 –1,204.0 –839.0 11.5 –324.8 – –125.6 – –
Total (1+2+3) –1,845.2 –592.1 522.2 –1,263.3 23.2 308.4 207.9 174.4 350.1
Memo items: Other Croatian National Bank transactions
Purchase of foreign exchange – 3.1 5.1 265.4 664.6 2.4 1.7 5.7 2.7
Sale of foreign exchange 167.6 441.3 176.7 83.7 98.3 108.0 19.6 – –
Table G5 Banks’ trade with foreign exchange • Data on trade with foreign exchange between banks comprise the spot pur-chase and sale of foreign exchange in domestic foreign exchange market. Spot transactions are contracted obligations to buy/sell foreign currency within maximally 48 hours.
The transactions are classified by category of participants (legal and natural persons, domestic and foreign banks and the
CNB). Sources of data are banks’ reports on trading with for-eign exchange and statistical data on external payment opera-tions.
Other Croatian National Bank transactions include foreign exchange sales and purchases on behalf of the Ministry of Fi-nance.
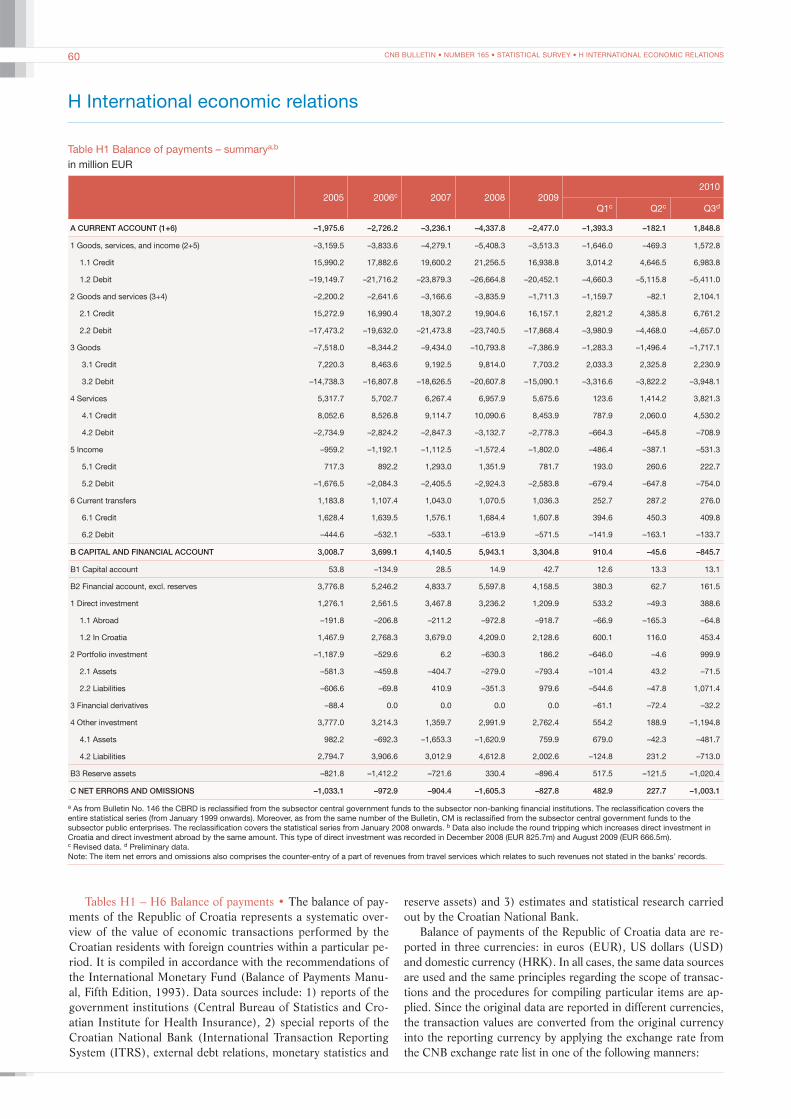
CNB BULLETIN • NUMBER 165 • STATISTICAL SURVEY • H INTERNATIONAL ECONOMIC RELATIONS60
H International economic relations
Table H1 Balance of payments – summarya,b
in million EUR
2005 2006c 2007 2008 20092010
Q1c Q2c Q3d
A CURRENT ACCOUNT (1+6) –1,975.6 –2,726.2 –3,236.1 –4,337.8 –2,477.0 –1,393.3 –182.1 1,848.8
1 Goods, services, and income (2+5) –3,159.5 –3,833.6 –4,279.1 –5,408.3 –3,513.3 –1,646.0 –469.3 1,572.8
1.1 Credit 15,990.2 17,882.6 19,600.2 21,256.5 16,938.8 3,014.2 4,646.5 6,983.8
1.2 Debit –19,149.7 –21,716.2 –23,879.3 –26,664.8 –20,452.1 –4,660.3 –5,115.8 –5,411.0
2 Goods and services (3+4) –2,200.2 –2,641.6 –3,166.6 –3,835.9 –1,711.3 –1,159.7 –82.1 2,104.1
2.1 Credit 15,272.9 16,990.4 18,307.2 19,904.6 16,157.1 2,821.2 4,385.8 6,761.2
2.2 Debit –17,473.2 –19,632.0 –21,473.8 –23,740.5 –17,868.4 –3,980.9 –4,468.0 –4,657.0
3 Goods –7,518.0 –8,344.2 –9,434.0 –10,793.8 –7,386.9 –1,283.3 –1,496.4 –1,717.1
3.1 Credit 7,220.3 8,463.6 9,192.5 9,814.0 7,703.2 2,033.3 2,325.8 2,230.9
3.2 Debit –14,738.3 –16,807.8 –18,626.5 –20,607.8 –15,090.1 –3,316.6 –3,822.2 –3,948.1
4 Services 5,317.7 5,702.7 6,267.4 6,957.9 5,675.6 123.6 1,414.2 3,821.3
4.1 Credit 8,052.6 8,526.8 9,114.7 10,090.6 8,453.9 787.9 2,060.0 4,530.2
4.2 Debit –2,734.9 –2,824.2 –2,847.3 –3,132.7 –2,778.3 –664.3 –645.8 –708.9
5 Income –959.2 –1,192.1 –1,112.5 –1,572.4 –1,802.0 –486.4 –387.1 –531.3
5.1 Credit 717.3 892.2 1,293.0 1,351.9 781.7 193.0 260.6 222.7
5.2 Debit –1,676.5 –2,084.3 –2,405.5 –2,924.3 –2,583.8 –679.4 –647.8 –754.0
6 Current transfers 1,183.8 1,107.4 1,043.0 1,070.5 1,036.3 252.7 287.2 276.0
6.1 Credit 1,628.4 1,639.5 1,576.1 1,684.4 1,607.8 394.6 450.3 409.8
6.2 Debit –444.6 –532.1 –533.1 –613.9 –571.5 –141.9 –163.1 –133.7
B CAPITAL AND FINANCIAL ACCOUNT 3,008.7 3,699.1 4,140.5 5,943.1 3,304.8 910.4 –45.6 –845.7
B1 Capital account 53.8 –134.9 28.5 14.9 42.7 12.6 13.3 13.1
B2 Financial account, excl. reserves 3,776.8 5,246.2 4,833.7 5,597.8 4,158.5 380.3 62.7 161.5
1 Direct investment 1,276.1 2,561.5 3,467.8 3,236.2 1,209.9 533.2 –49.3 388.6
1.1 Abroad –191.8 –206.8 –211.2 –972.8 –918.7 –66.9 –165.3 –64.8
1.2 In Croatia 1,467.9 2,768.3 3,679.0 4,209.0 2,128.6 600.1 116.0 453.4
2 Portfolio investment –1,187.9 –529.6 6.2 –630.3 186.2 –646.0 –4.6 999.9
2.1 Assets –581.3 –459.8 –404.7 –279.0 –793.4 –101.4 43.2 –71.5
2.2 Liabilities –606.6 –69.8 410.9 –351.3 979.6 –544.6 –47.8 1,071.4
3 Financial derivatives –88.4 0.0 0.0 0.0 0.0 –61.1 –72.4 –32.2
4 Other investment 3,777.0 3,214.3 1,359.7 2,991.9 2,762.4 554.2 188.9 –1,194.8
4.1 Assets 982.2 –692.3 –1,653.3 –1,620.9 759.9 679.0 –42.3 –481.7
4.2 Liabilities 2,794.7 3,906.6 3,012.9 4,612.8 2,002.6 –124.8 231.2 –713.0
B3 Reserve assets –821.8 –1,412.2 –721.6 330.4 –896.4 517.5 –121.5 –1,020.4
C NET ERRORS AND OMISSIONS –1,033.1 –972.9 –904.4 –1,605.3 –827.8 482.9 227.7 –1,003.1
a As from Bulletin No. 146 the CBRD is reclassified from the subsector central government funds to the subsector non-banking financial institutions. The reclassification covers the entire statistical series (from January 1999 onwards). Moreover, as from the same number of the Bulletin, CM is reclassified from the subsector central government funds to the subsector public enterprises. The reclassification covers the statistical series from January 2008 onwards. b Data also include the round tripping which increases direct investment in Croatia and direct investment abroad by the same amount. This type of direct investment was recorded in December 2008 (EUR 825.7m) and August 2009 (EUR 666.5m). c Revised data. d Preliminary data.Note: The item net errors and omissions also comprises the counter-entry of a part of revenues from travel services which relates to such revenues not stated in the banks’ records.
Tables H1 – H6 Balance of payments • The balance of pay-ments of the Republic of Croatia represents a systematic over-view of the value of economic transactions performed by the Croatian residents with foreign countries within a particular pe-riod. It is compiled in accordance with the recommendations of the International Monetary Fund (Balance of Payments Manu-al, Fifth Edition, 1993). Data sources include: 1) reports of the government institutions (Central Bureau of Statistics and Cro-atian Institute for Health Insurance), 2) special reports of the Croatian National Bank (International Transaction Reporting System (ITRS), external debt relations, monetary statistics and
reserve assets) and 3) estimates and statistical research carried out by the Croatian National Bank.
Balance of payments of the Republic of Croatia data are re-ported in three currencies: in euros (EUR), US dollars (USD) and domestic currency (HRK). In all cases, the same data sources are used and the same principles regarding the scope of transac-tions and the procedures for compiling particular items are ap-plied. Since the original data are reported in different currencies, the transaction values are converted from the original currency into the reporting currency by applying the exchange rate from the CNB exchange rate list in one of the following manners:
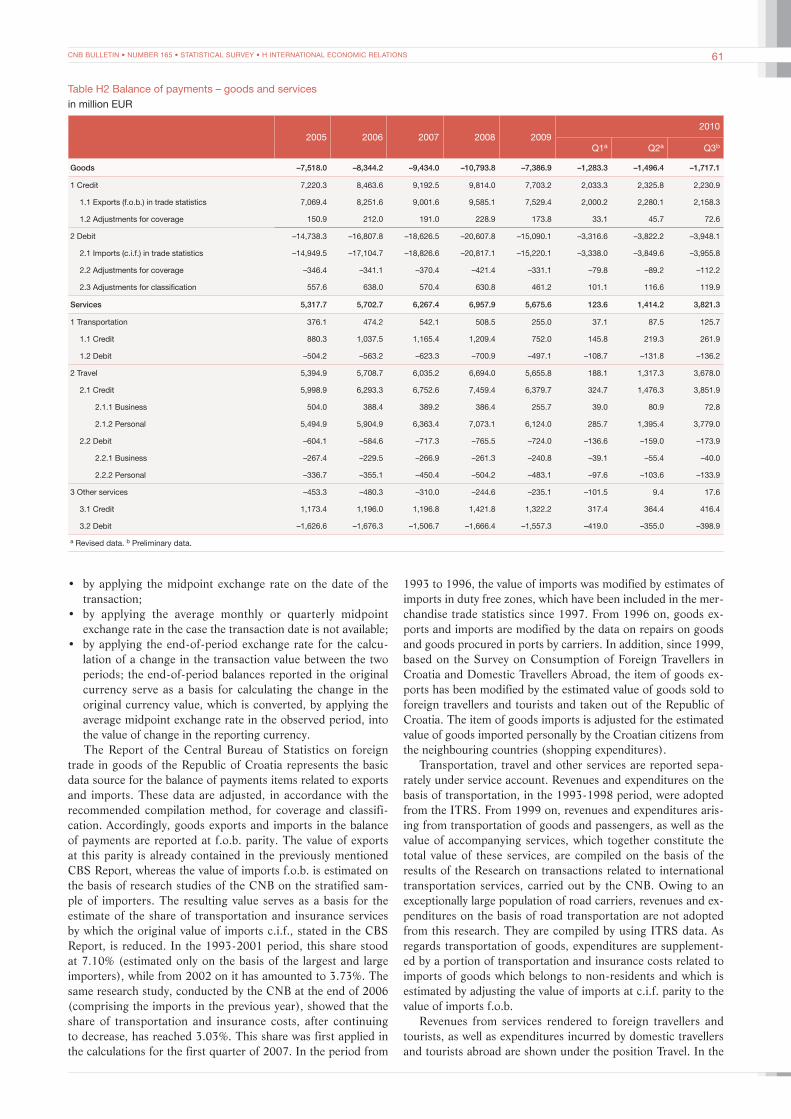
CNB BULLETIN • NUMBER 165 • STATISTICAL SURVEY • H INTERNATIONAL ECONOMIC RELATIONS 61
Table H2 Balance of payments – goods and servicesin million EUR
2005 2006 2007 2008 20092010
Q1a Q2a Q3b
Goods –7,518.0 –8,344.2 –9,434.0 –10,793.8 –7,386.9 –1,283.3 –1,496.4 –1,717.1
1 Credit 7,220.3 8,463.6 9,192.5 9,814.0 7,703.2 2,033.3 2,325.8 2,230.9
1.1 Exports (f.o.b.) in trade statistics 7,069.4 8,251.6 9,001.6 9,585.1 7,529.4 2,000.2 2,280.1 2,158.3
1.2 Adjustments for coverage 150.9 212.0 191.0 228.9 173.8 33.1 45.7 72.6
2 Debit –14,738.3 –16,807.8 –18,626.5 –20,607.8 –15,090.1 –3,316.6 –3,822.2 –3,948.1
2.1 Imports (c.i.f.) in trade statistics –14,949.5 –17,104.7 –18,826.6 –20,817.1 –15,220.1 –3,338.0 –3,849.6 –3,955.8
2.2 Adjustments for coverage –346.4 –341.1 –370.4 –421.4 –331.1 –79.8 –89.2 –112.2
2.3 Adjustments for classification 557.6 638.0 570.4 630.8 461.2 101.1 116.6 119.9
Services 5,317.7 5,702.7 6,267.4 6,957.9 5,675.6 123.6 1,414.2 3,821.3
1 Transportation 376.1 474.2 542.1 508.5 255.0 37.1 87.5 125.7
1.1 Credit 880.3 1,037.5 1,165.4 1,209.4 752.0 145.8 219.3 261.9
1.2 Debit –504.2 –563.2 –623.3 –700.9 –497.1 –108.7 –131.8 –136.2
2 Travel 5,394.9 5,708.7 6,035.2 6,694.0 5,655.8 188.1 1,317.3 3,678.0
2.1 Credit 5,998.9 6,293.3 6,752.6 7,459.4 6,379.7 324.7 1,476.3 3,851.9
2.1.1 Business 504.0 388.4 389.2 386.4 255.7 39.0 80.9 72.8
2.1.2 Personal 5,494.9 5,904.9 6,363.4 7,073.1 6,124.0 285.7 1,395.4 3,779.0
2.2 Debit –604.1 –584.6 –717.3 –765.5 –724.0 –136.6 –159.0 –173.9
2.2.1 Business –267.4 –229.5 –266.9 –261.3 –240.8 –39.1 –55.4 –40.0
2.2.2 Personal –336.7 –355.1 –450.4 –504.2 –483.1 –97.6 –103.6 –133.9
3 Other services –453.3 –480.3 –310.0 –244.6 –235.1 –101.5 9.4 17.6
3.1 Credit 1,173.4 1,196.0 1,196.8 1,421.8 1,322.2 317.4 364.4 416.4
3.2 Debit –1,626.6 –1,676.3 –1,506.7 –1,666.4 –1,557.3 –419.0 –355.0 –398.9
a Revised data. b Preliminary data.
• by applying the midpoint exchange rate on the date of the transaction;
• by applying the average monthly or quarterly midpoint exchange rate in the case the transaction date is not available;
• by applying the end-of-period exchange rate for the calcu-lation of a change in the transaction value between the two periods; the end-of-period balances reported in the original currency serve as a basis for calculating the change in the original currency value, which is converted, by applying the average midpoint exchange rate in the observed period, into the value of change in the reporting currency.The Report of the Central Bureau of Statistics on foreign
trade in goods of the Republic of Croatia represents the basic data source for the balance of payments items related to exports and imports. These data are adjusted, in accordance with the recommended compilation method, for coverage and classifi-cation. Accordingly, goods exports and imports in the balance of payments are reported at f.o.b. parity. The value of exports at this parity is already contained in the previously mentioned CBS Report, whereas the value of imports f.o.b. is estimated on the basis of research studies of the CNB on the stratified sam-ple of importers. The resulting value serves as a basis for the estimate of the share of transportation and insurance services by which the original value of imports c.i.f., stated in the CBS Report, is reduced. In the 1993-2001 period, this share stood at 7.10% (estimated only on the basis of the largest and large importers), while from 2002 on it has amounted to 3.73%. The same research study, conducted by the CNB at the end of 2006 (comprising the imports in the previous year), showed that the share of transportation and insurance costs, after continuing to decrease, has reached 3.03%. This share was first applied in the calculations for the first quarter of 2007. In the period from
1993 to 1996, the value of imports was modified by estimates of imports in duty free zones, which have been included in the mer-chandise trade statistics since 1997. From 1996 on, goods ex-ports and imports are modified by the data on repairs on goods and goods procured in ports by carriers. In addition, since 1999, based on the Survey on Consumption of Foreign Travellers in Croatia and Domestic Travellers Abroad, the item of goods ex-ports has been modified by the estimated value of goods sold to foreign travellers and tourists and taken out of the Republic of Croatia. The item of goods imports is adjusted for the estimated value of goods imported personally by the Croatian citizens from the neighbouring countries (shopping expenditures).
Transportation, travel and other services are reported sepa-rately under service account. Revenues and expenditures on the basis of transportation, in the 1993-1998 period, were adopted from the ITRS. From 1999 on, revenues and expenditures aris-ing from transportation of goods and passengers, as well as the value of accompanying services, which together constitute the total value of these services, are compiled on the basis of the results of the Research on transactions related to international transportation services, carried out by the CNB. Owing to an exceptionally large population of road carriers, revenues and ex-penditures on the basis of road transportation are not adopted from this research. They are compiled by using ITRS data. As regards transportation of goods, expenditures are supplement-ed by a portion of transportation and insurance costs related to imports of goods which belongs to non-residents and which is estimated by adjusting the value of imports at c.i.f. parity to the value of imports f.o.b.
Revenues from services rendered to foreign travellers and tourists, as well as expenditures incurred by domestic travellers and tourists abroad are shown under the position Travel. In the
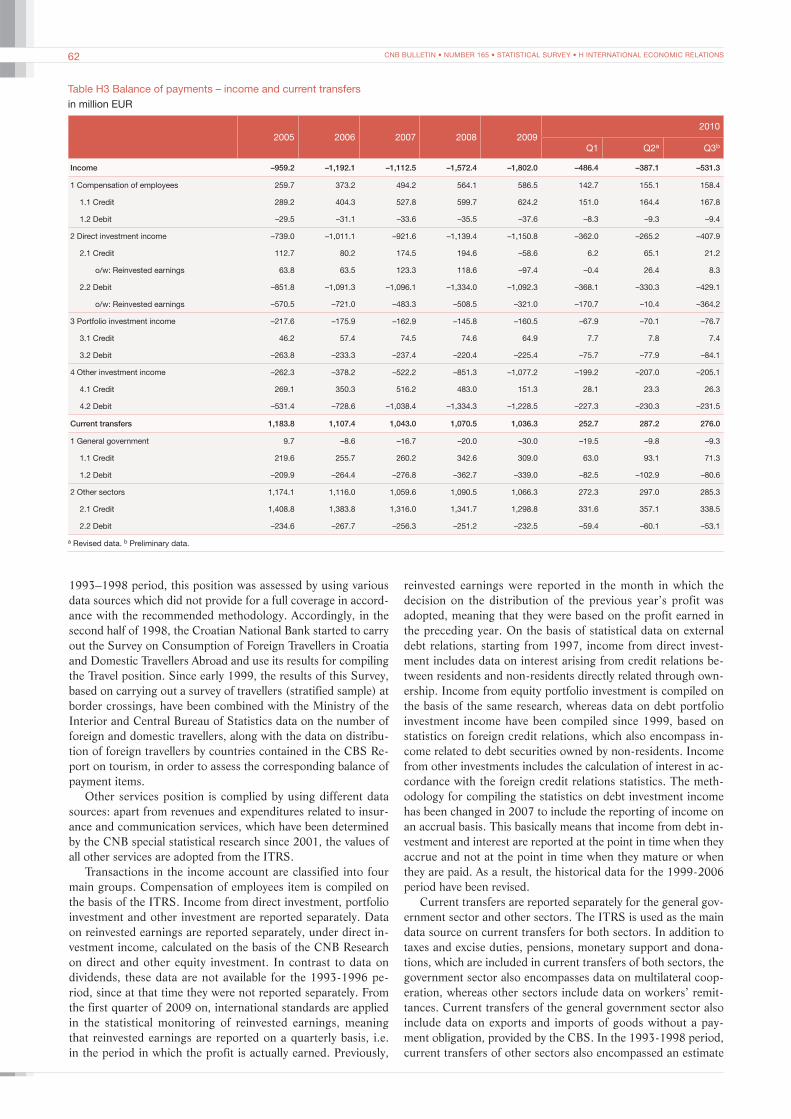
CNB BULLETIN • NUMBER 165 • STATISTICAL SURVEY • H INTERNATIONAL ECONOMIC RELATIONS62
Table H3 Balance of payments – income and current transfersin million EUR
2005 2006 2007 2008 20092010
Q1 Q2a Q3b
Income –959.2 –1,192.1 –1,112.5 –1,572.4 –1,802.0 –486.4 –387.1 –531.3
1 Compensation of employees 259.7 373.2 494.2 564.1 586.5 142.7 155.1 158.4
1.1 Credit 289.2 404.3 527.8 599.7 624.2 151.0 164.4 167.8
1.2 Debit –29.5 –31.1 –33.6 –35.5 –37.6 –8.3 –9.3 –9.4
2 Direct investment income –739.0 –1,011.1 –921.6 –1,139.4 –1,150.8 –362.0 –265.2 –407.9
2.1 Credit 112.7 80.2 174.5 194.6 –58.6 6.2 65.1 21.2
o/w: Reinvested earnings 63.8 63.5 123.3 118.6 –97.4 –0.4 26.4 8.3
2.2 Debit –851.8 –1,091.3 –1,096.1 –1,334.0 –1,092.3 –368.1 –330.3 –429.1
o/w: Reinvested earnings –570.5 –721.0 –483.3 –508.5 –321.0 –170.7 –10.4 –364.2
3 Portfolio investment income –217.6 –175.9 –162.9 –145.8 –160.5 –67.9 –70.1 –76.7
3.1 Credit 46.2 57.4 74.5 74.6 64.9 7.7 7.8 7.4
3.2 Debit –263.8 –233.3 –237.4 –220.4 –225.4 –75.7 –77.9 –84.1
4 Other investment income –262.3 –378.2 –522.2 –851.3 –1,077.2 –199.2 –207.0 –205.1
4.1 Credit 269.1 350.3 516.2 483.0 151.3 28.1 23.3 26.3
4.2 Debit –531.4 –728.6 –1,038.4 –1,334.3 –1,228.5 –227.3 –230.3 –231.5
Current transfers 1,183.8 1,107.4 1,043.0 1,070.5 1,036.3 252.7 287.2 276.0
1 General government 9.7 –8.6 –16.7 –20.0 –30.0 –19.5 –9.8 –9.3
1.1 Credit 219.6 255.7 260.2 342.6 309.0 63.0 93.1 71.3
1.2 Debit –209.9 –264.4 –276.8 –362.7 –339.0 –82.5 –102.9 –80.6
2 Other sectors 1,174.1 1,116.0 1,059.6 1,090.5 1,066.3 272.3 297.0 285.3
2.1 Credit 1,408.8 1,383.8 1,316.0 1,341.7 1,298.8 331.6 357.1 338.5
2.2 Debit –234.6 –267.7 –256.3 –251.2 –232.5 –59.4 –60.1 –53.1
a Revised data. b Preliminary data.
1993–1998 period, this position was assessed by using various data sources which did not provide for a full coverage in accord-ance with the recommended methodology. Accordingly, in the second half of 1998, the Croatian National Bank started to carry out the Survey on Consumption of Foreign Travellers in Croatia and Domestic Travellers Abroad and use its results for compiling the Travel position. Since early 1999, the results of this Survey, based on carrying out a survey of travellers (stratified sample) at border crossings, have been combined with the Ministry of the Interior and Central Bureau of Statistics data on the number of foreign and domestic travellers, along with the data on distribu-tion of foreign travellers by countries contained in the CBS Re-port on tourism, in order to assess the corresponding balance of payment items.
Other services position is complied by using different data sources: apart from revenues and expenditures related to insur-ance and communication services, which have been determined by the CNB special statistical research since 2001, the values of all other services are adopted from the ITRS.
Transactions in the income account are classified into four main groups. Compensation of employees item is compiled on the basis of the ITRS. Income from direct investment, portfolio investment and other investment are reported separately. Data on reinvested earnings are reported separately, under direct in-vestment income, calculated on the basis of the CNB Research on direct and other equity investment. In contrast to data on dividends, these data are not available for the 1993-1996 pe-riod, since at that time they were not reported separately. From the first quarter of 2009 on, international standards are applied in the statistical monitoring of reinvested earnings, meaning that reinvested earnings are reported on a quarterly basis, i.e. in the period in which the profit is actually earned. Previously,
reinvested earnings were reported in the month in which the decision on the distribution of the previous year’s profit was adopted, meaning that they were based on the profit earned in the preceding year. On the basis of statistical data on external debt relations, starting from 1997, income from direct invest-ment includes data on interest arising from credit relations be-tween residents and non-residents directly related through own-ership. Income from equity portfolio investment is compiled on the basis of the same research, whereas data on debt portfolio investment income have been compiled since 1999, based on statistics on foreign credit relations, which also encompass in-come related to debt securities owned by non-residents. Income from other investments includes the calculation of interest in ac-cordance with the foreign credit relations statistics. The meth-odology for compiling the statistics on debt investment income has been changed in 2007 to include the reporting of income on an accrual basis. This basically means that income from debt in-vestment and interest are reported at the point in time when they accrue and not at the point in time when they mature or when they are paid. As a result, the historical data for the 1999-2006 period have been revised.
Current transfers are reported separately for the general gov-ernment sector and other sectors. The ITRS is used as the main data source on current transfers for both sectors. In addition to taxes and excise duties, pensions, monetary support and dona-tions, which are included in current transfers of both sectors, the government sector also encompasses data on multilateral coop-eration, whereas other sectors include data on workers’ remit-tances. Current transfers of the general government sector also include data on exports and imports of goods without a pay-ment obligation, provided by the CBS. In the 1993-1998 period, current transfers of other sectors also encompassed an estimate

CNB BULLETIN • NUMBER 165 • STATISTICAL SURVEY • H INTERNATIONAL ECONOMIC RELATIONS 63
Table H4 Balance of payments – direct and portfolio invstmentsa,b
in million EUR
2005 2006 2007 2008 20092010
Q1c Q2c Q3d
Direct investment 1,276.1 2,561.5 3,467.8 3,236.2 1,209.9 533.2 –49.3 388.6
1 Abroad –191.8 –206.8 –211.2 –972.8 –918.7 –66.9 –165.3 –64.8
1.1 Equity capital and reinvested earnings –121.0 –210.5 –265.3 –1,078.5 –912.5 –58.8 –139.6 –79.8
1.1.1 Claims –122.2 –210.5 –268.4 –1,078.5 –1,009.9 –59.3 –139.6 –79.8
1.1.2 Liabilities 1.3 0.0 3.1 0.0 97.4 0.4 0.0 0.0
1.2 Other capital –70.9 3.7 54.1 105.7 –6.2 –8.1 –25.8 15.0
1.1.1 Claims –59.8 –13.9 20.3 106.8 –42.5 –27.0 –28.0 9.4
1.2.2 Liabilities –11.1 17.6 33.9 –1.1 36.3 19.0 2.2 5.7
2 In Croatia 1,467.9 2,768.3 3,679.0 4,209.0 2,128.6 600.1 116.0 453.4
2.1 Equity capital and reinvested earnings 1,363.5 2,468.6 2,671.6 2,696.1 1,078.5 462.0 529.4 502.1
2.1.1 Claims 0.0 –0.1 0.0 –6.9 –96.6 0.0 0.0 0.0
2.1.2 Liabilities 1,363.5 2,468.7 2,671.6 2,702.9 1,175.1 462.0 529.4 502.1
2.2 Other capital 104.4 299.7 1,007.4 1,512.9 1,050.1 138.2 –413.4 –48.7
2.2.1 Claims 0.0 12.4 20.3 –26.4 –32.1 –16.4 –37.2 10.6
2.2.2 Liabilities 104.4 287.3 987.2 1,539.3 1,082.2 154.5 –376.1 –59.3
Portfolio investment –1,187.9 –529.6 6.2 –630.3 186.2 –646.0 –4.6 999.9
1 Assets –581.3 –459.8 –404.7 –279.0 –793.4 –101.4 43.2 –71.5
1.1 Equity securities –193.0 –320.5 –844.2 147.8 –107.0 –247.8 –137.0 5.1
1.1.1 General government 0.0 0.0 0.0 0.0 0.0 0.0 0.0 0.0
1.1.1 Banks 0.0 2.6 0.0 0.0 0.0 0.0 0.0 0.0
1.1.2 Other sectors –193.0 –323.1 –844.2 147.8 –107.0 –247.8 –137.0 5.1
1.2 Debt securities –388.2 –139.3 439.4 –426.8 –686.4 146.4 180.2 –76.5
1.2.1 Bonds –407.8 118.2 329.7 –326.0 –345.0 237.2 7.5 111.7
1.2.1.1 General government 0.0 0.0 0.0 0.0 0.0 0.0 0.0 0.0
1.2.1.2 Banks –371.4 161.9 267.8 –226.5 –52.5 228.2 –80.8 110.1
1.2.1.3 Other sectors –36.3 –43.7 61.9 –99.5 –292.5 9.0 88.2 1.6
1.2.2 Money market instruments 19.5 –257.4 109.7 –100.8 –341.4 –90.8 172.7 –188.3
1.2.2.1 General government 0.0 0.0 0.0 0.0 0.0 0.0 0.0 0.0
1.2.2.2 Banks 19.5 –257.4 109.7 –100.9 –341.4 –91.2 170.8 –189.9
1.2.2.3 Other sectors 0.0 0.0 0.0 0.1 0.0 0.4 1.9 1.6
2 Liabilities –606.6 –69.8 410.9 –351.3 979.6 –544.6 –47.8 1,071.4
2.1 Equity securities 89.2 325.7 315.9 –87.1 15.2 –7.2 –7.3 51.8
2.1.1 Banks –12.8 28.0 0.0 0.0 0.0 0.0 0.0 0.0
2.1.2 Other sectors 102.0 297.7 315.9 –87.1 15.2 –7.2 –7.3 51.8
2.2 Debt securities –695.8 –395.6 95.1 –264.2 964.4 –537.4 –40.5 1,019.6
2.2.1 Bonds –695.8 –395.6 95.1 –264.3 964.4 –537.4 –40.5 1,019.6
2.2.1.1 General government –705.9 –463.7 –276.4 –208.0 998.8 –528.4 –26.0 1,016.7
2.2.1.2 Banks 3.2 1.2 1.0 –1.6 –446.5 0.0 0.0 0.0
2.2.1.3 Other sectors 6.9 66.9 370.5 –54.7 412.1 –9.0 –14.5 2.9
2.2.2 Money market instruments 0.0 0.0 0.0 0.0 0.0 0.0 0.0 0.0
2.2.2.1 General government 0.0 0.0 0.0 0.0 0.0 0.0 0.0 0.0
2.2.2.2 Banks 0.0 0.0 0.0 0.0 0.0 0.0 0.0 0.0
2.2.2.3 Other sectors 0.0 0.0 0.0 0.0 0.0 0.0 0.0 0.0
a As from Bulletin No. 146 the CBRD is reclassified from the subsector central government funds to the subsector non-banking financial institutions. The reclassification covers the entire statistical series (from January 1999 onwards). Moreover, as from the same number of the Bulletin, CM is reclassified from the subsector central government funds to the subsector public enterprises. The reclassification covers the statistical series from January 2008 onwards. b Data also include the round tripping which increases direct investment in Croatia and direct investment abroad by the same amount. This type of direct investment was recorded in December 2008 (EUR 825.7m) and August 2009 (EUR 666.5m). c Revised data. d Preliminary data.
of unregistered foreign currency remittances, which accounted for 15% of the positive difference between unclassified inflows and outflows of the household sector. From 1993 to the second quarter of 1996, the CNB also assessed a portion of the outflow based on current transfers. From 2002 on, inflows and outflows based on current transfers of other sectors are supplemented by
the data of the CNB special statistical research on international transactions related to insurance services.
Capital account is compiled on the basis of the ITRS, partic-ularly on their part related to transfers of migrants. In addition, capital account includes transfers that cannot be classified into current transfers, such as allocation of gold of the former SFRY
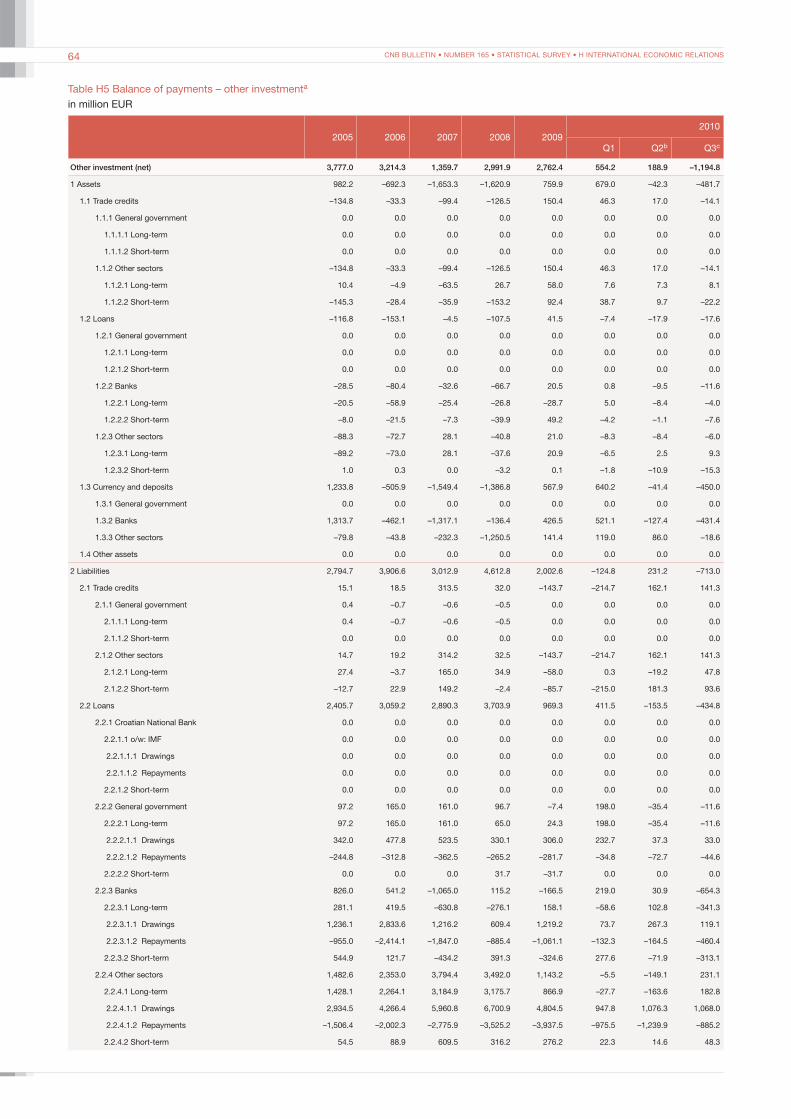
CNB BULLETIN • NUMBER 165 • STATISTICAL SURVEY • H INTERNATIONAL ECONOMIC RELATIONS64
Table H5 Balance of payments – other investmenta
in million EUR
2005 2006 2007 2008 20092010
Q1 Q2b Q3c
Other investment (net) 3,777.0 3,214.3 1,359.7 2,991.9 2,762.4 554.2 188.9 –1,194.8
1 Assets 982.2 –692.3 –1,653.3 –1,620.9 759.9 679.0 –42.3 –481.7
1.1 Trade credits –134.8 –33.3 –99.4 –126.5 150.4 46.3 17.0 –14.1
1.1.1 General government 0.0 0.0 0.0 0.0 0.0 0.0 0.0 0.0
1.1.1.1 Long-term 0.0 0.0 0.0 0.0 0.0 0.0 0.0 0.0
1.1.1.2 Short-term 0.0 0.0 0.0 0.0 0.0 0.0 0.0 0.0
1.1.2 Other sectors –134.8 –33.3 –99.4 –126.5 150.4 46.3 17.0 –14.1
1.1.2.1 Long-term 10.4 –4.9 –63.5 26.7 58.0 7.6 7.3 8.1
1.1.2.2 Short-term –145.3 –28.4 –35.9 –153.2 92.4 38.7 9.7 –22.2
1.2 Loans –116.8 –153.1 –4.5 –107.5 41.5 –7.4 –17.9 –17.6
1.2.1 General government 0.0 0.0 0.0 0.0 0.0 0.0 0.0 0.0
1.2.1.1 Long-term 0.0 0.0 0.0 0.0 0.0 0.0 0.0 0.0
1.2.1.2 Short-term 0.0 0.0 0.0 0.0 0.0 0.0 0.0 0.0
1.2.2 Banks –28.5 –80.4 –32.6 –66.7 20.5 0.8 –9.5 –11.6
1.2.2.1 Long-term –20.5 –58.9 –25.4 –26.8 –28.7 5.0 –8.4 –4.0
1.2.2.2 Short-term –8.0 –21.5 –7.3 –39.9 49.2 –4.2 –1.1 –7.6
1.2.3 Other sectors –88.3 –72.7 28.1 –40.8 21.0 –8.3 –8.4 –6.0
1.2.3.1 Long-term –89.2 –73.0 28.1 –37.6 20.9 –6.5 2.5 9.3
1.2.3.2 Short-term 1.0 0.3 0.0 –3.2 0.1 –1.8 –10.9 –15.3
1.3 Currency and deposits 1,233.8 –505.9 –1,549.4 –1,386.8 567.9 640.2 –41.4 –450.0
1.3.1 General government 0.0 0.0 0.0 0.0 0.0 0.0 0.0 0.0
1.3.2 Banks 1,313.7 –462.1 –1,317.1 –136.4 426.5 521.1 –127.4 –431.4
1.3.3 Other sectors –79.8 –43.8 –232.3 –1,250.5 141.4 119.0 86.0 –18.6
1.4 Other assets 0.0 0.0 0.0 0.0 0.0 0.0 0.0 0.0
2 Liabilities 2,794.7 3,906.6 3,012.9 4,612.8 2,002.6 –124.8 231.2 –713.0
2.1 Trade credits 15.1 18.5 313.5 32.0 –143.7 –214.7 162.1 141.3
2.1.1 General government 0.4 –0.7 –0.6 –0.5 0.0 0.0 0.0 0.0
2.1.1.1 Long-term 0.4 –0.7 –0.6 –0.5 0.0 0.0 0.0 0.0
2.1.1.2 Short-term 0.0 0.0 0.0 0.0 0.0 0.0 0.0 0.0
2.1.2 Other sectors 14.7 19.2 314.2 32.5 –143.7 –214.7 162.1 141.3
2.1.2.1 Long-term 27.4 –3.7 165.0 34.9 –58.0 0.3 –19.2 47.8
2.1.2.2 Short-term –12.7 22.9 149.2 –2.4 –85.7 –215.0 181.3 93.6
2.2 Loans 2,405.7 3,059.2 2,890.3 3,703.9 969.3 411.5 –153.5 –434.8
2.2.1 Croatian National Bank 0.0 0.0 0.0 0.0 0.0 0.0 0.0 0.0
2.2.1.1 o/w: IMF 0.0 0.0 0.0 0.0 0.0 0.0 0.0 0.0
2.2.1.1.1 Drawings 0.0 0.0 0.0 0.0 0.0 0.0 0.0 0.0
2.2.1.1.2 Repayments 0.0 0.0 0.0 0.0 0.0 0.0 0.0 0.0
2.2.1.2 Short-term 0.0 0.0 0.0 0.0 0.0 0.0 0.0 0.0
2.2.2 General government 97.2 165.0 161.0 96.7 –7.4 198.0 –35.4 –11.6
2.2.2.1 Long-term 97.2 165.0 161.0 65.0 24.3 198.0 –35.4 –11.6
2.2.2.1.1 Drawings 342.0 477.8 523.5 330.1 306.0 232.7 37.3 33.0
2.2.2.1.2 Repayments –244.8 –312.8 –362.5 –265.2 –281.7 –34.8 –72.7 –44.6
2.2.2.2 Short-term 0.0 0.0 0.0 31.7 –31.7 0.0 0.0 0.0
2.2.3 Banks 826.0 541.2 –1,065.0 115.2 –166.5 219.0 30.9 –654.3
2.2.3.1 Long-term 281.1 419.5 –630.8 –276.1 158.1 –58.6 102.8 –341.3
2.2.3.1.1 Drawings 1,236.1 2,833.6 1,216.2 609.4 1,219.2 73.7 267.3 119.1
2.2.3.1.2 Repayments –955.0 –2,414.1 –1,847.0 –885.4 –1,061.1 –132.3 –164.5 –460.4
2.2.3.2 Short-term 544.9 121.7 –434.2 391.3 –324.6 277.6 –71.9 –313.1
2.2.4 Other sectors 1,482.6 2,353.0 3,794.4 3,492.0 1,143.2 –5.5 –149.1 231.1
2.2.4.1 Long-term 1,428.1 2,264.1 3,184.9 3,175.7 866.9 –27.7 –163.6 182.8
2.2.4.1.1 Drawings 2,934.5 4,266.4 5,960.8 6,700.9 4,804.5 947.8 1,076.3 1,068.0
2.2.4.1.2 Repayments –1,506.4 –2,002.3 –2,775.9 –3,525.2 –3,937.5 –975.5 –1,239.9 –885.2
2.2.4.2 Short-term 54.5 88.9 609.5 316.2 276.2 22.3 14.6 48.3
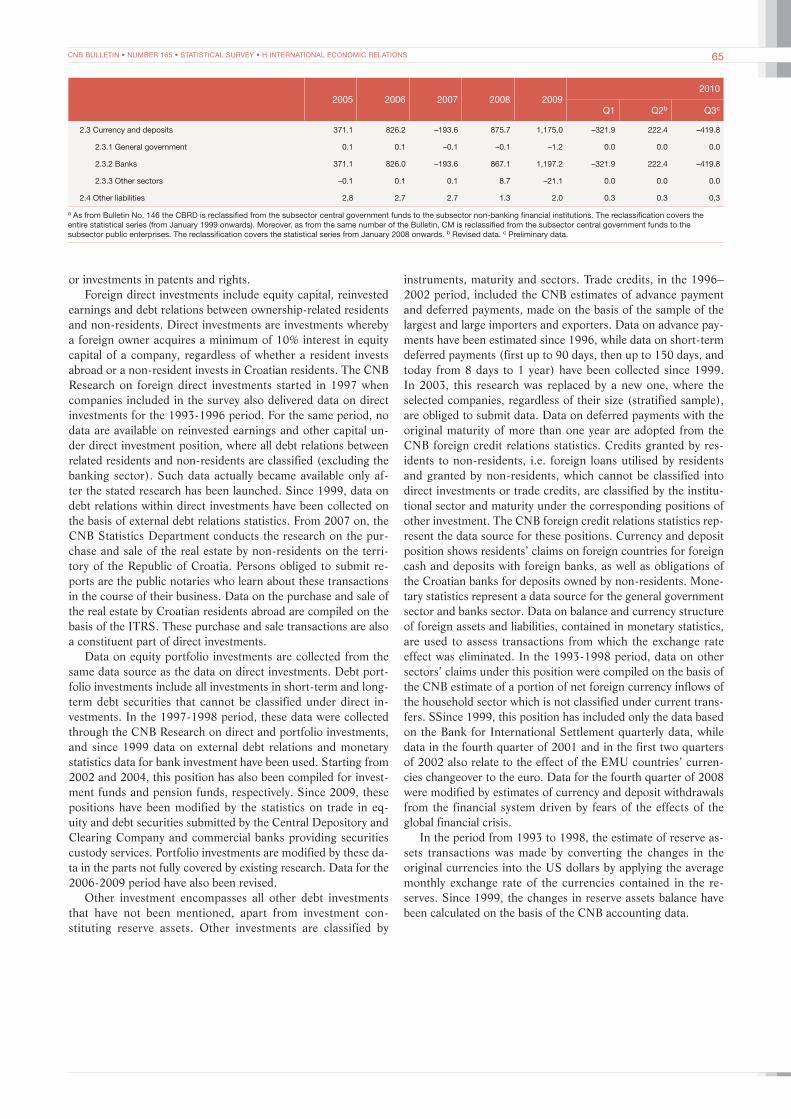
CNB BULLETIN • NUMBER 165 • STATISTICAL SURVEY • H INTERNATIONAL ECONOMIC RELATIONS 65
2005 2006 2007 2008 20092010
Q1 Q2b Q3c
2.3 Currency and deposits 371.1 826.2 –193.6 875.7 1,175.0 –321.9 222.4 –419.8
2.3.1 General government 0.1 0.1 –0.1 –0.1 –1.2 0.0 0.0 0.0
2.3.2 Banks 371.1 826.0 –193.6 867.1 1,197.2 –321.9 222.4 –419.8
2.3.3 Other sectors –0.1 0.1 0.1 8.7 –21.1 0.0 0.0 0.0
2.4 Other liabilities 2.8 2.7 2.7 1.3 2.0 0.3 0.3 0.3
a As from Bulletin No. 146 the CBRD is reclassified from the subsector central government funds to the subsector non-banking financial institutions. The reclassification covers the entire statistical series (from January 1999 onwards). Moreover, as from the same number of the Bulletin, CM is reclassified from the subsector central government funds to the subsector public enterprises. The reclassification covers the statistical series from January 2008 onwards. b Revised data. c Preliminary data.
or investments in patents and rights.Foreign direct investments include equity capital, reinvested
earnings and debt relations between ownership-related residents and non-residents. Direct investments are investments whereby a foreign owner acquires a minimum of 10% interest in equity capital of a company, regardless of whether a resident invests abroad or a non-resident invests in Croatian residents. The CNB Research on foreign direct investments started in 1997 when companies included in the survey also delivered data on direct investments for the 1993-1996 period. For the same period, no data are available on reinvested earnings and other capital un-der direct investment position, where all debt relations between related residents and non-residents are classified (excluding the banking sector). Such data actually became available only af-ter the stated research has been launched. Since 1999, data on debt relations within direct investments have been collected on the basis of external debt relations statistics. From 2007 on, the CNB Statistics Department conducts the research on the pur-chase and sale of the real estate by non-residents on the terri-tory of the Republic of Croatia. Persons obliged to submit re-ports are the public notaries who learn about these transactions in the course of their business. Data on the purchase and sale of the real estate by Croatian residents abroad are compiled on the basis of the ITRS. These purchase and sale transactions are also a constituent part of direct investments.
Data on equity portfolio investments are collected from the same data source as the data on direct investments. Debt port-folio investments include all investments in short-term and long-term debt securities that cannot be classified under direct in-vestments. In the 1997-1998 period, these data were collected through the CNB Research on direct and portfolio investments, and since 1999 data on external debt relations and monetary statistics data for bank investment have been used. Starting from 2002 and 2004, this position has also been compiled for invest-ment funds and pension funds, respectively. Since 2009, these positions have been modified by the statistics on trade in eq-uity and debt securities submitted by the Central Depository and Clearing Company and commercial banks providing securities custody services. Portfolio investments are modified by these da-ta in the parts not fully covered by existing research. Data for the 2006-2009 period have also been revised.
Other investment encompasses all other debt investments that have not been mentioned, apart from investment con-stituting reserve assets. Other investments are classified by
instruments, maturity and sectors. Trade credits, in the 1996–2002 period, included the CNB estimates of advance payment and deferred payments, made on the basis of the sample of the largest and large importers and exporters. Data on advance pay-ments have been estimated since 1996, while data on short-term deferred payments (first up to 90 days, then up to 150 days, and today from 8 days to 1 year) have been collected since 1999. In 2003, this research was replaced by a new one, where the selected companies, regardless of their size (stratified sample), are obliged to submit data. Data on deferred payments with the original maturity of more than one year are adopted from the CNB foreign credit relations statistics. Credits granted by res-idents to non-residents, i.e. foreign loans utilised by residents and granted by non-residents, which cannot be classified into direct investments or trade credits, are classified by the institu-tional sector and maturity under the corresponding positions of other investment. The CNB foreign credit relations statistics rep-resent the data source for these positions. Currency and deposit position shows residents’ claims on foreign countries for foreign cash and deposits with foreign banks, as well as obligations of the Croatian banks for deposits owned by non-residents. Mone-tary statistics represent a data source for the general government sector and banks sector. Data on balance and currency structure of foreign assets and liabilities, contained in monetary statistics, are used to assess transactions from which the exchange rate effect was eliminated. In the 1993-1998 period, data on other sectors’ claims under this position were compiled on the basis of the CNB estimate of a portion of net foreign currency inflows of the household sector which is not classified under current trans-fers. SSince 1999, this position has included only the data based on the Bank for International Settlement quarterly data, while data in the fourth quarter of 2001 and in the first two quarters of 2002 also relate to the effect of the EMU countries’ curren-cies changeover to the euro. Data for the fourth quarter of 2008 were modified by estimates of currency and deposit withdrawals from the financial system driven by fears of the effects of the global financial crisis.
In the period from 1993 to 1998, the estimate of reserve as-sets transactions was made by converting the changes in the original currencies into the US dollars by applying the average monthly exchange rate of the currencies contained in the re-serves. Since 1999, the changes in reserve assets balance have been calculated on the basis of the CNB accounting data.
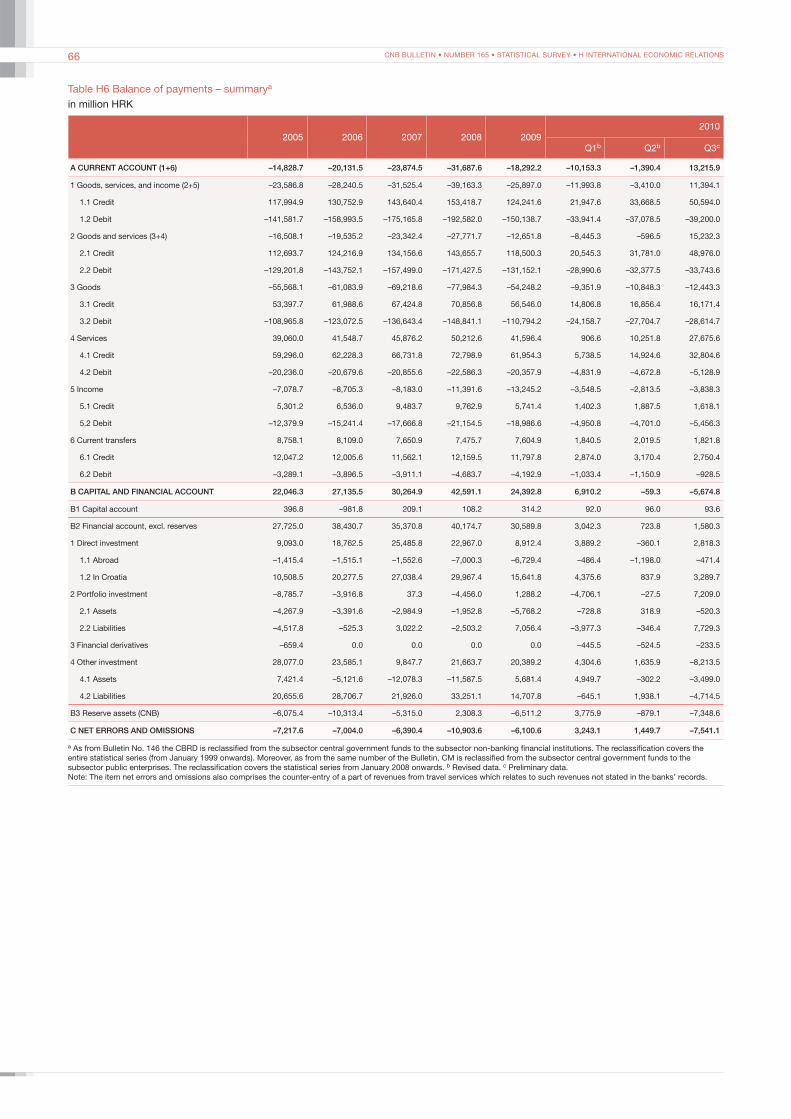
CNB BULLETIN • NUMBER 165 • STATISTICAL SURVEY • H INTERNATIONAL ECONOMIC RELATIONS66
Table H6 Balance of payments – summarya
in million HRK
2005 2006 2007 2008 20092010
Q1b Q2b Q3c
A CURRENT ACCOUNT (1+6) –14,828.7 –20,131.5 –23,874.5 –31,687.6 –18,292.2 –10,153.3 –1,390.4 13,215.9
1 Goods, services, and income (2+5) –23,586.8 –28,240.5 –31,525.4 –39,163.3 –25,897.0 –11,993.8 –3,410.0 11,394.1
1.1 Credit 117,994.9 130,752.9 143,640.4 153,418.7 124,241.6 21,947.6 33,668.5 50,594.0
1.2 Debit –141,581.7 –158,993.5 –175,165.8 –192,582.0 –150,138.7 –33,941.4 –37,078.5 –39,200.0
2 Goods and services (3+4) –16,508.1 –19,535.2 –23,342.4 –27,771.7 –12,651.8 –8,445.3 –596.5 15,232.3
2.1 Credit 112,693.7 124,216.9 134,156.6 143,655.7 118,500.3 20,545.3 31,781.0 48,976.0
2.2 Debit –129,201.8 –143,752.1 –157,499.0 –171,427.5 –131,152.1 –28,990.6 –32,377.5 –33,743.6
3 Goods –55,568.1 –61,083.9 –69,218.6 –77,984.3 –54,248.2 –9,351.9 –10,848.3 –12,443.3
3.1 Credit 53,397.7 61,988.6 67,424.8 70,856.8 56,546.0 14,806.8 16,856.4 16,171.4
3.2 Debit –108,965.8 –123,072.5 –136,643.4 –148,841.1 –110,794.2 –24,158.7 –27,704.7 –28,614.7
4 Services 39,060.0 41,548.7 45,876.2 50,212.6 41,596.4 906.6 10,251.8 27,675.6
4.1 Credit 59,296.0 62,228.3 66,731.8 72,798.9 61,954.3 5,738.5 14,924.6 32,804.6
4.2 Debit –20,236.0 –20,679.6 –20,855.6 –22,586.3 –20,357.9 –4,831.9 –4,672.8 –5,128.9
5 Income –7,078.7 –8,705.3 –8,183.0 –11,391.6 –13,245.2 –3,548.5 –2,813.5 –3,838.3
5.1 Credit 5,301.2 6,536.0 9,483.7 9,762.9 5,741.4 1,402.3 1,887.5 1,618.1
5.2 Debit –12,379.9 –15,241.4 –17,666.8 –21,154.5 –18,986.6 –4,950.8 –4,701.0 –5,456.3
6 Current transfers 8,758.1 8,109.0 7,650.9 7,475.7 7,604.9 1,840.5 2,019.5 1,821.8
6.1 Credit 12,047.2 12,005.6 11,562.1 12,159.5 11,797.8 2,874.0 3,170.4 2,750.4
6.2 Debit –3,289.1 –3,896.5 –3,911.1 –4,683.7 –4,192.9 –1,033.4 –1,150.9 –928.5
B CAPITAL AND FINANCIAL ACCOUNT 22,046.3 27,135.5 30,264.9 42,591.1 24,392.8 6,910.2 –59.3 –5,674.8
B1 Capital account 396.8 –981.8 209.1 108.2 314.2 92.0 96.0 93.6
B2 Financial account, excl. reserves 27,725.0 38,430.7 35,370.8 40,174.7 30,589.8 3,042.3 723.8 1,580.3
1 Direct investment 9,093.0 18,762.5 25,485.8 22,967.0 8,912.4 3,889.2 –360.1 2,818.3
1.1 Abroad –1,415.4 –1,515.1 –1,552.6 –7,000.3 –6,729.4 –486.4 –1,198.0 –471.4
1.2 In Croatia 10,508.5 20,277.5 27,038.4 29,967.4 15,641.8 4,375.6 837.9 3,289.7
2 Portfolio investment –8,785.7 –3,916.8 37.3 –4,456.0 1,288.2 –4,706.1 –27.5 7,209.0
2.1 Assets –4,267.9 –3,391.6 –2,984.9 –1,952.8 –5,768.2 –728.8 318.9 –520.3
2.2 Liabilities –4,517.8 –525.3 3,022.2 –2,503.2 7,056.4 –3,977.3 –346.4 7,729.3
3 Financial derivatives –659.4 0.0 0.0 0.0 0.0 –445.5 –524.5 –233.5
4 Other investment 28,077.0 23,585.1 9,847.7 21,663.7 20,389.2 4,304.6 1,635.9 –8,213.5
4.1 Assets 7,421.4 –5,121.6 –12,078.3 –11,587.5 5,681.4 4,949.7 –302.2 –3,499.0
4.2 Liabilities 20,655.6 28,706.7 21,926.0 33,251.1 14,707.8 –645.1 1,938.1 –4,714.5
B3 Reserve assets (CNB) –6,075.4 –10,313.4 –5,315.0 2,308.3 –6,511.2 3,775.9 –879.1 –7,348.6
C NET ERRORS AND OMISSIONS –7,217.6 –7,004.0 –6,390.4 –10,903.6 –6,100.6 3,243.1 1,449.7 –7,541.1
a As from Bulletin No. 146 the CBRD is reclassified from the subsector central government funds to the subsector non-banking financial institutions. The reclassification covers the entire statistical series (from January 1999 onwards). Moreover, as from the same number of the Bulletin, CM is reclassified from the subsector central government funds to the subsector public enterprises. The reclassification covers the statistical series from January 2008 onwards. b Revised data. c Preliminary data.Note: The item net errors and omissions also comprises the counter-entry of a part of revenues from travel services which relates to such revenues not stated in the banks’ records.
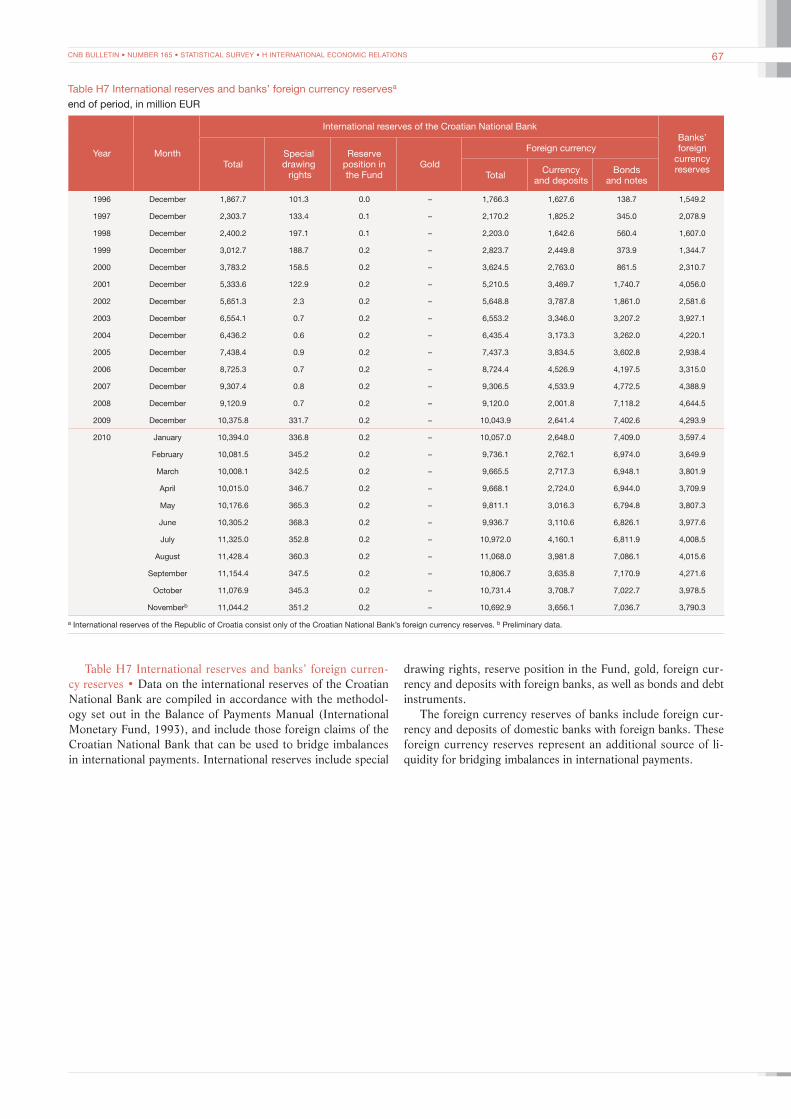
CNB BULLETIN • NUMBER 165 • STATISTICAL SURVEY • H INTERNATIONAL ECONOMIC RELATIONS 67
Table H7 International reserves and banks’ foreign currency reservesa
end of period, in million EUR
Year Month
International reserves of the Croatian National BankBanks’ foreign
currency reservesTotal
Special drawing rights
Reserve position in the Fund
Gold
Foreign currency
Total Currency and deposits
Bonds and notes
1996 December 1,867.7 101.3 0.0 – 1,766.3 1,627.6 138.7 1,549.2
1997 December 2,303.7 133.4 0.1 – 2,170.2 1,825.2 345.0 2,078.9
1998 December 2,400.2 197.1 0.1 – 2,203.0 1,642.6 560.4 1,607.0
1999 December 3,012.7 188.7 0.2 – 2,823.7 2,449.8 373.9 1,344.7
2000 December 3,783.2 158.5 0.2 – 3,624.5 2,763.0 861.5 2,310.7
2001 December 5,333.6 122.9 0.2 – 5,210.5 3,469.7 1,740.7 4,056.0
2002 December 5,651.3 2.3 0.2 – 5,648.8 3,787.8 1,861.0 2,581.6
2003 December 6,554.1 0.7 0.2 – 6,553.2 3,346.0 3,207.2 3,927.1
2004 December 6,436.2 0.6 0.2 – 6,435.4 3,173.3 3,262.0 4,220.1
2005 December 7,438.4 0.9 0.2 – 7,437.3 3,834.5 3,602.8 2,938.4
2006 December 8,725.3 0.7 0.2 – 8,724.4 4,526.9 4,197.5 3,315.0
2007 December 9,307.4 0.8 0.2 – 9,306.5 4,533.9 4,772.5 4,388.9
2008 December 9,120.9 0.7 0.2 – 9,120.0 2,001.8 7,118.2 4,644.5
2009 December 10,375.8 331.7 0.2 – 10,043.9 2,641.4 7,402.6 4,293.9
2010 January 10,394.0 336.8 0.2 – 10,057.0 2,648.0 7,409.0 3,597.4
February 10,081.5 345.2 0.2 – 9,736.1 2,762.1 6,974.0 3,649.9
March 10,008.1 342.5 0.2 – 9,665.5 2,717.3 6,948.1 3,801.9
April 10,015.0 346.7 0.2 – 9,668.1 2,724.0 6,944.0 3,709.9
May 10,176.6 365.3 0.2 – 9,811.1 3,016.3 6,794.8 3,807.3
June 10,305.2 368.3 0.2 – 9,936.7 3,110.6 6,826.1 3,977.6
July 11,325.0 352.8 0.2 – 10,972.0 4,160.1 6,811.9 4,008.5
August 11,428.4 360.3 0.2 – 11,068.0 3,981.8 7,086.1 4,015.6
September 11,154.4 347.5 0.2 – 10,806.7 3,635.8 7,170.9 4,271.6
October 11,076.9 345.3 0.2 – 10,731.4 3,708.7 7,022.7 3,978.5
Novemberb 11,044.2 351.2 0.2 – 10,692.9 3,656.1 7,036.7 3,790.3
a International reserves of the Republic of Croatia consist only of the Croatian National Bank’s foreign currency reserves. b Preliminary data.
Table H7 International reserves and banks’ foreign curren-cy reserves • Data on the international reserves of the Croatian National Bank are compiled in accordance with the methodol-ogy set out in the Balance of Payments Manual (International Monetary Fund, 1993), and include those foreign claims of the Croatian National Bank that can be used to bridge imbalances in international payments. International reserves include special
drawing rights, reserve position in the Fund, gold, foreign cur-rency and deposits with foreign banks, as well as bonds and debt instruments.
The foreign currency reserves of banks include foreign cur-rency and deposits of domestic banks with foreign banks. These foreign currency reserves represent an additional source of li-quidity for bridging imbalances in international payments.
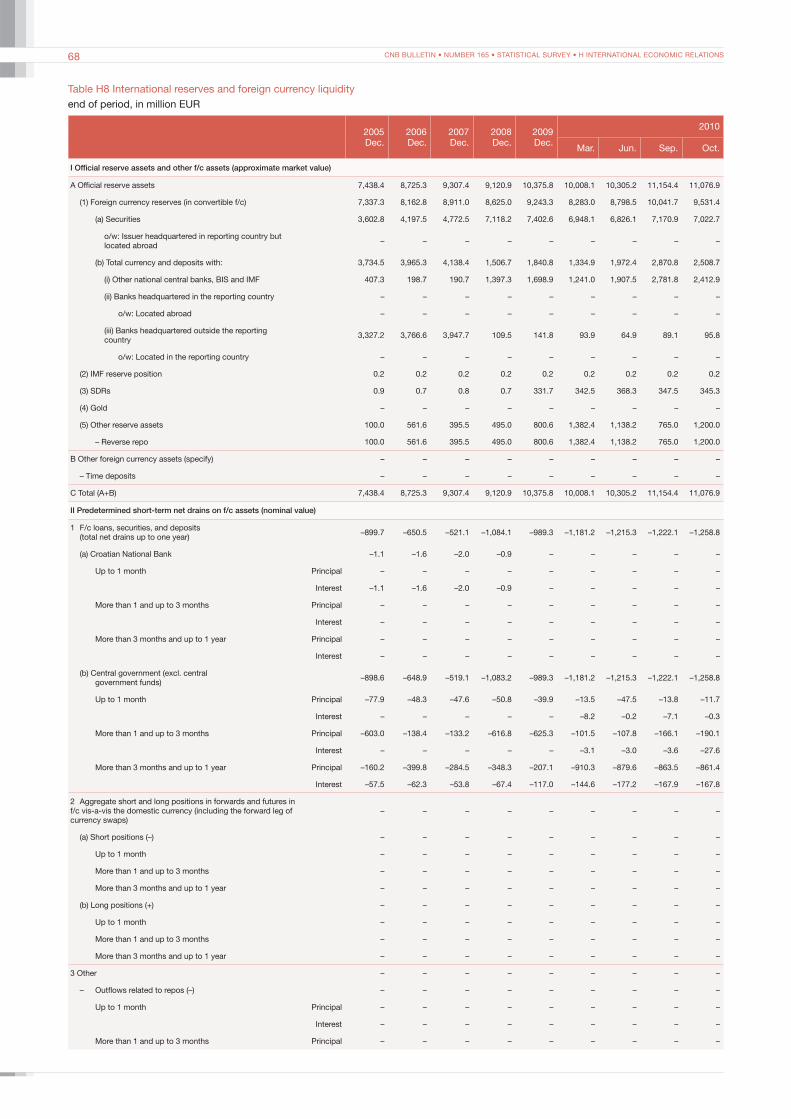
CNB BULLETIN • NUMBER 165 • STATISTICAL SURVEY • H INTERNATIONAL ECONOMIC RELATIONS68
Table H8 International reserves and foreign currency liquidityend of period, in million EUR
2005Dec.
2006Dec.
2007Dec.
2008Dec.
2009Dec.
2010
Mar. Jun. Sep. Oct.
I Official reserve assets and other f/c assets (approximate market value)
A Official reserve assets 7,438.4 8,725.3 9,307.4 9,120.9 10,375.8 10,008.1 10,305.2 11,154.4 11,076.9
(1) Foreign currency reserves (in convertible f/c) 7,337.3 8,162.8 8,911.0 8,625.0 9,243.3 8,283.0 8,798.5 10,041.7 9,531.4
(a) Securities 3,602.8 4,197.5 4,772.5 7,118.2 7,402.6 6,948.1 6,826.1 7,170.9 7,022.7
o/w: Issuer headquartered in reporting country but located abroad – – – – – – – – –
(b) Total currency and deposits with: 3,734.5 3,965.3 4,138.4 1,506.7 1,840.8 1,334.9 1,972.4 2,870.8 2,508.7
(i) Other national central banks, BIS and IMF 407.3 198.7 190.7 1,397.3 1,698.9 1,241.0 1,907.5 2,781.8 2,412.9
(ii) Banks headquartered in the reporting country – – – – – – – – –
o/w: Located abroad – – – – – – – – –
(iii) Banks headquartered outside the reporting country 3,327.2 3,766.6 3,947.7 109.5 141.8 93.9 64.9 89.1 95.8
o/w: Located in the reporting country – – – – – – – – –
(2) IMF reserve position 0.2 0.2 0.2 0.2 0.2 0.2 0.2 0.2 0.2
(3) SDRs 0.9 0.7 0.8 0.7 331.7 342.5 368.3 347.5 345.3
(4) Gold – – – – – – – – –
(5) Other reserve assets 100.0 561.6 395.5 495.0 800.6 1,382.4 1,138.2 765.0 1,200.0
– Reverse repo 100.0 561.6 395.5 495.0 800.6 1,382.4 1,138.2 765.0 1,200.0
B Other foreign currency assets (specify) – – – – – – – – –
– Time deposits – – – – – – – – –
C Total (A+B) 7,438.4 8,725.3 9,307.4 9,120.9 10,375.8 10,008.1 10,305.2 11,154.4 11,076.9
II Predetermined short-term net drains on f/c assets (nominal value)
1 F/c loans, securities, and deposits (total net drains up to one year) –899.7 –650.5 –521.1 –1,084.1 –989.3 –1,181.2 –1,215.3 –1,222.1 –1,258.8
(a) Croatian National Bank –1.1 –1.6 –2.0 –0.9 – – – – –
Up to 1 month Principal – – – – – – – – –
Interest –1.1 –1.6 –2.0 –0.9 – – – – –
More than 1 and up to 3 months Principal – – – – – – – – –
Interest – – – – – – – – –
More than 3 months and up to 1 year Principal – – – – – – – – –
Interest – – – – – – – – –
(b) Central government (excl. central government funds) –898.6 –648.9 –519.1 –1,083.2 –989.3 –1,181.2 –1,215.3 –1,222.1 –1,258.8
Up to 1 month Principal –77.9 –48.3 –47.6 –50.8 –39.9 –13.5 –47.5 –13.8 –11.7
Interest – – – – – –8.2 –0.2 –7.1 –0.3
More than 1 and up to 3 months Principal –603.0 –138.4 –133.2 –616.8 –625.3 –101.5 –107.8 –166.1 –190.1
Interest – – – – – –3.1 –3.0 –3.6 –27.6
More than 3 months and up to 1 year Principal –160.2 –399.8 –284.5 –348.3 –207.1 –910.3 –879.6 –863.5 –861.4
Interest –57.5 –62.3 –53.8 –67.4 –117.0 –144.6 –177.2 –167.9 –167.8
2 Aggregate short and long positions in forwards and futures in f/c vis-a-vis the domestic currency (including the forward leg of currency swaps)
– – – – – – – – –
(a) Short positions (–) – – – – – – – – –
Up to 1 month – – – – – – – – –
More than 1 and up to 3 months – – – – – – – – –
More than 3 months and up to 1 year – – – – – – – – –
(b) Long positions (+) – – – – – – – – –
Up to 1 month – – – – – – – – –
More than 1 and up to 3 months – – – – – – – – –
More than 3 months and up to 1 year – – – – – – – – –
3 Other – – – – – – – – –
– Outflows related to repos (–) – – – – – – – – –
Up to 1 month Principal – – – – – – – – –
Interest – – – – – – – – –
More than 1 and up to 3 months Principal – – – – – – – – –
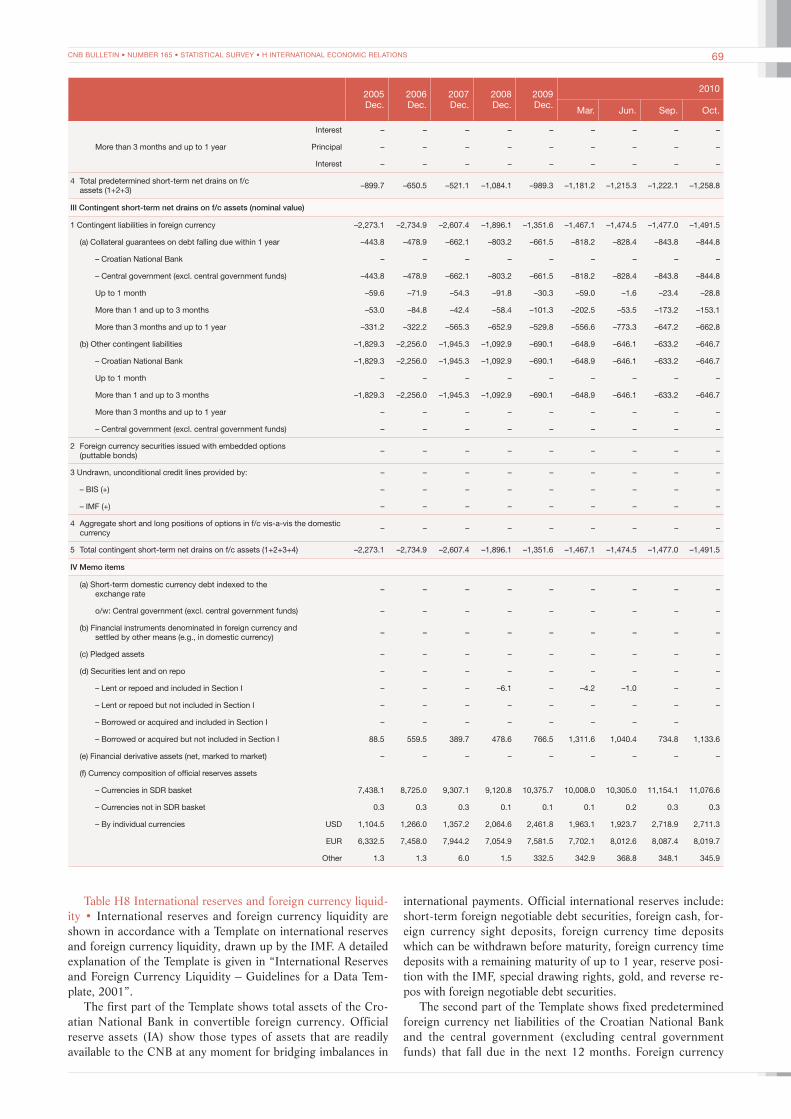
CNB BULLETIN • NUMBER 165 • STATISTICAL SURVEY • H INTERNATIONAL ECONOMIC RELATIONS 69
2005Dec.
2006Dec.
2007Dec.
2008Dec.
2009Dec.
2010
Mar. Jun. Sep. Oct.
Interest – – – – – – – – –
More than 3 months and up to 1 year Principal – – – – – – – – –
Interest – – – – – – – – –
4 Total predetermined short-term net drains on f/c assets (1+2+3) –899.7 –650.5 –521.1 –1,084.1 –989.3 –1,181.2 –1,215.3 –1,222.1 –1,258.8
III Contingent short-term net drains on f/c assets (nominal value)
1 Contingent liabilities in foreign currency –2,273.1 –2,734.9 –2,607.4 –1,896.1 –1,351.6 –1,467.1 –1,474.5 –1,477.0 –1,491.5
(a) Collateral guarantees on debt falling due within 1 year –443.8 –478.9 –662.1 –803.2 –661.5 –818.2 –828.4 –843.8 –844.8
– Croatian National Bank – – – – – – – – –
– Central government (excl. central government funds) –443.8 –478.9 –662.1 –803.2 –661.5 –818.2 –828.4 –843.8 –844.8
Up to 1 month –59.6 –71.9 –54.3 –91.8 –30.3 –59.0 –1.6 –23.4 –28.8
More than 1 and up to 3 months –53.0 –84.8 –42.4 –58.4 –101.3 –202.5 –53.5 –173.2 –153.1
More than 3 months and up to 1 year –331.2 –322.2 –565.3 –652.9 –529.8 –556.6 –773.3 –647.2 –662.8
(b) Other contingent liabilities –1,829.3 –2,256.0 –1,945.3 –1,092.9 –690.1 –648.9 –646.1 –633.2 –646.7
– Croatian National Bank –1,829.3 –2,256.0 –1,945.3 –1,092.9 –690.1 –648.9 –646.1 –633.2 –646.7
Up to 1 month – – – – – – – – –
More than 1 and up to 3 months –1,829.3 –2,256.0 –1,945.3 –1,092.9 –690.1 –648.9 –646.1 –633.2 –646.7
More than 3 months and up to 1 year – – – – – – – – –
– Central government (excl. central government funds) – – – – – – – – –
2 Foreign currency securities issued with embedded options (puttable bonds) – – – – – – – – –
3 Undrawn, unconditional credit lines provided by: – – – – – – – – –
– BIS (+) – – – – – – – – –
– IMF (+) – – – – – – – – –
4 Aggregate short and long positions of options in f/c vis-a-vis the domestic currency – – – – – – – – –
5 Total contingent short-term net drains on f/c assets (1+2+3+4) –2,273.1 –2,734.9 –2,607.4 –1,896.1 –1,351.6 –1,467.1 –1,474.5 –1,477.0 –1,491.5
IV Memo items
(a) Short-term domestic currency debt indexed to the exchange rate – – – – – – – – –
o/w: Central government (excl. central government funds) – – – – – – – – –
(b) Financial instruments denominated in foreign currency and settled by other means (e.g., in domestic currency) – – – – – – – – –
(c) Pledged assets – – – – – – – – –
(d) Securities lent and on repo – – – – – – – – –
– Lent or repoed and included in Section I – – – –6.1 – –4.2 –1.0 – –
– Lent or repoed but not included in Section I – – – – – – – – –
– Borrowed or acquired and included in Section I – – – – – – – –
– Borrowed or acquired but not included in Section I 88.5 559.5 389.7 478.6 766.5 1,311.6 1,040.4 734.8 1,133.6
(e) Financial derivative assets (net, marked to market) – – – – – – – – –
(f) Currency composition of official reserves assets
– Currencies in SDR basket 7,438.1 8,725.0 9,307.1 9,120.8 10,375.7 10,008.0 10,305.0 11,154.1 11,076.6
– Currencies not in SDR basket 0.3 0.3 0.3 0.1 0.1 0.1 0.2 0.3 0.3
– By individual currencies USD 1,104.5 1,266.0 1,357.2 2,064.6 2,461.8 1,963.1 1,923.7 2,718.9 2,711.3
EUR 6,332.5 7,458.0 7,944.2 7,054.9 7,581.5 7,702.1 8,012.6 8,087.4 8,019.7
Other 1.3 1.3 6.0 1.5 332.5 342.9 368.8 348.1 345.9
Table H8 International reserves and foreign currency liquid-ity • International reserves and foreign currency liquidity are shown in accordance with a Template on international reserves and foreign currency liquidity, drawn up by the IMF. A detailed explanation of the Template is given in “International Reserves and Foreign Currency Liquidity – Guidelines for a Data Tem-plate, 2001”.
The first part of the Template shows total assets of the Cro-atian National Bank in convertible foreign currency. Official reserve assets (IA) show those types of assets that are readily available to the CNB at any moment for bridging imbalances in
international payments. Official international reserves include: short-term foreign negotiable debt securities, foreign cash, for-eign currency sight deposits, foreign currency time deposits which can be withdrawn before maturity, foreign currency time deposits with a remaining maturity of up to 1 year, reserve posi-tion with the IMF, special drawing rights, gold, and reverse re-pos with foreign negotiable debt securities.
The second part of the Template shows fixed predetermined foreign currency net liabilities of the Croatian National Bank and the central government (excluding central government funds) that fall due in the next 12 months. Foreign currency
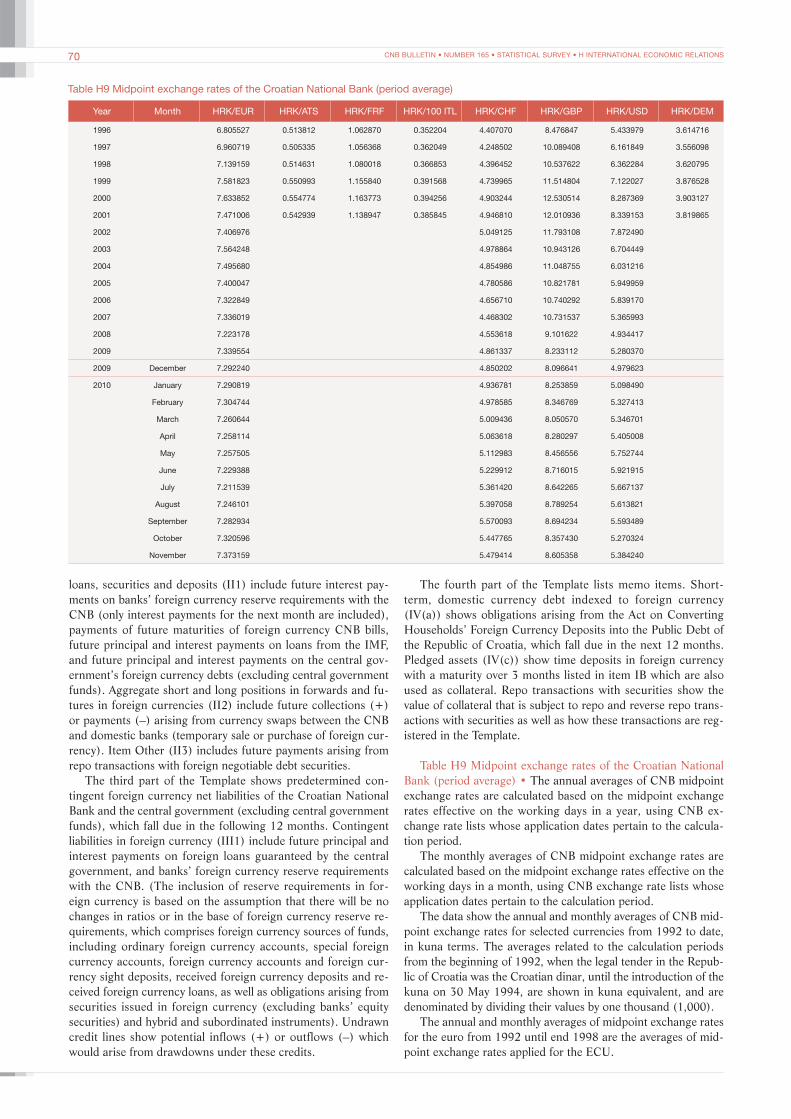
CNB BULLETIN • NUMBER 165 • STATISTICAL SURVEY • H INTERNATIONAL ECONOMIC RELATIONS70
Table H9 Midpoint exchange rates of the Croatian National Bank (period average)
Year Month HRK/EUR HRK/ATS HRK/FRF HRK/100 ITL HRK/CHF HRK/GBP HRK/USD HRK/DEM
1996 6.805527 0.513812 1.062870 0.352204 4.407070 8.476847 5.433979 3.614716
1997 6.960719 0.505335 1.056368 0.362049 4.248502 10.089408 6.161849 3.556098
1998 7.139159 0.514631 1.080018 0.366853 4.396452 10.537622 6.362284 3.620795
1999 7.581823 0.550993 1.155840 0.391568 4.739965 11.514804 7.122027 3.876528
2000 7.633852 0.554774 1.163773 0.394256 4.903244 12.530514 8.287369 3.903127
2001 7.471006 0.542939 1.138947 0.385845 4.946810 12.010936 8.339153 3.819865
2002 7.406976 5.049125 11.793108 7.872490
2003 7.564248 4.978864 10.943126 6.704449
2004 7.495680 4.854986 11.048755 6.031216
2005 7.400047 4.780586 10.821781 5.949959
2006 7.322849 4.656710 10.740292 5.839170
2007 7.336019 4.468302 10.731537 5.365993
2008 7.223178 4.553618 9.101622 4.934417
2009 7.339554 4.861337 8.233112 5.280370
2009 December 7.292240 4.850202 8.096641 4.979623
2010 January 7.290819 4.936781 8.253859 5.098490
February 7.304744 4.978585 8.346769 5.327413
March 7.260644 5.009436 8.050570 5.346701
April 7.258114 5.063618 8.280297 5.405008
May 7.257505 5.112983 8.456556 5.752744
June 7.229388 5.229912 8.716015 5.921915
July 7.211539 5.361420 8.642265 5.667137
August 7.246101 5.397058 8.789254 5.613821
September 7.282934 5.570093 8.694234 5.593489
October 7.320596 5.447765 8.357430 5.270324
November 7.373159 5.479414 8.605358 5.384240
loans, securities and deposits (II1) include future interest pay-ments on banks’ foreign currency reserve requirements with the CNB (only interest payments for the next month are included), payments of future maturities of foreign currency CNB bills, future principal and interest payments on loans from the IMF, and future principal and interest payments on the central gov-ernment’s foreign currency debts (excluding central government funds). Aggregate short and long positions in forwards and fu-tures in foreign currencies (II2) include future collections (+) or payments (–) arising from currency swaps between the CNB and domestic banks (temporary sale or purchase of foreign cur-rency). Item Other (II3) includes future payments arising from repo transactions with foreign negotiable debt securities.
The third part of the Template shows predetermined con-tingent foreign currency net liabilities of the Croatian National Bank and the central government (excluding central government funds), which fall due in the following 12 months. Contingent liabilities in foreign currency (III1) include future principal and interest payments on foreign loans guaranteed by the central government, and banks’ foreign currency reserve requirements with the CNB. (The inclusion of reserve requirements in for-eign currency is based on the assumption that there will be no changes in ratios or in the base of foreign currency reserve re-quirements, which comprises foreign currency sources of funds, including ordinary foreign currency accounts, special foreign currency accounts, foreign currency accounts and foreign cur-rency sight deposits, received foreign currency deposits and re-ceived foreign currency loans, as well as obligations arising from securities issued in foreign currency (excluding banks’ equity securities) and hybrid and subordinated instruments). Undrawn credit lines show potential inflows (+) or outflows (–) which would arise from drawdowns under these credits.
The fourth part of the Template lists memo items. Short-term, domestic currency debt indexed to foreign currency (IV(a)) shows obligations arising from the Act on Converting Households’ Foreign Currency Deposits into the Public Debt of the Republic of Croatia, which fall due in the next 12 months. Pledged assets (IV(c)) show time deposits in foreign currency with a maturity over 3 months listed in item IB which are also used as collateral. Repo transactions with securities show the value of collateral that is subject to repo and reverse repo trans-actions with securities as well as how these transactions are reg-istered in the Template.
Table H9 Midpoint exchange rates of the Croatian National Bank (period average) • The annual averages of CNB midpoint exchange rates are calculated based on the midpoint exchange rates effective on the working days in a year, using CNB ex-change rate lists whose application dates pertain to the calcula-tion period.
The monthly averages of CNB midpoint exchange rates are calculated based on the midpoint exchange rates effective on the working days in a month, using CNB exchange rate lists whose application dates pertain to the calculation period.
The data show the annual and monthly averages of CNB mid-point exchange rates for selected currencies from 1992 to date, in kuna terms. The averages related to the calculation periods from the beginning of 1992, when the legal tender in the Repub-lic of Croatia was the Croatian dinar, until the introduction of the kuna on 30 May 1994, are shown in kuna equivalent, and are denominated by dividing their values by one thousand (1,000).
The annual and monthly averages of midpoint exchange rates for the euro from 1992 until end 1998 are the averages of mid-point exchange rates applied for the ECU.
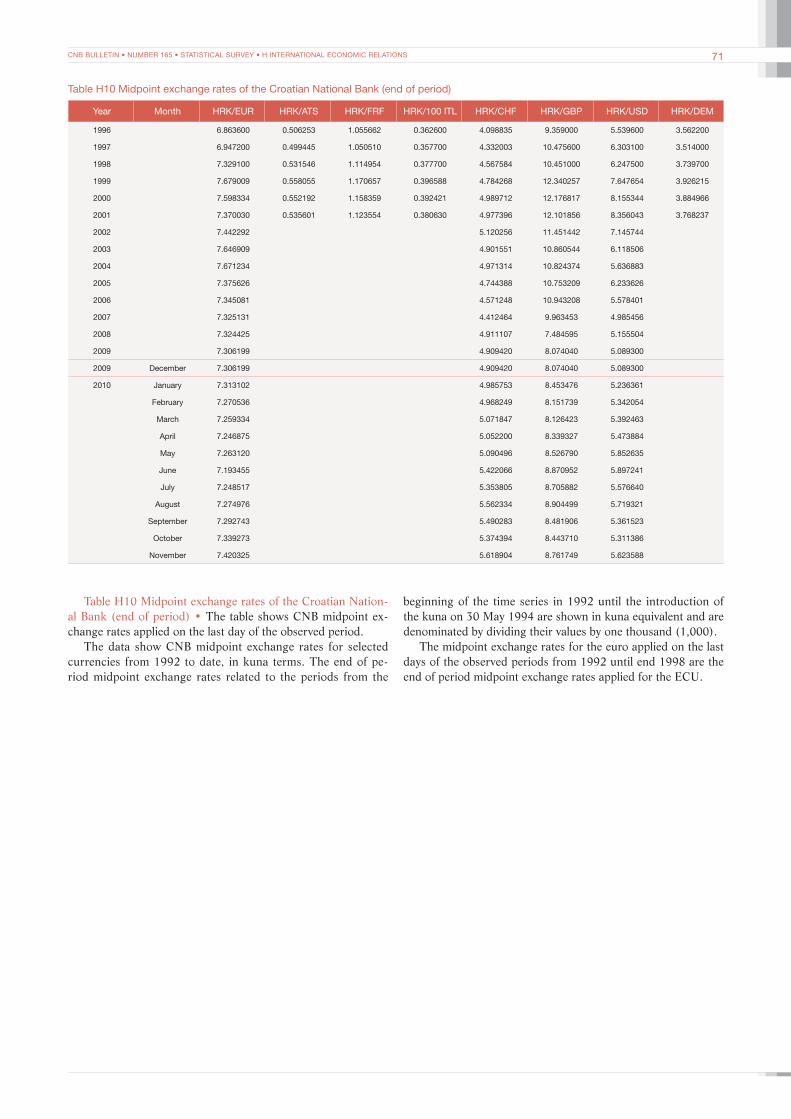
CNB BULLETIN • NUMBER 165 • STATISTICAL SURVEY • H INTERNATIONAL ECONOMIC RELATIONS 71
Table H10 Midpoint exchange rates of the Croatian National Bank (end of period)
Year Month HRK/EUR HRK/ATS HRK/FRF HRK/100 ITL HRK/CHF HRK/GBP HRK/USD HRK/DEM
1996 6.863600 0.506253 1.055662 0.362600 4.098835 9.359000 5.539600 3.562200
1997 6.947200 0.499445 1.050510 0.357700 4.332003 10.475600 6.303100 3.514000
1998 7.329100 0.531546 1.114954 0.377700 4.567584 10.451000 6.247500 3.739700
1999 7.679009 0.558055 1.170657 0.396588 4.784268 12.340257 7.647654 3.926215
2000 7.598334 0.552192 1.158359 0.392421 4.989712 12.176817 8.155344 3.884966
2001 7.370030 0.535601 1.123554 0.380630 4.977396 12.101856 8.356043 3.768237
2002 7.442292 5.120256 11.451442 7.145744
2003 7.646909 4.901551 10.860544 6.118506
2004 7.671234 4.971314 10.824374 5.636883
2005 7.375626 4.744388 10.753209 6.233626
2006 7.345081 4.571248 10.943208 5.578401
2007 7.325131 4.412464 9.963453 4.985456
2008 7.324425 4.911107 7.484595 5.155504
2009 7.306199 4.909420 8.074040 5.089300
2009 December 7.306199 4.909420 8.074040 5.089300
2010 January 7.313102 4.985753 8.453476 5.236361
February 7.270536 4.968249 8.151739 5.342054
March 7.259334 5.071847 8.126423 5.392463
April 7.246875 5.052200 8.339327 5.473884
May 7.263120 5.090496 8.526790 5.852635
June 7.193455 5.422066 8.870952 5.897241
July 7.248517 5.353805 8.705882 5.576640
August 7.274976 5.562334 8.904499 5.719321
September 7.292743 5.490283 8.481906 5.361523
October 7.339273 5.374394 8.443710 5.311386
November 7.420325 5.618904 8.761749 5.623588
Table H10 Midpoint exchange rates of the Croatian Nation-al Bank (end of period) • The table shows CNB midpoint ex-change rates applied on the last day of the observed period.
The data show CNB midpoint exchange rates for selected currencies from 1992 to date, in kuna terms. The end of pe-riod midpoint exchange rates related to the periods from the
beginning of the time series in 1992 until the introduction of the kuna on 30 May 1994 are shown in kuna equivalent and are denominated by dividing their values by one thousand (1,000).
The midpoint exchange rates for the euro applied on the last days of the observed periods from 1992 until end 1998 are the end of period midpoint exchange rates applied for the ECU.

CNB BULLETIN • NUMBER 165 • STATISTICAL SURVEY • H INTERNATIONAL ECONOMIC RELATIONS72
Table H11 Indices of the effective exchange rate of the kunaindices 2005 = 100
Year MonthNominal effective
exchange rate of the kuna
Real effective exchange rate of the kuna; deflator Real effective exchange rate of the kunaa; deflator
Consumer price index Producer price index Unit labour costs in industry
Unit labour costs in the total economy
1996 December 95.78 107.66 101.46
1997 December 95.53 106.32 101.00
1998 December 100.05 102.33 106.27
1999 December 107.42 108.96 110.74
2000 December 107.39 106.76 104.28 118.74 108.74
2001 December 104.41 103.85 103.78 112.90 108.45
2002 December 102.98 102.93 101.64 112.57 106.52
2003 December 103.17 103.24 102.18 105.91 105.33
2004 December 101.23 102.21 99.95 103.47 101.83
2005 December 100.26 99.82 101.00 100.58 100.55
2006 December 98.76 98.10 101.11 91.00 94.11
2007 December 97.20 94.63 98.66 87.22 90.16
2008 December 96.12 92.53 94.84 88.68 86.83
2009 December 96.36 92.36 92.02 89.86 88.07
2010 January 96.75 91.84 91.91
February 97.58 92.76 92.87
March 97.23 92.71 92.23 93.88 89.80
April 97.39 92.79 92.61
May 97.99 93.24 93.19
June 98.15 93.30 93.18 92.13b 91.57b
July 97.65 92.66 92.89
August 98.28 93.51 93.32
September 98.78 93.81 93.64
October 98.53 93.76b 93.41b
November 99.43
a The values shown are quarterly data. b Preliminary data.Note: Historical data may be revised when the series are updated.
Table H11 Indices of the effective exchange rate of the kuna • The index of the nominal effective exchange rate of the kuna is a weighted geometric average of the index of bilateral nominal exchange rates of the kuna against the selected curren-cies of the main trading partners. The currencies of the main trading partners and their weights are determined based on the structure of imports and exports of manufactured goods, where the weights used reflect direct import competition, direct export competition and export competition in third markets (see Box 2 in CNB Bulletin No. 165, 2011). The group of countries in-cluded in the formation of the index of the effective exchange rate of the kuna comprises the following 16 partner countries: a) eight eurozone countries: Austria (a 6.9% weight), Belgium (2.8%), France (6.4%), Germany (22.5%), Italy (21.4%), the Netherlands (3.2%), Slovenia (6.5%) and Spain (2.6%); b) five EU countries outside the eurozone: the Czech Republic (2.8%), Hungary (2.6%), Poland (2.8%), Sweden (1.9%) and the Unit-ed Kingdom (3.9%); and c) three non-EU countries: the United States (7.6%), Japan (4.0%) and Switzerland (2.2%). The ref-erence period for the calculation of the weights is the average for the 2007-2009 period. The time series of basic indices were recalculated on the basis of 2005.
The index of the nominal effective exchange rate is an ag-gregate indicator of the average value of the domestic currency
against a basket of currencies. An increase in the index of the nominal effective exchange rate of the kuna in a certain peri-od indicates that the kuna has depreciated against the basket of currencies and vice versa. The index of the real effective ex-change rate is a weighted geometric average of the index of bi-lateral exchange rates of the kuna adjusted for the correspond-ing indices of relative prices or costs (the ratio of price indices or costs in partner countries to domestic prices). Producer price indices, consumer price indices and the harmonised consumer price indices for EU member states, unit labour costs in the total economy and in industry are used as deflators. The time series for consumer prices in Croatia is constructed in the fol-lowing manner: retail price indices are used for the period until and including December 1997 and consumer price indices for the period as of January 1998. Unit labour costs in Croatia are calculated as the ratio of compensation per employee at current prices to labour productivity at constant prices (for more details on the calculation of unit labour costs, see Box 1 in CNB Bulle-tin No. 141, 2008). Data on the real effective exchange rate for the last month are preliminary. The historical data may be cor-rected for the subsequent changes in the data on deflators used in the calculation of the index of the real effective exchange rate of the kuna.

CNB BULLETIN • NUMBER 165 • STATISTICAL SURVEY • H INTERNATIONAL ECONOMIC RELATIONS 73
Table H12 Gross external debt by domestic sectorsa
in million EUR
2005Dec.
2006Dec.
2007Dec.b
2008Dec.c,d
2009Dec.e*
2010
Mar.* Jun.* Jul.* Aug.* Sep.
1 Government 6,152.7 5,670.1 5,371.8 4,197.3 5,165.2 4,965.6 5,050.1 5,891.7 5,983.3 5,841.0
Short-term 2.0 1.3 5.3 35.7 0.1 0.1 0.1 0.1 0.1 0.1
Money market instruments 0.0 0.0 0.0 0.0 0.0 0.0 0.0 0.0 0.0 0.0
Credits 0.0 0.0 0.0 31.7 0.0 0.0 0.0 0.0 0.0 0.0
Trade credits 0.0 0.0 0.0 0.0 0.0 0.0 0.0 0.0 0.0 0.0
Other debt liabilities 2.0 1.3 5.3 4.0 0.1 0.1 0.1 0.1 0.1 0.1
Principal arrears 1.8 0.0 1.1 3.9 0.1 0.0 0.0 0.0 0.0 0.0
Interest arrears 0.2 1.2 4.2 0.1 0.0 0.0 0.0 0.0 0.0 0.0
Other 0.0 0.0 0.0 0.0 0.0 0.0 0.0 0.0 0.0 0.0
Long-term 6,150.7 5,668.8 5,366.5 4,161.6 5,165.1 4,965.6 5,050.0 5,891.6 5,983.3 5,841.0
Bonds 3,663.4 3,109.1 2,756.9 2,621.9 3,572.5 3,119.8 3,214.9 4,085.9 4,161.4 4,040.7
Credits 2,484.8 2,557.8 2,608.4 1,538.9 1,592.6 1,845.8 1,835.2 1,805.7 1,821.9 1,800.2
Trade credits 2.6 1.9 1.2 0.7 0.0 0.0 0.0 0.0 0.0 0.0
Other debt liabilities 0.0 0.0 0.0 0.0 0.0 0.0 0.0 0.0 0.0 0.0
2 Croatian National Bank 2.6 2.6 2.3 2.3 1.1 1.2 1.3 1.2 1.2 1.1
Short-term 2.6 2.6 2.3 2.3 1.1 1.2 1.3 1.2 1.2 1.1
Money market instruments 0.0 0.0 0.0 0.0 0.0 0.0 0.0 0.0 0.0 0.0
Credits 0.0 0.0 0.0 0.0 0.0 0.0 0.0 0.0 0.0 0.0
Currency and deposits 2.6 2.6 2.3 2.3 1.1 1.2 1.3 1.2 1.2 1.1
Other debt liabilities 0.0 0.0 0.0 0.0 0.0 0.0 0.0 0.0 0.0 0.0
Principal arrears 0.0 0.0 0.0 0.0 0.0 0.0 0.0 0.0 0.0 0.0
Interest arrears 0.0 0.0 0.0 0.0 0.0 0.0 0.0 0.0 0.0 0.0
Other 0.0 0.0 0.0 0.0 0.0 0.0 0.0 0.0 0.0 0.0
Long-term 0.0 0.0 0.0 0.0 0.0 0.0 0.0 0.0 0.0 0.0
Bonds 0.0 0.0 0.0 0.0 0.0 0.0 0.0 0.0 0.0 0.0
Credits 0.0 0.0 0.0 0.0 0.0 0.0 0.0 0.0 0.0 0.0
Currency and deposits 0.0 0.0 0.0 0.0 0.0 0.0 0.0 0.0 0.0 0.0
Other debt liabilities 0.0 0.0 0.0 0.0 0.0 0.0 0.0 0.0 0.0 0.0
3 Banks 8,978.7 10,222.6 8,879.1 10,079.1 10,679.8 10,662.2 11,099.3 10,279.0 9,916.6 9,961.3
Short-term 2,505.2 3,362.7 2,361.2 3,793.3 3,091.8 2,909.6 3,097.9 2,553.4 2,320.0 2,350.9
Money market instruments 0.0 0.0 0.0 0.0 0.0 0.0 0.0 0.0 0.0 0.0
Credits 1,064.8 1,150.4 710.8 1,121.1 806.8 1,085.0 1,015.2 592.9 435.4 698.8
Currency and deposits 1,438.6 2,211.1 1,648.8 2,670.3 2,283.9 1,823.3 2,081.3 1,959.8 1,884.1 1,651.1
Other debt liabilities 1.7 1.2 1.7 2.0 1.2 1.4 1.4 0.7 0.5 1.0
Principal arrears 0.0 0.0 0.1 0.0 0.0 0.0 0.0 0.0 0.0 0.0
Interest arrears 1.7 1.2 1.5 2.0 1.2 1.4 1.4 0.7 0.5 1.0
Other 0.0 0.0 0.0 0.0 0.0 0.0 0.0 0.0 0.0 0.0
Long-term 6,473.6 6,859.9 6,517.9 6,285.8 7,587.9 7,752.6 8,001.4 7,725.6 7,596.5 7,610.4
Bonds 456.6 457.9 459.0 456.8 0.0 0.0 0.0 0.0 0.0 0.0
Credits 3,822.7 4,217.3 3,565.1 3,373.9 3,545.3 3,518.6 3,698.2 3,673.6 3,701.2 3,343.5
Currency and deposits 2,194.3 2,184.7 2,493.9 2,455.0 4,042.7 4,234.1 4,303.1 4,052.0 3,895.3 4,266.9
Other debt liabilities 0.0 0.0 0.0 0.0 0.0 0.0 0.0 0.0 0.0 0.0
4 Other sectors 8,176.4 10,500.2 14,743.1 19,835.7 21,328.7 21,438.9 21,521.5 21,716.4 21,793.6 21,616.2
Short-term 706.7 700.9 1,478.2 925.2 1,350.4 1,497.4 1,539.6 1,602.5 1,564.2 1,589.9
Money market instruments 0.0 0.0 0.0 0.0 0.0 0.0 0.0 0.0 0.0 0.0
Credits 133.0 155.0 681.0 652.9 677.2 659.3 538.9 580.9 548.9 522.2
Currency and deposits 0.0 0.0 0.0 0.0 0.0 0.0 0.0 0.0 0.0 0.0
Trade credits 27.8 35.9 31.1 39.5 28.2 37.6 40.5 45.1 41.3 41.2
Other debt liabilities 545.9 510.0 766.0 232.9 645.0 800.4 960.1 976.5 974.1 1,026.5
Principal arrears 502.1 460.6 683.4 170.4 525.4 668.5 803.2 819.3 819.8 867.7
Interest arrears 43.8 49.4 82.6 62.5 119.6 131.9 156.9 157.3 154.3 158.9
Other 0.0 0.0 0.0 0.0 0.0 0.0 0.0 0.0 0.0 0.0
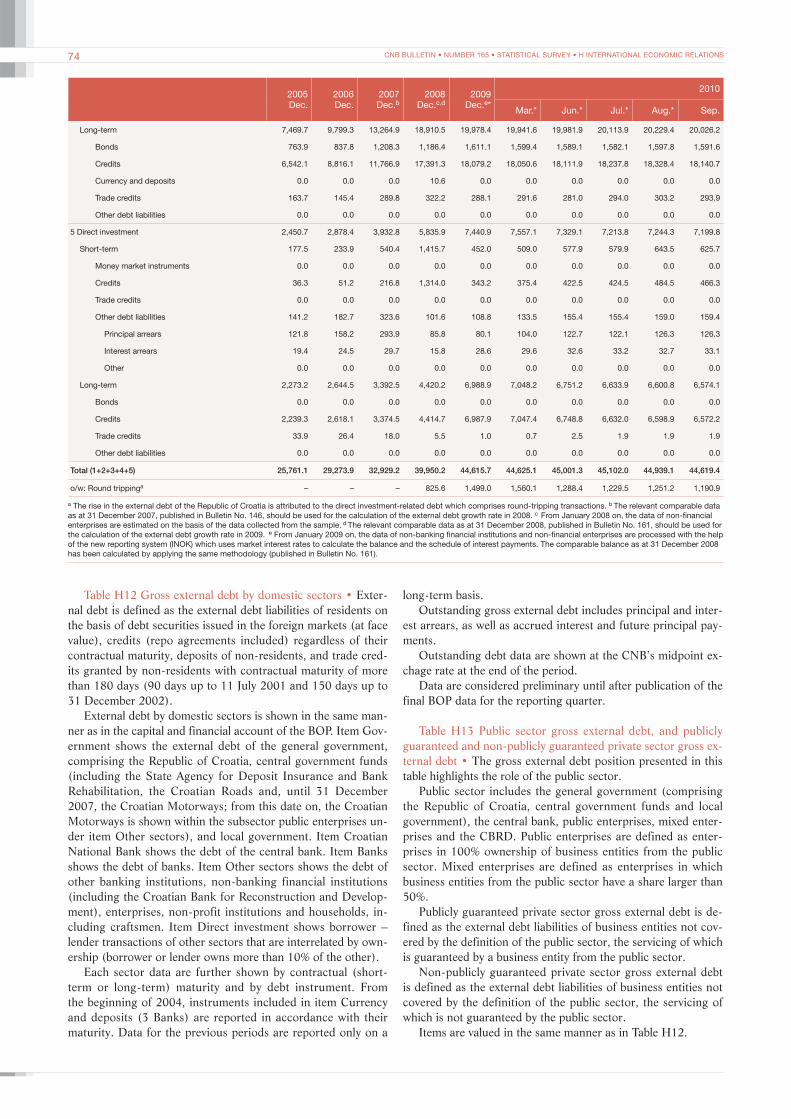
CNB BULLETIN • NUMBER 165 • STATISTICAL SURVEY • H INTERNATIONAL ECONOMIC RELATIONS74
2005Dec.
2006Dec.
2007Dec.b
2008Dec.c,d
2009Dec.e*
2010
Mar.* Jun.* Jul.* Aug.* Sep.
Long-term 7,469.7 9,799.3 13,264.9 18,910.5 19,978.4 19,941.6 19,981.9 20,113.9 20,229.4 20,026.2
Bonds 763.9 837.8 1,208.3 1,186.4 1,611.1 1,599.4 1,589.1 1,582.1 1,597.8 1,591.6
Credits 6,542.1 8,816.1 11,766.9 17,391.3 18,079.2 18,050.6 18,111.9 18,237.8 18,328.4 18,140.7
Currency and deposits 0.0 0.0 0.0 10.6 0.0 0.0 0.0 0.0 0.0 0.0
Trade credits 163.7 145.4 289.8 322.2 288.1 291.6 281.0 294.0 303.2 293.9
Other debt liabilities 0.0 0.0 0.0 0.0 0.0 0.0 0.0 0.0 0.0 0.0
5 Direct investment 2,450.7 2,878.4 3,932.8 5,835.9 7,440.9 7,557.1 7,329.1 7,213.8 7,244.3 7,199.8
Short-term 177.5 233.9 540.4 1,415.7 452.0 509.0 577.9 579.9 643.5 625.7
Money market instruments 0.0 0.0 0.0 0.0 0.0 0.0 0.0 0.0 0.0 0.0
Credits 36.3 51.2 216.8 1,314.0 343.2 375.4 422.5 424.5 484.5 466.3
Trade credits 0.0 0.0 0.0 0.0 0.0 0.0 0.0 0.0 0.0 0.0
Other debt liabilities 141.2 182.7 323.6 101.6 108.8 133.5 155.4 155.4 159.0 159.4
Principal arrears 121.8 158.2 293.9 85.8 80.1 104.0 122.7 122.1 126.3 126.3
Interest arrears 19.4 24.5 29.7 15.8 28.6 29.6 32.6 33.2 32.7 33.1
Other 0.0 0.0 0.0 0.0 0.0 0.0 0.0 0.0 0.0 0.0
Long-term 2,273.2 2,644.5 3,392.5 4,420.2 6,988.9 7,048.2 6,751.2 6,633.9 6,600.8 6,574.1
Bonds 0.0 0.0 0.0 0.0 0.0 0.0 0.0 0.0 0.0 0.0
Credits 2,239.3 2,618.1 3,374.5 4,414.7 6,987.9 7,047.4 6,748.8 6,632.0 6,598.9 6,572.2
Trade credits 33.9 26.4 18.0 5.5 1.0 0.7 2.5 1.9 1.9 1.9
Other debt liabilities 0.0 0.0 0.0 0.0 0.0 0.0 0.0 0.0 0.0 0.0
Total (1+2+3+4+5) 25,761.1 29,273.9 32,929.2 39,950.2 44,615.7 44,625.1 45,001.3 45,102.0 44,939.1 44,619.4
o/w: Round trippinga – – – 825.6 1,499.0 1,560.1 1,288.4 1,229.5 1,251.2 1,190.9
a The rise in the external debt of the Republic of Croatia is attributed to the direct investment-related debt which comprises round-tripping transactions. b The relevant comparable data as at 31 December 2007, published in Bulletin No. 146, should be used for the calculation of the external debt growth rate in 2008. c From January 2008 on, the data of non-financial enterprises are estimated on the basis of the data collected from the sample. d The relevant comparable data as at 31 December 2008, published in Bulletin No. 161, should be used for the calculation of the external debt growth rate in 2009. e From January 2009 on, the data of non-banking financial institutions and non-financial enterprises are processed with the help of the new reporting system (INOK) which uses market interest rates to calculate the balance and the schedule of interest payments. The comparable balance as at 31 December 2008 has been calculated by applying the same methodology (published in Bulletin No. 161).
Table H12 Gross external debt by domestic sectors • Exter-nal debt is defined as the external debt liabilities of residents on the basis of debt securities issued in the foreign markets (at face value), credits (repo agreements included) regardless of their contractual maturity, deposits of non-residents, and trade cred-its granted by non-residents with contractual maturity of more than 180 days (90 days up to 11 July 2001 and 150 days up to 31 December 2002).
External debt by domestic sectors is shown in the same man-ner as in the capital and financial account of the BOP. Item Gov-ernment shows the external debt of the general government, comprising the Republic of Croatia, central government funds (including the State Agency for Deposit Insurance and Bank Rehabilitation, the Croatian Roads and, until 31 December 2007, the Croatian Motorways; from this date on, the Croatian Motorways is shown within the subsector public enterprises un-der item Other sectors), and local government. Item Croatian National Bank shows the debt of the central bank. Item Banks shows the debt of banks. Item Other sectors shows the debt of other banking institutions, non-banking financial institutions (including the Croatian Bank for Reconstruction and Develop-ment), enterprises, non-profit institutions and households, in-cluding craftsmen. Item Direct investment shows borrower – lender transactions of other sectors that are interrelated by own-ership (borrower or lender owns more than 10% of the other).
Each sector data are further shown by contractual (short-term or long-term) maturity and by debt instrument. From the beginning of 2004, instruments included in item Currency and deposits (3 Banks) are reported in accordance with their maturity. Data for the previous periods are reported only on a
long-term basis.Outstanding gross external debt includes principal and inter-
est arrears, as well as accrued interest and future principal pay-ments.
Outstanding debt data are shown at the CNB’s midpoint ex-chage rate at the end of the period.
Data are considered preliminary until after publication of the final BOP data for the reporting quarter.
Table H13 Public sector gross external debt, and publicly guaranteed and non-publicly guaranteed private sector gross ex-ternal debt • The gross external debt position presented in this table highlights the role of the public sector.
Public sector includes the general government (comprising the Republic of Croatia, central government funds and local government), the central bank, public enterprises, mixed enter-prises and the CBRD. Public enterprises are defined as enter-prises in 100% ownership of business entities from the public sector. Mixed enterprises are defined as enterprises in which business entities from the public sector have a share larger than 50%.
Publicly guaranteed private sector gross external debt is de-fined as the external debt liabilities of business entities not cov-ered by the definition of the public sector, the servicing of which is guaranteed by a business entity from the public sector.
Non-publicly guaranteed private sector gross external debt is defined as the external debt liabilities of business entities not covered by the definition of the public sector, the servicing of which is not guaranteed by the public sector.
Items are valued in the same manner as in Table H12.
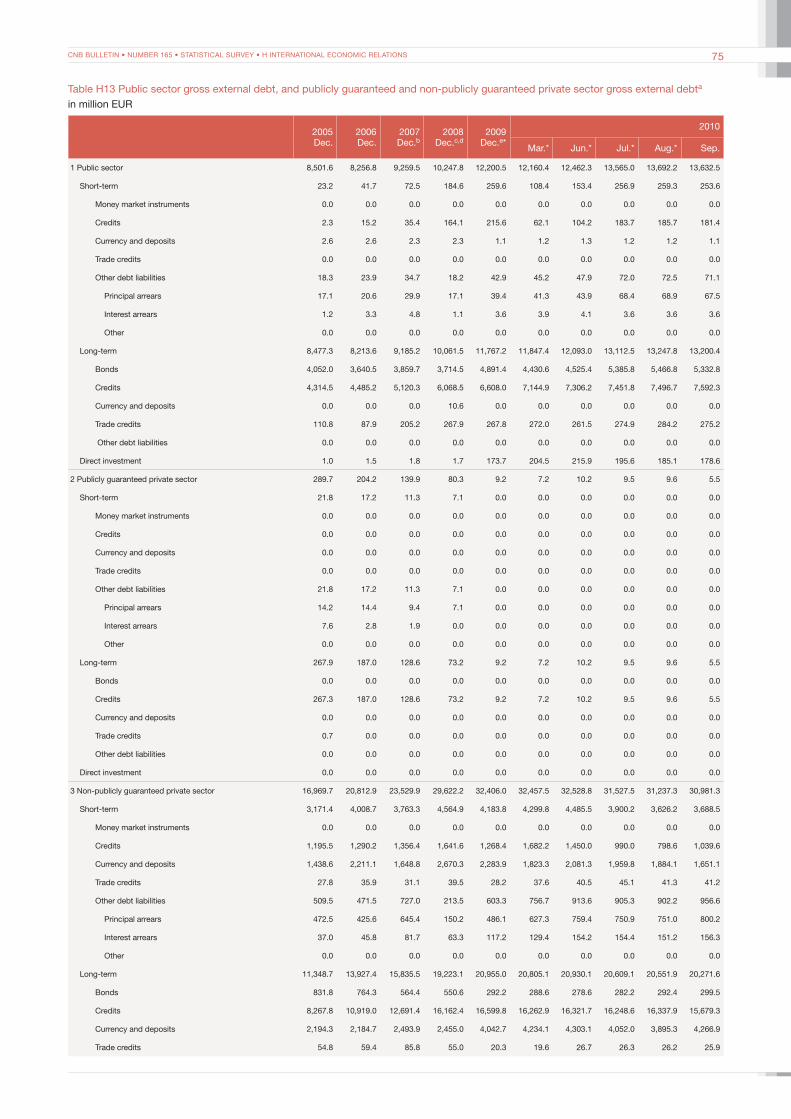
CNB BULLETIN • NUMBER 165 • STATISTICAL SURVEY • H INTERNATIONAL ECONOMIC RELATIONS 75
Table H13 Public sector gross external debt, and publicly guaranteed and non-publicly guaranteed private sector gross external debta
in million EUR
2005Dec.
2006Dec.
2007Dec.b
2008Dec.c,d
2009Dec.e*
2010
Mar.* Jun.* Jul.* Aug.* Sep.
1 Public sector 8,501.6 8,256.8 9,259.5 10,247.8 12,200.5 12,160.4 12,462.3 13,565.0 13,692.2 13,632.5
Short-term 23.2 41.7 72.5 184.6 259.6 108.4 153.4 256.9 259.3 253.6
Money market instruments 0.0 0.0 0.0 0.0 0.0 0.0 0.0 0.0 0.0 0.0
Credits 2.3 15.2 35.4 164.1 215.6 62.1 104.2 183.7 185.7 181.4
Currency and deposits 2.6 2.6 2.3 2.3 1.1 1.2 1.3 1.2 1.2 1.1
Trade credits 0.0 0.0 0.0 0.0 0.0 0.0 0.0 0.0 0.0 0.0
Other debt liabilities 18.3 23.9 34.7 18.2 42.9 45.2 47.9 72.0 72.5 71.1
Principal arrears 17.1 20.6 29.9 17.1 39.4 41.3 43.9 68.4 68.9 67.5
Interest arrears 1.2 3.3 4.8 1.1 3.6 3.9 4.1 3.6 3.6 3.6
Other 0.0 0.0 0.0 0.0 0.0 0.0 0.0 0.0 0.0 0.0
Long-term 8,477.3 8,213.6 9,185.2 10,061.5 11,767.2 11,847.4 12,093.0 13,112.5 13,247.8 13,200.4
Bonds 4,052.0 3,640.5 3,859.7 3,714.5 4,891.4 4,430.6 4,525.4 5,385.8 5,466.8 5,332.8
Credits 4,314.5 4,485.2 5,120.3 6,068.5 6,608.0 7,144.9 7,306.2 7,451.8 7,496.7 7,592.3
Currency and deposits 0.0 0.0 0.0 10.6 0.0 0.0 0.0 0.0 0.0 0.0
Trade credits 110.8 87.9 205.2 267.9 267.8 272.0 261.5 274.9 284.2 275.2
Other debt liabilities 0.0 0.0 0.0 0.0 0.0 0.0 0.0 0.0 0.0 0.0
Direct investment 1.0 1.5 1.8 1.7 173.7 204.5 215.9 195.6 185.1 178.6
2 Publicly guaranteed private sector 289.7 204.2 139.9 80.3 9.2 7.2 10.2 9.5 9.6 5.5
Short-term 21.8 17.2 11.3 7.1 0.0 0.0 0.0 0.0 0.0 0.0
Money market instruments 0.0 0.0 0.0 0.0 0.0 0.0 0.0 0.0 0.0 0.0
Credits 0.0 0.0 0.0 0.0 0.0 0.0 0.0 0.0 0.0 0.0
Currency and deposits 0.0 0.0 0.0 0.0 0.0 0.0 0.0 0.0 0.0 0.0
Trade credits 0.0 0.0 0.0 0.0 0.0 0.0 0.0 0.0 0.0 0.0
Other debt liabilities 21.8 17.2 11.3 7.1 0.0 0.0 0.0 0.0 0.0 0.0
Principal arrears 14.2 14.4 9.4 7.1 0.0 0.0 0.0 0.0 0.0 0.0
Interest arrears 7.6 2.8 1.9 0.0 0.0 0.0 0.0 0.0 0.0 0.0
Other 0.0 0.0 0.0 0.0 0.0 0.0 0.0 0.0 0.0 0.0
Long-term 267.9 187.0 128.6 73.2 9.2 7.2 10.2 9.5 9.6 5.5
Bonds 0.0 0.0 0.0 0.0 0.0 0.0 0.0 0.0 0.0 0.0
Credits 267.3 187.0 128.6 73.2 9.2 7.2 10.2 9.5 9.6 5.5
Currency and deposits 0.0 0.0 0.0 0.0 0.0 0.0 0.0 0.0 0.0 0.0
Trade credits 0.7 0.0 0.0 0.0 0.0 0.0 0.0 0.0 0.0 0.0
Other debt liabilities 0.0 0.0 0.0 0.0 0.0 0.0 0.0 0.0 0.0 0.0
Direct investment 0.0 0.0 0.0 0.0 0.0 0.0 0.0 0.0 0.0 0.0
3 Non-publicly guaranteed private sector 16,969.7 20,812.9 23,529.9 29,622.2 32,406.0 32,457.5 32,528.8 31,527.5 31,237.3 30,981.3
Short-term 3,171.4 4,008.7 3,763.3 4,564.9 4,183.8 4,299.8 4,485.5 3,900.2 3,626.2 3,688.5
Money market instruments 0.0 0.0 0.0 0.0 0.0 0.0 0.0 0.0 0.0 0.0
Credits 1,195.5 1,290.2 1,356.4 1,641.6 1,268.4 1,682.2 1,450.0 990.0 798.6 1,039.6
Currency and deposits 1,438.6 2,211.1 1,648.8 2,670.3 2,283.9 1,823.3 2,081.3 1,959.8 1,884.1 1,651.1
Trade credits 27.8 35.9 31.1 39.5 28.2 37.6 40.5 45.1 41.3 41.2
Other debt liabilities 509.5 471.5 727.0 213.5 603.3 756.7 913.6 905.3 902.2 956.6
Principal arrears 472.5 425.6 645.4 150.2 486.1 627.3 759.4 750.9 751.0 800.2
Interest arrears 37.0 45.8 81.7 63.3 117.2 129.4 154.2 154.4 151.2 156.3
Other 0.0 0.0 0.0 0.0 0.0 0.0 0.0 0.0 0.0 0.0
Long-term 11,348.7 13,927.4 15,835.5 19,223.1 20,955.0 20,805.1 20,930.1 20,609.1 20,551.9 20,271.6
Bonds 831.8 764.3 564.4 550.6 292.2 288.6 278.6 282.2 292.4 299.5
Credits 8,267.8 10,919.0 12,691.4 16,162.4 16,599.8 16,262.9 16,321.7 16,248.6 16,337.9 15,679.3
Currency and deposits 2,194.3 2,184.7 2,493.9 2,455.0 4,042.7 4,234.1 4,303.1 4,052.0 3,895.3 4,266.9
Trade credits 54.8 59.4 85.8 55.0 20.3 19.6 26.7 26.3 26.2 25.9

CNB BULLETIN • NUMBER 165 • STATISTICAL SURVEY • H INTERNATIONAL ECONOMIC RELATIONS76
2005Dec.
2006Dec.
2007Dec.b
2008Dec.c,d
2009Dec.e*
2010
Mar.* Jun.* Jul.* Aug.* Sep.
Other debt liabilities 0.0 0.0 0.0 0.0 0.0 0.0 0.0 0.0 0.0 0.0
Direct investment 2,449.6 2,876.9 3,931.1 5,834.2 7,267.2 7,352.6 7,113.2 7,018.2 7,059.2 7,021.2
Total (1+2+3) 25,761.1 29,273.9 32,929.2 39,950.2 44,615.7 44,625.1 45,001.3 45,102.1 44,939.1 44,619.4
o/w: Round trippinga – – – 825.6 1,499.0 1,560.1 1,288.4 1,229.5 1,251.2 1,190.9
a The rise in the external debt of the Republic of Croatia is attributed to the direct investment-related debt which comprises round-tripping transactions. b The relevant comparable data as at 31 December 2007, published in Bulletin No. 146, should be used for the calculation of the external debt growth rate in 2008. c From January 2008 on, the data of non-financial enterprises are estimated on the basis of the data collected from the sample. d The relevant comparable data as at 31 December 2008, published in Bulletin No. 161, should be used for the calculation of the external debt growth rate in 2009. e From January 2009 on, the data of non-banking financial institutions and non-financial enterprises are processed with the help of the new reporting system (INOK) which uses market interest rates to calculate the balance and the schedule of interest payments. The comparable balance as at 31 December 2008 has been calculated by applying the same methodology (published in Bulletin No. 161).
Table H14 Gross external debt by domestic sectors and projected future paymentsa
in million EUR
Gross external
debt30/9/2010
Imme-diate
Projected future principal payments
Q4/10 Q1/11 Q2/11 Q3/11 2010 2011 2012 2013 2014 2015 2016 2017 Other
1 Government 5,841.0 0.1 177.6 761.7 66.1 44.7 177.6 935.4 157.7 164.4 643.6 988.9 106.7 76.0 2,590.8
Short-term 0.1 0.1 0.0 0.0 0.0 0.0 0.0 0.0 0.0 0.0 0.0 0.0 0.0 0.0 0.0
Money market instruments 0.0 0.0 0.0 0.0 0.0 0.0 0.0 0.0 0.0 0.0 0.0 0.0 0.0 0.0 0.0
Credits 0.0 0.0 0.0 0.0 0.0 0.0 0.0 0.0 0.0 0.0 0.0 0.0 0.0 0.0 0.0
Trade credits 0.0 0.0 0.0 0.0 0.0 0.0 0.0 0.0 0.0 0.0 0.0 0.0 0.0 0.0 0.0
Other debt liabilities 0.1 0.1 0.0 0.0 0.0 0.0 0.0 0.0 0.0 0.0 0.0 0.0 0.0 0.0 0.0
Principal arrears 0.0 0.0 0.0 0.0 0.0 0.0 0.0 0.0 0.0 0.0 0.0 0.0 0.0 0.0 0.0
Interest arrears 0.0 0.0 0.0 0.0 0.0 0.0 0.0 0.0 0.0 0.0 0.0 0.0 0.0 0.0 0.0
Other 0.0 0.0 0.0 0.0 0.0 0.0 0.0 0.0 0.0 0.0 0.0 0.0 0.0 0.0 0.0
Long-term 5,841.0 0.0 177.6 761.7 66.1 44.7 177.6 935.4 157.7 164.4 643.6 988.9 106.7 76.0 2,590.8
Bonds 4,040.7 0.0 101.1 734.1 0.0 0.0 101.1 734.1 0.0 0.0 487.7 722.2 0.0 0.0 1,995.6
Credits 1,800.2 0.0 76.5 27.6 66.1 44.7 76.5 201.2 157.7 164.4 155.9 266.8 106.7 76.0 595.1
Trade credits 0.0 0.0 0.0 0.0 0.0 0.0 0.0 0.0 0.0 0.0 0.0 0.0 0.0 0.0 0.0
Other debt liabilities 0.0 0.0 0.0 0.0 0.0 0.0 0.0 0.0 0.0 0.0 0.0 0.0 0.0 0.0 0.0
2 Croatian National Bank 1.1 0.0 1.1 0.0 0.0 0.0 1.1 0.0 0.0 0.0 0.0 0.0 0.0 0.0 0.0
Short-term 1.1 0.0 1.1 0.0 0.0 0.0 1.1 0.0 0.0 0.0 0.0 0.0 0.0 0.0 0.0
Money market instruments 0.0 0.0 0.0 0.0 0.0 0.0 0.0 0.0 0.0 0.0 0.0 0.0 0.0 0.0 0.0
Credits 0.0 0.0 0.0 0.0 0.0 0.0 0.0 0.0 0.0 0.0 0.0 0.0 0.0 0.0 0.0
Currency and deposits 1.1 0.0 1.1 0.0 0.0 0.0 1.1 0.0 0.0 0.0 0.0 0.0 0.0 0.0 0.0
Other debt liabilities 0.0 0.0 0.0 0.0 0.0 0.0 0.0 0.0 0.0 0.0 0.0 0.0 0.0 0.0 0.0
Principal arrears 0.0 0.0 0.0 0.0 0.0 0.0 0.0 0.0 0.0 0.0 0.0 0.0 0.0 0.0 0.0
Interest arrears 0.0 0.0 0.0 0.0 0.0 0.0 0.0 0.0 0.0 0.0 0.0 0.0 0.0 0.0 0.0
Other 0.0 0.0 0.0 0.0 0.0 0.0 0.0 0.0 0.0 0.0 0.0 0.0 0.0 0.0 0.0
Long-term 0.0 0.0 0.0 0.0 0.0 0.0 0.0 0.0 0.0 0.0 0.0 0.0 0.0 0.0 0.0
Bonds 0.0 0.0 0.0 0.0 0.0 0.0 0.0 0.0 0.0 0.0 0.0 0.0 0.0 0.0 0.0
Credits 0.0 0.0 0.0 0.0 0.0 0.0 0.0 0.0 0.0 0.0 0.0 0.0 0.0 0.0 0.0
Currency and deposits 0.0 0.0 0.0 0.0 0.0 0.0 0.0 0.0 0.0 0.0 0.0 0.0 0.0 0.0 0.0
Other debt liabilities 0.0 0.0 0.0 0.0 0.0 0.0 0.0 0.0 0.0 0.0 0.0 0.0 0.0 0.0 0.0
3 Banks 9,961.3 1.0 2,288.9 693.5 835.5 503.2 2,288.9 2,863.4 1,644.8 670.5 768.4 420.8 374.9 873.8 54.8
Short-term 2,350.9 1.0 1,595.1 331.0 246.3 177.5 1,595.1 754.8 0.0 0.0 0.0 0.0 0.0 0.0 0.0
Money market instruments 0.0 0.0 0.0 0.0 0.0 0.0 0.0 0.0 0.0 0.0 0.0 0.0 0.0 0.0 0.0
Credits 698.8 0.0 484.7 149.4 64.7 0.0 484.7 214.1 0.0 0.0 0.0 0.0 0.0 0.0 0.0
Currency and deposits 1,651.1 0.0 1,110.4 181.6 181.6 177.5 1,110.4 540.7 0.0 0.0 0.0 0.0 0.0 0.0 0.0
Other debt liabilities 1.0 1.0 0.0 0.0 0.0 0.0 0.0 0.0 0.0 0.0 0.0 0.0 0.0 0.0 0.0
Principal arrears 0.0 0.0 0.0 0.0 0.0 0.0 0.0 0.0 0.0 0.0 0.0 0.0 0.0 0.0 0.0
Interest arrears 1.0 1.0 0.0 0.0 0.0 0.0 0.0 0.0 0.0 0.0 0.0 0.0 0.0 0.0 0.0
Other 0.0 0.0 0.0 0.0 0.0 0.0 0.0 0.0 0.0 0.0 0.0 0.0 0.0 0.0 0.0
Long-term 7,610.4 0.0 693.8 362.5 589.2 325.7 693.8 2,108.6 1,644.8 670.5 768.4 420.8 374.9 873.8 54.8
Bonds 0.0 0.0 0.0 0.0 0.0 0.0 0.0 0.0 0.0 0.0 0.0 0.0 0.0 0.0 0.0
Credits 3,343.5 0.0 278.5 87.4 314.2 48.9 278.5 939.5 539.3 408.1 514.7 49.9 299.7 272.6 41.3

CNB BULLETIN • NUMBER 165 • STATISTICAL SURVEY • H INTERNATIONAL ECONOMIC RELATIONS 77
Table H14 Gross external debt by domestic sectors and pro-jected future payments • The table shows outstanding gross ex-ternal debt, projected principal payments and estimated interest payments according to the CNB’s midpoint exchange rate at the end of the period. Projected principal payments and estimated interest payments on currency and deposits of non-residents under item Banks are reported in accordance with the available monetary statistics data on original and remaining maturity.
Estimated interest payments do not include interest on repo transactions and hybrid and subordinated instruments, as well as late interest on these instruments (up to March 2010, estimated
interest payments did not also include interest on currency and deposits). Future interest payments of banks are estimated on the basis of contractual interest rates and do not reflect changes of variable interest rates. Future interest payments of other sec-tors are estimated on the basis of the benchmark interest rate applicable on the reporting date. Projected payments of accrued interest, which are an integral part of the gross external debt, in-crease the projected principal payments in the first quarter peri-od and, consequently, decrease the interest payments estimated for the same period.
Gross external
debt30/9/2010
Imme-diate
Projected future principal payments
Q4/10 Q1/11 Q2/11 Q3/11 2010 2011 2012 2013 2014 2015 2016 2017 Other
Currency and deposits 4,266.9 0.0 415.3 275.1 275.1 276.8 415.3 1,169.1 1,105.6 262.4 253.7 370.9 75.3 601.2 13.5
Other debt liabilities 0.0 0.0 0.0 0.0 0.0 0.0 0.0 0.0 0.0 0.0 0.0 0.0 0.0 0.0 0.0
4 Other sectors 21,616.2 1,026.5 1,629.2 1,222.8 1,152.8 998.1 1,629.2 4,552.3 2,418.0 2,714.6 1,263.1 1,187.8 1,173.6 1,397.3 4,253.5
Short-term 1,589.9 1,026.5 136.3 215.0 141.2 66.4 136.3 427.1 0.0 0.0 0.0 0.0 0.0 0.0 0.0
Money market instruments 0.0 0.0 0.0 0.0 0.0 0.0 0.0 0.0 0.0 0.0 0.0 0.0 0.0 0.0 0.0
Credits 522.2 0.0 136.3 215.0 100.0 66.4 136.3 385.8 0.0 0.0 0.0 0.0 0.0 0.0 0.0
Currency and deposits 0.0 0.0 0.0 0.0 0.0 0.0 0.0 0.0 0.0 0.0 0.0 0.0 0.0 0.0 0.0
Trade credits 41.2 0.0 0.0 0.0 41.2 0.0 0.0 41.2 0.0 0.0 0.0 0.0 0.0 0.0 0.0
Other debt liabilities 1,026.5 1,026.5 0.0 0.0 0.0 0.0 0.0 0.0 0.0 0.0 0.0 0.0 0.0 0.0 0.0
Principal arrears 867.7 867.7 0.0 0.0 0.0 0.0 0.0 0.0 0.0 0.0 0.0 0.0 0.0 0.0 0.0
Interest arrears 158.9 158.9 0.0 0.0 0.0 0.0 0.0 0.0 0.0 0.0 0.0 0.0 0.0 0.0 0.0
Other 0.0 0.0 0.0 0.0 0.0 0.0 0.0 0.0 0.0 0.0 0.0 0.0 0.0 0.0 0.0
Long-term 20,026.2 0.0 1,492.9 1,007.8 1,011.6 931.7 1,492.9 4,125.3 2,418.0 2,714.6 1,263.1 1,187.8 1,173.6 1,397.3 4,253.5
Bonds 1,591.6 0.0 45.9 294.6 0.0 0.0 45.9 311.0 284.0 29.6 29.6 29.6 321.9 540.1 0.0
Credits 18,140.7 0.0 1,379.1 560.9 955.2 929.8 1,379.1 3,602.7 2,124.0 2,680.6 1,233.5 1,158.1 851.8 857.3 4,253.5
Currency and deposits 0.0 0.0 0.0 0.0 0.0 0.0 0.0 0.0 0.0 0.0 0.0 0.0 0.0 0.0 0.0
Trade credits 293.9 0.0 67.9 152.3 56.4 1.9 67.9 211.6 10.1 4.4 0.0 0.0 0.0 0.0 0.0
Other debt liabilities 0.0 0.0 0.0 0.0 0.0 0.0 0.0 0.0 0.0 0.0 0.0 0.0 0.0 0.0 0.0
5 Direct investment 7,199.8 159.4 2,020.0 748.1 492.5 222.3 2,020.0 1,702.8 653.6 373.6 318.9 176.9 249.0 128.7 1,416.9
Short-term 625.7 159.4 154.5 130.9 156.0 22.5 154.5 311.8 0.0 0.0 0.0 0.0 0.0 0.0 0.0
Money market instruments 0.0 0.0 0.0 0.0 0.0 0.0 0.0 0.0 0.0 0.0 0.0 0.0 0.0 0.0 0.0
Credits 466.3 0.0 154.5 130.9 156.0 22.5 154.5 311.8 0.0 0.0 0.0 0.0 0.0 0.0 0.0
Trade credits 0.0 0.0 0.0 0.0 0.0 0.0 0.0 0.0 0.0 0.0 0.0 0.0 0.0 0.0 0.0
Other debt liabilities 159.4 159.4 0.0 0.0 0.0 0.0 0.0 0.0 0.0 0.0 0.0 0.0 0.0 0.0 0.0
Principal arrears 126.3 126.3 0.0 0.0 0.0 0.0 0.0 0.0 0.0 0.0 0.0 0.0 0.0 0.0 0.0
Interest arrears 33.1 33.1 0.0 0.0 0.0 0.0 0.0 0.0 0.0 0.0 0.0 0.0 0.0 0.0 0.0
Other 0.0 0.0 0.0 0.0 0.0 0.0 0.0 0.0 0.0 0.0 0.0 0.0 0.0 0.0 0.0
Long-term 6,574.1 0.0 1,865.5 617.2 336.6 199.8 1,865.5 1,390.9 653.6 373.6 318.9 176.9 249.0 128.7 1,416.9
Bonds 0.0 0.0 0.0 0.0 0.0 0.0 0.0 0.0 0.0 0.0 0.0 0.0 0.0 0.0 0.0
Credits 6,572.2 0.0 1,865.3 617.2 336.6 199.2 1,865.3 1,390.2 652.9 373.4 318.9 176.9 249.0 128.7 1,416.9
Trade credits 1.9 0.0 0.2 0.0 0.0 0.6 0.2 0.7 0.8 0.2 0.0 0.0 0.0 0.0 0.0
Other debt liabilities 0.0 0.0 0.0 0.0 0.0 0.0 0.0 0.0 0.0 0.0 0.0 0.0 0.0 0.0 0.0
Total (1+2+3+4+5) 44,619.4 1,187.0 6,116.9 3,426.0 2,547.0 1,768.3 6,116.9 10,053.8 4,874.2 3,923.1 2,994.1 2,774.3 1,904.2 2,475.8 8,316.0
o/w: Round trippinga 1,190.9 0.0 892.6 0.0 0.0 0.0 892.6 0.0 0.0 0.0 0.0 0.0 0.0 0.0 298.3
Supplement: Projected interest payments 191.7 253.7 280.0 247.2 191.7 1,054.7 894.5 789.9 652.9 537.6 426.8 349.4 2,108.6
o/w: Round tripping 2.7 0.0 0.0 0.0 2.7 0.0 0.0 0.0 0.0 0.0 0.0 0.0 341.7
a The rise in the external debt of the Republic of Croatia is attributed to the direct investment-related debt which comprises round-tripping transactions.

CNB BULLETIN • NUMBER 165 • STATISTICAL SURVEY • H INTERNATIONAL ECONOMIC RELATIONS78
Table H15 Gross external debt by other sectorsin million EUR
2005Dec.
2006Dec.
2007Dec.a
2008Dec.b,c
2009Dec.d*
2010
Mar.* Jun.* Jul.* Aug.* Sep.
1 Other sectors 8,176.4 10,500.1 14,743.1 19,835.7 21,328.7 21,438.9 21,521.5 21,716.4 21,793.6 21,616.2
Short-term 706.7 700.9 1,478.2 925.3 1,350.4 1,497.4 1,539.6 1,602.5 1,564.2 1,589.9
Money market instruments 0.0 0.0 0.0 0.0 0.0 0.0 0.0 0.0 0.0 0.0
Credits 133.0 155.0 681.0 652.9 677.2 659.3 538.9 580.9 548.9 522.2
Currency and deposits 0.0 0.0 0.0 0.0 0.0 0.0 0.0 0.0 0.0 0.0
Trade credits 27.8 35.9 31.1 39.5 28.2 37.6 40.5 45.1 41.3 41.2
Other debt liabilities 545.9 510.0 766.0 232.9 645.0 800.4 960.1 976.5 974.1 1,026.5
Principal arrears 502.1 460.6 683.4 170.4 525.4 668.5 803.2 819.3 819.8 867.7
Interest arrears 43.8 49.4 82.6 62.5 119.6 131.9 156.9 157.3 154.3 158.9
Other 0.0 0.0 0.0 0.0 0.0 0.0 0.0 0.0 0.0 0.0
Long-term 7,469.7 9,799.3 13,264.9 18,910.5 19,978.4 19,941.6 19,981.9 20,113.9 20,229.4 20,026.2
Bonds 763.9 837.8 1,208.3 1,186.4 1,611.1 1,599.4 1,589.1 1,582.1 1,597.8 1,591.6
Credits 6,542.1 8,816.1 11,766.9 17,391.3 18,079.2 18,050.6 18,111.9 18,237.8 18,328.4 18,140.7
Currency and deposits 0.0 0.0 0.0 10.6 0.0 0.0 0.0 0.0 0.0 0.0
Trade credits 163.7 145.4 289.8 322.2 288.1 291.6 281.0 294.0 303.2 293.9
Other debt liabilities 0.0 0.0 0.0 0.0 0.0 0.0 0.0 0.0 0.0 0.0
1.1 Other banking institutions 25.7 0.0 0.0 0.0 0.0 0.0 0.0 0.0 0.0 0.0
Short-term 0.0 0.0 0.0 0.0 0.0 0.0 0.0 0.0 0.0 0.0
Money market instruments 0.0 0.0 0.0 0.0 0.0 0.0 0.0 0.0 0.0 0.0
Credits 0.0 0.0 0.0 0.0 0.0 0.0 0.0 0.0 0.0 0.0
Currency and deposits 0.0 0.0 0.0 0.0 0.0 0.0 0.0 0.0 0.0 0.0
Other debt liabilities 0.0 0.0 0.0 0.0 0.0 0.0 0.0 0.0 0.0 0.0
Principal arrears 0.0 0.0 0.0 0.0 0.0 0.0 0.0 0.0 0.0 0.0
Interest arrears 0.0 0.0 0.0 0.0 0.0 0.0 0.0 0.0 0.0 0.0
Other 0.0 0.0 0.0 0.0 0.0 0.0 0.0 0.0 0.0 0.0
Long-term 25.7 0.0 0.0 0.0 0.0 0.0 0.0 0.0 0.0 0.0
Bonds 0.0 0.0 0.0 0.0 0.0 0.0 0.0 0.0 0.0 0.0
Credits 25.7 0.0 0.0 0.0 0.0 0.0 0.0 0.0 0.0 0.0
Currency and deposits 0.0 0.0 0.0 0.0 0.0 0.0 0.0 0.0 0.0 0.0
Other debt liabilities 0.0 0.0 0.0 0.0 0.0 0.0 0.0 0.0 0.0 0.0
1.2 Non-banking financial institutions 2,132.1 2,871.4 3,922.0 4,949.7 5,396.1 5,127.4 4,973.1 4,964.4 5,017.3 4,759.8
Short-term 19.6 60.1 201.6 155.4 436.3 336.9 198.3 171.9 172.9 152.7
Money market instruments 0.0 0.0 0.0 0.0 0.0 0.0 0.0 0.0 0.0 0.0
Credits 14.3 46.5 184.5 144.5 431.8 332.2 192.6 166.4 167.7 147.6
Currency and deposits 0.0 0.0 0.0 0.0 0.0 0.0 0.0 0.0 0.0 0.0
Trade credits 0.0 0.0 0.0 0.0 0.0 0.0 0.0 0.0 0.0 0.0
Other debt liabilities 5.3 13.6 17.1 10.9 4.5 4.7 5.7 5.6 5.2 5.2
Principal arrears 2.9 6.4 2.9 4.2 1.3 1.4 1.6 1.9 1.8 1.8
Interest arrears 2.4 7.2 14.2 6.7 3.2 3.3 4.1 3.6 3.4 3.4
Other 0.0 0.0 0.0 0.0 0.0 0.0 0.0 0.0 0.0 0.0
Long-term 2,112.5 2,811.3 3,720.4 4,794.3 4,959.8 4,790.5 4,774.8 4,792.4 4,844.4 4,607.1
Bonds 388.6 531.4 806.7 791.5 1,014.7 1,003.4 998.9 1,003.3 1,007.6 994.2
Credits 1,723.8 2,279.9 2,913.7 3,992.3 3,945.1 3,787.0 3,775.9 3,789.2 3,836.8 3,612.8
Currency and deposits 0.0 0.0 0.0 10.6 0.0 0.0 0.0 0.0 0.0 0.0
Trade credits 0.0 0.0 0.0 0.0 0.0 0.0 0.0 0.0 0.0 0.0
Other debt liabilities 0.0 0.0 0.0 0.0 0.0 0.0 0.0 0.0 0.0 0.0
1.3 Public enterprises 1,121.9 1,168.5 1,997.4 3,945.4 5,177.9 5,454.7 5,644.7 5,899.9 5,943.3 6,010.6
Short-term 13.3 31.6 48.3 145.1 77.7 107.2 151.5 255.7 258.1 252.4
Money market instruments 0.0 0.0 0.0 0.0 0.0 0.0 0.0 0.0 0.0 0.0
Credits 0.0 15.2 35.4 132.4 34.8 62.1 104.2 183.7 185.7 181.4
Trade credits 0.0 0.0 0.0 0.0 0.0 0.0 0.0 0.0 0.0 0.0
Other debt liabilities 13.3 16.4 12.9 12.7 42.8 45.1 47.3 71.9 72.4 71.0

CNB BULLETIN • NUMBER 165 • STATISTICAL SURVEY • H INTERNATIONAL ECONOMIC RELATIONS 79
2005Dec.
2006Dec.
2007Dec.a
2008Dec.b,c
2009Dec.d*
2010
Mar.* Jun.* Jul.* Aug.* Sep.
Principal arrears 12.5 14.5 12.5 11.8 39.3 41.2 43.8 68.4 68.8 67.4
Interest arrears 0.8 1.9 0.5 0.9 3.6 3.9 3.5 3.6 3.6 3.6
Other 0.0 0.0 0.0 0.0 0.0 0.0 0.0 0.0 0.0 0.0
Long-term 1,108.6 1,136.9 1,949.0 3,800.4 5,100.2 5,347.5 5,493.2 5,644.2 5,685.2 5,758.2
Bonds 0.0 0.0 296.2 301.2 304.2 307.4 311.7 296.6 297.8 297.9
Credits 1,026.8 1,066.8 1,470.2 3,254.7 4,528.3 4,768.2 4,920.1 5,072.7 5,103.2 5,185.2
Trade credits 81.8 70.1 182.7 244.5 267.8 272.0 261.5 274.9 284.2 275.2
Other debt liabilities 0.0 0.0 0.0 0.0 0.0 0.0 0.0 0.0 0.0 0.0
1.4 Mixed enterprises 328.8 416.5 594.9 741.6 0.0 0.0 0.0 0.0 0.0 0.0
Short-term 5.3 6.3 16.5 1.2 0.0 0.0 0.0 0.0 0.0 0.0
Money market instruments 0.0 0.0 0.0 0.0 0.0 0.0 0.0 0.0 0.0 0.0
Credits 2.3 0.0 0.0 0.0 0.0 0.0 0.0 0.0 0.0 0.0
Trade credits 0.0 0.0 0.0 0.0 0.0 0.0 0.0 0.0 0.0 0.0
Other debt liabilities 3.0 6.3 16.5 1.2 0.0 0.0 0.0 0.0 0.0 0.0
Principal arrears 2.9 6.1 16.4 1.1 0.0 0.0 0.0 0.0 0.0 0.0
Interest arrears 0.2 0.2 0.1 0.2 0.0 0.0 0.0 0.0 0.0 0.0
Other 0.0 0.0 0.0 0.0 0.0 0.0 0.0 0.0 0.0 0.0
Long-term 323.5 410.2 578.4 740.4 0.0 0.0 0.0 0.0 0.0 0.0
Bonds 0.0 0.0 0.0 0.0 0.0 0.0 0.0 0.0 0.0 0.0
Credits 297.1 394.3 557.1 717.7 0.0 0.0 0.0 0.0 0.0 0.0
Trade credits 26.4 15.9 21.3 22.7 0.0 0.0 0.0 0.0 0.0 0.0
Other debt liabilities 0.0 0.0 0.0 0.0 0.0 0.0 0.0 0.0 0.0 0.0
1.5 Other enterprises 4,454.5 5,929.1 8,062.2 9,933.4 10,474.9 10,588.3 10,648.4 10,612.7 10,603.1 10,621.5
Short-term 653.7 578.8 1,174.3 619.2 804.0 1,018.6 1,173.2 1,158.2 1,126.5 1,178.9
Money market instruments 0.0 0.0 0.0 0.0 0.0 0.0 0.0 0.0 0.0 0.0
Credits 114.8 86.9 451.2 373.8 178.2 230.4 225.5 214.1 188.7 187.3
Trade credits 27.8 35.9 31.1 39.5 28.2 37.6 40.5 45.1 41.3 41.2
Other debt liabilities 511.1 456.0 692.0 205.9 597.6 750.6 907.1 899.0 896.5 950.3
Principal arrears 473.4 420.3 630.2 151.2 484.8 625.9 757.8 749.0 749.2 798.5
Interest arrears 37.7 35.7 61.8 54.7 112.9 124.7 149.3 150.0 147.2 151.9
Other 0.0 0.0 0.0 0.0 0.0 0.0 0.0 0.0 0.0 0.0
Long-term 3,800.9 5,350.3 6,887.9 9,314.2 9,670.9 9,569.6 9,475.3 9,454.5 9,476.6 9,442.6
Bonds 375.3 306.4 105.4 93.8 292.2 288.6 278.6 282.2 292.4 299.5
Credits 3,377.5 4,989.1 6,701.7 9,168.7 9,358.7 9,261.7 9,177.5 9,153.3 9,165.4 9,124.5
Trade credits 48.1 54.8 80.8 51.7 20.0 19.4 19.2 19.0 18.9 18.6
Other debt liabilities 0.0 0.0 0.0 0.0 0.0 0.0 0.0 0.0 0.0 0.0
1.6 Non-profit institutions 4.9 5.3 5.4 3.8 3.6 3.0 2.8 2.7 2.7 2.7
1.7 Craftsmen and sole traders 35.2 26.8 24.1 17.1 11.5 10.2 9.5 9.1 8.9 7.9
1.8 Households 73.3 82.7 137.2 244.7 264.8 255.4 243.0 227.7 218.4 213.7
a The relevant comparable data as at 31 December 2007, published in Bulletin No. 146, should be used for the calculation of the external debt growth rate in 2008. b From January 2008 on, the data of non-financial enterprises are estimated on the basis of the data collected from the sample. c The relevant comparable data as at 31 December 2008, published in Bulletin No. 161, should be used for the calculation of the external debt growth rate in 2009. d From January 2009 on, the data of non-banking financial institutions and non-financial enterprises are processed with the help of the new reporting system (INOK) which uses market interest rates to calculate the balance and the schedule of interest payments. The comparable balance as at 31 December 2008 has been calculated by applying the same methodology (published in Bulletin No. 161).
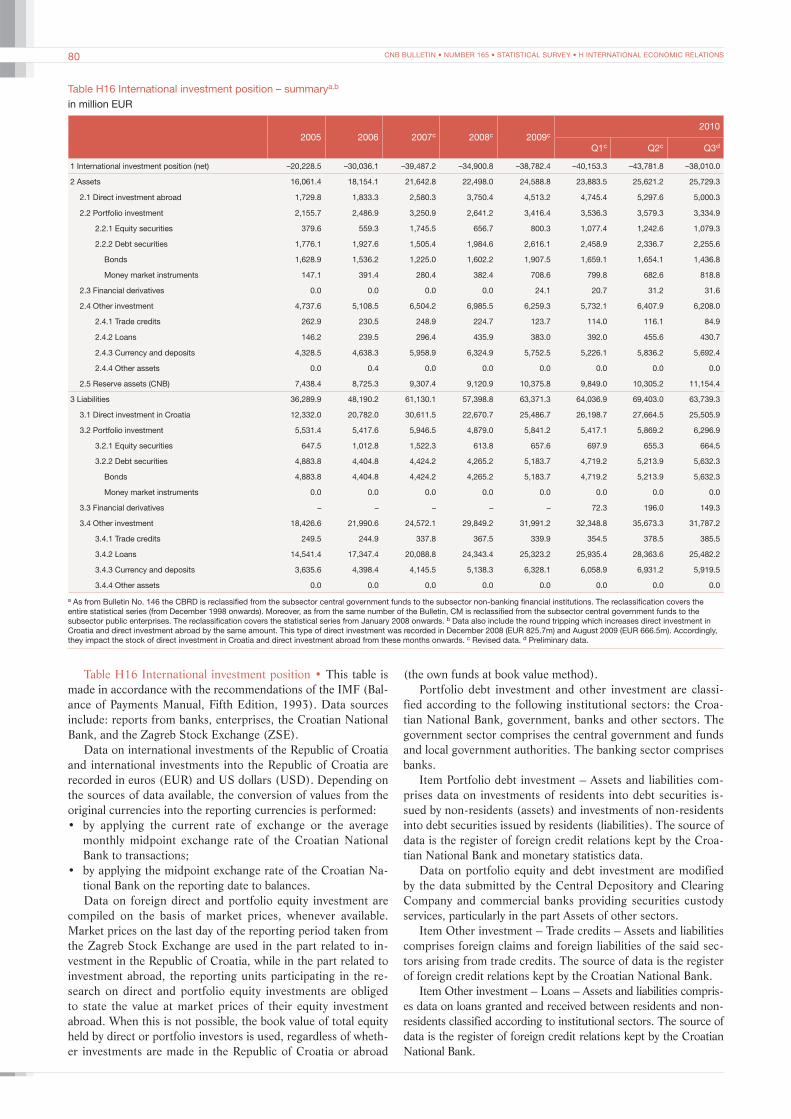
CNB BULLETIN • NUMBER 165 • STATISTICAL SURVEY • H INTERNATIONAL ECONOMIC RELATIONS80
Table H16 International investment position – summarya,b
in million EUR
2005 2006 2007c 2008c 2009c2010
Q1c Q2c Q3d
1 International investment position (net) –20,228.5 –30,036.1 –39,487.2 –34,900.8 –38,782.4 –40,153.3 –43,781.8 –38,010.0
2 Assets 16,061.4 18,154.1 21,642.8 22,498.0 24,588.8 23,883.5 25,621.2 25,729.3
2.1 Direct investment abroad 1,729.8 1,833.3 2,580.3 3,750.4 4,513.2 4,745.4 5,297.6 5,000.3
2.2 Portfolio investment 2,155.7 2,486.9 3,250.9 2,641.2 3,416.4 3,536.3 3,579.3 3,334.9
2.2.1 Equity securities 379.6 559.3 1,745.5 656.7 800.3 1,077.4 1,242.6 1,079.3
2.2.2 Debt securities 1,776.1 1,927.6 1,505.4 1,984.6 2,616.1 2,458.9 2,336.7 2,255.6
Bonds 1,628.9 1,536.2 1,225.0 1,602.2 1,907.5 1,659.1 1,654.1 1,436.8
Money market instruments 147.1 391.4 280.4 382.4 708.6 799.8 682.6 818.8
2.3 Financial derivatives 0.0 0.0 0.0 0.0 24.1 20.7 31.2 31.6
2.4 Other investment 4,737.6 5,108.5 6,504.2 6,985.5 6,259.3 5,732.1 6,407.9 6,208.0
2.4.1 Trade credits 262.9 230.5 248.9 224.7 123.7 114.0 116.1 84.9
2.4.2 Loans 146.2 239.5 296.4 435.9 383.0 392.0 455.6 430.7
2.4.3 Currency and deposits 4,328.5 4,638.3 5,958.9 6,324.9 5,752.5 5,226.1 5,836.2 5,692.4
2.4.4 Other assets 0.0 0.4 0.0 0.0 0.0 0.0 0.0 0.0
2.5 Reserve assets (CNB) 7,438.4 8,725.3 9,307.4 9,120.9 10,375.8 9,849.0 10,305.2 11,154.4
3 Liabilities 36,289.9 48,190.2 61,130.1 57,398.8 63,371.3 64,036.9 69,403.0 63,739.3
3.1 Direct investment in Croatia 12,332.0 20,782.0 30,611.5 22,670.7 25,486.7 26,198.7 27,664.5 25,505.9
3.2 Portfolio investment 5,531.4 5,417.6 5,946.5 4,879.0 5,841.2 5,417.1 5,869.2 6,296.9
3.2.1 Equity securities 647.5 1,012.8 1,522.3 613.8 657.6 697.9 655.3 664.5
3.2.2 Debt securities 4,883.8 4,404.8 4,424.2 4,265.2 5,183.7 4,719.2 5,213.9 5,632.3
Bonds 4,883.8 4,404.8 4,424.2 4,265.2 5,183.7 4,719.2 5,213.9 5,632.3
Money market instruments 0.0 0.0 0.0 0.0 0.0 0.0 0.0 0.0
3.3 Financial derivatives – – – – – 72.3 196.0 149.3
3.4 Other investment 18,426.6 21,990.6 24,572.1 29,849.2 31,991.2 32,348.8 35,673.3 31,787.2
3.4.1 Trade credits 249.5 244.9 337.8 367.5 339.9 354.5 378.5 385.5
3.4.2 Loans 14,541.4 17,347.4 20,088.8 24,343.4 25,323.2 25,935.4 28,363.6 25,482.2
3.4.3 Currency and deposits 3,635.6 4,398.4 4,145.5 5,138.3 6,328.1 6,058.9 6,931.2 5,919.5
3.4.4 Other assets 0.0 0.0 0.0 0.0 0.0 0.0 0.0 0.0
a As from Bulletin No. 146 the CBRD is reclassified from the subsector central government funds to the subsector non-banking financial institutions. The reclassification covers the entire statistical series (from December 1998 onwards). Moreover, as from the same number of the Bulletin, CM is reclassified from the subsector central government funds to the subsector public enterprises. The reclassification covers the statistical series from January 2008 onwards. b Data also include the round tripping which increases direct investment in Croatia and direct investment abroad by the same amount. This type of direct investment was recorded in December 2008 (EUR 825.7m) and August 2009 (EUR 666.5m). Accordingly, they impact the stock of direct investment in Croatia and direct investment abroad from these months onwards. c Revised data. d Preliminary data.
Table H16 International investment position • This table is made in accordance with the recommendations of the IMF (Bal-ance of Payments Manual, Fifth Edition, 1993). Data sources include: reports from banks, enterprises, the Croatian National Bank, and the Zagreb Stock Exchange (ZSE).
Data on international investments of the Republic of Croatia and international investments into the Republic of Croatia are recorded in euros (EUR) and US dollars (USD). Depending on the sources of data available, the conversion of values from the original currencies into the reporting currencies is performed:• by applying the current rate of exchange or the average
monthly midpoint exchange rate of the Croatian National Bank to transactions;
• by applying the midpoint exchange rate of the Croatian Na-tional Bank on the reporting date to balances.Data on foreign direct and portfolio equity investment are
compiled on the basis of market prices, whenever available. Market prices on the last day of the reporting period taken from the Zagreb Stock Exchange are used in the part related to in-vestment in the Republic of Croatia, while in the part related to investment abroad, the reporting units participating in the re-search on direct and portfolio equity investments are obliged to state the value at market prices of their equity investment abroad. When this is not possible, the book value of total equity held by direct or portfolio investors is used, regardless of wheth-er investments are made in the Republic of Croatia or abroad
(the own funds at book value method).Portfolio debt investment and other investment are classi-
fied according to the following institutional sectors: the Croa-tian National Bank, government, banks and other sectors. The government sector comprises the central government and funds and local government authorities. The banking sector comprises banks.
Item Portfolio debt investment – Assets and liabilities com-prises data on investments of residents into debt securities is-sued by non-residents (assets) and investments of non-residents into debt securities issued by residents (liabilities). The source of data is the register of foreign credit relations kept by the Croa-tian National Bank and monetary statistics data.
Data on portfolio equity and debt investment are modified by the data submitted by the Central Depository and Clearing Company and commercial banks providing securities custody services, particularly in the part Assets of other sectors.
Item Other investment – Trade credits – Assets and liabilities comprises foreign claims and foreign liabilities of the said sec-tors arising from trade credits. The source of data is the register of foreign credit relations kept by the Croatian National Bank.
Item Other investment – Loans – Assets and liabilities compris-es data on loans granted and received between residents and non-residents classified according to institutional sectors. The source of data is the register of foreign credit relations kept by the Croatian National Bank.
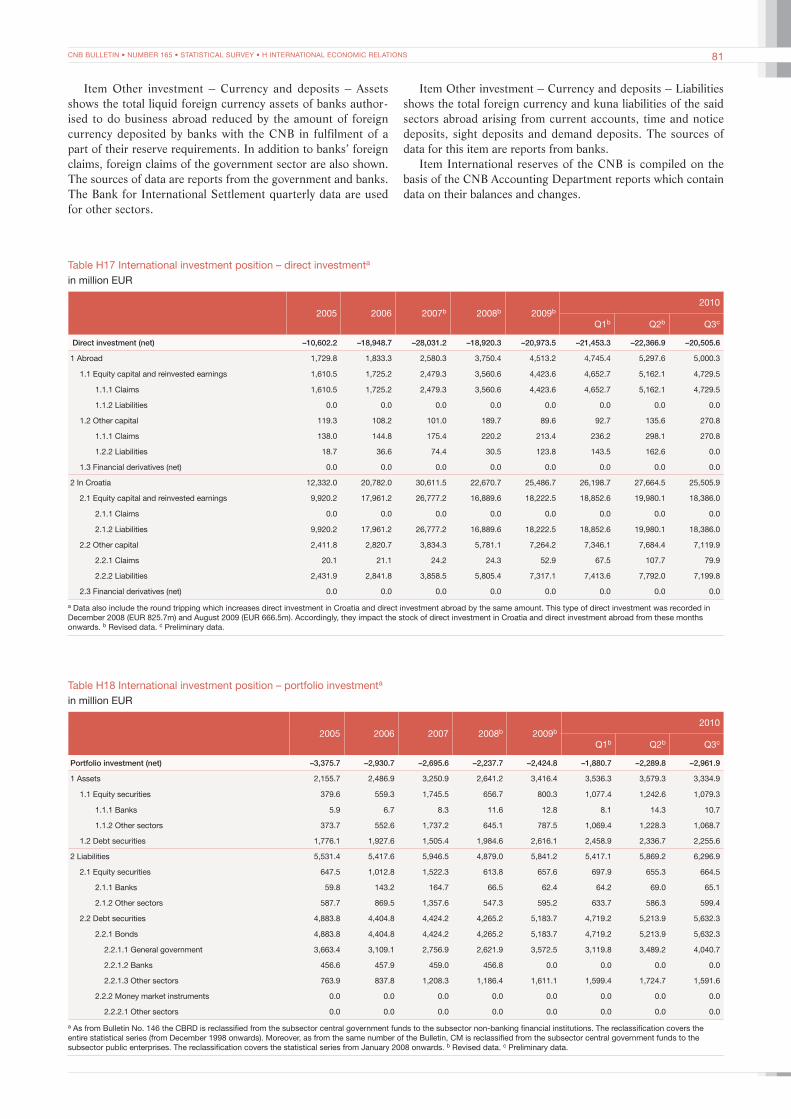
CNB BULLETIN • NUMBER 165 • STATISTICAL SURVEY • H INTERNATIONAL ECONOMIC RELATIONS 81
Table H17 International investment position – direct investmenta
in million EUR
2005 2006 2007b 2008b 2009b2010
Q1b Q2b Q3c
Direct investment (net) –10,602.2 –18,948.7 –28,031.2 –18,920.3 –20,973.5 –21,453.3 –22,366.9 –20,505.6
1 Abroad 1,729.8 1,833.3 2,580.3 3,750.4 4,513.2 4,745.4 5,297.6 5,000.3
1.1 Equity capital and reinvested earnings 1,610.5 1,725.2 2,479.3 3,560.6 4,423.6 4,652.7 5,162.1 4,729.5
1.1.1 Claims 1,610.5 1,725.2 2,479.3 3,560.6 4,423.6 4,652.7 5,162.1 4,729.5
1.1.2 Liabilities 0.0 0.0 0.0 0.0 0.0 0.0 0.0 0.0
1.2 Other capital 119.3 108.2 101.0 189.7 89.6 92.7 135.6 270.8
1.1.1 Claims 138.0 144.8 175.4 220.2 213.4 236.2 298.1 270.8
1.2.2 Liabilities 18.7 36.6 74.4 30.5 123.8 143.5 162.6 0.0
1.3 Financial derivatives (net) 0.0 0.0 0.0 0.0 0.0 0.0 0.0 0.0
2 In Croatia 12,332.0 20,782.0 30,611.5 22,670.7 25,486.7 26,198.7 27,664.5 25,505.9
2.1 Equity capital and reinvested earnings 9,920.2 17,961.2 26,777.2 16,889.6 18,222.5 18,852.6 19,980.1 18,386.0
2.1.1 Claims 0.0 0.0 0.0 0.0 0.0 0.0 0.0 0.0
2.1.2 Liabilities 9,920.2 17,961.2 26,777.2 16,889.6 18,222.5 18,852.6 19,980.1 18,386.0
2.2 Other capital 2,411.8 2,820.7 3,834.3 5,781.1 7,264.2 7,346.1 7,684.4 7,119.9
2.2.1 Claims 20.1 21.1 24.2 24.3 52.9 67.5 107.7 79.9
2.2.2 Liabilities 2,431.9 2,841.8 3,858.5 5,805.4 7,317.1 7,413.6 7,792.0 7,199.8
2.3 Financial derivatives (net) 0.0 0.0 0.0 0.0 0.0 0.0 0.0 0.0
a Data also include the round tripping which increases direct investment in Croatia and direct investment abroad by the same amount. This type of direct investment was recorded in December 2008 (EUR 825.7m) and August 2009 (EUR 666.5m). Accordingly, they impact the stock of direct investment in Croatia and direct investment abroad from these months onwards. b Revised data. c Preliminary data.
Item Other investment – Currency and deposits – Assets shows the total liquid foreign currency assets of banks author-ised to do business abroad reduced by the amount of foreign currency deposited by banks with the CNB in fulfilment of a part of their reserve requirements. In addition to banks’ foreign claims, foreign claims of the government sector are also shown. The sources of data are reports from the government and banks. The Bank for International Settlement quarterly data are used for other sectors.
Item Other investment – Currency and deposits – Liabilities shows the total foreign currency and kuna liabilities of the said sectors abroad arising from current accounts, time and notice deposits, sight deposits and demand deposits. The sources of data for this item are reports from banks.
Item International reserves of the CNB is compiled on the basis of the CNB Accounting Department reports which contain data on their balances and changes.
Table H18 International investment position – portfolio investmenta
in million EUR
2005 2006 2007 2008b 2009b2010
Q1b Q2b Q3c
Portfolio investment (net) –3,375.7 –2,930.7 –2,695.6 –2,237.7 –2,424.8 –1,880.7 –2,289.8 –2,961.9
1 Assets 2,155.7 2,486.9 3,250.9 2,641.2 3,416.4 3,536.3 3,579.3 3,334.9
1.1 Equity securities 379.6 559.3 1,745.5 656.7 800.3 1,077.4 1,242.6 1,079.3
1.1.1 Banks 5.9 6.7 8.3 11.6 12.8 8.1 14.3 10.7
1.1.2 Other sectors 373.7 552.6 1,737.2 645.1 787.5 1,069.4 1,228.3 1,068.7
1.2 Debt securities 1,776.1 1,927.6 1,505.4 1,984.6 2,616.1 2,458.9 2,336.7 2,255.6
2 Liabilities 5,531.4 5,417.6 5,946.5 4,879.0 5,841.2 5,417.1 5,869.2 6,296.9
2.1 Equity securities 647.5 1,012.8 1,522.3 613.8 657.6 697.9 655.3 664.5
2.1.1 Banks 59.8 143.2 164.7 66.5 62.4 64.2 69.0 65.1
2.1.2 Other sectors 587.7 869.5 1,357.6 547.3 595.2 633.7 586.3 599.4
2.2 Debt securities 4,883.8 4,404.8 4,424.2 4,265.2 5,183.7 4,719.2 5,213.9 5,632.3
2.2.1 Bonds 4,883.8 4,404.8 4,424.2 4,265.2 5,183.7 4,719.2 5,213.9 5,632.3
2.2.1.1 General government 3,663.4 3,109.1 2,756.9 2,621.9 3,572.5 3,119.8 3,489.2 4,040.7
2.2.1.2 Banks 456.6 457.9 459.0 456.8 0.0 0.0 0.0 0.0
2.2.1.3 Other sectors 763.9 837.8 1,208.3 1,186.4 1,611.1 1,599.4 1,724.7 1,591.6
2.2.2 Money market instruments 0.0 0.0 0.0 0.0 0.0 0.0 0.0 0.0
2.2.2.1 Other sectors 0.0 0.0 0.0 0.0 0.0 0.0 0.0 0.0
a As from Bulletin No. 146 the CBRD is reclassified from the subsector central government funds to the subsector non-banking financial institutions. The reclassification covers the entire statistical series (from December 1998 onwards). Moreover, as from the same number of the Bulletin, CM is reclassified from the subsector central government funds to the subsector public enterprises. The reclassification covers the statistical series from January 2008 onwards. b Revised data. c Preliminary data.
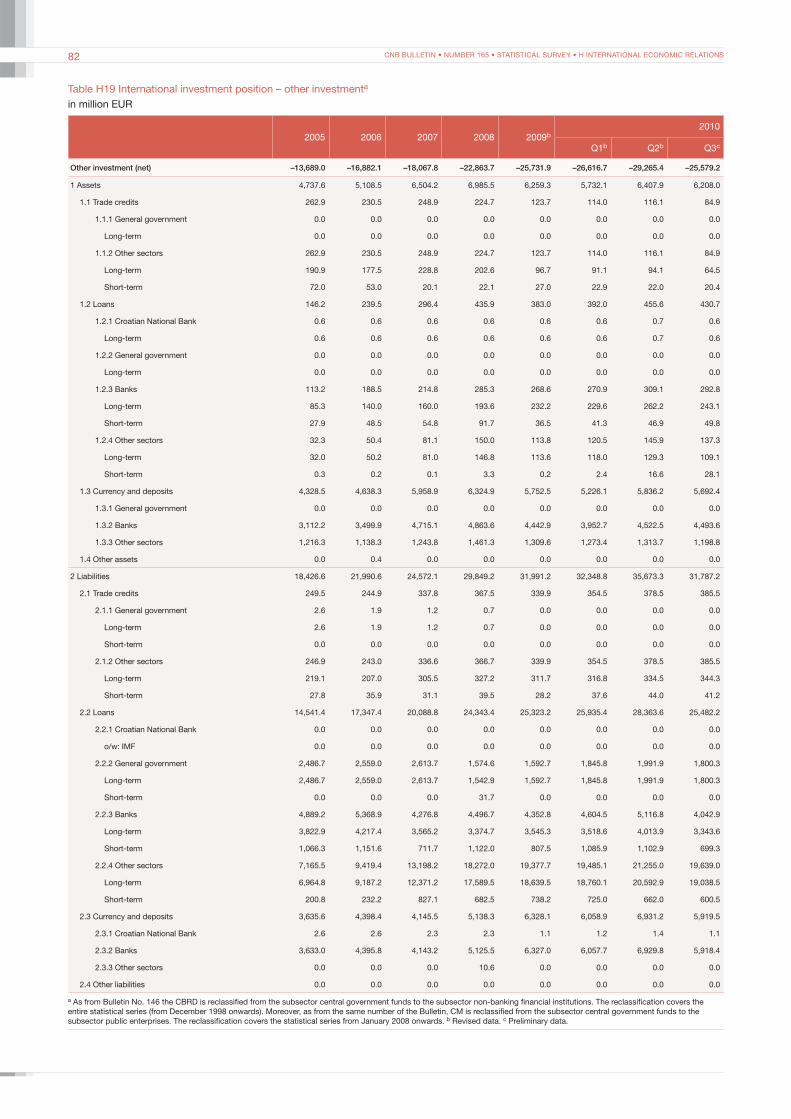
CNB BULLETIN • NUMBER 165 • STATISTICAL SURVEY • H INTERNATIONAL ECONOMIC RELATIONS82
Table H19 International investment position – other investmenta
in million EUR
2005 2006 2007 2008 2009b2010
Q1b Q2b Q3c
Other investment (net) –13,689.0 –16,882.1 –18,067.8 –22,863.7 –25,731.9 –26,616.7 –29,265.4 –25,579.2
1 Assets 4,737.6 5,108.5 6,504.2 6,985.5 6,259.3 5,732.1 6,407.9 6,208.0
1.1 Trade credits 262.9 230.5 248.9 224.7 123.7 114.0 116.1 84.9
1.1.1 General government 0.0 0.0 0.0 0.0 0.0 0.0 0.0 0.0
Long-term 0.0 0.0 0.0 0.0 0.0 0.0 0.0 0.0
1.1.2 Other sectors 262.9 230.5 248.9 224.7 123.7 114.0 116.1 84.9
Long-term 190.9 177.5 228.8 202.6 96.7 91.1 94.1 64.5
Short-term 72.0 53.0 20.1 22.1 27.0 22.9 22.0 20.4
1.2 Loans 146.2 239.5 296.4 435.9 383.0 392.0 455.6 430.7
1.2.1 Croatian National Bank 0.6 0.6 0.6 0.6 0.6 0.6 0.7 0.6
Long-term 0.6 0.6 0.6 0.6 0.6 0.6 0.7 0.6
1.2.2 General government 0.0 0.0 0.0 0.0 0.0 0.0 0.0 0.0
Long-term 0.0 0.0 0.0 0.0 0.0 0.0 0.0 0.0
1.2.3 Banks 113.2 188.5 214.8 285.3 268.6 270.9 309.1 292.8
Long-term 85.3 140.0 160.0 193.6 232.2 229.6 262.2 243.1
Short-term 27.9 48.5 54.8 91.7 36.5 41.3 46.9 49.8
1.2.4 Other sectors 32.3 50.4 81.1 150.0 113.8 120.5 145.9 137.3
Long-term 32.0 50.2 81.0 146.8 113.6 118.0 129.3 109.1
Short-term 0.3 0.2 0.1 3.3 0.2 2.4 16.6 28.1
1.3 Currency and deposits 4,328.5 4,638.3 5,958.9 6,324.9 5,752.5 5,226.1 5,836.2 5,692.4
1.3.1 General government 0.0 0.0 0.0 0.0 0.0 0.0 0.0 0.0
1.3.2 Banks 3,112.2 3,499.9 4,715.1 4,863.6 4,442.9 3,952.7 4,522.5 4,493.6
1.3.3 Other sectors 1,216.3 1,138.3 1,243.8 1,461.3 1,309.6 1,273.4 1,313.7 1,198.8
1.4 Other assets 0.0 0.4 0.0 0.0 0.0 0.0 0.0 0.0
2 Liabilities 18,426.6 21,990.6 24,572.1 29,849.2 31,991.2 32,348.8 35,673.3 31,787.2
2.1 Trade credits 249.5 244.9 337.8 367.5 339.9 354.5 378.5 385.5
2.1.1 General government 2.6 1.9 1.2 0.7 0.0 0.0 0.0 0.0
Long-term 2.6 1.9 1.2 0.7 0.0 0.0 0.0 0.0
Short-term 0.0 0.0 0.0 0.0 0.0 0.0 0.0 0.0
2.1.2 Other sectors 246.9 243.0 336.6 366.7 339.9 354.5 378.5 385.5
Long-term 219.1 207.0 305.5 327.2 311.7 316.8 334.5 344.3
Short-term 27.8 35.9 31.1 39.5 28.2 37.6 44.0 41.2
2.2 Loans 14,541.4 17,347.4 20,088.8 24,343.4 25,323.2 25,935.4 28,363.6 25,482.2
2.2.1 Croatian National Bank 0.0 0.0 0.0 0.0 0.0 0.0 0.0 0.0
o/w: IMF 0.0 0.0 0.0 0.0 0.0 0.0 0.0 0.0
2.2.2 General government 2,486.7 2,559.0 2,613.7 1,574.6 1,592.7 1,845.8 1,991.9 1,800.3
Long-term 2,486.7 2,559.0 2,613.7 1,542.9 1,592.7 1,845.8 1,991.9 1,800.3
Short-term 0.0 0.0 0.0 31.7 0.0 0.0 0.0 0.0
2.2.3 Banks 4,889.2 5,368.9 4,276.8 4,496.7 4,352.8 4,604.5 5,116.8 4,042.9
Long-term 3,822.9 4,217.4 3,565.2 3,374.7 3,545.3 3,518.6 4,013.9 3,343.6
Short-term 1,066.3 1,151.6 711.7 1,122.0 807.5 1,085.9 1,102.9 699.3
2.2.4 Other sectors 7,165.5 9,419.4 13,198.2 18,272.0 19,377.7 19,485.1 21,255.0 19,639.0
Long-term 6,964.8 9,187.2 12,371.2 17,589.5 18,639.5 18,760.1 20,592.9 19,038.5
Short-term 200.8 232.2 827.1 682.5 738.2 725.0 662.0 600.5
2.3 Currency and deposits 3,635.6 4,398.4 4,145.5 5,138.3 6,328.1 6,058.9 6,931.2 5,919.5
2.3.1 Croatian National Bank 2.6 2.6 2.3 2.3 1.1 1.2 1.4 1.1
2.3.2 Banks 3,633.0 4,395.8 4,143.2 5,125.5 6,327.0 6,057.7 6,929.8 5,918.4
2.3.3 Other sectors 0.0 0.0 0.0 10.6 0.0 0.0 0.0 0.0
2.4 Other liabilities 0.0 0.0 0.0 0.0 0.0 0.0 0.0 0.0
a As from Bulletin No. 146 the CBRD is reclassified from the subsector central government funds to the subsector non-banking financial institutions. The reclassification covers the entire statistical series (from December 1998 onwards). Moreover, as from the same number of the Bulletin, CM is reclassified from the subsector central government funds to the subsector public enterprises. The reclassification covers the statistical series from January 2008 onwards. b Revised data. c Preliminary data.
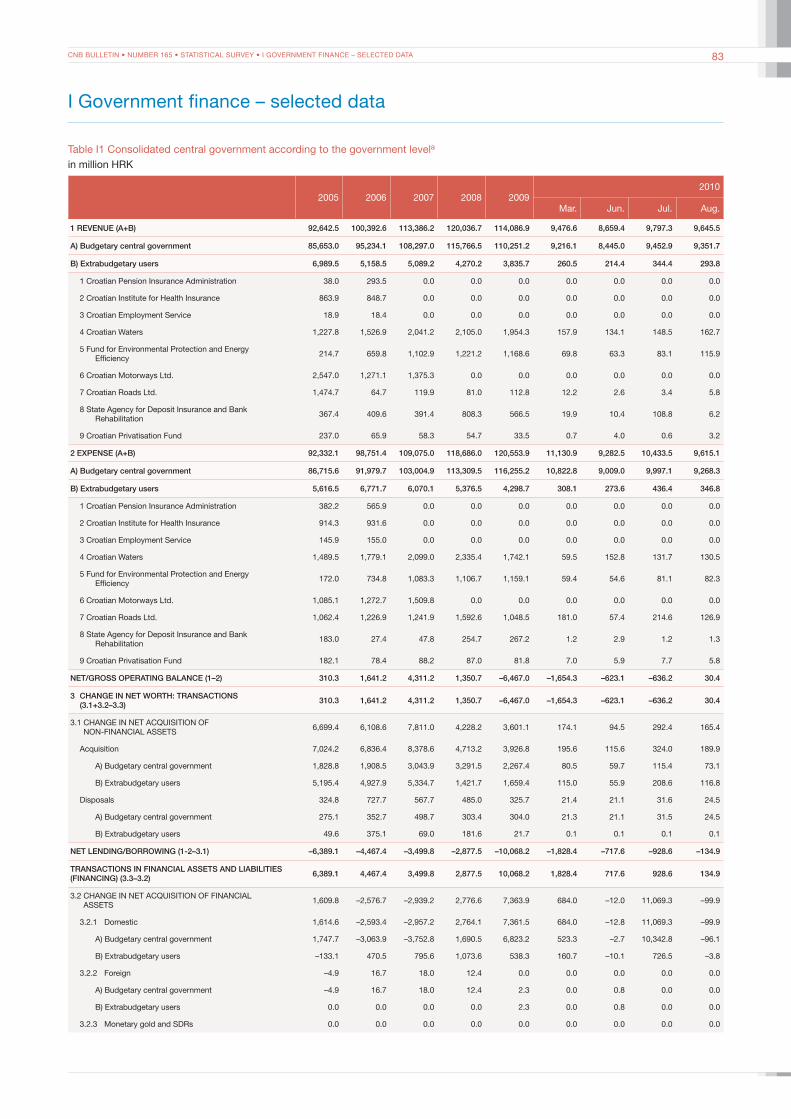
CNB BULLETIN • NUMBER 165 • STATISTICAL SURVEY • I GOVERNMENT FINANCE – SELECTED DATA 83
I Government finance – selected data
Table I1 Consolidated central government according to the government levela
in million HRK
2005 2006 2007 2008 20092010
Mar. Jun. Jul. Aug.
1 REVENUE (A+B) 92,642.5 100,392.6 113,386.2 120,036.7 114,086.9 9,476.6 8,659.4 9,797.3 9,645.5
A) Budgetary central government 85,653.0 95,234.1 108,297.0 115,766.5 110,251.2 9,216.1 8,445.0 9,452.9 9,351.7
B) Extrabudgetary users 6,989.5 5,158.5 5,089.2 4,270.2 3,835.7 260.5 214.4 344.4 293.8
1 Croatian Pension Insurance Administration 38.0 293.5 0.0 0.0 0.0 0.0 0.0 0.0 0.0
2 Croatian Institute for Health Insurance 863.9 848.7 0.0 0.0 0.0 0.0 0.0 0.0 0.0
3 Croatian Employment Service 18.9 18.4 0.0 0.0 0.0 0.0 0.0 0.0 0.0
4 Croatian Waters 1,227.8 1,526.9 2,041.2 2,105.0 1,954.3 157.9 134.1 148.5 162.7
5 Fund for Environmental Protection and Energy Efficiency 214.7 659.8 1,102.9 1,221.2 1,168.6 69.8 63.3 83.1 115.9
6 Croatian Motorways Ltd. 2,547.0 1,271.1 1,375.3 0.0 0.0 0.0 0.0 0.0 0.0
7 Croatian Roads Ltd. 1,474.7 64.7 119.9 81.0 112.8 12.2 2.6 3.4 5.8
8 State Agency for Deposit Insurance and Bank Rehabilitation 367.4 409.6 391.4 808.3 566.5 19.9 10.4 108.8 6.2
9 Croatian Privatisation Fund 237.0 65.9 58.3 54.7 33.5 0.7 4.0 0.6 3.2
2 EXPENSE (A+B) 92,332.1 98,751.4 109,075.0 118,686.0 120,553.9 11,130.9 9,282.5 10,433.5 9,615.1
A) Budgetary central government 86,715.6 91,979.7 103,004.9 113,309.5 116,255.2 10,822.8 9,009.0 9,997.1 9,268.3
B) Extrabudgetary users 5,616.5 6,771.7 6,070.1 5,376.5 4,298.7 308.1 273.6 436.4 346.8
1 Croatian Pension Insurance Administration 382.2 565.9 0.0 0.0 0.0 0.0 0.0 0.0 0.0
2 Croatian Institute for Health Insurance 914.3 931.6 0.0 0.0 0.0 0.0 0.0 0.0 0.0
3 Croatian Employment Service 145.9 155.0 0.0 0.0 0.0 0.0 0.0 0.0 0.0
4 Croatian Waters 1,489.5 1,779.1 2,099.0 2,335.4 1,742.1 59.5 152.8 131.7 130.5
5 Fund for Environmental Protection and Energy Efficiency 172.0 734.8 1,083.3 1,106.7 1,159.1 59.4 54.6 81.1 82.3
6 Croatian Motorways Ltd. 1,085.1 1,272.7 1,509.8 0.0 0.0 0.0 0.0 0.0 0.0
7 Croatian Roads Ltd. 1,062.4 1,226.9 1,241.9 1,592.6 1,048.5 181.0 57.4 214.6 126.9
8 State Agency for Deposit Insurance and Bank Rehabilitation 183.0 27.4 47.8 254.7 267.2 1.2 2.9 1.2 1.3
9 Croatian Privatisation Fund 182.1 78.4 88.2 87.0 81.8 7.0 5.9 7.7 5.8
NET/GROSS OPERATING BALANCE (1–2) 310.3 1,641.2 4,311.2 1,350.7 –6,467.0 –1,654.3 –623.1 –636.2 30.4
3 CHANGE IN NET WORTH: TRANSACTIONS (3.1+3.2–3.3) 310.3 1,641.2 4,311.2 1,350.7 –6,467.0 –1,654.3 –623.1 –636.2 30.4
3.1 CHANGE IN NET ACQUISITION OF NON-FINANCIAL ASSETS 6,699.4 6,108.6 7,811.0 4,228.2 3,601.1 174.1 94.5 292.4 165.4
Acquisition 7,024.2 6,836.4 8,378.6 4,713.2 3,926.8 195.6 115.6 324.0 189.9
A) Budgetary central government 1,828.8 1,908.5 3,043.9 3,291.5 2,267.4 80.5 59.7 115.4 73.1
B) Extrabudgetary users 5,195.4 4,927.9 5,334.7 1,421.7 1,659.4 115.0 55.9 208.6 116.8
Disposals 324.8 727.7 567.7 485.0 325.7 21.4 21.1 31.6 24.5
A) Budgetary central government 275.1 352.7 498.7 303.4 304.0 21.3 21.1 31.5 24.5
B) Extrabudgetary users 49.6 375.1 69.0 181.6 21.7 0.1 0.1 0.1 0.1
NET LENDING/BORROWING (1-2–3.1) –6,389.1 –4,467.4 –3,499.8 –2,877.5 –10,068.2 –1,828.4 –717.6 –928.6 –134.9
TRANSACTIONS IN FINANCIAL ASSETS AND LIABILITIES (FINANCING) (3.3–3.2) 6,389.1 4,467.4 3,499.8 2,877.5 10,068.2 1,828.4 717.6 928.6 134.9
3.2 CHANGE IN NET ACQUISITION OF FINANCIAL ASSETS 1,609.8 –2,576.7 –2,939.2 2,776.6 7,363.9 684.0 –12.0 11,069.3 –99.9
3.2.1 Domestic 1,614.6 –2,593.4 –2,957.2 2,764.1 7,361.5 684.0 –12.8 11,069.3 –99.9
A) Budgetary central government 1,747.7 –3,063.9 –3,752.8 1,690.5 6,823.2 523.3 –2.7 10,342.8 –96.1
B) Extrabudgetary users –133.1 470.5 795.6 1,073.6 538.3 160.7 –10.1 726.5 –3.8
3.2.2 Foreign –4.9 16.7 18.0 12.4 0.0 0.0 0.0 0.0 0.0
A) Budgetary central government –4.9 16.7 18.0 12.4 2.3 0.0 0.8 0.0 0.0
B) Extrabudgetary users 0.0 0.0 0.0 0.0 2.3 0.0 0.8 0.0 0.0
3.2.3 Monetary gold and SDRs 0.0 0.0 0.0 0.0 0.0 0.0 0.0 0.0 0.0

CNB BULLETIN • NUMBER 165 • STATISTICAL SURVEY • I GOVERNMENT FINANCE – SELECTED DATA84
Table I2 Budgetary central government operationsa
in million HRK
2005 2006 2007 2008 20092010
Mar. Jun. Jul. Aug.
1 REVENUE 85,653.0 95,235.6 108,320.6 115,772.7 110,257.9 9,216.1 8,445.5 9,452.9 9,356.6
1.1 Taxes 50,687.6 58,469.1 64,234.5 69,572.7 63,678.9 5,551.9 4,889.3 5,536.7 5,654.7
1.2 Social contributions 31,301.3 33,877.1 37,203.5 40,703.5 39,994.7 3,185.5 3,172.5 3,334.7 3,259.3
1.3 Grants 27.5 196.0 428.0 468.6 616.3 54.1 32.2 77.6 24.8
1.4 Other revenue 3,636.6 2,693.3 6,454.5 5,027.8 5,968.0 424.5 351.5 504.0 417.8
2 EXPENSE 87,857.5 95,950.0 108,007.6 115,292.4 117,924.0 11,043.2 9,146.6 10,198.6 9,435.2
2.1 Compensation of employees 23,182.6 24,313.9 27,545.1 29,948.5 31,289.3 2,613.4 2,554.1 2,801.7 2,510.8
2.2 Use of goods and services 4,951.9 6,069.1 7,162.4 8,113.7 7,363.8 675.2 517.4 730.0 549.5
2.3 Consumption of fixed capital 0.0 0.0 0.0 0.0 0.0 0.0 0.0 0.0 0.0
2.4 Interest 4,387.0 4,713.6 4,535.0 4,683.2 5,225.2 967.9 355.6 310.4 351.2
2.5 Subsidies 5,248.7 5,670.8 6,492.0 6,859.5 6,710.0 881.7 418.4 656.4 432.3
2.6 Grants 3,796.8 6,653.0 8,363.2 5,783.1 5,559.6 494.9 349.5 526.9 445.3
2.7 Social benefits 41,358.5 43,444.6 48,176.0 52,593.2 56,148.5 4,843.2 4,638.9 4,625.8 4,658.1
2.8 Other expense 4,931.9 5,085.0 5,733.9 7,311.2 5,627.6 567.0 312.6 547.5 488.0
3 CHANGE IN NET WORTH: TRANSACTIONS –2,204.5 –714.4 313.0 480.2 –7,666.0 –1,827.1 –701.1 –745.7 –78.6
3.1 Change in net acquisition of non-financial assets 1,553.7 1,555.8 2,545.2 2,988.1 1,963.4 59.2 38.6 83.9 48.7
3.1.1 Fixed assets 1,517.0 1,595.1 2,625.7 2,719.5 1,839.7 56.6 37.5 84.8 50.6
3.1.2 Inventories 0.0 –80.2 –161.4 79.4 35.4 –0.1 –0.5 –2.2 –0.7
3.1.3 Valuables 7.2 7.8 9.6 10.1 8.9 0.9 0.0 0.5 0.0
3.1.4 Non-produced assets 29.5 33.1 71.3 179.1 79.3 1.7 1.6 0.7 –1.3
3.2 Change in net acquisition of financial assets 1,752.8 –3,047.2 –3,734.8 1,702.9 6,825.5 542.6 –0.8 10,345.9 –85.3
3.2.1 Domestic 1,757.7 –3,063.9 –3,752.8 1,690.5 6,823.2 542.6 –1.6 10,345.9 –85.3
3.2.2 Foreign –4.9 16.7 18.0 12.4 2.3 0.0 0.8 0.0 0.0
3.2.3 Monetary gold and SDRs 0.0 0.0 0.0 0.0 0.0 0.0 0.0 0.0 0.0
3.3 Change in net incurrence of liabilities 5,510.9 –777.0 –1,502.6 4,210.8 16,455.0 2,428.8 738.9 11,175.4 41.9
3.3.1 Domestic 10,591.6 3,166.3 1,477.6 5,656.6 9,576.6 2,376.3 969.4 4,266.9 –58.5
3.3.2 Foreign –5,080.6 –3,943.2 –2,980.2 –1,445.8 6,878.4 52.5 –230.5 6,908.5 100.5
a CM is reclassified from the subsector central government funds to the subsector public enterprises. The reclassification covers the statistical series from January 2008 onwards. The Notes on Methodology can be found in the Ministry of Finance Monthly Statistical Review. Note: On a cash basis.Source: MoF.
2005 2006 2007 2008 20092010
Mar. Jun. Jul. Aug.
3.3 CHANGE IN NET INCURRENCE OF LIABILITIES 7,998.8 1,890.7 560.6 5,654.1 17,432.0 2,512.4 705.6 11,997.9 35.0
3.3.1 Domestic 12,041.7 5,282.8 2,017.1 6,795.7 10,130.2 2,465.6 968.8 5,098.9 –65.2
A) Budgetary central government 10,591.6 3,166.3 1,477.6 5,656.6 9,576.6 2,376.3 969.4 4,266.9 –58.5
B) Extrabudgetary users 1,450.1 2,116.5 539.5 1,139.1 553.6 89.3 –0.6 832.0 –6.7
3.3.2 Foreign –4,042.8 –3,392.1 –1,456.5 –1,141.7 7,301.8 46.9 –263.2 6,899.1 100.2
A) Budgetary central government –5,080.6 –3,943.2 –2,980.2 –1,445.8 6,878.4 52.5 –230.5 6,908.5 100.5
B) Extrabudgetary users 1,037.8 551.2 1,523.7 304.1 423.4 –5.7 –32.7 –9.5 –0.3
a CM is reclassified from the subsector central government funds to the subsector public enterprises. The reclassification covers the statistical series from January 2008 onwards. The Notes on Methodology can be found in the Ministry of Finance Monthly Statistical Review. Note: On a cash basis.Source: MoF.
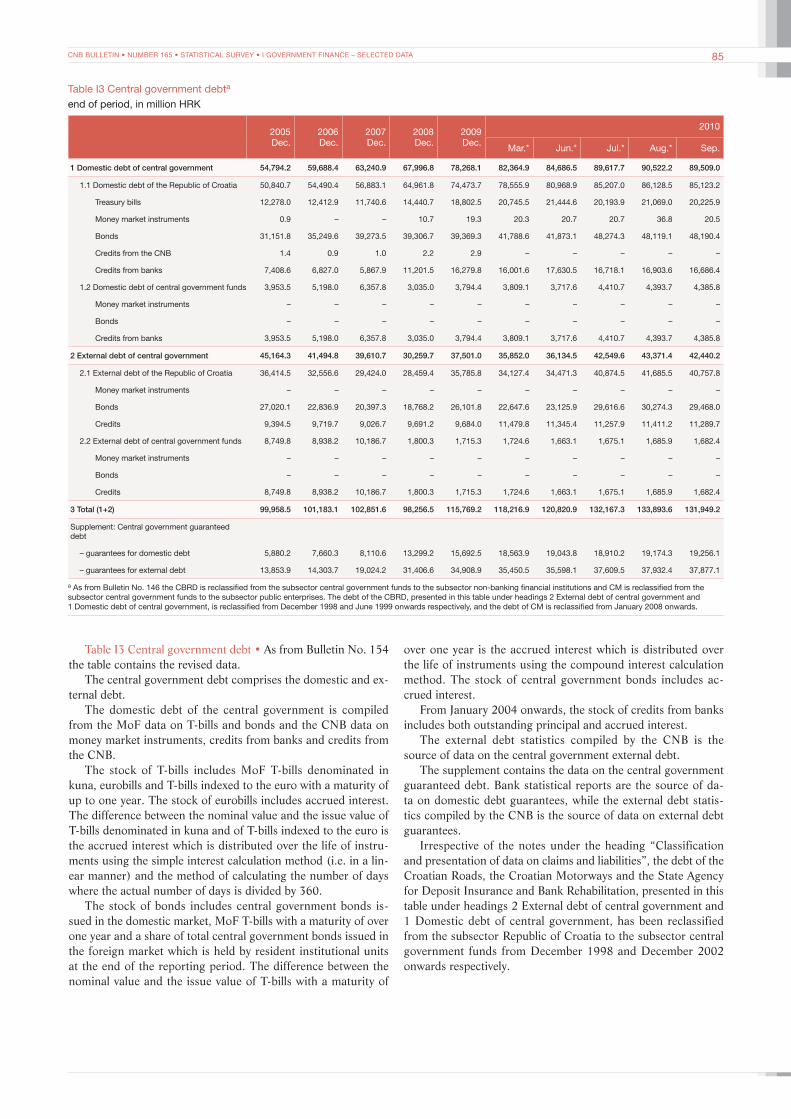
CNB BULLETIN • NUMBER 165 • STATISTICAL SURVEY • I GOVERNMENT FINANCE – SELECTED DATA 85
Table I3 Central government debta
end of period, in million HRK
2005Dec.
2006Dec.
2007Dec.
2008Dec.
2009Dec.
2010
Mar.* Jun.* Jul.* Aug.* Sep.
1 Domestic debt of central government 54,794.2 59,688.4 63,240.9 67,996.8 78,268.1 82,364.9 84,686.5 89,617.7 90,522.2 89,509.0
1.1 Domestic debt of the Republic of Croatia 50,840.7 54,490.4 56,883.1 64,961.8 74,473.7 78,555.9 80,968.9 85,207.0 86,128.5 85,123.2
Treasury bills 12,278.0 12,412.9 11,740.6 14,440.7 18,802.5 20,745.5 21,444.6 20,193.9 21,069.0 20,225.9
Money market instruments 0.9 – – 10.7 19.3 20.3 20.7 20.7 36.8 20.5
Bonds 31,151.8 35,249.6 39,273.5 39,306.7 39,369.3 41,788.6 41,873.1 48,274.3 48,119.1 48,190.4
Credits from the CNB 1.4 0.9 1.0 2.2 2.9 – – – – –
Credits from banks 7,408.6 6,827.0 5,867.9 11,201.5 16,279.8 16,001.6 17,630.5 16,718.1 16,903.6 16,686.4
1.2 Domestic debt of central government funds 3,953.5 5,198.0 6,357.8 3,035.0 3,794.4 3,809.1 3,717.6 4,410.7 4,393.7 4,385.8
Money market instruments – – – – – – – – – –
Bonds – – – – – – – – – –
Credits from banks 3,953.5 5,198.0 6,357.8 3,035.0 3,794.4 3,809.1 3,717.6 4,410.7 4,393.7 4,385.8
2 External debt of central government 45,164.3 41,494.8 39,610.7 30,259.7 37,501.0 35,852.0 36,134.5 42,549.6 43,371.4 42,440.2
2.1 External debt of the Republic of Croatia 36,414.5 32,556.6 29,424.0 28,459.4 35,785.8 34,127.4 34,471.3 40,874.5 41,685.5 40,757.8
Money market instruments – – – – – – – – – –
Bonds 27,020.1 22,836.9 20,397.3 18,768.2 26,101.8 22,647.6 23,125.9 29,616.6 30,274.3 29,468.0
Credits 9,394.5 9,719.7 9,026.7 9,691.2 9,684.0 11,479.8 11,345.4 11,257.9 11,411.2 11,289.7
2.2 External debt of central government funds 8,749.8 8,938.2 10,186.7 1,800.3 1,715.3 1,724.6 1,663.1 1,675.1 1,685.9 1,682.4
Money market instruments – – – – – – – – – –
Bonds – – – – – – – – – –
Credits 8,749.8 8,938.2 10,186.7 1,800.3 1,715.3 1,724.6 1,663.1 1,675.1 1,685.9 1,682.4
3 Total (1+2) 99,958.5 101,183.1 102,851.6 98,256.5 115,769.2 118,216.9 120,820.9 132,167.3 133,893.6 131,949.2
Supplement: Central government guaranteed debt
– guarantees for domestic debt 5,880.2 7,660.3 8,110.6 13,299.2 15,692.5 18,563.9 19,043.8 18,910.2 19,174.3 19,256.1
– guarantees for external debt 13,853.9 14,303.7 19,024.2 31,406.6 34,908.9 35,450.5 35,598.1 37,609.5 37,932.4 37,877.1
a As from Bulletin No. 146 the CBRD is reclassified from the subsector central government funds to the subsector non-banking financial institutions and CM is reclassified from the subsector central government funds to the subsector public enterprises. The debt of the CBRD, presented in this table under headings 2 External debt of central government and 1 Domestic debt of central government, is reclassified from December 1998 and June 1999 onwards respectively, and the debt of CM is reclassified from January 2008 onwards.
Table I3 Central government debt • As from Bulletin No. 154 the table contains the revised data.
The central government debt comprises the domestic and ex-ternal debt.
The domestic debt of the central government is compiled from the MoF data on T-bills and bonds and the CNB data on money market instruments, credits from banks and credits from the CNB.
The stock of T-bills includes MoF T-bills denominated in kuna , eurobills and T-bills indexed to the euro with a maturity of up to one year. The stock of eurobills includes accrued interest. The difference between the nominal value and the issue value of T-bills denominated in kuna and of T-bills indexed to the euro is the accrued interest which is distributed over the life of instru-ments using the simple interest calculation method (i.e. in a lin-ear manner) and the method of calculating the number of days where the actual number of days is divided by 360.
The stock of bonds includes central government bonds is-sued in the domestic market, MoF T-bills with a maturity of over one year and a share of total central government bonds issued in the foreign market which is held by resident institutional units at the end of the reporting period. The difference between the nominal value and the issue value of T-bills with a maturity of
over one year is the accrued interest which is distributed over the life of instruments using the compound interest calculation method. The stock of central government bonds includes ac-crued interest.
From January 2004 onwards, the stock of credits from banks includes both outstanding principal and accrued interest.
The external debt statistics compiled by the CNB is the source of data on the central government external debt.
The supplement contains the data on the central government guaranteed debt. Bank statistical reports are the source of da-ta on domestic debt guarantees, while the external debt statis-tics compiled by the CNB is the source of data on external debt guarantees.
Irrespective of the notes under the heading “Classification and presentation of data on claims and liabilities”, the debt of the Croatian Roads, the Croatian Motorways and the State Agency for Deposit Insurance and Bank Rehabilitation, presented in this table under headings 2 External debt of central government and 1 Domestic debt of central government, has been reclassified from the subsector Republic of Croatia to the subsector central government funds from December 1998 and December 2002 onwards respectively.

CNB BULLETIN • NUMBER 165 • STATISTICAL SURVEY • J NON-FINANCIAL STATISTICS – SELECTED DATA86
J Non-financial statistics – selected data
Table J1 Consumer price and producer price indices
Year Month
Basic indices, 2005 = 100 Chain indices Monthly year-on-year indices
Consumer price indices Consumer price indicesaProducer pricesb
Consumer price indicescProducer pricesb
Total Goods Services Total Goods Services Total Goods Services
1996 December …. …. …. 100.0 100.2 99.5 100.3 103.4 102.3 108.7 101.5
1997 December …. …. …. 100.7 100.3 102.3 99.9 103.8 102.7 108.2 101.6
1998 December 82.1 84.6 73.7 100.3 100.4 100.0 100.0 105.4 104.3 109.2 97.9
1999 December 85.3 87.2 78.5 100.6 100.8 100.0 100.3 103.9 103.1 106.5 105.9
2000 December 90.0 92.0 82.8 100.4 100.4 100.1 100.2 105.5 105.5 105.5 111.2
2001 December 92.1 93.2 88.5 100.4 100.4 100.5 99.0 102.4 101.3 106.8 96.9
2002 December 93.8 94.2 92.6 100.4 100.6 99.6 99.9 101.8 101.1 104.6 102.3
2003 December 95.4 95.7 94.6 100.3 100.2 100.5 100.0 101.7 101.6 102.2 101.0
2004 December 98.0 98.0 98.0 100.7 100.9 100.2 99.3 102.7 102.5 103.6 104.8
2005 December 101.6 101.4 102.0 100.5 100.5 100.5 99.7 103.6 103.5 104.1 102.7
2006 December 103.7 102.8 106.4 100.0 100.0 100.2 100.0 102.0 101.4 104.2 101.9
2007 December 109.7 109.5 110.0 101.2 101.2 101.3 100.4 105.8 106.6 103.4 105.9
2008 December 112.8 112.2 114.7 99.4 99.1 100.5 98.7 102.9 102.4 104.3 104.3
2009 December 114.9 114.5 117.3 99.4 99.3 100.2 100.0 101.9 101.3 103.9 101.6
2010 January 115.5 115.1 117.7 100.5 100.5 100.4 101.3 101.1 100.9 102.1 103.0
February 115.7 115.4 117.9 100.2 100.2 100.2 99.9 100.7 100.4 101.9 102.7
March 116.2 116.0 117.7 100.4 100.6 99.8 101.0 100.9 100.7 101.9 105.0
April 116.7 116.8 117.2 100.4 100.7 99.5 100.6 100.6 100.3 101.6 105.1
May 117.0 117.0 117.8 100.2 100.2 100.5 100.5 100.8 100.6 101.8 104.9
June 116.9 116.5 119.1 99.9 99.6 101.1 100.4 100.7 100.3 101.9 104.4
July 116.4 115.5 120.7 99.6 99.2 101.3 100.0 101.1 100.7 101.9 103.8
August 116.2 115.2 120.9 99.8 99.7 100.2 100.3 100.9 100.7 101.7 103.3
September 116.6 116.3 118.5 100.3 100.9 98.0 100.4 101.4 101.5 101.0 104.4
October 116.7 116.6 117.9 100.1 100.3 99.5 100.4 101.4 101.6 100.9 105.0
November 117.0 117.0 117.8 100.3 100.3 99.9 99.9 101.2 101.4 100.6 104.7
a Data from January 1992 to December 1997 relate to the retail price index. b Data have been revised from January 2005 onwards due to changes in the methodology used by the CBS. c Data from January 1992 to December 1998 relate to the retail price index.Source: CBS.
Table J1 Consumer price and producer price indices • The Central Bureau of Statistics (CBS) introduced the consumer price index (CPI) in early 2004. This indicator of price move-ments was compiled in accordance with the methodological principles laid down by the ILO and Eurostat. In its First Re-lease, issued on 17 February 2004, the CBS published the data on movements in the CPI in January 2004 and the time series for the CPI as of January 2001. The CBS subsequently con-structed the time series for the consumer price index encom-passing the period from January 1998 to December 2000. As expected following the introduction of the new index, the CBS ceased to publish the retail price index (RPI) and the cost of liv-ing index, whose calculation methodologies have not been ade-quately harmonised with internationally accepted standards. The main features of the CPI are described in the CNB Bulletin No.
91 (see Box 1). The data on the average year-on-year consumer price inflation rate are shown in the Bulletin table on Economic indicators.
Table J2 Core consumer price indices • The core consum-er price index is calculated by the Central Bureau of Statistics (CBS) in the manner that agricultural products prices and ad-ministrative prices (which among others include the prices of electricity and refined petroleum products) are excluded from the basket of goods and services used in the calculation of the total index. These two groups of products accounted for a total of 30.06% in the basket in 2005 (agricultural products 6.93 per-centage points, and administrative products 23.13 percentage points). A total of 111 goods and services are excluded from the coverage of the CPI basket and assigned a zero weight.
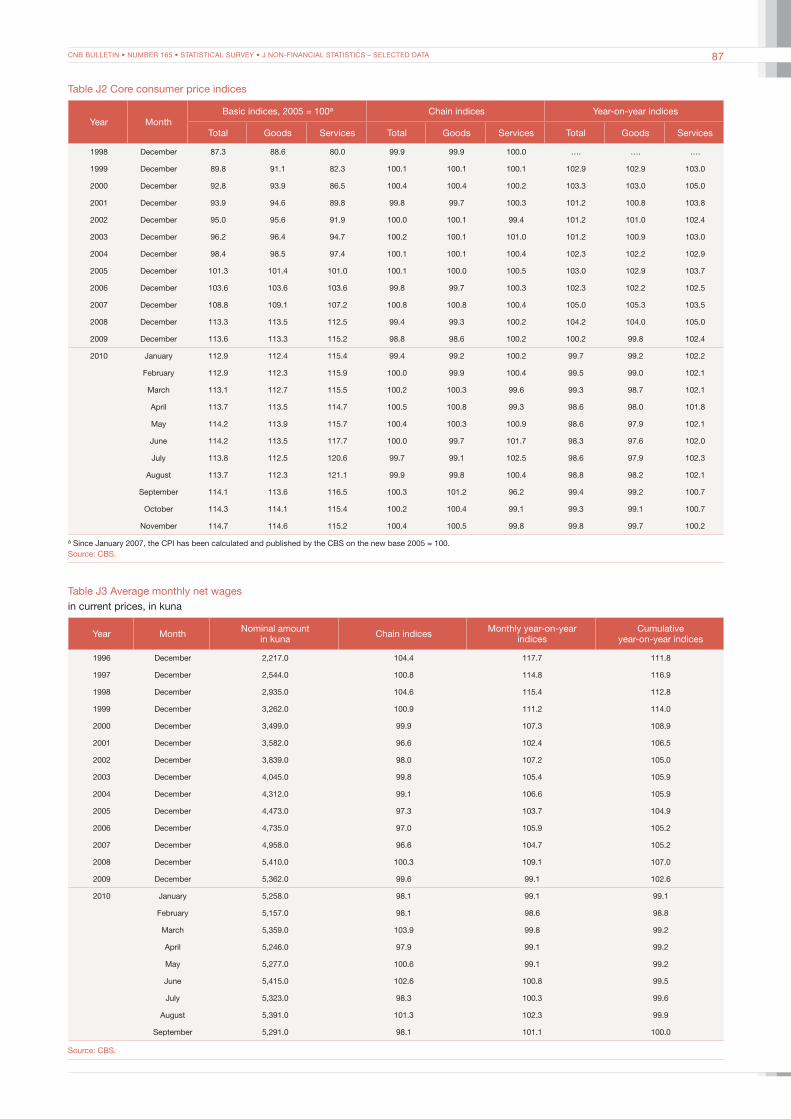
CNB BULLETIN • NUMBER 165 • STATISTICAL SURVEY • J NON-FINANCIAL STATISTICS – SELECTED DATA 87
Table J2 Core consumer price indices
Year MonthBasic indices, 2005 = 100a Chain indices Year-on-year indices
Total Goods Services Total Goods Services Total Goods Services
1998 December 87.3 88.6 80.0 99.9 99.9 100.0 …. …. ….
1999 December 89.8 91.1 82.3 100.1 100.1 100.1 102.9 102.9 103.0
2000 December 92.8 93.9 86.5 100.4 100.4 100.2 103.3 103.0 105.0
2001 December 93.9 94.6 89.8 99.8 99.7 100.3 101.2 100.8 103.8
2002 December 95.0 95.6 91.9 100.0 100.1 99.4 101.2 101.0 102.4
2003 December 96.2 96.4 94.7 100.2 100.1 101.0 101.2 100.9 103.0
2004 December 98.4 98.5 97.4 100.1 100.1 100.4 102.3 102.2 102.9
2005 December 101.3 101.4 101.0 100.1 100.0 100.5 103.0 102.9 103.7
2006 December 103.6 103.6 103.6 99.8 99.7 100.3 102.3 102.2 102.5
2007 December 108.8 109.1 107.2 100.8 100.8 100.4 105.0 105.3 103.5
2008 December 113.3 113.5 112.5 99.4 99.3 100.2 104.2 104.0 105.0
2009 December 113.6 113.3 115.2 98.8 98.6 100.2 100.2 99.8 102.4
2010 January 112.9 112.4 115.4 99.4 99.2 100.2 99.7 99.2 102.2
February 112.9 112.3 115.9 100.0 99.9 100.4 99.5 99.0 102.1
March 113.1 112.7 115.5 100.2 100.3 99.6 99.3 98.7 102.1
April 113.7 113.5 114.7 100.5 100.8 99.3 98.6 98.0 101.8
May 114.2 113.9 115.7 100.4 100.3 100.9 98.6 97.9 102.1
June 114.2 113.5 117.7 100.0 99.7 101.7 98.3 97.6 102.0
July 113.8 112.5 120.6 99.7 99.1 102.5 98.6 97.9 102.3
August 113.7 112.3 121.1 99.9 99.8 100.4 98.8 98.2 102.1
September 114.1 113.6 116.5 100.3 101.2 96.2 99.4 99.2 100.7
October 114.3 114.1 115.4 100.2 100.4 99.1 99.3 99.1 100.7
November 114.7 114.6 115.2 100.4 100.5 99.8 99.8 99.7 100.2
a Since January 2007, the CPI has been calculated and published by the CBS on the new base 2005 = 100.Source: CBS.
Table J3 Average monthly net wagesin current prices, in kuna
Year Month Nominal amount in kuna Chain indices Monthly year-on-year
indicesCumulative
year-on-year indices
1996 December 2,217.0 104.4 117.7 111.8
1997 December 2,544.0 100.8 114.8 116.9
1998 December 2,935.0 104.6 115.4 112.8
1999 December 3,262.0 100.9 111.2 114.0
2000 December 3,499.0 99.9 107.3 108.9
2001 December 3,582.0 96.6 102.4 106.5
2002 December 3,839.0 98.0 107.2 105.0
2003 December 4,045.0 99.8 105.4 105.9
2004 December 4,312.0 99.1 106.6 105.9
2005 December 4,473.0 97.3 103.7 104.9
2006 December 4,735.0 97.0 105.9 105.2
2007 December 4,958.0 96.6 104.7 105.2
2008 December 5,410.0 100.3 109.1 107.0
2009 December 5,362.0 99.6 99.1 102.6
2010 January 5,258.0 98.1 99.1 99.1
February 5,157.0 98.1 98.6 98.8
March 5,359.0 103.9 99.8 99.2
April 5,246.0 97.9 99.1 99.2
May 5,277.0 100.6 99.1 99.2
June 5,415.0 102.6 100.8 99.5
July 5,323.0 98.3 100.3 99.6
August 5,391.0 101.3 102.3 99.9
September 5,291.0 98.1 101.1 100.0
Source: CBS.
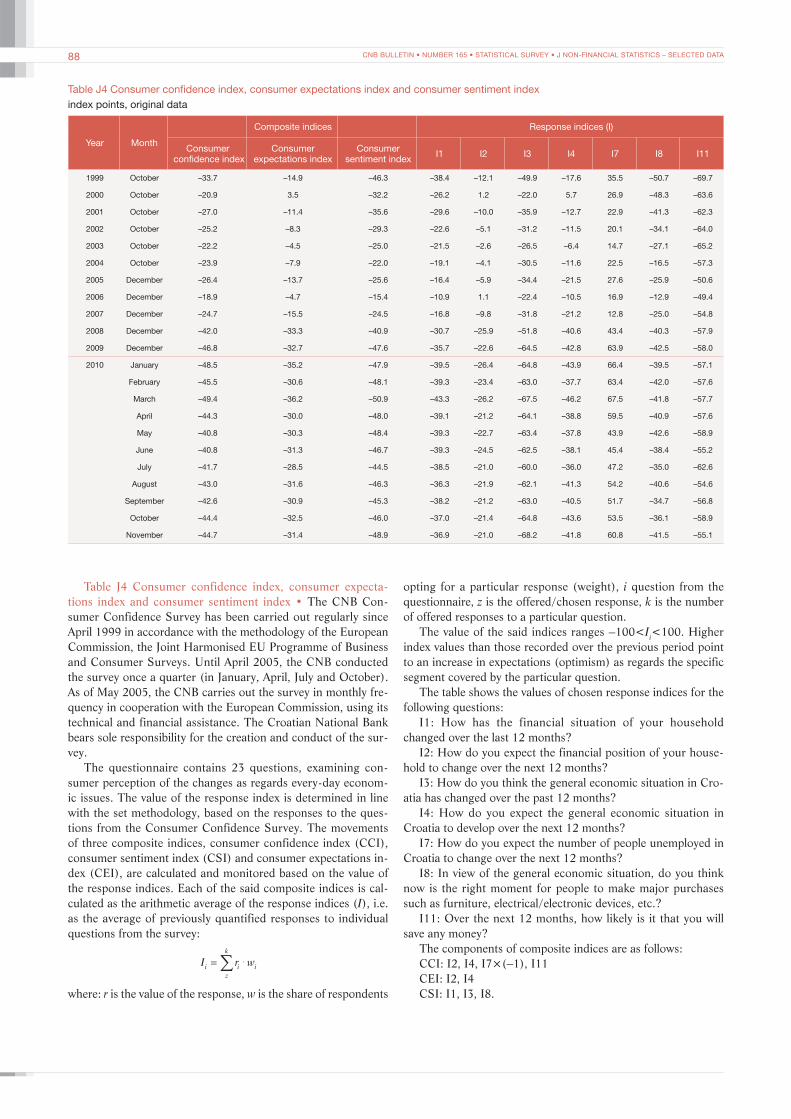
CNB BULLETIN • NUMBER 165 • STATISTICAL SURVEY • J NON-FINANCIAL STATISTICS – SELECTED DATA88
Table J4 Consumer confidence index, consumer expectations index and consumer sentiment indexindex points, original data
Year Month
Composite indices Response indices (I)
Consumer confidence index
Consumer expectations index
Consumer sentiment index I1 I2 I3 I4 I7 I8 I11
1999 October –33.7 –14.9 –46.3 –38.4 –12.1 –49.9 –17.6 35.5 –50.7 –69.7
2000 October –20.9 3.5 –32.2 –26.2 1.2 –22.0 5.7 26.9 –48.3 –63.6
2001 October –27.0 –11.4 –35.6 –29.6 –10.0 –35.9 –12.7 22.9 –41.3 –62.3
2002 October –25.2 –8.3 –29.3 –22.6 –5.1 –31.2 –11.5 20.1 –34.1 –64.0
2003 October –22.2 –4.5 –25.0 –21.5 –2.6 –26.5 –6.4 14.7 –27.1 –65.2
2004 October –23.9 –7.9 –22.0 –19.1 –4.1 –30.5 –11.6 22.5 –16.5 –57.3
2005 December –26.4 –13.7 –25.6 –16.4 –5.9 –34.4 –21.5 27.6 –25.9 –50.6
2006 December –18.9 –4.7 –15.4 –10.9 1.1 –22.4 –10.5 16.9 –12.9 –49.4
2007 December –24.7 –15.5 –24.5 –16.8 –9.8 –31.8 –21.2 12.8 –25.0 –54.8
2008 December –42.0 –33.3 –40.9 –30.7 –25.9 –51.8 –40.6 43.4 –40.3 –57.9
2009 December –46.8 –32.7 –47.6 –35.7 –22.6 –64.5 –42.8 63.9 –42.5 –58.0
2010 January –48.5 –35.2 –47.9 –39.5 –26.4 –64.8 –43.9 66.4 –39.5 –57.1
February –45.5 –30.6 –48.1 –39.3 –23.4 –63.0 –37.7 63.4 –42.0 –57.6
March –49.4 –36.2 –50.9 –43.3 –26.2 –67.5 –46.2 67.5 –41.8 –57.7
April –44.3 –30.0 –48.0 –39.1 –21.2 –64.1 –38.8 59.5 –40.9 –57.6
May –40.8 –30.3 –48.4 –39.3 –22.7 –63.4 –37.8 43.9 –42.6 –58.9
June –40.8 –31.3 –46.7 –39.3 –24.5 –62.5 –38.1 45.4 –38.4 –55.2
July –41.7 –28.5 –44.5 –38.5 –21.0 –60.0 –36.0 47.2 –35.0 –62.6
August –43.0 –31.6 –46.3 –36.3 –21.9 –62.1 –41.3 54.2 –40.6 –54.6
September –42.6 –30.9 –45.3 –38.2 –21.2 –63.0 –40.5 51.7 –34.7 –56.8
October –44.4 –32.5 –46.0 –37.0 –21.4 –64.8 –43.6 53.5 –36.1 –58.9
November –44.7 –31.4 –48.9 –36.9 –21.0 –68.2 –41.8 60.8 –41.5 –55.1
Table J4 Consumer confidence index, consumer expecta-tions index and consumer sentiment index • The CNB Con-sumer Confidence Survey has been carried out regularly since April 1999 in accordance with the methodology of the European Commission, the Joint Harmonised EU Programme of Business and Consumer Surveys. Until April 2005, the CNB conducted the survey once a quarter (in January, April, July and October). As of May 2005, the CNB carries out the survey in monthly fre-quency in cooperation with the European Commission, using its technical and financial assistance. The Croatian National Bank bears sole responsibility for the creation and conduct of the sur-vey.
The questionnaire contains 23 questions, examining con-sumer perception of the changes as regards every-day econom-ic issues. The value of the response index is determined in line with the set methodology, based on the responses to the ques-tions from the Consumer Confidence Survey. The movements of three composite indices, consumer confidence index (CCI), consumer sentiment index (CSI) and consumer expectations in-dex (CEI), are calculated and monitored based on the value of the response indices. Each of the said composite indices is cal-culated as the arithmetic average of the response indices (I), i.e. as the average of previously quantified responses to individual questions from the survey:
where: r is the value of the response, w is the share of respondents
opting for a particular response (weight), i question from the questionnaire, z is the offered/chosen response, k is the number of offered responses to a particular question.
The value of the said indices ranges –100<Ii<100. Higher index values than those recorded over the previous period point to an increase in expectations (optimism) as regards the specific segment covered by the particular question.
The table shows the values of chosen response indices for the following questions:
I1: How has the financial situation of your household changed over the last 12 months?
I2: How do you expect the financial position of your house-hold to change over the next 12 months?
I3: How do you think the general economic situation in Cro-atia has changed over the past 12 months?
I4: How do you expect the general economic situation in Croatia to develop over the next 12 months?
I7: How do you expect the number of people unemployed in Croatia to change over the next 12 months?
I8: In view of the general economic situation, do you think now is the right moment for people to make major purchases such as furniture, electrical/electronic devices, etc.?
I11: Over the next 12 months, how likely is it that you will save any money?
The components of composite indices are as follows:CCI: I2, I4, I7×(–1), I11CEI: I2, I4CSI: I1, I3, I8.
CNB BULLETIN • NUMBER 165 • LIST OF BANKS AND SAVINGS BANKS 89
List of banks and savings banks
1 December 2010
Authorised banks 1 Banco Popolare Croatia d.d., Zagreb 2 Banka Brod d.d., Slavonski Brod 3 Banka Kovanica d.d., Varaždin 4 Banka splitsko-dalmatinska d.d., Split 5 BKS Bank d.d., Rijeka 6 Centar banka d.d., Zagreb 7 Credo banka d.d., Split 8 Croatia banka d.d., Zagreb 9 Erste & Steiermärkische Bank d.d., Rijeka10 Hrvatska poštanska banka d.d., Zagreb11 Hypo Alpe-Adria-Bank d.d., Zagreb12 Imex banka d.d., Split13 Istarska kreditna banka Umag d.d., Umag14 Jadranska banka d.d., Šibenik15 Karlovačka banka d.d., Karlovac16 Kreditna banka Zagreb d.d., Zagreb17 Međimurska banka d.d., Čakovec18 Nava banka d.d., Zagreb19 OTP banka Hrvatska d.d., Zadar20 Partner banka d.d., Zagreb 21 Podravska banka d.d., Koprivnica 22 Primorska banka d.d., Rijeka23 Privredna banka Zagreb d.d., Zagreb24 Raiffeisenbank Austria d.d., Zagreb 25 Samoborska banka d.d., Samobor26 Slatinska banka d.d., Slatina27 Société Générale – Splitska banka d.d., Split28 Štedbanka d.d., Zagreb29 Vaba d.d. banka Varaždin, Varaždin30 Veneto banka d.d., Zagreb31 Volksbank d.d., Zagreb32 Zagrebačka banka d.d., Zagreb
Authorised savings banks1 Obrtnička štedna banka d.d., Zagreb2 A štedna banka malog poduzetništva d.d., Zagreb
Authorised housing savings banks1 HPB – Stambena štedionica d.d., Zagreb2 PBZ stambena štedionica d.d., Zagreb3 Prva stambena štedionica d.d., Zagreb4 Raiffeisen stambena štedionica d.d., Zagreb5 Wüstenrot stambena štedionica d.d., Zagreb
Other institutions1 Hrvatska banka za obnovu i razvitak, Zagreb,
operates in accordance with the Act on the Croatian Bank for Reconstruction and Development (OG 138/2006)
Representative offices of foreign banks1 BKS Bank AG, Zagreb2 Commerzbank Aktiengesellschaft, Zagreb3 Deutsche Bank AG, Zagreb4 LHB Internationale Handelsbank AG, Zagreb5 Union de Banques Arabes et Françaises – UBAF, Zagreb
Banks and savings banks undergoing bankruptcy proceedings Date of bankruptcy Name of bank/savings bank proceedings opening 1 Agroobrtnička banka d.d., Zagreb 14/6/2000 2 Alpe Jadran banka d.d., Split 15/5/2002 3 Cibalae banka d.d., Vinkovci 20/10/2000 4 Glumina banka d.d., Zagreb 30/4/1999 5 Gradska banka d.d., Osijek 3/5/1999/ 6 Hrvatska gospodarska banka d.d., Zagreb 19/4/2000 7 Ilirija banka d.d., Zagreb 6/4/1999 8 Komercijalna banka d.d., Zagreb 30/4/1999 9 Međimurska štedionica d.d., Čakovec 17/3/200410 Trgovačko-turistička banka d.d., Split 8.9/200011 Županjska banka d.d., Županja 3/5/1999
Banks and savings banks undergoing winding-up proceedings Date of winding-upName of bank/savings bank proceedings initiation1 Investicijsko-komercijalna štedionica d.d.,
Zagreb 31/5/20002 Križevačka banka d.d., Križevci 3/1/20053 Primus banka d.d., Zagreb 23/12/20044 Štedionica Dora d.d., Zagreb 1/1/20025 Štedionica Zlatni vrutak d.d., Zagreb 28/12/2001
Banks and savings banks whose authorisation was withdrawn, but have not initiated winding-up proceedings Date of withdrawalName of bank/savings bank of authorisation1 Hibis štedionica d.d., Zagreb 7/3/20012 Marvil štedionica d.d., Zagreb 8/6/20013 Zagrebačka štedionica d.d., Zagreb 22/3/2000

CNB BULLETIN • NUMBER 165 • MANAGEMENT OF THE CROATIAN NATIONAL BANK90
Management of the Croatian National Bank
1 December 2010
Members of the Council of the Croatian National Bank
Chairman of the Council Željko Rohatinski Members of the Council Boris Cota Davor Holjevac Vlado Leko Branimir Lokin Željko Lovrinčević Relja Martić Adolf Matejka Silvije Orsag Tomislav Presečan Jure Šimović Sandra Švaljek Mladen Vedriš Boris Vujčić
Management of the CNB
Governor Željko Rohatinski Deputy Governor Boris Vujčić Vicegovernor Davor Holjevac Vicegovernor Relja Martić Vicegovernor Adolf Matejka Vicegovernor Tomislav Presečan
Executive directors
Research and Statistics Area Ljubinko Jankov Central Banking Operations Area Irena Kovačec Foreign Exchange Operations Area Prudential Regulation and Bank Supervision Area Željko Jakuš Planning, Controlling and Accounting Area Diana Jakelić Payment Operations Area Neven Barbaroša Information Technology Area Mario Žgela Support Services Area Boris Ninić International Relations Area Michael Faulend
CNB BULLETIN • NUMBER 165 • ABBREVIATIONS AND SYMBOLS 91
Abbreviations and symbols
Abbreviationsbn – billionb.p. – basis pointsBOP – balance of paymentsc.i.f. – cost, insurance and freightCBRD – Croatian Bank for Reconstruction and DevelopmentCBS – Central Bureau of Statistics CCI – consumer confidence indexCDCC – Central Depository and Clearing Company Inc.CEE – Central and Eastern EuropeanCEFTA – Central European Free Trade AgreementCEI – consumer expectations indexCES – Croatian Employment ServiceCM – Croatian MotorwaysCIHI – Croatian Institute for Health InsuranceCLVPS – Croatian Large Value Payment SystemCNB – Croatian National BankCPF – Croatian Privatisation FundCPI – consumer price indexCPIA – Croatian Pension Insurance AdministrationCR – Croatian RoadsCSI – consumer sentiment indexDAB – State Agency for Deposit Insurance and Bank Rehabilitationdep. – depositDVP – delivery versus paymentEC – European CommissionECB – European Central BankEFTA – European Free Trade AssociationEMU – Economic and Monetary UnionESI – economic sentiment indexEU – European Unionexcl. – excludingf/c – foreign currency FDI – foreign direct investmentFed – Federal Reserve SystemFINA – Financial Agencyf.o.b. – free on boardGDP – gross domestic productGVA – gross value addedHANFA – Croatian Financial Services Supervisory AgencyHICP – harmonised index of consumer pricesIEMP – index of exchange market pressure
ILO – International Labour OrganizationIMF – International Monetary Fundincl. – includingIPO – initial public offeringm – millionMIGs – main industrial groupingsMM – monthly maturityMoF – Ministry of FinanceNCS – National Clearing Systemn.e.c. – not elsewhere classifiedOG – Official GazetteR – Republico/w – of whichPPI – producer price indexRTGS – Real-Time Gross SettlementQ – quarterlyRR – reserve requirementSDR – special drawing rightsSITC – Standard International Trade ClassificationVAT – value added taxWTO – World Trade OrganizationZMM – Zagreb Money MarketZSE – Zagreb Stock Exchange
Three-letter currency codesATS – Austrian schillingCHF – Swiss francDEM – German markEUR – euroFRF – French francGBP – pound sterlingHRK – Croatian kunaITL – Italian liraJPY – Japanese yenUSD – US dollar
Symbols– – no entry.... – data not available0 – value is less than 0.5 of the unit of measure being used – averagea, b, c,... – indicates a note beneath the table and figure* – corrected data( ) – incomplete or insufficiently verified data


ISSN 1331-6028 (print) • ISSN 1334-0050 (online)