bilten-engleski - 77 - mfin.gov.rsmfin.gov.rs/UserFiles/File/bilten javne...
84
Belgrade, February 2011 MINISTRY OF FINANCE BULLETIN PUBLIC FINANCE January 2011
Transcript of bilten-engleski - 77 - mfin.gov.rsmfin.gov.rs/UserFiles/File/bilten javne...
Belgrade, February 2011
MINISTRY OF FINANCE
BULLETINPUBLIC FINANCE
January 2011
Founder and publisherMinistry of Finance, Republic of Serbia
Belgrade, 20 Kneza Milosa St.www.mfin.gov.rsISSN 1452-0028
For the publisherJelena Rančić
Assistant Minister of [email protected]
EditorialJelena Rančić, Marinko Bošnjak,Ljubica Matić, Snežana Jovičić,
Vladimir Malbašić, Radovan Medić, Ognjen Jančić, Marko Lisica,
Branislav Tončić, Veselinka Kralj, Milica Jovanović
Editorial secretaryLjubica Matić
Design and printSlužbeni glasnik
Circulation 100 copies
The Bulletin is issued monthly

CONTENTS
41131355155616977Economic, Fiscal and Statistics of Public Debt

CURRENT MACROECONOMIC AND FISCAL DEVELOPMENTS
1. Current macroeconomic developments1.1. Economic activityIndustrial output. According to Statistical Offi ce of the Republic of Serbia (RSO) data, in January 2011 physical scope of industrial production increased by 3.8% compared to January 2010. But industrial production decreased by 12.1% compared to 2010 average. By sectors in January 2011 compared to same month of previous year mining and quarrying sector production recorded decline of 4.3%, while growth was recorded in manufacturing sector of 5.6% and in production and distribution of electricity, gas and water of 1.7%.Largest infl uence on growth of industrial production in January 2011 compared to same month of 2010 had: manufacturing of other non-metallic mineral products, basic pharmaceutical products and pharmaceutical preparations, electrical equipment, food products and motor vehicles and trailers.Th e data on industrial production by sectors in January 2011, compared to same month of previous year, expresses rise in production of capital goods by 25.9%, intermediate goods, except energy by 8.6%, nondurable consumer goods by 1.6% and energy by 1.2%, while drop in production was registered in production of durable consumer goods by 25.5%.Growth of industrial production in January 2011 compared to same month of previous year registered in 19 areas which accounts for 76% of total industrial production, while decline recorded in 10 areas, which accounts for 24% in total industrial production.
Seasonally adjusted indices of industrial output, average 2010 = 100
Seasonally adjusted rates indicate that total industrial production in January 2011 increased by 2.4% compared to 2010 average production, while production of manufacturing sector increased by 2.8%. Compared to previous month, seasonally adjusted index of industrial production increased by 3.2% while manufacturing sector recorded increase by 2.5%.
Finished goods inventories continue to decrease, and in January 2011 were lower by 2.8% compared to same month of 2010, while compared to 2010 average increased by 4.5%. At the same time observed by sectors, biggest increase recorded in energy inventories (30.2%), capital goods (12.4%), durable consumer goods inventories (22.7%), while inventories of non-durable consumer goods decreased by 10.3%.Retail trade turnover. Compared to December 2010 retail trade turnover decreased in January 2011 by 28.7% in real terms, while compared to same month of 2010 by 4.9%. Retail trade turnover decreased by 23.2% in real terms compared to 2010 average turnover.Construction. According to the data collected in 2010, value of construction works were decreased by 10.9% in real terms relative to 2009. Th ereby the construction activity was by 1.2% lower in the fourth quarter while in the third quarter value of construction works was lower by 10.8%. In 2010 construction of buildings were lower by 27.4% and other constructions by 1.3% compared to 2009. Drop in value of work done was followed by decrease in number of employed on construction sites by 12.6% compared to 2009.In 2010 signifi cant recovery was achieved with new construction contracts, which is fi rst sign of construction works recovery. On territory of the Republic of Serbia was contracted more works compared to 2009 which had signifi cant impact on the value of newly contracted works in 2010 (growth of 45.2%). However to insuffi cient commitment of construction operative impact came from decreasing number of issued construction licenses. In 2010 20.1% less licenses for construction where approved compared to 2009. According to type of construction there were 21.1% less licenses for building construction issued and by 15.7% less for construction of other constructions.Transportation. Physical volume of transportation services in 2010 increased by 7.8% compared to 2009. All types of transportation recorded a growth in the volume of services in this period. Aft er annually fall in second quarter (-2.5%), physical volume of transportation services was increased by 5.2% in third quarter 2010 and by 9.2% in fourth quarter. Th e greatest impact on growth in fourth quarter came from growth in railway transportation (11.5%) and road transportation (21.1%).Highest growth in 2010 was achieved in railway and road transportation by 16.6% and 12.6%, respectively. In 2010, passenger transportation services volume increased by 2.5% compared to 2009, while increase was recorded in
75
80
85
90
95
100
105
110
2009
Jan
Feb
Mar
Apr
May
June July
Aug
Sep
Oct
Nov Dec
2010
Jan
Industry total Processing industry
freight transport services by 25.3%.Volume of passenger transport measured by the number of passengers transported in 2010 decreased by 7.7%, and by 1.5% measured by passenger kilometers compared to 2009. Freight transport are registering recovery which transported by 14.9% more goods relative to last year, while the number of distance covered kilometers measured in tons increased by 19.5%.In 2010 the volume of services in postal activities increased by 3.6% compared to 2009.Tourism. In January 2011, number of tourist visits increased by 18.3%, from which domestic tourist visits increased by 18.3% and foreign tourists by 18.2% compared to the same month of previous year. Also number of tourist’s overnight stays increased by 26%, compared to January 2010. In this period were registered 113 thousand tourist visits and 428 thousand overnight stays.Privatization of enterprises. In January 2011 there were no privatization procedures of socially owned enterprises. 1.2. International Economic Relations1
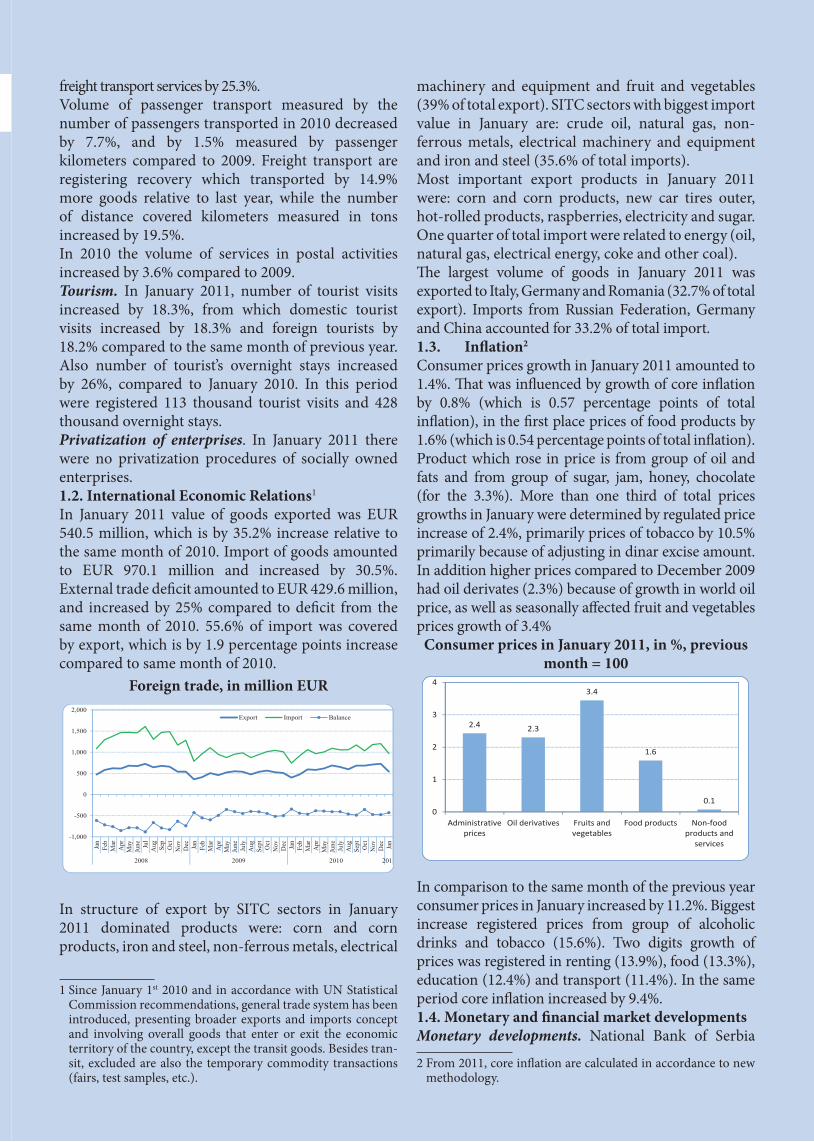
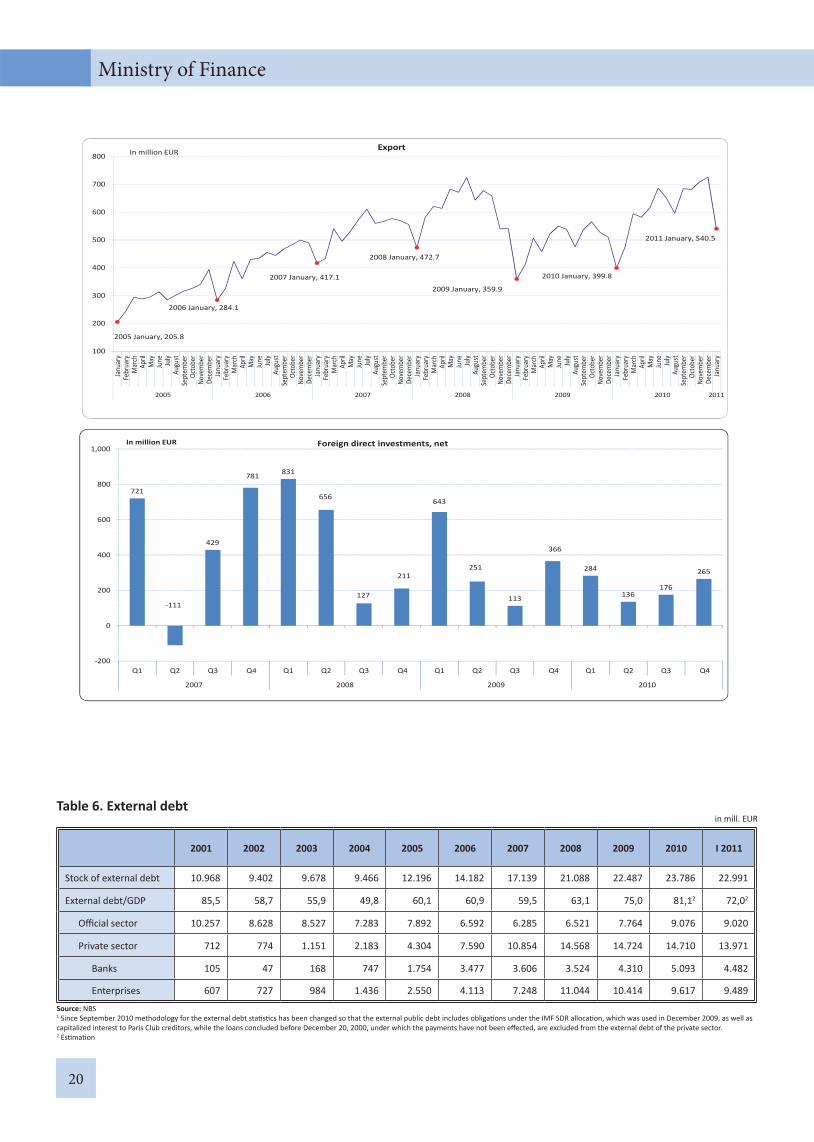
In January 2011 value of goods exported was EUR 540.5 million, which is by 35.2% increase relative to the same month of 2010. Import of goods amounted to EUR 970.1 million and increased by 30.5%. External trade defi cit amounted to EUR 429.6 million, and increased by 25% compared to defi cit from the same month of 2010. 55.6% of import was covered by export, which is by 1.9 percentage points increase compared to same month of 2010.
Foreign trade, in million EUR
In structure of export by SITC sectors in January 2011 dominated products were: corn and corn products, iron and steel, non-ferrous metals, electrical
1 Since January 1st 2010 and in accordance with UN Statistical Commission recommendations, general trade system has been introduced, presenting broader exports and imports concept and involving overall goods that enter or exit the economic territory of the country, except the transit goods. Besides tran-sit, excluded are also the temporary commodity transactions (fairs, test samples, etc.).
machinery and equipment and fruit and vegetables (39% of total export). SITC sectors with biggest import value in January are: crude oil, natural gas, non-ferrous metals, electrical machinery and equipment and iron and steel (35.6% of total imports). Most important export products in January 2011 were: corn and corn products, new car tires outer, hot-rolled products, raspberries, electricity and sugar. One quarter of total import were related to energy (oil, natural gas, electrical energy, coke and other coal).Th e largest volume of goods in January 2011 was exported to Italy, Germany and Romania (32.7% of total export). Imports from Russian Federation, Germany and China accounted for 33.2% of total import.1.3. Infl ation2
Consumer prices growth in January 2011 amounted to 1.4%. Th at was infl uenced by growth of core infl ation by 0.8% (which is 0.57 percentage points of total infl ation), in the fi rst place prices of food products by 1.6% (which is 0.54 percentage points of total infl ation). Product which rose in price is from group of oil and fats and from group of sugar, jam, honey, chocolate (for the 3.3%). More than one third of total prices growths in January were determined by regulated price increase of 2.4%, primarily prices of tobacco by 10.5% primarily because of adjusting in dinar excise amount. In addition higher prices compared to December 2009 had oil derivates (2.3%) because of growth in world oil price, as well as seasonally aff ected fruit and vegetables prices growth of 3.4%
Consumer prices in January 2011, in %, previous month = 100
In comparison to the same month of the previous year consumer prices in January increased by 11.2%. Biggest increase registered prices from group of alcoholic drinks and tobacco (15.6%). Two digits growth of prices was registered in renting (13.9%), food (13.3%), education (12.4%) and transport (11.4%). In the same period core infl ation increased by 9.4%.1.4. Monetary and fi nancial market developmentsMonetary developments. National Bank of Serbia 2 From 2011, core infl ation are calculated in accordance to new
methodology.
-1,000
-500
0
500
1,000
1,500
2,000
Jan
Feb
Mar
Apr
May
June Jul
Aug Sep
Oct
Nov Dec Jan
Feb
Mar
Apr
May
JuneJuly
AugSept Oct
Nov Dec Jan
Feb
Mar
Apr
May
JunJuly
AugSept Oct
Nov Dec Jan
2008 2009 2010 2011
Export Import Balance2.4 2.3
3.4
1.6
0.10
1
2
3
4
Administrativeprices
Oil derivatives Fruits andvegetables
Food products Non foodproducts and
services

(NBS) raised key interest rate from 11.5% in December 2010 to 12% in January 2011. Total stock of securities that NBS utilizes for operations on the OTC market at the end of January amounted to RSD 57,460 million. In January 2011 compared to same month of 2010, bank loans increased by 15.7% in real terms. Dinar reserve money, monetary aggregates M1, M2 and M3 recorded seasonal decrease by 28.5%, 15%, 18.9% and 1.5%, in real terms, respectively. Foreign exchange rate in January 2011 recorded nominal depreciation of 5.9% and real appreciation of 2.3%, compared to January 2010. With aim of stopping further appreciation of domestic exchange rate, NBS intervened in January by purchasing of EUR 5 million.
Monetary aggregates, annual real growth rates
Monetary aggregates recorded seasonally aff ected decrease in January compared to previous month. Dinar reserve money totaled RSD 169 billion and compared to previous month decreased by RSD 19.2 billion. In the same period monetary aggregate M1 decreased by RSD 29.4 billion and amounted to RSD 224 billion, while monetary aggregate M3 decreased by RSD 37.4 billion and amounted to RSD 1,324 billion.Bank lending activity is registering growth. Th e average weighted interest rate on bank loans in January was 13.9% on yearly bases. Bank loans totaled RSD 1,636 billion, which is by 0.1% decrease in real terms compared to a previous month. At the same time loans to the economy decreased by 0.2% while loans to households increased by 0.2%. Bank loans increased by 15.7% in real terms compared to the same month of 2010. At the same time loans to economy and households increased by 17.3% and 12.7% in real terms, respectively. Share of non-performing loans in total loans in January totaled 17% (on a gross basis).In January key interest rate was 12% which is compared to same month of 2010 increase by 2.5 percentage points. Banks are in January decreased their liabilities in NBS securities by 65.8%, while at the same time, due to higher interest rate, high level of security, wider maturity choices and by introduction of euro-indexed bonds3,
3 Six-months euro-indexed state treasury bonds for the fi rst time
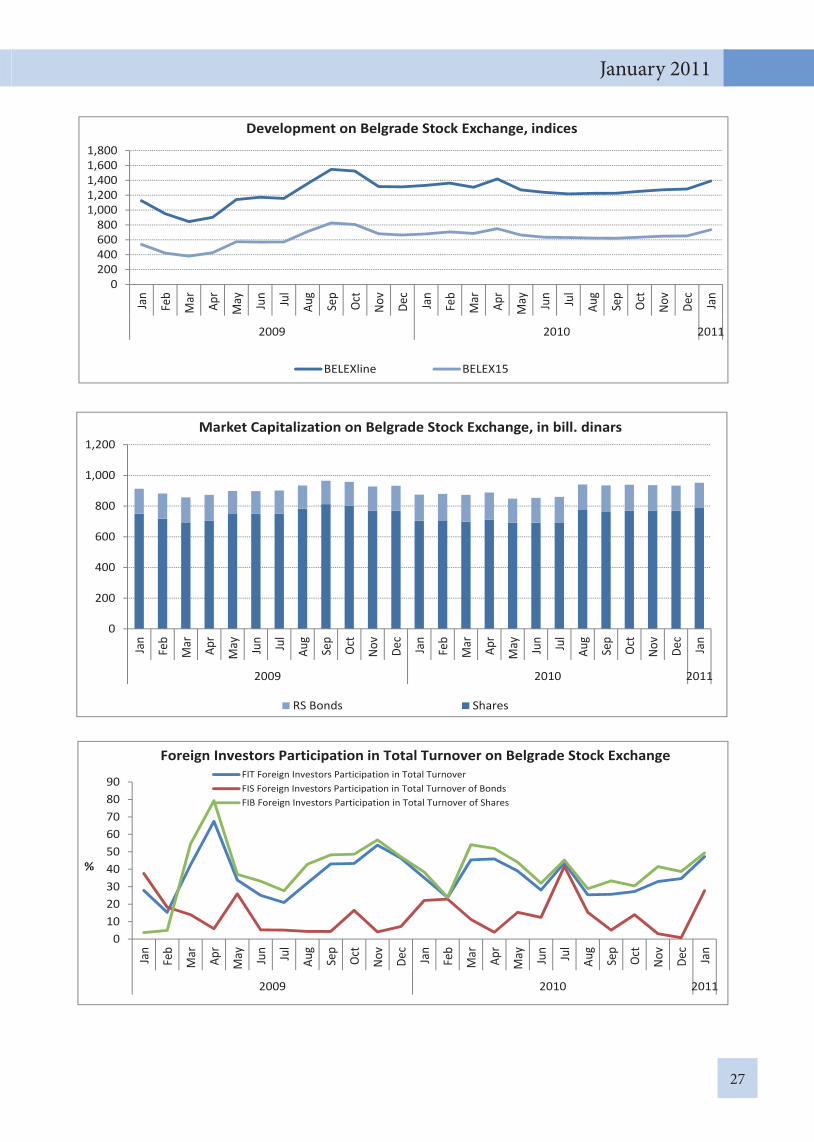
banks increased loans to state treasury bills by 67%.NBS foreign exchange reserves decreased by EUR 140.6 million compared to the previous month and totaled EUR 9,861 million in January 2011. At the same time net foreign exchange reserves4 amounted to EUR 4,922 million. Level of NBS foreign exchange reserves was suffi cient for coverage of 458% of M1 monetary aggregate and for coverage of more than 7 months of imports of goods and services. Household foreign currency savings recorded growth in January. Compared to previous month registered increase by EUR 64.5 million and totaled EUR 7,170 million. Th e average weighted interest rate on bank deposits totaled 6.1% on yearly basis. Total household savings are dominated by foreign currency savings deposits, while compared to the same month of 2010, share of savings with durability of one year and longer increased by 8.2%.Developments on the foreign exchange market in January 2011 compared to the previous month were characterized by nominal appreciation of dinar against Euro of 0.9% and real appreciation of 3%. Average daily variation from average exchange rate value in January amounted to RSD 0.82, which is approximately the same compared to average variation of exchange rate in previous month (RSD 0.89). Financial markets. In January 2011 Belgrade stock exchange registered total turnover of securities in amount of RSD 2.7 billion, from which turnover of shares and Republic of Serbia bonds (RS bonds) totaled RSD 2.5 billion and RSD 269 million, respectively. In comparison to same month of 2010 total turnover increased by 215.5%, while turnover of shares registered increase of 25.6% compared to RS bonds turnover increase of 53.5%. Total number of transactions totaled 224,956 which are compared to January 2010 signifi cant increase (by about 65 times). Increase of total transactions of securities in this period came from lower base value and increased turnover of shares.In 2010 foreign investors share in total turnover accounted for 47.2% on average and increased by 12.1 percentage points in comparison to January 2010. Share of foreign investors in turnover of shares increased by 11 percentage points and amounted to 49.4% on average, while share in RS bonds turnover increased by 5.6 percentage points and amounted to 27.7%.At the end of January 2011, value of BELEXline index was 1,390.7 index points and compared to the previous month increased by 8.4%, while value of BELEX15 index increased by 12.8% and amounted
are introduced in December 2010.4 Defi ned as foreign exchange reserves less banks foreign
exchange balances on accounts with the NBS and drawings from the IMF.
40
30
20
10
0
10
20
30
Jan
Feb
Mar Ap
r
May Jun Jul
Aug
Sep
Oct
Nov
Dec
Jan
2010 2011
M1 M3 Dinar reserve money

to 735.1 index points. Compared to January 2010 both indexes increased their value by 4.3% and 8.3%, respectively. Total market capitalization value at the end of January amounted to RSD 952 billion which is compared to previous month increase by 2%, while compared to January 2010 increase by 8.8%.1.5. Employment and unemploymentTotal number of employed persons in January 2011 decreased by 4.6% compared to the same month of 2010 and totaled 1,766,136 on average. Th e number of employed persons in enterprises, institutions and organizations5 in this period decreased by 2% and totaled 1,339,227 on average.Number of unemployed persons looking for employment at the end of January compared to the previous month increased by 2.2% and totaled 820,179 while number of persons actively looking for employment increased by 2.9% and totaled 750,726. Th e number of unemployed persons looking for employment and number of persons actively looking for employment decreased by 1.8% and 0.1%, respectively, compared to same month of 2010.According to monthly unemployment data of National Employment Service (NES), in January 2011, there was registered total of 82,397 terminations of employment.According to the NES data, unemployment rate of persons actively looking for employment in January 2011 totaled 29.8% (with insured farmers 27.4%). According to Labor Force Survey data, unemployment rate in October 2010 were 20%.
Unemployment developments
1.6. Salaries and pensionsAverage net salary in January was RSD 34,009 which is increase by 2.2% in real terms compared to same month of 2010. Denominated in Euros average net salaries increase by 5.2% in real terms and amounted to EUR 323. Average net salaries in public sector amounted to RSD 39,298 and increased by 0.4% in real terms.Aff ected by seasonal factor, average net salary in January decreased by 15.3% in real terms compared to
5 Data does not include private entrepreneurs and employed with them.
previous month. At the same time average net salary in public sector decreased by 14.4% in real terms.
Average net salaries, annual real growth rates
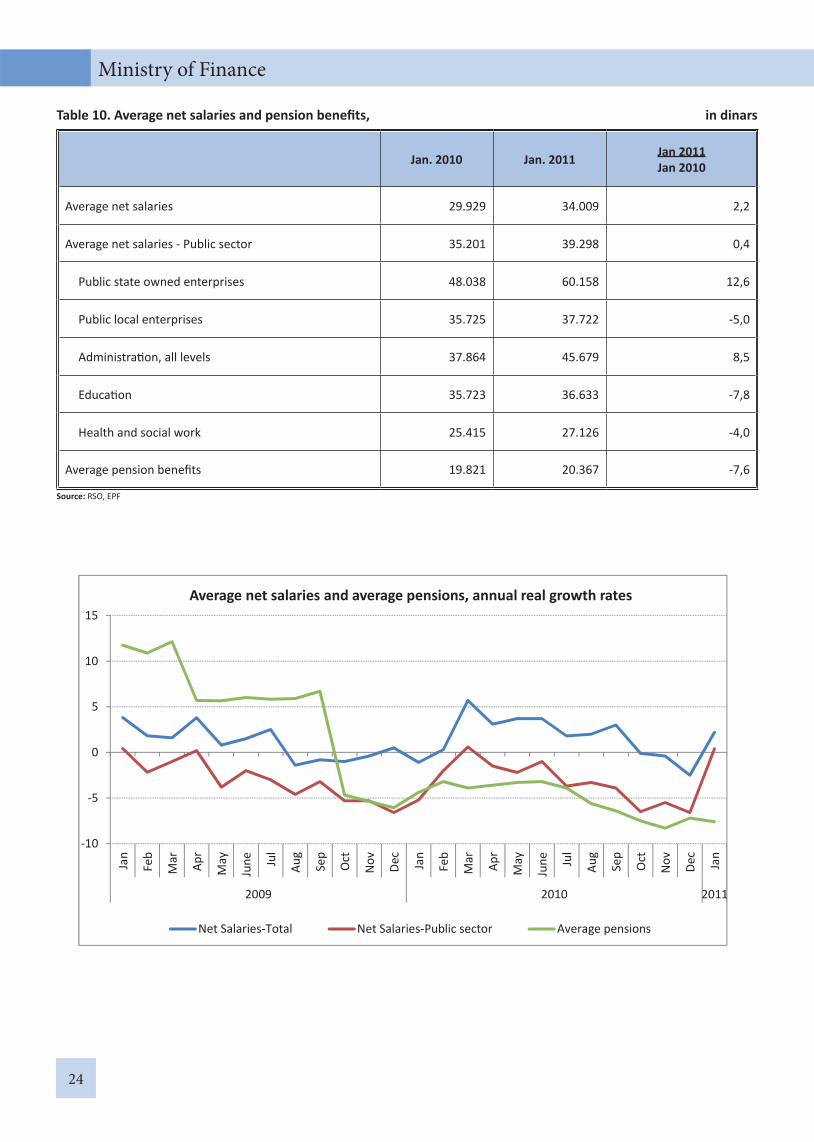
Decline of average net salaries in real terms in January 2011 compared to same month of previous year was recorded in areas of: local public enterprises (-5%), education and culture (-7.8%) and health sector (-4%), while public state owned enterprises and all levels of administration recorded growth in average net salaries by 12.6% and 8.5%, in real terms, respectively.Average paid pension6 in January 2011 was RSD 20,367 which is decrease by 7.6% decrease in real terms compared to same month of 2010. In comparison to previous month average paid pension registered decrease by 1% in real terms. Denominated in Euros average pension in January totaled EUR 194. Total number of pension benefi ciaries increased by 1.4% compared to the same month of 2010 and totaled 1,628,715. Ratio of registered number of employees and number of pension benefi ciaries was 1.1:1. Average pension accounted for 59.9% of average net salary.
Pension developments
2. Current fi scal developments7
Public revenue of the general government posted moderate nominal and minor real growth in January, compared to the same month of the
6 Integrated data of employee fund, self-employed fund and farmer’s fund.
7 Revenue, expense and result of the consolidated general government are presented in chapter II Fiscal Developments, Table 1.A more detailed overview of revenues and expense by governmental levels can also be found in tables in chapter II Fiscal Developments.
8
6
4
2
0
2
4
6
8
Jan
Feb
Mar Ap
r
May Jun Jul
Aug
Sep
Oct
Nov
Dec
Jan
2010 2011
Average net salaries total Average net salaries public sector
27.5
28.0
28.5
29.0
29.5
30.0
30.5
201510
505
10152025
Jan
Feb
Mar Ap
r
May Jun Jul
Aug
Sep
Oct
Nov
Dec
Jan
2010 2011
%
Change from the previous month, thousands (left hand scale)Unemployment rate (right hand scale)
40%
45%
50%
55%
60%
65%
70%
75%
80%
19,50019,60019,70019,80019,90020,00020,10020,20020,30020,40020,500
Jan
Feb
Mar Ap
r
May Jun Jul
Aug
Sep
Oct
Nov
Dec
Jan
2010 2011
Pension, in dinars (left hand scale) Pension/net salary ratio (right hand scale)

previous year. Current revenue is 2.8% higher, in real terms, compared to the exact period of the previous year. Tax revenue in the same period posted a real growth of 2.2%, and there is a real increase of non-tax revenue of 8.9%. Capital revenue also posted a real growth 5.3 times, and for the fi rst time its infl uence on revenue trends is tangible.Revenues from all major tax types except excises and VAT, posted a real decline compared to the same period previous year, while almost categories recorded a modest or somewhat higher nominal growth. Revenue from excises posted a 26.7% nominal increase, VAT 7.6% while social insurance contributions posted nominal growth of 2.8%. Only customs revenues recorded nominal decrease while personal income tax posted nominal growth of 4.0%.Personal income tax. Th e level of personal income tax revenue grew by 4% nominally and fell by 2.4% in real terms compared with the previous year. As wage tax makes the largest share of income tax (around 77%), its trends predominantly infl uence generation of overall personal income tax revenue. Nominal wages grew by 13.6% in January 2011, compared with the same month of the previous year, while nominal growth of wage tax revenue in the same period was 6.7%. Th e diff erence between the movement of income tax and movements in wages was caused by the employment fall in the observed period. Other types of personal income tax receipts (tax on revenue of self-employed persons, tax on royalties, annual income tax etc.) posted a 5.7% nominal growth in the observed period. Corporate income tax. In January 2011, compared with the previous year, the nominal decrease of corporate profi t tax (which share in total is around 84%) was 0.3%, while the real drop in the same period was 6.3%. Revenue from other types of profi t tax recorded a nominal growth of 15.4%8, while the real growth was 8.3% in the observed period.Value added tax. VAT revenues were by 3.1% higher in real terms in January 2011 relative to the same month last year. Its nominal growth in the same period was 9.8%. Domestic VAT was by 2.3% lower nominally and by 8.4% lower in real terms, whereas VAT on imported goods recorded a 30.2% nominal and 20.2% real growth, respectively. Trends in foreign trade sector shows continued recovery of revenues from this type of tax, at beginning of 2011. Excises. Excise revenues recorded both nominal and a real growth in the observed period. Th e real level of
8 Other profi t taxes include tax on distributed profi t, tax on corporate profi t from interest, royalties and capital gains paid to non-residents and profi t tax from lease of movable and immovable property.
collected excise was by 18.9% higher compared with the same period of the previous year and such a trend is a consequence of, among other things, increase in the nominal amount of excise tax on tobacco products in late 2010. and the changes in the structure of excise rates on petroleum products. Revenue from excise on oil derivatives rose by 15% nominally, and rose 7.9% in real terms. Revenue from excise on tobacco products rose by 36.2% in real terms, and recorded 27.9% nominal growth, while revenues from excises on alcoholic beverages decline by 15.2% in real terms. Revenues from other types of excises in the observed were higher in real terms by 71.4% compared with the same period of the previous year. Customs. Level of revenues from customs duties in January was a consequence of imports patterns in the observed period and the further implementation of the Interim Trade Agreement with the EU. Nominal decline in customs revenues in the observed period was 0.1%, while imports expressed in dinars increased by 41.7%.Other tax revenue. Other tax revenues were by 2.1% higher in real terms in January 2011 compared with the same month of the previous year. Property tax, which is attributed to local authorities, accounts for the biggest share of other tax revenue and its trends predominantly infl uence developments in the entire group of other tax revenue. Property tax revenue was by 13.5% lower in real terms, while declined 7.8% nominally relative to the same period of the previous year. Other tax revenue recorded growth of 29.5% compared with the same period of the previous year, although the fall of this group of revenues will occur during the year, due to the abolition of tax on mobile phones.Social contributions. Th e real level of revenue from social contributions in January 2011 was by 3% lower relative to the previous year. Nominal growth in contributions revenue in the observed period was 3.3% and deviates from the movement of revenues from taxes on wages. During 2010, 25.7 billion dinars were transferred to pension fund due to exceptional payment of contributions by the Government decree. In January 2011, collected contributions paid by self-employed persons were by 2.1% higher nominally, while contributions paid for pension and disability insurance of farmers were nominally by 19.9% higher compared with the same period of the previous year. Revenues from contributions for pension and disability insurance of employed persons grew nominally by the rate of 5.3%, while revenues from health security and unemployment insurance contributions grow/fell nominally by 0.3% and 7.3%, respectively. Public expenditure grew moderately in January 2011. Government spending in the observed period

grew by 8.4% nominally, current expense that posted 9.4% nominal growth, while capital expense was by 29.8% lower nominally compared with the same period of the previous year, although capital expenditure has been traditionally lower in this period of the year.Net lending expenditures posted high nominal increase. Diff erent expenditure categories manifested a growth tendency. Expenditures for employees. Th e real wage bill level in the general government was by 0.5% higher in the observed period. Nominal growth was 7.1% and due to unfreezing of nominal wages that trend is going to continue. Th e nominal movements at particular levels of government were as follows: the budget of the Republic recorded a 13.2% nominal growth, while local governments recorded a 6.8% nominal growth. Procurement of goods and services. Real decline of expenditure for procurement of goods and services in January 2011 was 2%, compared with the previous year, while the nominal increase was 6.2%. By levels of government, growth of these expenditures was recorded at local government level and by Health Fund (RZZO) and PE “Roads of Serbia”. On the other hand decrease of these expenses from Republican budget was recorded.Repayment of interest. Funds spent for the repayment of interest are higher by 0.5% in real terms compared to the previous year. Movement of these expenditures is conditioned by the plan of repayment of principal and interest on debt. Th e largest growth was recorded at the level of interest payments on the basis of domestic debt. Subsidies. Subsidies paid in the observed period were 3.9% lower in real terms compared with the same period of the previous year. Subsidies paid from the Republican budget are nominally lower by 8.7% while a real decline of 14.2% is recorded. On the local level, expenditure for subsidies posted a 28.9% nominal and 21.1% real growth. Decline of these expenses was recorded at the level of AP Vojvodina, however small volumes consequently to a lesser extent, aff ect the movement of the overall level of subsidies. Social assistance and other transfers to citizens. Real level of transfers to citizens was by 2.1% lower in January 2011 compared with the same period of 2010. Pensions account for the biggest share of transfers to citizens, and they were, same as the wages in general governed sector, frozen at the level of the end of year 2008. In the fi rst month of 2001 expenditures for pensions recorded a real decline of 2.9% compared to same period last year, but moderate nominal and real growth is expected during the year. Nominal decrease of expenditure for sick leave and the unemployment benefi ts is also recorded. On the other hand there is a
growth in other categories of transfers to citizens and various forms of social assistance.9
Capital expense. Capital spending in January was higher by 34.1% in real terms compared with the same previous year. Such a low level, however, does not say enough about the future movement of these expenses during the year. Nominal decrease of this expense has been recorded at all levels of government.Net lending. Th ese expenses have shown a signifi cant increase, of 15.8% in real terms, compared to the previous year.In January 2010, the general government posted an RSD 1.7 billion surplus. In the same period of the previous year, RSD 0.7 billion consolidated surplus was recorded.
9 Other transfers to citizens include payments made by mandatory social insurance organizations for diff erent purposes: care for the elderly, funeral costs, medicinal aids etc.
MIN
ISTR
Y O
F FI
NA
NCE
BULL
ETIN
JAN
UARY
201
1
MACROECONOMICTRENDS
I

12
Ministry of Finance
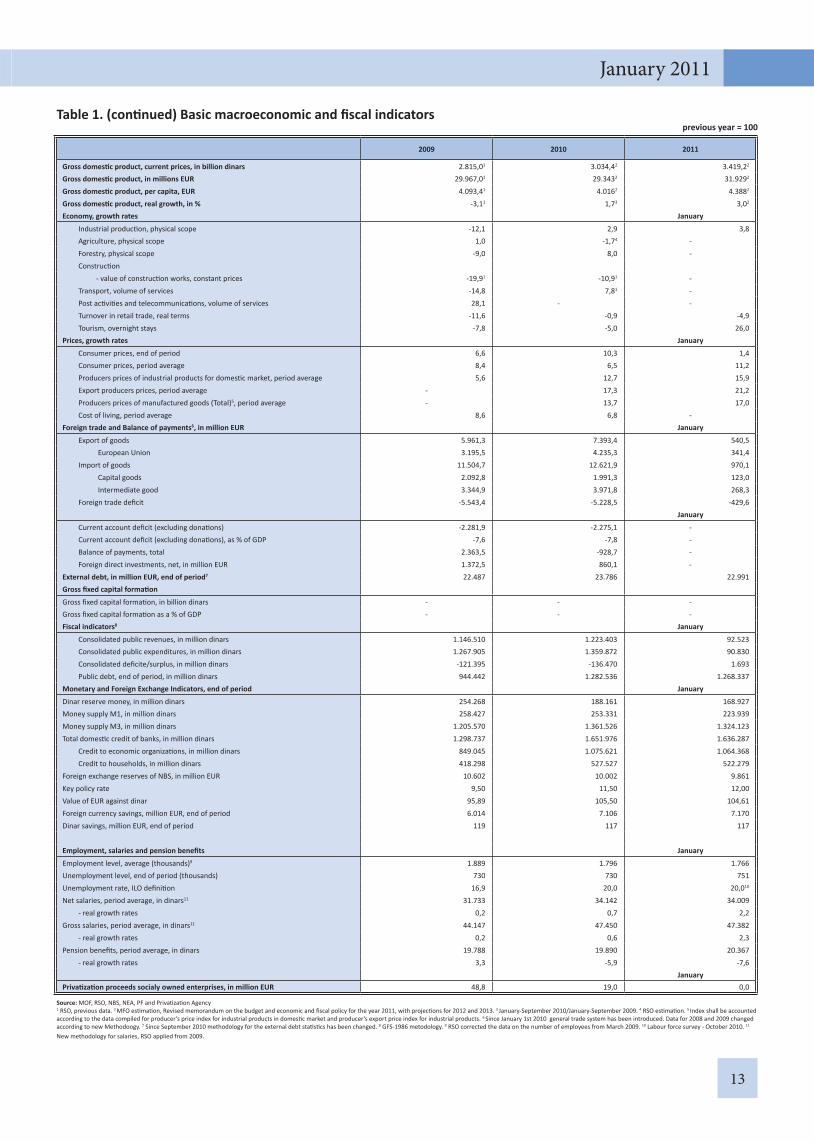
Table 1. Basic macroeconomic and fi scal indicatorsprevious year = 100
2001 2002 2003 2004 2005 2006 2007 2008
Gross domes c product, current prices, in billion dinars 762,2 972,6 1.125,8 1.380,7 1.683,5 1.962,1 2.302,2 2.722,5
Gross domes c product, in millions EUR 12.820,9 16.028,4 17.305,9 19.026,2 20.305,6 23.304,9 28.784,6 33.417,9
Gross domes c product, per capita, EUR 1.708,7 2.137,1 2.313,4 2.549,4 2.729,0 3.144,4 3.899,5 4.546,5
Gross domes c product, real growth, in % 5,6 3,9 2,4 8,3 5,6 5,2 6,9 5,5
Economy, growth rates
Industrial produc on, physical scope 0,1 1,8 -3,0 7,1 0,8 4,7 3,7 1,1
Agriculture, physical scope 18,6 -3,4 -7,2 19,5 -5,0 -0,3 -8,0 8,5
Forestry, physical scope -17,6 6,9 5,6 3,1 -2,2 6,1 -4,2 13,9
Construc on
- value of construc on works, constant prices -13,1 76,8 19,7 31,3 13,7 10,9 18,9 4,2
Transport, volume of services 9,6 6,9 5,0 4,7 4,4 5,9 6,9 0,4
Post ac vi es and telecommunica ons, volume of services 25,1 3,6 24,1 26,8 34,1 75,1 43,4 39,0
Turnover in retail trade, real terms 19,8 23,9 13,8 18,0 26,5 7,7 23,0 6,6
Tourism, overnight stays -6,5 0,2 -7,3 -0,6 -2,2 1,4 11,2 0,1
Prices, growth rates
Retail prices, end of period 40,7 14,8 7,8 13,7 17,7 6,6 10,1 6,8
Retail prices, period average 91,8 19,5 11,7 10,1 16,5 12,7 6,8 10,9
Producers prices of manufactured goods, period average 87,7 8,8 4,6 9,1 14,2 13,3 5,9 12,4
Cost of living, period average 93,3 16,6 9,9 11,4 16,2 11,7 7,0 13,5
Foreign trade and Balance of payments, in million EUR1
Export of goods 1.922,2 2.201,7 2.441,3 2.831,6 3.608,3 5.102,4 6.431,9 7.428,9
European Union 892,4 960,7 1.202,3 1.456,5 2.117,6 2.942,9 3.602,7 4.028,5
Import of goods 4.759,2 5.956,8 6.585,5 8.623,3 8.439,2 10.462,6 13.951,0 16.478,1
Capital goods2 - - - 2.495,3 1.971,6 2.429,8 3.495,9 2.965,1
Intermediate good2 - - - 2.830,6 3.027,6 3.781,4 4.892,1 4.631,5
Foreign trade defi cit -2.837,0 -3.755,1 -4.144,3 -5.791,7 -4.831,0 -5.360,1 -7.519,1 -9.049,2
Current account defi cit (excluding dona ons)3,4 -370 -1.190 -1.770 -3.001 -2.046 -2.541 -5.219 -7.217
Current account defi cit (excluding dona ons), as % of GDP -2,9 -7,4 -10,2 -15,8 -10,1 -10,9 -18,1 -21,6
Balance of payments, total3,4 562 996 827 343 1.647 4.269 742 -1.687
Foreign direct investments, net, in million EUR 184 500 1.194 774 1.250 3.323 1.821 1.824
External debt, in million EUR, end of period5 10.968 9.402 9.678 9.466 12.196 14.182 17.139 21.088
Gross fi xed capital forma on
Gross fi xed capital forma on, in billion dinars 81,3 120,5 188,9 265,7 319,9 412,8 552,3 632,4
Gross fi xed capital forma on as a % of GDP 10,7 12,4 16,8 19,2 19,0 21,0 24,0 23,2
Fiscal indicators6
Consolidated public revenues, in million dinars - - - - 724.526,7 867.681,6 1.002.047,5 1.143.603,2
Consolidated public expenditures, in million dinars - - - - 706.844,2 899.287,0 1.046.848,3 1.214.026,4
Consolidated defi cite/surplus, in million dinars - - - - 17.682,5 -31.605,4 -44.800,8 -70.423,2
Public debt, end of period, in million dinars 802.138 709.283 752.995 763.324 879.171 738.808 703.249 778.039
Monetary and Foreign Exchange Indicators, end of period
Dinar reserve money, in million dinars 41.643 69.543 72.267 82.383 100.341 143.409 169.020 319.781
Money supply М1, in million dinars 58.233 93.815 99.303 111.258 144.949 200.090 248.873 240.744
Money supply М3, in million dinars 125.414 191.491 244.731 322.876 458.870 634.470 903.871 992.151
Total domes c credit of banks, in million dinars 263.640 171.873 228.429 334.850 509.379 594.336 827.297 1.117.196
Economic organiza ons 246.887 151.626 195.442 264.177 370.391 380.395 506.991 708.882
Households 5.277 16.139 29.333 66.356 131.860 203.318 305.457 381.919
Foreign exchange reserves of NBS, in million EUR 1.325 2.208 2.854 3.131 4.952 9.041 9.660 8.190
Key policy rate - - - - - 14,00 10,00 17,75
Value of EUR against dinar 59,7 61,5 68,3 78,9 85,5 79,0 79,2 88,6
Foreign currency savings, million EUR, end of period 330 755 1.038 1.425 2.239 3.346 4.903 4.775
Dinar savings, million EUR, end of period - 42 49 36 36 67 125 105,6
Employment, salaries and pension benefi ts
Employment level, average (thousands) 2.102 2.067 2.041 2.051 2.069 2.026 2.002 1.999
Unemployment level, end of period (thousands) - - - - 896 916 785 728
Unemployment rate, ILO defi ni on 19,5 21,8 21,6 18,8 14,4
Net salaries, period average, in dinars 6.078 9.208 11.500 14.108 17.443 21.707 27.759 32.746
- real growth rates 16,5 29,9 13,6 10,1 6,4 11,4 19,5 3,9
Gross salaries, period average, in dinars 8.691 13.260 16.612 20.555 25.514 31.745 38.744 45.674
- real growth rates 16,0 30,0 14,0 11,1 6,8 11,4 14,1 3,9
Pension benefi ts, period average, in dinars 4.505 6.134 7.393 8.725 10.568 12.151 13.612 17.660
- real growth rates 17,9 16,8 9,7 5,9 4,2 2,9 4,7 14,2
Priva za on proceeds socialy owned enterprises, in million EUR 318,8 839,7 153,9 367,8 235,5 426,9 252,3
Source: MOF, RSO, NBS, NEA, PF and Priva za on Agency1 Data for foreign trade with Montenegro included in 2006. 2 New classifi ca on in order from 2004. 3 For precalcula ons from USD to EUR for 2001-2006. was used average rela on of USD to EUR for those years. Data for 2007. and 2008. are from NBS. 4 New metodology. 5 Since September 2010 methodology for the external debt sta s cs has been changed. 6 GFS-1986 metodology.
13
January 2011
Table 1. (con nued) Basic macroeconomic and fi scal indicatorsprevious year = 100
2009 2010 2011
Gross domes c product, current prices, in billion dinars 2.815,01 3.034,42 3.419,22
Gross domes c product, in millions EUR 29.967,01 29.3432 31.9292
Gross domes c product, per capita, EUR 4.093,41 4.0162 4.3882
Gross domes c product, real growth, in % -3,11 1,73 3,02
Economy, growth rates January
Industrial produc on, physical scope -12,1 2,9 3,8Agriculture, physical scope 1,0 -1,74 -Forestry, physical scope -9,0 8,0 -Construc on
- value of construc on works, constant prices -19,91 -10,91 -Transport, volume of services -14,8 7,81 -Post ac vi es and telecommunica ons, volume of services 28,1 - -Turnover in retail trade, real terms -11,6 -0,9 -4,9Tourism, overnight stays -7,8 -5,0 26,0
Prices, growth rates January
Consumer prices, end of period 6,6 10,3 1,4Consumer prices, period average 8,4 6,5 11,2Producers prices of industrial products for domes c market, period average 5,6 12,7 15,9Export producers prices, period average - 17,3 21,2Producers prices of manufactured goods (Total)5, period average - 13,7 17,0Cost of living, period average 8,6 6,8 -
Foreign trade and Balance of payments6, in million EUR January
Export of goods 5.961,3 7.393,4 540,5 European Union 3.195,5 4.235,3 341,4
Import of goods 11.504,7 12.621,9 970,1 Capital goods 2.092,8 1.991,3 123,0 Intermediate good 3.344,9 3.971,8 268,3
Foreign trade defi cit -5.543,4 -5.228,5 -429,6 January
Current account defi cit (excluding dona ons) -2.281,9 -2.275,1 -Current account defi cit (excluding dona ons), as % of GDP -7,6 -7,8 -Balance of payments, total 2.363,5 -928,7 -Foreign direct investments, net, in million EUR 1.372,5 860,1 -
External debt, in million EUR, end of period7 22.487 23.786 22.991Gross fi xed capital forma on
Gross fi xed capital forma on, in billion dinars - - -Gross fi xed capital forma on as a % of GDP - - -Fiscal indicators8 January
Consolidated public revenues, in million dinars 1.146.510 1.223.403 92.523Consolidated public expenditures, in million dinars 1.267.905 1.359.872 90.830Consolidated defi cite/surplus, in million dinars -121.395 -136.470 1.693Public debt, end of period, in million dinars 944.442 1.282.536 1.268.337
Monetary and Foreign Exchange Indicators, end of period January
Dinar reserve money, in million dinars 254.268 188.161 168.927Money supply М1, in million dinars 258.427 253.331 223.939Money supply М3, in million dinars 1.205.570 1.361.526 1.324.123Total domes c credit of banks, in million dinars 1.298.737 1.651.976 1.636.287
Credit to economic organiza ons, in million dinars 849.045 1.075.621 1.064.368Credit to households, in million dinars 418.298 527.527 522.279
Foreign exchange reserves of NBS, in million EUR 10.602 10.002 9.861Key policy rate 9,50 11,50 12,00Value of EUR against dinar 95,89 105,50 104,61Foreign currency savings, million EUR, end of period 6.014 7.106 7.170Dinar savings, million EUR, end of period 119 117 117 Employment, salaries and pension benefi ts January
Employment level, average (thousands)9 1.889 1.796 1.766Unemployment level, end of period (thousands) 730 730 751Unemployment rate, ILO defi ni on 16,9 20,0 20,010
Net salaries, period average, in dinars11 31.733 34.142 34.009- real growth rates 0,2 0,7 2,2
Gross salaries, period average, in dinars11 44.147 47.450 47.382- real growth rates 0,2 0,6 2,3
Pension benefi ts, period average, in dinars 19.788 19.890 20.367- real growth rates 3,3 -5,9 -7,6
JanuaryPriva za on proceeds socialy owned enterprises, in million EUR 48,8 19,0 0,0
Source: MOF, RSO, NBS, NEA, PF and Priva za on Agency 1 RSO, previous data. 2 MFO es ma on, Revised memorandum on the budget and economic and fi scal policy for the year 2011, with projec ons for 2012 and 2013. 3 January-September 2010/January-September 2009. 4 RSO es ma on. 5 Index shall be accounted according to the data compiled for producer’s price index for industrial products in domes c market and producer’s export price index for industrial products. 6 Since January 1st 2010 general trade system has been introduced. Data for 2008 and 2009 changed according to new Methodoogy. 7 Since September 2010 methodology for the external debt sta s cs has been changed. 8 GFS-1986 metodology. 9 RSO corrected the data on the number of employees from March 2009. 10 Labour force survey - October 2010. 11
New methodology for salaries, RSO applied from 2009.
14
Ministry of Finance
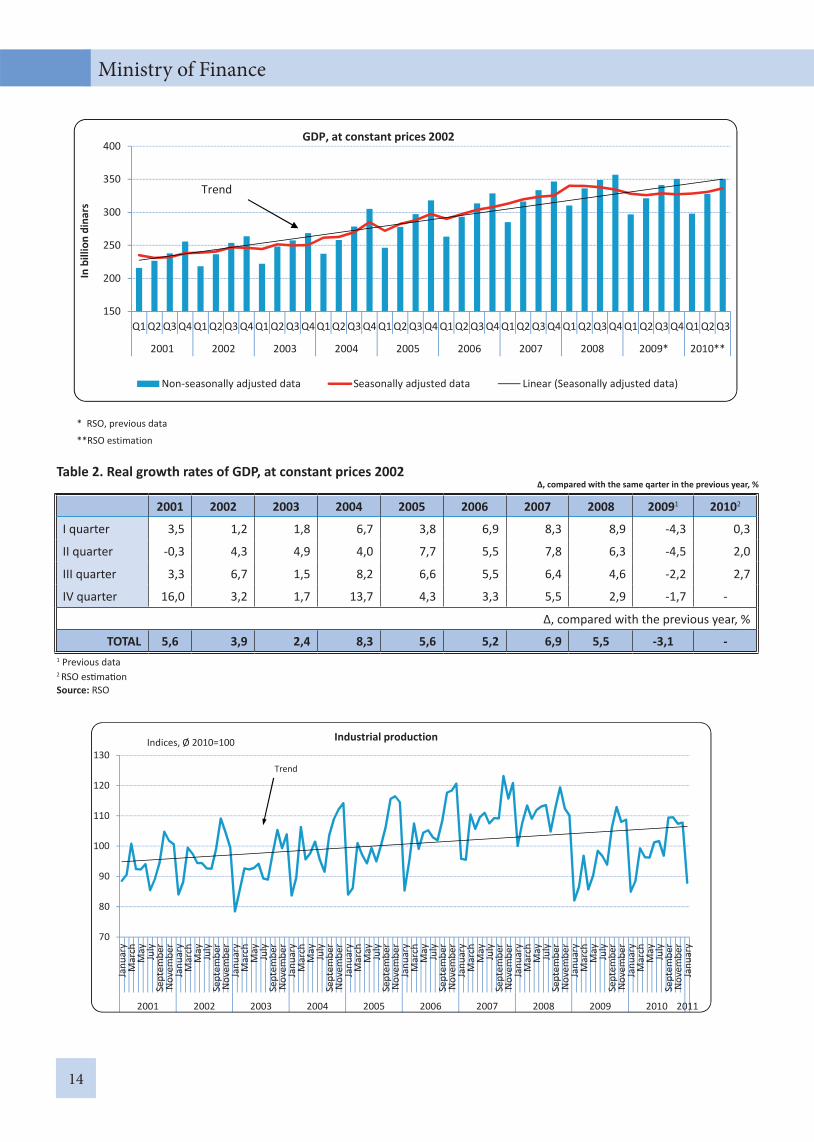
Table 2. Real growth rates of GDP, at constant prices 2002∆, compared with the same qarter in the previous year, %
2001 2002 2003 2004 2005 2006 2007 2008 20091 20102
I quarter 3,5 1,2 1,8 6,7 3,8 6,9 8,3 8,9 -4,3 0,3
II quarter -0,3 4,3 4,9 4,0 7,7 5,5 7,8 6,3 -4,5 2,0
III quarter 3,3 6,7 1,5 8,2 6,6 5,5 6,4 4,6 -2,2 2,7
IV quarter 16,0 3,2 1,7 13,7 4,3 3,3 5,5 2,9 -1,7 -
∆, compared with the previous year, %
TOTAL 5,6 3,9 2,4 8,3 5,6 5,2 6,9 5,5 -3,1 -1 Previous data2 RSO es ma onSource: RSO
* RSO, previous data
**RSO estimation
150
200
250
300
350
400
Q1 Q2 Q3 Q4 Q1 Q2 Q3 Q4 Q1 Q2 Q3 Q4 Q1 Q2 Q3 Q4 Q1 Q2 Q3 Q4 Q1 Q2 Q3 Q4 Q1 Q2 Q3 Q4 Q1 Q2 Q3 Q4 Q1 Q2 Q3 Q4 Q1 Q2 Q3
2001 2002 2003 2004 2005 2006 2007 2008 2009* 2010**
Inbi
llion
dina
rs
Non seasonally adjusted data Seasonally adjusted data Linear (Seasonally adjusted data)
Trend
GDP, at constant prices 2002
70
80
90
100
110
120
130
Janu
ary
Mar
chM
ay July
Sept
embe
rN
ovem
ber
Janu
ary
Mar
chM
ay July
Sept
embe
rN
ovem
ber
Janu
ary
Mar
chM
ay July
Sept
embe
rN
ovem
ber
Janu
ary
Mar
chM
ay July
Sept
embe
rN
ovem
ber
Janu
ary
Mar
chM
ay July
Sept
embe
rN
ovem
ber
Janu
ary
Mar
chM
ay July
Sept
embe
rN
ovem
ber
Janu
ary
Mar
chM
ay July
Sept
embe
rN
ovem
ber
Janu
ary
Mar
chM
ay July
Sept
embe
rN
ovem
ber
Janu
ary
Mar
chM
ay July
Sept
embe
rN
ovem
ber
Janu
ary
Mar
chM
ay July
Sept
embe
rN
ovem
ber
Janu
ary
2001 2002 2003 2004 2005 2006 2007 2008 2009 2010 2011
Indices, Ø 2010=100 Industrial production
Trend

15
January 2011
Table 3. Consumer pricesIndices
Total Food and non-alcoholicbeverages Housing Transport
Structure (in 2011), % 100,0 37,79 16,32 9,6520071) 111,0 118,4 107,4 108,720081) 108,6 113,8 111,6 97,220091) 106,6 100,8 106,8 121,120101) 110,3 110,7 113,8 109,520072) January 100,4 100,0 100,0 99,6February 99,7 99,4 100,8 98,6March 100,6 100,2 100,3 102,1April 100,7 100,9 100,0 102,0May 101,9 102,6 105,9 99,4June 100,4 99,0 100,1 101,3July 99,8 98,2 100,1 101,5August 102,5 106,7 100,0 100,3September 101,6 104,6 99,7 99,5October 100,5 100,6 99,8 100,9November 101,4 103,2 100,3 101,5December 101,2 102,0 100,2 101,820082) January 100,9 101,4 100,4 102,0February 100,6 101,0 100,3 100,9March 101,6 102,8 101,5 101,8April 101,5 103,7 99,8 100,0May 101,8 103,8 100,3 101,3June 100,7 100,6 99,8 103,9July 98,9 96,5 100,1 101,7August 100,4 99,7 103,8 97,3September 101,0 101,7 100,2 97,5October 101,8 103,1 103,6 99,8November 100,2 100,7 101,0 95,8December 99,1 98,4 100,3 95,620092) January 102,1 100,5 103,4 103,1February 101,2 100,7 100,4 106,3March 100,4 100,6 100,1 100,4April 100,9 100,7 100,4 101,3May 102,1 103,8 100,3 103,6June 100,0 99,0 99,9 101,7July 99,1 96,8 100,9 99,9August 99,9 99,0 100,1 100,7September 100,3 100,2 100,6 100,5October 99,8 99,4 100,2 99,5November 100,8 101,2 100,1 102,2December 99,8 99,0 100,2 100,220102) January 100,5 99,5 100,1 100,7February 100,3 99,6 100,8 100,9March 101,2 100,5 105,3 101,1April 100,6 100,6 100,1 101,5May 101,5 102,8 100,0 102,0June 100,4 100,1 100,8 100,5July 100,0 98,8 100,9 100,9August 101,4 102,6 100,6 100,1September 101,3 102,0 100,9 100,3October 101,0 101,4 100,9 100,5November 101,5 102,2 102,5 100,8December 100,3 100,1 100,2 99,920112) January 101,4 102,0 100,2 102,4
1) End of period2) Previous month=100Source: RSO

MIN
ISTR
Y O
F FI
NA
NCE
BULL
ETIN
JAN
UARY
201
1

17
January 2011
Table 4. Consumer prices
Indices, previous month=100
Dec 2010Dec 2009
2010 2011
October November December January
TOTAL 110,3 101,0 101,5 100,3 101,4
Core infl a on 108,6 101,2 101,1 100,8 100,8
Oil deriva ves 112,3 100,0 101,3 100,0 102,3
Fruits and vegetables 120,4 102,2 106,0 95,7 103,4
Administra ve prices 112,0 100,2 101,2 100,4 102,4
Electricity 111,5 100,0 100,0 100,0 100,0
Gas 100,0 100,0 100,0 100,0 100,0
Housing, public-u li es services2 122,9 101,2 108,2 100,4 100,5
Social security services 106,5 100,2 102,1 100,1 100,0
Transport services3 104,2 100,1 100,0 100,0 111,8
Postal services 100,5 100,0 100,0 100,0 100,0
TV subscrip on 115,2 100,0 100,0 100,0 100,0
Tobacco 116,3 100,0 100,0 100,0 110,5
Medicines 110,2 100,2 100,3 102,4 100,4
Other 111,0 100,9 100,0 99,8 100,2
1 Star ng from 2011, core infl a on is calculated in line with the new methodology. Core infl a on since 2007 has therefore been adequately recalculated. 2 Water for household, waste-water, taking out rubbish from fl at, central heathing.3 Bus city transport, monthly cket, railway passenger transport, airway passenger transport.Source: RSO
0.07
0.40
0.040.04
Core
infla
tion
Adm
inist
rativ
epr
ices
Oil
deriv
ativ
es
Frui
tsan
dve
geta
bles
0.5
0.0
0.5
Consumer pricesin January 2010percentage points
0.570.51
0.090.20
0.0
0.5
1.0
Core
infla
tion
Adm
inist
rativ
epr
ices
Oil
deriv
ativ
es
Frui
tsan
dve
geta
bles
Consumer pricesin January 2011percentage points

18
Ministry of Finance
Table 5. Balance of Payments of the Republic of Serbia1
January February March April May June
2009 2010 2009 2010 2009 2010 2009 2010 2009 2010 2009 2010
I. CURRENT ACCOUNT -203,4 -139,8 -373,6 -306,9 -401,2 -313,5 -132,6 -135,9 -28,6 -189,7 -84,4 -284,2
CURRENT ACCOUNT (without offi cial transfers) -212,8 -145,5 -389,7 -319,3 -414,3 -324,7 -144,2 -138,2 -38,6 -196,6 -99,7 -295,0
1. Goods (1.1-1.2.)2 -394,9 -306,2 -513,9 -414,4 -555,3 -465,7 -451,8 -377,9 -322,6 -363,3 -367,4 -424,4
1.1. Export, f.o.b. 365,6 409,6 415,0 467,5 510,4 595,0 465,2 577,8 523,4 609,8 549,2 682,3
1.2. Import, f.o.b. -760,5 -715,8 -928,9 -881,9 -1.065,7 -1.060,7 -917,0 -955,7 -845,9 -973,1 -916,6 -1.106,7
2. Services (2.1.-2.2.) -17,5 -0,1 -17,2 -8,2 -4,1 -10,4 15,1 3,3 17,0 10,2 -11,7 -8,1
2.1. Export 188,5 168,7 164,8 166,1 214,8 201,8 196,2 210,6 198,5 201,5 204,1 222,5
2.2. Import -206,1 -168,8 -182,0 -174,3 -218,8 -212,2 -181,1 -207,3 -181,5 -191,3 -215,8 -230,6
3. Goods and services (3.1.-3.2.) -412,5 -306,3 -531,1 -422,5 -559,3 -476,1 -436,7 -374,6 -305,6 -353,1 -379,1 -432,5
3.1. Export 554,1 578,4 579,8 633,7 725,2 796,8 661,4 788,4 721,9 811,3 753,3 904,8
3.2. Import -966,5 -884,6 -1.110,9 -1.056,2 -1.284,5 -1.272,9 -1.098,1 -1.163,0 -1.027,5 -1.164,5 -1.132,4 -1.337,3
4. Income -31,8 10,9 -9,5 -80,1 -82,3 -97,5 -16,9 -64,4 -19,0 -54,3 -59,1 -86,2
4.1. Receipts 53,4 59,7 34,3 21,7 29,0 25,3 84,4 43,0 33,0 21,0 32,1 44,4
4.2. Payments -85,1 -48,8 -43,8 -101,8 -111,2 -122,8 -101,3 -107,4 -52,0 -75,3 -91,2 -130,6
5. Current transfers 240,8 155,6 167,0 195,8 240,4 260,1 321,0 303,1 296,0 217,8 353,8 234,5
5.1. Receipts 257,2 176,1 187,1 212,5 261,5 289,7 341,4 332,2 313,4 236,1 372,8 254,4
5.2. Payments -16,4 -20,6 -20,2 -16,7 -21,1 -29,6 -20,4 -29,2 -17,4 -18,4 -19,0 -19,9
II. CAPITAL ACCOUNT 0,0 -0,3 -0,4 0,0 -0,1 0,8 0,2 -0,1 -1,4 -0,1 -0,2 -0,1
1. Receipts 0,1 0,0 0,0 0,1 0,2 0,9 0,3 0,0 0,6 0,0 0,0 0,0
2. Payments -0,1 -0,4 -0,5 0,0 -0,3 -0,1 -0,1 -0,1 -1,9 -0,1 -0,2 -0,1
III. FINANCIAL ACCOUNT 218,7 129,5 346,0 282,0 426,5 286,2 57,1 83,4 95,5 222,9 122,1 292,8
1. Direct investment, net 62,5 123,1 451,9 29,3 128,8 131,1 102,2 75,2 29,9 34,8 118,6 25,9
2. Por olio investment, net 5,4 30,6 -10,5 -3,0 1,1 10,4 1,7 21,8 2,6 -2,5 -62,0 15,4
3. Other investment -232,0 -58,3 88,0 92,9 256,0 -25,1 -20,3 247,6 929,0 -94,3 53,7 -46,2
4. Reserves3 382,9 34,1 -183,5 162,8 40,5 169,7 -26,4 -261,1 -865,9 284,9 11,8 297,7
IV ERRORS AND OMISSIONS, net -15,3 10,6 28,1 24,9 -25,2 26,5 75,2 52,5 -65,6 -33,0 -37,5 -8,6
V OVERALL BALANCE -382,9 -34,1 183,5 -162,8 -40,5 -169,7 26,4 261,1 865,9 -284,9 -11,8 -297,7
1 According to IMF motodology.2 Since January 1st 2010 and in accordance with UN Sta s cal Commission recommenda ons, general trade system has been introduced, presen ng broader exports and imports concept and involving overall goods that enter or exit the economic territory of the country, except the transit goods. Besides transit, excluded are also the temporary commodity transac ons (fairs, test samples, etc.). According to general trade system, goods are imported, i.e. exported into: а) free circula ng area, rooms for internal processing or industrial free zones; b) customs storage places. General trade system provides be er adjustment to measures and criteria of the System of Na onal Accounts and Balance of Payment. From January 1st 2010, new version of Standard Interna onal Trade Classifi ca on - SITC Rev 4 has been used. 3 Gross foreign reserves of NBS (Reserve assets) and commercial banks (Currency and deposits) without exchanges rate adjustments.Source: NBS

19
January 2011
in million EUR
July August September October November December January-December
2009 2010 2009 2010 2009 2010 2009 2010 2009 2010 2009 2010 2009 2010
-117,6 -153,4 -87,5 -144,1 -139,3 -225,9 -134,3 -102,4 -193,9 155,8 -188,0 -241,9 -2.084,4 -2.081,9
-138,2 -167,7 -97,9 -151,7 -148,4 -238,6 -143,9 -118,8 -207,7 140,1 -246,4 -319,1 -2.281,9 -2.275,1
-414,9 -370,5 -366,2 -427,8 -376,7 -450,0 -406,7 -312,9 -484,1 -426,3 -464,1 -434,0 -5.118,5 -4.773,3
534,6 647,9 477,0 597,6 535,2 685,3 571,6 687,8 521,1 715,8 509,3 726,0 5.977,8 7.402,5
-949,5 -1.018,4 -843,2 -1.025,5 -911,9 -1.135,3 -978,3 -1.000,7 -1.005,2 -1.142,1 -973,4 -1.160,0 -11.096,3 -12.175,8
5,9 14,9 -10,7 -16,9 2,5 0,5 9,2 27,5 4,2 1,9 25,8 -9,5 18,3 5,3
250,3 265,0 215,3 240,3 203,6 232,1 212,2 230,7 199,9 242,0 252,0 285,7 2.500,0 2.667,1
-244,4 -250,1 -226,0 -257,2 -201,1 -231,5 -203,1 -203,2 -195,7 -240,1 -226,2 -295,2 -2.481,7 -2.661,8
-408,9 -355,6 -376,9 -444,8 -374,3 -449,4 -397,5 -285,4 -479,9 -424,4 -438,3 -443,5 -5.100,2 -4.768,0
784,9 912,9 692,3 837,9 738,8 917,4 783,8 918,5 721,1 957,8 761,3 1.011,7 8.477,7 10.069,6
-1.193,8 -1.268,4 -1.069,2 -1.282,7 -1.113,1 -1.366,8 -1.181,4 -1.203,9 -1.200,9 -1.382,2 -1.199,6 -1.455,2 -13.577,9 -14.837,6
-20,4 -31,6 -45,4 -23,9 -63,4 -71,8 -78,2 -55,9 -32,4 -19,8 -44,2 -95,2 -502,5 -669,9
68,5 46,1 20,4 20,0 22,7 25,6 42,4 37,5 28,4 35,6 51,1 57,8 499,7 437,7
-88,9 -77,7 -65,8 -43,9 -86,1 -97,4 -120,6 -93,4 -60,8 -55,4 -95,3 -153,0 -1.002,1 -1.107,5
311,7 233,7 334,9 324,5 298,3 295,4 341,5 238,9 318,3 599,9 294,5 296,8 3.518,2 3.356,0
334,0 255,7 352,1 344,4 317,1 316,5 369,6 261,7 338,1 622,1 317,6 322,6 3.762,0 3.624,0
-22,3 -22,0 -17,2 -19,9 -18,8 -21,1 -28,2 -22,8 -19,8 -22,2 -23,1 -25,8 -243,8 -268,0
-0,2 -0,3 0,1 0,1 0,7 1,2 0,4 -0,2 0,2 0,0 2,3 -0,1 1,6 0,9
0,1 0,0 0,1 0,2 0,7 1,4 0,5 0,0 0,3 0,1 2,5 0,2 5,5 3,0
-0,2 -0,3 0,0 -0,1 -0,1 -0,3 -0,1 -0,2 -0,1 -0,1 -0,2 -0,3 -3,9 -2,1
110,3 168,4 151,9 126,5 108,5 198,4 152,5 69,2 207,8 -127,0 209,9 299,2 2.206,9 2.031,6
2,0 100,2 79,2 43,9 31,4 31,5 66,6 59,4 39,3 107,7 259,9 98,0 1.372,5 860,1
4,5 4,5 -1,6 -4,2 3,1 4,2 3,3 -1,9 2,8 22,7 -1,3 -59,0 -51,0 38,8
424,4 -93,4 469,5 -146,3 74,8 239,8 313,1 -67,1 445,8 -492,1 447,1 646,4 3.248,9 204,0
-320,5 157,2 -395,0 233,2 -0,8 -77,2 -230,5 78,8 -280,1 234,7 -496,0 -386,1 -2.363,5 928,7
7,5 -14,7 -64,6 17,5 30,2 26,3 -18,7 33,4 -14,1 -28,7 -24,2 -57,3 -124,1 49,4
320,5 -157,2 395,0 -233,2 0,8 77,2 230,5 -78,8 280,1 -234,7 496,0 386,1 2.363,5 -928,7
20
Ministry of Finance
Table 6. External debtin mill. EUR
2001 2002 2003 2004 2005 2006 2007 2008 2009 2010 I 2011
Stock of external debt 10.968 9.402 9.678 9.466 12.196 14.182 17.139 21.088 22.487 23.786 22.991
External debt/GDP 85,5 58,7 55,9 49,8 60,1 60,9 59,5 63,1 75,0 81,12 72,02
Offi cial sector 10.257 8.628 8.527 7.283 7.892 6.592 6.285 6.521 7.764 9.076 9.020
Private sector 712 774 1.151 2.183 4.304 7.590 10.854 14.568 14.724 14.710 13.971
Banks 105 47 168 747 1.754 3.477 3.606 3.524 4.310 5.093 4.482
Enterprises 607 727 984 1.436 2.550 4.113 7.248 11.044 10.414 9.617 9.489
Source: NBS1 Since September 2010 methodology for the external debt sta s cs has been changed so that the external public debt includes obliga ons under the IMF SDR alloca on, which was used in December 2009, as well as capitalized interest to Paris Club creditors, while the loans concluded before December 20, 2000, under which the payments have not been eff ected, are excluded from the external debt of the private sector. 2 Es ma on
721
111
429
781 831
656
127
211
643
251
113
366
284
136176
265
200
0
200
400
600
800
1,000
Q1 Q2 Q3 Q4 Q1 Q2 Q3 Q4 Q1 Q2 Q3 Q4 Q1 Q2 Q3 Q4
2007 2008 2009 2010
In million EUR Foreign direct investments, net
2005 January, 205.8
2006 January, 284.1
2007 January, 417.1
2008 January, 472.7
2009 January, 359.9
2010 January, 399.8
2011 January, 540.5
100
200
300
400
500
600
700
800
Janu
ary
Febr
uary
Mar
chAp
rilM
ayJu
ne July
Augu
stSe
ptem
ber
Octo
ber
Nove
mbe
rDe
cem
ber
Janu
ary
Febr
uary
Mar
chAp
rilM
ayJu
ne July
Augu
stSe
ptem
ber
Octo
ber
Nove
mbe
rDe
cem
ber
Janu
ary
Febr
uary
Mar
chAp
rilM
ayJu
ne July
Augu
stSe
ptem
ber
Octo
ber
Nove
mbe
rDe
cem
ber
Janu
ary
Febr
uary
Mar
chAp
rilM
ayJu
ne July
Augu
stSe
ptem
ber
Octo
ber
Nove
mbe
rDe
cem
ber
Janu
ary
Febr
uary
Mar
chAp
rilM
ayJu
ne July
Augu
stSe
ptem
ber
Octo
ber
Nove
mbe
rDe
cem
ber
Janu
ary
Febr
uary
Mar
chAp
rilM
ayJu
ne July
Augu
stSe
ptem
ber
Octo
ber
Nove
mbe
rDe
cem
ber
Janu
ary
2005 2006 2007 2008 2009 2010 2011
In million EUR Export

21
January 2011
Table 7. Monetary Survey, end of periodin million dinars
2001 2002 2003 2004 2005 2006 2007 2008 2009 2010 I 2011
Net foreign assets -96.343 132.114 170.227 160.868 218.886 407.565 563.315 483.707 570.534 507.096 473.779
Foreign assets 506.371 196.847 257.601 313.353 491.883 770.999 876.889 847.473 1.185.455 1.287.317 1.184.614
NBS 423.250 142.883 198.015 248.376 424.844 715.114 765.739 724.755 1.022.861 1.063.078 1.039.398
Banks 83.121 53.964 59.586 64.977 67.039 55.885 111.150 122.718 162.594 224.239 145.216
Foreign liabili es (-) -602.714 -64.733 -87.373 -152.485 -272.997 -363.434 -313.574 -363.766 -614.921 -780.221 -710.835
NBS -394.740 -47.610 -64.093 -69.260 -81.873 -55.692 -13.805 -14.063 -114.585 -170.362 -167.133
Banks -207.974 -17.123 -23.280 -83.225 -191.124 -307.742 -299.769 -349.703 -500.336 -609.859 -543.702
Net domes c assets 389.979 204.800 280.920 412.131 560.818 574.894 800.348 1.128.685 1.412.716 1.756.951 1.640.739
Domes c credit 275.143 185.134 228.389 348.617 490.467 504.961 722.019 1.073.069 1.301.884 1.727.526 1.706.327
Net claims on government 7.961 3.851 -9.153 5.952 -27.831 -104.210 -112.228 -53.042 -4.340 66.656 61.494
Credit to government 23.320 35.192 32.255 44.001 40.106 34.897 19.204 20.367 119.164 194.232 192.569
Dinar credit 21.560 26.370 22.500 30.008 21.272 18.271 10.935 12.928 101.554 149.451 148.123
NBS 14.685 21.295 19.760 22.407 16.330 16.450 10.811 10.892 11.290 1.315 1.308
Banks 6.875 5.075 2.739 7.601 4.942 1.821 124 2.036 90.264 148.136 146.815
Foreign currency credit 1.760 8.822 9.756 13.993 18.834 16.626 8.269 7.439 17.610 44.781 44.446
NBS 1.479 1.509 0 0 181 0 0 21 3 4 5
Banks 281 7.313 9.756 13.993 18.653 16.626 8.269 7.418 17.607 44.777 44.441
Government deposits (-) -15.359 -31.341 -41.408 -38.049 -67.938 -139.107 -131.432 -73.409 -123.504 -127.576 -131.075
Dinar deposits -7.653 -15.508 -17.934 -24.484 -43.605 -31.197 -45.094 -27.127 -67.732 -58.380 -62.674
NBS -3.612 -5.009 -12.998 -22.966 -40.718 -19.678 -29.200 -19.722 -62.987 -54.020 -58.531
Banks -4.041 -10.499 -4.936 -1.518 -2.887 -11.519 -15.894 -7.405 -4.745 -4.360 -4.143
Foreign currency deposits -7.706 -15.833 -23.474 -13.565 -24.333 -107.910 -86.338 -46.282 -55.772 -69.196 -68.401
NBS -7.259 -6.159 -18.107 -9.990 -18.806 -103.443 -81.998 -40.705 -49.253 -52.603 -52.489
Banks -447 -9.674 -5.367 -3.575 -5.527 -4.467 -4.340 -5.577 -6.519 -16.593 -15.912
Credit to non-government sectors 267.182 181.283 237.541 342.665 518.299 609.171 834.247 1.126.111 1.306.224 1.660.870 1.644.833
Households 5.277 16.139 29.536 66.514 132.146 203.631 305.967 382.382 418.854 528.233 523.001
Enterprises 247.829 153.643 197.319 264.488 370.775 381.435 508.167 711.433 851.018 1.078.290 1.066.800
Other fi nancial corpora ons 3.154 8.392 7.446 8.216 8.868 14.400 6.659 19.643 18.864 35.574 36.607
Local government 1.627 593 1.410 1.269 2.208 5.033 7.008 9.240 11.533 18.106 17.796
Non-profi t and other organiza ons 9.295 2.516 1.830 2.179 4.301 4.672 6.446 3.413 5.955 667 629
Other assets, net 114.836 19.666 52.531 63.514 70.351 69.933 78.329 47.138 110.832 29.425 -65.588
Deposit, capital and provisioning 293.636 336.914 451.147 572.998 779.704 982.459 1.363.663 1.612.392 1.983.250 2.264.047 2.114.518
Money supply М3 125.414 191.492 244.731 322.876 458.870 634.470 903.871 992.151 1.203.981 1.361.526 1.324.123
Money supply М2 68.097 110.896 124.895 146.209 192.180 278.966 390.485 395.025 436.784 410.172 375.221
Money supply М1 58.233 93.815 99.303 111.258 144.949 200.090 248.873 240.744 258.442 253.331 223.939
Currency in circula on 25.266 43.719 42.980 45.165 53.650 68.461 77.000 89.956 95.522 91.803 78.658
Sight deposits 32.967 50.096 56.323 66.093 91.299 131.629 171.873 151.013 162.920 161.528 145.281
Dinar me an savings deposits 9.864 17.081 25.592 34.951 47.231 78.876 141.612 154.119 178.342 156.841 151.282
Foreign currency deposits 57.317 80.596 119.837 176.667 266.690 355.504 513.386 597.445 767.197 951.354 948.902
Capital accounts -140.560 83.099 117.788 142.753 181.772 242.254 356.256 505.188 633.430 726.385 616.428
NBS 8.090 6.992 17.418 33.580 41.450 7.454 6.715 63.451 166.316 202.360 102.722
Banks -148.650 76.107 100.370 109.173 140.322 234.800 349.541 441.737 467.114 524.025 513.706
Provisioning for losses 308.782 62.323 88.628 107.369 139.062 105.735 103.536 114.671 145.839 176.136 173.967
Anali cal items Net monetary eff ects of foreign currency transac ons -104.049 116.281 146.753 147.303 194.553 299.655 476.977 437.425 514.762 437.900 405.378 Net domes c assets excluding foreign currency government deposits
397.685 220.633 304.394 425.696 585.151 682.804 886.686 1.174.967 1.468.488 1.826.147 1.709.140
Net credit to non-government sectors 232.048 166.207 173.844 263.984 415.368 531.570 758.572 1.027.307 1.176.849 1.497.825 1.483.685
Annual growth rates
М3 92,3% 52,7% 27,8% 31,9% 42,1% 40,0% 42,5% 9,8% 21,3% 12,9 9,5
М2 107,0% 62,9% 12,6% 17,1% 31,4% 47,0% 40,0% 1,2% 10,6% -6,1 -9,8
М1 115,5% 61,1% 5,9% 12,0% 30,3% 38,0% 24,4% -3,2% 7,3% -2,0 -5,5
Domes c credit
Credit to government 82,7 50,9 -8,3 36,4 -8,9 -13,0 -45,0 6,1 485,1 63,0 61,6
Credit to households 85,2 205,8 83,0 125,2 98,7 54,1 50,3 25,0 9,5 26,1 24,9
Credit to enterprises 15,7 -38,0 28,4 34,0 40,2 2,9 33,2 40,0 19,8 26,7 22,2
Source: NBS

22
Ministry of Finance
Table 8. Household Savings, end of period in million EUR
I 2010 I 2011 I 2011I 2010
Household savings - total 6.213,4 7.287,5 17,3%
-Dinar savings 119,8 117,2 -2,2%
-Foreign currency savings 6.093,5 7.170,3 17,7%
Long-term saving deposits 52,3% 60,5% 8,2%
Savings deposits currency structure:
- Foreign currency deposits 98,07% 98,39% 0,32%
- Dinar deposits 1,93% 1,61% -0,32%
Source: NBS
4,000
4,500
5,000
5,500
6,000
6,500
7,000
7,500
Jan
Feb
Mar Ap
r
May
June Ju
l
Aug
Sep
Oct
Nov De
c
Jan
Feb
Mar Ap
r
May
June Ju
l
Aug
Sep
Oct
Nov De
c
Jan
2009 2010 2011
Foreign currency savings, in mill. EUR
20.0
10.0
0.0
10.0
20.0
30.0
40.0
50.0
Jan Feb Mar Apr May Jun Jul Aug Sep Oct Nov Dec Jan Feb Mar Apr May Jun Jul Aug Sep Oct Nov Dec Jan
2009 2010 2011
Loans to economic organizations Loans to households Cross border loans of economic organizations*
Bank and cross border loans, denominated in EUR, annual growth rates
* From September 2010 loans (by which are not made payments) concluded before 20 December 2000 were excluded from external debt of private sector .
23
January 2011
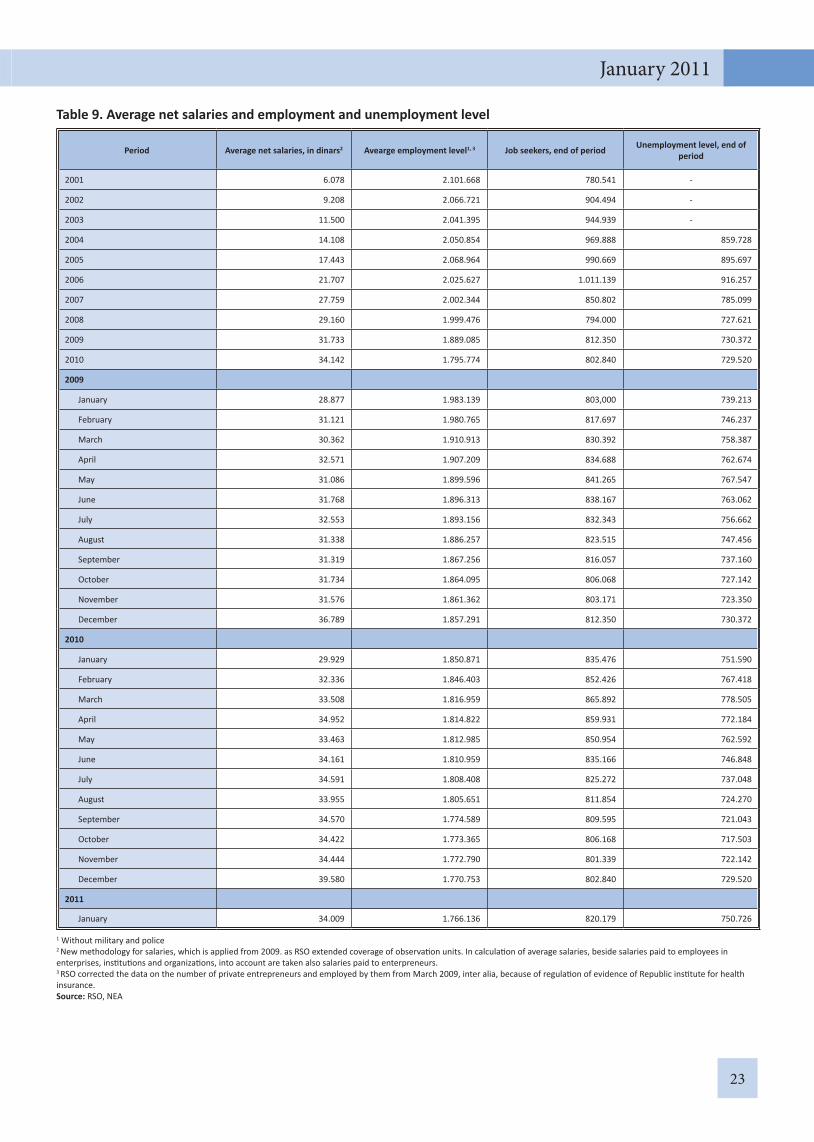
Table 9. Average net salaries and employment and unemployment level
Period Average net salaries, in dinars2 Avearge employment level1, 3 Job seekers, end of period Unemployment level, end of period
2001 6.078 2.101.668 780.541 -
2002 9.208 2.066.721 904.494 -
2003 11.500 2.041.395 944.939 -
2004 14.108 2.050.854 969.888 859.728
2005 17.443 2.068.964 990.669 895.697
2006 21.707 2.025.627 1.011.139 916.257
2007 27.759 2.002.344 850.802 785.099
2008 29.160 1.999.476 794.000 727.621
2009 31.733 1.889.085 812.350 730.372
2010 34.142 1.795.774 802.840 729.520
2009
January 28.877 1.983.139 803,000 739.213
February 31.121 1.980.765 817.697 746.237
March 30.362 1.910.913 830.392 758.387
April 32.571 1.907.209 834.688 762.674
May 31.086 1.899.596 841.265 767.547
June 31.768 1.896.313 838.167 763.062
July 32.553 1.893.156 832.343 756.662
August 31.338 1.886.257 823.515 747.456
September 31.319 1.867.256 816.057 737.160
October 31.734 1.864.095 806.068 727.142
November 31.576 1.861.362 803.171 723.350
December 36.789 1.857.291 812.350 730.372
2010
January 29.929 1.850.871 835.476 751.590
February 32.336 1.846.403 852.426 767.418
March 33.508 1.816.959 865.892 778.505
April 34.952 1.814.822 859.931 772.184
May 33.463 1.812.985 850.954 762.592
June 34.161 1.810.959 835.166 746.848
July 34.591 1.808.408 825.272 737.048
August 33.955 1.805.651 811.854 724.270
September 34.570 1.774.589 809.595 721.043
October 34.422 1.773.365 806.168 717.503
November 34.444 1.772.790 801.339 722.142
December 39.580 1.770.753 802.840 729.520
2011
January 34.009 1.766.136 820.179 750.726
1 Without military and police2 New methodology for salaries, which is applied from 2009. as RSO extended coverage of observa on units. In calcula on of average salaries, beside salaries paid to employees in enterprises, ins tu ons and organiza ons, into account are taken also salaries paid to enterpreneurs. 3 RSO corrected the data on the number of private entrepreneurs and employed by them from March 2009, inter alia, because of regula on of evidence of Republic ins tute for health insurance.Source: RSO, NEA
24
Ministry of Finance
Table 10. Average net salaries and pension benefi ts, in dinars
Jan. 2010 Jan. 2011 Jan 2011Jan 2010
Average net salaries 29.929 34.009 2,2
Average net salaries - Public sector 35.201 39.298 0,4
Public state owned enterprises 48.038 60.158 12,6
Public local enterprises 35.725 37.722 -5,0
Administra on, all levels 37.864 45.679 8,5
Educa on 35.723 36.633 -7,8
Health and social work 25.415 27.126 -4,0
Average pension benefi ts 19.821 20.367 -7,6
Source: RSO, EPF
10
5
0
5
10
15
Jan
Feb
Mar Ap
r
May
June Ju
l
Aug
Sep
Oct
Nov De
c
Jan
Feb
Mar Ap
r
May
June Ju
l
Aug
Sep
Oct
Nov De
c
Jan
2009 2010 2011
Average net salaries and average pensions, annual real growth rates
Net Salaries Total Net Salaries Public sector Average pensions
25
January 2011
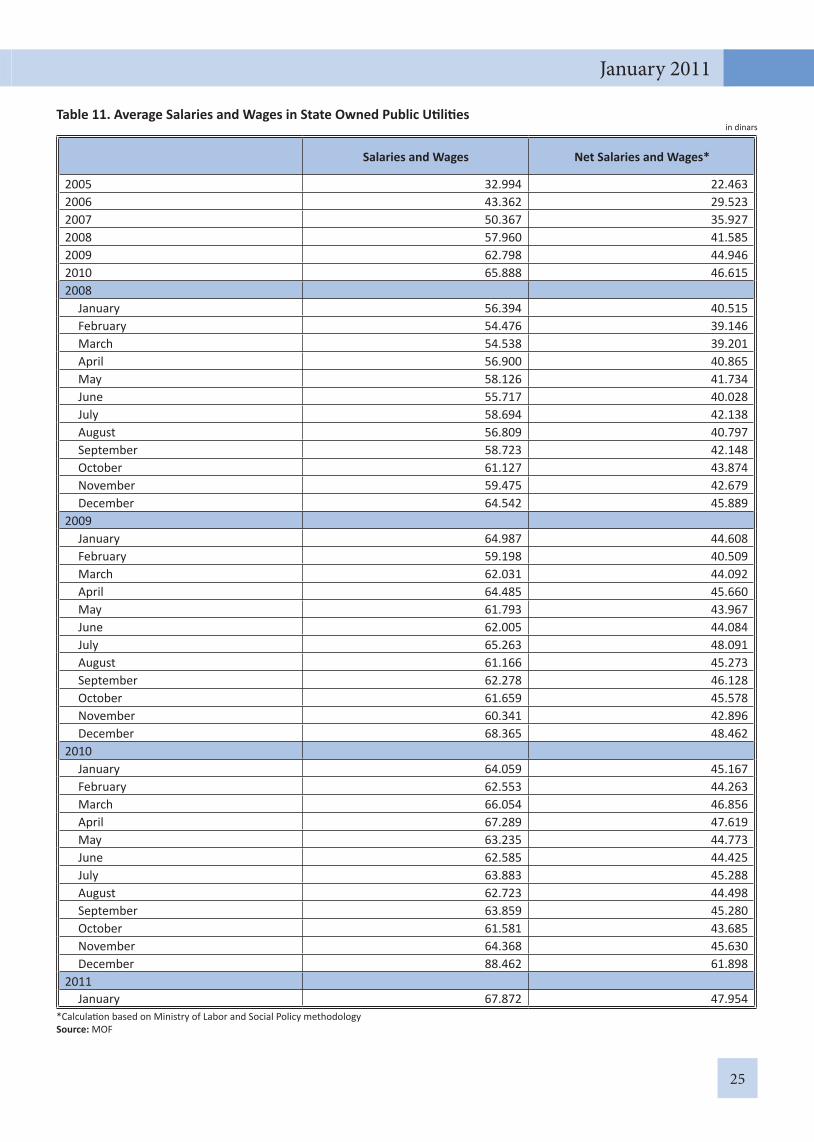
Table 11. Average Salaries and Wages in State Owned Public U li esin dinars
Salaries and Wages Net Salaries and Wages*
2005 32.994 22.4632006 43.362 29.5232007 50.367 35.9272008 57.960 41.5852009 62.798 44.9462010 65.888 46.6152008
January 56.394 40.515February 54.476 39.146March 54.538 39.201April 56.900 40.865May 58.126 41.734June 55.717 40.028July 58.694 42.138August 56.809 40.797September 58.723 42.148October 61.127 43.874November 59.475 42.679December 64.542 45.889
2009 January 64.987 44.608February 59.198 40.509March 62.031 44.092April 64.485 45.660May 61.793 43.967June 62.005 44.084July 65.263 48.091August 61.166 45.273September 62.278 46.128October 61.659 45.578November 60.341 42.896December 68.365 48.462
2010 January 64.059 45.167February 62.553 44.263March 66.054 46.856April 67.289 47.619May 63.235 44.773June 62.585 44.425July 63.883 45.288August 62.723 44.498September 63.859 45.280October 61.581 43.685November 64.368 45.630December 88.462 61.898
2011 January 67.872 47.954
*Calcula on based on Ministry of Labor and Social Policy methodologySource: MOF

26
Ministry of Finance
Table 12. Results of priva za on
2002 2003 2004 2005 2006 2007 2008 2009 2010 I 2011 TOTAL
Number of sold enterprises
Tender 11 16 7 11 15 13 14 5 2 0 94
Auc on 152 514 185 158 161 179 154 49 24 0 1.576
Capital market 48 107 45 147 102 120 105 40 13 0 727
Total 211 637 237 316 278 312 273 94 39 0 2.397
Number of employees
Tender 11.719 13.966 9.811 6.780 12.225 10.370 7.421 2.304 178 0 74.774
Auc on 10.799 42.740 17.770 17.981 17.158 15.629 5.035 2.438 668 0 130.218
Capital market 14.802 20.183 11.227 34.132 15.931 18.770 14.623 4.377 1.141 0 135.186
Total 37.320 76.889 38.808 58.893 45.314 44.769 27.079 9.119 1.987 0 340.178
in million EUR
Sale price
Tender 200,7 594,7 11,2 96,1 62,8 80,0 51,2 3,8 0,5 0,0 1.101,0
Auc on 35,1 177,2 90,5 146,5 102,7 184,8 109,3 34,5 6,9 0,0 887,5
Capital market 83,0 67,8 52,2 125,2 70,1 162,1 91,7 10,5 11,6 0,0 674,3
Total 318,8 839,7 153,9 367,8 235,5 426,9 252,3 48,8 19,0 0,0 2.662,8
Investment
Tender 303,2 271,1 66,1 69,5 114,4 74,8 55,3 15,6 0,0 0,0 970,1
Auc on 10,9 48,7 33,5 29,0 35,0 28,4 6,8 9,0 1,3 0,0 202,5
Capital market 5,9 0,0 0,0 0,0 0,0 0,0 0,0 0,0 0,0 0,0 5,9
Total 320,1 319,8 99,6 98,5 149,4 103,2 62,1 24,6 1,3 0,0 1.178,5
Social program
Tender 145,8 128,3 2,6 0,0 0,0 0,0 0,0 0,0 0,0 0,0 276,7
Auc on 0,0 0,0 0,0 0,0 0,0 0,0 0,0 0,0 0,0 0,0 0,0
Capital market 0,0 0,0 0,0 0,0 0,0 0,0 0,0 0,0 0,0 0,0 0,0
Total 145,8 128,3 2,6 0,0 0,0 0,0 0,0 0,0 0,0 0,0 276,7
Source: Priva za on Agency
27
January 2011
0200400600800
1,0001,2001,4001,6001,800
Jan
Feb
Mar Ap
r
May Jun Jul
Aug
Sep
Oct
Nov
Dec
Jan
Feb
Mar Ap
r
May Jun Jul
Aug
Sep
Oct
Nov
Dec
Jan
2009 2010 2011
Development on Belgrade Stock Exchange, indices
BELEXline BELEX15
0
200
400
600
800
1,000
1,200
Jan
Feb
Mar Ap
r
May Jun Jul
Aug
Sep
Oct
Nov
Dec
Jan
Feb
Mar Ap
r
May Jun Jul
Aug
Sep
Oct
Nov
Dec
Jan
2009 2010 2011
Market Capitalization on Belgrade Stock Exchange, in bill. dinars
RS Bonds Shares
0102030405060708090
Jan
Feb
Mar Ap
r
May Jun Jul
Aug
Sep
Oct
Nov
Dec
Jan
Feb
Mar Ap
r
May Jun Jul
Aug
Sep
Oct
Nov
Dec
Jan
2009 2010 2011
%
FIT Foreign Investors Participation in Total TurnoverFIS Foreign Investors Participation in Total Turnover of BondsFIB Foreign Investors Participation in Total Turnover of Shares
Foreign Investors Participation in Total Turnover on Belgrade Stock Exchange
MIN
ISTR
Y O
F FI
NA
NCE
BULL
ETIN
JAN
UARY
201
1
29
January 2011
Table 13. Turnover of Securi es on Belgrade Stock Exchange
I 2010 I 2011 I 2010 I 2011 I 2011XII 2010
I 2011I 2010
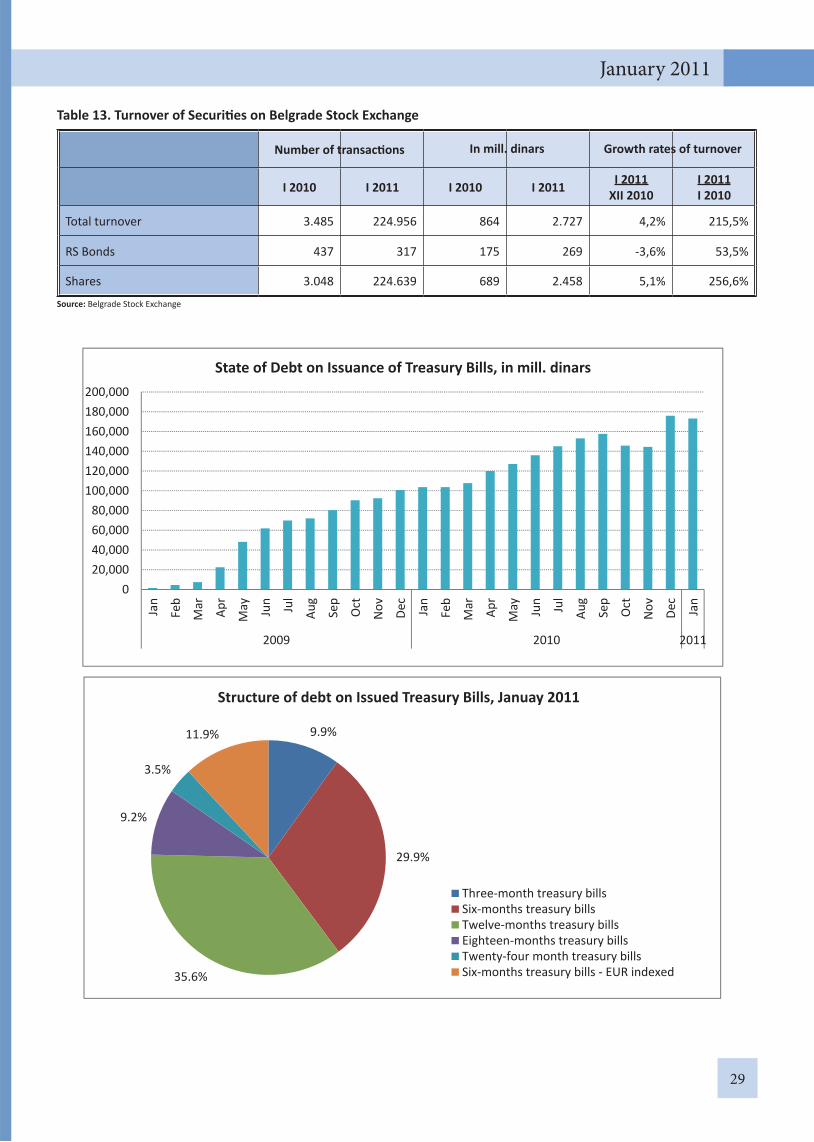
Total turnover 3.485 224.956 864 2.727 4,2% 215,5%
RS Bonds 437 317 175 269 -3,6% 53,5%
Shares 3.048 224.639 689 2.458 5,1% 256,6%
Source: Belgrade Stock Exchange
020,00040,00060,00080,000
100,000120,000140,000160,000180,000200,000
Jan
Feb
Mar Ap
r
May Jun Jul
Aug
Sep
Oct
Nov De
c
Jan
Feb
Mar Ap
r
May Jun Jul
Aug
Sep
Oct
Nov De
c
Jan
2009 2010 2011
State of Debt on Issuance of Treasury Bills, in mill. dinars
9.9%
29.9%
35.6%
9.2%
3.5%
11.9%
Structure of debt on Issued Treasury Bills, Januay 2011
Three month treasury billsSix months treasury billsTwelve months treasury billsEighteen months treasury billsTwenty four month treasury billsSix months treasury bills EUR indexed
Number of transac ons In mill. dinars Growth rates of turnover
30
Ministry of Finance
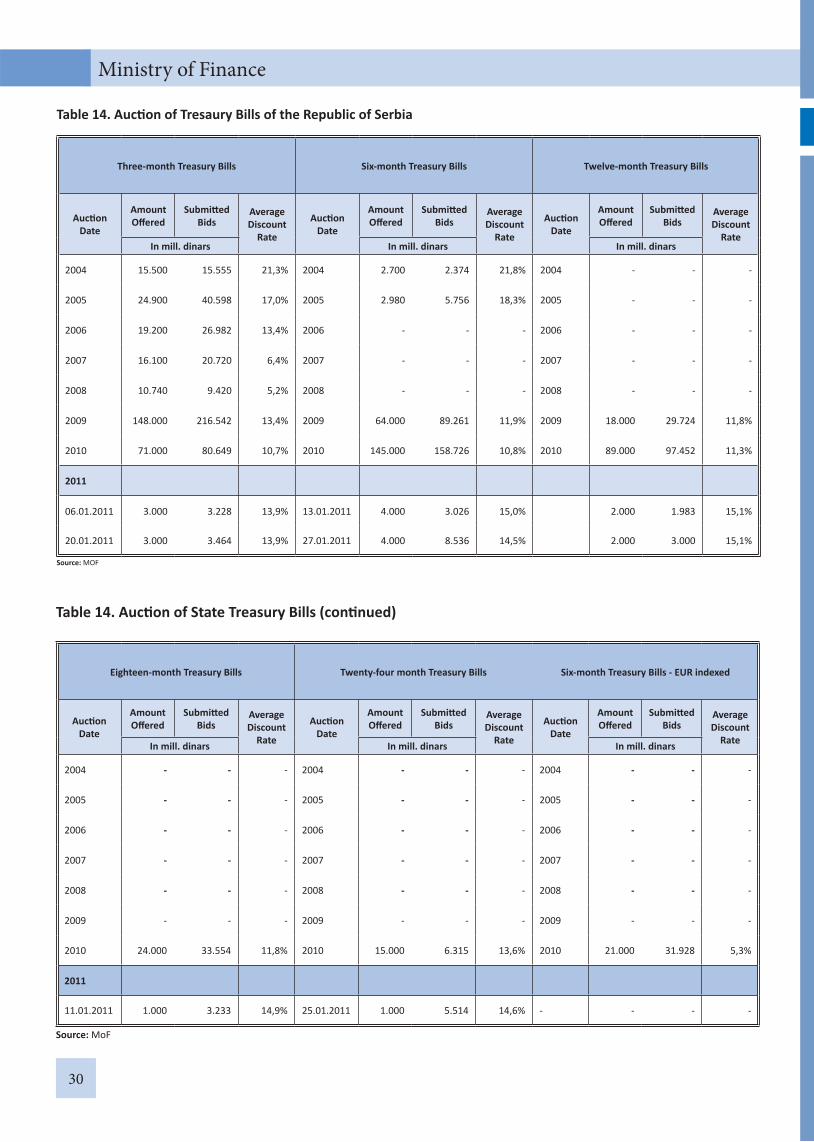
Table 14. Auc on of Tresaury Bills of the Republic of Serbia
Three-month Treasury Bills Six-month Treasury Bills Twelve-month Treasury Bills
Auc on Date
Amount Off ered
Submi ed Bids
Average Discount
Rate
Auc on Date
Amount Off ered
Submi ed Bids
Average Discount
Rate
Auc on Date
Amount Off ered
Submi ed Bids
Average Discount
RateIn mill. dinars In mill. dinars In mill. dinars
2004 15.500 15.555 21,3% 2004 2.700 2.374 21,8% 2004 - - -
2005 24.900 40.598 17,0% 2005 2.980 5.756 18,3% 2005 - - -
2006 19.200 26.982 13,4% 2006 - - - 2006 - - -
2007 16.100 20.720 6,4% 2007 - - - 2007 - - -
2008 10.740 9.420 5,2% 2008 - - - 2008 - - -
2009 148.000 216.542 13,4% 2009 64.000 89.261 11,9% 2009 18.000 29.724 11,8%
2010 71.000 80.649 10,7% 2010 145.000 158.726 10,8% 2010 89.000 97.452 11,3%
2011
06.01.2011 3.000 3.228 13,9% 13.01.2011 4.000 3.026 15,0% 2.000 1.983 15,1%
20.01.2011 3.000 3.464 13,9% 27.01.2011 4.000 8.536 14,5% 2.000 3.000 15,1%
Source: MOF
Table 14. Auc on of State Treasury Bills (con nued)
Eighteen-month Treasury Bills Twenty-four month Treasury Bills Six-month Treasury Bills - EUR indexed
Auc on Date
Amount Off ered
Submi ed Bids
Average Discount
Rate
Auc on Date
Amount Off ered
Submi ed Bids
Average Discount
Rate
Auc on Date
Amount Off ered
Submi ed Bids
Average Discount
RateIn mill. dinars In mill. dinars In mill. dinars
2004 - - - 2004 - - - 2004 - - -
2005 - - - 2005 - - - 2005 - - -
2006 - - - 2006 - - - 2006 - - -
2007 - - - 2007 - - - 2007 - - -
2008 - - - 2008 - - - 2008 - - -
2009 - - - 2009 - - - 2009 - - -
2010 24.000 33.554 11,8% 2010 15.000 6.315 13,6% 2010 21.000 31.928 5,3%
2011
11.01.2011 1.000 3.233 14,9% 25.01.2011 1.000 5.514 14,6% - - - -
Source: MoF
FISCAL TRENDS
II

32
Ministry of Finance
Table 1. Consolidated general government, from 2005 to 2011 in mil. dinar
2005 2006 2007 2008 2009 2010 2011Nominal growth
Jan 2011 /Jan 2010
Real growth Jan 2011 /Jan 2010
Total Total Total Total Total January Total January Total
I PUBLIC REVENUES 724.526,7 867.681,6 1.002.047,5 1.143.437,7 1.146.509,5 84.409,2 1.223.402,7 92.523,3 92.523,3 109,6 102,9
1. Current revenues 721.509,3 865.526,4 995.415,2 1.140.370,0 1.139.849,2 84.336,9 1.214.494,3 92.316,1 92.316,1 109,5 102,8
1.1.Tax revenues 637.913,2 755.968,9 870.036,0 1.000.368,0 1.000.321,2 76.860,2 1.056.460,3 83.642,2 83.642,2 108,8 102,2
Personal income tax 94.282,5 118.591,0 115.772,0 136.450,8 133.481,8 9.204,6 139.051,5 9.572,4 9.572,4 104,0 97,6
Corporate income tax 10.307,9 18.313,4 29.686,4 39.006,9 31.213,1 2.074,2 32.593,0 2.150,0 2.150,0 103,7 97,3
Value added tax 215.938,5 225.137,2 265.464,7 301.689,5 296.927,2 27.954,3 319.369,4 30.688,5 30.688,5 109,8 103,1
Excises 71.275,2 86.850,1 98.600,6 110.137,0 134.781,1 10.990,9 152.166,6 13.923,3 13.923,3 126,7 118,9
Customs 38.964,7 45.375,0 57.380,9 64.784,3 48.039,8 2.256,6 44.285,5 2.253,7 2.253,7 99,9 93,8
Other tax revenue 24.192,0 30.282,7 32.820,0 35.567,7 37.072,2 2.364,5 45.979,6 2.414,7 2.414,7 102,1 95,9
Social contribu ons 182.952,3 231.419,5 270.311,4 312.731,8 318.806,1 22.015,2 323.014,8 22.639,6 22.639,6 102,8 96,6
1.2.Non-tax revenue 83.596,1 109.557,5 125.379,2 140.002,0 139.528,0 7.476,6 158.034,0 8.673,9 8.673,9 116,0 108,9
2. Capital revenues 160,3 277,4 5.330,4 1.538,2 187,0 1,8 1.518,8 96,1 96,1 5.462,0 5.128,6
3. Grants 2.857,1 1.877,8 1.301,9 1.529,6 6.473,3 70,5 7.389,6 111,1 111,1 157,5 147,9
II PUBLIC EXPENDITURES 706.844,2 899.287,0 1.046.848,4 1.213.888,8 1.267.905,0 83.792,8 1.359.872,3 90.830,0 90.830,0 108,4 101,8
1. Current expenditures 653.189,3 807.018,2 919.453,6 1.088.803,2 1.154.156,1 81.318,5 1.224.773,2 88.957,8 88.957,8 109,4 102,7
Expenditure for employees 170.016,1 204.398,2 238.325,3 293.132,5 301.846,3 21.063,9 308.051,2 22.555,5 22.555,5 107,1 100,5
Purchase of goods and services 107.217,7 135.873,8 168.130,3 181.075,5 186.412,0 11.914,0 202.544,6 12.655,2 12.655,2 106,2 99,7
Interest payment 17.658,9 30.210,7 17.893,5 16.324,3 22.377,9 1.781,4 34.193,0 1.905,9 1.905,9 107,0 100,5
Subsidies 54.880,0 55.554,9 63.697,5 77.984,4 63.075,9 2.660,3 77.858,6 2.724,1 2.724,1 102,4 96,1
Social assistance and insurance 285.650,3 360.442,1 409.284,3 496.805,4 555.632,2 43.110,5 579.184,2 45.107,6 45.107,6 104,6 98,2
of which: Pensions 186.115,4 227.735,4 259.858,2 331.027,9 387.306,0 30.486,3 394.035,4 31.528,6 31.528,6 103,4 97,1
Unemployment benefi ts 9.575,7 11.889,1 14.694,1 16.718,5 19.348,5 1.532,7 21.865,1 1.421,2 1.421,2 92,7 87,1
Sick leave 6.815,5 6.897,2 4.997,4 6.070,7 6.767,0 455,9 6.770,1 372,2 372,2 81,7 76,7
Other transfers to households 83.143,7 113.920,4 129.734,6 142.988,3 142.210,8 10.635,7 156.513,6 11.785,6 11.785,6 110,8 104,0
Other current expenditure 17.766,3 20.538,5 22.122,6 23.481,0 24.811,8 788,3 22.941,7 4.009,5 4.009,5 508,6 477,6
2. Capital expenditures 45.866,4 81.337,0 112.061,0 105.906,3 93.270,8 2.389,2 105.105,1 1.676,6 1.676,6 70,2 65,9
3. Net lending 7.788,5 10.931,8 15.333,8 19.179,3 20.478,0 85,1 29.993,9 195,6 195,6 229,8 215,8
III CONSOLIDATED BALANCE (I - II) 17.682,5 -31.605,4 -44.800,9 -70.451,1 -121.395,5 616,4 -136.469,6 1.693,3 1.693,3
Financing
IV OTHER PROCEEDS 64.431,6 195.726,5 61.732,4 70.716,3 328.736,1 35.222,1 383.180,1 17.251,0 17.251,0 49,0 46,0
1. Priva za on proceeds 43.509,2 157.891,4 49.761,0 37.527,4 37.925,9 366,8 6.492,5 265,1 265,1 72,3 67,8
2. Receipts from repayment of loans 53,9 55,3 78,1 11.534,5 1.907,3 11,3 1.287,2 3,5 3,5 31,2 29,3
2. Domes c borrowing 9.066,8 27.149,2 5.683,8 15.475,8 243.196,7 19.178,1 304.777,5 16.011,8 16.011,8 83,5 78,4
3. Foreign borrowing 11.801,7 10.630,6 6.209,5 6.178,6 6.725,1 15.665,9 70.623,0 970,6 970,6 6,2 5,8
4. IMF resources 0,0 0,0 0,0 0,0 40.888,4 0,0 0,0 0,0 0,0
V OTHER EXPENSES 32.449,4 58.185,6 38.779,4 44.784,7 171.649,1 19.366,3 256.595,2 17.512,3 17.512,3 90,4 84,9
1. Debt repayment to domes c creditors* 30.411,9 27.109,3 32.964,1 32.533,9 155.348,1 17.099,4 229.912,0 17.109,3 17.109,3 100,1 94,0
1. Debt repayment to foreign creditors 2.037,5 31.076,3 5.694,2 9.000,8 12.748,0 2.266,9 25.683,2 403,0 403,0 17,8 16,7
2. Purchase of fi nancial asset 0,0 0,0 121,1 3.250,0 3.553,0 0,0 1.000,0 0,0 0,0
* Including repayments of Old foreign currency savings and Loan for economic recovery (Rehabilita on loan)Note: Excise revenues include excises from oil derivates, that belong to the Public Enterprise “Serbian Roads”, from 01 Jan-Febuary 2006.Note: Methodological explana ons can be found in the end of bulle n
33
January 2011
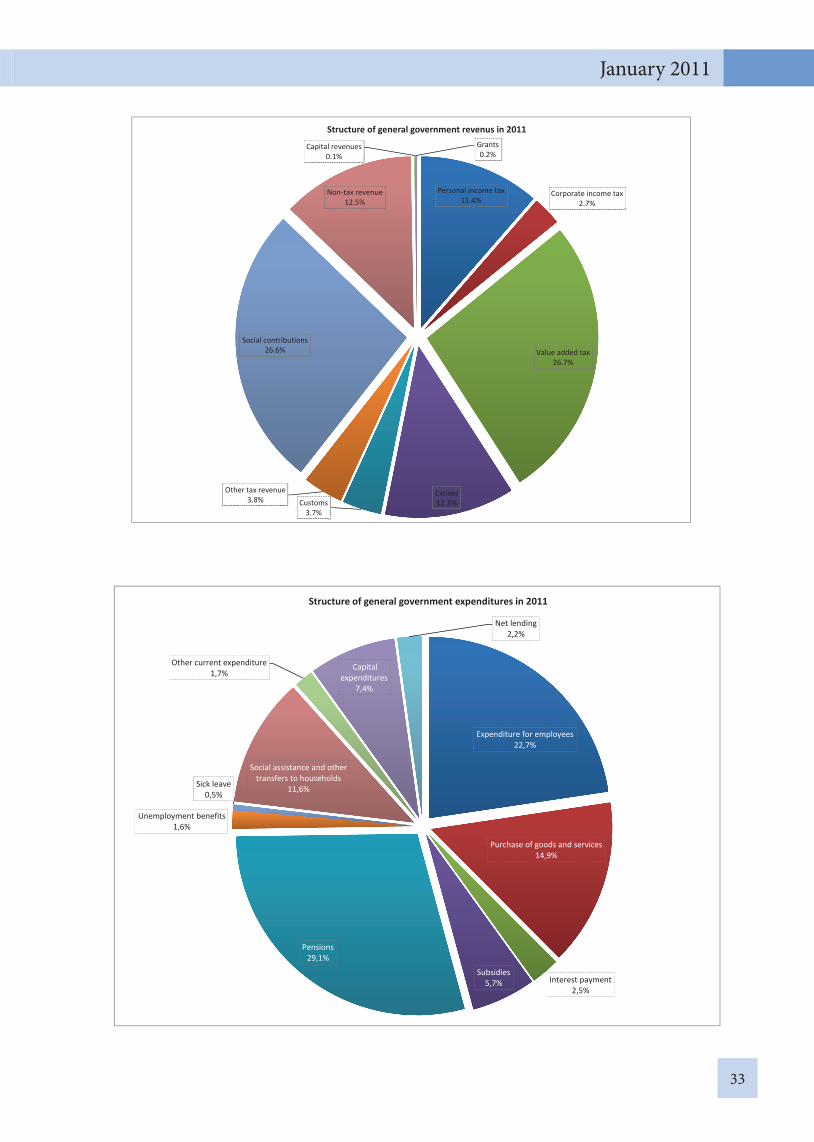
Personal income tax11.4%
Corporate income tax2.7%
Value added tax26.7%
Excises12.3%Customs
3.7%
Other tax revenue3.8%
Social contributions26.6%
Non tax revenue12.5%
Capital revenues0.1%
Grants0.2%
Structure of general government revenus in 2011
Expenditure for employees22,7%
Purchase of goods and services14,9%
Interest payment2,5%
Subsidies5,7%
Pensions29,1%
Unemployment benefits1,6%
Sick leave0,5%
Social assistance and othertransfers to households
11,6%
Other current expenditure1,7%
Capitalexpenditures
7,4%
Net lending2,2%
Structure of general government expenditures in 2011

MIN
ISTR
Y O
F FI
NA
NCE
BULL
ETIN
JAN
UARY
201
1
REPUBLIC OF SERBIA BUDGET(preliminary data for 2010)
Source: Treasury Administration of the Republic of Serbia
FISC
AL
TREN
DS
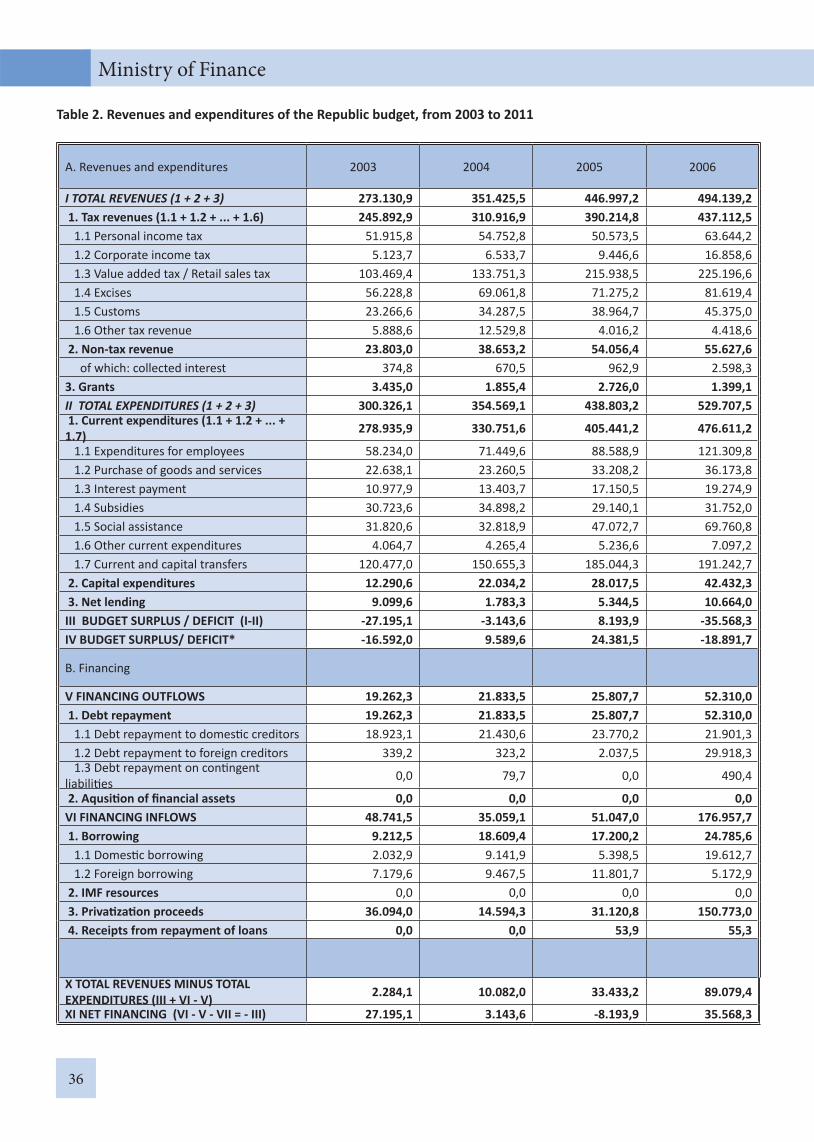
36
Ministry of Finance
Table 2. Revenues and expenditures of the Republic budget, from 2003 to 2011
A. Revenues and expenditures 2003 2004 2005 2006
I TOTAL REVENUES (1 + 2 + 3) 273.130,9 351.425,5 446.997,2 494.139,2 1. Tax revenues (1.1 + 1.2 + ... + 1.6) 245.892,9 310.916,9 390.214,8 437.112,5 1.1 Personal income tax 51.915,8 54.752,8 50.573,5 63.644,2 1.2 Corporate income tax 5.123,7 6.533,7 9.446,6 16.858,6 1.3 Value added tax / Retail sales tax 103.469,4 133.751,3 215.938,5 225.196,6 1.4 Excises 56.228,8 69.061,8 71.275,2 81.619,4 1.5 Customs 23.266,6 34.287,5 38.964,7 45.375,0 1.6 Other tax revenue 5.888,6 12.529,8 4.016,2 4.418,6 2. Non-tax revenue 23.803,0 38.653,2 54.056,4 55.627,6 of which: collected interest 374,8 670,5 962,9 2.598,33. Grants 3.435,0 1.855,4 2.726,0 1.399,1II TOTAL EXPENDITURES (1 + 2 + 3) 300.326,1 354.569,1 438.803,2 529.707,5 1. Current expenditures (1.1 + 1.2 + ... + 1.7) 278.935,9 330.751,6 405.441,2 476.611,2
1.1 Expenditures for employees 58.234,0 71.449,6 88.588,9 121.309,8 1.2 Purchase of goods and services 22.638,1 23.260,5 33.208,2 36.173,8 1.3 Interest payment 10.977,9 13.403,7 17.150,5 19.274,9 1.4 Subsidies 30.723,6 34.898,2 29.140,1 31.752,0 1.5 Social assistance 31.820,6 32.818,9 47.072,7 69.760,8 1.6 Other current expenditures 4.064,7 4.265,4 5.236,6 7.097,2 1.7 Current and capital transfers 120.477,0 150.655,3 185.044,3 191.242,7 2. Capital expenditures 12.290,6 22.034,2 28.017,5 42.432,3 3. Net lending 9.099,6 1.783,3 5.344,5 10.664,0III BUDGET SURPLUS / DEFICIT (I-II) -27.195,1 -3.143,6 8.193,9 -35.568,3IV BUDGET SURPLUS/ DEFICIT* -16.592,0 9.589,6 24.381,5 -18.891,7
B. Financing
V FINANCING OUTFLOWS 19.262,3 21.833,5 25.807,7 52.310,0 1. Debt repayment 19.262,3 21.833,5 25.807,7 52.310,0 1.1 Debt repayment to domes c creditors 18.923,1 21.430,6 23.770,2 21.901,3 1.2 Debt repayment to foreign creditors 339,2 323,2 2.037,5 29.918,3 1.3 Debt repayment on con ngent liabili es 0,0 79,7 0,0 490,4
2. Aqusi on of fi nancial assets 0,0 0,0 0,0 0,0VI FINANCING INFLOWS 48.741,5 35.059,1 51.047,0 176.957,7 1. Borrowing 9.212,5 18.609,4 17.200,2 24.785,6 1.1 Domes c borrowing 2.032,9 9.141,9 5.398,5 19.612,7 1.2 Foreign borrowing 7.179,6 9.467,5 11.801,7 5.172,9 2. IMF resources 0,0 0,0 0,0 0,0 3. Priva za on proceeds 36.094,0 14.594,3 31.120,8 150.773,0 4. Receipts from repayment of loans 0,0 0,0 53,9 55,3
X TOTAL REVENUES MINUS TOTAL EXPENDITURES (III + VI - V) 2.284,1 10.082,0 33.433,2 89.079,4
XI NET FINANCING (VI - V - VII = - III) 27.195,1 3.143,6 -8.193,9 35.568,3
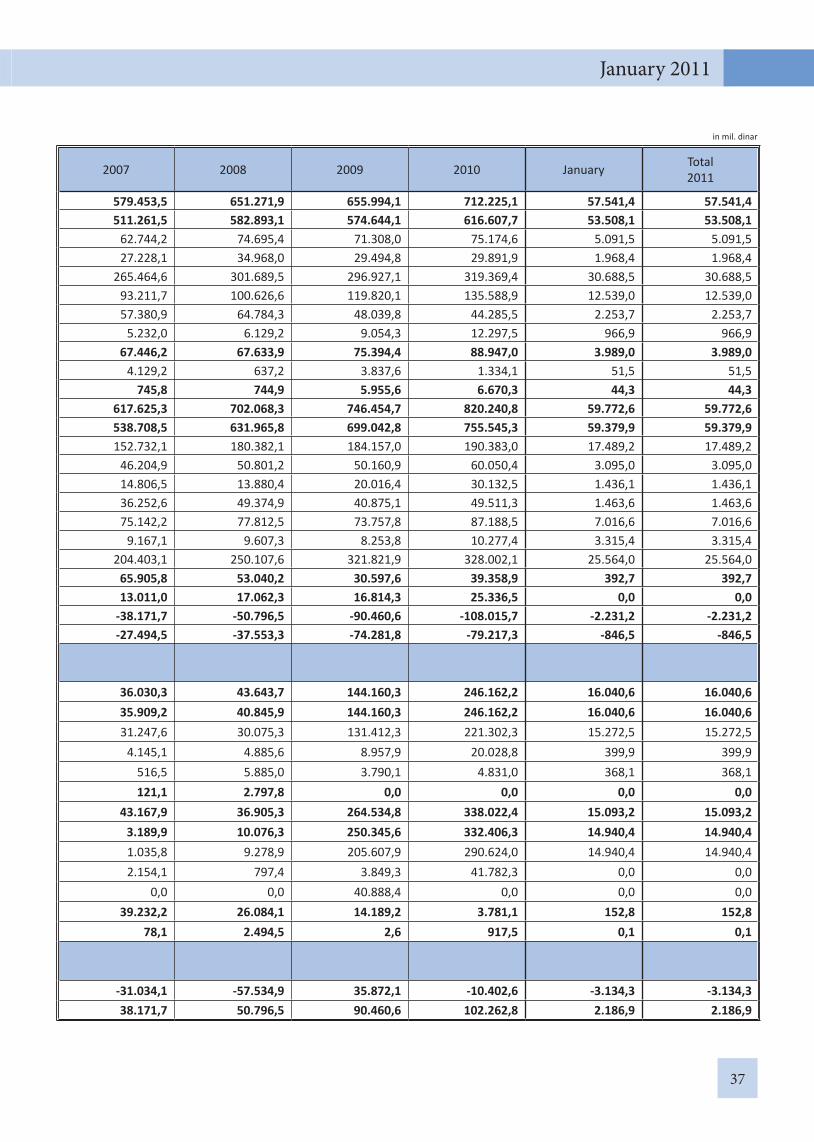
37
January 2011
in mil. dinar
2007 2008 2009 2010 January Total2011
579.453,5 651.271,9 655.994,1 712.225,1 57.541,4 57.541,4511.261,5 582.893,1 574.644,1 616.607,7 53.508,1 53.508,1
62.744,2 74.695,4 71.308,0 75.174,6 5.091,5 5.091,527.228,1 34.968,0 29.494,8 29.891,9 1.968,4 1.968,4
265.464,6 301.689,5 296.927,1 319.369,4 30.688,5 30.688,593.211,7 100.626,6 119.820,1 135.588,9 12.539,0 12.539,057.380,9 64.784,3 48.039,8 44.285,5 2.253,7 2.253,7
5.232,0 6.129,2 9.054,3 12.297,5 966,9 966,967.446,2 67.633,9 75.394,4 88.947,0 3.989,0 3.989,0
4.129,2 637,2 3.837,6 1.334,1 51,5 51,5745,8 744,9 5.955,6 6.670,3 44,3 44,3
617.625,3 702.068,3 746.454,7 820.240,8 59.772,6 59.772,6538.708,5 631.965,8 699.042,8 755.545,3 59.379,9 59.379,9152.732,1 180.382,1 184.157,0 190.383,0 17.489,2 17.489,2
46.204,9 50.801,2 50.160,9 60.050,4 3.095,0 3.095,014.806,5 13.880,4 20.016,4 30.132,5 1.436,1 1.436,136.252,6 49.374,9 40.875,1 49.511,3 1.463,6 1.463,675.142,2 77.812,5 73.757,8 87.188,5 7.016,6 7.016,6
9.167,1 9.607,3 8.253,8 10.277,4 3.315,4 3.315,4204.403,1 250.107,6 321.821,9 328.002,1 25.564,0 25.564,0
65.905,8 53.040,2 30.597,6 39.358,9 392,7 392,713.011,0 17.062,3 16.814,3 25.336,5 0,0 0,0
-38.171,7 -50.796,5 -90.460,6 -108.015,7 -2.231,2 -2.231,2-27.494,5 -37.553,3 -74.281,8 -79.217,3 -846,5 -846,5
36.030,3 43.643,7 144.160,3 246.162,2 16.040,6 16.040,635.909,2 40.845,9 144.160,3 246.162,2 16.040,6 16.040,631.247,6 30.075,3 131.412,3 221.302,3 15.272,5 15.272,5
4.145,1 4.885,6 8.957,9 20.028,8 399,9 399,9516,5 5.885,0 3.790,1 4.831,0 368,1 368,1121,1 2.797,8 0,0 0,0 0,0 0,0
43.167,9 36.905,3 264.534,8 338.022,4 15.093,2 15.093,23.189,9 10.076,3 250.345,6 332.406,3 14.940,4 14.940,41.035,8 9.278,9 205.607,9 290.624,0 14.940,4 14.940,42.154,1 797,4 3.849,3 41.782,3 0,0 0,0
0,0 0,0 40.888,4 0,0 0,0 0,039.232,2 26.084,1 14.189,2 3.781,1 152,8 152,8
78,1 2.494,5 2,6 917,5 0,1 0,1
-31.034,1 -57.534,9 35.872,1 -10.402,6 -3.134,3 -3.134,338.171,7 50.796,5 90.460,6 102.262,8 2.186,9 2.186,9
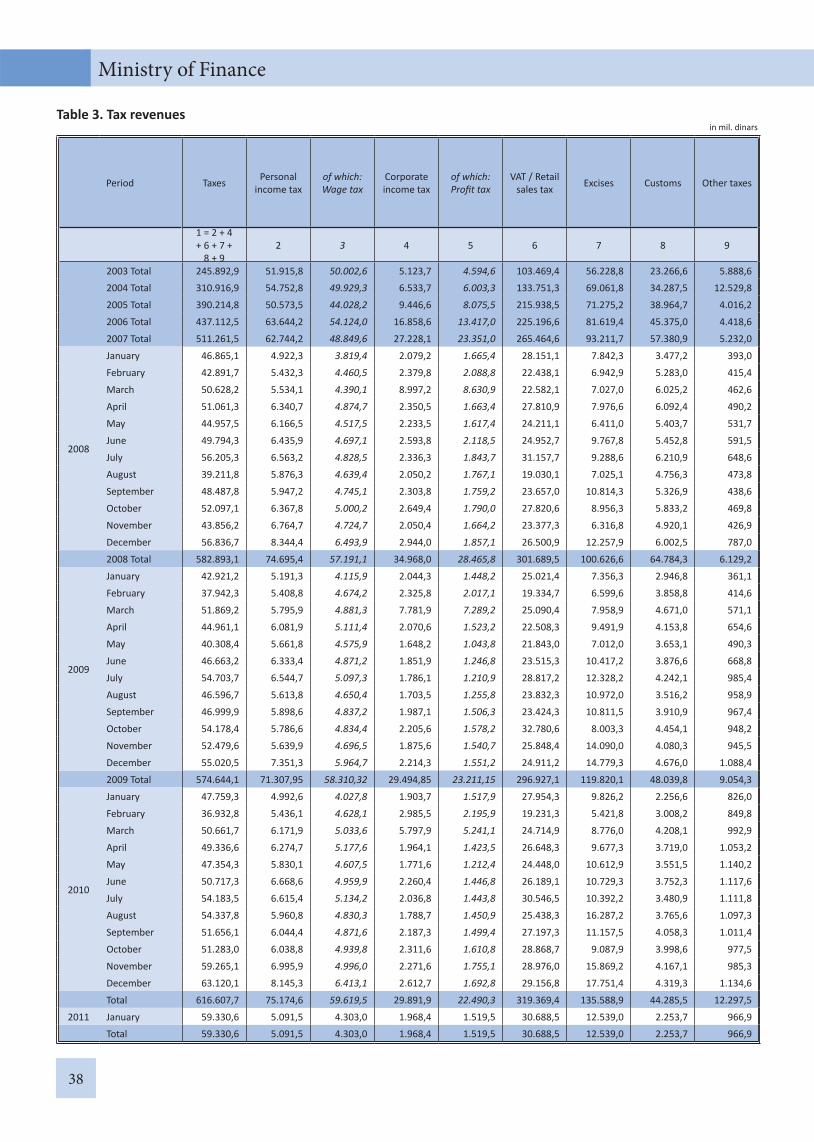
38
Ministry of Finance
Table 3. Tax revenuesin mil. dinars
Period Taxes Personal income tax
of which: Wage tax
Corporate income tax
of which: Profi t tax
VAT / Retail sales tax Excises Customs Other taxes
1 = 2 + 4 + 6 + 7 +
8 + 92 3 4 5 6 7 8 9
2003 Total 245.892,9 51.915,8 50.002,6 5.123,7 4.594,6 103.469,4 56.228,8 23.266,6 5.888,6 2004 Total 310.916,9 54.752,8 49.929,3 6.533,7 6.003,3 133.751,3 69.061,8 34.287,5 12.529,8
2005 Total 390.214,8 50.573,5 44.028,2 9.446,6 8.075,5 215.938,5 71.275,2 38.964,7 4.016,2
2006 Total 437.112,5 63.644,2 54.124,0 16.858,6 13.417,0 225.196,6 81.619,4 45.375,0 4.418,6
2007 Total 511.261,5 62.744,2 48.849,6 27.228,1 23.351,0 265.464,6 93.211,7 57.380,9 5.232,0
2008
January 46.865,1 4.922,3 3.819,4 2.079,2 1.665,4 28.151,1 7.842,3 3.477,2 393,0
February 42.891,7 5.432,3 4.460,5 2.379,8 2.088,8 22.438,1 6.942,9 5.283,0 415,4
March 50.628,2 5.534,1 4.390,1 8.997,2 8.630,9 22.582,1 7.027,0 6.025,2 462,6
April 51.061,3 6.340,7 4.874,7 2.350,5 1.663,4 27.810,9 7.976,6 6.092,4 490,2
May 44.957,5 6.166,5 4.517,5 2.233,5 1.617,4 24.211,1 6.411,0 5.403,7 531,7
June 49.794,3 6.435,9 4.697,1 2.593,8 2.118,5 24.952,7 9.767,8 5.452,8 591,5
July 56.205,3 6.563,2 4.828,5 2.336,3 1.843,7 31.157,7 9.288,6 6.210,9 648,6
August 39.211,8 5.876,3 4.639,4 2.050,2 1.767,1 19.030,1 7.025,1 4.756,3 473,8
September 48.487,8 5.947,2 4.745,1 2.303,8 1.759,2 23.657,0 10.814,3 5.326,9 438,6
October 52.097,1 6.367,8 5.000,2 2.649,4 1.790,0 27.820,6 8.956,3 5.833,2 469,8
November 43.856,2 6.764,7 4.724,7 2.050,4 1.664,2 23.377,3 6.316,8 4.920,1 426,9
December 56.836,7 8.344,4 6.493,9 2.944,0 1.857,1 26.500,9 12.257,9 6.002,5 787,0
2008 Total 582.893,1 74.695,4 57.191,1 34.968,0 28.465,8 301.689,5 100.626,6 64.784,3 6.129,2
2009
January 42.921,2 5.191,3 4.115,9 2.044,3 1.448,2 25.021,4 7.356,3 2.946,8 361,1
February 37.942,3 5.408,8 4.674,2 2.325,8 2.017,1 19.334,7 6.599,6 3.858,8 414,6
March 51.869,2 5.795,9 4.881,3 7.781,9 7.289,2 25.090,4 7.958,9 4.671,0 571,1
April 44.961,1 6.081,9 5.111,4 2.070,6 1.523,2 22.508,3 9.491,9 4.153,8 654,6
May 40.308,4 5.661,8 4.575,9 1.648,2 1.043,8 21.843,0 7.012,0 3.653,1 490,3
June 46.663,2 6.333,4 4.871,2 1.851,9 1.246,8 23.515,3 10.417,2 3.876,6 668,8
July 54.703,7 6.544,7 5.097,3 1.786,1 1.210,9 28.817,2 12.328,2 4.242,1 985,4
August 46.596,7 5.613,8 4.650,4 1.703,5 1.255,8 23.832,3 10.972,0 3.516,2 958,9
September 46.999,9 5.898,6 4.837,2 1.987,1 1.506,3 23.424,3 10.811,5 3.910,9 967,4
October 54.178,4 5.786,6 4.834,4 2.205,6 1.578,2 32.780,6 8.003,3 4.454,1 948,2
November 52.479,6 5.639,9 4.696,5 1.875,6 1.540,7 25.848,4 14.090,0 4.080,3 945,5
December 55.020,5 7.351,3 5.964,7 2.214,3 1.551,2 24.911,2 14.779,3 4.676,0 1.088,4
2009 Total 574.644,1 71.307,95 58.310,32 29.494,85 23.211,15 296.927,1 119.820,1 48.039,8 9.054,3
2010
January 47.759,3 4.992,6 4.027,8 1.903,7 1.517,9 27.954,3 9.826,2 2.256,6 826,0
February 36.932,8 5.436,1 4.628,1 2.985,5 2.195,9 19.231,3 5.421,8 3.008,2 849,8
March 50.661,7 6.171,9 5.033,6 5.797,9 5.241,1 24.714,9 8.776,0 4.208,1 992,9
April 49.336,6 6.274,7 5.177,6 1.964,1 1.423,5 26.648,3 9.677,3 3.719,0 1.053,2
May 47.354,3 5.830,1 4.607,5 1.771,6 1.212,4 24.448,0 10.612,9 3.551,5 1.140,2
June 50.717,3 6.668,6 4.959,9 2.260,4 1.446,8 26.189,1 10.729,3 3.752,3 1.117,6
July 54.183,5 6.615,4 5.134,2 2.036,8 1.443,8 30.546,5 10.392,2 3.480,9 1.111,8
August 54.337,8 5.960,8 4.830,3 1.788,7 1.450,9 25.438,3 16.287,2 3.765,6 1.097,3
September 51.656,1 6.044,4 4.871,6 2.187,3 1.499,4 27.197,3 11.157,5 4.058,3 1.011,4
October 51.283,0 6.038,8 4.939,8 2.311,6 1.610,8 28.868,7 9.087,9 3.998,6 977,5
November 59.265,1 6.995,9 4.996,0 2.271,6 1.755,1 28.976,0 15.869,2 4.167,1 985,3
December 63.120,1 8.145,3 6.413,1 2.612,7 1.692,8 29.156,8 17.751,4 4.319,3 1.134,6
Total 616.607,7 75.174,6 59.619,5 29.891,9 22.490,3 319.369,4 135.588,9 44.285,5 12.297,5
2011 January 59.330,6 5.091,5 4.303,0 1.968,4 1.519,5 30.688,5 12.539,0 2.253,7 966,9 Total 59.330,6 5.091,5 4.303,0 1.968,4 1.519,5 30.688,5 12.539,0 2.253,7 966,9

39
January 2011
Table 4. Value added tax and excisesin mil. dinars
Period VAT VAT - domes c
VAT - imports
Retail sales tax (from previous
years)
VAT reimbursement Excises
Excises on oil
derivates
Tobacco excises
Other excises
1 = 2 + 3 + 4 2 3 4 5 6 = 7 + 8
+ 9 7 8 9
2005 Total 215.938,5 70.440,9 121.680,2 23.817,5 26.824,3 71.275,2 44.044,8 19.044,5 8.185,9 2006 Total 225.196,6 68.494,3 150.235,2 6.467,1 57.134,0 81.619,4 45.915,7 26.147,0 9.556,7
2007 Total 265.464,6 81.678,2 179.238,2 4.548,2 70.732,7 93.211,7 49.107,8 34.371,9 9.732,0
2008
January 28.151,1 15.467,7 12.473,9 209,5 7.232,5 7.842,3 3.557,7 3.611,0 673,6
February 22.438,1 5.285,4 16.644,5 508,2 7.458,3 6.942,9 3.741,2 2.351,3 850,5
March 22.582,1 3.987,8 18.325,2 269,1 7.220,4 7.027,0 3.928,0 2.347,9 751,1
April 27.810,9 8.834,9 18.625,3 350,7 6.373,5 7.976,6 4.290,4 2.910,1 776,1
May 24.211,1 6.236,5 17.656,9 317,7 7.338,4 6.411,0 2.423,9 3.090,2 896,9
June 24.952,7 6.462,6 18.173,7 316,4 7.497,5 9.767,8 5.631,1 3.191,9 944,8
July 31.157,7 9.592,4 21.214,2 351,0 7.385,6 9.288,6 4.689,2 3.590,5 1.008,8
August 19.030,1 3.123,8 15.672,7 233,6 9.971,4 7.025,1 2.896,8 3.474,0 654,3
September 23.657,0 5.940,3 17.338,1 378,6 7.666,2 10.814,3 6.101,9 3.583,6 1.128,8
October 27.820,6 10.245,2 17.311,5 263,9 7.011,2 8.956,3 4.661,4 3.506,7 788,2
November 23.377,3 6.919,6 16.241,6 216,1 8.010,0 6.316,8 2.837,1 2.852,7 627,0
December 26.500,9 6.603,1 19.389,6 508,2 7.664,7 12.257,9 6.238,1 4.829,9 1.190,0
2008 Total 301.689,5 88.699,4 209.067,2 3.923,0 90.829,7 100.626,6 50.996,7 39.339,9 10.290,0
2009
January 25.021,4 15.740,0 9.036,1 245,4 6.142,1 7.356,3 2.379,6 4.358,8 617,9
February 19.334,7 5.670,0 13.389,2 275,5 7.422,8 6.599,6 4.231,3 1.944,7 423,6
March 25.090,4 9.392,8 15.392,6 305,0 2.683,6 7.958,9 5.006,9 2.275,3 676,7
April 22.508,3 7.602,5 14.637,9 267,8 8.259,9 9.491,9 4.974,2 3.667,3 850,4
May 21.843,0 8.579,9 12.989,0 274,2 5.604,8 7.012,0 2.734,3 3.519,3 758,5
June 23.515,3 8.578,6 14.646,2 290,5 6.229,1 10.417,2 5.342,0 3.834,1 1.241,0
July 28.817,2 13.114,8 15.455,9 246,4 5.476,7 12.328,2 6.258,4 5.185,4 884,4
August 23.832,3 10.064,1 13.531,7 236,5 5.829,1 10.972,0 5.857,9 4.123,4 990,6
September 23.424,3 9.560,2 13.695,4 168,7 5.266,7 10.811,5 5.831,3 4.068,4 911,8
October 32.780,6 15.426,6 17.120,7 233,3 5.325,6 8.003,3 3.703,9 3.633,2 666,2
November 25.848,4 10.147,0 15.485,4 216,1 4.772,8 14.090,0 8.161,6 4.951,0 977,4
December 24.911,2 6.740,5 17.968,6 202,1 7.499,6 14.779,3 4.901,4 9.042,9 835,0
2009 Total 296.927,1 120.616,9 173.348,6 2.961,6 70.512,8 119.820,1 59.382,8 50.604,0 9.833,3
2010
January 27.954,3 17.565,3 10.188,9 200,1 5.404,4 9.826,2 3.182,9 6.103,5 539,8
February 19.231,3 6.035,1 12.950,2 246,0 6.452,6 5.421,8 3.788,3 1.012,2 621,4
March 24.714,9 7.891,1 16.653,4 170,4 5.450,3 8.776,0 5.874,9 2.173,3 727,7
April 26.648,3 10.775,6 15.619,9 252,8 6.942,9 9.677,3 5.436,0 3.274,6 966,7
May 24.448,0 7.959,3 16.235,5 253,2 6.902,5 10.612,9 5.176,5 4.381,5 1.054,8
June 26.189,1 7.884,6 18.075,8 228,7 6.518,2 10.729,3 4.338,4 5.410,4 980,5
July 30.546,5 11.244,6 19.013,0 288,9 7.391,0 10.392,2 3.142,2 6.381,4 868,6
August 25.438,3 6.728,6 18.475,8 233,9 9.517,4 16.287,2 8.711,8 6.231,3 1.344,2
September 27.197,3 7.515,8 19.405,8 275,7 7.684,7 11.157,5 6.135,2 3.926,9 1.095,3
October 28.868,7 10.410,7 18.285,6 172,3 8.677,3 9.087,9 3.992,0 4.328,8 767,0
November 28.976,0 8.020,8 20.707,9 247,2 8.706,4 15.869,2 8.164,3 6.634,7 1.070,2
December 29.156,8 6.957,2 22.038,2 161,4 8.895,9 17.751,4 5.855,7 10.911,9 983,8
Total 319.369,4 108.988,8 207.649,9 2.730,7 88.543,5 135.588,9 63.798,2 60.770,6 11.020,1
2011 January 30.688,5 17.188,6 13.262,2 237,7 9.416,8 12.539,0 3.659,9 8.315,5 563,7 Total 30.688,5 17.188,6 13.262,2 237,7 9.416,8 12.539,0 3.659,9 8.315,5 563,7
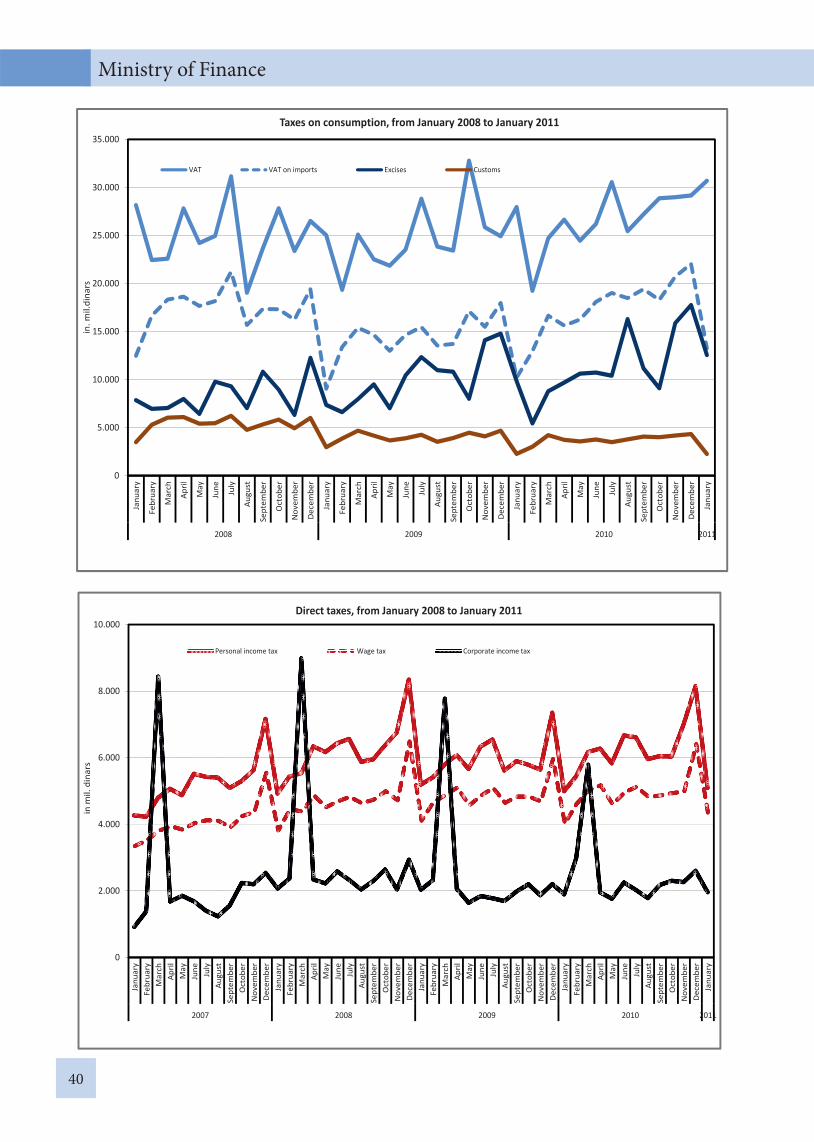
40
0
5.000
10.000
15.000
20.000
25.000
30.000
35.000Ja
nuar
y
Febr
uary
Mar
ch
April
May
June July
Augu
st
Sept
embe
r
Oct
ober
Nov
embe
r
Dec
embe
r
Janu
ary
Febr
uary
Mar
ch
April
May
June July
Augu
st
Sept
embe
r
Oct
ober
Nov
embe
r
Dec
embe
r
Janu
ary
Febr
uary
Mar
ch
April
May
June July
Augu
st
Sept
embe
r
Oct
ober
Nov
embe
r
Dec
embe
r
Janu
ary
2008 2009 2010 2011
in.m
il.di
nars
Taxes on consumption, from January 2008 to January 2011
VAT VAT on imports Excises Customs
0
2.000
4.000
6.000
8.000
10.000
Janu
ary
Febr
uary
Mar
chAp
rilM
ayJu
ne July
Augu
stSe
ptem
ber
Oct
ober
Nov
embe
rD
ecem
ber
Janu
ary
Febr
uary
Mar
chAp
rilM
ayJu
ne July
Augu
stSe
ptem
ber
Oct
ober
Nov
embe
rD
ecem
ber
Janu
ary
Febr
uary
Mar
chAp
rilM
ayJu
ne July
Augu
stSe
ptem
ber
Oct
ober
Nov
embe
rD
ecem
ber
Janu
ary
Febr
uary
Mar
chAp
rilM
ayJu
ne July
Augu
stSe
ptem
ber
Oct
ober
Nov
embe
rD
ecem
ber
Janu
ary
2007 2008 2009 2010 2011
inm
il.di
nars
Direct taxes, from January 2008 to January 2011
Personal income tax Wage tax Corporate income tax
Ministry of Finance
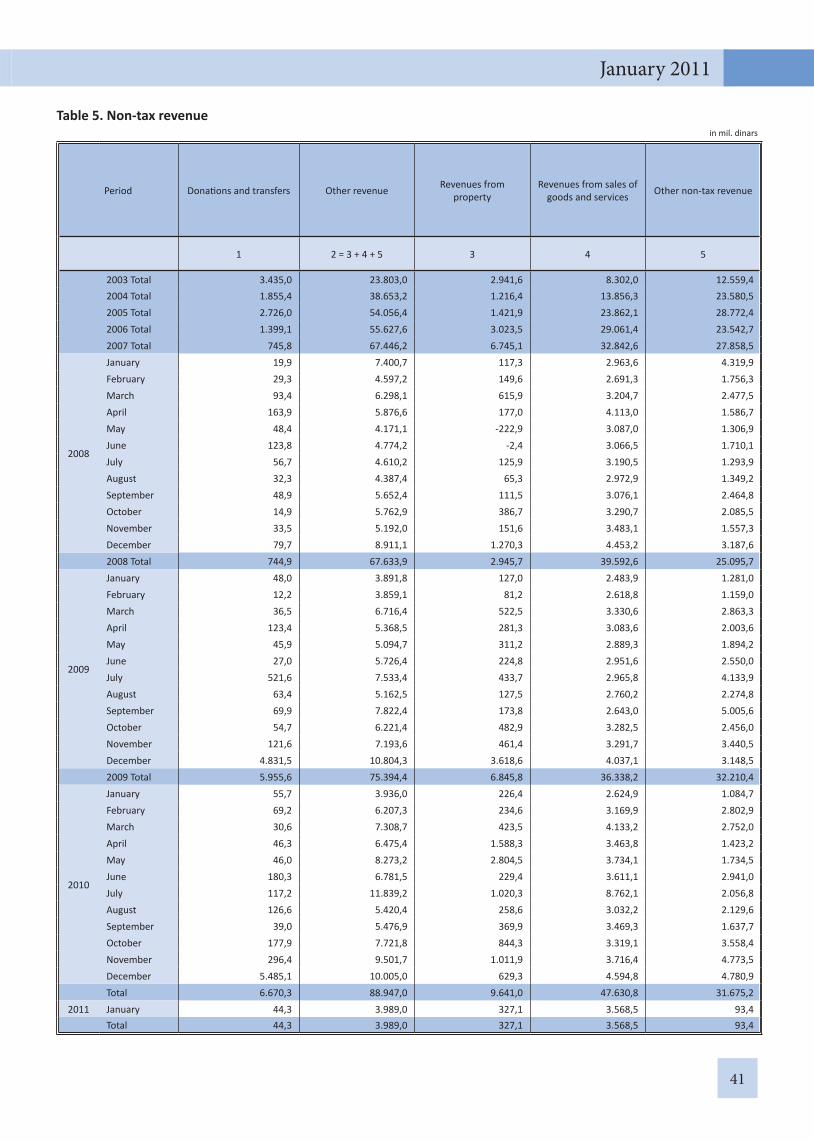
41
January 2011
Table 5. Non-tax revenuein mil. dinars
Period Dona ons and transfers Other revenue Revenues from property
Revenues from sales of goods and services Other non-tax revenue
1 2 = 3 + 4 + 5 3 4 5
2003 Total 3.435,0 23.803,0 2.941,6 8.302,0 12.559,4 2004 Total 1.855,4 38.653,2 1.216,4 13.856,3 23.580,5 2005 Total 2.726,0 54.056,4 1.421,9 23.862,1 28.772,4 2006 Total 1.399,1 55.627,6 3.023,5 29.061,4 23.542,7 2007 Total 745,8 67.446,2 6.745,1 32.842,6 27.858,5
2008
January 19,9 7.400,7 117,3 2.963,6 4.319,9February 29,3 4.597,2 149,6 2.691,3 1.756,3March 93,4 6.298,1 615,9 3.204,7 2.477,5April 163,9 5.876,6 177,0 4.113,0 1.586,7May 48,4 4.171,1 -222,9 3.087,0 1.306,9June 123,8 4.774,2 -2,4 3.066,5 1.710,1July 56,7 4.610,2 125,9 3.190,5 1.293,9August 32,3 4.387,4 65,3 2.972,9 1.349,2September 48,9 5.652,4 111,5 3.076,1 2.464,8October 14,9 5.762,9 386,7 3.290,7 2.085,5November 33,5 5.192,0 151,6 3.483,1 1.557,3December 79,7 8.911,1 1.270,3 4.453,2 3.187,6
2008 Total 744,9 67.633,9 2.945,7 39.592,6 25.095,7
2009
January 48,0 3.891,8 127,0 2.483,9 1.281,0February 12,2 3.859,1 81,2 2.618,8 1.159,0March 36,5 6.716,4 522,5 3.330,6 2.863,3April 123,4 5.368,5 281,3 3.083,6 2.003,6May 45,9 5.094,7 311,2 2.889,3 1.894,2June 27,0 5.726,4 224,8 2.951,6 2.550,0July 521,6 7.533,4 433,7 2.965,8 4.133,9August 63,4 5.162,5 127,5 2.760,2 2.274,8September 69,9 7.822,4 173,8 2.643,0 5.005,6October 54,7 6.221,4 482,9 3.282,5 2.456,0November 121,6 7.193,6 461,4 3.291,7 3.440,5December 4.831,5 10.804,3 3.618,6 4.037,1 3.148,5
2009 Total 5.955,6 75.394,4 6.845,8 36.338,2 32.210,4
2010
January 55,7 3.936,0 226,4 2.624,9 1.084,7February 69,2 6.207,3 234,6 3.169,9 2.802,9March 30,6 7.308,7 423,5 4.133,2 2.752,0April 46,3 6.475,4 1.588,3 3.463,8 1.423,2May 46,0 8.273,2 2.804,5 3.734,1 1.734,5June 180,3 6.781,5 229,4 3.611,1 2.941,0July 117,2 11.839,2 1.020,3 8.762,1 2.056,8August 126,6 5.420,4 258,6 3.032,2 2.129,6September 39,0 5.476,9 369,9 3.469,3 1.637,7October 177,9 7.721,8 844,3 3.319,1 3.558,4November 296,4 9.501,7 1.011,9 3.716,4 4.773,5December 5.485,1 10.005,0 629,3 4.594,8 4.780,9
Total 6.670,3 88.947,0 9.641,0 47.630,8 31.675,22011 January 44,3 3.989,0 327,1 3.568,5 93,4
Total 44,3 3.989,0 327,1 3.568,5 93,4

42
Ministry of Finance
Table 6. Total expenditures of the Republic budget
Period Total expenditures Current expenditures
Expenditure for employees
Purchase of goods and services Interest payment Subsidies
1 = 2 + 10 + 13 + 14 2 = 3 + 4 + 5 + 6 + 7 + 8 + 9 3 4 5 6
2003 Total 319.588,4 278.935,9 58.234,0 22.638,1 10.977,9 30.723,6 2004 Total 376.402,6 330.751,6 71.449,6 23.260,5 13.403,7 34.898,2 2005 Total 464.610,9 405.441,2 88.588,9 33.208,2 17.150,5 29.140,1 2006 Total 568.217,0 476.611,2 121.309,8 36.173,8 19.274,9 31.752,0 2007 Total 653.534,5 538.708,5 152.732,1 46.204,9 14.806,5 36.252,6
2008
January 51.789,2 48.261,3 15.508,4 1.918,9 37,0 1.960,1February 56.012,3 45.621,0 14.017,2 3.568,1 236,1 3.102,8March 61.845,0 51.891,5 13.859,5 4.174,9 4.775,8 2.849,4April 65.085,1 56.155,9 16.143,6 3.847,9 1.697,4 4.949,2May 68.807,9 52.950,5 15.188,0 4.214,4 252,1 6.205,7June 65.256,9 50.214,3 14.671,5 4.683,3 336,0 3.095,4July 54.261,7 48.955,7 14.694,7 4.243,6 626,3 2.687,2August 52.064,2 47.234,0 14.488,3 4.183,4 514,3 3.039,2September 62.482,1 50.121,0 14.441,4 4.069,5 3.309,0 2.476,5October 58.254,5 51.817,7 15.471,2 3.880,5 1.966,6 3.870,7November 65.542,1 58.953,8 15.061,6 5.030,7 212,4 4.933,7December 91.358,1 69.789,1 16.836,7 6.986,0 -82,7 10.205,1
2008 Total 752.759,0 631.965,6 180.382,1 50.801,2 13.880,4 49.374,9
2009
January 47.003,0 46.585,0 15.079,4 1.905,0 116,3 1.561,2February 52.003,2 50.998,5 15.009,2 2.435,9 687,3 2.698,7March 64.970,6 58.806,4 15.234,2 2.831,7 4.410,0 2.428,0April 69.291,1 64.439,8 15.366,0 4.913,2 2.650,9 3.125,4May 68.482,6 56.061,2 15.144,0 4.569,4 547,9 2.893,2June 79.840,6 58.947,6 15.233,0 4.457,8 990,2 4.431,8July 81.867,7 58.903,8 15.451,2 4.783,0 -75,9 5.882,4August 89.801,6 58.350,7 15.222,1 3.863,4 2.781,4 4.149,2September 79.555,0 58.732,2 15.020,0 4.397,8 3.532,9 3.122,4October 76.145,5 60.762,5 15.351,5 4.489,0 1.950,5 4.262,2November 81.231,8 57.764,7 15.693,0 4.366,0 816,7 2.804,1December 100.422,3 68.690,4 16.353,4 7.148,6 1.608,2 3.516,5
2009 Total 890.615,0 699.042,8 184.157,0 50.160,9 20.016,4 40.875,1
2010
January 71.224,0 51.955,3 15.441,6 3.193,1 1.024,2 1.601,4February 78.107,3 57.260,3 15.620,3 3.589,7 1.672,8 2.612,0March 84.335,6 59.309,8 15.946,5 3.892,1 3.545,3 2.241,7April 86.563,1 62.889,1 15.580,0 4.366,8 3.795,9 2.827,1May 97.564,8 61.397,0 15.613,4 4.056,4 1.020,8 5.189,1June 80.045,7 62.616,0 15.811,9 3.933,9 2.924,9 5.288,0July 89.555,8 68.330,7 15.880,3 5.302,4 1.220,7 9.210,4August 73.239,7 58.446,2 15.633,1 4.082,8 1.516,6 3.206,0September 90.564,0 62.820,1 15.683,4 4.522,4 4.528,6 3.469,2October 102.966,0 69.173,6 15.889,7 4.233,7 4.387,9 3.405,0November 85.829,7 61.385,4 16.367,7 5.222,1 1.301,9 3.951,7December 126.407,1 79.961,8 16.915,1 13.655,1 3.193,1 6.509,8
Total 1.066.403,0 755.545,3 190.383,0 60.050,4 30.132,5 49.511,32011 January 75.813,1 59.379,9 17.489,2 3.095,0 1.436,1 1.463,6
Total 75.813,1 59.379,9 17.489,2 3.095,0 1.436,1 1.463,6
Ministry of Finance

43
January 2011
in mil. dinars
Grants and transfers Social assistance Other current
expendituresCapital
expenditures
Expenditures for fi xed and
natural assets
Expenditures for NIP Debt repayment Net lending
7 8 9 10 = 11 + 12 11 12 13 14
120.477,0 31.820,6 4.064,7 12.290,6 12.290,6 ... 19.262,3 9.099,6150.655,3 32.818,9 4.265,4 22.034,2 22.034,2 ... 21.833,5 1.783,3185.044,3 47.072,7 5.236,6 28.017,5 28.017,5 ... 25.807,7 5.344,5191.242,7 69.760,8 7.097,2 42.432,3 33.293,2 9.139,1 38.509,5 10.664,0204.403,1 75.142,2 9.167,1 65.905,8 26.581,6 39.324,2 35.909,2 13.011,0
16.159,1 12.328,7 349,2 268,6 266,4 2,2 978,8 2.280,418.345,4 5.560,3 791,1 2.190,5 1.652,4 538,1 5.319,7 2.881,120.089,0 5.388,6 754,4 4.342,0 979,6 3.362,4 3.820,4 1.791,022.048,8 6.817,0 652,1 7.895,5 1.944,2 5.951,3 757,0 276,719.599,6 6.340,6 1.150,0 4.181,7 1.267,7 2.914,0 10.725,1 950,719.871,5 6.328,6 1.227,9 2.881,3 1.734,9 1.146,3 8.401,3 3.760,020.066,0 6.026,5 611,3 2.779,0 1.443,9 1.335,1 1.955,3 571,719.473,0 4.728,0 807,7 2.231,2 1.905,9 325,3 1.879,4 719,719.554,4 5.694,0 576,2 4.019,0 2.977,4 1.041,6 7.578,1 764,120.314,1 5.709,8 604,9 4.799,8 3.137,8 1.662,0 964,4 672,527.093,0 5.754,6 867,8 3.976,0 3.594,1 381,9 1.603,5 1.008,927.493,7 7.135,7 1.214,7 13.475,8 8.434,0 5.041,8 6.707,8 1.385,4
250.107,4 77.812,5 9.607,3 53.040,2 29.338,3 23.701,9 50.690,9 17.062,322.816,5 4.769,5 337,1 253,3 240,7 12,6 151,0 13,724.206,5 5.509,6 451,3 425,2 425,2 0,0 203,8 375,726.872,5 6.417,8 612,2 593,7 593,7 0,0 5.241,4 329,132.103,9 5.925,0 355,4 1.122,0 1.122,0 0,0 2.901,9 827,425.750,8 6.310,1 845,8 2.078,8 1.528,4 550,4 8.201,1 2.141,526.131,2 7.333,5 370,2 2.858,2 1.706,8 1.151,4 16.291,5 1.743,326.024,1 6.253,3 585,7 2.330,0 2.034,2 295,8 18.246,1 2.387,827.009,9 4.376,7 947,9 2.409,9 1.853,5 556,4 27.999,3 1.041,724.961,7 7.179,0 518,6 2.740,2 1.850,1 890,2 16.780,8 1.301,728.213,3 5.554,4 941,6 2.142,8 1.437,3 705,5 12.299,1 941,127.009,7 6.310,7 764,5 3.299,9 2.085,2 1.214,7 18.230,1 1.937,130.721,7 7.818,3 1.523,6 10.343,5 4.653,9 5.689,6 17.614,3 3.774,2
321.821,9 73.757,8 8.253,8 30.597,6 19.531,0 11.066,6 144.160,3 16.814,324.753,4 5.559,0 382,8 722,7 722,7 0,0 18.539,4 6,627.547,1 5.840,3 378,0 1.024,4 1.024,4 0,0 19.360,6 462,026.580,6 6.276,1 827,5 829,2 756,7 72,5 21.494,2 2.702,427.774,8 7.769,8 774,8 1.124,6 797,5 327,1 20.336,7 2.212,626.653,1 8.082,3 781,9 1.754,1 975,5 778,7 31.599,2 2.814,527.482,5 6.323,6 851,2 1.525,1 1.230,1 295,0 14.584,8 1.319,827.696,7 8.165,7 854,5 2.853,7 1.665,5 1.188,2 14.846,8 3.524,627.108,0 5.973,8 925,8 2.543,3 2.013,3 530,0 10.021,3 2.228,927.908,2 5.972,1 736,2 4.168,4 1.915,1 2.253,3 20.886,1 2.689,527.858,6 12.667,9 730,9 4.602,8 3.724,1 878,7 27.435,7 1.754,027.405,0 6.299,0 838,0 4.814,3 3.592,4 1.221,9 18.311,2 1.318,829.234,2 8.258,9 2.195,8 13.396,3 10.841,2 2.555,0 28.746,1 4.302,9
328.002,1 87.188,5 10.277,4 39.358,9 29.258,5 10.100,4 246.162,2 25.336,525.564,0 7.016,6 3.315,4 392,7 392,7 0,0 16.040,6 0,025.564,0 7.016,6 3.315,4 392,7 392,7 0,0 16.040,6 0,0
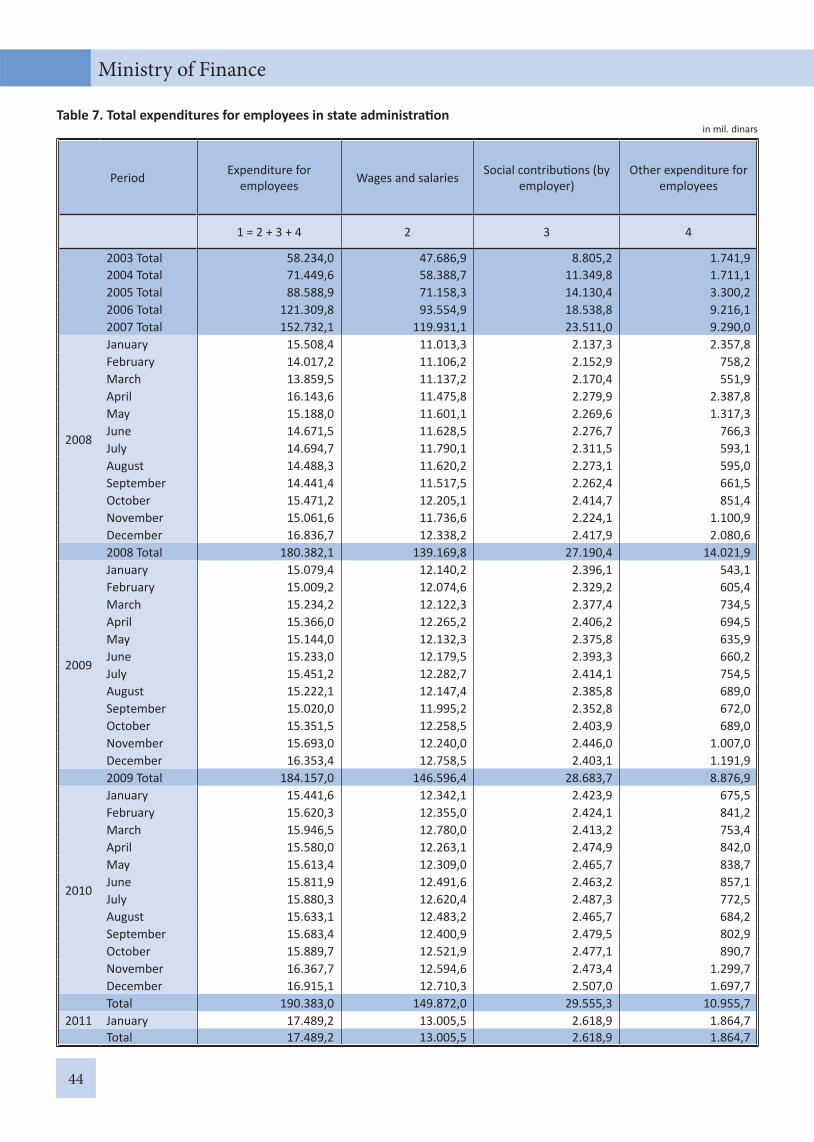
44
Ministry of Finance
Table 7. Total expenditures for employees in state administra on in mil. dinars
Period Expenditure for employees Wages and salaries Social contribu ons (by
employer)Other expenditure for
employees
1 = 2 + 3 + 4 2 3 4
2003 Total 58.234,0 47.686,9 8.805,2 1.741,9 2004 Total 71.449,6 58.388,7 11.349,8 1.711,1 2005 Total 88.588,9 71.158,3 14.130,4 3.300,2 2006 Total 121.309,8 93.554,9 18.538,8 9.216,1 2007 Total 152.732,1 119.931,1 23.511,0 9.290,0
2008
January 15.508,4 11.013,3 2.137,3 2.357,8February 14.017,2 11.106,2 2.152,9 758,2March 13.859,5 11.137,2 2.170,4 551,9April 16.143,6 11.475,8 2.279,9 2.387,8May 15.188,0 11.601,1 2.269,6 1.317,3June 14.671,5 11.628,5 2.276,7 766,3July 14.694,7 11.790,1 2.311,5 593,1August 14.488,3 11.620,2 2.273,1 595,0September 14.441,4 11.517,5 2.262,4 661,5October 15.471,2 12.205,1 2.414,7 851,4November 15.061,6 11.736,6 2.224,1 1.100,9December 16.836,7 12.338,2 2.417,9 2.080,6
2008 Total 180.382,1 139.169,8 27.190,4 14.021,9
2009
January 15.079,4 12.140,2 2.396,1 543,1February 15.009,2 12.074,6 2.329,2 605,4March 15.234,2 12.122,3 2.377,4 734,5April 15.366,0 12.265,2 2.406,2 694,5May 15.144,0 12.132,3 2.375,8 635,9June 15.233,0 12.179,5 2.393,3 660,2July 15.451,2 12.282,7 2.414,1 754,5August 15.222,1 12.147,4 2.385,8 689,0September 15.020,0 11.995,2 2.352,8 672,0October 15.351,5 12.258,5 2.403,9 689,0November 15.693,0 12.240,0 2.446,0 1.007,0December 16.353,4 12.758,5 2.403,1 1.191,9
2009 Total 184.157,0 146.596,4 28.683,7 8.876,9
2010
January 15.441,6 12.342,1 2.423,9 675,5February 15.620,3 12.355,0 2.424,1 841,2March 15.946,5 12.780,0 2.413,2 753,4April 15.580,0 12.263,1 2.474,9 842,0May 15.613,4 12.309,0 2.465,7 838,7June 15.811,9 12.491,6 2.463,2 857,1July 15.880,3 12.620,4 2.487,3 772,5August 15.633,1 12.483,2 2.465,7 684,2September 15.683,4 12.400,9 2.479,5 802,9October 15.889,7 12.521,9 2.477,1 890,7November 16.367,7 12.594,6 2.473,4 1.299,7December 16.915,1 12.710,3 2.507,0 1.697,7
Total 190.383,0 149.872,0 29.555,3 10.955,72011 January 17.489,2 13.005,5 2.618,9 1.864,7
Total 17.489,2 13.005,5 2.618,9 1.864,7
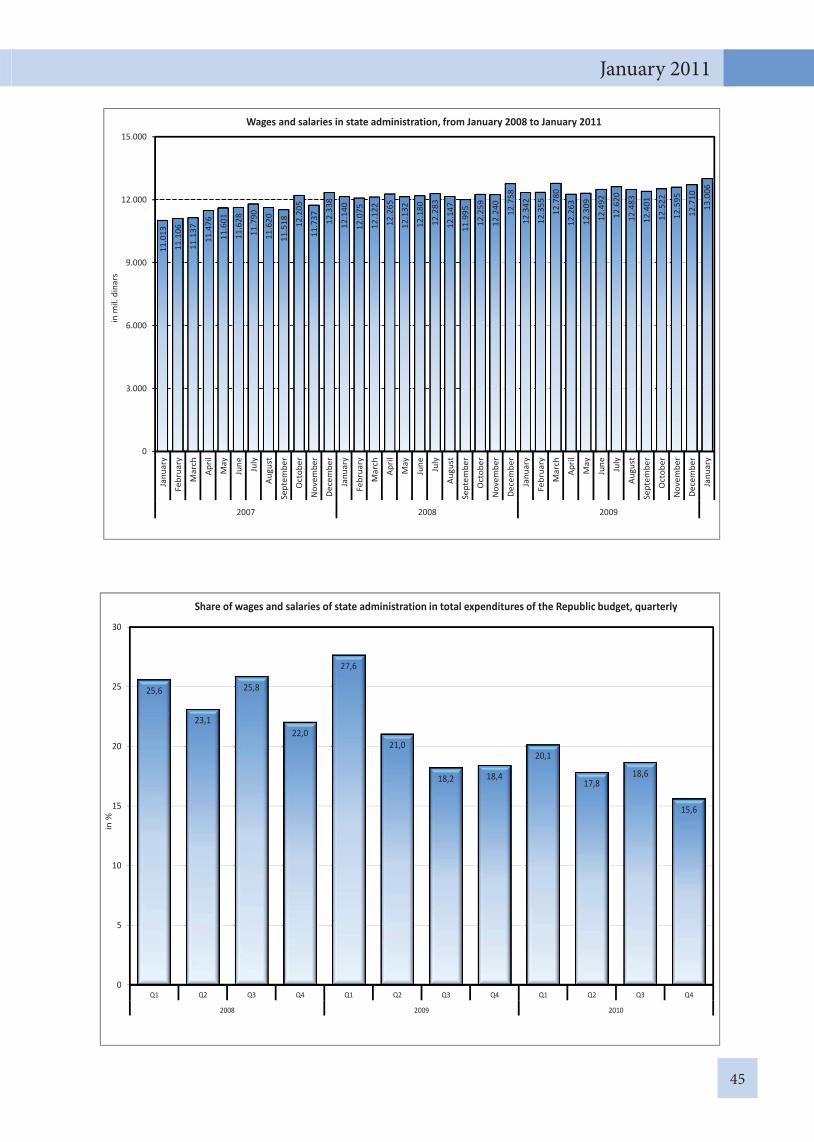
45
January 2011
11.0
13
11.1
06
11.1
37
11.4
76
11.6
01
11.6
28
11.7
90
11.6
20
11.5
18 12.2
05
11.7
37 12.3
38
12.1
40
12.0
75
12.1
22
12.2
65
12.1
32
12.1
80
12.2
83
12.1
47
11.9
95
12.2
59
12.2
40 12.7
58
12.3
42
12.3
55
12.7
80
12.2
63
12.3
09
12.4
92
12.6
20
12.4
83
12.4
01
12.5
22
12.5
95
12.7
10
13.0
06
0
3.000
6.000
9.000
12.000
15.000
Janu
ary
Febr
uary
Mar
ch
April
May
June July
Augu
st
Sept
embe
r
Oct
ober
Nov
embe
r
Dece
mbe
r
Janu
ary
Febr
uary
Mar
ch
April
May
June July
Augu
st
Sept
embe
r
Oct
ober
Nov
embe
r
Dece
mbe
r
Janu
ary
Febr
uary
Mar
ch
April
May
June July
Augu
st
Sept
embe
r
Oct
ober
Nov
embe
r
Dece
mbe
r
Janu
ary
2007 2008 2009
inm
il.di
nars
Wages and salaries in state administration, from January 2008 to January 2011
25,6
23,1
25,8
22,0
27,6
21,0
18,2 18,4
20,1
17,818,6
15,6
0
5
10
15
20
25
30
Q1 Q2 Q3 Q4 Q1 Q2 Q3 Q4 Q1 Q2 Q3 Q4
2008 2009 2010
in%
Share of wages and salaries of state administration in total expenditures of the Republic budget, quarterly
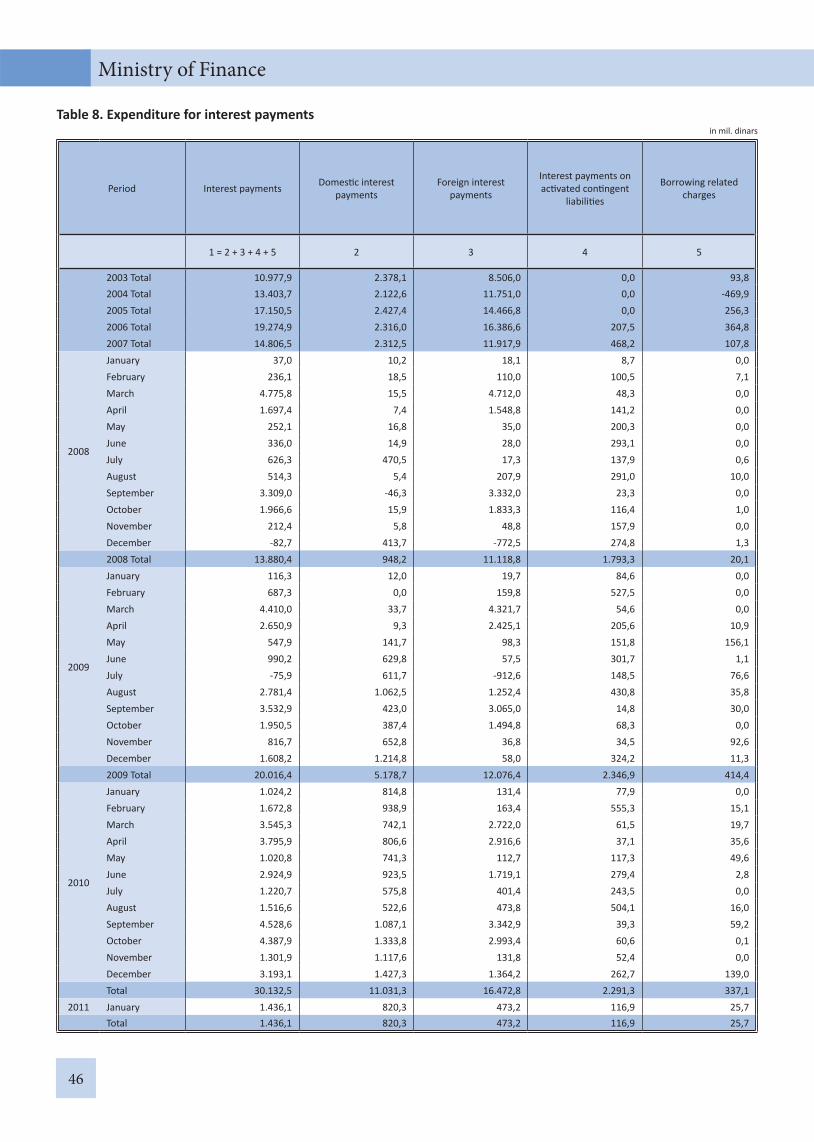
46
Ministry of Finance
Table 8. Expenditure for interest paymentsin mil. dinars
Period Interest payments Domes c interest payments
Foreign interest payments
Interest payments on ac vated con ngent
liabili es
Borrowing related charges
1 = 2 + 3 + 4 + 5 2 3 4 5
2003 Total 10.977,9 2.378,1 8.506,0 0,0 93,8 2004 Total 13.403,7 2.122,6 11.751,0 0,0 -469,9 2005 Total 17.150,5 2.427,4 14.466,8 0,0 256,3 2006 Total 19.274,9 2.316,0 16.386,6 207,5 364,8 2007 Total 14.806,5 2.312,5 11.917,9 468,2 107,8
2008
January 37,0 10,2 18,1 8,7 0,0February 236,1 18,5 110,0 100,5 7,1March 4.775,8 15,5 4.712,0 48,3 0,0April 1.697,4 7,4 1.548,8 141,2 0,0May 252,1 16,8 35,0 200,3 0,0June 336,0 14,9 28,0 293,1 0,0July 626,3 470,5 17,3 137,9 0,6August 514,3 5,4 207,9 291,0 10,0September 3.309,0 -46,3 3.332,0 23,3 0,0October 1.966,6 15,9 1.833,3 116,4 1,0November 212,4 5,8 48,8 157,9 0,0December -82,7 413,7 -772,5 274,8 1,3
2008 Total 13.880,4 948,2 11.118,8 1.793,3 20,1
2009
January 116,3 12,0 19,7 84,6 0,0February 687,3 0,0 159,8 527,5 0,0March 4.410,0 33,7 4.321,7 54,6 0,0April 2.650,9 9,3 2.425,1 205,6 10,9May 547,9 141,7 98,3 151,8 156,1June 990,2 629,8 57,5 301,7 1,1July -75,9 611,7 -912,6 148,5 76,6August 2.781,4 1.062,5 1.252,4 430,8 35,8September 3.532,9 423,0 3.065,0 14,8 30,0October 1.950,5 387,4 1.494,8 68,3 0,0November 816,7 652,8 36,8 34,5 92,6December 1.608,2 1.214,8 58,0 324,2 11,3
2009 Total 20.016,4 5.178,7 12.076,4 2.346,9 414,4
2010
January 1.024,2 814,8 131,4 77,9 0,0February 1.672,8 938,9 163,4 555,3 15,1March 3.545,3 742,1 2.722,0 61,5 19,7April 3.795,9 806,6 2.916,6 37,1 35,6May 1.020,8 741,3 112,7 117,3 49,6June 2.924,9 923,5 1.719,1 279,4 2,8July 1.220,7 575,8 401,4 243,5 0,0August 1.516,6 522,6 473,8 504,1 16,0September 4.528,6 1.087,1 3.342,9 39,3 59,2October 4.387,9 1.333,8 2.993,4 60,6 0,1November 1.301,9 1.117,6 131,8 52,4 0,0December 3.193,1 1.427,3 1.364,2 262,7 139,0
Total 30.132,5 11.031,3 16.472,8 2.291,3 337,12011 January 1.436,1 820,3 473,2 116,9 25,7
Total 1.436,1 820,3 473,2 116,9 25,7
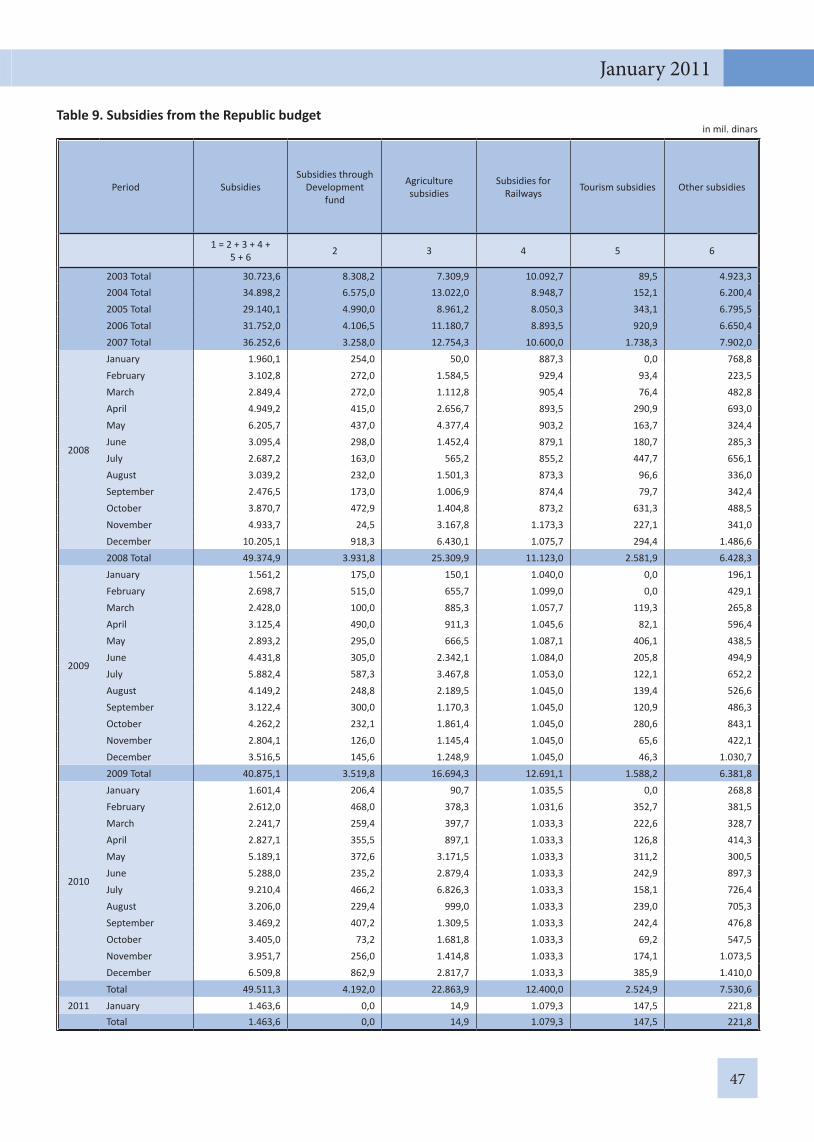
47
January 2011
Table 9. Subsidies from the Republic budgetin mil. dinars
Period SubsidiesSubsidies through
Development fund
Agriculture subsidies
Subsidies for Railways Tourism subsidies Other subsidies
1 = 2 + 3 + 4 + 5 + 6 2 3 4 5 6
2003 Total 30.723,6 8.308,2 7.309,9 10.092,7 89,5 4.923,3 2004 Total 34.898,2 6.575,0 13.022,0 8.948,7 152,1 6.200,4 2005 Total 29.140,1 4.990,0 8.961,2 8.050,3 343,1 6.795,5 2006 Total 31.752,0 4.106,5 11.180,7 8.893,5 920,9 6.650,4 2007 Total 36.252,6 3.258,0 12.754,3 10.600,0 1.738,3 7.902,0
2008
January 1.960,1 254,0 50,0 887,3 0,0 768,8February 3.102,8 272,0 1.584,5 929,4 93,4 223,5March 2.849,4 272,0 1.112,8 905,4 76,4 482,8April 4.949,2 415,0 2.656,7 893,5 290,9 693,0May 6.205,7 437,0 4.377,4 903,2 163,7 324,4June 3.095,4 298,0 1.452,4 879,1 180,7 285,3July 2.687,2 163,0 565,2 855,2 447,7 656,1August 3.039,2 232,0 1.501,3 873,3 96,6 336,0September 2.476,5 173,0 1.006,9 874,4 79,7 342,4October 3.870,7 472,9 1.404,8 873,2 631,3 488,5November 4.933,7 24,5 3.167,8 1.173,3 227,1 341,0December 10.205,1 918,3 6.430,1 1.075,7 294,4 1.486,6
2008 Total 49.374,9 3.931,8 25.309,9 11.123,0 2.581,9 6.428,3
2009
January 1.561,2 175,0 150,1 1.040,0 0,0 196,1February 2.698,7 515,0 655,7 1.099,0 0,0 429,1March 2.428,0 100,0 885,3 1.057,7 119,3 265,8April 3.125,4 490,0 911,3 1.045,6 82,1 596,4May 2.893,2 295,0 666,5 1.087,1 406,1 438,5June 4.431,8 305,0 2.342,1 1.084,0 205,8 494,9July 5.882,4 587,3 3.467,8 1.053,0 122,1 652,2August 4.149,2 248,8 2.189,5 1.045,0 139,4 526,6September 3.122,4 300,0 1.170,3 1.045,0 120,9 486,3October 4.262,2 232,1 1.861,4 1.045,0 280,6 843,1November 2.804,1 126,0 1.145,4 1.045,0 65,6 422,1December 3.516,5 145,6 1.248,9 1.045,0 46,3 1.030,7
2009 Total 40.875,1 3.519,8 16.694,3 12.691,1 1.588,2 6.381,8
2010
January 1.601,4 206,4 90,7 1.035,5 0,0 268,8February 2.612,0 468,0 378,3 1.031,6 352,7 381,5March 2.241,7 259,4 397,7 1.033,3 222,6 328,7April 2.827,1 355,5 897,1 1.033,3 126,8 414,3May 5.189,1 372,6 3.171,5 1.033,3 311,2 300,5June 5.288,0 235,2 2.879,4 1.033,3 242,9 897,3July 9.210,4 466,2 6.826,3 1.033,3 158,1 726,4August 3.206,0 229,4 999,0 1.033,3 239,0 705,3September 3.469,2 407,2 1.309,5 1.033,3 242,4 476,8October 3.405,0 73,2 1.681,8 1.033,3 69,2 547,5November 3.951,7 256,0 1.414,8 1.033,3 174,1 1.073,5December 6.509,8 862,9 2.817,7 1.033,3 385,9 1.410,0
Total 49.511,3 4.192,0 22.863,9 12.400,0 2.524,9 7.530,62011 January 1.463,6 0,0 14,9 1.079,3 147,5 221,8
Total 1.463,6 0,0 14,9 1.079,3 147,5 221,8
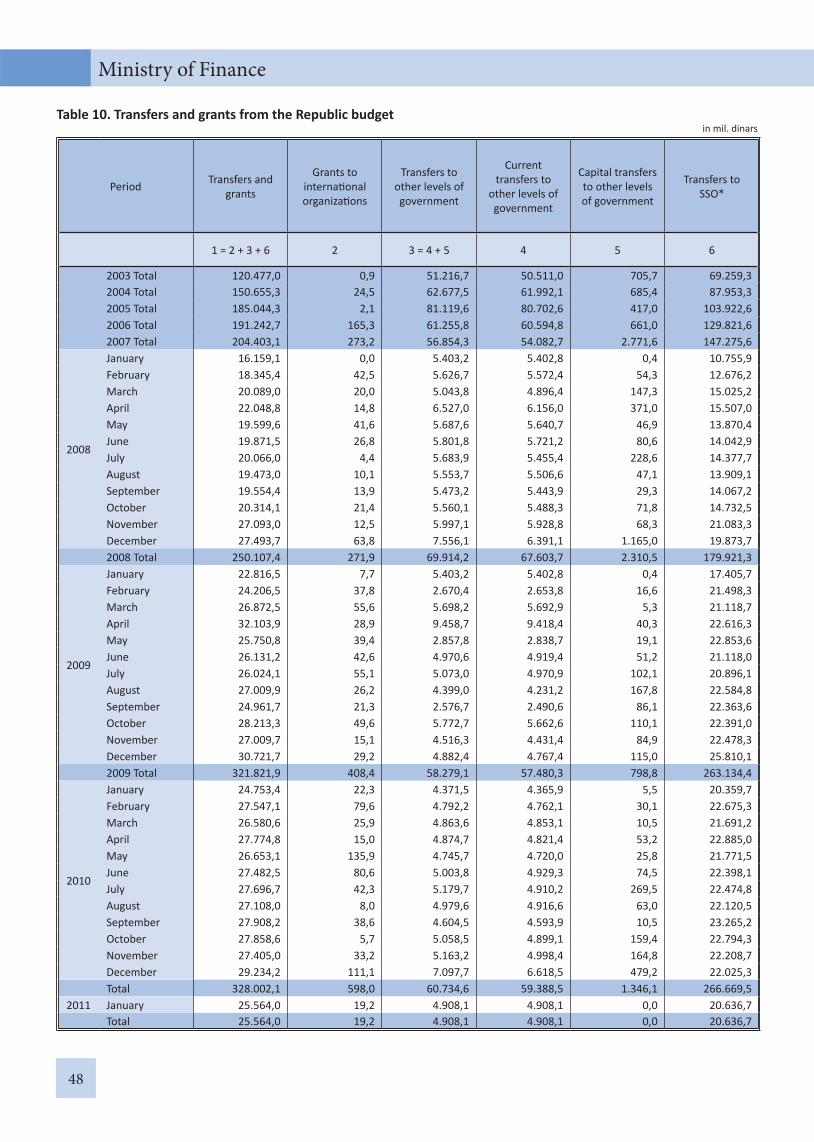
48
Ministry of Finance
Table 10. Transfers and grants from the Republic budgetin mil. dinars
Period Transfers and grants
Grants to interna onal organiza ons
Transfers to other levels of government
Current transfers to
other levels of government
Capital transfers to other levels of government
Transfers to SSO*
1 = 2 + 3 + 6 2 3 = 4 + 5 4 5 6
2003 Total 120.477,0 0,9 51.216,7 50.511,0 705,7 69.259,3 2004 Total 150.655,3 24,5 62.677,5 61.992,1 685,4 87.953,3 2005 Total 185.044,3 2,1 81.119,6 80.702,6 417,0 103.922,6 2006 Total 191.242,7 165,3 61.255,8 60.594,8 661,0 129.821,6 2007 Total 204.403,1 273,2 56.854,3 54.082,7 2.771,6 147.275,6
2008
January 16.159,1 0,0 5.403,2 5.402,8 0,4 10.755,9February 18.345,4 42,5 5.626,7 5.572,4 54,3 12.676,2March 20.089,0 20,0 5.043,8 4.896,4 147,3 15.025,2April 22.048,8 14,8 6.527,0 6.156,0 371,0 15.507,0May 19.599,6 41,6 5.687,6 5.640,7 46,9 13.870,4June 19.871,5 26,8 5.801,8 5.721,2 80,6 14.042,9July 20.066,0 4,4 5.683,9 5.455,4 228,6 14.377,7August 19.473,0 10,1 5.553,7 5.506,6 47,1 13.909,1September 19.554,4 13,9 5.473,2 5.443,9 29,3 14.067,2October 20.314,1 21,4 5.560,1 5.488,3 71,8 14.732,5November 27.093,0 12,5 5.997,1 5.928,8 68,3 21.083,3December 27.493,7 63,8 7.556,1 6.391,1 1.165,0 19.873,7
2008 Total 250.107,4 271,9 69.914,2 67.603,7 2.310,5 179.921,3
2009
January 22.816,5 7,7 5.403,2 5.402,8 0,4 17.405,7February 24.206,5 37,8 2.670,4 2.653,8 16,6 21.498,3March 26.872,5 55,6 5.698,2 5.692,9 5,3 21.118,7April 32.103,9 28,9 9.458,7 9.418,4 40,3 22.616,3May 25.750,8 39,4 2.857,8 2.838,7 19,1 22.853,6June 26.131,2 42,6 4.970,6 4.919,4 51,2 21.118,0July 26.024,1 55,1 5.073,0 4.970,9 102,1 20.896,1August 27.009,9 26,2 4.399,0 4.231,2 167,8 22.584,8September 24.961,7 21,3 2.576,7 2.490,6 86,1 22.363,6October 28.213,3 49,6 5.772,7 5.662,6 110,1 22.391,0November 27.009,7 15,1 4.516,3 4.431,4 84,9 22.478,3December 30.721,7 29,2 4.882,4 4.767,4 115,0 25.810,1
2009 Total 321.821,9 408,4 58.279,1 57.480,3 798,8 263.134,4
2010
January 24.753,4 22,3 4.371,5 4.365,9 5,5 20.359,7February 27.547,1 79,6 4.792,2 4.762,1 30,1 22.675,3March 26.580,6 25,9 4.863,6 4.853,1 10,5 21.691,2April 27.774,8 15,0 4.874,7 4.821,4 53,2 22.885,0May 26.653,1 135,9 4.745,7 4.720,0 25,8 21.771,5June 27.482,5 80,6 5.003,8 4.929,3 74,5 22.398,1July 27.696,7 42,3 5.179,7 4.910,2 269,5 22.474,8August 27.108,0 8,0 4.979,6 4.916,6 63,0 22.120,5September 27.908,2 38,6 4.604,5 4.593,9 10,5 23.265,2October 27.858,6 5,7 5.058,5 4.899,1 159,4 22.794,3November 27.405,0 33,2 5.163,2 4.998,4 164,8 22.208,7December 29.234,2 111,1 7.097,7 6.618,5 479,2 22.025,3
Total 328.002,1 598,0 60.734,6 59.388,5 1.346,1 266.669,52011 January 25.564,0 19,2 4.908,1 4.908,1 0,0 20.636,7
Total 25.564,0 19,2 4.908,1 4.908,1 0,0 20.636,7
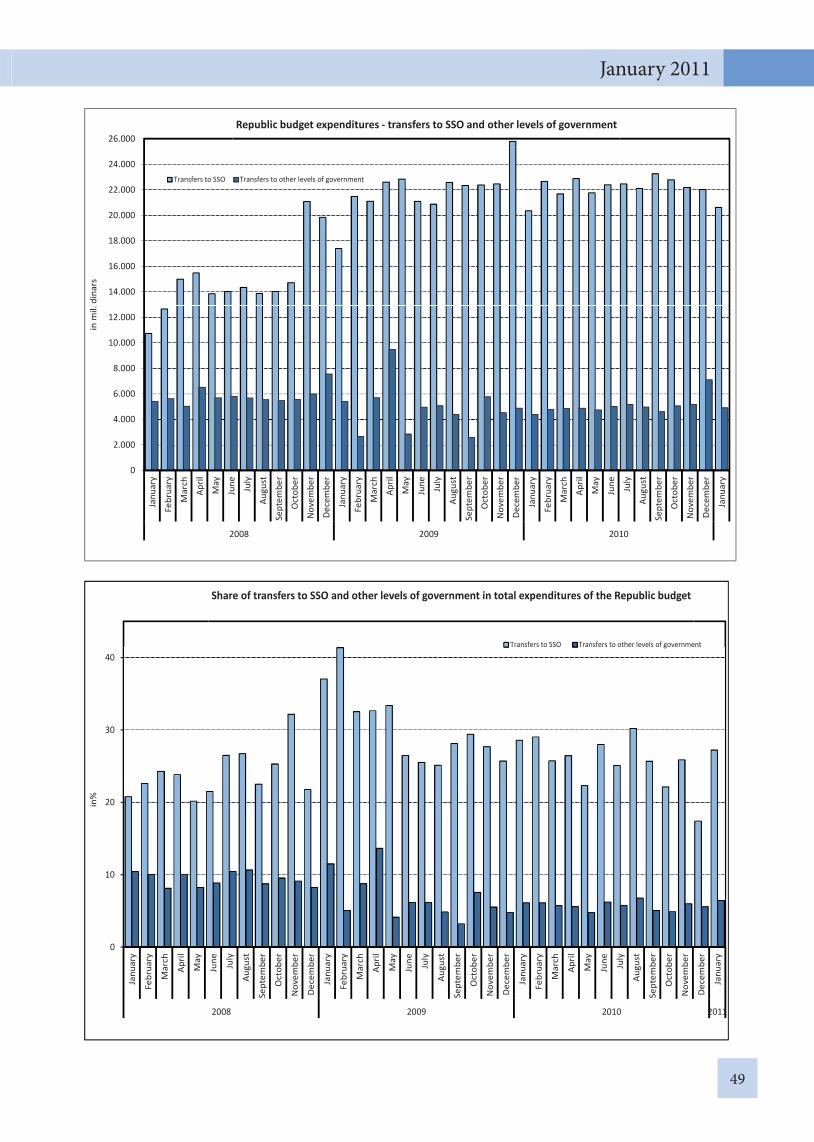
49
January 2011
0
2.000
4.000
6.000
8.000
10.000
12.000
14.000
16.000
18.000
20.000
22.000
24.000
26.000Ja
nuar
y
Febr
uary
Mar
ch
April
May
June July
Augu
st
Sept
embe
r
Oct
ober
Nov
embe
r
Dece
mbe
r
Janu
ary
Febr
uary
Mar
ch
April
May
June July
Augu
st
Sept
embe
r
Oct
ober
Nov
embe
r
Dece
mbe
r
Janu
ary
Febr
uary
Mar
ch
April
May
June July
Augu
st
Sept
embe
r
Oct
ober
Nov
embe
r
Dece
mbe
r
Janu
ary
2008 2009 2010
inm
il.di
nars
Republic budget expenditures transfers to SSO and other levels of government
Transfers to SSO Transfers to other levels of government
0
10
20
30
40
Janu
ary
Febr
uary
Mar
ch
April
May
June July
Augu
st
Sept
embe
r
Oct
ober
Nov
embe
r
Dec
embe
r
Janu
ary
Febr
uary
Mar
ch
April
May
June July
Augu
st
Sept
embe
r
Oct
ober
Nov
embe
r
Dec
embe
r
Janu
ary
Febr
uary
Mar
ch
April
May
June July
Augu
st
Sept
embe
r
Oct
ober
Nov
embe
r
Dec
embe
r
Janu
ary
2008 2009 2010 2011
in%
Share of transfers to SSO and other levels of government in total expenditures of the Republic budget
Transfers to SSO Transfers to other levels of government
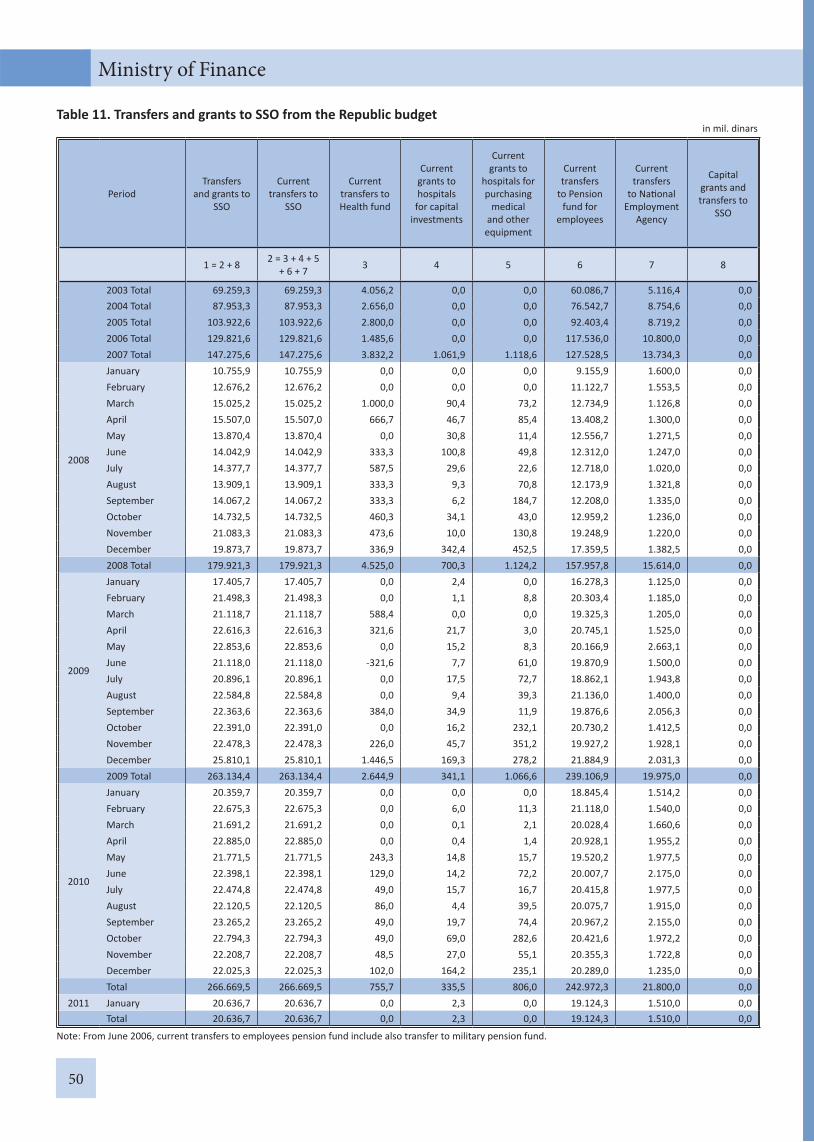
50
Ministry of Finance
Table 11. Transfers and grants to SSO from the Republic budgetin mil. dinars
PeriodTransfers
and grants to SSO
Current transfers to
SSO
Current transfers to Health fund
Current grants to hospitals for capital
investments
Current grants to
hospitals for purchasing
medical and other
equipment
Current transfers
to Pension fund for
employees
Current transfers
to Na onal Employment
Agency
Capital grants and transfers to
SSO
1 = 2 + 8 2 = 3 + 4 + 5 + 6 + 7 3 4 5 6 7 8
2003 Total 69.259,3 69.259,3 4.056,2 0,0 0,0 60.086,7 5.116,4 0,0 2004 Total 87.953,3 87.953,3 2.656,0 0,0 0,0 76.542,7 8.754,6 0,0 2005 Total 103.922,6 103.922,6 2.800,0 0,0 0,0 92.403,4 8.719,2 0,0 2006 Total 129.821,6 129.821,6 1.485,6 0,0 0,0 117.536,0 10.800,0 0,0 2007 Total 147.275,6 147.275,6 3.832,2 1.061,9 1.118,6 127.528,5 13.734,3 0,0
2008
January 10.755,9 10.755,9 0,0 0,0 0,0 9.155,9 1.600,0 0,0February 12.676,2 12.676,2 0,0 0,0 0,0 11.122,7 1.553,5 0,0March 15.025,2 15.025,2 1.000,0 90,4 73,2 12.734,9 1.126,8 0,0April 15.507,0 15.507,0 666,7 46,7 85,4 13.408,2 1.300,0 0,0May 13.870,4 13.870,4 0,0 30,8 11,4 12.556,7 1.271,5 0,0June 14.042,9 14.042,9 333,3 100,8 49,8 12.312,0 1.247,0 0,0July 14.377,7 14.377,7 587,5 29,6 22,6 12.718,0 1.020,0 0,0August 13.909,1 13.909,1 333,3 9,3 70,8 12.173,9 1.321,8 0,0September 14.067,2 14.067,2 333,3 6,2 184,7 12.208,0 1.335,0 0,0October 14.732,5 14.732,5 460,3 34,1 43,0 12.959,2 1.236,0 0,0November 21.083,3 21.083,3 473,6 10,0 130,8 19.248,9 1.220,0 0,0December 19.873,7 19.873,7 336,9 342,4 452,5 17.359,5 1.382,5 0,0
2008 Total 179.921,3 179.921,3 4.525,0 700,3 1.124,2 157.957,8 15.614,0 0,0
2009
January 17.405,7 17.405,7 0,0 2,4 0,0 16.278,3 1.125,0 0,0February 21.498,3 21.498,3 0,0 1,1 8,8 20.303,4 1.185,0 0,0March 21.118,7 21.118,7 588,4 0,0 0,0 19.325,3 1.205,0 0,0April 22.616,3 22.616,3 321,6 21,7 3,0 20.745,1 1.525,0 0,0May 22.853,6 22.853,6 0,0 15,2 8,3 20.166,9 2.663,1 0,0June 21.118,0 21.118,0 -321,6 7,7 61,0 19.870,9 1.500,0 0,0July 20.896,1 20.896,1 0,0 17,5 72,7 18.862,1 1.943,8 0,0August 22.584,8 22.584,8 0,0 9,4 39,3 21.136,0 1.400,0 0,0September 22.363,6 22.363,6 384,0 34,9 11,9 19.876,6 2.056,3 0,0October 22.391,0 22.391,0 0,0 16,2 232,1 20.730,2 1.412,5 0,0November 22.478,3 22.478,3 226,0 45,7 351,2 19.927,2 1.928,1 0,0December 25.810,1 25.810,1 1.446,5 169,3 278,2 21.884,9 2.031,3 0,0
2009 Total 263.134,4 263.134,4 2.644,9 341,1 1.066,6 239.106,9 19.975,0 0,0
2010
January 20.359,7 20.359,7 0,0 0,0 0,0 18.845,4 1.514,2 0,0February 22.675,3 22.675,3 0,0 6,0 11,3 21.118,0 1.540,0 0,0March 21.691,2 21.691,2 0,0 0,1 2,1 20.028,4 1.660,6 0,0April 22.885,0 22.885,0 0,0 0,4 1,4 20.928,1 1.955,2 0,0May 21.771,5 21.771,5 243,3 14,8 15,7 19.520,2 1.977,5 0,0June 22.398,1 22.398,1 129,0 14,2 72,2 20.007,7 2.175,0 0,0July 22.474,8 22.474,8 49,0 15,7 16,7 20.415,8 1.977,5 0,0August 22.120,5 22.120,5 86,0 4,4 39,5 20.075,7 1.915,0 0,0September 23.265,2 23.265,2 49,0 19,7 74,4 20.967,2 2.155,0 0,0October 22.794,3 22.794,3 49,0 69,0 282,6 20.421,6 1.972,2 0,0November 22.208,7 22.208,7 48,5 27,0 55,1 20.355,3 1.722,8 0,0December 22.025,3 22.025,3 102,0 164,2 235,1 20.289,0 1.235,0 0,0
Total 266.669,5 266.669,5 755,7 335,5 806,0 242.972,3 21.800,0 0,02011 January 20.636,7 20.636,7 0,0 2,3 0,0 19.124,3 1.510,0 0,0
Total 20.636,7 20.636,7 0,0 2,3 0,0 19.124,3 1.510,0 0,0
Note: From June 2006, current transfers to employees pension fund include also transfer to military pension fund.
VOJVODINA BUDGET
Source: Provincial Finance Secretariat
FISC
AL
TREN
DS

52
Table 1. Revenues of Autonomous Province of Vojvodinain mil. dinars
Period Total revenues Taxes Personal
income taxCorporate income tax Other taxes Transfers
and grantsOther
revenue
Proceeds from
borrowing
Priva za on proceeds
1 = 2 + 6 + 7 + 8 + 9
2 = 3 + 4 + 5 3 4 5 6 7 8 9
2005 Total 20.694,3 4.928,1 3.814,9 861,3 251,9 13.198,7 156,8 0,0 2.410,7
2006 Total 25.429,1 6.091,2 4.636,4 1.454,8 0,0 15.953,1 203,6 0,0 3.181,2
2007 Total 30.906,4 6.541,4 4.083,1 2.458,3 0,0 19.297,2 194,2 0,0 4.873,6
2008
January 2.855,6 471,9 314,2 157,7 0,0 2.061,6 9,4 0,0 312,7
February 5.358,3 590,1 381,2 208,9 0,0 1.862,3 8,9 0,0 2.897,0
March 5.875,3 1.518,0 355,7 1.162,3 0,0 3.862,4 26,2 0,0 468,7
April 8.339,5 856,2 392,6 463,6 0,0 6.929,2 63,6 0,0 490,5
May 4.852,9 338,7 366,2 -27,5 0,0 4.072,8 55,0 0,0 386,4
June 3.145,8 893,0 379,4 513,6 0,0 1.940,8 69,8 0,0 242,2
July 2.846,4 625,3 397,2 228,1 0,0 1.937,2 83,0 0,0 200,9
August 2.809,7 589,7 380,4 209,3 0,0 1.925,1 58,3 0,0 236,6
September 2.877,1 673,2 388,0 285,2 0,0 1.886,3 59,6 0,0 258,0
October 2.862,9 716,6 406,7 309,9 0,0 2.028,6 60,0 0,0 57,7
November 2.845,4 602,6 381,1 221,5 0,0 2.188,7 31,7 0,0 22,4
December 4.447,3 826,8 520,6 306,2 0,0 3.269,4 40,6 0,0 310,5
2008 Total 49.116,2 8.702,1 4.663,3 4.038,8 0,0 33.964,4 566,1 0,0 5.883,6
2009
January 2.596,7 423,3 327,4 95,9 0,0 2.061,5 23,7 0,0 88,2
February 21.495,4 592,2 373,8 218,4 0,0 2.059,4 18,3 0,0 18.825,5
March 3.073,2 724,9 384,3 340,6 0,0 2.064,7 20,2 0,0 263,4
April 3.267,4 397,5 414,9 -17,4 0,0 2.069,1 156,0 0,0 644,8
May 2.765,7 313,6 356,0 -42,4 0,0 2.085,4 148,3 0,0 218,4
June 4.039,8 498,0 391,3 106,7 0,0 2.616,0 152,3 0,0 773,5
July 3.676,5 531,3 422,3 109,0 0,0 2.588,5 269,7 0,0 287,0
August 3.148,4 570,3 370,7 199,6 0,0 2.400,0 118,8 0,0 59,3
September 3.027,5 677,5 411,0 266,5 0,0 2.089,4 111,8 0,0 148,8
October 3.497,6 590,0 386,1 203,9 0,0 2.711,2 119,1 0,0 77,3
November 3.202,3 440,2 381,2 59,0 0,0 2.486,2 98,6 0,0 177,3
December 3.446,0 664,8 486,3 178,5 0,0 2.537,1 102,9 0,0 141,2
2009 Total 57.236,5 6.423,6 4.705,3 1.718,3 0,0 27.768,5 1.339,7 0,0 21.704,7
2010
January 3.220,8 494,5 324,0 170,5 0,0 2.578,0 84,4 0,0 63,9
February 3.228,2 547,6 366,4 181,2 0,0 2.583,8 70,4 0,0 26,4
March 3.989,8 1.017,7 400,7 617,0 0,0 2.628,5 63,9 0,0 279,7
April 3.344,3 530,7 416,5 113,6 0,6 2.621,2 93,5 0,0 98,9
May 3.459,2 504,2 364,7 140,1 -0,6 2.625,5 43,6 0,0 285,9
June 3.668,5 606,6 391,5 215,1 0,0 2.727,9 44,5 0,0 289,5
July 3.297,8 580,0 430,4 149,6 0,0 2.648,6 69,2 0,0 0,0
August 3.228,8 559,4 382,7 176,7 0,0 2.593,6 37,5 0,0 38,3
September 3.268,9 594,6 396,0 198,6 0,0 2.611,6 35,9 0,0 26,8
October 3.497,2 577,0 397,2 179,8 0,0 2.592,3 85,8 0,0 242,1
November 3.591,4 696,2 394,0 302,2 0,0 2.615,2 80,7 0,0 199,3
December 4.127,6 788,7 532,0 256,7 0,0 3.236,1 60,2 0,0 42,6
2010 Total 41.922,5 7.497,2 4.796,1 2.701,1 0,0 32.062,3 769,6 0,0 1.593,4
2011 January 3.267,9 524,2 342,6 181,6 0,0 2.625,6 54,9 0,0 63,2 2011 Total 3.267,9 524,2 342,6 181,6 0,0 2.625,6 54,9 0,0 63,2
Ministry of Finance
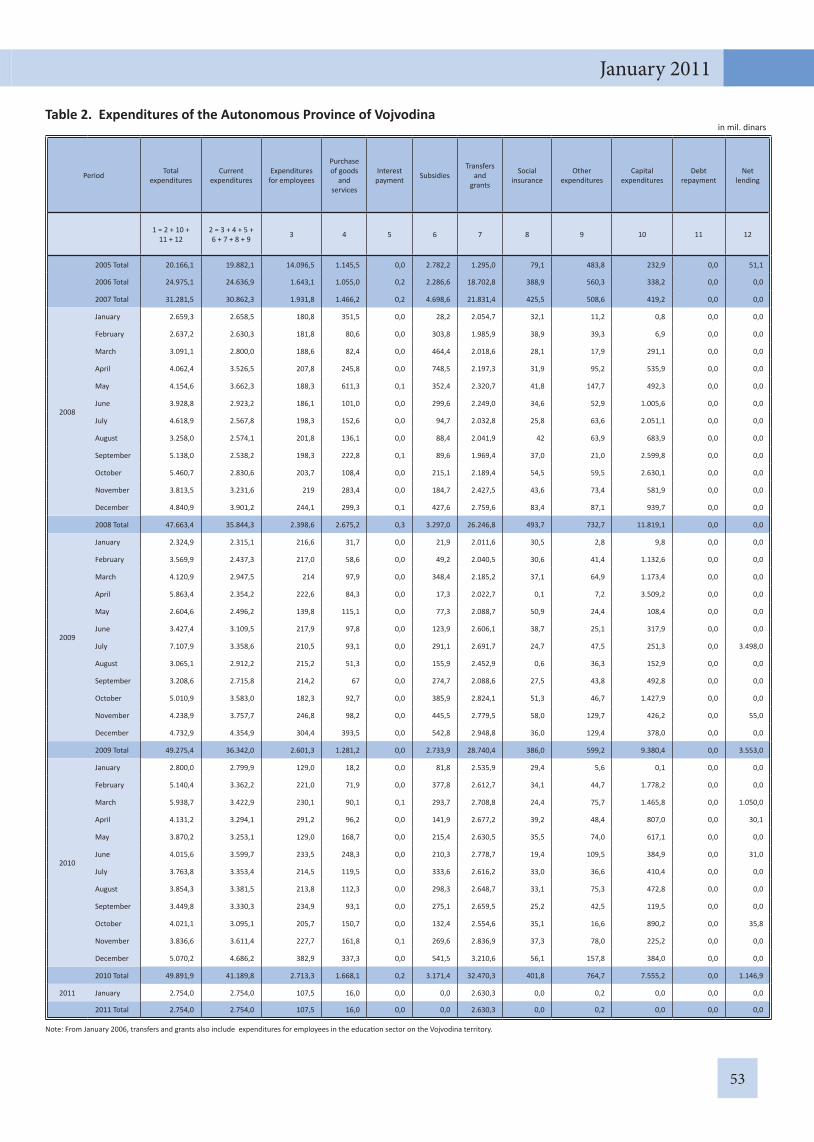
53
January 2011
Table 2. Expenditures of the Autonomous Province of Vojvodinain mil. dinars
Period Total expenditures
Current expenditures
Expenditures for employees
Purchase of goods
and services
Interest payment Subsidies
Transfers and
grants
Social insurance
Other expenditures
Capital expenditures
Debt repayment
Net lending
1 = 2 + 10 + 11 + 12
2 = 3 + 4 + 5 + 6 + 7 + 8 + 9 3 4 5 6 7 8 9 10 11 12
2005 Total 20.166,1 19.882,1 14.096,5 1.145,5 0,0 2.782,2 1.295,0 79,1 483,8 232,9 0,0 51,1
2006 Total 24.975,1 24.636,9 1.643,1 1.055,0 0,2 2.286,6 18.702,8 388,9 560,3 338,2 0,0 0,0
2007 Total 31.281,5 30.862,3 1.931,8 1.466,2 0,2 4.698,6 21.831,4 425,5 508,6 419,2 0,0 0,0
2008
January 2.659,3 2.658,5 180,8 351,5 0,0 28,2 2.054,7 32,1 11,2 0,8 0,0 0,0
February 2.637,2 2.630,3 181,8 80,6 0,0 303,8 1.985,9 38,9 39,3 6,9 0,0 0,0
March 3.091,1 2.800,0 188,6 82,4 0,0 464,4 2.018,6 28,1 17,9 291,1 0,0 0,0
April 4.062,4 3.526,5 207,8 245,8 0,0 748,5 2.197,3 31,9 95,2 535,9 0,0 0,0
May 4.154,6 3.662,3 188,3 611,3 0,1 352,4 2.320,7 41,8 147,7 492,3 0,0 0,0
June 3.928,8 2.923,2 186,1 101,0 0,0 299,6 2.249,0 34,6 52,9 1.005,6 0,0 0,0
July 4.618,9 2.567,8 198,3 152,6 0,0 94,7 2.032,8 25,8 63,6 2.051,1 0,0 0,0
August 3.258,0 2.574,1 201,8 136,1 0,0 88,4 2.041,9 42 63,9 683,9 0,0 0,0
September 5.138,0 2.538,2 198,3 222,8 0,1 89,6 1.969,4 37,0 21,0 2.599,8 0,0 0,0
October 5.460,7 2.830,6 203,7 108,4 0,0 215,1 2.189,4 54,5 59,5 2.630,1 0,0 0,0
November 3.813,5 3.231,6 219 283,4 0,0 184,7 2.427,5 43,6 73,4 581,9 0,0 0,0
December 4.840,9 3.901,2 244,1 299,3 0,1 427,6 2.759,6 83,4 87,1 939,7 0,0 0,0
2008 Total 47.663,4 35.844,3 2.398,6 2.675,2 0,3 3.297,0 26.246,8 493,7 732,7 11.819,1 0,0 0,0
2009
January 2.324,9 2.315,1 216,6 31,7 0,0 21,9 2.011,6 30,5 2,8 9,8 0,0 0,0
February 3.569,9 2.437,3 217,0 58,6 0,0 49,2 2.040,5 30,6 41,4 1.132,6 0,0 0,0
March 4.120,9 2.947,5 214 97,9 0,0 348,4 2.185,2 37,1 64,9 1.173,4 0,0 0,0
April 5.863,4 2.354,2 222,6 84,3 0,0 17,3 2.022,7 0,1 7,2 3.509,2 0,0 0,0
May 2.604,6 2.496,2 139,8 115,1 0,0 77,3 2.088,7 50,9 24,4 108,4 0,0 0,0
June 3.427,4 3.109,5 217,9 97,8 0,0 123,9 2.606,1 38,7 25,1 317,9 0,0 0,0
July 7.107,9 3.358,6 210,5 93,1 0,0 291,1 2.691,7 24,7 47,5 251,3 0,0 3.498,0
August 3.065,1 2.912,2 215,2 51,3 0,0 155,9 2.452,9 0,6 36,3 152,9 0,0 0,0
September 3.208,6 2.715,8 214,2 67 0,0 274,7 2.088,6 27,5 43,8 492,8 0,0 0,0
October 5.010,9 3.583,0 182,3 92,7 0,0 385,9 2.824,1 51,3 46,7 1.427,9 0,0 0,0
November 4.238,9 3.757,7 246,8 98,2 0,0 445,5 2.779,5 58,0 129,7 426,2 0,0 55,0
December 4.732,9 4.354,9 304,4 393,5 0,0 542,8 2.948,8 36,0 129,4 378,0 0,0 0,0
2009 Total 49.275,4 36.342,0 2.601,3 1.281,2 0,0 2.733,9 28.740,4 386,0 599,2 9.380,4 0,0 3.553,0
2010
January 2.800,0 2.799,9 129,0 18,2 0,0 81,8 2.535,9 29,4 5,6 0,1 0,0 0,0
February 5.140,4 3.362,2 221,0 71,9 0,0 377,8 2.612,7 34,1 44,7 1.778,2 0,0 0,0
March 5.938,7 3.422,9 230,1 90,1 0,1 293,7 2.708,8 24,4 75,7 1.465,8 0,0 1.050,0
April 4.131,2 3.294,1 291,2 96,2 0,0 141,9 2.677,2 39,2 48,4 807,0 0,0 30,1
May 3.870,2 3.253,1 129,0 168,7 0,0 215,4 2.630,5 35,5 74,0 617,1 0,0 0,0
June 4.015,6 3.599,7 233,5 248,3 0,0 210,3 2.778,7 19,4 109,5 384,9 0,0 31,0
July 3.763,8 3.353,4 214,5 119,5 0,0 333,6 2.616,2 33,0 36,6 410,4 0,0 0,0
August 3.854,3 3.381,5 213,8 112,3 0,0 298,3 2.648,7 33,1 75,3 472,8 0,0 0,0
September 3.449,8 3.330,3 234,9 93,1 0,0 275,1 2.659,5 25,2 42,5 119,5 0,0 0,0
October 4.021,1 3.095,1 205,7 150,7 0,0 132,4 2.554,6 35,1 16,6 890,2 0,0 35,8
November 3.836,6 3.611,4 227,7 161,8 0,1 269,6 2.836,9 37,3 78,0 225,2 0,0 0,0
December 5.070,2 4.686,2 382,9 337,3 0,0 541,5 3.210,6 56,1 157,8 384,0 0,0 0,0
2010 Total 49.891,9 41.189,8 2.713,3 1.668,1 0,2 3.171,4 32.470,3 401,8 764,7 7.555,2 0,0 1.146,9
2011 January 2.754,0 2.754,0 107,5 16,0 0,0 0,0 2.630,3 0,0 0,2 0,0 0,0 0,0
2011 Total 2.754,0 2.754,0 107,5 16,0 0,0 0,0 2.630,3 0,0 0,2 0,0 0,0 0,0
Note: From January 2006, transfers and grants also include expenditures for employees in the educa on sector on the Vojvodina territory.

54
Ministry of Finance
2,85
6
5,35
8
5,87
5
8,34
0
4,85
3
3,14
6
2,84
6
2,81
0
2,87
7
2,86
3
2,84
5 4,44
7
2,59
7
21,4
95
3,07
3
3,26
7
2,76
6 4,04
0
3,67
7
3,14
8
3,02
8
3,49
8
3,20
2
3,44
6
3,22
1
3,22
8
3,99
0
3,34
4
3,45
9
3,66
9
3,29
8
3,22
9
3,26
9
3,49
7
3,59
1
4,12
8
3,26
8
0
3,000
6,000
9,000
12,000
15,000
18,000
21,000
Janu
ary
Febr
uary
Mar
ch
April
May
June July
Augu
st
Sept
embe
r
Oct
ober
Nov
embe
r
Dec
embe
r
Janu
ary
Febr
uary
Mar
ch
April
May
June July
Augu
st
Sept
embe
r
Oct
ober
Nov
embe
r
Dec
embe
r
Janu
ary
Febr
uary
Mar
ch
April
May
June July
Augu
st
Sept
embe
r
Oct
ober
Nov
embe
r
Dec
embe
r
Janu
ary
2008 2009 2010 2011
inm
il.di
nars
Vojvodina revenues, from 2008 to 20112,
659
2,63
7 3,09
1
4,06
2
4,15
5
3,92
9
4,61
9
3,25
8
5,13
8 5,46
1
3,81
4
4,84
1
2,32
5
3,57
0 4,12
1
5,86
3
2,60
5
3,42
7
7,10
8
3,06
5
3,20
9
5,01
1
4,23
9 4,73
3
2,80
0
5,14
0
5,93
9
4,13
1
3,87
0
4,01
6
3,76
4
3,85
4
3,45
0 4,02
1
3,83
7
5,07
0
2,75
4
0
1,000
2,000
3,000
4,000
5,000
6,000
7,000
8,000
Janu
ary
Febr
uary
Mar
ch
April
May
June July
Augu
st
Sept
embe
r
Oct
ober
Nov
embe
r
Dec
embe
r
Janu
ary
Febr
uary
Mar
ch
April
May
June July
Augu
st
Sept
embe
r
Oct
ober
Nov
embe
r
Dec
embe
r
Janu
ary
Febr
uary
Mar
ch
April
May
June July
Augu
st
Sept
embe
r
Oct
ober
Nov
embe
r
Dec
embe
r
Janu
ary
2008 2009 2010 2011
inm
il.di
nars
Vojvodina expenditures, from 2008 to 2011
BUDGET OFMUNICIPALITIESAND CITIES
Source: Treasury Administration of the Republic of Serbia
FISC
AL
TREN
DS
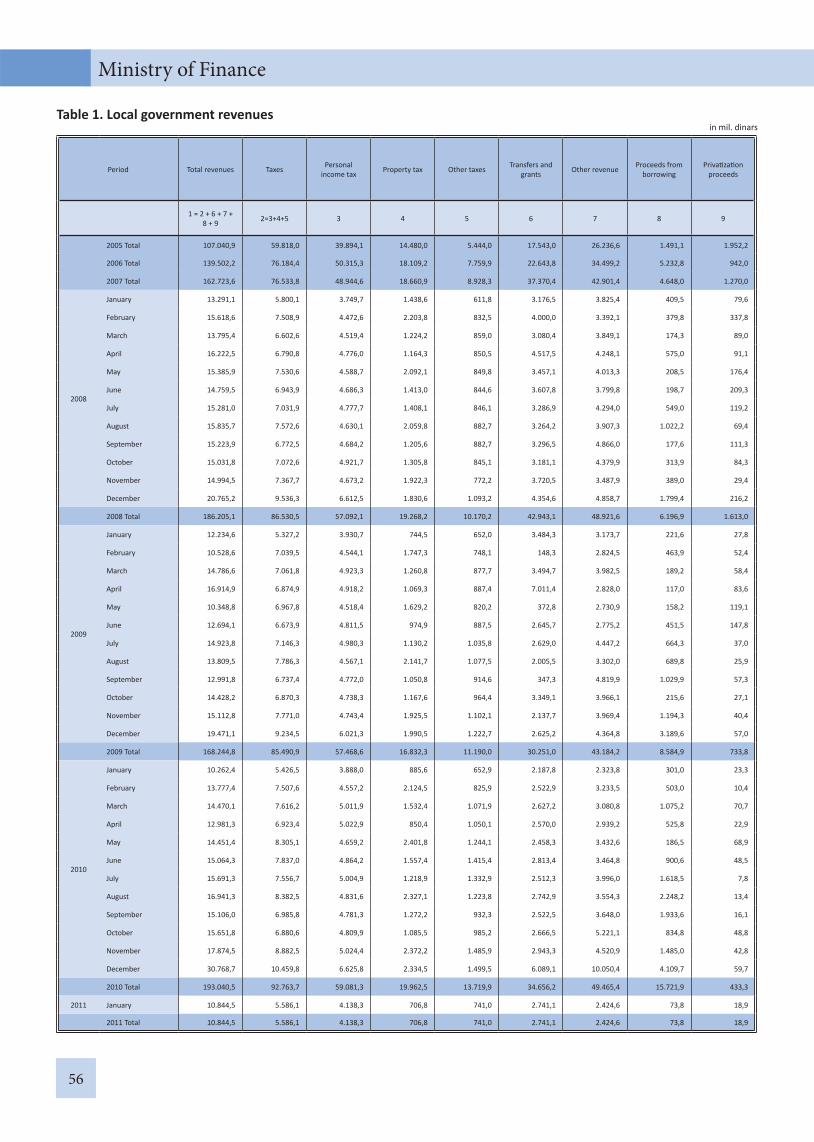
56
Ministry of Finance
Table 1. Local government revenuesin mil. dinars
Period Total revenues Taxes Personal income tax Property tax Other taxes Transfers and
grants Other revenue Proceeds from borrowing
Priva za on proceeds
1 = 2 + 6 + 7 + 8 + 9 2=3+4+5 3 4 5 6 7 8 9
2005 Total 107.040,9 59.818,0 39.894,1 14.480,0 5.444,0 17.543,0 26.236,6 1.491,1 1.952,2
2006 Total 139.502,2 76.184,4 50.315,3 18.109,2 7.759,9 22.643,8 34.499,2 5.232,8 942,0
2007 Total 162.723,6 76.533,8 48.944,6 18.660,9 8.928,3 37.370,4 42.901,4 4.648,0 1.270,0
2008
January 13.291,1 5.800,1 3.749,7 1.438,6 611,8 3.176,5 3.825,4 409,5 79,6
February 15.618,6 7.508,9 4.472,6 2.203,8 832,5 4.000,0 3.392,1 379,8 337,8
March 13.795,4 6.602,6 4.519,4 1.224,2 859,0 3.080,4 3.849,1 174,3 89,0
April 16.222,5 6.790,8 4.776,0 1.164,3 850,5 4.517,5 4.248,1 575,0 91,1
May 15.385,9 7.530,6 4.588,7 2.092,1 849,8 3.457,1 4.013,3 208,5 176,4
June 14.759,5 6.943,9 4.686,3 1.413,0 844,6 3.607,8 3.799,8 198,7 209,3
July 15.281,0 7.031,9 4.777,7 1.408,1 846,1 3.286,9 4.294,0 549,0 119,2
August 15.835,7 7.572,6 4.630,1 2.059,8 882,7 3.264,2 3.907,3 1.022,2 69,4
September 15.223,9 6.772,5 4.684,2 1.205,6 882,7 3.296,5 4.866,0 177,6 111,3
October 15.031,8 7.072,6 4.921,7 1.305,8 845,1 3.181,1 4.379,9 313,9 84,3
November 14.994,5 7.367,7 4.673,2 1.922,3 772,2 3.720,5 3.487,9 389,0 29,4
December 20.765,2 9.536,3 6.612,5 1.830,6 1.093,2 4.354,6 4.858,7 1.799,4 216,2
2008 Total 186.205,1 86.530,5 57.092,1 19.268,2 10.170,2 42.943,1 48.921,6 6.196,9 1.613,0
2009
January 12.234,6 5.327,2 3.930,7 744,5 652,0 3.484,3 3.173,7 221,6 27,8
February 10.528,6 7.039,5 4.544,1 1.747,3 748,1 148,3 2.824,5 463,9 52,4
March 14.786,6 7.061,8 4.923,3 1.260,8 877,7 3.494,7 3.982,5 189,2 58,4
April 16.914,9 6.874,9 4.918,2 1.069,3 887,4 7.011,4 2.828,0 117,0 83,6
May 10.348,8 6.967,8 4.518,4 1.629,2 820,2 372,8 2.730,9 158,2 119,1
June 12.694,1 6.673,9 4.811,5 974,9 887,5 2.645,7 2.775,2 451,5 147,8
July 14.923,8 7.146,3 4.980,3 1.130,2 1.035,8 2.629,0 4.447,2 664,3 37,0
August 13.809,5 7.786,3 4.567,1 2.141,7 1.077,5 2.005,5 3.302,0 689,8 25,9
September 12.991,8 6.737,4 4.772,0 1.050,8 914,6 347,3 4.819,9 1.029,9 57,3
October 14.428,2 6.870,3 4.738,3 1.167,6 964,4 3.349,1 3.966,1 215,6 27,1
November 15.112,8 7.771,0 4.743,4 1.925,5 1.102,1 2.137,7 3.969,4 1.194,3 40,4
December 19.471,1 9.234,5 6.021,3 1.990,5 1.222,7 2.625,2 4.364,8 3.189,6 57,0
2009 Total 168.244,8 85.490,9 57.468,6 16.832,3 11.190,0 30.251,0 43.184,2 8.584,9 733,8
2010
January 10.262,4 5.426,5 3.888,0 885,6 652,9 2.187,8 2.323,8 301,0 23,3
February 13.777,4 7.507,6 4.557,2 2.124,5 825,9 2.522,9 3.233,5 503,0 10,4
March 14.470,1 7.616,2 5.011,9 1.532,4 1.071,9 2.627,2 3.080,8 1.075,2 70,7
April 12.981,3 6.923,4 5.022,9 850,4 1.050,1 2.570,0 2.939,2 525,8 22,9
May 14.451,4 8.305,1 4.659,2 2.401,8 1.244,1 2.458,3 3.432,6 186,5 68,9
June 15.064,3 7.837,0 4.864,2 1.557,4 1.415,4 2.813,4 3.464,8 900,6 48,5
July 15.691,3 7.556,7 5.004,9 1.218,9 1.332,9 2.512,3 3.996,0 1.618,5 7,8
August 16.941,3 8.382,5 4.831,6 2.327,1 1.223,8 2.742,9 3.554,3 2.248,2 13,4
September 15.106,0 6.985,8 4.781,3 1.272,2 932,3 2.522,5 3.648,0 1.933,6 16,1
October 15.651,8 6.880,6 4.809,9 1.085,5 985,2 2.666,5 5.221,1 834,8 48,8
November 17.874,5 8.882,5 5.024,4 2.372,2 1.485,9 2.943,3 4.520,9 1.485,0 42,8
December 30.768,7 10.459,8 6.625,8 2.334,5 1.499,5 6.089,1 10.050,4 4.109,7 59,7
2010 Total 193.040,5 92.763,7 59.081,3 19.962,5 13.719,9 34.656,2 49.465,4 15.721,9 433,3
2011 January 10.844,5 5.586,1 4.138,3 706,8 741,0 2.741,1 2.424,6 73,8 18,9
2011 Total 10.844,5 5.586,1 4.138,3 706,8 741,0 2.741,1 2.424,6 73,8 18,9

57
January 2011
Table 2. Local government expendituresin mil. Dinars
Period Total expenditures
Current expenditures
Expenditures for
employees
Purchase of goods
and services
Interest payment Subsidies
Transfers and
grants
Social insurance
Other expenditures
Capital expenditures
Debt repayment
Net lending
1 = 2 + 10 + 11 + 12
2 = 3 + 4 + 5 + 6 + 7 +
8 + 93 4 5 6 7 8 9 10 11 12
2005 Total 100.553,5 84.075,0 22.196,5 19.051,7 276,3 22.959,7 11.250,9 2.601,1 5.738,8 15.487,8 815,3 175,4
2006 Total 134.307,4 103.212,1 26.930,5 28.660,5 488,3 21.423,0 16.051,3 3.250,0 6.408,5 29.192,7 1.736,6 166,0
2007 Total 166.501,8 126.074,3 31.691,6 34.429,6 927,5 26.880,0 20.289,3 4.240,4 7.615,9 38.757,5 1.533,1 136,9
2008
January 9.442,8 8.068,6 2.685,4 1.929,9 159,2 1.556,9 1.069,7 215,1 452,4 945,4 425,9 2,9
February 12.512,3 10.382,6 3.067,1 2.695,9 68,4 1.471,0 2.144,9 398,0 537,3 2.039,8 82,6 7,3
March 12.510,4 10.161,9 2.781,5 2.823,4 66,3 1.565,2 1.892,5 377,5 655,5 2.252,4 90,1 6,0
April 16.050,4 12.738,2 3.761,1 3.530,7 68,6 2.043,1 2.061,0 368,9 904,8 3.237,0 72,1 3,1
May 16.358,8 12.230,5 3.152,2 3.571,4 84,7 2.226,4 1.844,6 386,4 964,8 4.005,5 113,4 9,4
June 14.547,3 11.033,2 2.902,7 3.258,6 84,2 2.290,0 1.444,7 375,9 677,1 3.352,6 146,6 14,9
July 14.779,9 11.647,5 3.385,4 3.324,8 170,9 2.174,7 1.660,6 317,3 613,8 2.806,6 320,9 4,9
August 13.132,2 9.863,3 2.992,2 2.995,1 65,8 1.715,0 1.310,0 185,7 599,5 3.178,6 79,2 11,1
September 13.571,6 9.792,3 3.153,3 2.751,6 76,7 1.581,0 1.449,6 222,1 558,0 3.547,2 223,6 8,5
October 15.025,3 12.026,7 3.636,4 3.543,6 70,6 1.883,6 1.855,3 473,4 563,8 2.876,6 116,5 5,5
November 16.096,3 12.197,2 3.095,0 3.229,7 77,7 2.645,2 1.865,1 568,6 715,9 3.798,1 95,0 6,0
December 29.076,6 19.680,7 4.690,5 5.465,3 145,7 4.360,6 3.327,4 615,5 1.075,7 8.866,9 525,1 3,9
2008 Total 183.103,9 139.822,7 39.302,8 39.120,0 1.138,8 25.512,7 21.925,4 4.504,4 8.318,6 40.906,7 2.291,0 83,5
2009
January 10.222,9 8.428,5 3.135,8 2.030,1 231,0 1.203,0 1.210,1 199,4 419,1 1.404,9 370,6 18,9
February 11.478,3 9.424,8 2.926,0 2.522,1 56,0 1.333,8 1.298,1 710,7 578,1 1.967,4 84,0 2,1
March 13.046,1 10.907,3 3.380,7 3.189,5 82,1 1.365,3 1.834,4 384,3 671,0 2.005,4 132,4 1,0
April 15.042,9 12.237,2 4.435,7 3.181,5 79,3 1.373,5 1.901,6 452,4 813,2 2.660,1 136,0 9,6
May 12.335,4 9.797,5 2.744,6 2.885,4 73,9 1.349,9 1.364,6 677,7 701,4 2.452,3 83,5 2,1
June 12.646,9 9.950,0 3.693,3 2.726,8 98,4 1.317,3 1.213,2 277,6 623,4 2.518,0 177,4 1,5
July 15.435,2 10.936,6 3.610,8 2.933,2 241,8 1.482,8 1.321,0 606,6 740,4 4.105,0 387,0 6,6
August 14.686,6 10.901,8 3.319,5 3.135,3 59,5 1.838,1 1.491,7 379,4 678,3 3.616,0 158,3 10,5
September 14.231,7 10.309,4 3.057,4 3.100,3 61,9 1.550,3 1.301,0 629,9 608,6 3.781,9 138,2 2,2
October 15.366,8 11.506,7 3.796,2 3.441,6 74,2 1.376,8 1.709,8 368,6 739,5 3.675,4 164,6 20,1
November 15.721,8 10.951,5 3.357,8 3.276,4 67,9 1.879,8 1.498,2 295,3 576,1 4.574,7 185,7 9,9
December 26.214,4 18.310,4 4.174,9 6.047,6 120,2 3.396,4 2.367,8 1.186,0 1.017,5 7.580,3 289,5 34,2
2009 Total 176.429,0 133.661,7 41.632,7 38.469,8 1.246,2 19.467,0 18.511,5 6.167,9 8.166,6 40.341,4 2.307,2 118,7
2010
January 9.490,6 8.027,2 2.973,6 1.834,1 249,6 977,3 1.142,1 457,3 393,2 1.020,0 429,9 13,5
February 11.527,7 9.446,7 3.417,2 2.215,7 58,4 1.238,2 1.328,4 560,7 628,1 1.944,6 129,8 6,6
March 14.244,1 11.538,7 3.867,7 3.128,0 76,2 1.763,8 1.457,2 490,8 755,0 2.491,9 195,4 18,1
April 14.557,8 11.248,9 3.779,2 3.170,8 76,2 1.543,2 1.580,0 337,8 761,7 2.121,6 1.186,1 1,2
May 13.428,2 10.577,0 3.030,9 3.357,4 75,8 1.286,4 1.466,8 633,0 726,7 2.678,7 172,3 0,2
June 14.380,6 11.214,6 3.417,3 3.334,5 124,4 1.662,5 1.398,3 532,2 745,4 2.952,9 212,9 0,2
July 16.416,5 11.903,7 3.455,0 3.550,9 378,9 1.618,3 1.339,4 828,7 732,5 3.820,4 685,4 7,0
August 16.350,7 12.365,7 3.444,0 4.087,1 81,3 2.057,3 1.434,8 492,0 769,2 3.610,7 373,4 0,9
September 15.363,9 11.330,2 3.434,6 3.487,8 91,9 1.665,7 1.311,8 665,4 673,0 3.768,5 252,5 12,7
October 16.335,1 12.796,9 3.548,7 3.851,7 110,5 2.328,0 1.454,0 793,2 710,8 3.283,1 253,5 1,6
November 17.063,3 12.458,2 3.549,1 4.122,0 100,5 1.925,1 1.594,4 501,8 665,3 4.339,2 257,6 8,3
December 33.907,1 23.359,8 4.304,1 6.470,6 211,7 7.116,2 2.782,2 1.112,5 1.362,5 9.963,8 523,8 59,7
2010 Total 193.065,6 146.267,6 42.221,4 42.610,6 1.635,4 25.182,0 18.289,4 7.405,4 8.923,4 41.995,4 4.672,6 130,0
2011 January 10.335,8 8.789,9 3.099,2 2.328,6 341,4 1.260,5 1.003,5 324,2 432,5 711,1 817,4 17,4
2011 Total 10.335,8 8.789,9 3.099,2 2.328,6 341,4 1.260,5 1.003,5 324,2 432,5 711,1 817,4 17,4
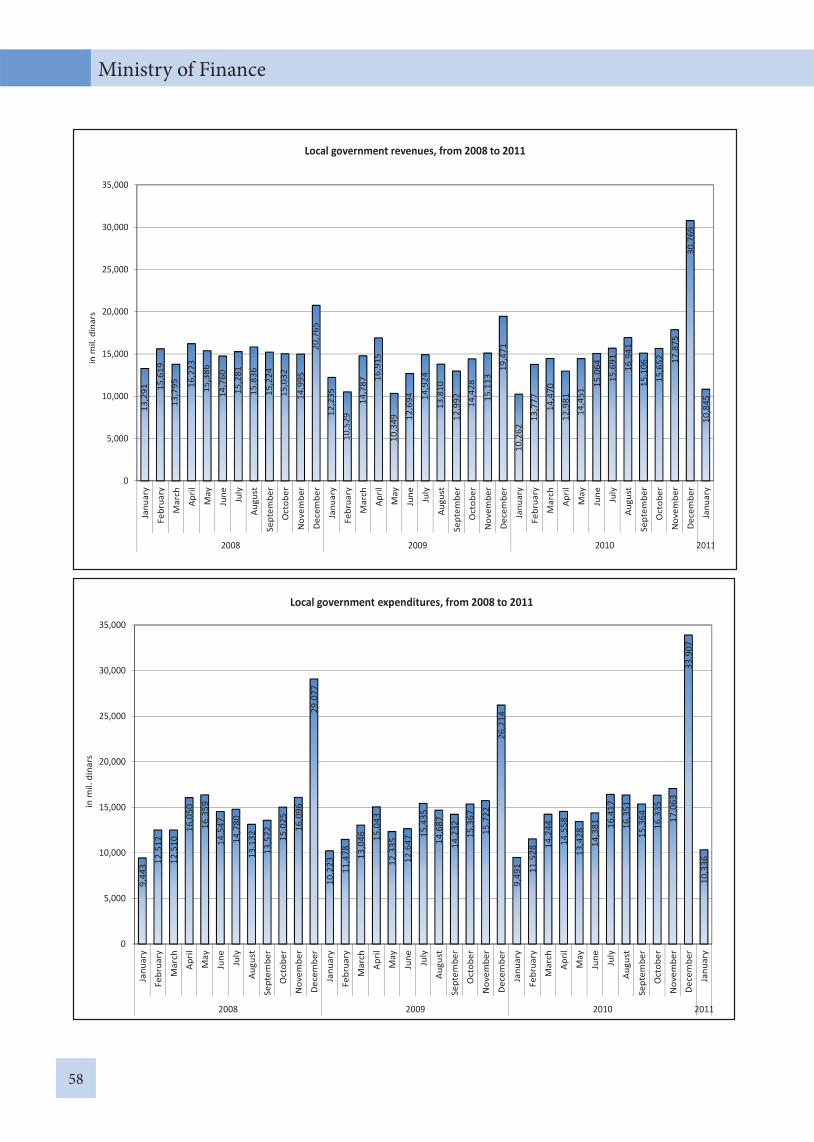
58
Ministry of Finance
13,2
91 15,6
1913
,795 16
,223
15,3
86
14,7
60
15,2
81
15,8
36
15,2
2415
,032
14,9
9520
,765
12,2
35
10,5
29
14,7
87 16,9
15
10,3
49 12,6
94 14,9
24
13,8
10
12,9
92 14,4
28
15,1
13
19,4
71
10,2
62
13,7
77
14,4
70
12,9
8114
,451
15,0
64
15,6
91
16,9
41
15,1
06
15,6
52 17,8
75
30,7
69
10,8
45
0
5,000
10,000
15,000
20,000
25,000
30,000
35,000
Janu
ary
Febr
uary
Mar
ch
April
May
June July
Augu
st
Sept
embe
r
Oct
ober
Nov
embe
r
Dec
embe
r
Janu
ary
Febr
uary
Mar
ch
April
May
June July
Augu
st
Sept
embe
r
Oct
ober
Nov
embe
r
Dec
embe
r
Janu
ary
Febr
uary
Mar
ch
April
May
June July
Augu
st
Sept
embe
r
Oct
ober
Nov
embe
r
Dec
embe
r
Janu
ary
2008 2009 2010 2011
inm
il.di
nars
Local government revenues, from 2008 to 20119,
443 12
,512
12,5
10
16,0
50
16,3
59
14,5
47
14,7
80
13,1
32
13,5
72 15,0
25
16,0
96
29,0
77
10,2
23
11,4
78 13,0
46 15,0
43
12,3
35
12,6
47
15,4
35
14,6
87
14,2
32
15,3
67
15,7
22
26,2
14
9,49
1 11,5
28
14,2
44
14,5
58
13,4
28
14,3
81 16,4
17
16,3
51
15,3
64
16,3
35
17,0
63
33,9
07
10,3
36
0
5,000
10,000
15,000
20,000
25,000
30,000
35,000
Janu
ary
Febr
uary
Mar
ch
April
May
June July
Augu
st
Sept
embe
r
Oct
ober
Nov
embe
r
Dec
embe
r
Janu
ary
Febr
uary
Mar
ch
April
May
June July
Augu
st
Sept
embe
r
Oct
ober
Nov
embe
r
Dec
embe
r
Janu
ary
Febr
uary
Mar
ch
April
May
June July
Augu
st
Sept
embe
r
Oct
ober
Nov
embe
r
Dec
embe
r
Janu
ary
2008 2009 2010 2011
inm
il.di
nars
Local government expenditures, from 2008 to 2011

59
January 2011
Belgrade30.0%
Cities32.0%
Municipalities38.0%
Structure of revenues of local government in 2011
Belgrade25.5%
Cities30.1%
Municipalities44.4%
Structure of expenditures of local government in 2011

MIN
ISTR
Y O
F FI
NA
NCE
BULL
ETIN
JAN
UARY
201
1

FINANCIAL PLANS OF SOCIAL SECURITYORGANIZATIONS (SSO)
Source: SSO
FISC
AL
TREN
DS

62
Ministry of Finance
Table 1. Revenues of Pension fundin mil. dinars
Period Total revenues Social contribu ons
Transfers and grants Other revenues Priva za on
proceeds
1 = 2 + 3 + 4 + 5 2 3 4 5
2005 Total 244.016,5 135.686,7 92.403,3 7.964,5 7.962,0 2006 Total 294.226,6 171.237,1 111.182,3 8.894,8 2.912,4 2007 Total 320.305,4 196.888,4 110.060,6 9.087,4 4.268,9
2008
January 24.716,6 15.118,0 7.609,5 857,7 1131,4February 29.996,8 17.996,9 9.676,3 696,6 1627,0March 31.959,6 17.934,2 11.797,2 703,7 1.524,5April 32.277,9 19.229,1 11.993,2 856,0 199,6May 29.536,2 17.677,6 10.771,7 727,3 359,6June 30.596,4 18.480,7 10.640,2 886,3 589,2July 31.655,6 19.587,7 10.736,7 897,9 433,3August 30.070,5 18.504,1 10.637,7 748,3 180,4September 32.231,3 19.071,0 10.620,8 784,3 1.755,2October 34.317,9 20.355,5 11.293,2 915,0 1.754,2November 37.798,0 18.580,7 16.962,8 702,8 1.551,7December 43.381,4 25.591,9 15.050,9 857,6 1.881,0
2008 Total 388.538,2 228.127,4 137.790,2 9.633,5 12.987,1
2009
January 32.640,7 16.125,4 14.344,1 714,6 1.456,6February 37.610,4 18.397,2 18.381,1 705,2 126,9March 38.052,3 19.713,4 17.416,4 779,1 143,4April 41.177,2 21.059,5 18.828,6 999,3 289,8May 38.080,0 18.637,5 18.257,2 911,8 273,5June 38.695,5 19.618,4 17.962,1 797,3 317,7July 38.004,6 22.025,6 14.887,8 987,5 103,7August 38.706,8 18.503,2 19.226,8 886,4 90,4September 37.595,9 18.715,1 17.961,4 838,2 81,2October 38.947,8 19.203,2 18.803,6 854,4 86,6November 37.578,6 18.816,9 17.741,4 890,3 130,0December 45.599,8 24.593,0 19.957,9 949,2 99,7
2009 Total 462.689,6 235.408,4 213.768,4 10.313,3 3.199,5
2010
January 33.598,6 15.856,9 16.936,5 755,7 49,5February 38.625,7 18.511,5 19.186,8 886,0 41,4March 39.319,0 20.208,8 18.114,8 831,5 163,9April 40.535,9 20.801,2 18.736,0 928,4 70,3May 36.937,2 18.147,8 17.602,6 1.026,5 160,3June 38.671,0 19.392,9 18.096,9 1.067,5 113,7July 39.183,8 19.665,0 18.493,1 992,0 33,7August 38.241,7 19.517,0 17.711,0 953,4 60,3September 39.388,7 19.311,9 19.056,1 975,5 45,2October 39.049,6 19.360,9 18.552,5 1.003,3 132,9November 39.329,3 19.977,4 18.243,0 983,3 125,6December 44.673,9 25.250,4 18.421,1 944,7 57,7
2010 Total 467.554,4 236.001,7 219.150,4 11.347,8 1.054,52011 January 34.552,4 16.625,7 17.166,0 727,1 33,6
2011 Total 34.552,4 16.625,7 17.166,0 727,1 33,6Note: priva za on proceeds include proceeds from borrowing of Employees pension fund revenues fund in 2003, 2004 and 2005
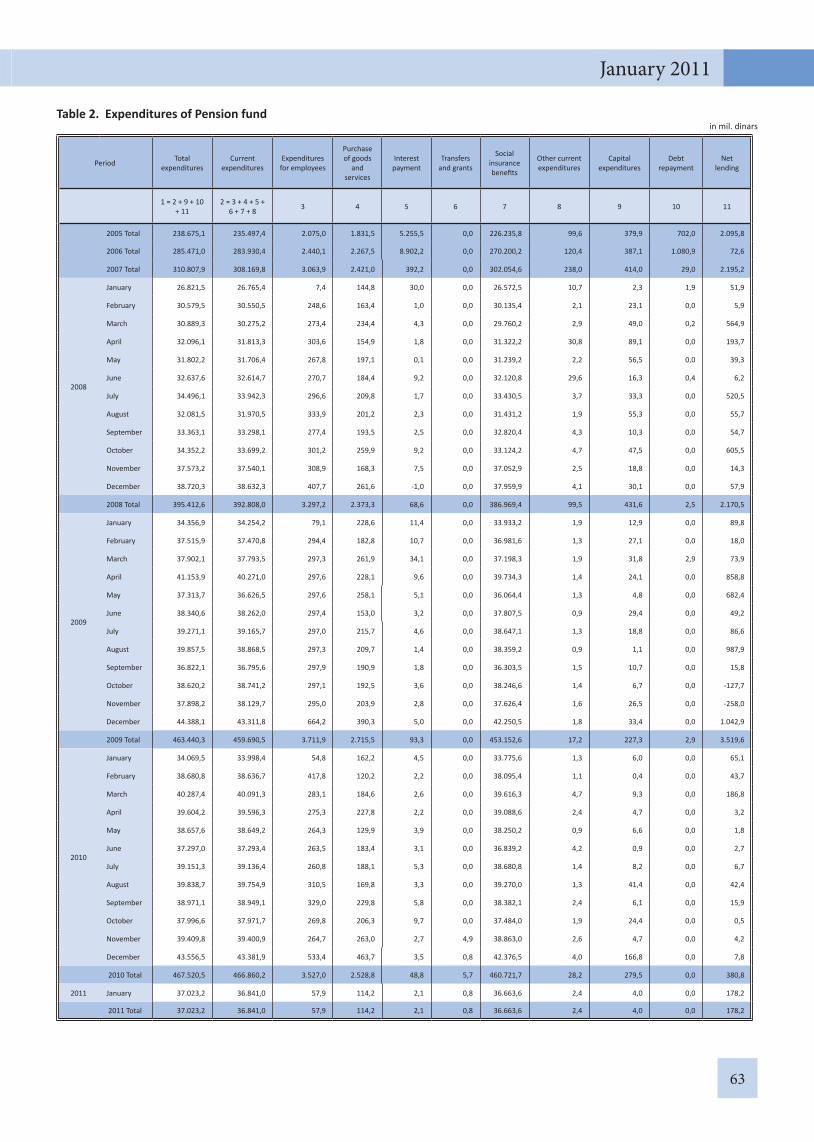
63
January 2011
Table 2. Expenditures of Pension fundin mil. dinars
Period Total expenditures
Current expenditures
Expenditures for employees
Purchase of goods
and services
Interest payment
Transfers and grants
Social insurance benefi ts
Other current expenditures
Capital expenditures
Debt repayment
Net lending
1 = 2 + 9 + 10 + 11
2 = 3 + 4 + 5 + 6 + 7 + 8 3 4 5 6 7 8 9 10 11
2005 Total 238.675,1 235.497,4 2.075,0 1.831,5 5.255,5 0,0 226.235,8 99,6 379,9 702,0 2.095,8
2006 Total 285.471,0 283.930,4 2.440,1 2.267,5 8.902,2 0,0 270.200,2 120,4 387,1 1.080,9 72,6
2007 Total 310.807,9 308.169,8 3.063,9 2.421,0 392,2 0,0 302.054,6 238,0 414,0 29,0 2.195,2
2008
January 26.821,5 26.765,4 7,4 144,8 30,0 0,0 26.572,5 10,7 2,3 1,9 51,9
February 30.579,5 30.550,5 248,6 163,4 1,0 0,0 30.135,4 2,1 23,1 0,0 5,9
March 30.889,3 30.275,2 273,4 234,4 4,3 0,0 29.760,2 2,9 49,0 0,2 564,9
April 32.096,1 31.813,3 303,6 154,9 1,8 0,0 31.322,2 30,8 89,1 0,0 193,7
May 31.802,2 31.706,4 267,8 197,1 0,1 0,0 31.239,2 2,2 56,5 0,0 39,3
June 32.637,6 32.614,7 270,7 184,4 9,2 0,0 32.120,8 29,6 16,3 0,4 6,2
July 34.496,1 33.942,3 296,6 209,8 1,7 0,0 33.430,5 3,7 33,3 0,0 520,5
August 32.081,5 31.970,5 333,9 201,2 2,3 0,0 31.431,2 1,9 55,3 0,0 55,7
September 33.363,1 33.298,1 277,4 193,5 2,5 0,0 32.820,4 4,3 10,3 0,0 54,7
October 34.352,2 33.699,2 301,2 259,9 9,2 0,0 33.124,2 4,7 47,5 0,0 605,5
November 37.573,2 37.540,1 308,9 168,3 7,5 0,0 37.052,9 2,5 18,8 0,0 14,3
December 38.720,3 38.632,3 407,7 261,6 -1,0 0,0 37.959,9 4,1 30,1 0,0 57,9
2008 Total 395.412,6 392.808,0 3.297,2 2.373,3 68,6 0,0 386.969,4 99,5 431,6 2,5 2.170,5
2009
January 34.356,9 34.254,2 79,1 228,6 11,4 0,0 33.933,2 1,9 12,9 0,0 89,8
February 37.515,9 37.470,8 294,4 182,8 10,7 0,0 36.981,6 1,3 27,1 0,0 18,0
March 37.902,1 37.793,5 297,3 261,9 34,1 0,0 37.198,3 1,9 31,8 2,9 73,9
April 41.153,9 40.271,0 297,6 228,1 9,6 0,0 39.734,3 1,4 24,1 0,0 858,8
May 37.313,7 36.626,5 297,6 258,1 5,1 0,0 36.064,4 1,3 4,8 0,0 682,4
June 38.340,6 38.262,0 297,4 153,0 3,2 0,0 37.807,5 0,9 29,4 0,0 49,2
July 39.271,1 39.165,7 297,0 215,7 4,6 0,0 38.647,1 1,3 18,8 0,0 86,6
August 39.857,5 38.868,5 297,3 209,7 1,4 0,0 38.359,2 0,9 1,1 0,0 987,9
September 36.822,1 36.795,6 297,9 190,9 1,8 0,0 36.303,5 1,5 10,7 0,0 15,8
October 38.620,2 38.741,2 297,1 192,5 3,6 0,0 38.246,6 1,4 6,7 0,0 -127,7
November 37.898,2 38.129,7 295,0 203,9 2,8 0,0 37.626,4 1,6 26,5 0,0 -258,0
December 44.388,1 43.311,8 664,2 390,3 5,0 0,0 42.250,5 1,8 33,4 0,0 1.042,9
2009 Total 463.440,3 459.690,5 3.711,9 2.715,5 93,3 0,0 453.152,6 17,2 227,3 2,9 3.519,6
2010
January 34.069,5 33.998,4 54,8 162,2 4,5 0,0 33.775,6 1,3 6,0 0,0 65,1
February 38.680,8 38.636,7 417,8 120,2 2,2 0,0 38.095,4 1,1 0,4 0,0 43,7
March 40.287,4 40.091,3 283,1 184,6 2,6 0,0 39.616,3 4,7 9,3 0,0 186,8
April 39.604,2 39.596,3 275,3 227,8 2,2 0,0 39.088,6 2,4 4,7 0,0 3,2
May 38.657,6 38.649,2 264,3 129,9 3,9 0,0 38.250,2 0,9 6,6 0,0 1,8
June 37.297,0 37.293,4 263,5 183,4 3,1 0,0 36.839,2 4,2 0,9 0,0 2,7
July 39.151,3 39.136,4 260,8 188,1 5,3 0,0 38.680,8 1,4 8,2 0,0 6,7
August 39.838,7 39.754,9 310,5 169,8 3,3 0,0 39.270,0 1,3 41,4 0,0 42,4
September 38.971,1 38.949,1 329,0 229,8 5,8 0,0 38.382,1 2,4 6,1 0,0 15,9
October 37.996,6 37.971,7 269,8 206,3 9,7 0,0 37.484,0 1,9 24,4 0,0 0,5
November 39.409,8 39.400,9 264,7 263,0 2,7 4,9 38.863,0 2,6 4,7 0,0 4,2
December 43.556,5 43.381,9 533,4 463,7 3,5 0,8 42.376,5 4,0 166,8 0,0 7,8
2010 Total 467.520,5 466.860,2 3.527,0 2.528,8 48,8 5,7 460.721,7 28,2 279,5 0,0 380,8
2011 January 37.023,2 36.841,0 57,9 114,2 2,1 0,8 36.663,6 2,4 4,0 0,0 178,2
2011 Total 37.023,2 36.841,0 57,9 114,2 2,1 0,8 36.663,6 2,4 4,0 0,0 178,2
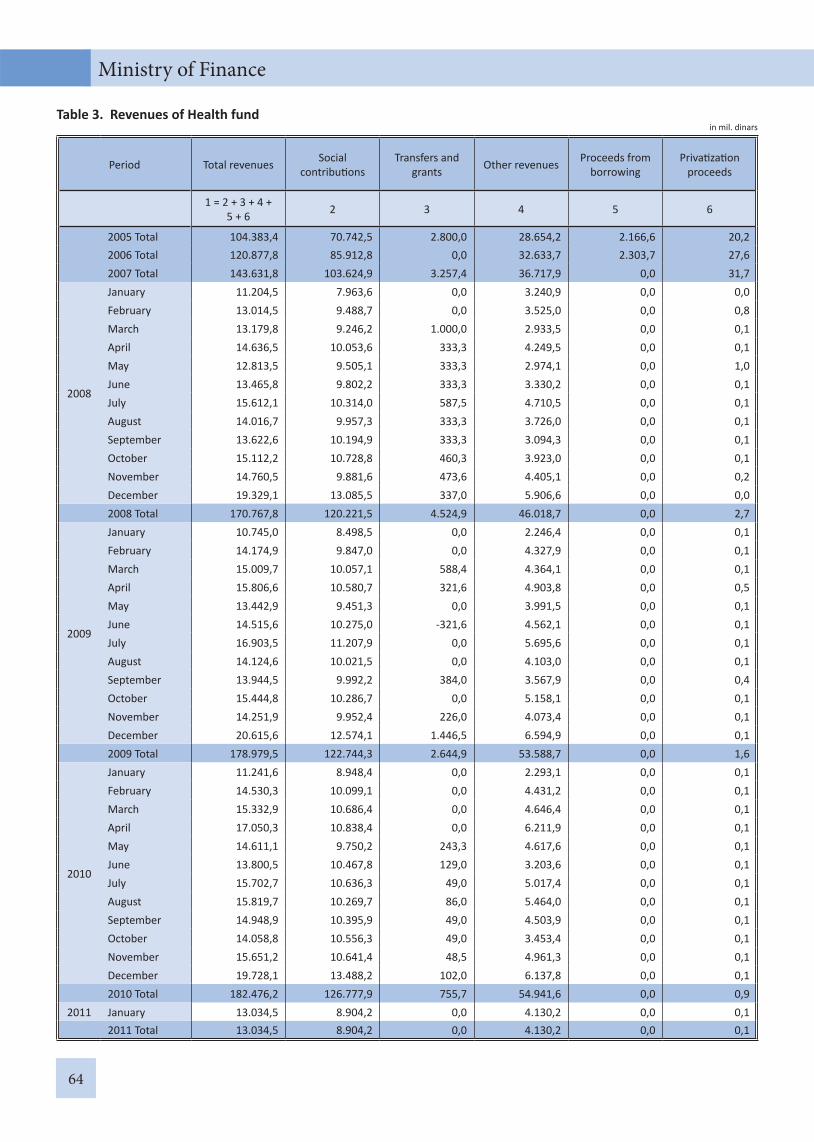
64
Ministry of Finance
Table 3. Revenues of Health fundin mil. dinars
Period Total revenues Social contribu ons
Transfers and grants Other revenues Proceeds from
borrowingPriva za on
proceeds
1 = 2 + 3 + 4 + 5 + 6 2 3 4 5 6
2005 Total 104.383,4 70.742,5 2.800,0 28.654,2 2.166,6 20,2 2006 Total 120.877,8 85.912,8 0,0 32.633,7 2.303,7 27,6 2007 Total 143.631,8 103.624,9 3.257,4 36.717,9 0,0 31,7
2008
January 11.204,5 7.963,6 0,0 3.240,9 0,0 0,0February 13.014,5 9.488,7 0,0 3.525,0 0,0 0,8March 13.179,8 9.246,2 1.000,0 2.933,5 0,0 0,1April 14.636,5 10.053,6 333,3 4.249,5 0,0 0,1May 12.813,5 9.505,1 333,3 2.974,1 0,0 1,0June 13.465,8 9.802,2 333,3 3.330,2 0,0 0,1July 15.612,1 10.314,0 587,5 4.710,5 0,0 0,1August 14.016,7 9.957,3 333,3 3.726,0 0,0 0,1September 13.622,6 10.194,9 333,3 3.094,3 0,0 0,1October 15.112,2 10.728,8 460,3 3.923,0 0,0 0,1November 14.760,5 9.881,6 473,6 4.405,1 0,0 0,2December 19.329,1 13.085,5 337,0 5.906,6 0,0 0,0
2008 Total 170.767,8 120.221,5 4.524,9 46.018,7 0,0 2,7
2009
January 10.745,0 8.498,5 0,0 2.246,4 0,0 0,1February 14.174,9 9.847,0 0,0 4.327,9 0,0 0,1March 15.009,7 10.057,1 588,4 4.364,1 0,0 0,1April 15.806,6 10.580,7 321,6 4.903,8 0,0 0,5May 13.442,9 9.451,3 0,0 3.991,5 0,0 0,1June 14.515,6 10.275,0 -321,6 4.562,1 0,0 0,1July 16.903,5 11.207,9 0,0 5.695,6 0,0 0,1August 14.124,6 10.021,5 0,0 4.103,0 0,0 0,1September 13.944,5 9.992,2 384,0 3.567,9 0,0 0,4October 15.444,8 10.286,7 0,0 5.158,1 0,0 0,1November 14.251,9 9.952,4 226,0 4.073,4 0,0 0,1December 20.615,6 12.574,1 1.446,5 6.594,9 0,0 0,1
2009 Total 178.979,5 122.744,3 2.644,9 53.588,7 0,0 1,6
2010
January 11.241,6 8.948,4 0,0 2.293,1 0,0 0,1February 14.530,3 10.099,1 0,0 4.431,2 0,0 0,1March 15.332,9 10.686,4 0,0 4.646,4 0,0 0,1April 17.050,3 10.838,4 0,0 6.211,9 0,0 0,1May 14.611,1 9.750,2 243,3 4.617,6 0,0 0,1June 13.800,5 10.467,8 129,0 3.203,6 0,0 0,1July 15.702,7 10.636,3 49,0 5.017,4 0,0 0,1August 15.819,7 10.269,7 86,0 5.464,0 0,0 0,1September 14.948,9 10.395,9 49,0 4.503,9 0,0 0,1October 14.058,8 10.556,3 49,0 3.453,4 0,0 0,1November 15.651,2 10.641,4 48,5 4.961,3 0,0 0,1December 19.728,1 13.488,2 102,0 6.137,8 0,0 0,1
2010 Total 182.476,2 126.777,9 755,7 54.941,6 0,0 0,92011 January 13.034,5 8.904,2 0,0 4.130,2 0,0 0,1 2011 Total 13.034,5 8.904,2 0,0 4.130,2 0,0 0,1
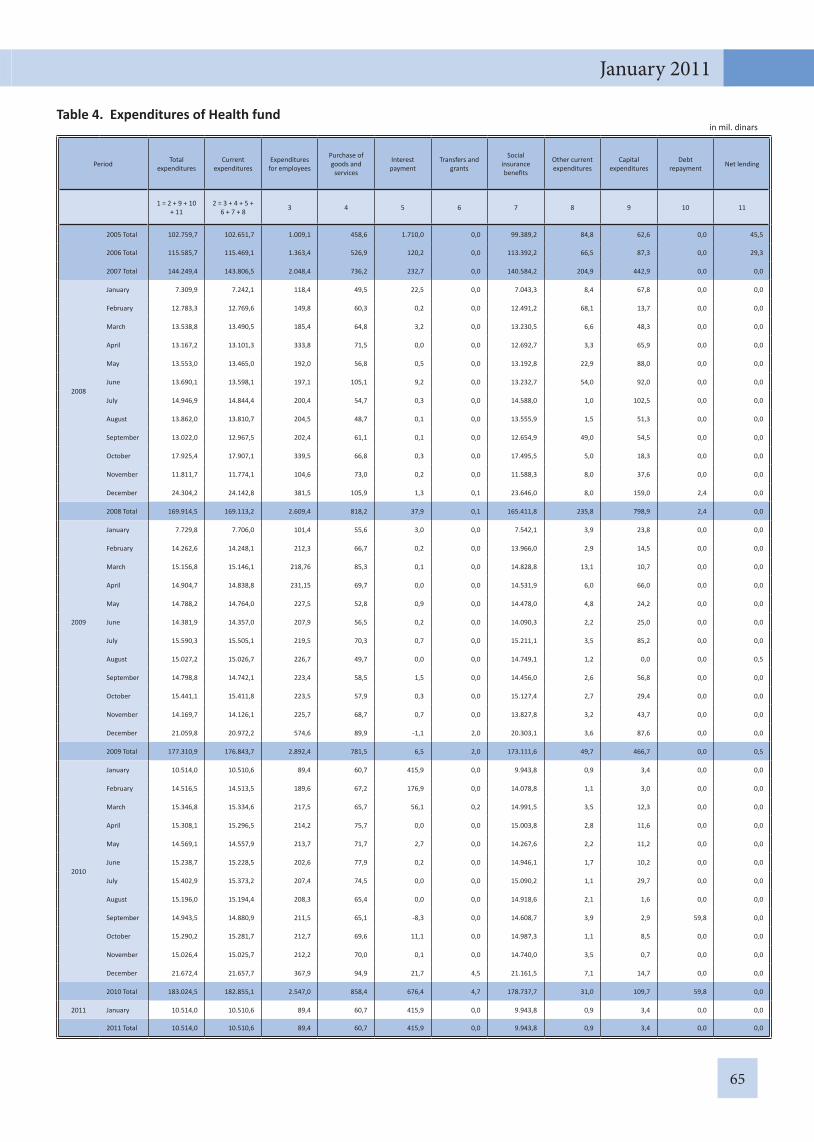
65
January 2011
Table 4. Expenditures of Health fundin mil. dinars
Period Total expenditures
Current expenditures
Expenditures for employees
Purchase of goods and
services
Interest payment
Transfers and grants
Social insurance benefi ts
Other current expenditures
Capital expenditures
Debt repayment Net lending
1 = 2 + 9 + 10 + 11
2 = 3 + 4 + 5 + 6 + 7 + 8 3 4 5 6 7 8 9 10 11
2005 Total 102.759,7 102.651,7 1.009,1 458,6 1.710,0 0,0 99.389,2 84,8 62,6 0,0 45,5
2006 Total 115.585,7 115.469,1 1.363,4 526,9 120,2 0,0 113.392,2 66,5 87,3 0,0 29,3
2007 Total 144.249,4 143.806,5 2.048,4 736,2 232,7 0,0 140.584,2 204,9 442,9 0,0 0,0
2008
January 7.309,9 7.242,1 118,4 49,5 22,5 0,0 7.043,3 8,4 67,8 0,0 0,0
February 12.783,3 12.769,6 149,8 60,3 0,2 0,0 12.491,2 68,1 13,7 0,0 0,0
March 13.538,8 13.490,5 185,4 64,8 3,2 0,0 13.230,5 6,6 48,3 0,0 0,0
April 13.167,2 13.101,3 333,8 71,5 0,0 0,0 12.692,7 3,3 65,9 0,0 0,0
May 13.553,0 13.465,0 192,0 56,8 0,5 0,0 13.192,8 22,9 88,0 0,0 0,0
June 13.690,1 13.598,1 197,1 105,1 9,2 0,0 13.232,7 54,0 92,0 0,0 0,0
July 14.946,9 14.844,4 200,4 54,7 0,3 0,0 14.588,0 1,0 102,5 0,0 0,0
August 13.862,0 13.810,7 204,5 48,7 0,1 0,0 13.555,9 1,5 51,3 0,0 0,0
September 13.022,0 12.967,5 202,4 61,1 0,1 0,0 12.654,9 49,0 54,5 0,0 0,0
October 17.925,4 17.907,1 339,5 66,8 0,3 0,0 17.495,5 5,0 18,3 0,0 0,0
November 11.811,7 11.774,1 104,6 73,0 0,2 0,0 11.588,3 8,0 37,6 0,0 0,0
December 24.304,2 24.142,8 381,5 105,9 1,3 0,1 23.646,0 8,0 159,0 2,4 0,0
2008 Total 169.914,5 169.113,2 2.609,4 818,2 37,9 0,1 165.411,8 235,8 798,9 2,4 0,0
2009
January 7.729,8 7.706,0 101,4 55,6 3,0 0,0 7.542,1 3,9 23,8 0,0 0,0
February 14.262,6 14.248,1 212,3 66,7 0,2 0,0 13.966,0 2,9 14,5 0,0 0,0
March 15.156,8 15.146,1 218,76 85,3 0,1 0,0 14.828,8 13,1 10,7 0,0 0,0
April 14.904,7 14.838,8 231,15 69,7 0,0 0,0 14.531,9 6,0 66,0 0,0 0,0
May 14.788,2 14.764,0 227,5 52,8 0,9 0,0 14.478,0 4,8 24,2 0,0 0,0
June 14.381,9 14.357,0 207,9 56,5 0,2 0,0 14.090,3 2,2 25,0 0,0 0,0
July 15.590,3 15.505,1 219,5 70,3 0,7 0,0 15.211,1 3,5 85,2 0,0 0,0
August 15.027,2 15.026,7 226,7 49,7 0,0 0,0 14.749,1 1,2 0,0 0,0 0,5
September 14.798,8 14.742,1 223,4 58,5 1,5 0,0 14.456,0 2,6 56,8 0,0 0,0
October 15.441,1 15.411,8 223,5 57,9 0,3 0,0 15.127,4 2,7 29,4 0,0 0,0
November 14.169,7 14.126,1 225,7 68,7 0,7 0,0 13.827,8 3,2 43,7 0,0 0,0
December 21.059,8 20.972,2 574,6 89,9 -1,1 2,0 20.303,1 3,6 87,6 0,0 0,0
2009 Total 177.310,9 176.843,7 2.892,4 781,5 6,5 2,0 173.111,6 49,7 466,7 0,0 0,5
2010
January 10.514,0 10.510,6 89,4 60,7 415,9 0,0 9.943,8 0,9 3,4 0,0 0,0
February 14.516,5 14.513,5 189,6 67,2 176,9 0,0 14.078,8 1,1 3,0 0,0 0,0
March 15.346,8 15.334,6 217,5 65,7 56,1 0,2 14.991,5 3,5 12,3 0,0 0,0
April 15.308,1 15.296,5 214,2 75,7 0,0 0,0 15.003,8 2,8 11,6 0,0 0,0
May 14.569,1 14.557,9 213,7 71,7 2,7 0,0 14.267,6 2,2 11,2 0,0 0,0
June 15.238,7 15.228,5 202,6 77,9 0,2 0,0 14.946,1 1,7 10,2 0,0 0,0
July 15.402,9 15.373,2 207,4 74,5 0,0 0,0 15.090,2 1,1 29,7 0,0 0,0
August 15.196,0 15.194,4 208,3 65,4 0,0 0,0 14.918,6 2,1 1,6 0,0 0,0
September 14.943,5 14.880,9 211,5 65,1 -8,3 0,0 14.608,7 3,9 2,9 59,8 0,0
October 15.290,2 15.281,7 212,7 69,6 11,1 0,0 14.987,3 1,1 8,5 0,0 0,0
November 15.026,4 15.025,7 212,2 70,0 0,1 0,0 14.740,0 3,5 0,7 0,0 0,0
December 21.672,4 21.657,7 367,9 94,9 21,7 4,5 21.161,5 7,1 14,7 0,0 0,0
2010 Total 183.024,5 182.855,1 2.547,0 858,4 676,4 4,7 178.737,7 31,0 109,7 59,8 0,0
2011 January 10.514,0 10.510,6 89,4 60,7 415,9 0,0 9.943,8 0,9 3,4 0,0 0,0
2011 Total 10.514,0 10.510,6 89,4 60,7 415,9 0,0 9.943,8 0,9 3,4 0,0 0,0

66
Ministry of Finance
Table 5. Revenues of Na onal employment agencyin mil. dinars
Period Total revenues Social contribu ons Transfers and grants Other revenues
1 = 2 + 3 + 4 2 3 4
2005 Total 17.364,4 8.461,8 8.820,7 81,9 2006 Total 21.338,3 10.404,9 10.812,0 121,4 2007 Total 26.467,3 12.422,8 13.782,2 262,3
2008
January 2.613,5 972,3 1.625,6 15,6February 2.716,9 1.144,0 1.558,2 14,7March 2.095,7 1.129,7 954,6 11,4April 2.423,3 1.243,4 1.171,7 8,2May 2.351,1 1.150,0 1.169,7 31,4June 2.549,8 1.193,5 1.334,8 21,5July 2.686,5 1.238,7 1.413,5 34,3August 2.552,6 1.203,0 1.330,6 19,0September 2.638,9 1.223,7 1.390,6 24,6October 2.611,6 1.307,5 1.280,8 23,3November 2.447,6 1.196,6 1.227,6 23,4December 3.249,6 1.624,2 1.597,9 27,5
2008 Total 30.937,1 14.626,6 16.055,6 254,9
2009
January 2.189,0 1.040,0 1.125,8 23,2February 2.464,0 1.197,2 1.242,6 24,2March 2.471,3 1.234,2 1.210,8 26,3April 2.936,0 1.285,4 1.625,5 25,1May 3.920,8 1.143,3 2.717,8 59,7June 2.888,1 1.247,4 1.600,0 40,7July 3.430,5 1.311,5 2.060,2 58,8August 2.736,9 1.194,2 1.519,8 22,9September 3.646,1 1.202,5 2.402,4 41,2October 2.829,5 1.238,8 1.553,6 37,1November 3.327,1 1.208,9 2.087,8 30,4December 3.706,9 1.485,3 2.186,5 35,1
2009 Total 36.546,2 14.788,7 21.332,8 424,7
2010
January 2.692,0 1.028,3 1.650,1 13,6February 2.936,8 1.204,6 1.713,9 18,3March 3.112,5 1.289,2 1.803,2 20,1April 3.465,5 1.320,0 2.105,2 40,3May 3.333,0 1.187,1 2.124,8 21,1June 3.628,4 1.267,0 2.341,0 20,4July 3.479,6 1.291,8 2.163,6 24,2August 3.631,7 1.248,5 2.363,5 19,7September 3.631,8 1.259,7 2.348,6 23,5October 3.479,0 1.270,8 2.183,9 24,3November 3.252,8 1.285,5 1.930,2 37,1December 3.113,9 1.614,5 1.470,0 29,4
2010 Total 39.757,0 15.267,0 24.198,0 292,02011 January 2.517,9 1.094,9 1.402,9 20,1
2011 Total 2.517,9 1.094,9 1.402,9 20,1

67
January 2011
Table 6. Expenditures of Na onal employment agencyin mil. dinars
Period Total expenditures
Current expenditures
Expenditures for employees
Purchase of goods and
services
Interest payment
Transfers and grants
Social insurance benefi ts
Other current expenditures
Capital expenditures
Debt repayment Net lending
1 = 2 + 9 + 10 + 11
2 = 3 + 4 + 5 + 6 + 7 + 8 3 4 5 6 7 8 9 10 11
2005 Total 17.057,5 16.848,6 920,0 512,5 0,0 0,0 15.409,8 6,3 132,7 0,0 76,2
2006 Total 21.168,6 21.051,7 1.106,4 723,3 0,0 0,0 19.212,9 9,1 116,9 0,0 0,0
2007 Total 26.702,9 26.519,7 1.623,4 762,1 0,0 0,0 24.116,4 17,8 183,2 0,0 0,0
2008
January 2.500,8 2.498,6 123,0 43,4 0,0 0,0 2.328,8 3,4 2,2 0,0 0,0
February 2.761,9 2.747,7 189,5 58,6 0,0 0,0 2.494,4 5,2 14,2 0,0 0,0
March 2.409,0 2.398,0 144,5 49,4 0,0 0,0 2.199,4 4,7 11,0 0,0 0,0
April 2.247,5 2.231,9 157,0 59,8 0,8 0,0 2.009,8 4,5 15,6 0,0 0,0
May 2.499,2 2.468,9 155,2 60,4 1,3 0,0 2.247,2 4,8 30,3 0,0 0,0
June 2.696,4 2.688,6 148,1 59,3 0,5 0,0 2.476,8 3,9 7,8 0,0 0,0
July 2.591,6 2.549,7 151,1 64,7 0,9 0,0 2.327,0 6,0 41,9 0,0 0,0
August 2.571,4 2.546,4 152,4 50,4 0,8 0,0 2.339,3 3,5 25,0 0,0 0,0
September 2.858,0 2.851,8 148,5 66,0 1,6 0,0 2.629,9 5,8 6,2 0,0 0,0
October 2.445,3 2.425,3 159,8 78,1 1,5 0,0 2.180,0 5,9 20,0 0,0 0,0
November 2.274,1 2.266,6 160,6 64,6 1,2 0,0 2.034,8 5,4 7,5 0,0 0,0
December 3.418,9 3.373,1 212,7 98,1 1,8 0,0 3.054,9 5,6 45,8 0,0 0,0
2008 Total 31.274,1 31.046,6 1.902,4 752,8 10,4 0,0 28.322,3 58,7 227,5 0,0 0,0
2009
January 2.182,3 2.178,5 163,0 66,0 0,3 0,0 1.945,1 4,1 3,8 0,0 0,0
February 2.283,1 2.270,8 163,4 57,2 3,8 0,0 2.039,2 7,2 12,3 0,0 0,0
March 2.631,9 2.615,7 163,0 71,2 0,8 0,0 2.376,7 4,0 16,2 0,0 0,0
April 2.823,2 2.807,0 162,7 81,5 1,0 0,0 2.558,7 3,1 16,2 0,0 0,0
May 2.914,0 2.865,7 219,6 88,8 0,8 0,0 2.553,5 3,0 48,3 0,0 0,0
June 2.793,8 2.793,8 170,6 80,9 0,6 0,0 2.538,6 3,1 0,0 0,0 0,0
July 3.258,2 3.242,7 162,3 77,6 0,9 0,0 2.998,7 3,2 15,5 0,0 0,0
August 3.174,6 3.157,1 157,8 81,3 0,0 0,0 2.916,4 1,6 17,5 0,0 0,0
September 3.601,2 3.593,9 155,2 71,2 0,2 0,0 3.364,8 2,5 7,3 0,0 0,0
October 3.297,3 3.287,3 156,8 74,5 0,1 0,0 3.052,5 3,4 10,0 0,0 0,0
November 3.223,8 3.217,6 155,6 79,5 0,0 0,0 2.978,1 4,4 6,2 0,0 0,0
December 3.390,8 3.362,1 207,0 107,3 0,2 0,0 3.042,7 4,9 28,7 0,0 0,0
2009 Total 35.574,2 35.392,2 2.037,0 937,0 8,7 0,0 32.365,0 44,5 182,0 0,0 0,0
2010
January 2.784,8 2.782,9 127,0 55,0 1,0 0,0 2.598,0 1,9 1,9 0,0 0,0
February 3.135,0 3.124,3 180,1 98,2 0,1 0,0 2.843,5 2,4 10,7 0,0 0,0
March 2.790,7 2.779,9 152,1 107,2 0,2 0,0 2.515,7 4,7 10,8 0,0 0,0
April 2.996,0 2.985,9 352,6 64,1 1,5 0,0 2.564,0 3,7 10,1 0,0 0,0
May 3.685,7 3.681,9 6,4 84,6 0,3 0,0 3.587,6 3,0 3,8 0,0 0,0
June 3.926,2 3.901,0 143,8 113,1 0,9 0,0 3.638,1 5,1 25,2 0,0 0,0
July 3.775,5 3.739,1 147,0 109,5 0,2 0,0 3.478,9 3,5 36,4 0,0 0,0
August 3.159,5 3.154,4 145,6 69,4 0,1 0,0 2.937,3 2,0 5,1 0,0 0,0
September 3.398,5 3.368,4 149,5 94,6 1,2 0,0 3.120,9 2,2 30,1 0,0 0,0
October 3.510,8 3.497,9 148,1 81,9 0,5 0,0 3.264,3 3,1 12,9 0,0 0,0
November 3.366,7 3.346,3 145,3 93,5 0,2 0,0 3.104,2 3,1 20,4 0,0 0,0
2010 Total 39.878,3 39.674,5 1.945,1 1.153,9 6,5 0,0 36.530,0 39,0 203,8 0,0 0,0
2011 January 2.313,7 2.303,8 92,7 50,9 0,3 0,0 2.157,9 2,0 9,9 0,0 0,0
2011 Total 42.192,0 41.978,3 2.037,8 1.204,8 6,8 0,0 38.687,9 41,0 213,7 0,0 0,0

MIN
ISTR
Y O
F FI
NA
NCE
BULL
ETIN
JAN
UARY
201
1

PUBLIC DEBT
III
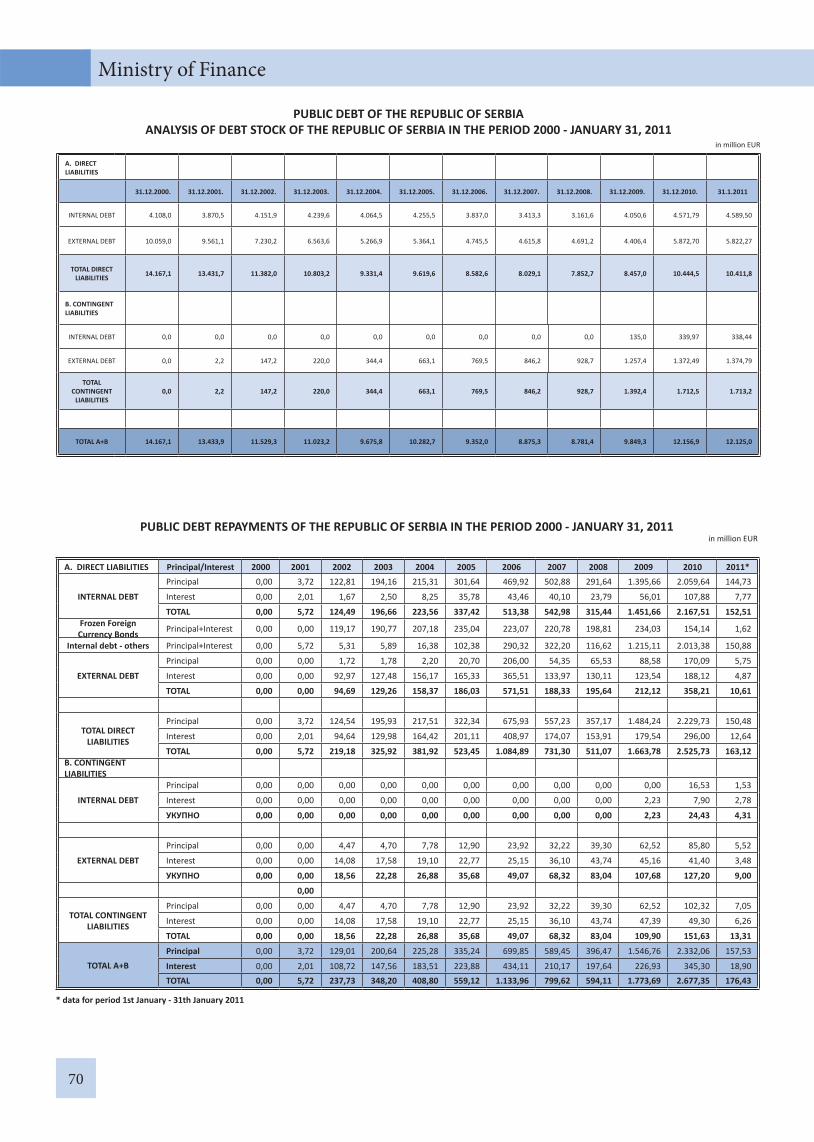
70
Ministry of Finance
PUBLIC DEBT OF THE REPUBLIC OF SERBIAANALYSIS OF DEBT STOCK OF THE REPUBLIC OF SERBIA IN THE PERIOD 2000 - JANUARY 31, 2011
in million EUR
А. DIRECT LIABILITIES
31.12.2000. 31.12.2001. 31.12.2002. 31.12.2003. 31.12.2004. 31.12.2005. 31.12.2006. 31.12.2007. 31.12.2008. 31.12.2009. 31.12.2010. 31.1.2011
INTERNAL DEBT 4.108,0 3.870,5 4.151,9 4.239,6 4.064,5 4.255,5 3.837,0 3.413,3 3.161,6 4.050,6 4.571,79 4.589,50
EXTERNAL DEBT 10.059,0 9.561,1 7.230,2 6.563,6 5.266,9 5.364,1 4.745,5 4.615,8 4.691,2 4.406,4 5.872,70 5.822,27
TOTAL DIRECT LIABILITIES 14.167,1 13.431,7 11.382,0 10.803,2 9.331,4 9.619,6 8.582,6 8.029,1 7.852,7 8.457,0 10.444,5 10.411,8
B. CONTINGENT LIABILITIES
INTERNAL DEBT 0,0 0,0 0,0 0,0 0,0 0,0 0,0 0,0 0,0 135,0 339,97 338,44
EXTERNAL DEBT 0,0 2,2 147,2 220,0 344,4 663,1 769,5 846,2 928,7 1.257,4 1.372,49 1.374,79
TOTAL CONTINGENT
LIABILITIES0,0 2,2 147,2 220,0 344,4 663,1 769,5 846,2 928,7 1.392,4 1.712,5 1.713,2
TOTAL A+B 14.167,1 13.433,9 11.529,3 11.023,2 9.675,8 10.282,7 9.352,0 8.875,3 8.781,4 9.849,3 12.156,9 12.125,0
PUBLIC DEBT REPAYMENTS OF THE REPUBLIC OF SERBIA IN THE PERIOD 2000 - JANUARY 31, 2011in million EUR
А. DIRECT LIABILITIES Principal/Interest 2000 2001 2002 2003 2004 2005 2006 2007 2008 2009 2010 2011*
INTERNAL DEBT
Principal 0,00 3,72 122,81 194,16 215,31 301,64 469,92 502,88 291,64 1.395,66 2.059,64 144,73
Interest 0,00 2,01 1,67 2,50 8,25 35,78 43,46 40,10 23,79 56,01 107,88 7,77
TOTAL 0,00 5,72 124,49 196,66 223,56 337,42 513,38 542,98 315,44 1.451,66 2.167,51 152,51Frozen Foreign Currency Bonds Principal+Interest 0,00 0,00 119,17 190,77 207,18 235,04 223,07 220,78 198,81 234,03 154,14 1,62
Internal debt - others Principal+Interest 0,00 5,72 5,31 5,89 16,38 102,38 290,32 322,20 116,62 1.215,11 2.013,38 150,88
EXTERNAL DEBT
Principal 0,00 0,00 1,72 1,78 2,20 20,70 206,00 54,35 65,53 88,58 170,09 5,75
Interest 0,00 0,00 92,97 127,48 156,17 165,33 365,51 133,97 130,11 123,54 188,12 4,87
TOTAL 0,00 0,00 94,69 129,26 158,37 186,03 571,51 188,33 195,64 212,12 358,21 10,61
TOTAL DIRECT LIABILITIES
Principal 0,00 3,72 124,54 195,93 217,51 322,34 675,93 557,23 357,17 1.484,24 2.229,73 150,48
Interest 0,00 2,01 94,64 129,98 164,42 201,11 408,97 174,07 153,91 179,54 296,00 12,64
TOTAL 0,00 5,72 219,18 325,92 381,92 523,45 1.084,89 731,30 511,07 1.663,78 2.525,73 163,12B. CONTINGENT LIABILITIES
INTERNAL DEBT
Principal 0,00 0,00 0,00 0,00 0,00 0,00 0,00 0,00 0,00 0,00 16,53 1,53
Interest 0,00 0,00 0,00 0,00 0,00 0,00 0,00 0,00 0,00 2,23 7,90 2,78
УКУПНО 0,00 0,00 0,00 0,00 0,00 0,00 0,00 0,00 0,00 2,23 24,43 4,31
EXTERNAL DEBT
Principal 0,00 0,00 4,47 4,70 7,78 12,90 23,92 32,22 39,30 62,52 85,80 5,52
Interest 0,00 0,00 14,08 17,58 19,10 22,77 25,15 36,10 43,74 45,16 41,40 3,48
УКУПНО 0,00 0,00 18,56 22,28 26,88 35,68 49,07 68,32 83,04 107,68 127,20 9,00
0,00
TOTAL CONTINGENT LIABILITIES
Principal 0,00 0,00 4,47 4,70 7,78 12,90 23,92 32,22 39,30 62,52 102,32 7,05
Interest 0,00 0,00 14,08 17,58 19,10 22,77 25,15 36,10 43,74 47,39 49,30 6,26
TOTAL 0,00 0,00 18,56 22,28 26,88 35,68 49,07 68,32 83,04 109,90 151,63 13,31
TOTAL A+BPrincipal 0,00 3,72 129,01 200,64 225,28 335,24 699,85 589,45 396,47 1.546,76 2.332,06 157,53
Interest 0,00 2,01 108,72 147,56 183,51 223,88 434,11 210,17 197,64 226,93 345,30 18,90TOTAL 0,00 5,72 237,73 348,20 408,80 559,12 1.133,96 799,62 594,11 1.773,69 2.677,35 176,43
* data for period 1st January - 31th January 2011

71
January 2011
* Estimate GDP for 2010. and Debt stock of December 31, 2010** Estimate GDP for 2011. and Debt stock of January 31, 2011
169,3
104,8
71,963,7
50,9 50,6
40,130,8
26,332,9
41,4 38,0
0
50
100
150
200
2000 2001 2002 2003 2004 2005 2006 2007 2008 2009 2010* 2011**
in %
Debt to GDP ratio in the period 2000 January 31,2011
2000 2001 2002 2003 2004 2005 2006 2007 2008 2009 2010* 2011**
169,3 104,8 71,9 63,7 50,9 50,6 40,1 30,8 26,3 32,9 41,4 38,0
DEBT GDP RATIO IN THE PERIOD 2000 JANUARY 31, 2011
YEAR
Public Debt/GDP (%)

72
Ministry of Finance
Public Debt Stock of the Republic of Serbia as of January 31, 2011Currency mix
Currency Amount in original currency Amount in RSD Share of outstanding debt, in %
RSD 187.598.250.264,72 187.598.250.264,72 14,79%
EUR 7.304.866.547,66 764.126.295.705,10 60,25%
USD 2.375.394.363,37 182.463.067.549,29 14,39%
CHF 264.974.123,92 21.629.069.310,91 1,71%
SDR 831.653.573,78 99.931.327.095,15 7,88%
Other * 12.588.562.752,47 0,99%
Total 1.268.336.572.678 100,00%
* GBP, JPY, CHF, DKK, SEK, NOK
14,8%
60,2%
14,4%
1,7%7,9%1,0%
RSD EUR USD CHF SDR Other *

73
January 2011
RSDTOTAL PUBLIC DEBT 1.268.336.572.677,64FIXED INTEREST RATES 843.684.062.493,01VARIABLE INTEREST RATES 424.652.510.184,63
EURIBOR 357.495.643.078,28LIBOR USD 45.209.102.937,94
LIBOR CHF 10.361.590.935,03
LIBOR GBP 774.800.846,17
LIBOR JPY 1.147.170.240,19
STIBOR 511.133.088,16
NIBOR 927.662.931,10
CIBOR 955.266.810,39
BELIBOR 1.250.000.000,00Аustrian market interest rate and other interes rates* 6.020.139.317,36
TOTAL PUBLIC DEBT 100,00%FIXED INTEREST RATES 66,52%VARIABLE INTEREST RATES 33,48%
EURIBOR 28,19%LIBOR USD 3,56%LIBOR CHF 0,82%LIBOR GBP 0,06%LIBOR JPY 0,09%STIBOR 0,04%NIBOR 0,07%CIBOR 0,08%BELIBOR 0,10%Аustrian market interest rate and other interest rates* 0,47%
EURIBOR and LIBOR EUR 84,19%LIBOR USD 10,65%LIBOR CHF 2,44%Other variable interest rates 2,73%TOTAL 100,00%
* other interes rates that forms depending on interest rates of Securi es (T-bills) of mostdeveloped countries

74
Ministry of Finance
67%
33%
Public Debt Stock of the Republic Serbia as ofJanuary 31, 2011 Interest rate mix
FIXED INTEREST RATES VARIABLE INTEREST RATES
84%
11%
2% 3%
Floating Interest Rate mix as of January31, 2011
EURIBOR and LIBOR EUR LIBOR USD LIBOR CHF Other variable interest rates
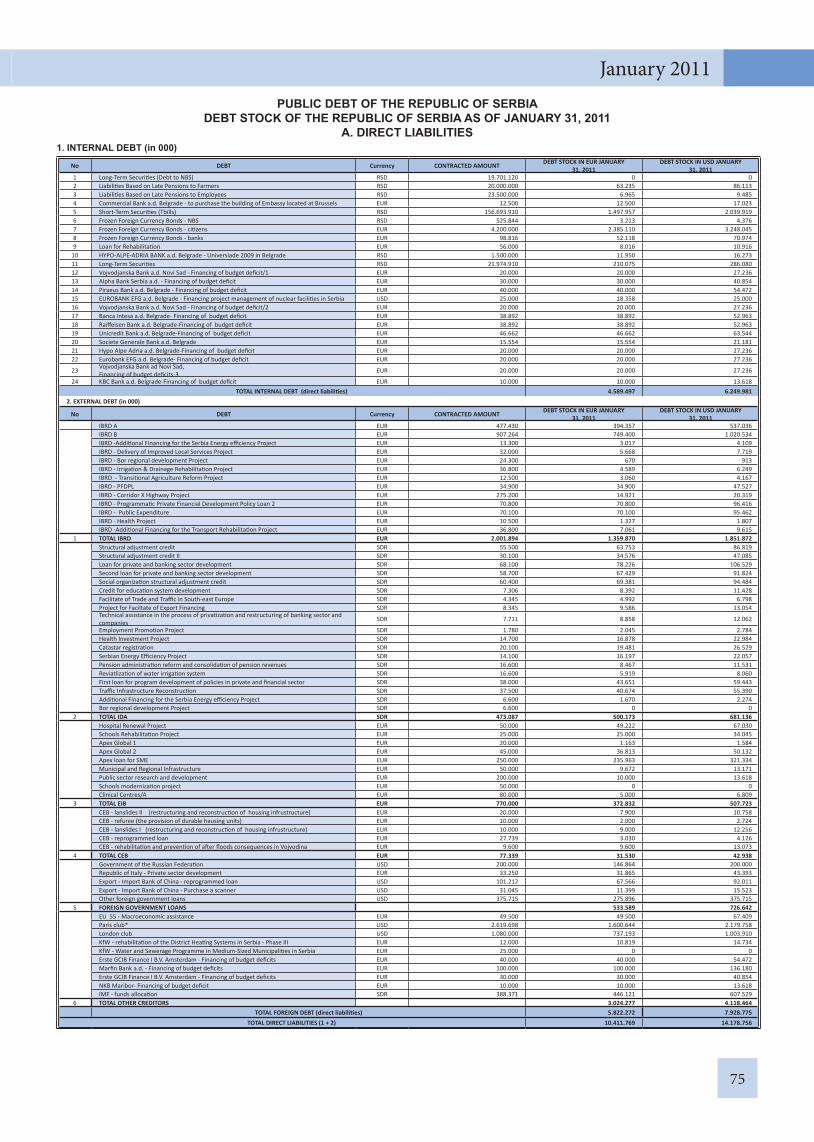
75
January 2011PUBLIC DEBT OF THE REPUBLIC OF SERBIA
DEBT STOCK OF THE REPUBLIC OF SERBIA AS OF JANUARY 31, 2011A. DIRECT LIABILITIES
1. INTERNAL DEBT (in 000)
No DEBT Currency CONTRACTED AMOUNT DEBT STOCK IN EUR JANUARY 31, 2011
DEBT STOCK IN USD JANUARY 31, 2011
1 Long-Term Securi es (Debt to NBS) RSD 19.701.120 0 02 Liabili es Based on Late Pensions to Farmers RSD 20.000.000 63.235 86.1133 Liabili es Based on Late Pensions to Employees RSD 23.500.000 6.965 9.4854 Commercial Bank a.d. Belgrade - to purchase the building of Embassy located at Brussels EUR 12.500 12.500 17.0235 Short-Term Securi es (Tbills) RSD 156.693.910 1.497.957 2.039.9196 Frozen Foreign Currency Bonds - NBS RSD 525.844 3.213 4.3767 Frozen Foreign Currency Bonds - ci zens EUR 4.200.000 2.385.110 3.248.0458 Frozen Foreign Currency Bonds - banks EUR 98.816 52.118 70.9749 Loan for Rehabilita on EUR 56.000 8.016 10.916
10 HYPO-ALPE-ADRIA BANK a.d. Belgrade - Universiade 2009 in Belgrade RSD 1.500.000 11.950 16.27311 Long-Term Securi es RSD 21.974.910 210.075 286.08012 Vojvodjanska Bank a.d. Novi Sad - Financing of budget defi cit/1 EUR 20.000 20.000 27.23613 Alpha Bank Serbia a.d. - Financing of budget defi cit EUR 30.000 30.000 40.85414 Piraeus Bank a.d. Belgrade - Financing of budget defi cit EUR 40.000 40.000 54.47215 EUROBANK EFG a.d. Belgrade - Financing project management of nuclear facili es in Serbia USD 25.000 18.358 25.00016 Vojvodjanska Bank a.d. Novi Sad - Financing of budget defi cit/2 EUR 20.000 20.000 27.23617 Banca Intesa a.d. Belgrade- Financing of budget defi cit EUR 38.892 38.892 52.96318 Raiff eisen Bank a.d. Belgrade-Financing of budget defi cit EUR 38.892 38.892 52.96319 Unicredit Bank a.d. Belgrade-Financing of budget defi cit EUR 46.662 46.662 63.54420 Societe Generale Bank a.d. Belgrade EUR 15.554 15.554 21.18121 Hypo Alpe Adria a.d. Belgrade-Financing of budget defi cit EUR 20.000 20.000 27.23622 Eurobank EFG a.d. Belgrade- Financing of budget defi cit EUR 20.000 20.000 27.236
23 Vojvodjanska Bank ad Novi Sad, Financing of budget defi cits-3 EUR 20.000 20.000 27.236
24 KBC Bank a.d. Belgrade-Financing of budget defi cit EUR 10.000 10.000 13.618TOTAL INTERNAL DEBT (direct liabili es) 4.589.497 6.249.981
2. EXTERNAL DEBT (in 000)
No DEBT Currency CONTRACTED AMOUNT DEBT STOCK IN EUR JANUARY 31, 2011
DEBT STOCK IN USD JANUARY 31, 2011
IBRD A EUR 477.430 394.357 537.036
IBRD B EUR 907.264 749.400 1.020.534IBRD -Addi onal Financing for the Serbia Energy effi ciency Project EUR 13.300 3.017 4.109IBRD - Delivery of Improved Local Services Project EUR 32.000 5.668 7.719IBRD - Bor regional development Project EUR 24.300 670 913IBRD - Irriga on & Drainage Rehabilita on Project EUR 36.800 4.589 6.249IBRD - Transi onal Agriculture Reform Project EUR 12.500 3.060 4.167
IBRD - PFDPL EUR 34.900 34.900 47.527 IBRD - Corridor X Highway Project EUR 275.200 14.921 20.319 IBRD - Programma c Private Financial Development Policy Loan 2 EUR 70.800 70.800 96.416 IBRD - Public Expenditure EUR 70.100 70.100 95.462 IBRD - Health Project EUR 10.500 1.327 1.807 IBRD -Addi onal Financing for the Transport Rehabilita on Project EUR 36.800 7.061 9.6151 TOTAL IBRD EUR 2.001.894 1.359.870 1.851.872 Structural adjustment credit SDR 55.500 63.753 86.819 Structural adjustment credit II SDR 30.100 34.576 47.085 Loan for private and banking sector development SDR 68.100 78.226 106.529 Second loan for private and banking sector development SDR 58.700 67.429 91.824 Social organiza on structural adjustment credit SDR 60.400 69.381 94.484 Credit for educa on system development SDR 7.306 8.392 11.428 Facilitate of Trade and Traffi c in South-east Europe SDR 4.345 4.992 6.798 Project for Faciltate of Export Financing SDR 8.345 9.586 13.054
Technical assistance in the process of priva za on and restructuring of banking sector and companies SDR 7.711 8.858 12.062
Employment Promo on Project SDR 1.780 2.045 2.784 Health Investment Project SDR 14.700 16.878 22.984 Catastar registra on SDR 20.100 19.481 26.529 Serbian Energy Effi ciency Project SDR 14.100 16.197 22.057 Pension administra on reform and consolida on of pension revenues SDR 16.600 8.467 11.531 Reviatliza on of water irriga on system SDR 16.600 5.919 8.060
First loan for program development of policies in private and fi nancial sector SDR 38.000 43.651 59.443Traffi c Infrastructure Reconstruc on SDR 37.500 40.674 55.390
Addi onal Financing for the Serbia Energy effi ciency Project SDR 6.600 1.670 2.274Bor regional development Project SDR 6.600 0 0
2 TOTAL IDA SDR 473.087 500.173 681.136 Hospital Renewal Project EUR 50.000 49.222 67.030 Schools Rehabilita on Project EUR 25.000 25.000 34.045 Apex Global 1 EUR 20.000 1.163 1.584
Apex Global 2 EUR 45.000 36.813 50.132Apex loan for SME EUR 250.000 235.963 321.334Municipal and Regional Infrastructure EUR 50.000 9.672 13.171Public sector research and development EUR 200.000 10.000 13.618Schools moderniza on project EUR 50.000 0 0Clinical Centres/A EUR 80.000 5.000 6.809
3 TOTAL EIB EUR 770.000 372.832 507.723 CEB - lanslides II (restructuring and reconstruc on of housing infrustructure) EUR 20.000 7.900 10.758 CEB - refuгее (the provision of durable hausing units) EUR 10.000 2.000 2.724 CEB - lanslides I (restructuring and reconstruc on of housing infrustructure) EUR 10.000 9.000 12.256 CEB - reprogrammed loan EUR 27.739 3.030 4.126 CEB - rehabilita on and preven on of a er fl oods consequences in Vojvodina EUR 9.600 9.600 13.0734 TOTAL CEB EUR 77.339 31.530 42.938 Government of the Russian Federa on USD 200.000 146.864 200.000 Republic of Italy - Private sector development EUR 33.250 31.865 43.393 Export - Import Bank of China - reprogrammed loan USD 101.212 67.566 92.011 Export - Import Bank of China - Purchase a scanner USD 31.045 11.399 15.523 Other foreign government loans USD 375.715 275.896 375.7155 FOREIGN GOVERNMENT LOANS 533.589 726.642
EU 55 - Macroeconomic assistance EUR 49.500 49.500 67.409Paris club* USD 2.619.698 1.600.644 2.179.758London club USD 1.080.000 737.193 1.003.910KfW - rehabilita on of the District Hea ng Systems in Serbia - Phase III EUR 12.000 10.819 14.734KfW - Water and Sewerage Programme in Medium-Sized Municipali es in Serbia EUR 25.000 0 0Erste GCIB Finance I B.V. Amsterdam - Financing of budget defi cits EUR 40.000 40.000 54.472Marfi n Bank a.d. - Financing of budget defi cits EUR 100.000 100.000 136.180
Erste GCIB Finance I B.V. Amsterdam - Financing of budget defi cits EUR 30.000 30.000 40.854 NKB Maribor- Financing of budget defi cit EUR 10.000 10.000 13.618 IMF - funds alloca on SDR 388.371 446.121 607.5296 TOTAL OTHER CREDITORS 3.024.277 4.118.464
TOTAL FOREIGN DEBT (direct liabili es) 5.822.272 7.928.775TOTAL DIRECT LIABILITIES (1 + 2) 10.411.769 14.178.756

76
Ministry of Finance
No DEBT Currency CONTRACTED AMOUNT DEBT STOCK IN EUR JANUARY 31, 2011
DEBT STOCK IN USD JANUARY 31, 2011
1 Roads Serbia - Liabili es to the UniCredit Bank a.d. Belgrade EUR 75.000 64.290 87.5502 Roads Serbia - Liabili es to the Marfi n Bank a.d. Belgrade EUR 60.000 52.653 71.7033 PE Srbijagas - Liabili es to the Banca Intesa a.d. Belgrade EUR 50.000 50.000 68.0904 PE Srbijagas - Liabili es to the Banca Intesa a.d. Belgrade EUR 120.000 120.000 163.4165 PE JAT Airways - Liabili es to the UniCredit Bank a.d. Belgrade EUR 20.000 20.000 27.2366 PE JAT Airways - Liabili es to the Societe Generale Bank a.d. Belgrade EUR 20.000 20.000 27.2367 PE JAT Airways - Liabili es to the UniCredit Bank a.d. Belgrade EUR 4.750 4.750 6.4698 PE JAT Airways - Liabili es to the Societe Generale Bank a.d. Belgrade EUR 4.750 4.750 6.4699 PE JAT Airways - Liabili es to the UniCredit Bank a.d. Belgrade EUR 1.000 1.000 1.362
10 PE JAT Airways - Liabili es to the Societe Generale Bank a.d. Belgrade EUR 1.000 1.000 1.362
TOTAL INTERNAL DEBT (con ngent liabili es) 338.443 460.892 2. EXTERNAL DEBT (in 000)
No DEBT Currency CONTRACTED AMOUNT DEBT STOCK IN EUR JANUARY 31, 2011
DEBT STOCK IN USD JANUARY 31, 2011
EPS - Urgent Reconstruc on of Electric Energy Sector EUR 39.600 24.885 33.888EMS - Urgent Reconstruc on of Electric Energy Sector EUR 34.150 20.559 27.998Railways Serbia - Reconstruc on of Corridor X EUR 56.988 31.084 42.330Road Serbia - Corridor X EUR 76.000 44.909 61.157EPS - Urgent Reconstruc on of Electric Energy Sector II EUR 60.000 48.495 66.041Nis - Improvement of Water Supply EUR 5.548 2.506 3.413Kragujevac - Improvement of water supply EUR 3.939 1.788 2.435Airtraffi c Control EUR 30.820 12.419 16.913Subo ca - Reconstruc on and moderniza on of municipal water network EUR 9.000 7.328 9.979Road Serbia - Highway Belgrade-Novi Sad and Bridge near Beska EUR 72.000 48.342 65.833Roads Serbia - Belgrade By-pass EUR 80.000 17.361 23.643Railways Serbia - Rolling Stock EUR 60.000 57.443 78.226Railways Serbia - Rolling Stock - Electric Mul ple Units EUR 100.000 1.000 1.362PE Srbijagas - Refi nancing of Short-term Debt, Construc on of an Underground Gas Storage Facility and Maintenance of its Gas Transmission and Distribu on Networks EUR 150.000 50.000 68.090
1 TOTAL EBRD EUR 778.046 368.121 501.307
Railway Serbia - Railways Rehabilita on Project EUR 70.000 57.835 78.760Road Serbia - Reconstruc on of Road Network EUR 95.000 91.803 125.018EMS - Reconstruc on of Electric Energy System EUR 25.272 25.272 34.416Belgrade Center Reconstruc on EUR 90.000 80.100 109.080Road Serbia - Urgent Traffi c Reconstruc on EUR 37.000 28.475 38.778Airport “Nikola Tesla” Urgent Traffi c Reconstruc onа EUR 13.000 11.485 15.640Road Serbia - Consolidated Reprogrammed Loans EUR 49.104 6.059 8.252Railway Serbia - Consolidated Reprogrammed Loans EUR 7.256 895 1.219EPS - Equipment for Electric Energy System EUR 22.000 21.733 29.596Road Serbia - Project Euroroad II EUR 120.000 87.800 119.566Nis - Urgent reconstruc on of water supply system EUR 10.000 0 0Novi Sad - Urgent reconstruc on of water supply system EUR 15.000 0 0Air Naviga on Control EUR 31.280 25.599 34.860Railway Serbia - Railways Rehabilita on II Project EUR 80.000 32.000 43.578Roads Serbia - Gazela Bridge Rehabilita on EUR 33.000 18.000 24.512Roads Serbia -Roads and Bridgeds Rehabilita on B2 EUR 33.000 15.000 20.427Roads Serbia - Belgrade By-pass EUR 60.000 0 0
2 TOTAL EIB 790.912 502.058 683.703
EPS - Reconstruc on of Kolubara Coal-Mine and Termo Power Plant Nikola Tesla EUR 51.129 14.203 19.341EPS - Procurement of equipment for Tamnava EUR 16.000 11.077 15.085ЕPS - Rehabilita on HPP Bajina Basta EUR 30.000 19.550 26.623
EPS - Environmental Measures in Lignite Fired Power Plants EUR 36.000 10.073 13.718 EPS - Revitaliza on HPP Zvornik EUR 70.000 0 03 TOTAL KfW 203.129 54.903 74.766
EPS - Reprogrammed EIB credit EUR 2.483 2.483 3.381Railway Serbia - Reprogrammed EIB credit EUR 35.769 35.769 48.710Road Serbia - Reprogrammed EIB credit EUR 185.545 185.545 252.675
4 TOTAL EU 225 EUR 223.797 223.797 304.766 EUROFIMA 2671 CHF 22.500 17.558 23.910 EUROFIMA 2534 CHF 17.000 13.266 18.065 EUROFIMA 2520 CHF 20.000 15.607 21.253 EUROFIMA 2771 CHF 43.000 6.661 9.071 EUROFIMA 2636 CHF 20.000 15.607 21.253 EUROFIMA 2599 CHF 7.500 5.853 7.970 EUROFIMA 2632 CHF 20.000 15.607 21.253 EUROFIMA 2653 CHF 11.000 8.584 11.689 EUROFIMA 2602 CHF 2.500 1.951 2.657 EUROFIMA 2666 CHF 9.000 7.023 9.5645 TOTAL EUROFIMA CHF 172.500 107.714 146.686 Republic of Poland - EPS - EPS Rehabilita on USD 49.997 25.494 34.718 IDA - 4090 - YF**SE Europe Energy Community Programm - Serbian project (EPS, EMS) SDR 13.900 9.025 12.291 Roads Serbia - Liabili es to the Societe Generale Bank Paris EUR 100.000 83.673 113.9476 TOTAL OTHER CREDITORS 118.193 160.956
TOTAL FOREIGN DEBT (con ngent liabili es) 1.374.785 1.872.184TOTAL CONTINGENT LIABILITIES 1.713.229 2.333.076
TOTAL INTERNAL DEBT (direct and con ngent liabili es) 4.927.940 6.710.874TOTAL EXTERNAL DEBT (direct and con ngent liabili es) 7.197.057 9.800.959
TOTAL A + B 12.124.997 16.511.832
‘Remarks: Data for January 31th 2011 exchange rate list No. 19 issued on date January 31th 2011. *Paris club debt consists of following currencies: EUR, USD, GBP, CHF, JPY, DKK, SEK, NOK ** 1.660.000 SDRs belongs to EMS
B. CONTINGENT LIABILITIES

ECONOMIC, FISCAL AND STATISTICS OF PUBLIC DEBT
IV

1 Economic statistics (tables in Chapter I, Macr-oeconomic Developments) are based primarily on the statistical methodology and data provided by the Statistical Office of the Republic of Serbia, National Bank of Serbia, National Employment Agency, Priva-tization Agency, Belgrade Stock Exchange etc.
Economic Statistics contained in Chapter I includes: main indicators of macroeconomic and fiscal devel-opments in the annual dynamics from 2001 and in monthly dynamics for the current year; gross domes-tic product (GDP) in constant prices and its growth rates by quarters from 2001; trends in physical vol-ume of industrial production in monthly dynamics from 2001; retail price trends – overall, core inflation, regulated prices and prices of agricultural products in annual dynamics from 2001 and in monthly dynam-ics for the current and the previous two years; trends in regulated prices in the current year in monthly dy-namics; an overview of Serbian balance of payments in annual dynamics from 2001 and in monthly dy-namics for the current and the previous year; external debt in annual dynamics from 2001 and in the last month of the current year; export trends in monthly dynamics in the current and the previous two years; foreign direct investments by quarters in the current and the previous two years; monetary overview by years from 2001 and in the last month of the current year for which there are available data; an overview of overall private savings in December of the previ-ous year and in the last month of the current year for which there are data available and increment in savings in the current year relative to December of the previous year; an overview of private foreign ex-change savings by quarters since 2002; an overview of term structure of foreign exchange savings in the last month of the current year for which there are data available compared with December of the previous year; an overview of average net wages and number of persons employed in annual dynamics from 2001 and in monthly dynamics for the current year and the previous two years; trends in average net wages and pensions in the current year; trends in average net wages in the public sector in the current year; annual level of wages and pensions in euros since 2001 up till the last month of the current year for which there are data available; average gross and net wages in republic public enterprises in monthly dynamics for the cur-rent and the previous two years; an overview of priva-tization results in annual dynamics from 2002 and for
a specific period of the current year for which there are data available; an overview of trends of indices and market capitalization of Belgrade Stock Exchange; an overview of turnover of long-term securities on the stock exchange and share of foreign investments in turnover on the stock exchange; Belex Sentiment; an overview of auctions of Republic of Serbia treasury bills; developments in supply, demand and discount rate on auctions of treasury bills; an overview of debt balance related with issuance of treasury bills.
2. Fiscal statistics (tables in Chapter I Fiscal Devel-opments) is based on GFS methodology and data of the Ministry of Finance, Treasury Administration and Public Debt Administration.
Starting from Memorandum on the Budget and Economic and Fiscal Policy for 2009 with projections for 2010 and 2011, IMF methodology – Government Finance Statistics is used to present and create pro-jections for fiscal aggregates. All data in this bulletin have been computed by using the same methodologi-cal basis.
The main objectives of alignment with methodol-ogy of Government Finance Statistics is the possibil-ity to perceive macroeconomic implications of fiscal policy. It is particularly important to perceive the in-fluence of fiscal policy on domestic demand, hence every item of revenues and expenditure is considered from this aspect, regardless of its classification in ac-counting.
Here is a comparative overview of the previous and the new methodology of government finance statis-tics:
1. The level of observation is consolidated govern-ment sector that comprises the following levels of government: the central government – budget of the Republic of Serbia and Social Security Organizations; local government – budget of the Autonomous Prov-ince of Vojvodina and budgets of municipalities and towns; public road company Putevi Srbije. In previ-ous practice, Putevi Srbije road company was covered only for the part that was financed from revenues from excise on oil derivatives.
2. Coverage of data: beside budget resources, appli-cation of this methodology in computation of fiscal aggregates includes other sources of financing – a part of own resources of government bodies, donations, loans and privatization receipts. The previous cover-
ECONOMIC AND FISCAL STATISTICS

age included only budget resources and expenditure financed from budget resources.
3. The method of computation of results: The defi-cit or surplus of consolidated government sector is the difference between revenues and overall expense plus net budget borrowing. The category of net lending is treated as an expense in cases when the purpose of the spending is implementation of a government policy, while if expense is made in order to manage liquid-ity, it becomes a financing item, without any influence on the government’s result. Net lending, regardless of its purpose, used to be treated as part of financing – therefore, without influence on the result.
4. The difference in accounting and statistical cov-erage of particular items of expenditure: in view of the primary objective – gaining insight into macr-oeconomic implications of the fiscal policy, particu-lar items of the expenditure, e.g. repayment of debt to pensioners, which is treated in accounting as a part of repayment of debt – without influence on the result, statistically is treated as transfer to citizens and on that ground influences increase in domestic demand. Mobile telephony license, treated in accounting as current non-tax revenue, in view of its one-time char-acter is now treated as part of financing.
With advancement of accounting base – i.e. with transition to accrual basis in recording government transactions – conditions will be created for further enhancement of government finance statistics meth-odology and for alignment of the methodology with the EU (ESA 95).
The Ministry of Finance is responsible for collection and processing of fiscal statistics data. Fiscal statistics includes: consolidated balance of the general govern-ment sector and particular balances, i.e. budget of the Republic of Serbia (central government), budget of AP Vojvodina, budget of local authorities, financial plans of social security organizations and public road company Putevi Srbije.
General government. General government sector encompasses all levels of government in the country. Subsectors that form the general government include: central government – budget of the Republic of Ser-bia, provincial government – AP Vojvodina, local government – municipalities, towns, social security funds and public road company Putevi Srbije. Fiscal statistics, with regard to the individual state subsec-tors, is especially significant for the understanding of interrelation between different governmental levels, separation of functions as well as division of revenues. It is important to determine the amounts and the flow of transfers between governmental levels, which is
achievable only owing to the individual and separate balances of all governmental levels. However, only the data presenting the entire general government may provide the information concerning the amount of fiscal operations of the state, consumption of the state and its influence on aggregate demand and to-tal macroeconomic stability, reallocation of collected funds originating from other economic sectors, bur-den of taxation of the economy, tax structure etc.
Central government budget of the RoS. Central government comprises all the ministries, agencies, and other special organizations defined as direct or indirect republic budget beneficiaries.1 The Govern-ment may define and achieve set goals concerning economic policy at the level of the entire country, pri-marily through the implementation of certain meas-ures and programmes by the means of the budget of central government. Other governmental levels do not formulate objectives nor manage relevant economic policies concerning the national level. The more cen-tralized the country, the more significant are the data related to this level of governmen.2.
АP Vojvodina. Budget of AP Vojvodina comprises all governmental authorities and other special organi-zations defined as AP Vojvodina budget beneficiar-ies.
Local self-government. Data concerning local self-government relate to the data collected in all cities and municipalities constituting the local self-govern-ment system. The coverage of data at the level of cities or municipalities relate to all direct or indirect budget beneficiaries of a city or a municipality. The budget beneficiary of a city or a municipality is an institution primarily financed from the funds originating from the local government. Local government controls its business activities and it performs certain functions through the institution3. 1 Indirect republic budget benefi ciaries are primary and
secondary schools, faculties, scientifi c institutes, social welfare institutions, cultural institutions and other institutions partly fi nanced from the Republic budget.
2 Th e largest amount of tax revenues, apart from property taxes, pertains to the budget of the RS. Income tax is remitted in the legally defi ned percentage to the local self-government, whereas a part of the revenues collected from income taxes realised in the territory of Vojvodina pertains to the AP Vojvodina. Th is shows the importance of the central governmental level in the country.
3 Primary and secondary schools pertain to the central government as their fi nancing is mostly provided from that level. A part of material expenses of schools is fi nanced from local self-government funds but not in the extent suffi cient for pertaining of these institutions to the local government. Pre-school institutions are local budget benefi ciaries. When reviewing data regarding their revenues and expenditures, they are included in the local government level.

Social security organizations. Social security or-ganizations include the Pension and Disability Insur-ance Fund for the Employed, Republic Health Insur-ance Fund and National Employment Service.
Public road company Putevi Srbije. Revenues of Putevi Srbije have the character of public revenues (toll and a fraction of excise) to a considerable extent, and repayment of a large part of the company’s debt takes place from the Republic of Serbia budget, there-fore the company is treated as a part of the general government sector.
BASIC FISCAL AGGREGATESBasic fiscal aggregates are total public revenues, to-
tal public expenditures, and the result of the differ-ence between these two categories, which is defined as a surplus or deficit in the consolidated balance of general government or balances of individual govern-mental levels.
Total public revenues are divided into two basic categories: current revenues and yield on capital.
Current revenues are divided into tax and non-tax revenues.
The basic characteristics of tax revenues is their mandatory nature and non-existence of any direct reciprocal service for the payment of taxes. The state collects taxes and finances certain state functions from collected funds. The benefits related to certain func-tions cannot be directly connected to an individual who paid the tax.
Income tax comprises wage tax, as well as taxes on oth-er forms of earnings of individuals, beside the wages.
Corporate profit tax comprises, in addition to cor-porate profit tax in the narrow meaning of the term, also tax on dividends paid to the residents and non-residents, as well as the tax on interests, royalties and capital incomes realized by non- residents.
VAT comprises national VAT, import VAT, and the arrears of turnover taxes from the previous years.
Excise duties present consumption taxes concern-ing specific products such as oil, tobacco, coffee, alco-holic beverages etc.
Customs duties and other import duties comprise revenues from duties paid for import of goods and services, with the exception of the VAT on imported goods that is included in VAT revenues.
Other tax revenues comprise taxes on use, own-ership and carrying of goods, and other taxes. The
property tax of local government is included in the category of other tax revenues in the general govern-ment consolidated balance.
Non-tax revenues are heterogenic category of rev-enues including property revenues (collected interest, rental fees) compensations, taxes, fines and other rev-enues that cannot be classified. As opposed to tax rev-enues, non-tax revenues imply the existence of recip-rocal favor for the sum collected – e.g. the compensa-tion for the usage of natural resources. However, there are revenues that may by their characteristics be clas-sified as non-tax revenues, but without implying the reciprocal favor for the collection. Fines are a typical example of this sort of revenue.
Capital revenues comprise only revenues originat-ing from the sale of capital goods, as well as the capi-tal transfers from non-governmental institutions. The sale of capital goods imply the sale of non-financial assets, buildings, inventories and state-owned land.
Total expenditures in the Bulletin of Public Fi-nance are presented according to the economic clas-sification emphasizing the type of expenses, i.e. its economic characteristics and influence of state con-sumption on the market of goods and services, finan-cial market and reallocation of income. In addition to the economic classification of expenditure, there is also a functional classification emphasizing the func-tion the state performs by using the funds for specific purposes.4. The Bulletin of Public Finance does not contain expenditures classified in accordance with the functional classification.
Overall expenditure is divided into current expens-es, capital expenses and net budget borrowing.
Current expenses present final budget outflows, and are not intended for the procurement of non-fi-nancial assets.
Compensation of employees comprise (net) sala-ries of employees including income tax and contribu-tions paid by employees, contributions paid by em-ployers, as well as other fringe benefits (transport al-lowance, sick leave allowance for the period of up to 30 days etc.).
Procurement of goods and services comprise pay-ments related with coverage of business expenses (elec-tricity, phone bills etc.), business trips, services contracts, current maintenance and procurement of material.4 Division of expenditures according to the functional
classifi cation is the following: general public services, defence, internal security, economic aff airs, enviromental protection, housing construction and municipal services, healthcare, recreation, culture and religion, education and social welfare.
Repayment of interests is divided into repayment of interests on domestic debt, interests on external debt, interests based on activated guarantees and ac-companying borrowing expenses.
Subsidies comprise all the funds transferred to the economic sector (public enterprises, registered ag-ricultural holdings etc.) for coverage of running ex-penses or/and the grant intended for current business activities.
Social insurance and social welfare expenses in-clude payments to persons insured with social securi-ty organizations (pensions of beneficiaries of Pension and Disability Insurance Fund, sick leave benefits paid by the Republic Health Insurance Fund, unem-ployment benefits paid by the National Employment Service, repayment of debt to pensioners, children and family benefits, benefits for war-disabled persons, pregnancy leave benefits, housing benefits etc.
Other current expenses include grants to non-gov-ernmental organizations, mandatory levies and pen-alties imposed by one governmental level to another, fines and penalties imposed by courts and judicial bodies, injury compensations or compensations for damages incurred by natural disasters, and damages incurred by the public bodies.
Capital expenses comprise all the payments intend-ed for the procurement of non-financial assets, con-struction of buildings and infrastructure, procure-ment of equipment and inventories and the purchase of land.
Net lending are expenses for purchase of financial assets whose objective is implementation of a particu-lar government policy.
General government consolidated balance con-tains consolidated revenues and consolidated ex-penditure.
Consolidated revenues are aggregate revenues of individual governmental levels, but in the consolida-tion procedure, transfers received from other govern-mental levels are excluded. In the consolidation pro-cedure, benefits paid by general government in the function of employer are excluded from the revenues of mandatory social insurance organizations
Consolidated expenditure present aggregate ex-penditures of individual governmental levels, while in the consolidation procedure, the transfers provided from one governmental level to another are excluded. In the consolidation procedure, expenditures paid by general government in the function of employer are excluded from the expenditures.
Consolidated surplus/ deficit is a difference be-tween consolidated revenues and consolidated ex-penditure.
Balance surplus/ deficit of individual governmen-tal levels is a difference between total revenues and total expenditures, at a particular governmental level.
Earnings not included in the revenues of general government present earnings based on domestic and external borrowing and earnings based on the priva-tization of state-owned enterprises.
Expenses that are not included in general govern-ment expenses are those for repayment of principal of national and foreign debt and expenses for pur-chase of financial assets that cannot be classified as net lending.
3. Public Debt Statistics (Tables in Chapter III – Pub-lic Debt) is based on the data of the Republic of Serbia Treasury Administration. The public debt of the Re-public of Serbia consists of direct liabilities (received loans) and indirect liabilities (issued guarantees).
1. Direct Liabilities Direct Liabilities of the RoS are those incurred on
the basis of the loans taken. Direct liabilities, depend-ing on the creditor, constitute the following: (1) do-mestic debt and (2) foreign debt.
Domestic Debt consists of liabilities carried over from the past, and liabilities stemming from short-term treasury notes. The largest share in the domestic debt is the one of the frozen foreign exchange savings, which also constitutes the largest individual debt in the public debt of the RoS.
Foreign Debt consists of (1) rescheduled old debt and (2) new borrowing.
The rescheduled debt consists of: (1) the debt to-wards International Bank for Reconstruction and De-velopment (IBRD, A, B, C), (2) debt towards the Paris Club of Creditors, (3) debt towards the London Club of Creditors, (4) debt towards Council of Europe De-velopment Bank (CEB).
2. Indirect Liabilities Indirect liabilities of the RoS are those incurred on
the basis of the issued guaranties. Due to the fact that the guarantees that have been issued up to date were related with loans taken from foreign creditors, total indirect liabilities fall under the category of foreign debt.
RATIO BETWEEN THE PUBLIC DEBT AND GROSS DOMESTIC PRODUCT
The ratio between the public debt and gross domes-tic product, as the most important indicator of the public debt sustainability and one of the convergence criteria for joining the EMU, has been decreasing constantly in the last five years.
In 2004, the ratio between the public debt and GDP fell down to 60%, and went below 35% in 2006.
STRUCTURE OF INTEREST RATESThe ratio between the fixed and variable interest
rates in the public debt of Serbia is distinctly favo-rable. High share of the fixed interest rates provides high level of predictability of future liabilities arising from the interest and thus the Republic of Serbia is not exposed to a high interest rate risk.
CURRENCY STRUCTURE OF THE PUBLIC DEBT
The public debt consists of different currencies. The largest share, however, is the debt denominated in Eu-ros and US Dollars


![Seminarski [Engleski]](https://static.fdocuments.in/doc/165x107/55cf8553550346484b8cc746/seminarski-engleski-55d299b781fd5.jpg)