BMC Neurology - Infomed Normative data.pdf · de la Memoria y Desórdenes Relacionados,Universidad...
26
This Provisional PDF corresponds to the article as it appeared upon acceptance. Fully formatted PDF and full text (HTML) versions will be made available soon. Population normative data for the 10/66 Dementia Research Group cognitive test battery from Latin America, India and China: a cross-sectional survey BMC Neurology 2009, 9:48 doi:10.1186/1471-2377-9-48 Ana LUISA Sosa ([email protected]) Emiliano Albanese ([email protected]) Martin Prince ([email protected]) Daisy Acosta ([email protected]) Cleusa P Ferri ([email protected]) Mariella Guerra ([email protected]) Yueqin Huang ([email protected]) K S Jacob ([email protected]) Juan Llibre de Rodriguez ([email protected]) Aquiles Salas ([email protected]) Fang Yang ([email protected]) Ciro Gaona ([email protected]) A T Joteeshwaran ([email protected]) Guillermina Rodriguez ([email protected]) Gabriela Rojas de la Torre ([email protected]) Joseph D Williams ([email protected]) Robert Stewart ([email protected]) ISSN 1471-2377 Article type Research article Submission date 16 February 2009 Acceptance date 26 August 2009 Publication date 26 August 2009 Article URL http://www.biomedcentral.com/1471-2377/9/48 Like all articles in BMC journals, this peer-reviewed article was published immediately upon acceptance. It can be downloaded, printed and distributed freely for any purposes (see copyright notice below). Articles in BMC journals are listed in PubMed and archived at PubMed Central. BMC Neurology © 2009 Sosa et al. , licensee BioMed Central Ltd. This is an open access article distributed under the terms of the Creative Commons Attribution License ( http://creativecommons.org/licenses/by/2.0), which permits unrestricted use, distribution, and reproduction in any medium, provided the original work is properly cited.
Transcript of BMC Neurology - Infomed Normative data.pdf · de la Memoria y Desórdenes Relacionados,Universidad...

This Provisional PDF corresponds to the article as it appeared upon acceptance. Fully formattedPDF and full text (HTML) versions will be made available soon.
Population normative data for the 10/66 Dementia Research Group cognitive testbattery from Latin America, India and China: a cross-sectional survey
BMC Neurology 2009, 9:48 doi:10.1186/1471-2377-9-48
Ana LUISA Sosa ([email protected])Emiliano Albanese ([email protected])
Martin Prince ([email protected])Daisy Acosta ([email protected])Cleusa P Ferri ([email protected])
Mariella Guerra ([email protected])Yueqin Huang ([email protected])
K S Jacob ([email protected])Juan Llibre de Rodriguez ([email protected])
Aquiles Salas ([email protected])Fang Yang ([email protected])Ciro Gaona ([email protected])
A T Joteeshwaran ([email protected])Guillermina Rodriguez ([email protected])
Gabriela Rojas de la Torre ([email protected])Joseph D Williams ([email protected])
Robert Stewart ([email protected])
ISSN 1471-2377
Article type Research article
Submission date 16 February 2009
Acceptance date 26 August 2009
Publication date 26 August 2009
Article URL http://www.biomedcentral.com/1471-2377/9/48
Like all articles in BMC journals, this peer-reviewed article was published immediately uponacceptance. It can be downloaded, printed and distributed freely for any purposes (see copyright
notice below).
Articles in BMC journals are listed in PubMed and archived at PubMed Central.
BMC Neurology
© 2009 Sosa et al. , licensee BioMed Central Ltd.This is an open access article distributed under the terms of the Creative Commons Attribution License (http://creativecommons.org/licenses/by/2.0),
which permits unrestricted use, distribution, and reproduction in any medium, provided the original work is properly cited.

For information about publishing your research in BMC journals or any BioMed Central journal, go to
http://www.biomedcentral.com/info/authors/
BMC Neurology
© 2009 Sosa et al. , licensee BioMed Central Ltd.This is an open access article distributed under the terms of the Creative Commons Attribution License (http://creativecommons.org/licenses/by/2.0),
which permits unrestricted use, distribution, and reproduction in any medium, provided the original work is properly cited.

1
Population normative data for the 10/66 Dementia Research Group cognitive test battery
from Latin America, India and China: a cross-sectional survey
Ana Luisa Sosa1; Emiliano Albanese
2; Martin Prince
2 ; Daisy Acosta
3; Cleusa P Ferri
2 ; Mariella
Guerra4; Yueqin Huang
5; KS Jacob
6; Juan Llibre de Rodriguez
7; Aquiles Salas
8 ; Fang Yang
5; Ciro
Gaona 9; AT Joteeshwaran
10; Guillermina Rodriguez
11; Gabriela Rojas de la Torre
1; Joseph D
Williams10
; Robert Stewart2
1National Institute of Neurology and Neurosurgery of Mexico, Mexico City, Mexico.
2King’s College London (Institute of Psychiatry), London, United Kingdom.
3Universidad Nacional Pedro Henriquez Ureña (UNPHU), Santo Domingo, Dominican Republic.
4Instituto
de la Memoria y Desórdenes Relacionados, Universidad Peruana Cayetano Heredia,. Lima, Peru
5Institute of Mental Health, Peking University, Beijing, China.
6Christian Medical College, Vellore, India.
7Facultad de Medicina Finley-Albarran, Medical University of Havana, Cuba.
8Caracas University Hospital Faculty of Medicine, Universidad Central de Venezuela, Caracas, Venezuela.
9Clínica Loira, Caracas, Venezuela.
10Community Health Services, VHS, Chennai, India.
11Dirección General de Salud Publica Ministerio de Protección Social (6th district), Santo Domingo,
Dominican Republic.
Correspondence to: Dr Robert Stewart, Section of Epidemiology (Box 60), Institute of Psychiatry
(King’s College London), De Crespigny Park, London SE5 8AF, United Kingdom. Phone: +44
(0)20 7848 0136; Fax: +44 (0)20 7848 5450; email: [email protected]
JLDR [email protected]
GRDLT [email protected]

2
Abstract
Background: 1) To report site-specific normative values by age, sex and educational level for four
components of the 10/66 Dementia Research Group cognitive test battery; 2) to estimate the main
and interactive effects of age, sex, and educational level by site; and 3) to investigate the effect of
site by region and by rural or urban location.
Methods: Population-based cross-sectional one phase catchment area surveys were conducted in
Cuba, Dominican Republic, Venezuela, Peru, Mexico, China and India. The protocol included the
administration of the Community Screening Instrument for Dementia (CSI ‘D’, generating the
COGSCORE measure of global function), and the Consortium to Establish a Registry for
Alzheimer’s Disease (CERAD) verbal fluency (VF), word list memory (WLM, immediate recall)
and recall (WLR, delayed recall) tests. Only those free of dementia were included in the analysis.
Results: Older people, and those with less education performed worse on all four tests. The effect
of sex was much smaller and less consistent. There was a considerable effect of site after
accounting for compositional differences in age, education and sex. Much of this was accounted for
by the effect of region with Chinese participants performing better, and Indian participants worse,
than those from Latin America. The effect of region was more prominent for VF and WLM than for
COGSCORE and WLR.
Conclusions: Cognitive assessment is a basic element for dementia diagnosis. Age- and education-
specific norms are required for this purpose, while the effect of gender can probably be ignored.
The basis of cultural effects is poorly understood, but our findings serve to emphasise that
normative data may not be safely generalised from one population to another with quite different
characteristics. The minimal effects of region on COGSCORE and WLR are reassuring with respect
to the cross-cultural validity of the 10/66 dementia diagnosis, which uses only these elements of the
10/66 battery.

3
Background
Rapid demographic ageing around the world has important implications for health and social care.
Cognitive decline and dementia have a high individual impact and are strongly age-associated [1],
so that their overall prevalence and societal impact is increasing rapidly. A recent consensus report
estimated that the number of people with dementia in the world will increase from 24 million to 82
million from 2000 to 2040 [2]. This increase will be particularly marked in low and middle income
countries where epidemiological research into the aetiology and impact of dementia and cognitive
decline is limited. The 10/66 Dementia Research Programme was set up to facilitate research in
these regions and to provide data that can be used for public health and service planning [1].
Cognitive tests covering multiple domains are an essential component of a definitive dementia
diagnostic assessment: for the purposes of establishing the criterion of decline in at least two
domains of cognitive function, including memory [3]. Normative data are urgently required, given
the influence of both education and culture on cognitive test performance [4, 5].
The data presented in this paper were drawn from the 10/66 Dementia Research Group’s cross-
sectional surveys of older people carried out in seven urban and four rural sites in five Latin
American countries, China and India. The primary objective was to generate site-specific norms for
the cognitive test battery used in the 10/66 studies comprising tests of general cognitive function,
verbal fluency and immediate and delayed verbal recall. Further objectives were: a) to assess the
independent influences of age, educational level and gender and their homogeneity across sites, and
b) to assess the extent to which variance attributable to site could be attributed to the effects of
region and/or rural versus urban residence.

4
Method
Study design
The design of the 10/66 Dementia Research Group (DRG) baseline population-based studies has
been described in detail [6]. Briefly, cross-sectional surveys were carried out, approaching all
residents aged 65 and over within purposively selected geographically-defined catchment areas at
each site. No over-sampling strategy was applied (e.g. with respect to age groups). Affluent districts
were intentionally avoided. A target sample of 2000 persons aged 65 years and over, per country
(3,000 in Cuba) was identified by means of door knocking the catchment areas. Peru, Mexico,
China and India recruited both from rural and urban sites. Interviews followed a comprehensive
one-phase design where all participants received a full assessment including: cognitive and mental
health evaluation, an informant interview, a physical and neurological examination, blood assays
and genotyping, in addition to questionnaire measures of environmental and behavioural risk
exposures, sociodemographic and socioeconomic status, and physical health status. Disability,
health service utilisation, care arrangements and impact of providing care were also evaluated.
Measurements
For this analysis we considered the following socio-demographic measures as independent
variables: participants’ age divided into four groups (65-69 years, 70-74 years, 75-79 years, 80
years and over), sex, and education level divided into five groups (none, some (but did not complete
primary), completed primary, completed secondary, and tertiary). Age of participants was formally
established during interview from stated age, official documentation, informant report and, in the
case of discrepancy, age according to an event calendar.
The 10/66 cognitive assessment battery was drawn principally from the Community Screening
Instrument for Dementia (CSI ‘D’) developed by the Ibadan-Indianapolis study group [7]

5
specifically for use in cross-cultural research, and in low education settings, and from the
Consortium to Establish a Registry for Alzheimer's Disease (CERAD) [8]. As such, components of
the battery have been very widely used in other population and clinical research. In our large multi-
site pilot study [9] we developed and validated a culture- and education-fair algorithm for dementia
diagnosis across a wide variety of low and middle income country settings, comprising components
of the cognitive test battery in combination with the Geriatric Mental State and the informant
section of the CSI ‘D’
The analysis described here focussed on the four main tests included in the 10/66 cognitive test
battery:
1) Global cognitive function: The Community Screening Instrument for Dementia (CSI ‘D’)
[7] includes a 32 item cognitive test assessing orientation, comprehension, memory, naming
and language expression, which is used to generate a global cognitive score (COGSCORE).
The CSI ‘D’ was from the outset intended to be used across cultures with the minimum of
necessary adaptation. It was developed and first validated among Cree American Indians [7,
10], further validated and used in population-based research (The US-Nigeria Study) among
Nigerians in Ibadan and African-Americans in Indianapolis [11], and has also been validated
among white Canadians in Winnipeg [12], and in Jamaica in conjunction with the CERAD
battery [13]. The CSI ‘D’ test score distributions among those with dementia and controls,
and the degree of discrimination provided were remarkably consistent across the
aforementioned cultural settings [12].
2) Memory: The 10/66 battery includes two elements of the CERAD 10 word list learning test:
world list memory (WLM) and word list recall (WLR), testing immediate and delayed recall
respectively. WLR has been reported to be of particular value in distinguishing early
dementia from normal aging [14]. WLM and WLR are taken from the adapted CERAD ten
word list learning task used in the Indo-US Ballabgarh dementia study [15]. Six words;

6
butter, arm, letter, queen, ticket, and grass; were taken from the original CERAD battery
English language list [16]. Pole, shore, cabin, and engine were replaced with corner, stone,
book and stick, which were deemed more cross-culturally applicable. In the learning phase,
the list is read out to the participant from a green card, who is then asked to recall straight
away the words that they remember. This process is repeated three times, giving a WLM
score out of 30. In the 10/66 protocol, approximately five minutes later, after a series of
unrelated CSI ‘D’ questions (name registration, object naming, object function, repetition)
the participant is again asked to recall the 10 words with prompting that they were read from
a green card, giving a WLR score out of 10.
3) Verbal fluency (VF): the animal naming verbal fluency task [7] from the CERAD is
administered as part of the CSI ‘D’, however it is accorded very little weight within the
algorithm for calculating the total CSI ‘D’ score. In the version of the test used in CSI ‘D’,
after a brief practice naming items from another category (clothing), participants are
encouraged to name as many different animals as they can in the space of one minute. The
instructions read out to the participant stipulate: ‘think of any kinds of animal in the air, on
land, in the water, in the forest, all the different animals’. If the participant stops before the
allotted time has elapsed they are encouraged to continue. The score is one point for each
valid name. In the computation of the CSI ‘D’ cognitive test (COGSCORE) the VF score is
divided by 23. These weighted scores generally range between 0 and 1, the same as for a
single CSI ‘D’ orientation item.
The CERAD neuropsychological battery has been adapted for use in India [15], Korea [17], Brazil
[18], Nigeria [16] and Jamaica [13], and norms have been provided for black and white persons in
the USA, both with dementia [19], and among the general population [20]. While education effects
are prominent, cultural or ethnic differences have been less evident [13, 17]. CERAD battery

7
components have been found to distinguish reliably between those with dementia and controls
across cultures [13, 15].
Ethical considerations
The study was carried out in compliance with the Helsinki Declaration and all participants provided
informed consent. The study was considered and approved by the appropriate Research Ethics
Committee at King’s College London (Institute of Psychiatry and South London & Maudsley NHS
Trust (references 076/03 and 209/01) after approvals at all participating sites (Ministerio de Salud
Pública in Cuba, Bioethics National Committee for Research in Dominican Republic, Instituto de la
Memoria in Peru, Medical Ethics Committee of Peking University the Sixth Hospital in China,
Institutional Review Board of Christian Medical College in Vellore, Institutional Review Board of
Voluntary Health Services in Chennai, Instituto Nacional de Neurologia y Neurocirugia in Mexico,
Universidad Central de Venezuela).
Statistical analysis
For this analysis, all participants who had received a diagnosis of dementia according to either
DSM-IV [3] or 10/66 dementia criteria were excluded [9]. Participants’ age, sex and education data
were described by site. Means and standard deviations (SD) for each of the four cognitive tests were
calculated by age, sex and education for each of the eleven sites. General linear models were used
to determine the unadjusted and independent effects of age, sex and education on cognitive test
scores across sites. We then tested formally for effect modification by extending the models used to
estimate the main effects of age, education and sex to include site by age, site by education and site
by sex interaction terms. Finally, we estimated the proportion of the variance (eta2) in each
cognitive test accounted for by age, education, gender and site. We further sought to investigate the
variance accounted for by site by substituting this variable with two further variables sub-
classifying sites into region (Latin America versus (a) China, and (b) India) and rural or urban

8
location. The effect of region (controlling for age, education, gender and rural/ urban location) is
summarised as adjusted means and mean differences with 95% confidence intervals for the two
contrasts: China versus Latin America and India versus Latin America. All analyses were carried
out using STATA 9.2 (StataCorp. 2007. Stata Statistical Software: Release 10. College Station, TX:
StataCorp LP) on release 1_5 of the 10/66 baseline dataset.

9
Results.
Response rates for the sites were as follows: Cuba 94%, Dominican Republic 95%, urban Peru
80%, rural Peru 88%, Venezuela 80%, urban Mexico 84%, rural Mexico 86%, urban China 74%,
rural China 96%, urban India 72%, rural India 98%. In all, 14,967 participants were fully evaluated
of whom 1318 met criteria for dementia [21] and were excluded from further analysis, leaving a
total of 13,649 participants, free of dementia (Table 1).
All age groups were well represented. The Venezuelan, rural Chinese and Indian samples had a
younger age distribution than other sites. The female/ male ratio exceeded 1 in all sites, but with a
less striking preponderance of women in rural Peru, China and India. Educational level showed
considerable variation across sites, highest in urban Latin America sites (other than the Dominican
Republic), and lowest in rural China and in India. Within countries, educational levels were
consistently higher in urban compared with rural sites.
Tables 2, 3, 4 and 5 present normative data: stratified means and standard deviations for the four
cognitive outcomes. Older age and lower levels of education were consistently associated with
poorer cognitive test performance on scores for all four tests, across all sites. The effect of sex on
cognitive test performance was smaller and more variable, both between tests and between sites.
Men tended to perform marginally better than women on the COGSCORE, and on VF. For WLM
and WLR, women performed better than men in Latin American sites, but there was no gender
difference in China and India.
Tests for interaction indicated that the effects of age, sex and education on cognitive test
performance were each significantly modified by site for all four cognitive tests. However, the
effects were uniformly very modest in size, generally accounting for between 0.1% and 0.3% of the

10
overall variance. The two largest interaction effects were those for verbal fluency between site and
age (0.6% of the variance), and site and education (0.5%).
Table 6 summarises the independent effects of age, sex, education and site on cognitive test
performance. Site accounted for the highest proportion of variance for all four scores followed by
education and then age, except for WLR where the effect of age was stronger than education. The
contribution of sex to the models was uniformly low. Most of the effect of site could be more
parsimoniously accounted for by region (Latin America versus (a) China, and (b) India) and, to a
lesser extent, rural versus urban location (with marginally poorer performance on WLM and WLR
in rural compared with urban settings). Controlling for age, education, sex and rural/urban location,
performance on all cognitive tests was best among Chinese participants, intermediate among Latin
American participants, and worst among Indian participants. Chinese participants scored one point
more and Indian participants one and a half points less on the COGSCORE than did participants in
Latin American sites. Indian participants generated nearly six fewer animals on verbal fluency than
did participants in China and Latin America. Compared with Latin American participants, Chinese
participants remembered on average nearly three more words out of 30 on WLM and one more
word out of 10 on delayed WLR. Indian participants, on the other hand, recalled on average two and
a half words fewer on WLM and half a word fewer on WLR.

11
Discussion
We have provided normative data by age group, sex and educational level for widely used
neuropsychological tests of global cognitive function, verbal fluency and immediate and delayed
word recall in seven low or middle income countries. People with any degrees of dementia,
including questionable dementia, were excluded. These norms have been rigorously generated
applying a standardized testing procedure amongst representative community-dwelling samples. To
our knowledge this is the largest study to date on neuropsychological tests norms and the first to
present direct comparisons between so many culturally diverse countries.
With the exception of rural India, our norms for CERAD WLM and WLR are well aligned with
those previously reported from affluent western countries. [4, 22, 23, 24]. Our norms for CERAD
VF are comparable to previously determined norms from both Europe and North America countries
[22, 23, 25, 26] and from Latin America [27, 28, 29]. We found that older age and lower
educational level corresponded to poorer performances in all four tests and across all sites. The
influences of age and educational level on test performances were large, and consistent in size and
direction with other normative data investigations from western countries [23]. Sex had a much
weaker influence and can probably be safely ignored when constructing reference norms. Likewise,
while the site by age, education and sex interactions were statistically significant for all cognitive
tests, these were very modest effects, and the beta coefficients (Tables 2, 3, 4 and 5) are remarkable
mainly for their consistency across sites.
There was a considerable residual effect of site upon cognitive test performance, not accounted for
by compositional differences between samples in the distribution of age and education. Further
analyses clarified that the between-site difference was most parsimoniously accounted for by the
effect of region, with smaller effects of rural versus urban location evident for the two memory

12
tests. We should still be cautious about attributing the effect of region to that of language and
culture. First, other compositional differences not directly linked to culture per se, but relevant to
cognitive performance and differently distributed across sites, may not have not been taken into
consideration in our analyses. One such effect may be the quality and nature of education received
that may not be adequately summarised in terms of level of education [30]. Second, while we have
included a wide variety of Latin American and Hispanic Caribbean countries and shown fairly
consistent norms between them, the norms derived from the Tamil speaking Indians in Tamil Nadu,
and the Mandarin-speaking Chinese in and around Beijing clearly cannot be generalised to the vast
and diverse populations of India and China as a whole.
By design, the two cognitive tests included in the 10/66 dementia diagnosis, the CSI ‘D’
COGSCORE and the CERAD WLR, were those that showed the smallest cultural influences and
the most robust cross-cultural discriminating properties [9]. This finding has now been, in part,
replicated in the population-based phase of our study and is reassuring with respect to the cross-
cultural validity of that diagnosis. However, in the light of the findings with respect to other tests, it
may be necessary in the future to use region-specific norms for the identification of impairment in
immediate recall or verbal fluency for the identification of those meeting cognitive impairment
criteria (1.5 standard deviations below the age- and education-specific norms for those with no
dementia) for DSM-IV dementia [31], and amnestic and non-amnestic mild cognitive impairment.
The general effect of such a change would be to lower still further the already negligible prevalence
of DSM-IV dementia in Indian sites, and to increase slightly the prevalence of DSM-IV dementia in
Chinese sites.
Conclusions
Cognitive assessment is a basic element for dementia diagnosis. Age- and education-specific norms
are required for this purpose, while the effect of gender can probably be ignored. The basis of

13
cultural effects is poorly understood, but our findings serve to emphasise that normative data may
not be safely generalised from one population to another with quite different characteristics. The
minimal effects of region on COGSCORE and WLR are reassuring with respect to the cross-
cultural validity of the 10/66 dementia diagnosis, which uses only these elements of the 10/66
battery.
Competing interests
The 10/66 Dementia Research Group works closely with Alzheimer's Disease International (ADI),
the non-profit federation of 77 Alzheimer associations around the world. ADI is committed to
strengthening Alzheimer associations worldwide, raising awareness regarding dementia and
Alzheimer's Disease and advocating for more and better services for people with dementia and their
caregivers. ADI is supported in part by grants from GlaxoSmithKline, Novartis, Lundbeck, Pfizer
and Eisai.
Authors’ contributions
All of the authors worked collectively to develop the protocols and methods described in this paper.
MP led the research group and CF acted as research coordinator. JLR (Cuba), DA (Dominican
Republic), MG (Peru), AS (Venezuela), ALS (Mexico), KSJ (Vellore, India), JDW (Chennai, India)
and YH (China) were principal investigators responsible for the field work in their respective
countries. ALS, EA and RS prepared the first draft and carried out the analyses of this manuscript.
MP carried out a final revision for the first submission and RS revised the second submission in
response to reviewers’ comments. Other authors reviewed the manuscript, provided additional
comments and contributions. All authors read and approved the final version of the manuscript.
Acknowledgements
The 10/66 Dementia Research Group’s research has been funded by the Wellcome Trust Health
Consequences of Population Change Programme (GR066133 – Prevalence phase in Cuba and

14
Brazil; GR08002- Incidence phase in Peru, Mexico, Argentina, Cuba, Dominican Republic,
Venezuela and China), the World Health Organisation (India, Dominican Republic and China), the
US Alzheimer’s Association (IIRG – 04 – 1286 - Peru, Mexico and Argentina), and FONACIT/
CDCH/ UCV (Venezuela). The Rockefeller Foundation supported our dissemination meeting at
their Bellagio Centre. Alzheimer’s Disease International has provided support for networking and
infrastructure.
� �
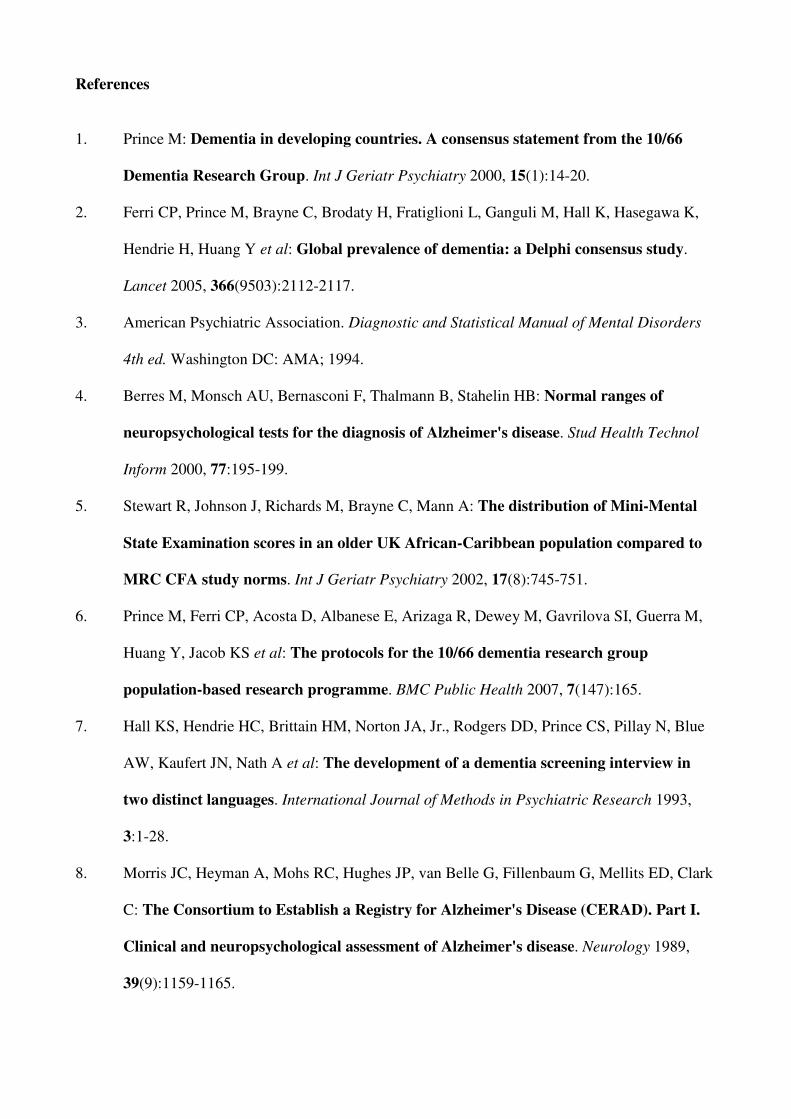
References
1. Prince M: Dementia in developing countries. A consensus statement from the 10/66
Dementia Research Group. Int J Geriatr Psychiatry 2000, 15(1):14-20.
2. Ferri CP, Prince M, Brayne C, Brodaty H, Fratiglioni L, Ganguli M, Hall K, Hasegawa K,
Hendrie H, Huang Y et al: Global prevalence of dementia: a Delphi consensus study.
Lancet 2005, 366(9503):2112-2117.
3. American Psychiatric Association. Diagnostic and Statistical Manual of Mental Disorders
4th ed. Washington DC: AMA; 1994.
4. Berres M, Monsch AU, Bernasconi F, Thalmann B, Stahelin HB: Normal ranges of
neuropsychological tests for the diagnosis of Alzheimer's disease. Stud Health Technol
Inform 2000, 77:195-199.
5. Stewart R, Johnson J, Richards M, Brayne C, Mann A: The distribution of Mini-Mental
State Examination scores in an older UK African-Caribbean population compared to
MRC CFA study norms. Int J Geriatr Psychiatry 2002, 17(8):745-751.
6. Prince M, Ferri CP, Acosta D, Albanese E, Arizaga R, Dewey M, Gavrilova SI, Guerra M,
Huang Y, Jacob KS et al: The protocols for the 10/66 dementia research group
population-based research programme. BMC Public Health 2007, 7(147):165.
7. Hall KS, Hendrie HC, Brittain HM, Norton JA, Jr., Rodgers DD, Prince CS, Pillay N, Blue
AW, Kaufert JN, Nath A et al: The development of a dementia screening interview in
two distinct languages. International Journal of Methods in Psychiatric Research 1993,
3:1-28.
8. Morris JC, Heyman A, Mohs RC, Hughes JP, van Belle G, Fillenbaum G, Mellits ED, Clark
C: The Consortium to Establish a Registry for Alzheimer's Disease (CERAD). Part I.
Clinical and neuropsychological assessment of Alzheimer's disease. Neurology 1989,
39(9):1159-1165.
� �
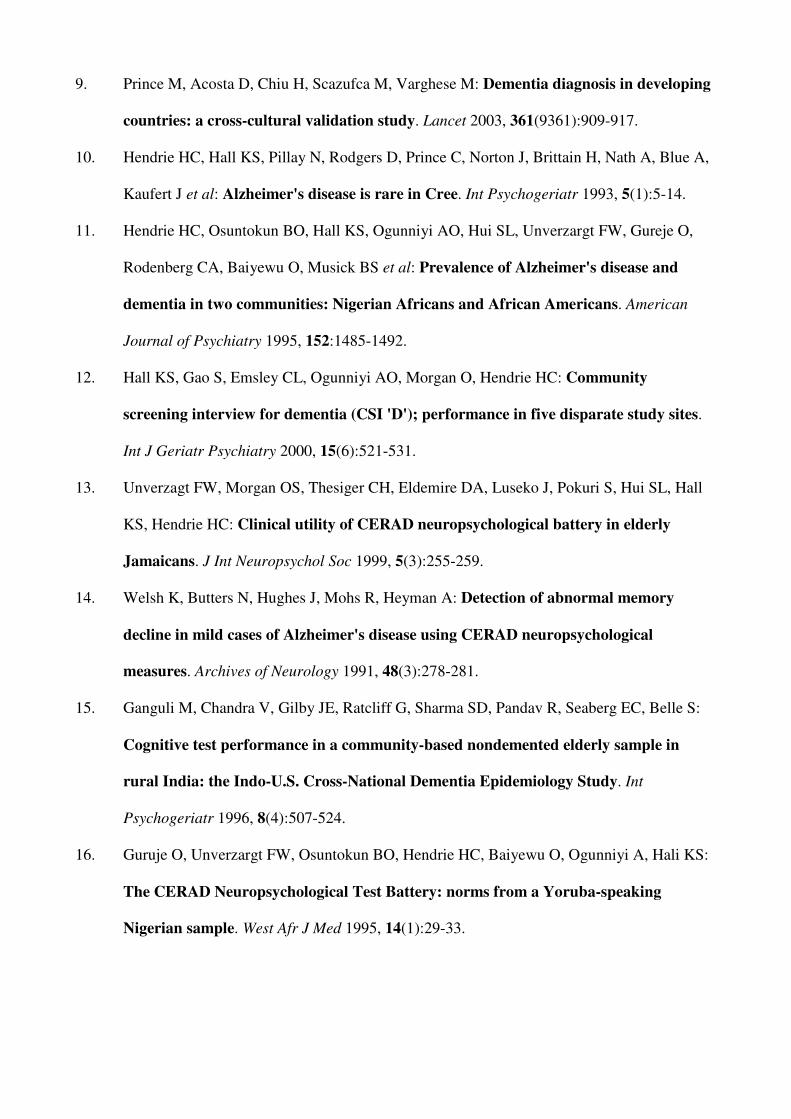
9. Prince M, Acosta D, Chiu H, Scazufca M, Varghese M: Dementia diagnosis in developing
countries: a cross-cultural validation study. Lancet 2003, 361(9361):909-917.
10. Hendrie HC, Hall KS, Pillay N, Rodgers D, Prince C, Norton J, Brittain H, Nath A, Blue A,
Kaufert J et al: Alzheimer's disease is rare in Cree. Int Psychogeriatr 1993, 5(1):5-14.
11. Hendrie HC, Osuntokun BO, Hall KS, Ogunniyi AO, Hui SL, Unverzargt FW, Gureje O,
Rodenberg CA, Baiyewu O, Musick BS et al: Prevalence of Alzheimer's disease and
dementia in two communities: Nigerian Africans and African Americans. American
Journal of Psychiatry 1995, 152:1485-1492.
12. Hall KS, Gao S, Emsley CL, Ogunniyi AO, Morgan O, Hendrie HC: Community
screening interview for dementia (CSI 'D'); performance in five disparate study sites.
Int J Geriatr Psychiatry 2000, 15(6):521-531.
13. Unverzagt FW, Morgan OS, Thesiger CH, Eldemire DA, Luseko J, Pokuri S, Hui SL, Hall
KS, Hendrie HC: Clinical utility of CERAD neuropsychological battery in elderly
Jamaicans. J Int Neuropsychol Soc 1999, 5(3):255-259.
14. Welsh K, Butters N, Hughes J, Mohs R, Heyman A: Detection of abnormal memory
decline in mild cases of Alzheimer's disease using CERAD neuropsychological
measures. Archives of Neurology 1991, 48(3):278-281.
15. Ganguli M, Chandra V, Gilby JE, Ratcliff G, Sharma SD, Pandav R, Seaberg EC, Belle S:
Cognitive test performance in a community-based nondemented elderly sample in
rural India: the Indo-U.S. Cross-National Dementia Epidemiology Study. Int
Psychogeriatr 1996, 8(4):507-524.
16. Guruje O, Unverzargt FW, Osuntokun BO, Hendrie HC, Baiyewu O, Ogunniyi A, Hali KS:
The CERAD Neuropsychological Test Battery: norms from a Yoruba-speaking
Nigerian sample. West Afr J Med 1995, 14(1):29-33.

� �
17. Lee DY, Lee KU, Lee JH, Kim KW, Jhoo JH, Kim SY, Yoon JC, Woo SI, Ha J, Woo JI: A
normative study of the CERAD neuropsychological assessment battery in the Korean
elderly. J Int Neuropsychol Soc 2004, 10(1):72-81.
18. Bertolucci PH, Okamoto IH, Brucki SM, Siviero MO, Toniolo Neto J, Ramos LR:
Applicability of the CERAD neuropsychological battery to Brazilian elderly. Arq
Neuropsiquiatr 2001, 59(3-A):532-536.
19. Welsh KA, Fillenbaum G, Wilkinson W, Heyman A, Mohs RC, Stern Y, Harrell L, Edland
S, Beekly D: Neuropsychological test performance in African-American and white
patients with Alzheimer's disease. Neurology 1995, 45:2207-2211.
20. Fillenbaum G, Heyman A, Huber MS, Ganguli M, Unverzagt FW: Performance of elderly
African American and White community residents on the CERAD Neuropsychological
Battery. Journal of the International Neuropsychological Society 2001(7):502-509.
21. Llibre-Rodriguez JJ, Ferri CP, Acosta D, Guerra M, Huang Y, Jacob KS, Krishnamoorthy
ES, Salas A, Sosa AL, Acosta I et al: Prevalence of dementia in Latin America, India,
and China: a population-based cross-sectional survey. Lancet 2008, 372(9637):464-474.
22. Welsh KA, Butters N, Mohs RC, Beekly D, Edland S, Fillenbaum G, Heyman A: The
Consortium to Establish a Registry for Alzheimer's Disease (CERAD). Part V. A
normative study of the neuropsychological battery. Neurology 1994, 44(4):609-614.
23. Stewart R, Richards M, Brayne C, Mann A: Cognitive function in UK community-
dwelling African Caribbean elders: normative data for a test battery. Int J Geriatr
Psychiatry 2001, 16(5):518-527.
24. Collie A, Shafiq-Antonacci R, Maruff P, Tyler P, Currie J: Norms and the effects of
demographic variables on a neuropsychological battery for use in healthy ageing
Australian populations. Aust N Z J Psychiatry 1999, 33(4):568-575.

� �
25. Tombaugh TN, Kozak J, Rees L: Normative data stratified by age and education for two
measures of verbal fluency: FAS and animal naming. Arch Clin Neuropsychol 1999,
14(2):167-177.
26. Tallberg IM, Ivachova E, Jones Tinghag K, Ostberg P: Swedish norms for word fluency
tests: FAS, animals and verbs. Scand J Psychol 2008, 49(5): 479-85.
27. del Ser Quijano T, Garcia de Yebenes MJ, Sanchez Sanchez F, Frades Payo B, Rodriguez
Laso A, Bartolome Martinez MP, Otero Puime A: [Cognitive assessment in the elderly.
Normative data of a Spanish population sample older than 70 years]. Med Clin (Barc)
2004, 122(19):727-740.
28. Brucki SM, Malheiros SM, Okamoto IH, Bertolucci PH: [Normative data on the verbal
fluency test in the animal category in our milieu]. Arq Neuropsiquiatr 1997, 55(1):56-61.
29. Acevedo A, Loewenstein DA, Barker WW, Harwood DG, Luis C, Bravo M, Hurwitz DA,
Aguero H, Greenfield L, Duara R: Category fluency test: normative data for English-
and Spanish-speaking elderly. J Int Neuropsychol Soc 2000, 6(7):760-769.
30. Manly JJ, Jacobs DM, Sano M, Bell K, Merchant CA, Small SA, Stern Y: Effect of literacy
on neuropsychological test performance in nondemented, education-matched elders. J
Int Neuropsychol Soc 1999, 5(3):191-202.
31. Prince MJ, de Rodriguez JL, Noriega L, Lopez A, Acosta D, Albanese E, Arizaga R,
Copeland JR, Dewey M, Ferri CP et al: The 10/66 Dementia Research Group's fully
operationalised DSM-IV dementia computerized diagnostic algorithm, compared with
the 10/66 dementia algorithm and a clinician diagnosis: a population validation study.
BMC Public Health 2008, 8:219.

� �
Table 1 Sociodemographic characteristics of participants by site
Region Latin America China India
Country Cuba DR Peru Venezuela Mexico
Rural or urban site Urban Urban Urban Rural Urban Urban Rural Urban Rural Urban Rural
Total (n) 2,621 1,769 1,251 516 1,826 910 913 1,076 946 930 891
Age in years (MV) 7 0 1 0 23 1 0 0 0 4 0
65 – 69 years % 28.2 29.0 29.2 33.5 44.1 26.7 32.2 28.7 39.9 42.9 34.8
70 – 74 years % 28.3 27.3 27.3 25.8 24.9 34.4 26.2 32.5 30.1 32.1 34.9
75 – 79 years % 22.3 19.5 21.9 18.2 17.8 20.2 22.1 21.9 19.3 14.6 17.7
80+ years % 21.3 24.3 21.6 22.5 13.1 18.7 19.5 16.8 11.0 10.5 12.6
Females (MV) 0 2 0 0 60 0 0 0 0 15 0
% 64.4 65.4 64.1 52.5 63.5 65.6 59.9 56.6 55.3 57.3 52.3
Education (MV) 8 19 8 8 63 0 0 0 0 2 0
No education % 2.1 17.8 2.5 14.0 7.3 19.6 31.0 19.2 57.2 41.3 63.6
Some education
(did not complete primary) % 20.9 51.8 6.4 25.6 22.1 35.7 52.3 12.8 11.5 24.2 21.0
Completed primary % 33.0 19.1 31.8 49.6 49.4 24.2 12.8 26.5 26.3 20.8 12.4
Completed secondary % 26.0 7.1 36.1 6.6 14.3 10.4 2.4 29.4 4.4 9.1 2.8
Completed tertiary % 17.9 3.7 22.8 3.1 5.0 10.1 1.5 12.1 0.5 4.4 0.2
DR = Dominican Republic; MV= number of records with missing information on the variable in
question.

� �
Table 2 Mean (SD) scores for global cognitive function (CSI ‘D’ COGSCORE) by demographic status and site
Country
Cuba DR Peru Venezuela Mexico China India
Urban Urban Urban Rural Urban Urban Rural Urban Rural Urban Rural
Age
65 - 69 31.1 (1.9) 30.4 (2.3) 31.8 (1.3) 30.6 (2.9) 31.1 (1.8) 30.8 (1.7) 29.8 (2.1) 31.7 (1.2) 31.0 (3.9) 29.2
(3.0)
27.9
(3.2)
70 - 74 30.8 (1.9) 30.2 (2.1) 31.3 (2.2) 30.4 (1.8) 30.6 (2.2) 30.1 (2.8) 29.3 (1.9) 31.4 (2.0) 30.7 (2.6) 28.3
(3.7)
27.3
(4.3)
75 - 79 30.3 (2.1) 29.9 (2.1) 31.1 (2.4) 29.7 (2.7) 30.1 (2.5) 29.5 (2.8) 28.5 (3.4) 31.4 (1.5) 29.6 (4.3) 28.5
(4.0)
27.0
(3.6)
80+ 29.5 (2.6) 28.7 (2.8) 29.6 (3.4) 28.9 (3.4) 29.0 (2.8) 29.3 (2.4) 28.3 (2.6) 30.9 (2.8) 29.1 (3.7) 27.6
(3.4)
25.3
(7.3)
Crude β
(95% C.I.)
-0.5
(-0.6 to -
0.5)
-0.5
(-0.6 to -
0.4)
-0.6
(-0.8 to -
0.5)
-0.6
(-0.8 to -
0.4)
-0.6
(-0.7 to-
0.5)
-0.5
(-0.7 to -
0.4)
-0.5
(-0.7 to -
0.4)
-0.2
(-0.3 to -
0.1)
-0.7
(-0.9 to -
0.4)
-0.8
(-0.7 to -
0.3)
-0.8
(-1.0 to -
0.5)
Adj. β1
(95% C.I.)
-0.4
(-0.4 to -
0.3)
-0.5
(-0.6 to -
0.4)
-0.6
(-0.7 to -
0.4)
-0.5
(-0.7 to -
0.3)
-0.5
(-0.6 to -
0.4)
-0.4
(-0.5 to -
0.2)
-0.5
(-0.6 to -
0.3)
-0.2
(-0.3 to -
0.9)
-0.6
(-0.8 to -
0.3)
-0.5
(-0.7 to -
0.3)
-0.8
(-1.1 to -
0.5)
Sex
Females 30.4 (2.3) 29.6 (2.6) 31.0 (2.2) 29.9 (2.7) 30.4
(1.89) 29.9 (2.5) 29.0 (2.5) 31.2 (2.3) 30.2 (3.1)
27.9
(3.4)
26.0
(5.3)
Males 30.7 (2.1) 30.2
(2.01) 31.1 (2.9) 30.2 (3.0)
30.7
(2.54) 30.2 (2.5) 29.2 (2.7) 31.6 (1.2) 30.7 (4.3)
29.7
(3.1)
28.5
(2.52)
Crude β
(95% C.I.)
0.3
(0.1 to
0.5)
0.6
(0.3 to
0.8)
0.0
(-0.2 to
0.3)
0.3
(-0.2 to
0.7)
0.3
(0.1 to
0.5)
0.4
(0.0 to
0.7)
0.2
(-0.1 to
0.5)
0.4
(0.2 to
0.7)
0.5
(0.0 to
0.9)
1.9
(1.4 to
2.3)
2.6
(2.0 to
3.1)
Adj. β2
(95% C.I.)
0.1
(-0.1 to
0.2)
0.4
(0.1 to
0.6)
0.0
(-0.2 to
0.3)
0.1
(-0.4 to
0.6)
0.2
(-0.0 to
0.4)
0.4
(0.0 to
0.7)
0.2
(-0.1 to
0.6)
0.2
(-0.1 to
0.4)
0.1
(-0.5 to
0.6)
1.0
(0.6 to
1.4)
1.4
(0.8 to
2.1)
Education
No Ed. 28.3 (3.7) 28.2 (3.1) 28.7 (3.1) 27.9 (3.7) 29.1 (1.9) 28.5 (2.7) 27.8 (3.3) 30.6 (2.7) 30.1 (3.5) 27.0
(3.3)
26.1
(5.0)
Some Ed. 29.3 (2.5) 29.8 (2.2) 29.8 (2.6) 29.9 (2.2) 29.7 (2.3) 29.5 (2.9) 29.4 (2.1) 30.7 (1.4) 30.3 (3.5) 29.0
(3.3)
28.5
(1.9)
Primary 30.4 (1.8) 30.8 (1.6) 30.6 (2.4) 30.6 (1.9) 30.8 (1.6) 30.6 (1.7) 30.3 (1.8) 31.5 (2.1) 31.0 (4.2) 29.8
(3.5)
30.0
(1.6)
Secondary 31.1 (1.5) 31.1 (1.7) 31.3 (2.7) 30.1 (5.6) 31.1 (3.2) 31.3 (1.3) 30.7 (1.6) 31.9 (1.1) 32.0 (0.7) 31.1
(1.2)
30.9
(1.3)
Tertiary 31.7 (2.2) 31.1 (1.7) 31.7 (1.4) 31.1 (0.9) 31.3 (1.5) 31.6 (1.2) 31.5 (1.2) 32.0 (0.9) 31.4 (1.8) 31.0
(1.5)
31.4
(1.7)
Crude β
(95% C.I.)
0.8
(0.7 to
0.8)
0.7
(0.6 to
0.8)
0.6
(0.5 to
0.7)
0.6
(0.4 to
0.8)
0.4
(0.3 to
0.5)
0.7
(0.6 to
0.8)
0.8
(0.7 to
0.9)
0.3
(0.2 to
0.4)
0.3
(0.2 to
0.5)
0.9
(0.8 to
1.0)
1.2
(1.0 to
1.5)
Adj. β 3
(95% C.I.)
0.7
(0.6 to
0.7)
0.6
(0.5 to
0.7)
0.5
(0.3 to
0.6)
0.6
(0.4 to
0.7)
0.5
(0.4 to
0.6)
0.6
(0.5 to
0.7)
0.7
(0.6 to
0.9)
0.3
(0.2 to
0.4)
0.2
(0.1 to
0.4)
0.8
(0.7 to
0.9)
0.9
(0.7 to
1.2)
DR = Dominican Republic
1. Adjusted for sex and education
2. Adjusted for age and education
3. Adjusted for age and sex

� �
Table 3 Mean (SD) scores for CERAD verbal fluency (animal naming) test by demographic status and site
Country
Cuba DR Peru Venezuela Mexico China India
Urban Urban Urban Rural Urban Urban Rural Urban Rural Urban Rural
Age
65 - 69 18.1 (6.2) 15.0 (4.8) 19.3 (5.5) 17.1 (4.9) 20.1 (6.3)
16.9
(5.1)
14.9
(4.2)
17.3
(4.6)
16.2
(5.7) 8.9 (3.3)
10.4
(3.6)
70 - 74 16.9 (5.8) 14.2 (4.9) 18.2 (5.3) 16.1 (5.1) 18.0 (6.0)
15.7
(5.1)
14.1
(4.4)
16.8
(4.7)
15.8
(5.1) 8.6 (3.4)
10.1
(3.8)
75 - 79 15.9 (5.4) 13.7 (4.3) 16.9 (4.8) 15.2 (3.7) 16.8 (5.7)
15.2
(4.8)
13.0
(4.5)
16.3
(4.5)
14.1
(5.2) 8.4 (3.3) 9.5 (3.3)
80+ 14.7 (5.6) 12.3 (4.4) 14.3 (5.1) 14.4 (5.0) 14.8 (5.8)
14.3
(5.1)
13.0
(4.6)
15.8
(4.8)
13.1
(5.0) 7.4 (2.5) 9.1 (4.4)
Crude β
(95% C.I.)
-1.1
(-1.3 to -
0.9)
-0.9
(-1.1 to -
0.7)
-1.6
(-1.9 to -
1.3)
-0.9
(-1.3 to -
0.5)
-1.7
(-2.0 to -
1.4)
-0.8
(-1.1 to -
0.5)
-0.7
(-1.0 to -
0.5)
-0.5
(-0.8 to -
0.3)
-1.0
(-1.4 to -
0.7)
-0.4
(-0.6 to -
0.2)
-0.4
(-0.7 to -
0.2)
Adj. β1
(95% C.I.)
-0.7
(-0.9 to -
0.5)
-0.8
(-1.0-0.6)
-1.4
(-1.7 to -
1.2)
-0.8
(-1.2 to -
0.5)
-1.4
(-1.7 to -
1.1)
-0.6
(-0.9 to -
0.2)
-0.7
(-0.9 to -
0.4)
-0.5
(-0.8 to -
0.3)
-0.7
(-1.1 to -
0.4)
-0.4
(-0.6 to -
0.1)
-0.4
(-0.6 to -
0.2)
Sex
Females 15.9 (5.6) 13.5 (4.5) 17.2 (5.3) 15.6 (4.7) 18.1 (6.2)
15.5
(5.1)
13.5
(4.3)
16.1
(4.6)
14.8
(5.1) 8.1 (3.1) 9.3 (3.7)
Males 17.7 (6.3) 14.6 (5.1) 17.8 (5.9) 16.2 (5.0) 18.7 (6.6)
16.1
(5.2)
14.4
(4.7)
17.4
(4.6)
15.9
(5.9) 9.4 (3.5)
10.7
(3.6)
Crude β
(95% C.I.)
1.8
(1.4 to 2.3)
1.1
(0.6 to 1.6)
0.5
(-0.1 to
1.2)
0.6
(-0.2 to
1.4)
0.6
(0.0 to
1.2)
0.6
(-0.1 to
1.3)
0.9
(0.3 to
1.5)
1.2
(0.7 to
1.8)
1.1
(0.4 to
1.8)
1.3
(0.9 to
1.8)
1.4
(1.0 to
1.9)
Adj. β2
(95% C.I.)
1.3
(0.9 to 1.7)
0.9
(0.4 to 1.3)
0.5
(-0.1 to
1.1)
0.5
(-0.3 to
1.3)
0.2
(-0.4 to
0.8)
0.6
(-0.1 to
1.2)
0.9
(0.4 to
1.5)
0.8
(0.3 to
1.4)
-0.1
(-0.8 to
0.7)
0.9
(0.4 to
1.3)
0.9
(0.4 to
1.3)
Education
No Ed. 13.6 (4.5) 12.8 (4.3) 14.3 (4.5) 13.4 (4.1) 14.8 (5.0)
14.0
(4.4)
12.6
(4.0)
15.3
(4.4)
14.3
(5.1) 7.7 (3.1) 9.3 (3.6)
Some Ed. 13.9 (5.0) 13.4 (4.4) 14.7 (4.6) 15.7 (5.0) 16.7 (6.6)
14.5
(4.7)
14.1
(4.5)
15.2
(5.1)
14.3
(5.1) 8.9 (3.4)
10.3
(3.3)
Primary 15.6 (5.28) 14.8 (5.0) 16.1 (4.9) 16.5 (4.5) 18.8 (6.1)
16.2
(4.9)
14.8
(4.2)
17.1
(4.4)
17.5
(5.7)
10.0
(3.0)
12.0
(3.2)
Secondary 17.2 (5.5) 15.8 (5.2) 17.7 (5.6) 16.9 (6.3) 19.7 (6.0)
18.1
(4.3)
18.0
(4.5)
17.6
(4.2)
17.6
(6.4)
10.3
(3.5)
14.0
(4.1)
Tertiary 20.7 (6.4) 16.8 (5.7) 19.7 (5.7) 16.1 (6.2) 21.7 (7.3)
19.4
(6.0)
18.3
(5.0)
17.2
(5.2)
17.6
(2.7)
9.7
(3.03)
16.0
(2.8)
Crude β
(95% C.I.)
1.9
(1.7 to 2.1)
0.7
(0.6 to 0.9)
1.4
(1.2 to 1.7)
0.8
(0.4 to 1.1)
1.2
(0.9 to
1.4)
1.1
(0.9 to
1.3)
0.9
(0.7 to
1.1)
0.5
(0.4 to
0.7)
0.9
(0.7 to
1.1)
0.5
(0.4 to
0.6)
0.9
(0.7 to
1.1)
Adj. β 3
(95% C.I.)
1.6
(1.4 to 1.8)
0.6
(0.4 to 0.8)
1.1
(0.8 to 1.4)
0.6
(0.3 to 0.9)
1.3
(1.1 to
1.6)
1.0
(0.8 to
1.2)
0.8
(0.6 to
1.1)
0.4
(0.2 to
0.6)
0.7
(0.5 to
1.0)
0.4
(0.3 to
0.6)
0.8
(0.5 to
1.0)
DR = Dominican Republic
1. Adjusted for sex and education
2. Adjusted for age and education
3. Adjusted for age and sex

� �
Table 4 Mean (SD) scores for CERAD word list memory (immediate recall) test by demographic status and site
Country
Cuba DR Peru Venezuela Mexico China India
Urban Urban Urban Rural Urban Urban Rural Urban Rural Urban Rural
Age
65 - 69 17.0 (3.9) 15.07 (3.65) 16.9 (3.8) 14.0 (3.8) 16.3 (4.0) 15.0 (3.6) 13.7 (3.6) 18.7 (4.2) 15.5 (4.3) 13.5 (4.8) 8.9 (3.9)
70 - 74 16.0 (4.1) 14.37 (3.78) 15.7 (3.5) 13.2 (3.7) 15.0 (3.9) 13.5 (4.0) 12.4 (3.9) 18.0 (4.0) 14.6 (3.6) 12.3 (4.5) 7.9 (3.7)
75 - 79 15.1 (3.8) 13.43 (3.52) 14.4 (3.9) 11.9 (3.9) 14.3 (4.3) 12.1 (3.7) 11.3 (4.0) 17.5 (4.4) 13.0 (4.2) 11.6 (4.6) 8.0 (3.9)
80+ 14.0 (4.1) 12.24 (3.84) 12.6 (3.6) 11.6 (3.9) 13.0 (3.9) 11.7 (4.1) 11.2 (3.8) 16.4 (4.7) 12.6 (3.6) 10.8 (4.1) 5.9 (4.2)
Crude β
(95% C.I.)
-1.0
(-1.1 to -
0.8)
-0.9
(-1.1 to -
0.8)
-1.4
(-1.6 to -
1.2)
-0.8
(-1.1 to -
0.5)
-1.1
(-1.2 to -0.9)
-1.1
(-1.4 to -
0.9)
-0.9
(-1.1 to -
0.7)
-0.7
(-1.0 to -
0.5)
-1.1
(-1.3 to -
0.8)
-0.9
(-1.2 to -
0.6)
-0.8
(-1.1 to -
0.5)
Adj. β1
(95% C.I.)
-0.7
(-0.8 to -
0.6)
-0.9
(-1.0 to -
0.7)
-1.2
(-1.4 to -
1.0)
-0.7
(-0.9 to -
0.4)
-0.9
(-1.1 to -0.7)
-0.9
(-1.1 to -
0.6)
-0.7
(-1.0 to -
0.5)
-0.7
(-0.9 to -
0.4)
-0.9
(-1.2 to -
0.6)
-0.9
(-1.2 to -
0.6)
-0.7
(-1.0 to -
0.5)
Sex
Females 15.6 (4.2) 14.1 (3.8) 15.4 (4.0) 13.4 (4.1) 15.4 (4.2) 13.7 (3.9) 12.9 (3.9) 17.5 (4.1) 14.1 (3.8) 12.2 (4.5) 7.5 (4.1)
Males 15.5 (4.0) 13.5 (3.9) 14.5 (4.0)
12.3
(3.72) 14.9 (4.1) 12.5 (4.3) 11.5 (3.9) 18.3 (4.5) 14.8 (4.5) 13.0 (4.9) 8.5 (3.7)
Crude β
(95% C.I.)
-0.1
(-0.4 to 0.2)
-0.6
(-1.0 to -
0.2)
-1.0
(-1.4 to -
0.5)
-1.1
(-1.8 to -
0.5)
-0.5
(-0.9 to -0.1)
-1.2
(-1.7 to -
0.6)
-1.3
(-1.8 to -
0.8)
0.8
(0.3 to
1.3)
0.8
(0.2 to
1.3)
0.8
(0.1 to
1.4)
1.0
(0.5 to
1.5)
Adj. β2
(95% C.I.)
-0.4
(-0.7 to -
0.1)
-0.8
(-1.2 to -
0.5)
-1.0
(-1.4 to -
0.5)
-1.4
(-2.0 to -
0.7)
-0.8
(-1.2 to -0.4)
-1.1
(-1.6 to -
0.6)
-1.2
(-1.7 to -
0.7)
0.1
(-0.4 to
0.7)
0.1
(-0.5 to
0.7)
-0.3
(-0.9 to
0.3)
-0.1
(-0.7 to
0.5)
Education
No Ed. 13.4 (4.9) 13.0 (3.8) 12.3 (4.7)
10.6
(3.49) 12.1 (4.0) 11.7 (3.8) 11.3 (3.6) 16.3 (4.0) 13.8 (3.9) 11.0 (4.3) 7.2 (3.8)
Some Ed. 13.9 (4.0) 13.5 (3.7) 13.1 (3.7)
12.8
(3.91) 14.5 (4.3) 12.2 (3.8) 12.5 (3.9) 16.1 (3.7) 14.1 (4.1) 12.2 (4.1) 8.8 (3.5)
Primary 15.2 (3.9) 14.7 (3.6) 14.3 (3.9)
13.4
(3.76) 15.6 (3.9) 13.9 (3.7) 13.1 (3.7) 17.7 (4.2) 15.4 (4.3) 14.0 (4.3) 10.1 (4.1)
Secondary 16.2 (3.9) 15.7 (4.1) 15.4 (3.9)
13.5
(4.65) 15.9 (4.0) 15.1 (3.6) 14.9 (3.7) 18.9 (4.1) 17.0 (4.7) 16.0 (5.2) 10.8 (3.9)
Tertiary 17.8 (3.9) 16.1 (4.5) 16.6 (4.0) 15.1 (4.5) 16.7 (4.1) 16.8 (3.5) 17.1 (4.9) 19.7 (4.7) 14.8 (6.5) 15.5 (4.8) 12.5 (3.5)
Crude β
(95% C.I.)
1.1
(1.0 to 1.3)
0.6
(0.5 to 0.8)
1.0
(0.8 to
1.2)
0.8
(0.5 to
1.0)
0.8
(0.6 to 0.9)
1.0
(0.8 to
1.1)
0.7
(0.5 to
0.9)
0.7
(0.5 to
0.9)
0.6
(0.4 to
0.7)
1.0
0.8 to
1.2)
0.9
(0.7 to
1.1)
Adj. β 3
(95% C.I.)
1.0
(0.8 to 1.1)
0.6
(0.4 to 0.7)
0.8
(0.6 to
1.0)
0.8
(0.5 to
1.0)
0.9
(0.7 to 1.1)
0.9
(0.7 to
1.1)
0.7
(0.5 to
0.9)
0.7
(0.5 to
0.8)
0.4
(0.2 to
0.6)
1.0
(0.8 to
1.2)
0.9
(0.7 to
1.1)
DR = Dominican Republic
1. Adjusted for sex and education
2. Adjusted for age and education
3. Adjusted for age and sex

� �
Table 5 Mean (SD) scores for CERAD word list recall (delayed recall) test by demographic status and site
Country
Cuba DR Peru Venezuela Mexico China India
Urban Urban Urban Rural Urban Urban Rural Urban Rural Urban Rural
Age
65 - 69 5.7 (1.9) 4.8 (1.9) 5.7 (1.8) 4.8 (1.9) 5.6 (2.0) 5.1 (1.7) 4.8 (1.8) 7.0 (1.6) 4.2 (1.8) 4.63 (2.0) 3.2 (1.8)
70 - 74 5.3 (1.8) 4.4 (1.8) 5.2 (1.8) 4.5 (1.9) 5.2 (2.0) 4.6 (1.8) 4.1 (1.9) 6.8 (1.7) 3.9 (1.7) 4.19 (2.0) 2.9 (1.7)
75 - 79 4.9 (1.9) 4.1 (1.8) 4.6 (1.8) 3.6 (1.8) 4.8 (2.1) 4.0 (1.8) 3.6 (2.0) 6.5 (1.9) 3.3 (1.7) 3.87 (2.2) 2.8 (1.7)
80+ 4.3 (1.8) 3.5 (1.9) 3.8 (1.9) 3.5 (2.0) 4.1 (2.0) 3.6 (1.8) 3.7 (1.9) 6.1 (2.2) 3.3 (1.6) 3.31 (2.1) 2.1 (1.6)
Crude β
(95% C.I.)
-0.4
(-0.5 to -
0.4)
-0.4
(-0.5 to -
0.4)
-0.6
(-0.7 to -
0.5)
-0.5
(-0.6 to -
0.3)
-0.5
(-0.6 to -
0.4)
-0.5
(-0.6 to -
0.4)
-0.4
(-0.5 to -
0.3)
-0.3
(-0.4 to -
0.2)
-0.4
(-0.5 to -
0.3)
-0.4
(-0.6 to -
0.3)
-0.3
(-0.4 to -
0.2)
Adj. β1
(95% C.I.)
-0.3
(-0.4 to -
0.3)
-0.4
(-0.5 to -
0.3)
-0.6
(-0.6 to -
0.5)
-0.4
(-0.5 to -
0.3)
-0.4
(-0.5 to -
0.3)
-0.4
(-0.5 to -
0.3)
-0.3
(-0.5 to -
0.2)
-0.3
(-0.4 to -
0.2)
-0.3
(-0.4 to -
0.2)
-0.4
(-0.6 to -
0.3)
-0.3
(-0.4 to -
0.2)
Sex
Females 5.1 (1.9) 4.4 (1.9) 5.1 (2.0) 4.4 (2.1) 5.3 (2.0) 4.6 (1.9) 4.3 (2.0) 6.6 (1.8) 3.7 (1.7) 4.2 (1.9) 2.7 (1.7)
Males 5.0 (1.9) 4.0 (1.8) 4.6 (1.9) 3.9 (1.9) 4.9 (2.0) 4.1 (1.9) 3.8 (1.9) 6.8 (1.9) 4.0 (1.8) 4.3 (2.2) 3.1 (1.8)
Crude β
(95% C.I.)
-0.1
(-0.3 to 0.0)
-0.3
(-0.5 to -
0.2)
-0.5
(-0.7 to -
0.2)
-0.5
(-0.8 to -
0.2)
-0.3
(-0.5 to -
0.1)
-0.5
(-0.8 to -
0.3)
-0.5
(-0.8 to -
0.3)
0.3
(0.1 to
0.5)
0.2
(0.0 to
0.5)
0.2
(-0.1 to
0.4)
0.4
(0.2 to
0.6)
Adj. β2
(95% C.I.)
-0.2
(-0.4 to -
0.1)
-0.4
(-0.6 to -
0.3)
-0.4
(-0.7 to -
0.2)
-0.6
(-0.9 to -
0.3)
-0.4
(-0.6 to -
0.2)
-0.5
(-0.7 to -
0.21)
-0.5
(-0.7 to -
0.2)
0.0
(-0.2 to
0.3)
0.0
(-0.3 to
0.2)
-0.2
(-0.5 to
0.04)
0.0
(-0.3 to
0.2)
Education
No Ed. 4.2 (2.1) 4.0 (2.0) 4.0 (2.0) 3.1 (1.8) 4.1 (1.7) 3.9 (1.9) 3.7 (2.1) 6.2 (1.9) 3.6 (1.7) 3.7 (2.0) 2.6 (1.6)
Some Ed. 4.4 (1.9) 4.1 (1.8) 4.3 (1.9) 4.1 (2.2) 4.9 (2.1) 4.0 (1.8) 4.2 (1.9) 5.7 (1.8) 4.0 (1.7) 3.9 (1.8) 3.2 (1.8)
Primary 5.0 (1.8) 4.5 (1.7) 4.5 (1.9) 4.4 (1.8) 5.3 (2.0) 4.7 (1.8) 4.5 (1.8) 6.8 (1.7) 4.2 (1.8) 4.8 (2.0) 3.7 (1.8)
Secondary 5.3 (1.8) 4.9 (1.9) 5.1 (1.8) 4.8 (1.7) 5.3 (1.9) 5.3 (1.9) 5.1 (2.2) 7.1 (1.7) 4.6 (1.9) 5.5(2.1) 4.1 (1.7)
Tertiary 6.0 (2.0) 5.0 (2.1) 5.4 (2.0) 5.4 (1.7) 5.8 (2.1) 5.4 (1.7) 5.8 (1.6) 7.3 (1.9) 3.8 (2.7) 5.3 (1.6 4.0 (1.4)
Crude β
(95% C.I.)
0.5
(0.4 to 0.5)
0.2
(0.1 to 0.3)
0.4
(0.3 to
0.5)
0.4
(0.2 to
0.5)
0.3
(0.2 to 0.4)
0.3
(0.3 to
0.4)
0.3
(0.2 to
0.4)
0.3
(0.2 to
0.3)
0.2
(0.1 to
0.3)
0.3
(0.3 to
4.0)
0.3
(0.2 to
0.4)
Adj. β 3
(95% C.I.)
0.4
(0.3 to 0.5)
0.2
(0.1 to 0.3)
0.3
(0.2 to
0.4)
0.4
(0.2 to
0.5)
0.3
(0.2 to 0.4)
0.3
(0.2 to
0.4)
0.3
(0.2 to
0.4)
0.2
(0.2 to
0.3)
0.2
(0.1 to
0.2)
0.4
(0.3 to
0.4)
0.3
(0.2 to
0.4)
DR = Dominican Republic
1. Adjusted for sex and education
2. Adjusted for age and education
3. Adjusted for age and sex

� �
Table 6 The independent effects of age, education, sex and site on the four cognitive assessments, further decomposing
the effect of site into region and rural/ urban location
The independent, mutually
adjusted effects (eta2 %) of
age, education, sex and site
on cognitive test performance
Unpacking ‘site’ – the
independent effects
(eta2 %) of region and
rural/urban location
The effect of region, adjusting for age, education, sex and rural/urban
location
(95% CI)
Cognitive test Age Education Sex Site Region Rural/
Urban
Parameter Latin America China India
Adjusted mean 30.0 (29.9,
30.1)
31.1 (31.0,
31.2)
28.5 (28.3,
28.6)
Global function
(COGSCORE)
3.3% 7.0% 0.4% 7.6% 6.8% 0.5%
Mean
difference
Reference 1.1 (0.9, 1.2) -1.6 (-1.7, -1.4)
Adjusted mean 16.0 (15.9,
16.1)
16.3 (16.1,
16.5)
10.2 (10.0,
10.5)
Verbal Fluency 3.1% 5.1% 0.4% 15.8% 12.2% 0.0%
Mean
difference
Reference 0.3 (0.0, 0.5) -5.8 (-6.1, -5.5)
Adjusted mean 13.5 (13.4,
13.6)
16.3 (16.1,
16.5)
11.0 (10.7,
11.2)
Word list
memory
4.9% 6.5% 0.5% 16.0% 11.6% 4.1%
Mean
difference
Reference 2.8 (2.6, 3.0) -2.5 (-2.8, -2.3)
Adjusted mean 4.3 (4.3, 4.3) 5.4 (5.3, 5.5) 3.8 (3.7, 3.9) Word list recall 4.7% 4.0% 0.6% 11.6% 5.1% 3.5%
Mean
difference
Reference 1.1 (1.0, 1.2) -0.5 (-0.6, -0.4)