Berenberg Specialty Chemicals & Food Ingredients...
46
Public Patrick Jany, CFO 30 September 2014 Berenberg Specialty Chemicals & Food Ingredients Conference LONDON, 30 SEPTEMBER 2014
-
Upload
truongcong -
Category
Documents
-
view
219 -
download
1
Transcript of Berenberg Specialty Chemicals & Food Ingredients...
Public
Patrick Jany, CFO30 September 2014
Berenberg Specialty Chemicals & Food Ingredients ConferenceLONDON, 30 SEPTEMBER 2014

Public
Patrick Jany, CFO30 September 2014
Strategy and goals

Patrick Jany, CFO, 30 September 2014
PROFITABLE GROWTHPROFITABLE GROWTH
Continuous improvement
Clariant’s roadmap to increased performance
Public, Berenberg Specialty Chemicals & Food Ingredients Conference / London3
THREE PHASES OF STRATEGY IMPLEMENTATION SINCE 2009
2009 2010 2011 2012 2013 2014 2015
Comprehensive restructuring
Clariant Excellence (CLNX) for continuous improvement
* before exceptional items
Increase Profitability
5 PILLARS STRATEGY
1
Foster Innovation and R&D
2
Intensify Growth
4
Reposition Portfolio
5
Add value with Sustainability
3
TARGETS− Sales growth > global GDP
growth (approx. 5%)
− EBITDA* margin 16-19%
− Above-average peer group return on invested capital (ROIC)
Patrick Jany, CFO, 30 September 2014
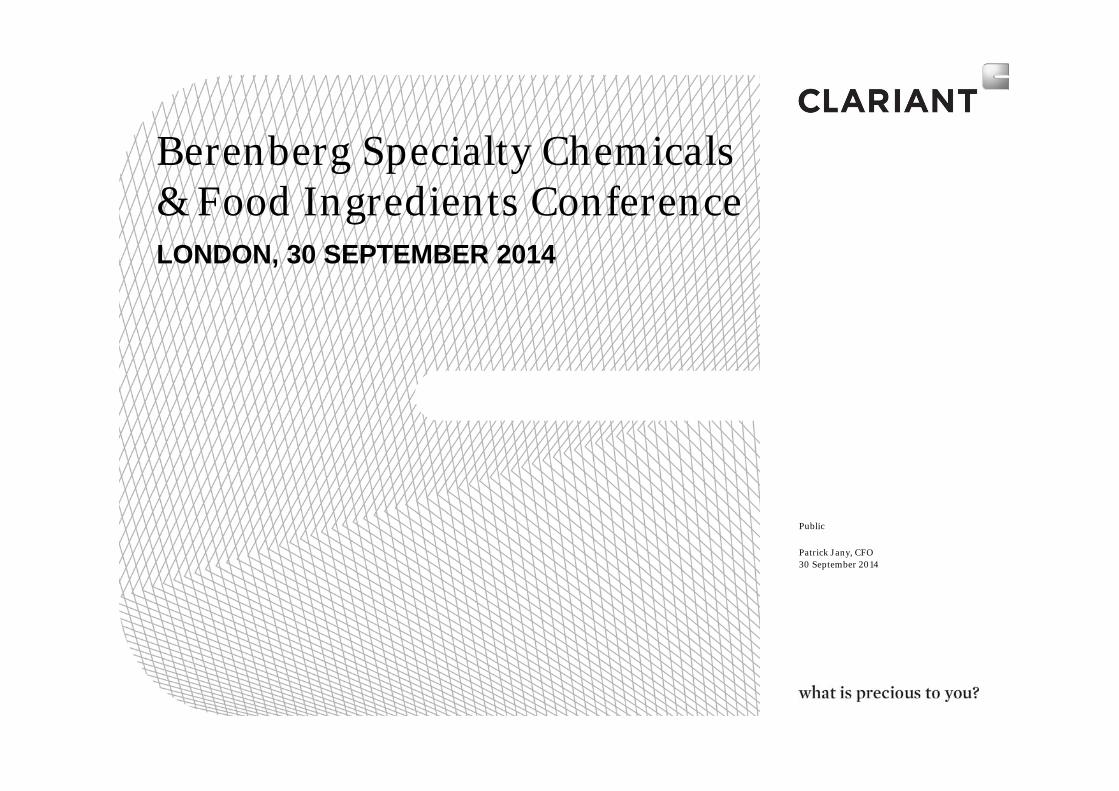
12.7% 13.2% 13.3%14.1%
>14.1%
16-19%
4
2012 2013 2014 2015 & beyond2011
* before exceptional items, as reported
EBITDA* MARGIN
2010
Profitability has stabilized – closing the gap to target in a next step
Target 2014:
– Increase in profitability despite adverse currency developments –150 bps negative impact in H1 2014
Target 2015 and beyond:
– 1-2% margin increase resulting from cost efficiency measures
– 1-2% margin increase from growth in above average profitability business areas
Public, Berenberg Specialty Chemicals & Food Ingredients Conference / London

Public
Patrick Jany, CFO30 September 2014
Business Areas
Patrick Jany, CFO, 30 September 2014
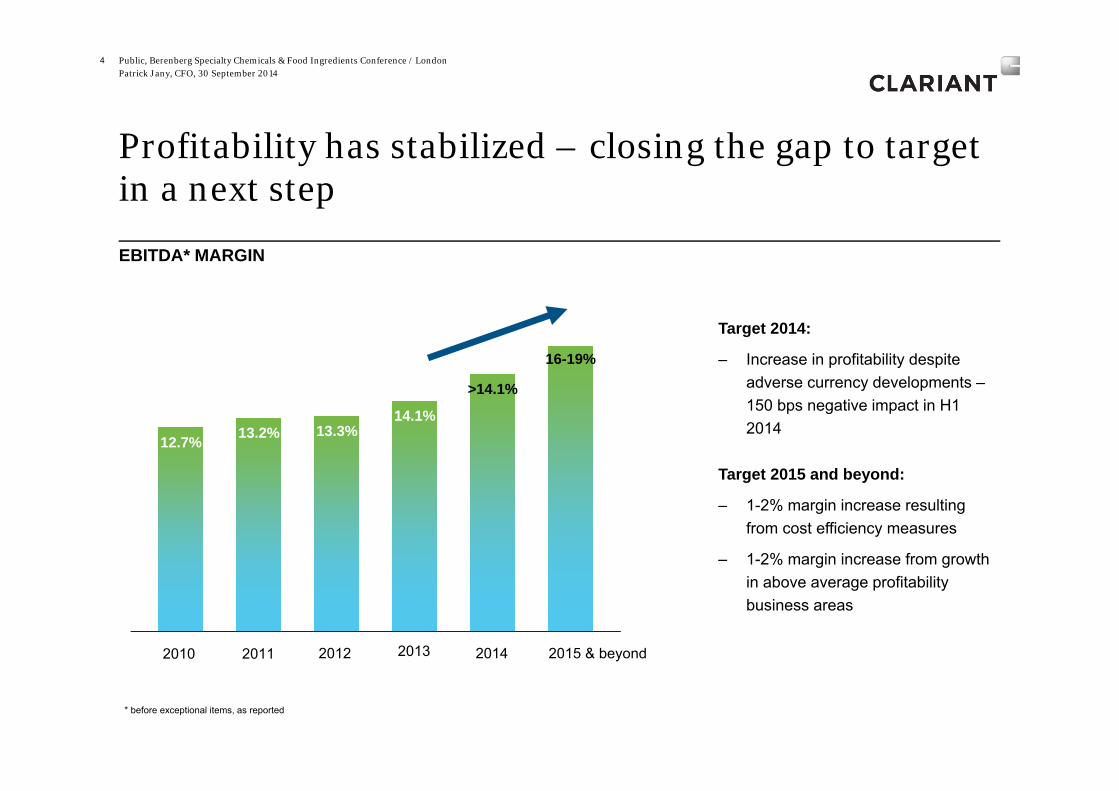
Clariant 2014 – a focused specialty chemicals company after portfolio repositioning
Strategic acquisition– Süd-Chemie
Bolt-on acquisitions (selection):– Octagon– Prairie PetroChem– Oxiteno Catalysts– CRM– Jiangsu Multicolor
6
Divestments– Detergents & Intermediates– Emulsions– Leather Services– Paper Specialties– Textile Chemicals
– Water Treatment business
– ASK Chemicals JV
–
Care ChemicalsIndustrial & Consumer Specialties
Industrial Biotechnology
Catalysis & Energy
Natural ResourcesOil & Mining Services Functional Minerals
Plastics & CoatingsAdditivesMasterbatchesPigments
CLARIANT 2014
+
CatalystsEnergy Storage
ACQUISITIONS & DIVESTMENTS 2011-2014
Public, Berenberg Specialty Chemicals & Food Ingredients Conference / London
Patrick Jany, CFO, 30 September 2014
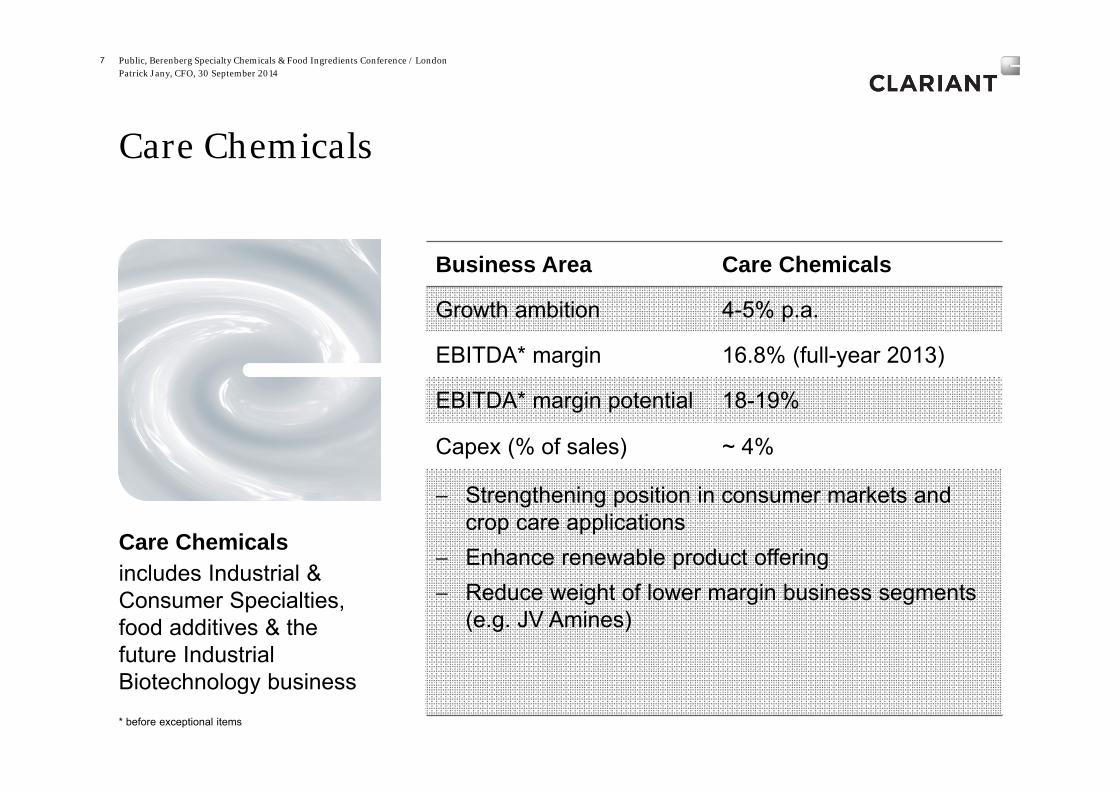
Care Chemicals
Business Area Care Chemicals
Growth ambition 4-5% p.a.
EBITDA* margin 16.8% (full-year 2013)
EBITDA* margin potential 18-19%
Capex (% of sales) ~ 4%
− Strengthening position in consumer markets and crop care applications
− Enhance renewable product offering− Reduce weight of lower margin business segments
(e.g. JV Amines)
7
* before exceptional items
Care Chemicalsincludes Industrial & Consumer Specialties, food additives & the future Industrial Biotechnology business
Public, Berenberg Specialty Chemicals & Food Ingredients Conference / London

Patrick Jany, CFO, 30 September 2014
Catalysis & Energy
8
Business Area Catalysis & Energy
Growth ambition 6-7% p.a.
EBITDA* margin 22.3% (full-year 2013)
EBITDA* margin potential 24-26%
Capex (% of sales) ~ 6% of sales
− Strengthen position in various product segments via organic growth and innovation (Catofin for propylene/butylene production, OleMax®, selective hydrogenation catalyst, catalysts for PP production)
− achieve break-even in Li-battery materials and accelerate market penetration
Public, Berenberg Specialty Chemicals & Food Ingredients Conference / London
* before exceptional items
Catalysis & Energyincludes Catalysts and Energy Storage businesses

Patrick Jany, CFO, 30 September 2014
Natural Resources
9
Business Area Natural Resources
Growth ambition 6-7% p.a
EBITDA* margin 15.2% (full-year 2013)
EBITDA* margin potential 15-17%
Capex (% of sales) 3-4%
− Grow with megatrends e.g. deep-water, EOR or Unconventional Oil and leverage structure
− Grow in North America− Expand in core Floating expertise in Mining Services − Improve low margin Functional Mineral businesses
(Europe, water)
Public, Berenberg Specialty Chemicals & Food Ingredients Conference / London
* before exceptional items
Natural Resourcesincludes Oil & Mining Services and Functional Minerals businesses

Patrick Jany, CFO, 30 September 2014
Plastics & Coatings
10
Business Area Plastics & Coatings
Growth ambition Global GDP
EBITDA* margin 14.1% (full-year 2013)
EBITDA* margin potential 16-19%
Capex (% of sales) 3-4%
− Above average growth in emerging markets and end-user segments in Pigments
− Reduce dependency of Masterbatches and Pigments on Europe
− Broaden market presence in flame retardants
Public, Berenberg Specialty Chemicals & Food Ingredients Conference / London
* before exceptional items
Plastics & Coatingsincludes Additives, Pigments and Masterbatchesbusinesses

Public
Patrick Jany, CFO30 September 2014
Performance, Growth, Innovation
Patrick Jany, CFO, 30 September 2014
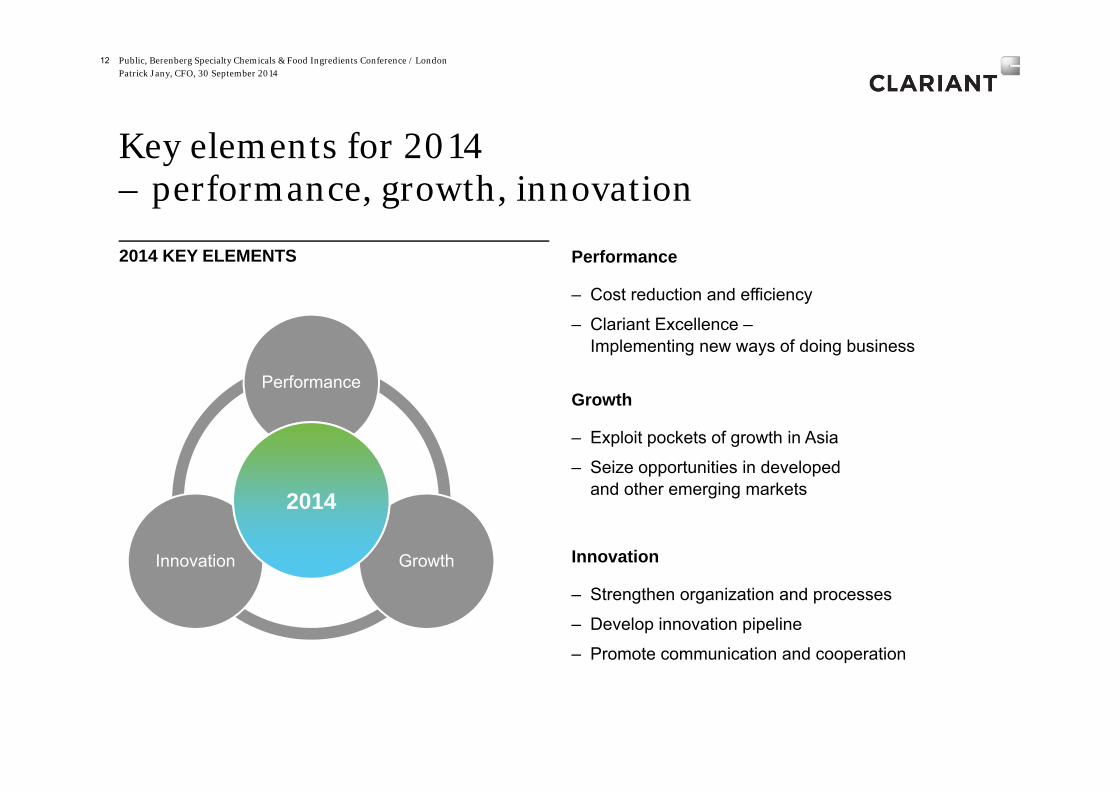
Key elements for 2014 – performance, growth, innovation
12
GrowthInnovation
Performance
2014
Performance
– Cost reduction and efficiency
– Clariant Excellence –Implementing new ways of doing business
Growth
– Exploit pockets of growth in Asia
– Seize opportunities in developed and other emerging markets
Innovation
– Strengthen organization and processes
– Develop innovation pipeline
– Promote communication and cooperation
2014 KEY ELEMENTS
Public, Berenberg Specialty Chemicals & Food Ingredients Conference / London

Patrick Jany, CFO, 30 September 2014
Performance – higher profitability expected from cost efficiency and growth investments
Public, Berenberg Specialty Chemicals & Food Ingredients Conference / London13
– Cost discipline across the company
– Efficient delivery of business services
– Avoiding remnant costs from divestments
– Investments into innovation and capexprojects
Clariant Excellence initiative:
Connecting the dots – operational improvements by systematically linking all Functional Excellence Programs (Innovation, Commercial and Operational Excellence)
Intesifiy Lean
Operational Excellence Commercial Excellence Innovation Excellence
Explore growth
Accelerate business transformation
12
3
KEY METRICS IMPROVED

Patrick Jany, CFO, 30 September 2014
Growth – differentiated business steering: investment geared towards attractive markets …
14
COMPETITIVE POSITION% Share of revenues 2013
INDUSTRY ATTRACTIVENESS
Harvest
Watch List Improve
Grow39%
6%
34%
21%
25% of 2014 investments*
52% of 2014 investments*
23% of 2014 investments*
* Distribution of growth capex 2014E
Public, Berenberg Specialty Chemicals & Food Ingredients Conference / London
Focus investments on key growth businesses
– Catalysts
– Crop Solutions
– Mining Solutions
– Oil Services
– Personal Care
– Bio-based Chemicals

Patrick Jany, CFO, 30 September 2014
… and growth regions
Public, Berenberg Specialty Chemicals & Food Ingredients Conference / London15
62% of investments in emerging markets and North America in 2014 vs. 36% in 2013

Patrick Jany, CFO, 30 September 2014
Growth – Major investment projects coming on stream in the next 1-2 years
– Focused investments on growth areas and niches to avoid overcapacities
16
PROJECT BUSINESS LOCATION INVESTMENT (M CHF)
ON STREAM
Polypropylene Catalyst production Catalysts Louisville (KY), USA > 100 2015
Glucamide production Consumer Care Gendorf, Germany 25-50 2015
Industrial Home Care expansion Ind. & Cons. Spec. Clear Lake, USA 25-50 2015
Licocene Performance Polymer Additives Höchst, Germany < 25 2016
Industrial Home Care expansion Ind. & Cons. Spec. Dayabay, China < 25 2016
High performance pigments Pigments Zhenjiang, China 25-50 2016
Additives project Additives Zhenjiang, China 25-50 2016
Public, Berenberg Specialty Chemicals & Food Ingredients Conference / London

Patrick Jany, CFO, 30 September 2014
Innovation and R&D for profitable growth
Public, Berenberg Specialty Chemicals & Food Ingredients Conference / London17
950People in R&D (end of 2013)
12Global R&D Centers
>7 000Patents
3.3%of Group sales 2013
>50Technical Application Centersaround the world
>130Scientific collaborations
Innovation figures Megatrends as drivers for innovation
ENVIRONMENTPROTECTION
GLOBALIZATION & URBANIZATION
RESOURCES & ENERGY

Patrick Jany, CFO, 30 September 2014
Innovation focuses on attractive segments linked to megatrends
18 Public, Berenberg Specialty Chemicals & Food Ingredients Conference / London
ATTRACTIVE MARKET SEGMENTS
Shale Oil & GasBio-based Chemicals
Functional Packaging
Oil Production and Mining
Coal-to-Gas/Chemicals
Nutrition & Health
Public
Patrick Jany, CFO30 September 2014
Financial Targets

Patrick Jany, CFO, 30 September 2014
Priority on cash generation and a conservative financing policy
Solid cash profile and increased focus on cash generation:
– in 2014 through CHF 200-250 million cash proceeds from disposals
– 2014/15 through improved profitability and cash focused incentives
– 2015 onwards through high-margin innovation driven growth
20
0 0
0.30 0.33 0.36
2009 2010 2011 2012 2013
SOLID MATURITY PROFILE* – POTENTIAL TO REDUCE DEBTin CHF million
ESTABLISHING A TRACK RECORDDividend per share (CHF)
820
20099
249 284174
605
324150
8
16 16
12
266
13 7
2 12
2
0100200300400500600700800900
Cash* 2014 2015 2016 2017 2018 2019 2020 2021 2022 2023 2024
DerivativesUncommitted & other loans / NWC facilitiesLong-term loansCertificate of IndebtednessEUR BondCHF BondCash*
Liquidity Maturities of Financial Debt
* including near cash assets and financial instruments with positive fair values reported under other current assets, status end of June 2014
Public, Berenberg Specialty Chemicals & Food Ingredients Conference / London

Patrick Jany, CFO, 30 September 2014
Delivering on the next performance steps and preparing for sustainable value creation
– Profitability increase – implementation of business-specific strategies, cost efficiency
– Focus on cash generation: significantly improved free cash flow in 2015
– Long-term, conservative financing policy allows financial flexibility
– Financial flexibility – basis for investments into growth i.e. innovation, growth opportunities, bolt-on acquisitions
– Based on improved profitability, solid cash generation, and a shortened balance sheet, focus will shift to sustainable ROIC-improvement
21
PROFITABLE GROWTH
EBITDA improvement
2011 2012 2013 2014 2015
ROIC improvementFree cash flow generation
2016
Public, Berenberg Specialty Chemicals & Food Ingredients Conference / London

Public
Patrick Jany, CFO30 September 2014
First Half-Year 2014
Patrick Jany, CFO, 30 September 201423 Public, Berenberg Specialty Chemicals & Food Ingredients Conference / London
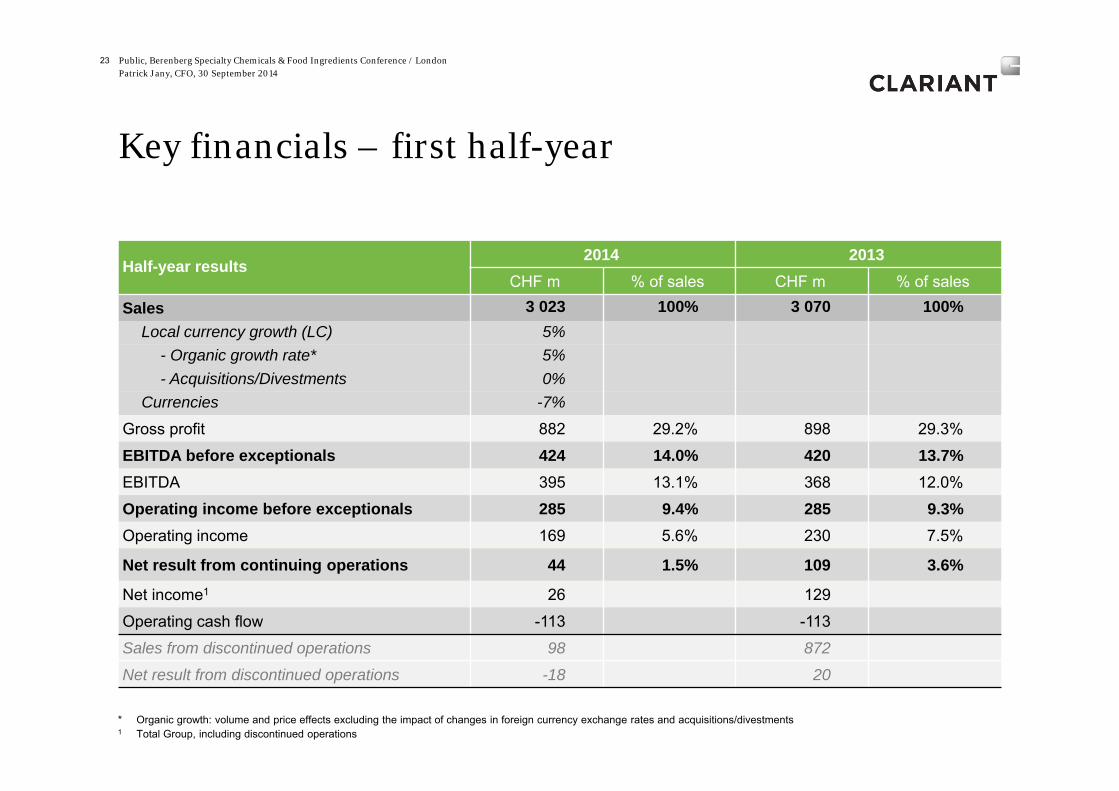
Key financials – first half-year
Half-year results2014 2013
CHF m % of sales CHF m % of sales
Sales 3 023 100% 3 070 100%Local currency growth (LC) 5%
- Organic growth rate* 5%- Acquisitions/Divestments 0%
Currencies -7%
Gross profit 882 29.2% 898 29.3%
EBITDA before exceptionals 424 14.0% 420 13.7%EBITDA 395 13.1% 368 12.0%
Operating income before exceptionals 285 9.4% 285 9.3%Operating income 169 5.6% 230 7.5%
Net result from continuing operations 44 1.5% 109 3.6%
Net income1 26 129
Operating cash flow -113 -113
Sales from discontinued operations 98 872
Net result from discontinued operations -18 20
* Organic growth: volume and price effects excluding the impact of changes in foreign currency exchange rates and acquisitions/divestments1 Total Group, including discontinued operations

Patrick Jany, CFO, 30 September 2014
Sales in CHF m
H1 2014
Change (LC)
H12013
315 316
24 Public, Berenberg Specialty Chemicals & Food Ingredients Conference / London
Business Area performance – first half-year
Sales in CHF m
H1 2014
Change (LC)
H12013
775 811
Sales in CHF m
H1 2014
Change (LC)
H12013
621 634
EBITDA bef. exc. in CHF m
H1 2014
Change (LC)
H12013
12215.7%
13817.0%
EBITDA bef. exc. in CHF m
H1 2014
Change (LC)
H12013
8613.8%
7111.2%
Care Chemicals
Natural Resources
EBITDA bef. exc. in CHF m
H1 2014
Change (LC)
H12013
7925.1%
7022.2%
Catalysis & Energy
+2% +23%
Sales in CHF m
H1 2014
Change (LC)
H12013
1 312 1 309
EBITDA bef. exc. in CHF m
H1 2014
Change (LC)
H12013
19114.6%
19114.6%
Plastics & Coatings
–5%
+6% +6%+8%
+6%
+36%
Patrick Jany, CFO, 30 September 2014
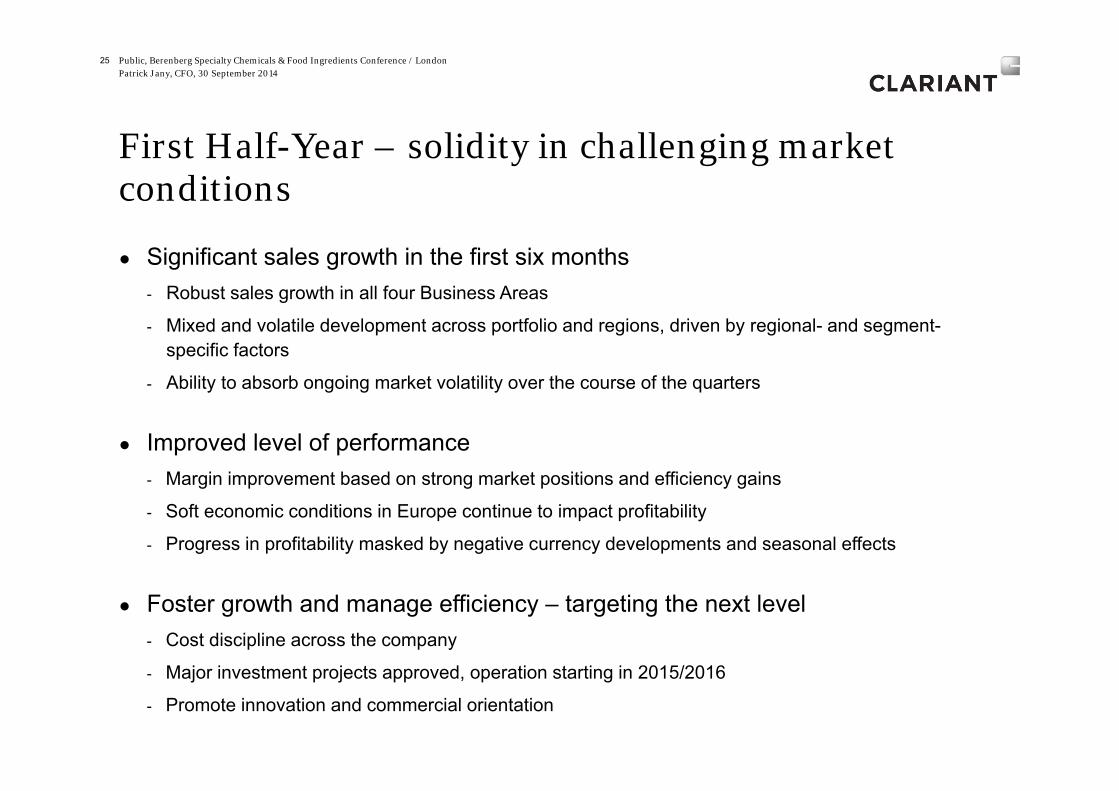
First Half-Year – solidity in challenging market conditions
● Significant sales growth in the first six months- Robust sales growth in all four Business Areas
- Mixed and volatile development across portfolio and regions, driven by regional- and segment-specific factors
- Ability to absorb ongoing market volatility over the course of the quarters
● Improved level of performance- Margin improvement based on strong market positions and efficiency gains
- Soft economic conditions in Europe continue to impact profitability
- Progress in profitability masked by negative currency developments and seasonal effects
● Foster growth and manage efficiency – targeting the next level- Cost discipline across the company
- Major investment projects approved, operation starting in 2015/2016
- Promote innovation and commercial orientation
25 Public, Berenberg Specialty Chemicals & Food Ingredients Conference / London

Patrick Jany, CFO, 30 September 2014
Sales growth driven by volumes – headwinds from FX in the first half-year
Public, Berenberg Specialty Chemicals & Food Ingredients Conference / London26
Sales mix H1 2014 Sales growth in local currencies
Volume4%
Price1% Acq./Div.
0%
Currency-7%
Sales H1 2014: CHF 3 023 m
Latin America448 / +14%
Europe1173 / -1%
North America 485 / +3% Asia / Pacific
679 / +10%
Middle East& Africa 238 / +12%
Germany 431 / −3%
China 253/ +22%
Brazil 194 / +4%
all figures continuing operations
Emerging Markets Mature Markets
− Good LC sales growth driven by 4% higher volumes and 1% higher prices, overcompensated by unfavorable currency developments
− Double-digit sales growth in the emerging markets, weaker growth in Brazil
− Persistent weakness in Europe; Germany and Eastern Europe softened

Public
Patrick Jany, CFO30 September 2014
Second Quarter 2014

Patrick Jany, CFO, 30 September 201428 Public, Berenberg Specialty Chemicals & Food Ingredients Conference / London
Key financials – second quarter
Second Quarter2014 2013
CHF m % of sales CHF m % of sales
Sales 1 531 100% 1 544 100%Local currency growth (LC) 6%
- Organic growth rate* 6%- Acquisitions/Divestments 0%
Currencies -7%
Gross profit 451 29.5% 453 29.3%
EBITDA before exceptionals 214 14.0% 211 13.7%EBITDA 197 12.9% 180 11.7%
Operating income before exceptionals 145 9.5% 144 9.3%Operating income 128 8.4% 111 7.2%
Net result from continuing operations 83 5.4% 71 4.6%
Net income1 74 79
Operating cash flow -62 -41
Sales from discontinued operations 32 451
Net result from discontinued operations -9 8
* Organic growth: volume and price effects excluding the impact of changes in foreign currency exchange rates and acquisitions/divestments1 Total Group, including discontinued operations

Patrick Jany, CFO, 30 September 2014
Sales in CHF m
Q2 2014
Change (LC)
Q22013
195 197
29 Public, Berenberg Specialty Chemicals & Food Ingredients Conference / London
Business Area performance – second quarter
Sales in CHF m
Q2 2014
Change (LC)
Q22013
359 370
Sales in CHF m
Q2 2014
Change (LC)
Q22013
307 309
EBITDA bef. exc. in CHF m
Q2 2014
Change (LC)
Q22013
5515.3%
5915.9%
EBITDA bef. exc. in CHF m
Q2 2014
Change (LC)
Q22013
3912.7%
299.4%
Care Chemicals
Natural Resources
EBITDA bef. exc. in CHF m
Q2 2014
Change (LC)
Q22013
5528.2%
5125.9%
Catalysis & Energy
3% 14%
Sales in CHF m
Q2 2014
Change (LC)
Q22013
670 668
EBITDA bef. exc. in CHF m
Q2 2014
Change (LC)
Q22013
9414.0%
9614.4%
Plastics & Coatings
– 1%
5%9%
5%
55% 6%

Patrick Jany, CFO, 30 September 2014
Sales growth driven by volumes – headwinds from FX
Public, Berenberg Specialty Chemicals & Food Ingredients Conference / London30
Sales mix Q2 2014 Sales growth in local currenciesVolume
5%
Price1% Acq./Div.
0%
Currency-7%
− Organic sales growth in LC driven by 5% higher volumes and 1% higher prices
− Double-digit sales growth in the emerging markets China, MEA and LATAM; solid growth in North America
− Brazil with further slowing growth (+5% in Q1)
− Europe slightly weaker, due to negative growth in Germany and Eastern Europe
Sales Q2 2014: CHF 1 531 m
Latin America240 / +13%
Europe565 / –1%
North America 229 / +6% Asia / Pacific
365 / +9%
Middle East& Africa 132 / +15%
Germany 204 / −2%
China 144/ +16%
Brazil 103/ +3%
all figures continuing operations
Emerging Markets Mature Markets

Patrick Jany, CFO, 30 September 2014
LC sales growth EBITDA* margin
Care Chemicals• Industrial Applications and Consumer Care businesses achieved
solid growth, the latter driven by continuing double-digit growth in the Crop Solution segment
• EBITDA* margin at 15.3% compared to 15.9% due to an unfavorable currency effect, weak market prices for mono-ethylene-glycol (MEG) and lower de-icing sales
+3% 15.3%
Catalysis & Energy• Particularly good sales growth in the Middle East
• Strong sales growth in the Petrochemicals business; beneficial re-fill cycle
• Sales in Energy Storage significantly above prior-year level
• EBITDA* margin increased due to lower production costs and less dilution from Energy Storage
+5% 28.2%
31
Strong margins in Catalysis & Energy, solid sales growth in Care Chemicals
* before exceptional items
Public, Berenberg Specialty Chemicals & Food Ingredients Conference / London

Patrick Jany, CFO, 30 September 2014
LC sales growth EBITDA* margin
Natural Resources• Oil & Mining Services business with double-digit sales growth
• Mining Services reported good double-digit sales growth: market share gains, mainly in Latin America and Australia
• EBITDA* margin increased significantly on higher volumes and sales prices, a lower cost base and a better product mix, more than offsetting a significant currency impact
+9% 12.7%
Plastics & Coatings• All three businesses Pigments, Masterbatches, and Additives
contributed to growth
• Heterogeneous regional development from business to business
• EBITDA* margin below previous-year level as higher volumes could not compensate for unfavorable currency developments
+6% 14.0%
32
EBITDA* margin improvement in Natural Resources, volumes recovered in Plastics & Coatings
* before exceptional items
Public, Berenberg Specialty Chemicals & Food Ingredients Conference / London

Public
Patrick Jany, CFO30 September 2014
Summary & Outlook

Patrick Jany, CFO, 30 September 2014
Summary
34
Achievements
Priorities 2014 –moving along the profitable growth path
− Performance: more profitable portfolio and improved operational efficiency
− Innovation: 260 innovation projects with more than CHF 1.6 billion sales potential in total
− Sustainability introduced as 5th strategic pillar – essential to achieve company targets
− Increase profitability – on the basis of a competitive cost position
− Improve free cash flow generation – manage EBITDA conversion into free cash flow
− Intensify organic growth – investments in short-term business opportunities and developing the long-term innovation pipeline
Public, Berenberg Specialty Chemicals & Food Ingredients Conference / London
Patrick Jany, CFO, 30 September 2014
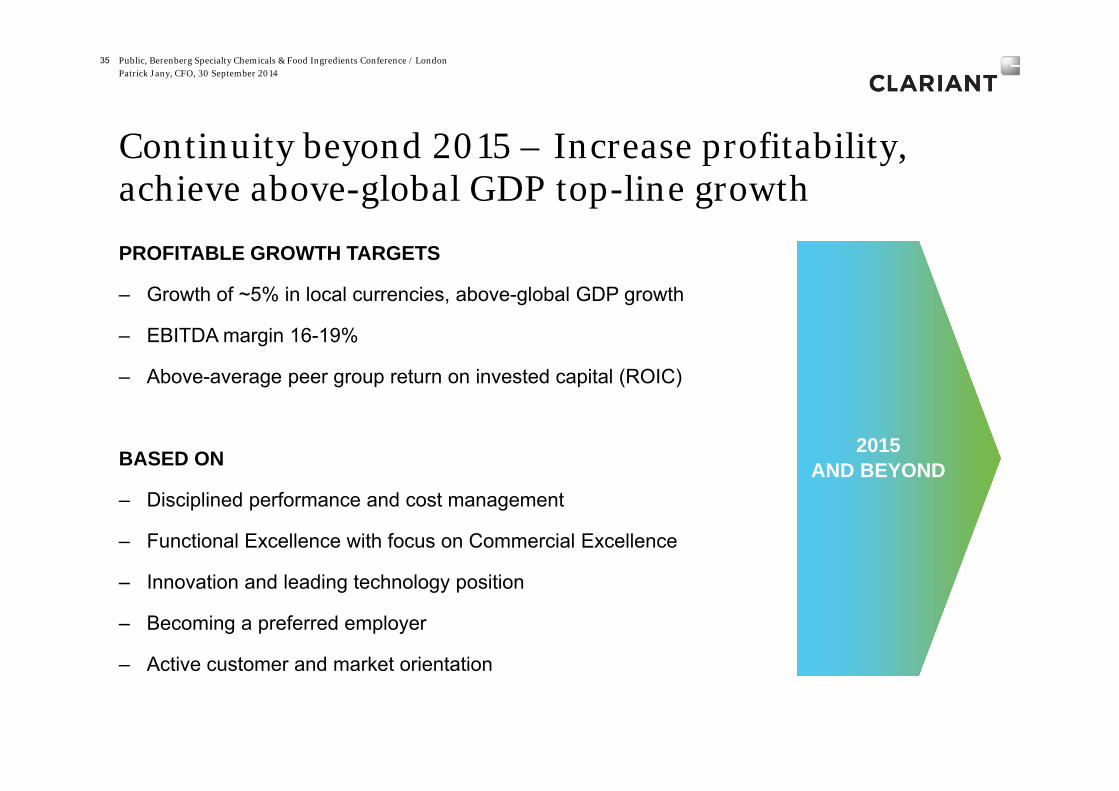
Continuity beyond 2015 – Increase profitability, achieve above-global GDP top-line growth
35
PROFITABLE GROWTH TARGETS
– Growth of ~5% in local currencies, above-global GDP growth
– EBITDA margin 16-19%
– Above-average peer group return on invested capital (ROIC)
BASED ON
– Disciplined performance and cost management
– Functional Excellence with focus on Commercial Excellence
– Innovation and leading technology position
– Becoming a preferred employer
– Active customer and market orientation
2015 AND BEYOND
Public, Berenberg Specialty Chemicals & Food Ingredients Conference / London

Patrick Jany, CFO, 30 September 2014
Clariant’s macroeconomic view
− A challenging business environment similar to the first half-year, characterized by a heterogeneous development in the different regions
− Favorable but mixed emerging market economies, with volatile currencies
− Europe flat, moderate growth in the United States
Outlook 2014 – Clariant will further progress in sales and profitability
− Focus on profitably growing the four Business Areas, on cost efficiency and on promoting innovation
− Full-year 2014: low to mid single-digit sales growth in local currencies and an EBITDA margin before exceptional items above full-year 2013
2015 and beyond
− Target to reach the top tier of the specialty chemicals industry by 2015, i.e. an EBITDA margin before exceptional items range of 16% to 19% and a return on invested capital (ROIC) above peer group average
36
Challenging trading conditions to persist through the remainder of the year
Public, Berenberg Specialty Chemicals & Food Ingredients Conference / London

Public
Patrick Jany, CFO30 September 2014
Backup Slides

Patrick Jany, CFO, 30 September 201438
Sales and cost structure*
Global cost distribution in %
* These distributions represent an approximation to total cash in- and out-flows and are closely linked to transaction exposures for H1 2014. Including discontinued operations
EUR49%
USD31%
CHF4%
JPY2%
Emerging markets
14%
EUR43%
USD37%
CHF0% JPY
3%
Emerging markets
17%
Global sales distribution in %
Public, Berenberg Specialty Chemicals & Food Ingredients Conference / London
Patrick Jany, CFO, 30 September 2014
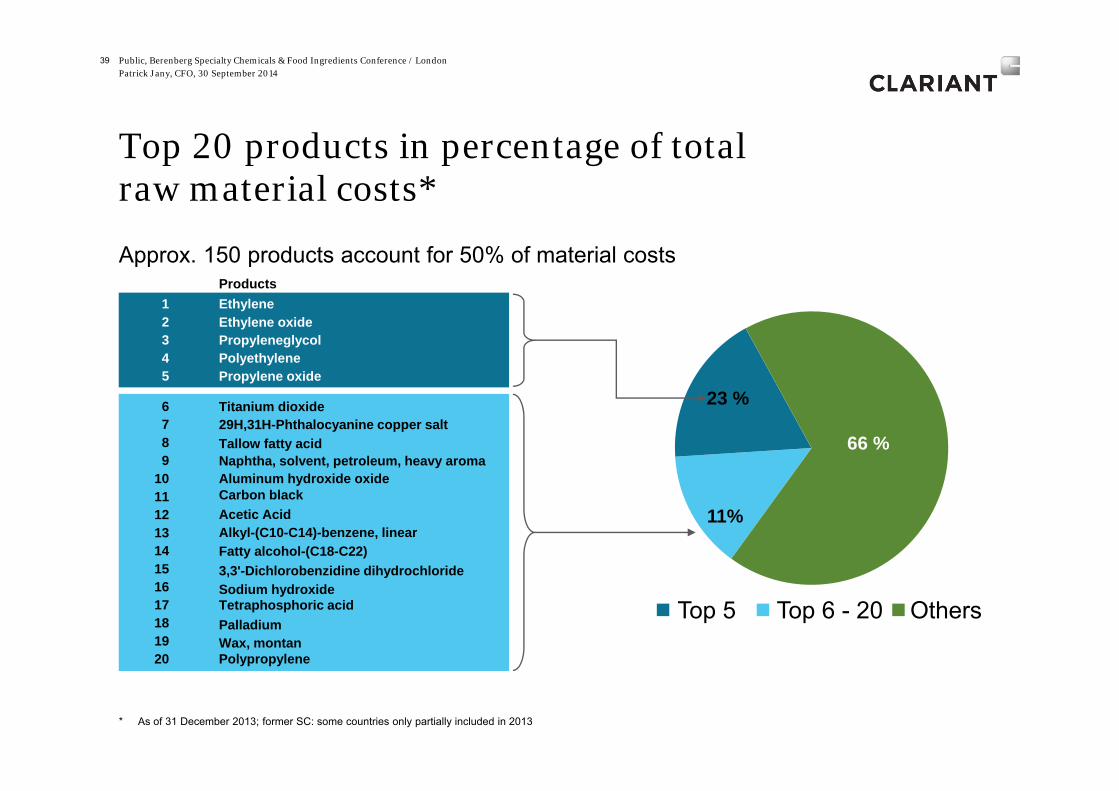
Approx. 150 products account for 50% of material costs
39
Top 20 products in percentage of total raw material costs*
11%
23 %
1 Ethylene2 Ethylene oxide3 Propyleneglycol4 Polyethylene5 Propylene oxide
6 Titanium dioxide7
Tallow fatty acid8
3,3'-Dichlorobenzidine dihydrochloride
9
29H,31H-Phthalocyanine copper salt
10 Aluminum hydroxide oxide11
Naphtha, solvent, petroleum, heavy aroma
12Alkyl-(C10-C14)-benzene, linear13
Wax, montan
14
Carbon black
15
Acetic Acid
16 Sodium hydroxide17 Tetraphosphoric acid18 Palladium19
Fatty alcohol-(C18-C22)
20 Polypropylene
66 %
Top 5 Top 6 - 20 Others
Products
* As of 31 December 2013; former SC: some countries only partially included in 2013
Public, Berenberg Specialty Chemicals & Food Ingredients Conference / London

Patrick Jany, CFO, 30 September 2014
Regional distribution of Clariant’s shareholder baseas of 31 December 2013
40
Switzerland 38%
Germany 17%
United Kingdom 9%
Rest of Europe 10%
Europe Total 74%
Americas Total 7%
Rest of the World 2%
Unidentified Shareholdings 17%
Switzerland38%
Germany17%
United Kingdom9%
Rest of Europe10%
Americas7%
Rest of the World2%
Unidentified Shareholdings
17%
Public, Berenberg Specialty Chemicals & Food Ingredients Conference / London

Patrick Jany, CFO, 30 September 2014
,1.3
,2.1
,2.3
,3.0
,3.6
,3.8
,5.3
,5.9
,6.0
,6.3
,6.3
,6.7
,6.7
,7.0
,7.1
,7.1
,7.2
,7.4
,7.7
,7.8
,8.1
,8.2
,9.0
,9.5
9.5
,9.6
,9.7
,9.7
,10.
2,1
0.6
,11.
2,1
1.7
,11.
7,1
2.3
,12.
6,1
2.7
,12.
9,1
2.9
,13.
0,1
3.3
,14.
1,1
4.5
,15.
1,1
6.2
,16.
3,1
6.6
,17.
2,2
0.4
,23.
8,2
9.3
41
Improved ROIC in relation to peers
ROIC 2013 by peer (in %)
2013 Median 9.5%
Clariant ROIC2013: 9.5%
Source: Annual Reports; Corporate Controlling2012: Clariant ROIC: 8.5%, Median 10.5%, WACC 8.2%
Cro
daEM
SLy
onde
ll Ba
sell
Hon
eyw
ell
Alb
emar
leIC
LC
elan
ese
East
man
Ferr
oS
herw
in W
illiam
sPP
GVa
lspa
rH
B F
ulle
rD
u P
ont
John
son
Mat
they
Cyt
ecBA
SFS
ymris
ePo
lyon
eE
voni
kA
ltana
Axi
all
Um
icor
eW
est L
ake
Che
mAk
zo
Cla
riant
LG C
hem
ical
sR
ockw
ood
Om
nova
AZ
Ele
ctro
nics
Bras
kem
Shin
etsu
Dow
Bor
ealis
DS
MH
unts
man
nS
chul
man
Sol
vay
Ashl
and
Lonz
aC
hem
tura
Cab
otH
& R
DIC
Kem
iraW
acke
rK
rato
nLa
nxes
sM
itsub
ishi
Mits
ui
Public, Berenberg Specialty Chemicals & Food Ingredients Conference / London

Patrick Jany, CFO, 30 September 2014
9.7%
7.5%
12.7%13.2% 13.5%
14.1%
6%
8%
10%
12%
14%
16%
18%
20%
2008 2009 2010 2011 2012 2013
42
Historic EBITDA* Development
* before exceptional items, as reported
Public, Berenberg Specialty Chemicals & Food Ingredients Conference / London

Patrick Jany, CFO, 30 September 2014
30 October 2014 Nine Months 2014 Results
18 February 2015 Full-Year 2014 Results
31 March 2015 Annual General Meeting
43
Calendar of upcoming corporate events
Public, Berenberg Specialty Chemicals & Food Ingredients Conference / London
Patrick Jany, CFO, 30 September 2014
IR contacts
44
Dr. Ulrich SteinerHead of Investor Relations
Phone +41 (0) 61 469 67 45Mobile +41 (0) 79 297 27 07E-mail [email protected]
Dr. Siegfried SchwirzerDeputy Head Investor Relations
Phone +41 (0) 61 469 67 49Mobile +41 (0) 79 718 45 98 E-mail [email protected]
Marco FerraroInvestor Relations Officer
Phone +41 (0) 61 469 64 11Mobile +41 (0) 79 931 03 98E-mail [email protected]
Edith Schwab
Phone +41 (0) 61 469 67 48E-mail [email protected]
Mirjam Grieder
Phone +41 (0) 61 469 67 66E-mail [email protected]
Public, Berenberg Specialty Chemicals & Food Ingredients Conference / London

Patrick Jany, CFO, 30 September 2014
Our Publications
Public, Berenberg Specialty Chemicals & Food Ingredients Conference / London45
iPad App: www.clariant.com/IRapp Factbook: www.clariant.com/factbook
Patrick Jany, CFO, 30 September 2014
This presentation contains certain statements that are neither reported financial results nor other historical information. This presentation also includes forward-looking statements.
Because these forward-looking statements are subject to risks and uncertainties, actual future results may differ materially from those expressed in or implied by the statements. Many of these risks and uncertainties relate to factors that are beyond Clariant’s ability to control or estimate precisely, such as future market conditions, currency fluctuations, the behavior of other market participants, the actions of governmental regulators and other risk factors such as: the timing and strength of new product offerings; pricing strategies of competitors; the Company's ability to continue to receive adequate products from its vendors on acceptable terms, or at all, and to continue to obtain sufficient financing to meet its liquidity needs; and changes in the political, social and regulatory framework in which the Company operates or in economic or technological trends or conditions, including currency fluctuations, inflation and consumer confidence, on a global, regional or national basis.
Readers are cautioned not to place undue reliance on these forward-looking statements, which speak only as of the date of this document. Clariant does not undertake any obligation to publicly release any revisions to these forward-looking statements to reflect events or circumstances after the date of these materials.
46
Disclaimer
Public, Berenberg Specialty Chemicals & Food Ingredients Conference / London