Mining machinery - Berenberg
38
BERENBERG EQUITY RESEARCH Mining machinery Process plant exposure preferable to mining operations Alexander Virgo Analyst +44 20 3207 7856 [email protected] Chris Armstrong Specialist Sales +44 20 3207 7809 [email protected] Kaj Alftan Specialist Sales +44 20 3207 7879 [email protected] 2 July 2013 Capital Goods & Industrial Engineering
Transcript of Mining machinery - Berenberg
BERENBERG EQUITY RESEARCH
Mining machinery
Process plant exposure preferable to mining operations
Alexander Virgo
Analyst
+44 20 3207 7856
Chris Armstrong
Specialist Sales
+44 20 3207 7809
Kaj Alftan
Specialist Sales
+44 20 3207 7879
2 July 2013
Capital Goods & Industrial Engineering
What is Berenberg THOUGHT LEADERSHIP?
Berenberg’s analysts are recognised by investors and by corporates for their in-depth research into the industries they cover.
Our THOUGHT LEADERSHIP brand will highlight the deep-dive fundamental industry research that we feel is most important to informing our forecasts and ratings.
For our disclosures in respect of section 34b of the German Securities Trading Act (Wertpapierhandelsgesetz – WpHG) and our disclaimer please see the end of this document. Please note that the use of this research report is subject to the conditions and restrictions set forth in the disclosures and the disclaimer at the end of this document.

Mining machinery Capital Goods & Industrial Engineering
Table of contents
Process plant exposure preferable to mining operations 4
The changing face of mining investment 7
Focus on brownfield investment favours mining equipment 11
Opex budgets favour process plant exposure 16
Equipment characteristics: consumables vs spares and service 20
Assessing portfolio exposure 25
Atlas Copco: Good aftermarket exposure, but fool’s gold? 29
Metso: Grinding a strong position; diamond in the rough 30
Sandvik: Underperformance belies breadth of portfolio 31
Weir: Strongest aftermarket revenue exposure 32
Disclosures in respect of section 34b of the German Securities Trading Act (Wertpapierhandelsgesetz – WpHG) 33
Contacts: Investment Banking 37

Mining machinery Capital Goods & Industrial Engineering
4
Process plant exposure preferable to mining operations
Investors should seek exposure to mining equipment suppliers with ●high exposure to the fast-growing maintenance capex budgets of the miners. Process plant equipment offers more high-margin aftermarket business and greater stability than mining operations. In this light, we reiterate our Buy recommendations on Metso and Sandvik and highlight Weir as favourably exposed. We retain concerns over investors’ faith in the robustness of Atlas Copco’s business. Analysis of feasibility studies and equipment operating costs supports our preference for process plant exposure.
Mining capex emphasis shifting fast to maintenance: ●Maintenance capex has grown at a 29% CAGR since 2009 and is expected to grow at a 27% CAGR 2012-14E as capex budgets are refocused towards maintenance capex and away from expansion projects. Expansion capex is expected to decline 23% and 38% in 2013E and 2014E. Greenfield investment over the last 5-8 years has seen significant growth in the installed base of equipment, which miners now need to optimise and maintain, to the benefit of both revenue growth and profitability of the original equipment suppliers.
Shift from greenfield to brownfield expansion more beneficial ●for mining equipment suppliers: The likes of Sandvik and Atlas Copco can still see original equipment orders as brownfield expansion projects generally focus on extending mining operations for existing processing plants. Despite brownfield investment typically being 20-25% of the greenfield capex required for equivalent mine production, mining equipment procurement can be similar in absolute terms, reflecting no need for new infrastructure or process plant.
Opex budgets favour process plant exposure: High utilisation rates ●(90%+) and consequent requirements for equipment availability (95%+) mean the process plant generally offers more favourable aftermarket revenue streams for equipment suppliers – Metso and Weir are best positioned. Process plant equipment on average requires 2x the level of wear parts of mining equipment in normal production, while spare parts (ie maintenance) are also typically 2x mining equipment requirements through the life of the mine. Low headcount and high fixed costs of process plants make mining operations the first point of focus for miners in terms of cost savings, suggesting Atlas Copco’s portfolio could actually be at greater risk in the near term.
Preference for process equipment exposure supported by ●analysis of equipment operating characteristics: Equipment with the highest ratio of stay-in-business capital (defined as spare parts, wear parts and replacement capex) to initial capex is the most attractive from a product portfolio standpoint. Pumps, cyclones and grinding mills exhibit the best characteristics, favouring Metso and Weir; Sandvik, too, though to a lesser degree.
Portfolio assessment points to Weir and Metso as best positioned ●in terms of high-margin aftermarket business and exposure to process plant equipment across balanced minerals exposure. Sandvik benefits from some exposure to process equipment, while its Systems business offers stability, albeit at lower margins. Atlas Copco has the highest product exposure to mining operations, particularly gold, but benefits from high aftermarket exposure and a broad non-mining portfolio.
Atlas Copco AB
Sell Current price
SEK 162.50 Price target
SEK 165.00 01/07/2013 Stockholm Close
Metso Oyj
Buy Current price
EUR 26.09 Price target
EUR 38.00 01/07/2013 Helsinki Close
Sandvik AB
Buy Current price
SEK 80.90 Price target
SEK 115.00 01/07/2013 Stockholm Close
Weir Group plc
Hold Current price
GBp 2,187 Price target
GBp 2,515 01/07/2013 London Close
Rating system: Relative
2 July 2013
Alexander Virgo Analyst +44 20 3207 7856 [email protected]
Chris Armstrong Specialist Sales +44 20 3207 7809 [email protected]
Mining machinery Capital Goods & Industrial Engineering
5
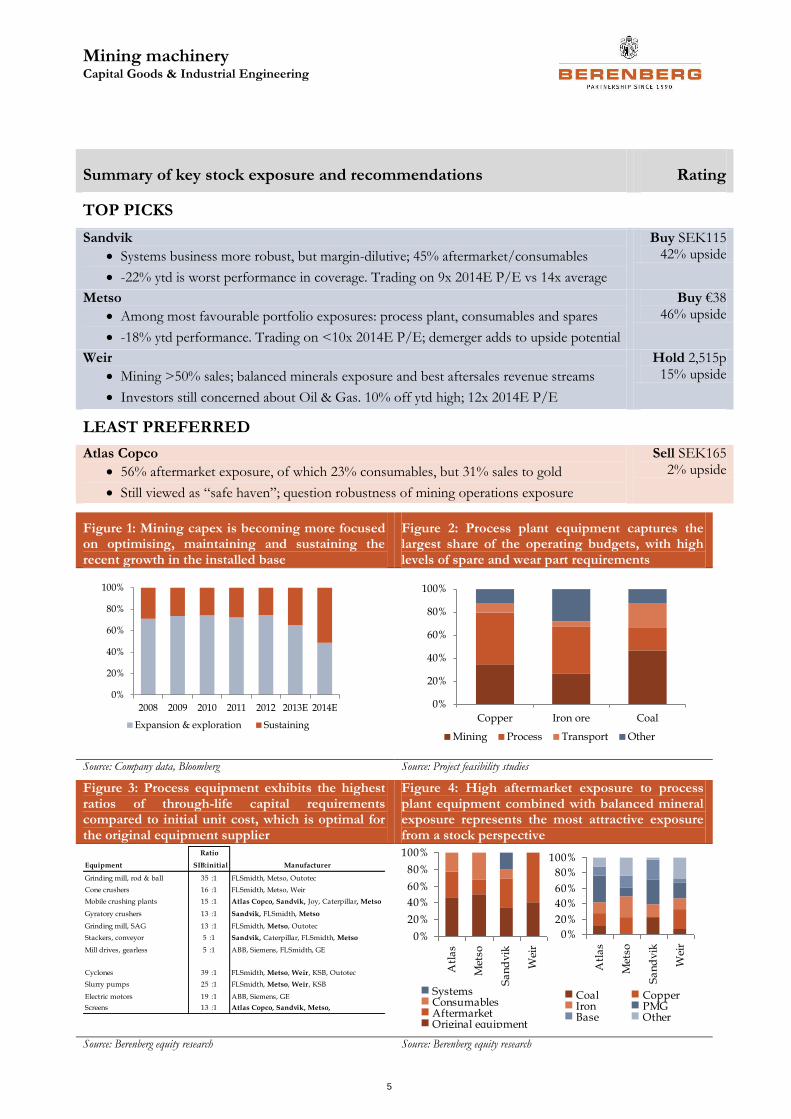
Summary of key stock exposure and recommendations Rating
TOP PICKS
Sandvik
Systems business more robust, but margin-dilutive; 45% aftermarket/consumables
-22% ytd is worst performance in coverage. Trading on 9x 2014E P/E vs 14x average
Buy SEK115 42% upside
Metso
Among most favourable portfolio exposures: process plant, consumables and spares
-18% ytd performance. Trading on <10x 2014E P/E; demerger adds to upside potential
Buy €38 46% upside
Weir
Mining >50% sales; balanced minerals exposure and best aftersales revenue streams
Investors still concerned about Oil & Gas. 10% off ytd high; 12x 2014E P/E
Hold 2,515p 15% upside
LEAST PREFERRED
Atlas Copco
56% aftermarket exposure, of which 23% consumables, but 31% sales to gold
Still viewed as “safe haven”; question robustness of mining operations exposure
Sell SEK165 2% upside
Figure 1: Mining capex is becoming more focused on optimising, maintaining and sustaining the recent growth in the installed base
Figure 2: Process plant equipment captures the largest share of the operating budgets, with high levels of spare and wear part requirements
Source: Company data, Bloomberg Source: Project feasibility studies
Figure 3: Process equipment exhibits the highest ratios of through-life capital requirements compared to initial unit cost, which is optimal for the original equipment supplier
Figure 4: High aftermarket exposure to process plant equipment combined with balanced mineral exposure represents the most attractive exposure from a stock perspective
Source: Berenberg equity research Source: Berenberg equity research
0%
20%
40%
60%
80%
100%
2008 2009 2010 2011 2012 2013E 2014E
Expansion & exploration Sustaining
0%
20%
40%
60%
80%
100%
Copper Iron ore Coal
Mining Process Transport Other
Ratio
Equipment SIB:initial Manufacturer
Grinding mill, rod & ball 35 :1 FLSmidth, Metso, Outotec
Cone crushers 16 :1 FLSmidth, Metso, Weir
Mobile crushing plants 15 :1 Atlas Copco, Sandvik, Joy, Caterpillar, Metso
Gyratory crushers 13 :1 Sandvik, FLSmidth, Metso
Grinding mill, SAG 13 :1 FLSmidth, Metso, Outotec
Stackers, conveyor 5 :1 Sandvik, Caterpillar, FLSmidth, Metso
Mill drives, gearless 5 :1 ABB, Siemens, FLSmidth, GE
Cyclones 39 :1 FLSmidth, Metso, Weir, KSB, Outotec
Slurry pumps 25 :1 FLSmidth, Metso, Weir, KSB
Electric motors 19 :1 ABB, Siemens, GE
Screens 13 :1 Atlas Copco, Sandvik, Metso,
0%
20%
40%
60%
80%
100%
Atl
as
Met
so
Sa
nd
vik
Wei
r
SystemsConsumablesAftermarketOriginal equipment
0%
20%
40%
60%
80%
100%
Atl
as
Met
so
Sa
nd
vik
Wei
r
Coal CopperIron PMGBase Other

Mining machinery Capital Goods & Industrial Engineering
6
Figure 5: Mapping the equipment suppliers’ exposure to the mining processes and their key characteristics
Source: Company data; for disclosures, historical price targets and rating changes pertaining to the companies included in this table, please visit our disclosure listing page on our website at: https://www.berenberg.de/cgi-bin/compliance.cgi?rm=comp_start&lang=englisch
Exploration Development Extraction Materials Handling Comminution Separation Refining
5% greenfield capital 65% greenfield capital 2% greenfield capital 10% greenfield capital 6% greenfield capital 6% greenfield capital 6% greenfield capital
6% sustaining capex 54% sustaining capex 40% sustaining capex
3% operating costs 37% operating costs 40% operating costs 8% operating costs
Exploration for Drilling & modelling Mining of the ore body Mined minerals transport Materials are crushed & Flotation, leaching, Refining to increase
mineral resources of the ore body - rock breaking to processing site ground to achieve grades sedimentation, filtration mineral concentration
- remote sensing - selection of right - surface mining - loaders, trucks, trains - grinders, rollers
- geophysical test mining technique - underground mining - conveyor systems - pumps, vortices, cyclones
- samples - capital investment
- feasibility studies in mine infrastructure
Sandvik (Buy, SEK115)
Atlas Copco (Sell, SEK165)
Boart Longyear (n/r)
Furukawa (n/r)
Komatsu (n/r)
Joy Global (n/r)
Caterpillar (n/r)
Volvo (Buy, SEK116)
Metso (Buy, €38)
FL Smidth (n/r)
Outotec (n/r)
Citic Heavy (n/r) Citic Heavy
Terex (n/r)
Weir (Hold, 2,515p)
KSB (Hold, €450)
Sigdo Koppers (n/r)
One Steel (n/r)
GE Mining (n/r)
ABB (drives, process automation, plant construction) (Hold, CHF20.8)
Siemens (drives) (Buy, €94.5)
SKF (bearings, condition monitoring) (Buy, SEK185)
85% availability 95% availability
80% utilisation 90% utilisation
Hourly operating cost components (ex operator costs)
MRO parts MRO labour
Energy Tyres
Wear parts

Mining machinery Capital Goods & Industrial Engineering
7
The changing face of mining investment
Focus on maintenance capex and brownfield expansion
Debottlenecking or expanding existing mining operations is cheaper and more capital-efficient than starting from scratch, and miners’ capex guidance reflects a more cautious approach to capital allocation in the medium term than we have seen since the 2008/09 recovery. Since the middle of 2012, miners have been returning to an enduring theme of asset efficiency and process optimisation – brownfield investment.
Significant headwinds for new orders for equipment suppliers but this is well known
The significant investment made in new mining projects over the last 5-8 years has had a consequent effect on the capital required to sustain that investment, meaning operating budgets and maintenance capital requirements have increased. This should provide a larger addressable wallet for equipment suppliers in terms of aftersales support. Company guidance would suggest maintenance capex growth of 35% and 24% in 2013E and 2014E respectively.
Positive implications for suppliers with high aftermarket exposure and offering ways to improve operational efficiency
Investors have been focused on the end of the mining super-cycle for some time, but expectations are now low in terms of capex development. Consensus is 6-7% below company capex guidance for 2013E/14E, but assuming scepticism is reserved for expansion plans (and maintenance capex guidance is accepted), expectations for expansion capex declines in 2013E and 2014E are more than 20% and 40% respectively.
Consensus expectations for capex growth are already low
Shift from expansion to asset optimisation
With the return of uncertainty to the macro environment, falling commodity prices and questions being raised in the near term around Chinese growth in particular, miners are scaling back expansion plans and focusing on maximising the efficiency of their existing assets. Expansion, where it comes, is being pursued through brownfield investment in existing assets, rather than breaking new ground in greenfield projects. Maintenance – or stay-in-business (SIB) – capex continues to grow, driven in part by the significant investment in expansion and new assets over the last 5-8 years.
Following the huge government stimulus in China in 2010 and the strong rebound in the resources sector, miners returned to significant capital investment (Figure 6). The top five1 alone spent over $165bn of expansionary capex over the 2010-12 period. As the macro environment became more uncertain through 2012 and commodity prices began to fall, questions were raised over the extent of expansion on the supply side. Calls from shareholders for tighter capital management have been backed up with changes in top management at a number of the major miners. Capital allocation has become focused on reducing the operating cost per tonne rather than developing new assets.
Greenfield expansion is expensive: it typically requires significant investment in infrastructure such as roads, railways and ports as well as considerable time spent building and constructing the mine before it can even begin production. Technical
1 BHP Billiton, Rio Tinto, Anglo American, Vale and GlencoreXstrata.
Top 5 miners: expansion capex (US$bn)
Source: Company data inc. guidance
0
10
20
30
40
50
60
2008 2009 2010 2011 2012 2013E 2014E
Total Anglo American Xstrata
Rio Tinto Vale BHP
Top 5 miners: maintenance capex (US$bn)
Source: Company data inc. guidance
0
5
10
15
20
25
30
35
2008 2009 2010 2011 2012 2013E 2014E
Total Anglo American Xstrata
Rio Tinto Vale BHP
Capex growth expectations (yoy)
Source: Company data inc. guidance
-60%
-40%
-20%
0%
20%
40%
60%
2009 2010 2011 2012 2013E 2014E 2015E
Expansion & exploration Sustaining
Top 5 consensus Global listed capex
Expansion, where it is happening, is being pursued through brownfield projects, while maintenance capex continues to grow, servicing an increased installed base and targeting asset efficiency

Mining machinery Capital Goods & Industrial Engineering
8
reports, pre-feasibility studies, bankable feasibility studies (on the basis of which “go/no-go” decisions are made) and planning/permitting often taken 3-5 years before ground can even be broken on a new mine. It might take another 2-4 years before the first product is shipped from the mine and revenue begins to come in. Brownfield investment is often less than 20% of the costs of a new mine of equivalent capacity.
SIB investment can be made to optimise the method of mining, from investing in new, more efficient drilling, loading and hauling equipment, automating the hauling process (Rio Tinto’s autonomous trucks in the Pilbara save more than AUD100,000 per year, per truck in driver costs – there are over 150 trucks in the system and drivers are typically hired on a 2.25:1 ratio to account for double shifts and changeover efficiency) or shortening the haulage distance (to reduce fuel costs).
On the process side, optimising the crushing system, ensuring correct and efficient screens are in place and improving the wear life of the plant equipment can considerably enhance the throughput of the mill circuit and reduce the cost per tonne. Brownfield and maintenance investment typically sees much quicker payback – often within 12-18 months. Significant recent new mine development has led to an increase in the installed base of equipment and equipment waiting commissioning, suggesting the requirement for SIB capex is higher, and miners’ guidance reflects this shift (Figure 7).
Figure 6: Annual capex – top five miners ($m) Figure 7: Expansion vs maintenance capex
Source: Company data, including guidance Source: Company data, including guidance
The last three years have seen significant increases in expansion capex, from the top five miners (Figure 8) and from the mining industry as a whole. Capex grew at a 30% CAGR from 2009-12, but guidance suggests it is likely to shrink considerably over the next two years. On the maintenance side, growth since 2009 has also been strong (29% CAGR), and is expected to continue to develop over the next two years, reflecting the greater focus on brownfield investment, SIB capex and the larger installed base (Figure 9).
Figure 8: Expansion capex – top five ($bn) Figure 9: Maintenance capex – top five ($bn)
Source: Company data Source: Company data
0
10,000
20,000
30,000
40,000
50,000
60,000
70,000
80,000
2008 2009 2010 2011 2012 2013E 2014E
BHP Vale Rio Tinto Xstrata Anglo American
0%
20%
40%
60%
80%
100%
2008 2009 2010 2011 2012 2013E 2014E
Expansion & exploration Sustaining
0
20
40
60
2008 2009 2010 2011 2012 2013E 2014E
BHP ValeRio Tinto XstrataAnglo American Total
0
10
20
30
40
2008 2009 2010 2011 2012 2013E 2014E
BHP ValeRio Tinto XstrataAnglo American Total

Mining machinery Capital Goods & Industrial Engineering
9
Much of the focus on brownfield investment is a result of the escalation in costs of both starting a new project and operating the assets once they are in place. The cost of new projects combined with the falling commodity prices forces miners to consider new options for capital deployment and they look for the quicker, more certain returns that are available from plant optimisation and operational efficiencies.
Figure 10: Capital intensity ($/t) Figure 11: Mine capital cost escalation (yoy)
Source: Xstrata Source: Xstrata
Consensus expectations have already adjusted
Declines in mining capex have been consensus for some time now, though the magnitude has varied. At the beginning of 2012, consensus expected mining capex to decline by 9% in the year and actually it ended up growing by almost 20%. Expectations for 2013E and 2014E have been for around a 7-8% decline in each year for most of the last 18 months; however, consensus remains, on average, 6-7% below company guidance (top five miners). Assuming the scepticism is connected with expansionary rather than maintenance capex, consensus is already discounting significant declines.
The top five miners currently guide for $72bn capex in 2013E and another $61bn in 2014E, which compares to consensus expectations of $68bn and $56bn respectively (Figure 12). On average, consensus expectations are 6-7% below company guidance for both years, except for Rio Tinto, with 2014E showing a marginally larger differential overall (Figure 13). This suggests the capex of the top five miners will decline by between 17% (company guidance) and 23% (consensus) over the next two years (2014 versus 2012).
Figure 12: Capex guidance vs consensus ($m) Figure 13: Capex guidance vs consensus (%)
Source: Company data, Bloomberg Source: Company data, Bloomberg
If we look beyond the top five at the broader group of listed companies, consensus expects overall capex to decline 6%/8% in 2013E/14E and 12% in 2015E (Figure 14). The evolution of that expectation has also not changed significantly in the last 12 months, suggesting that consensus is already bearish on expansionary capex.
We do not know the split in consensus expectations between expansion and maintenance capex, but it seems more likely that company guidance on maintenance capex will be taken as accurate, with scepticism largely retained for expansion plans.
Capital intensity - copper 2011 $/t
1985-2011 green & brownfield projects 7,700
2012-2015 greenfield projects in construction 14,970
2016-2020 greenfield unapproved 18,600
Xstrata brownfield 8,920
Xstrata greenfield 13,315 0%
10%
20%
30%
40%
2004 2005 2006 2007 2008 2009 2010 2011
010,00020,00030,00040,00050,00060,00070,00080,000
2013E 2014E 2013E 2014E
Guidance Consensus
BHP Vale Rio Tinto Xstrata Anglo American
-20%
-15%
-10%
-5%
0%
5%
10%
BHP VLE RTO XTA AA Total
2013E 2014E
Mining machinery Capital Goods & Industrial Engineering
10
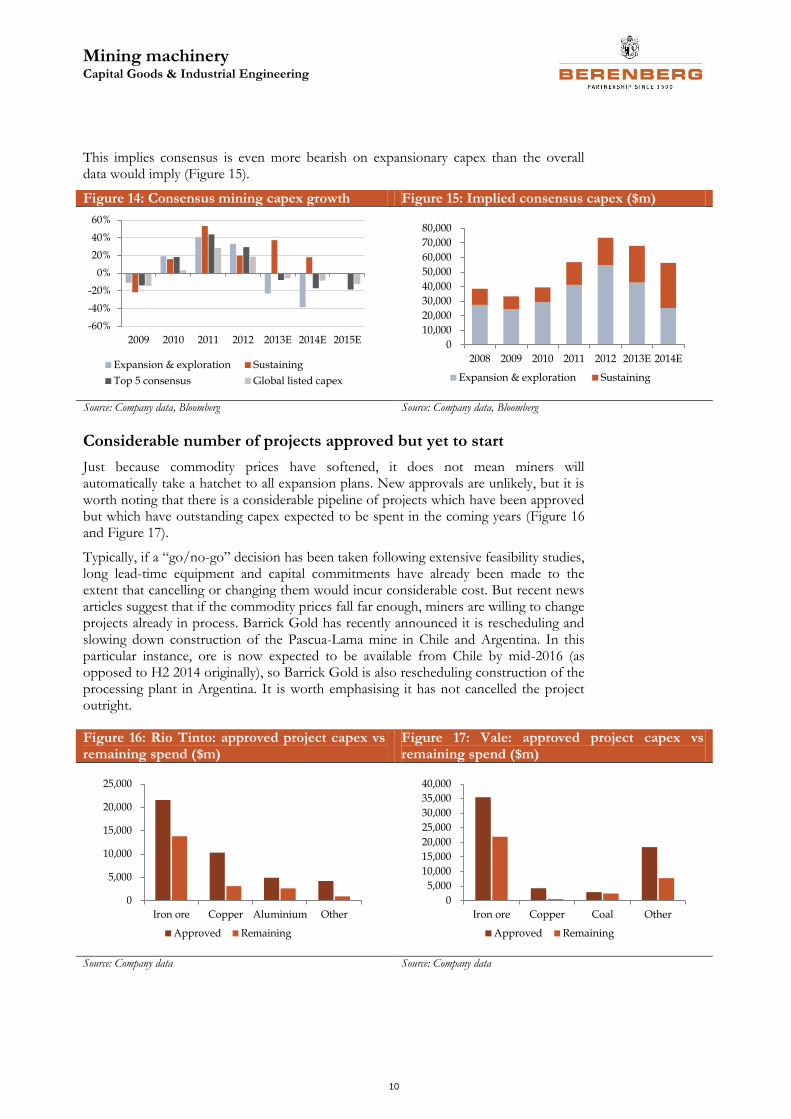
This implies consensus is even more bearish on expansionary capex than the overall data would imply (Figure 15).
Figure 14: Consensus mining capex growth Figure 15: Implied consensus capex ($m)
Source: Company data, Bloomberg Source: Company data, Bloomberg
Considerable number of projects approved but yet to start
Just because commodity prices have softened, it does not mean miners will automatically take a hatchet to all expansion plans. New approvals are unlikely, but it is worth noting that there is a considerable pipeline of projects which have been approved but which have outstanding capex expected to be spent in the coming years (Figure 16 and Figure 17).
Typically, if a “go/no-go” decision has been taken following extensive feasibility studies, long lead-time equipment and capital commitments have already been made to the extent that cancelling or changing them would incur considerable cost. But recent news articles suggest that if the commodity prices fall far enough, miners are willing to change projects already in process. Barrick Gold has recently announced it is rescheduling and slowing down construction of the Pascua-Lama mine in Chile and Argentina. In this particular instance, ore is now expected to be available from Chile by mid-2016 (as opposed to H2 2014 originally), so Barrick Gold is also rescheduling construction of the processing plant in Argentina. It is worth emphasising it has not cancelled the project outright.
Figure 16: Rio Tinto: approved project capex vs remaining spend ($m)
Figure 17: Vale: approved project capex vs remaining spend ($m)
Source: Company data Source: Company data
-60%
-40%
-20%
0%
20%
40%
60%
2009 2010 2011 2012 2013E 2014E 2015E
Expansion & exploration Sustaining
Top 5 consensus Global listed capex
0
10,000
20,000
30,000
40,000
50,000
60,000
70,000
80,000
2008 2009 2010 2011 2012 2013E 2014E
Expansion & exploration Sustaining
0
5,000
10,000
15,000
20,000
25,000
Iron ore Copper Aluminium Other
Approved Remaining
0
5,000
10,000
15,000
20,000
25,000
30,000
35,000
40,000
Iron ore Copper Coal Other
Approved Remaining

Mining machinery Capital Goods & Industrial Engineering
11
Focus on brownfield investment favours mining equipment
Mining operations often capture more of brownfield investment; maintenance benefits both mining and process
Mining operations (drills, shovels, trucks etc) often account for more of the budget for brownfield investment, when expansion plans are driven by the need to sustain throughput for existing processing plants. Mining operation capex also tends to continue beyond the initial outlay, as truck fleets etc are built up, whereas the process plant is built prior to production commencing.
The current focus on brownfield investment is more likely to favour mining equipment suppliers, particularly hauling and conveying, rather than process equipment suppliers
Moving underground generally requires more mining equipment and infrastructure investment in both greenfield and brownfield projects. If the underground mine is a development of an existing open pit mine site, then the process plant is already in place and virtually all the capital is allocated to mining equipment and bulk material handling systems.
Large-scale brownfield capex can still generate new equipment orders for suppliers such as Atlas Copco, Sandvik and Caterpillar
SIB capex can take a number of forms and appears to focus as much on equipment replacement as it does on operational enhancements. Projects can be very specific (replacement or addition of a ball mill, for example) or focused much more generally on process systems and infrastructure.
Companies that can offer quick payback on upgraded equipment or which can help capture process efficiency savings should benefit from this trend; eg Weir, Metso, ABB
Focus on brownfield changes the dynamics for equipment demand
The nature of brownfield investment, focused on sustaining and developing existing mine sites, means infrastructure and overheads account for less of the budget and more of the capital is focused on equipment, particularly mining equipment.
Figure 18: Greenfield copper investment split Figure 19: Brownfield copper investment split
Source: Project feasibility studies Source: Project feasibility studies
Brownfield capex might be some 20% of the cost of greenfield investment, but the proportion allocated to equipment could be 50% in mining operations and another 20-25% in the mill circuit.
We have examined feasibility studies, which are conducted for up to three years prior to the “go/no-go” decision on a new mining investment, to understand where the capital is
Capex budget: greenfield vs. brownfield
Source: Project feasibility studies
0%
20%
40%
60%
80%
100%
Copper Iron ore Copper
Greenfield BrownfieldContingency Owner costsIndirect costs InfrastructureProcess Mining
Capex budget: greenfield vs. brownfield
Source: Project feasibility studies
0%
20%
40%
60%
80%
100%
Open pit U/ground
Owner costs Indirect costsInfrastructure ProcessMining
Vale 2013 SIB capex composition (US$m)
Source: Company data
0
500
1000
1500
2000
2500
3000
Iron ore Base metals Coal
Other Equipment replacement Ops enhancement
Mining Process Infrastructure
Indirect costs Owner costs Contingency Mining Process Infrastructure Indirect costs

Mining machinery Capital Goods & Industrial Engineering
12
allocated across different types of mine (open pit versus underground), different minerals (copper, iron ore, coal) and different levels of investment (greenfield versus brownfield).
Starting with copper, the difference in scale between greenfield and brownfield investment is clear from the data in Figure 20, and underpins the data displayed in the pie charts in the previous two figures. The annual production intended at each of the three greenfield projects cited here ranges from 300ktpa to 84mtpa (thousand or million tonnes per annum), and initial investment is between $5.5bn and $6.5bn. By contrast, brownfield investment in the two projects examined came to less than $1bn. What is most striking from a mining equipment supplier’s perspective (such as that of Atlas Copco or Sandvik) is that the capex budget allocated to mining equipment in brownfield projects can in some cases exceed a greenfield opportunity (compare the first US project to the Alaskan and South American projects in Figure 20).
On the process equipment side, the proportion of the capital outlay allocated does not appear to change significantly (about 25%), which means brownfield investment does not necessarily favour process equipment suppliers. However, miners do not need to undertake feasibility studies on the same scale to add a grinding circuit, optimise a process plant or invest in concentration plants as they would when looking to break new ground and develop new mining operations.
Figure 20: Sample copper mine capex budgets ($m)
Source: Project feasibility studies
Looking at iron ore projects, a similar picture emerges to that described above for copper. Mining equipment can account for almost double the proportion of the budget for brownfield iron ore projects (Figure 22) compared to greenfield (Figure 21). On the process side, again, proportions remain relatively similar. A process plant is designed for a certain level of throughput, and brownfield investment typically involves expanding the mining operations to sustain that level of design throughput for the existing plant.
Only if the expansion plans are likely to significantly improve the output of the mine would the miner consider adding to the mill circuit. Instead, brownfield investment from a process standpoint focuses more on plant optimisation, ensuring equipment is up to date, well maintained and operating efficiently. This capital is smaller and frequently related to the operating cost budget, which we will discuss in greater detail in the next section.
0
1,000
2,000
3,000
4,000
5,000
6,000
7,000
Mongolia Alaska S America US US
Greenfield BrownfieldContingency Owner costsIndirect costs InfrastructureProcess Mining
Despite a smaller overall capital outlay, more of a brownfield project’s capital can be allocated to mining equipment, favouring suppliers such as Caterpillar, Komatsu, Atlas Copco and Sandvik
2012 capex by mineral
Sources: McKinsey

Mining machinery Capital Goods & Industrial Engineering
13
Figure 21: Greenfield iron ore investment split Figure 22: Brownfield iron ore investment split
Source: Project feasibility studies Source: Project feasibility studies
The iron ore projects for which we found details were smaller in scale than the copper projects examined earlier, but still provide a good cross-section (although we could not find sufficient details on brownfield projects). From a greenfield perspective, the process plant for iron ore projects accounts for a much larger share than mine equipment (compared to copper) in the projects we examined. The intended production of each project ranged from 10mtpa to 68mtpa (Figure 23). Mining equipment budgets appear largely to vary in proportion to the scale of the project.
Figure 23: Sample iron ore mine capex budgets ($m)
Source: Project feasibility studies
Moving underground certainly favours extraction and haulage
Coal was the only mineral for which we were able to obtain good comparable details for both open pit and underground mining projects. Moving mining operations underground is intuitively a more expensive business than open cast mining, and the project data we found supports this intuition. In fact, for the projects we looked at, the mining equipment share of the capex budget essentially doubled with underground mining (Figure 24).
Looking at brownfield investment for underground coal operations shows mining equipment accounting for up to 50% of the capital outlay, with process plant investment accounting for 20-25% (Figure 25). The reasons for this have been discussed with respect to iron ore and copper, but the additional factor is that coal tends to be much harder and more abrasive to mine, so the equipment required at the mine face has to be able to cope with the harsher environment, which inevitably means greater expense per unit.
Mining Process Infrastructure
Indirect costs Owner costs Contingency
Mining Process Infrastructure
Indirect costs Contingency
0
500
1,000
1,500
2,000
2,500
3,000
3,500
S Africa Finland Australia Canada
GreenfieldContingency Owner costsIndirect costs InfrastructureProcess Mining

Mining machinery Capital Goods & Industrial Engineering
14
Figure 24: Greenfield coal investment split Figure 25: Brownfield underground coal investment split
Source: Project feasibility studies Source: Project feasibility studies
Mining equipment capex is concentrated on trucks
The bulk of the cost in mining operations lies with the loading and haulage system, whether that is traditional shovel and truck operations or in-pit crushing and conveying (IPCC). As can be seen from examining the equipment procurement list for the two largest projects we examined – the new copper mine at Oyu Tolgoi in Mongolia and the potential Pebble mine, also copper, in Alaska (Figure 26) – over 50% of the capex budget for mining equipment lies with trucks, and another 10-20% with shovels. A good proportion of the balance lies with ancillary trucks, excavators, dozers and graders, with perhaps 5% associated with drills. This mix is relatively consistent if we examine brownfield expansion projects as well.
Figure 26: Composition of mining equipment spend at two open cast copper mines ($m)
Figure 27: Composition of process plant procurement at Oyu Tolgoi and Pebble ($m)
Source: Company data, feasibility studies Source: Company data, feasibility studies
Looking at the composition of the process plant at both projects shows a much more fragmented bill of materials (Figure 27). Typically, the cost of building a new process plant is about equally weighted between procurement, steel and labour. The individual equipment – such as crushers, mills, pumps and drives – can still be expensive (primary crushers or semi-autogenous grinding (SAG) mills can cost $15m or more) but there are fewer of them; or in the case of pumps and drives, there can be high volumes, but prices are below $1m each.
The initial outlay on mining truck fleets may be relatively limited (to, say, 10-12 trucks) and the fleet is built up over time, whereas the process plant has to be finished and commissioned before product can be shipped from the mine. This means that mining equipment capex can be extended over a longer time period and delivery schedules can
0%
20%
40%
60%
80%
100%
Open pit U/ground
Mining Process Infrastructure
Indirect costs Owner costs
Mining Process Infrastructure
Indirect costs Owner costs
0
100
200
300
400
500
Oyu Tolgoi Pebble
Drills Shovels
Trucks Ancillary trucks
Excavators Other
0
200
400
600
Oyu Tolgoi Pebble
Crushers Mills
Flotation circuit Pumps & cyclones
Drives Other
Mining equipment capital outlay is dominated by trucks and loading equipment – favouring Caterpillar, Komatsu and Joy Global
Process plant bill of materials is much more fragmented and the more expensive items are fewer in volume

Mining machinery Capital Goods & Industrial Engineering
15
provide good visibility for the equipment suppliers. Process equipment is generally associated with longer lead times and takes longer to deliver and install.
Because of the size of the outlay on trucks and the cost of transporting the ore to the mill circuit, the option of IPCC systems is being considered. This generally includes a semi-mobile crusher and then long conveyor belt systems to transport the crushed ore to the mill circuit; however, IPCC systems tend to be suitable only if the crusher can stay in place for extended periods of time – moving it and the associated conveyor belts is expensive (can be over 30% of initial capex).
Sustaining capex focuses on both equipment replacement and operations enhancement
Examining specific examples of sustaining capex shows that the replacement of equipment and operational enhancement are the two main drivers, both of which offer scope for equipment suppliers to generate orders in a market where overall capex is declining.
Vale’s main initiatives for its sustaining capex in 2013 have been summarised in Figure 28. The company is expecting to spend $2.4bn on projects in iron ore, of which $600m is allocated to operational enhancements and c$1bn is allocated to equipment replacement, or 25% and 40% of the total respectively. For base metals, Vale expects to spend $1.4bn in sustaining capex this year, of which 35% is on operational enhancements and 15% on equipment replacement. Clearly, the various allocations are driven by the needs of the assets in operation in those minerals, but it is helpful to think about the magnitudes of investment that will be undertaken even in a declining capex environment.
Freeport McMoRan (FCX) has been even more specific about its brownfield development projects (Figure 29), illustrating how the lines are somewhat blurred between brownfield and maintenance, but the combined investment of c$7bn is expected to increase production by over 40% (from 2012) by 2016. The sulphur dioxide furnace rebuild would fall more into maintenance or SIB capex, but is expected to increase annual copper production at the Tenke mine by 50% as it also includes the addition of a second sulphuric acid plant. The Cerro Verde project earthworks are a more typical brownfield investment, focused on adding 600m lbs (from c400m lbs currently) to annual production by developing new open pit mining operations for the existing plant.
Figure 28: Vale: focus of sustaining capex ($m) Figure 29: Freeport McMoRan brownfield investment to 2016 ($m)
Source: Company data Source: Company data, feasibility studies
The last brownfield investment project for FCX flies in the face of the brownfield project analysis conducted earlier in the section as it is totally focused on adding a new ball mill and flotation circuit to the existing plant at the Morenci mine, which will increase production by c50%.
0
500
1000
1500
2000
2500
3000
Iron ore Base metals Coal
Ops enhancement Equipment replacement Other
0
1000
2000
3000
4000
5000
SulphurDioxide furnace
Earthworks Ball mill
To date Outstanding

Mining machinery Capital Goods & Industrial Engineering
16
Opex budgets favour process plant exposure
Operating budgets favour suppliers exposed to the process plant, due to high utilisation rates and availability needs
Although the proportion of operating costs associated with mining operations and processing appear similar, the reality is that fuel and labour account for the greatest portions of the operating budget. Longer life, greater utilisation rates and higher availability requirements make process equipment more appealing in terms of both consumables and spares exposure.
This favours Weir and Metso over Atlas Copco and Sandvik within our coverage universe, with their greater exposure to the mill circuit
Mining operation costs are driven by fuel, labour and a concentration of large equipment with high initial costs. Draglines, shovels and trucks have high initial costs and expensive annual maintenance, while the consumables component associated with drilling and loading is relatively low.
High headcount (equipment operators) and intensive maintenance schedules offer scope for cost savings. Consumables are a relatively low proportion of the budget, which means price sensitivity should be low
Process costs are characterised by high energy demands but maintenance-intensive equipment that is required to run at 95% availability to sustain 90% utilisation rates. The expense incurred in not running at design capacity or switching on and off tends to mean cost savings are sought elsewhere.
Underlines the strong positioning of the portfolios of Weir and Metso
Energy costs mask true share of operating costs; availability is key
Although clearly the mineral, the grade, the mining system, the location and many other factors affect the set-up of a mine, the operating budgets for mining operations and process operations appear relatively similar (Figure 30), except when mining operations are underground. However, energy and labour (operation and maintenance) account for more of the costs of mining operations than they do for processing.
Figure 30: Typical operating budget split (open cast mines)
Figure 31: Operating cost per tonne ($/t) and proportion of life of mine costs (copper mine)
Source: Project feasibility studies Source: Project feasibility studies
High utilisation rates in the process plant, which demand higher equipment availability, drive a different mix of operating costs within the process plant. With coal, the harder
Typical operating costs by process
Source: Project feasibility studies
0%
20%
40%
60%
80%
100%
Copper Iron ore Coal
Mining Process Transport Other
Mining process: operating cost breakdown
Source: Project feasibility studies
0%
20%
40%
60%
80%
100%
Copper Coal
Hauling Haulage support
Loading Blasting
Drilling Other
Processing: operating cost breakdown
Source: Project feasibility studies
0%
20%
40%
60%
80%
100%
Copper Iron ore Coal
Energy Labour
Consumables - mech Consumables - chem
Repairs Other
0%
20%
40%
60%
80%
100%
Copper Iron ore Coal
Mining Process Transport Other
0%5%10%15%20%25%30%35%40%
0
5
10
15
20
25
30

Mining machinery Capital Goods & Industrial Engineering
17
and more abrasive environment means the mining process accounts for a greater proportion of the costs, while for copper and iron ore the material needs to be processed (rather than washed, as with coal) and refined before it can be shipped, meaning the process costs are a greater proportion of the operating budget. Labour and transport of the product to port clearly also command a reasonable share of the operating costs.
Looking in more detail at some of the components of the Pumpkin Hollow copper project in the US, which has both open pit and underground operations, the cost of underground mining is some 5-6x more than open pit, though in this case the lower volumes mined underground mean the latter accounts for a lower proportion of costs than the open pit operations through the life of mine (LoM; see Figure 31). On a per tonne basis, therefore, the process and mining costs are still relatively similar.
One critical element where the processing and mining do differ, though, is in utilisation and availability. The former represents the utilisation rates of the equipment – essentially how many hours a year it operates. Typically, mining equipment operates on a 12-hour shift basis, with two shifts a day, and for 350-360 days a year, to account for holidays, weather and scheduled maintenance, which implies utilisation rates of c80%. A process plant operates 365 days a year, 24 hours a day, and utilisation rates are typically 90%. Availability is defined as whether a piece of equipment is serviceable and able to be used. The higher utilisation requirements in process plants mean the equipment has to run at c95% availability, while mining equipment tends to run at availability rates of c85%. The expense of unscheduled failure in the process plant (where the feed is relatively constant and the rest of the plant has to stop) is much greater than if, perhaps, a drill or truck is non-operational for slightly longer than anticipated. The stockpile of ore-to-be-processed provides a buffer between the mining operations and the process plant.
Intuitively, this means process plant equipment is more critical from a maintenance and uptime standpoint, which should favour the equipment suppliers most exposed to it, such as Weir and Metso.
Opex budgets of mining operations dominated by fuel and labour
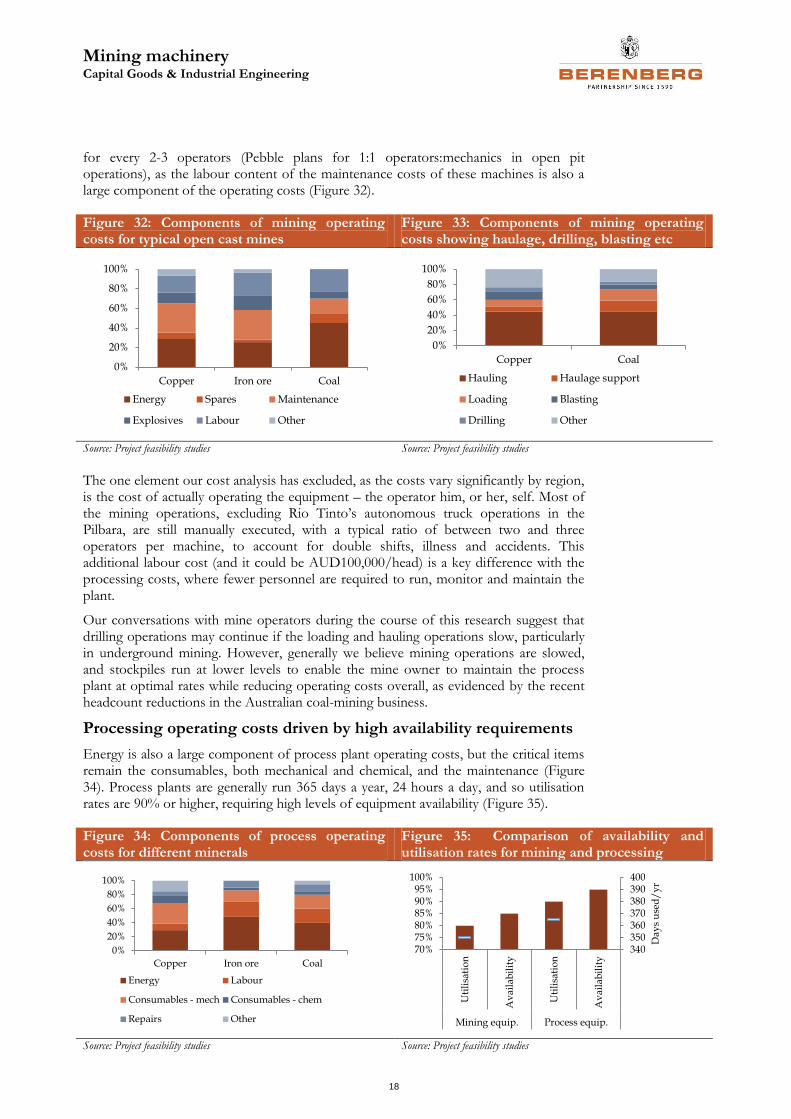
The most striking (and again, somewhat intuitive) conclusion from examining the detailed cost components of the operating budgets is that energy is the largest cost, whether in the form of electrical drives to run the shovels or diesel to run the trucks. Spares (6% of costs) and maintenance (25%) are clearly important components of mining operating costs, but labour and other overheads also account for meaningful proportions (Figure 32). Our research suggested that there is scope to lengthen maintenance schedules, shorten shifts and cut headcount in mining operations as a way of mitigating price declines in the refined product. This has been confirmed by recent announcements in the Australian mining sector, with GlencoreXstrata, Peabody and Aquila announcing a combined 1,000 job cuts as well as production reductions in the last couple of weeks.
Looking at the mining operations in a different way, and breaking the costs down by the different operations (Figure 33), we can see that haulage (ie trucks) accounts for the largest share of the costs, driven by the fuel required. Drilling (4-5% of operating costs) is a relatively small proportion, though clearly has a high proportion of consumables associated with it.
Mining equipment life, as we shall see in the next section in more detail, varies between 12,000 and 72,000 hours (or c2-6 years) before full rebuild is required, though this depends on the individual mine characteristics, abrasiveness and hardness etc of the ore. Scheduled maintenance typically happens once a year, where the equipment may be out of use for up to a couple of days. Mines employ maintenance personnel specialising in some of the more complex equipment, typically employing 1-2 maintenance engineers
Mining machinery Capital Goods & Industrial Engineering
18
for every 2-3 operators (Pebble plans for 1:1 operators:mechanics in open pit operations), as the labour content of the maintenance costs of these machines is also a large component of the operating costs (Figure 32).
Figure 32: Components of mining operating costs for typical open cast mines
Figure 33: Components of mining operating costs showing haulage, drilling, blasting etc
Source: Project feasibility studies Source: Project feasibility studies
The one element our cost analysis has excluded, as the costs vary significantly by region, is the cost of actually operating the equipment – the operator him, or her, self. Most of the mining operations, excluding Rio Tinto’s autonomous truck operations in the Pilbara, are still manually executed, with a typical ratio of between two and three operators per machine, to account for double shifts, illness and accidents. This additional labour cost (and it could be AUD100,000/head) is a key difference with the processing costs, where fewer personnel are required to run, monitor and maintain the plant.
Our conversations with mine operators during the course of this research suggest that drilling operations may continue if the loading and hauling operations slow, particularly in underground mining. However, generally we believe mining operations are slowed, and stockpiles run at lower levels to enable the mine owner to maintain the process plant at optimal rates while reducing operating costs overall, as evidenced by the recent headcount reductions in the Australian coal-mining business.
Processing operating costs driven by high availability requirements
Energy is also a large component of process plant operating costs, but the critical items remain the consumables, both mechanical and chemical, and the maintenance (Figure 34). Process plants are generally run 365 days a year, 24 hours a day, and so utilisation rates are 90% or higher, requiring high levels of equipment availability (Figure 35).
Figure 34: Components of process operating costs for different minerals
Figure 35: Comparison of availability and utilisation rates for mining and processing
Source: Project feasibility studies Source: Project feasibility studies
0%
20%
40%
60%
80%
100%
Copper Iron ore Coal
Energy Spares Maintenance
Explosives Labour Other
0%
20%
40%
60%
80%
100%
Copper Coal
Hauling Haulage support
Loading Blasting
Drilling Other
0%
20%
40%
60%
80%
100%
Copper Iron ore Coal
Energy Labour
Consumables - mech Consumables - chem
Repairs Other
340350360370380390400
70%75%80%85%90%95%
100%
Uti
lisa
tio
n
Av
aila
bil
ity
Uti
lisa
tio
n
Av
aila
bil
ity
Mining equip. Process equip.
Da
ys
use
d/
yr
Mining machinery Capital Goods & Industrial Engineering
19
While all assets are better operating than not, from a cost effectiveness standpoint, process plants have such a high fixed cost base that generally the optimal situation for them to be generating the best cost per tonne milled or processed is for them to be operating at design capacity. Coal plants, which generally simply wash the product, are perhaps the exception to this, but iron, copper, gold and other metals where there is a continuous process make it difficult to vary either the speed or the volume of the process, which would generally require a similar energy input almost regardless of the volume throughput. The energy saved by running a mill slightly slower is insignificant compared to that required to overcome the inertia in stopping and starting.
In running the plant, consumables take different forms, all of which provide a more or less continuous stream of aftermarket business for the equipment suppliers:
grinding media inside the mills (steel rods, balls etc), the use of which is driven by the abrasiveness of the ore and the throughput of the mill;
liners for the inside of the mills and slurry pumps, which are also subject to the abrasiveness of the ore and the plant throughput; and
chemicals (flocculants), which are used as catalysts or reagents in the refining process and which are also calculated on a per tonne basis.
On top of this is the cost of maintaining and repairing (both scheduled and on an ad hoc basis) the equipment to ensure the high availability and utilisation rates are sustained. The manpower required to implement, monitor and sustain the plant is much lower, per tonne processed and in absolute terms, than that required for the mining operations – the employee base associated with the processing operations of an integrated copper mine and plant, processing perhaps 70,000 tonnes per day, might be less than 15% of the manpower required to drill, load and haul the required feed tonnage of ore. The Alaskan Pebble project plans for over 500 open pit operations employees (50:50 operators:mechanics) compared to c75 process plant personnel.
Our examination of the cost saving plans of the major miners and our conversations during the course of this research show that there are certainly savings to be made in terms of negotiating with suppliers of consumables, running lower inventories and ensuring automation is used where possible. However, the scope for making immediate, and reversible, savings in the processing plant is more limited compared to the mining operations, supporting our thesis that the more defensive exposure lies here rather than closer to the mine face.
Mining machinery Capital Goods & Industrial Engineering
20
Equipment characteristics: consumables vs spares and service
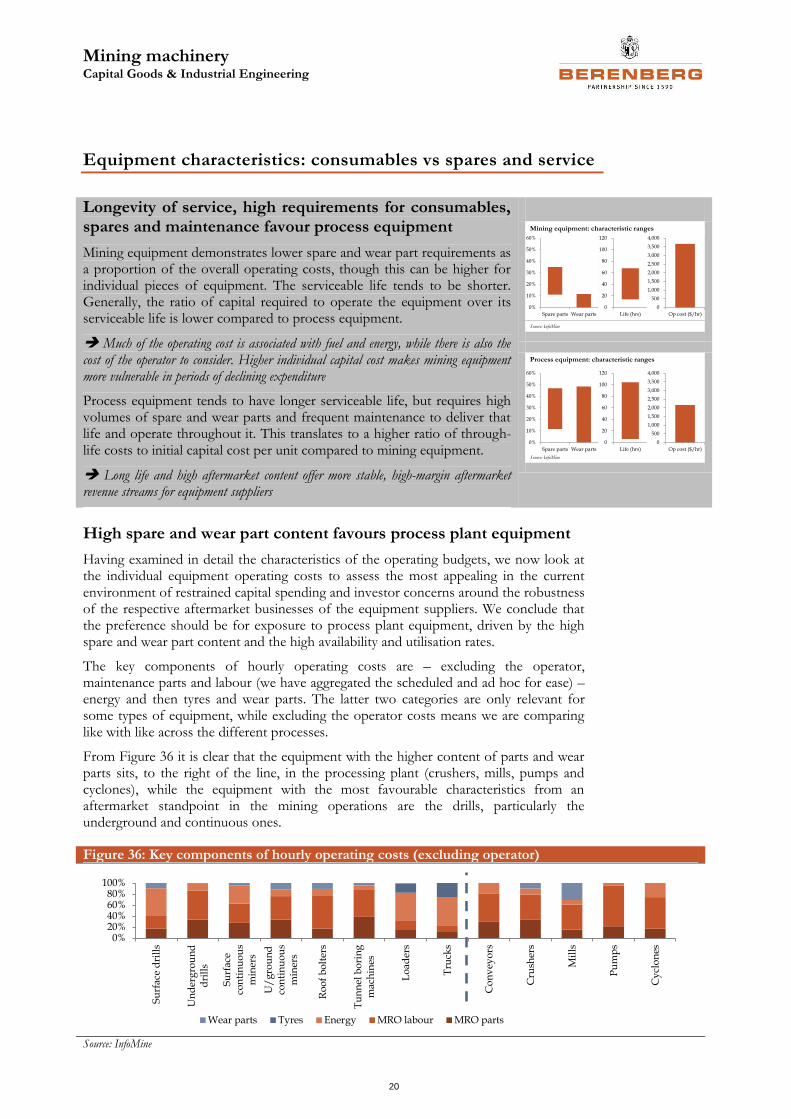
Longevity of service, high requirements for consumables, spares and maintenance favour process equipment
Mining equipment demonstrates lower spare and wear part requirements as a proportion of the overall operating costs, though this can be higher for individual pieces of equipment. The serviceable life tends to be shorter. Generally, the ratio of capital required to operate the equipment over its serviceable life is lower compared to process equipment.
Much of the operating cost is associated with fuel and energy, while there is also the cost of the operator to consider. Higher individual capital cost makes mining equipment more vulnerable in periods of declining expenditure
Process equipment tends to have longer serviceable life, but requires high volumes of spare and wear parts and frequent maintenance to deliver that life and operate throughout it. This translates to a higher ratio of through-life costs to initial capital cost per unit compared to mining equipment.
Long life and high aftermarket content offer more stable, high-margin aftermarket revenue streams for equipment suppliers
High spare and wear part content favours process plant equipment
Having examined in detail the characteristics of the operating budgets, we now look at the individual equipment operating costs to assess the most appealing in the current environment of restrained capital spending and investor concerns around the robustness of the respective aftermarket businesses of the equipment suppliers. We conclude that the preference should be for exposure to process plant equipment, driven by the high spare and wear part content and the high availability and utilisation rates.
The key components of hourly operating costs are – excluding the operator, maintenance parts and labour (we have aggregated the scheduled and ad hoc for ease) – energy and then tyres and wear parts. The latter two categories are only relevant for some types of equipment, while excluding the operator costs means we are comparing like with like across the different processes.
From Figure 36 it is clear that the equipment with the higher content of parts and wear parts sits, to the right of the line, in the processing plant (crushers, mills, pumps and cyclones), while the equipment with the most favourable characteristics from an aftermarket standpoint in the mining operations are the drills, particularly the underground and continuous ones.
Figure 36: Key components of hourly operating costs (excluding operator)
Source: InfoMine
0%
10%
20%
30%
40%
50%
60%
Spare parts Wear parts
0
20
40
60
80
100
120
Life (hrs)
0
500
1,000
1,500
2,000
2,500
3,000
3,500
4,000
Op cost ($/hr)
Mining equipment: characteristic ranges
Source: InfoMine
Process equipment: characteristic ranges
Source: InfoMine
0%
10%
20%
30%
40%
50%
60%
Spare parts Wear parts
0
20
40
60
80
100
120
Life (hrs)
0
500
1,000
1,500
2,000
2,500
3,000
3,500
4,000
Op cost ($/hr)
0%20%40%60%80%
100%
Su
rfac
e d
rill
s
Un
der
gro
un
dd
rill
s
Su
rfac
eco
nti
nu
ou
sm
iner
s
U/
gro
un
dco
nti
nu
ou
sm
iner
s
Ro
of
bo
lter
s
Tu
nn
el b
ori
ng
mac
hin
es
Lo
ader
s
Tru
cks
Co
nv
eyo
rs
Cru
sher
s
Mil
ls
Pu
mp
s
Cy
clo
nes
Wear parts Tyres Energy MRO labour MRO parts

Mining machinery Capital Goods & Industrial Engineering
21
Mining equipment: pick your spot carefully for aftermarket business
Our analysis suggests that while mining equipment can be very expensive and may require high levels of sustaining capital (the capital required to rebuild or replace the equipment) and operating costs, the aftermarket opportunity associated with the initial sale can vary from low (eg draglines) to relatively high (eg shovels or tunnel boring machines).
Assuming a mine life of 30 years, we calculated the initial capital cost, sustaining capital cost and operating capital cost (the latter two combined to define stay-in-business capital, or SIB capital) on a per unit basis for each of the key pieces of equipment in mining and process operations. We then compared the ratio of SIB capital to initial capital on a per unit basis to establish the SIB ratio, to identify what equipment generated the most attractive aftermarket sales opportunity (Figure 37). Using the feasibility studies we have examined, mining operations are typically modelled on 350-360 days per year, two shifts of 12 hours each, with 80% utilisation rates and 85% equipment availability, resulting in c5,700 hours of operation per year, or 171,000 over a 30-year LoM.
Items of mining equipment with the most appealing SIB ratios are drilling rigs and continuous mining machines (including tunnel boring machines), while shovels and backhoe excavators also demonstrate appealing aftermarket characteristics.
Figure 37: Mining operations: SIB capital vs initial capital
Source: InfoMine, Berenberg equity research
Mining operations encompass some of the largest pieces of mechanical equipment manufactured and the operating costs are of similar magnitude, with the likes of draglines, hydraulic shovels and large-scale hydraulic backhoe excavators costing $2,000 to $3,000 per hour to operate (excluding the actual operator!). The smaller equipment generally costs less than $500 per hour to operate (Figure 37).
Spare parts and wear parts, on average, account for c25% and 5% respectively of operating costs, though this does vary by equipment, sometimes significantly. A drill or continuous miner will require 10-12% of the hourly operating costs allocated to wear parts and also figures highly (35%+) in terms of spare part requirements. The larger equipment may also generate 5x to 6x the initial capital cost in maintenance labour costs over the life of a mine, suggesting that suppliers which can improve this aspect of the
Capital invested ($m) Ratio
Initial Sustaining Operating Total SIB SIB:initial
Underground loaders (LHDs) 1.9 14.3 12.7 27.0 14 :1
Shovels, hydraulic 15.9 117.0 62.3 179.3 11 :1
Continuous miners, u/ground 3.2 13.8 22.1 35.9 11 :1
Roof bolters 1.4 7.7 8.8 16.5 11 :1
Tunnel boring machines 19.0 48.3 162.5 210.9 11 :1
Rotary blasthole drill rigs 3.0 17.0 13.2 30.3 10 :1
Continuous miners, surface 4.9 20.1 29.6 49.7 10 :1
Backhoes, hydraulic 17.0 124.7 40.2 164.9 9 :1
Bucketwheel excavators 7.1 25.1 31.1 56.1 7 :1
Wheel loaders 7.7 44.0 14.9 58.9 7 :1
Shovels, cable 23.0 94.6 32.9 127.5 5 :1
Underground ore & coal haulers 1.6 3.8 4.6 8.4 5 :1
Draglines, crawler 5.5 12.5 12.1 24.5 4 :1
Trucks, rear-dump (40t-400t) 6.5 17.8 11.8 29.6 4 :1
Draglines, walking 184.5 279.6 243.9 523.5 2 :1

Mining machinery Capital Goods & Industrial Engineering
22
operational performance of their equipment will be offering considerable cost saving potential to their customers.
Figure 38: Mining equipment: key operating cost characteristics
Source: InfoMine
Process equipment: longevity and high SIB capex appeal
Using the same simple assumptions to calculate the SIB ratios for process equipment shows a considerable advantage from an aftermarket perspective for suppliers of equipment into the process plant. The SIB ratios are, on average, over twice those of mining equipment (18:1 average versus 8:1), while the higher availability and utilisation rates could see process equipment operating for up to one-third longer over the life of the mine (225,000 hours versus 171,000 hours).
Figure 39: Processing plant: SIB capital vs initial capital
Source: InfoMine, Berenberg equity research
The feasibility studies show that process plant modelling typically assumes two shifts of 12 hours per day operating 365 days per year, with 90% utilisation rates and 95% equipment availability. This translates to c7,500 hours per year and c225,000 hours over a 30-year LoM. From an equipment perspective, due to the grinding media and liners
0
1,000
2,000
3,000
Op cost ($/hr)
0
20
40
60
80
100
120
Life (hrs)
0%
10%
20%
30%
40%
50%
Dra
gli
nes
,w
alk
ing
Co
nti
nu
ou
s m
iner
s,u
/g
rou
nd
Sh
ov
els,
cab
le
Bu
cket
wh
eel
exca
vat
ors
Co
nti
nu
ou
s m
iner
s,su
rfac
e Sh
ov
els,
hy
dra
uli
c
Dra
gli
nes
,cr
awle
r
Bac
kh
oes
,h
yd
rau
lic
Ro
tary
bla
sth
ole
dri
ll r
igs
Ro
of
bo
lter
s
Wh
eel
load
ers
Du
mp
tru
cks
Wear parts Spare parts
Capital invested ($m) Ratio
Initial Sustaining Operating Total SIB SIB:initial
Grinding mill, rod & ball 5.5 7.1 190.5 197.6 35 :1
Cone crushers 4.0 21.2 43.8 65.0 16 :1
Mobile crushing plants 1.2 8.8 9.0 17.7 15 :1
Gyratory crushers 13.0 33.5 136.5 170.0 13 :1
Grinding mill, SAG 13.5 17.6 164.2 181.7 13 :1
Stackers, conveyor 20.5 53.1 67.2 120.4 5 :1
Mill drives, gearless 18.8 24.3 72.7 97.0 5 :1
$, 000s
Cyclones 26 1.0 0.0 1.0 39 :1
Slurry pumps 84 1.6 0.6 2.1 25 :1
Electric motors 185 1.9 1.7 3.6 19 :1
Screens 403 3.5 1.9 5.4 13 :1
Mining machinery Capital Goods & Industrial Engineering
23
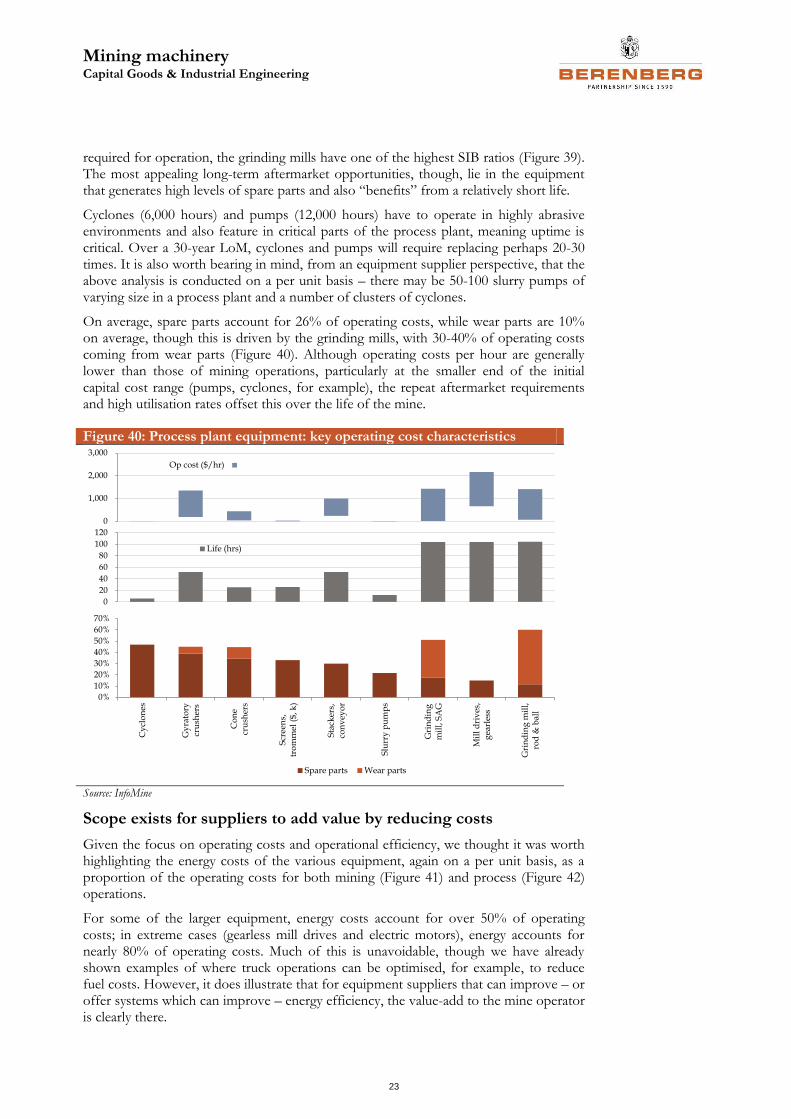
required for operation, the grinding mills have one of the highest SIB ratios (Figure 39). The most appealing long-term aftermarket opportunities, though, lie in the equipment that generates high levels of spare parts and also “benefits” from a relatively short life.
Cyclones (6,000 hours) and pumps (12,000 hours) have to operate in highly abrasive environments and also feature in critical parts of the process plant, meaning uptime is critical. Over a 30-year LoM, cyclones and pumps will require replacing perhaps 20-30 times. It is also worth bearing in mind, from an equipment supplier perspective, that the above analysis is conducted on a per unit basis – there may be 50-100 slurry pumps of varying size in a process plant and a number of clusters of cyclones.
On average, spare parts account for 26% of operating costs, while wear parts are 10% on average, though this is driven by the grinding mills, with 30-40% of operating costs coming from wear parts (Figure 40). Although operating costs per hour are generally lower than those of mining operations, particularly at the smaller end of the initial capital cost range (pumps, cyclones, for example), the repeat aftermarket requirements and high utilisation rates offset this over the life of the mine.
Figure 40: Process plant equipment: key operating cost characteristics
Source: InfoMine
Scope exists for suppliers to add value by reducing costs
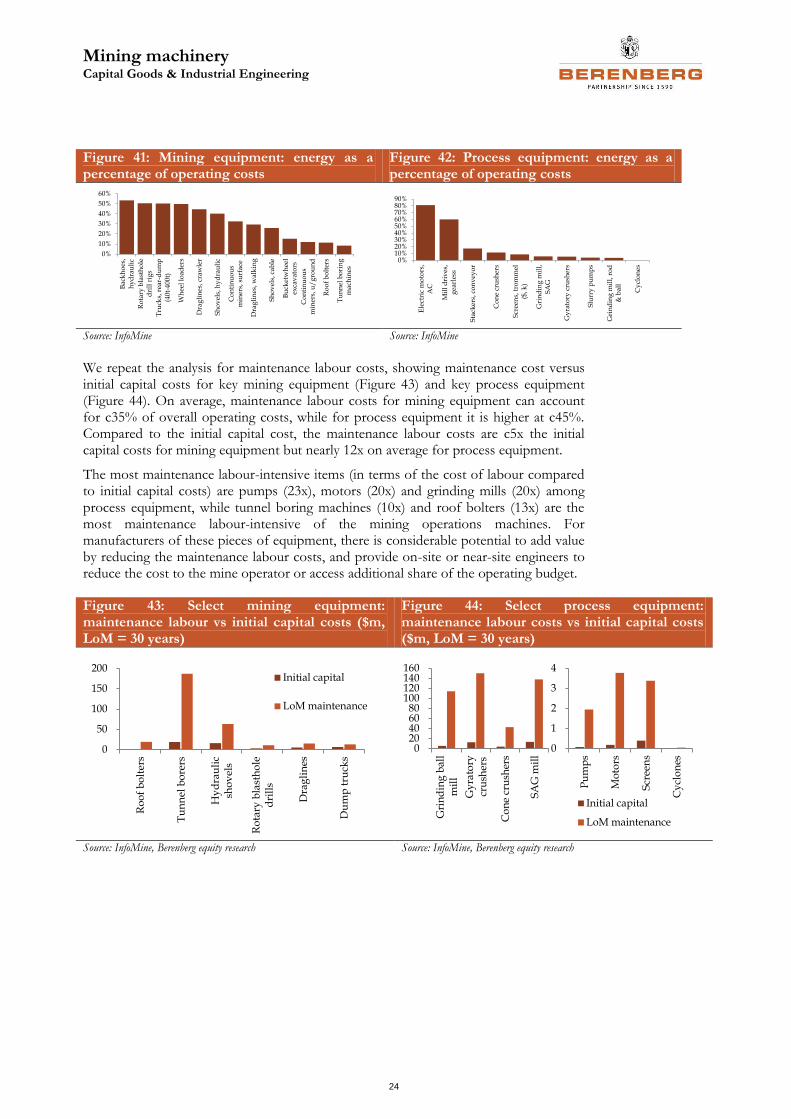
Given the focus on operating costs and operational efficiency, we thought it was worth highlighting the energy costs of the various equipment, again on a per unit basis, as a proportion of the operating costs for both mining (Figure 41) and process (Figure 42) operations.
For some of the larger equipment, energy costs account for over 50% of operating costs; in extreme cases (gearless mill drives and electric motors), energy accounts for nearly 80% of operating costs. Much of this is unavoidable, though we have already shown examples of where truck operations can be optimised, for example, to reduce fuel costs. However, it does illustrate that for equipment suppliers that can improve – or offer systems which can improve – energy efficiency, the value-add to the mine operator is clearly there.
0
1,000
2,000
3,000
Op cost ($/hr)
0
20
40
60
80
100
120
Life (hrs)
0%
10%
20%
30%
40%
50%
60%
70%
Cy
clo
nes
Gy
rato
rycr
ush
ers
Co
ne
cru
sher
s
Scr
een
s,tr
om
mel
($,
k)
Sta
cker
s,co
nv
eyo
r
Slu
rry
pu
mp
s
Gri
nd
ing
mil
l, S
AG
Mil
l d
riv
es,
gea
rles
s
Gri
nd
ing
mil
l,ro
d &
bal
l
Spare parts Wear parts
Mining machinery Capital Goods & Industrial Engineering
24
Figure 41: Mining equipment: energy as a percentage of operating costs
Figure 42: Process equipment: energy as a percentage of operating costs
Source: InfoMine Source: InfoMine
We repeat the analysis for maintenance labour costs, showing maintenance cost versus initial capital costs for key mining equipment (Figure 43) and key process equipment (Figure 44). On average, maintenance labour costs for mining equipment can account for c35% of overall operating costs, while for process equipment it is higher at c45%. Compared to the initial capital cost, the maintenance labour costs are c5x the initial capital costs for mining equipment but nearly 12x on average for process equipment.
The most maintenance labour-intensive items (in terms of the cost of labour compared to initial capital costs) are pumps (23x), motors (20x) and grinding mills (20x) among process equipment, while tunnel boring machines (10x) and roof bolters (13x) are the most maintenance labour-intensive of the mining operations machines. For manufacturers of these pieces of equipment, there is considerable potential to add value by reducing the maintenance labour costs, and provide on-site or near-site engineers to reduce the cost to the mine operator or access additional share of the operating budget.
Figure 43: Select mining equipment: maintenance labour vs initial capital costs ($m, LoM = 30 years)
Figure 44: Select process equipment: maintenance labour costs vs initial capital costs ($m, LoM = 30 years)
Source: InfoMine, Berenberg equity research Source: InfoMine, Berenberg equity research
0%
10%
20%
30%
40%
50%
60%
Bac
kh
oes
,h
yd
rau
lic
Ro
tary
bla
sth
ole
dri
ll r
igs
Tru
cks,
rea
r-d
um
p(4
0t-
400
t)
Wh
eel
load
ers
Dra
gli
nes
, cra
wle
r
Sh
ov
els,
hy
dra
uli
c
Co
nti
nu
ou
sm
iner
s, s
urf
ace
Dra
gli
nes
, wal
kin
g
Sh
ov
els,
cab
le
Bu
cket
wh
eel
exca
vat
ors
Co
nti
nu
ou
sm
iner
s, u
/g
rou
nd
Ro
of
bo
lter
s
Tu
nn
el b
ori
ng
ma
chin
es
0%10%20%30%40%50%60%70%80%90%
Ele
ctri
c m
oto
rs,
AC
Mil
l d
riv
es,
gea
rles
s
Sta
cker
s, c
on
vey
or
Co
ne
cru
sher
s
Scr
een
s, t
rom
mel
($, k
)
Gri
nd
ing
mil
l,S
AG
Gy
rato
ry c
rush
ers
Slu
rry
pu
mp
s
Gri
nd
ing
mil
l, r
od
& b
all
Cy
clo
nes
0
50
100
150
200
Ro
of
bo
lter
s
Tu
nn
el b
ore
rs
Hy
dra
uli
csh
ov
els
Ro
tary
bla
sth
ole
dri
lls
Dra
gli
nes
Du
mp
tru
cks
Initial capital
LoM maintenance
020406080
100120140160
Gri
nd
ing
bal
lm
ill
Gy
rato
rycr
ush
ers
Co
ne
cru
sher
s
SA
G m
ill
0
1
2
3
4
Pu
mp
s
Mo
tors
Scr
een
s
Cy
clo
nes
Initial capital
LoM maintenance
Mining machinery Capital Goods & Industrial Engineering
25
Assessing portfolio exposure
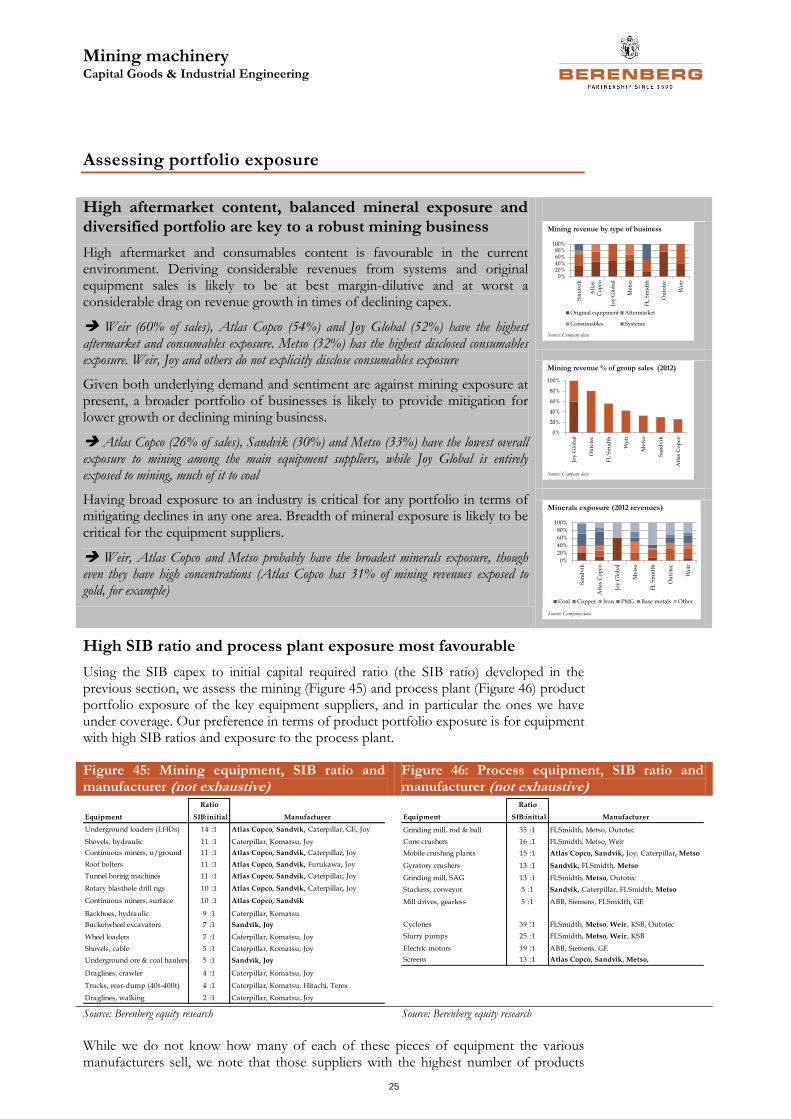
High aftermarket content, balanced mineral exposure and diversified portfolio are key to a robust mining business
High aftermarket and consumables content is favourable in the current environment. Deriving considerable revenues from systems and original equipment sales is likely to be at best margin-dilutive and at worst a considerable drag on revenue growth in times of declining capex.
Weir (60% of sales), Atlas Copco (54%) and Joy Global (52%) have the highest aftermarket and consumables exposure. Metso (32%) has the highest disclosed consumables exposure. Weir, Joy and others do not explicitly disclose consumables exposure
Given both underlying demand and sentiment are against mining exposure at present, a broader portfolio of businesses is likely to provide mitigation for lower growth or declining mining business.
Atlas Copco (26% of sales), Sandvik (30%) and Metso (33%) have the lowest overall exposure to mining among the main equipment suppliers, while Joy Global is entirely exposed to mining, much of it to coal
Having broad exposure to an industry is critical for any portfolio in terms of mitigating declines in any one area. Breadth of mineral exposure is likely to be critical for the equipment suppliers.
Weir, Atlas Copco and Metso probably have the broadest minerals exposure, though even they have high concentrations (Atlas Copco has 31% of mining revenues exposed to gold, for example)
High SIB ratio and process plant exposure most favourable
Using the SIB capex to initial capital required ratio (the SIB ratio) developed in the previous section, we assess the mining (Figure 45) and process plant (Figure 46) product portfolio exposure of the key equipment suppliers, and in particular the ones we have under coverage. Our preference in terms of product portfolio exposure is for equipment with high SIB ratios and exposure to the process plant.
Figure 45: Mining equipment, SIB ratio and manufacturer (not exhaustive)
Figure 46: Process equipment, SIB ratio and manufacturer (not exhaustive)
Source: Berenberg equity research Source: Berenberg equity research
While we do not know how many of each of these pieces of equipment the various manufacturers sell, we note that those suppliers with the highest number of products
Mining revenue by type of business
Source: Company data
0%20%40%60%80%
100%
San
dv
ik
Atl
as
Co
pco
Joy
Glo
bal
Met
so
FL
Sm
idth
Ou
tote
c
Wei
r
Original equipment Aftermarket
Consumables Systems
Mining revenue % of group sales (2012)
Source: Company data
0%
20%
40%
60%
80%
100%
Joy
Glo
bal
Ou
tote
c
FL
Sm
idth
Wei
r
Met
so
San
dv
ik
Atl
as C
op
co
Minerals exposure (2012 revenues)
Source: Company data
0%
20%
40%
60%
80%
100%
San
dv
ik
Atl
as C
op
co
Joy
Glo
bal
Met
so
FL
Sm
idth
Ou
tote
c
Wei
r
Coal Copper Iron PMG Base metals Other
Ratio
Equipment SIB:initial Manufacturer
Underground loaders (LHDs) 14 :1 Atlas Copco, Sandvik, Caterpillar, GE, Joy
Shovels, hydraulic 11 :1 Caterpillar, Komatsu, Joy
Continuous miners, u/ground 11 :1 Atlas Copco, Sandvik, Caterpillar, Joy
Roof bolters 11 :1 Atlas Copco, Sandvik, Furukawa, Joy
Tunnel boring machines 11 :1 Atlas Copco, Sandvik, Caterpillar, Joy
Rotary blasthole drill rigs 10 :1 Atlas Copco, Sandvik, Caterpillar, Joy
Continuous miners, surface 10 :1 Atlas Copco, Sandvik
Backhoes, hydraulic 9 :1 Caterpillar, Komatsu
Bucketwheel excavators 7 :1 Sandvik, Joy
Wheel loaders 7 :1 Caterpillar, Komatsu, Joy
Shovels, cable 5 :1 Caterpillar, Komatsu, Joy
Underground ore & coal haulers 5 :1 Sandvik, Joy
Draglines, crawler 4 :1 Caterpillar, Komatsu, Joy
Trucks, rear-dump (40t-400t) 4 :1 Caterpillar, Komatsu, Hitachi, Terex
Draglines, walking 2 :1 Caterpillar, Komatsu, Joy
Ratio
Equipment SIB:initial Manufacturer
Grinding mill, rod & ball 35 :1 FLSmidth, Metso, Outotec
Cone crushers 16 :1 FLSmidth, Metso, Weir
Mobile crushing plants 15 :1 Atlas Copco, Sandvik, Joy, Caterpillar, Metso
Gyratory crushers 13 :1 Sandvik, FLSmidth, Metso
Grinding mill, SAG 13 :1 FLSmidth, Metso, Outotec
Stackers, conveyor 5 :1 Sandvik, Caterpillar, FLSmidth, Metso
Mill drives, gearless 5 :1 ABB, Siemens, FLSmidth, GE
Cyclones 39 :1 FLSmidth, Metso, Weir, KSB, Outotec
Slurry pumps 25 :1 FLSmidth, Metso, Weir, KSB
Electric motors 19 :1 ABB, Siemens, GE
Screens 13 :1 Atlas Copco, Sandvik, Metso,

Mining machinery Capital Goods & Industrial Engineering
26
with high SIB ratios and process plant exposure are Metso and Weir, while among the more mining operations-focused suppliers, Atlas Copco and Sandvik products rank most consistently with high SIB ratios. When translating this into the individual company exposures, we find only Metso (32% of sales), Atlas Copco (23%) and Sandvik (11%) break out explicitly the revenues they derive from consumables. The reality is that Joy Global and Weir, Outotec and FLSmidth must generate revenue from consumables and it could be quite a high proportion when one considers the portfolio exposure (continuous miners at Joy, pumps and liners and Weir, grinding mills at Outotec and FLSmidth).
Overall, the suppliers with the highest levels of aftermarket and consumables revenues are Weir (60% of sales), Atlas Copco (54%) and Joy Global (52%), with Outotec (23%) generating the lowest levels (Figure 47). The high process exposure at Weir should also be of benefit given the more limited flexibility in that part of operations with respect to operating budgets.
High levels of systems business (FLSmidth, 49%; Sandvik 20%) are a mixed blessing. Long installation periods and considerable investment costs mean current projects are unlikely to be significantly curtailed, though Barrick Gold’s recent actions highlight that build schedules can still be changed. The turnkey nature of the systems business means margins are generally lower than in the rest of the mining equipment portfolio. If the balance of the business is in decline, the more stable, lower-margin systems business is likely to be margin-dilutive.
Figure 47: Mining revenue by type – key equipment suppliers
Source: Company data
Balanced portfolio exposure is key to a robust business
This is something of a truism and relevant for any business, industry or portfolio. In mining, clearly companies with mining accounting for a lower proportion of their overall sales will be better positioned with respect to both end market demand dynamics and investor sentiment. Atlas Copco (26% of group sales), Sandvik (30%) and Metso (33%) have the lowest overall exposure of the mining equipment suppliers we are examining, while Joy Global has the highest (Figure 48).
Balanced mineral exposure should help mitigate the decline of one commodity in particular. The suppliers with the most balanced exposures are Atlas Copco, Weir and Metso, while Joy Global is clearly very dependent on coal (Figure 49). FLSmidth has high exposure to fertilisers and aggregates, which is why the “other” component of its revenue exposure is so large.
0%
20%
40%
60%
80%
100%
Sa
nd
vik
Atl
as C
op
co
Joy
Glo
bal
Met
so
FL
Sm
idth
Ou
tote
c
Wei
r
Original equipment Aftermarket Consumables Systems
Revenue from consumables and aftermarket is critical to a robust mining business in a declining capex environment. Metso, Atlas Copco and Sandvik have the highest disclosed revenues from consumables, but we suspect the others derive similar levels of revenue from this source
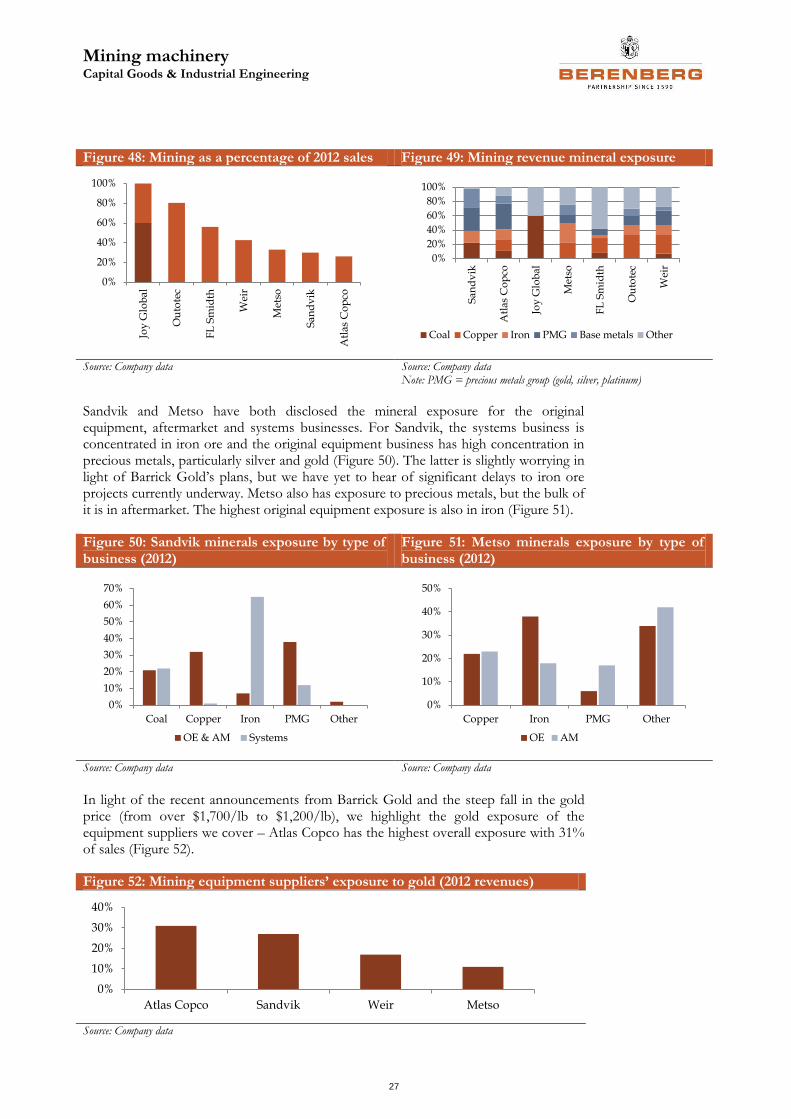
Mining machinery Capital Goods & Industrial Engineering
27
Figure 48: Mining as a percentage of 2012 sales Figure 49: Mining revenue mineral exposure
Source: Company data Source: Company data
Note: PMG = precious metals group (gold, silver, platinum)
Sandvik and Metso have both disclosed the mineral exposure for the original equipment, aftermarket and systems businesses. For Sandvik, the systems business is concentrated in iron ore and the original equipment business has high concentration in precious metals, particularly silver and gold (Figure 50). The latter is slightly worrying in light of Barrick Gold’s plans, but we have yet to hear of significant delays to iron ore projects currently underway. Metso also has exposure to precious metals, but the bulk of it is in aftermarket. The highest original equipment exposure is also in iron (Figure 51).
Figure 50: Sandvik minerals exposure by type of business (2012)
Figure 51: Metso minerals exposure by type of business (2012)
Source: Company data Source: Company data
In light of the recent announcements from Barrick Gold and the steep fall in the gold price (from over $1,700/lb to $1,200/lb), we highlight the gold exposure of the equipment suppliers we cover – Atlas Copco has the highest overall exposure with 31% of sales (Figure 52).
Figure 52: Mining equipment suppliers’ exposure to gold (2012 revenues)
Source: Company data
0%
20%
40%
60%
80%
100%
Joy
Glo
bal
Ou
tote
c
FL
Sm
idth
Wei
r
Met
so
San
dv
ik
Atl
as C
op
co
0%
20%
40%
60%
80%
100%
San
dv
ik
Atl
as C
op
co
Joy
Glo
bal
Met
so
FL
Sm
idth
Ou
tote
c
Wei
r
Coal Copper Iron PMG Base metals Other
0%
10%
20%
30%
40%
50%
60%
70%
Coal Copper Iron PMG Other
OE & AM Systems
0%
10%
20%
30%
40%
50%
Copper Iron PMG Other
OE AM
0%
10%
20%
30%
40%
Atlas Copco Sandvik Weir Metso
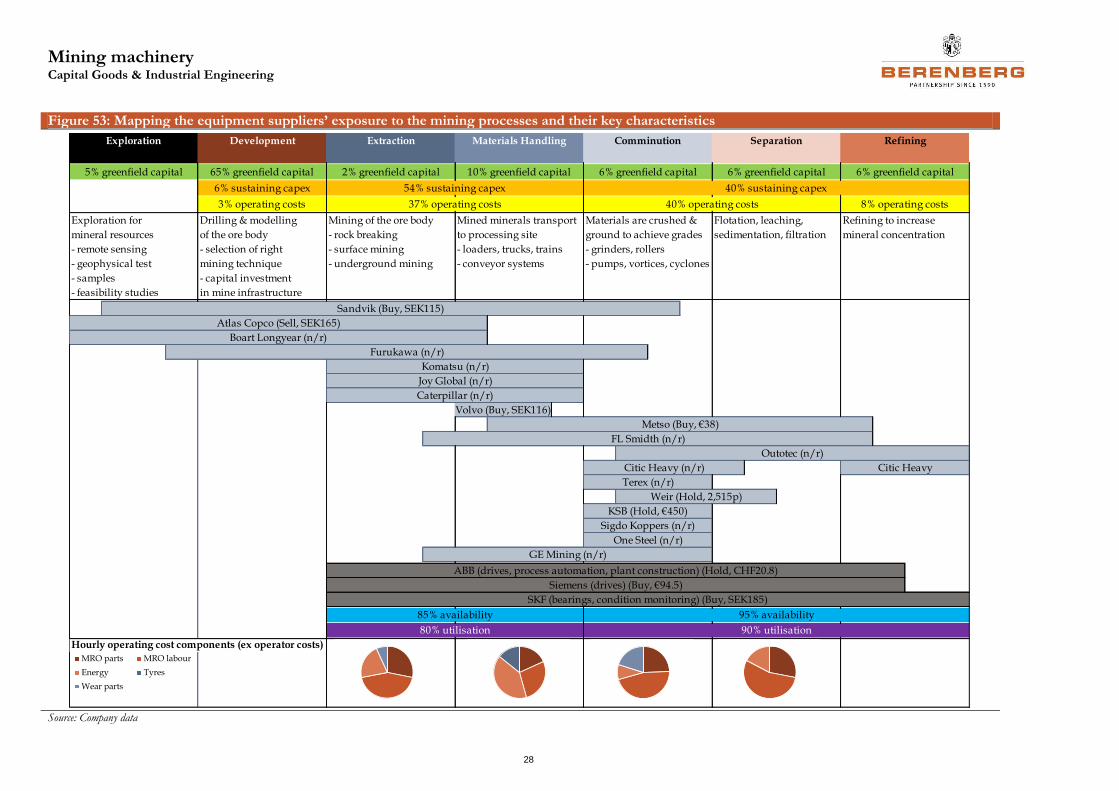
Mining machinery Capital Goods & Industrial Engineering
28
Figure 53: Mapping the equipment suppliers’ exposure to the mining processes and their key characteristics
Source: Company data
Exploration Development Extraction Materials Handling Comminution Separation Refining
5% greenfield capital 65% greenfield capital 2% greenfield capital 10% greenfield capital 6% greenfield capital 6% greenfield capital 6% greenfield capital
6% sustaining capex 54% sustaining capex 40% sustaining capex
3% operating costs 37% operating costs 40% operating costs 8% operating costs
Exploration for Drilling & modelling Mining of the ore body Mined minerals transport Materials are crushed & Flotation, leaching, Refining to increase
mineral resources of the ore body - rock breaking to processing site ground to achieve grades sedimentation, filtration mineral concentration
- remote sensing - selection of right - surface mining - loaders, trucks, trains - grinders, rollers
- geophysical test mining technique - underground mining - conveyor systems - pumps, vortices, cyclones
- samples - capital investment
- feasibility studies in mine infrastructure
Sandvik (Buy, SEK115)
Atlas Copco (Sell, SEK165)
Boart Longyear (n/r)
Furukawa (n/r)
Komatsu (n/r)
Joy Global (n/r)
Caterpillar (n/r)
Volvo (Buy, SEK116)
Metso (Buy, €38)
FL Smidth (n/r)
Outotec (n/r)
Citic Heavy (n/r) Citic Heavy
Terex (n/r)
Weir (Hold, 2,515p)
KSB (Hold, €450)
Sigdo Koppers (n/r)
One Steel (n/r)
GE Mining (n/r)
ABB (drives, process automation, plant construction) (Hold, CHF20.8)
Siemens (drives) (Buy, €94.5)
SKF (bearings, condition monitoring) (Buy, SEK185)
85% availability 95% availability
80% utilisation 90% utilisation
Hourly operating cost components (ex operator costs)
MRO parts MRO labour
Energy Tyres
Wear parts

Atlas Copco AB Capital Goods & Industrial Engineering
29
Good aftermarket exposure, but fool’s gold?
We reiterate our Sell recommendation on Atlas Copco, with a SEK165 target price. Our concern lies with the high gold exposure and the investor perception that Atlas Copco’s consumables business (23% of sales) represents a “safe haven” in times of declining capex. Drilling and mining operations have greater flexibility with respect to cost saving initiatives for the mine operator than the process plant, potentially rendering the consumables business not as robust as investors hope.
Capex exposure generally positive: Despite greenfield capex cuts, Atlas Copco’s mining operations and underground equipment portfolio mean it should be better placed to cope with reduced demand for original equipment – brownfield expansion generally favours mining operations. Atlas’ high gold exposure (31% of mining sales) may compound the decline in original equipment sales in the near term.
Operating budget exposure raises some questions: Our analysis of the opex budgets of mining operations suggests there is greater scope in manpower and fuel for cost saving initiatives than there is in the process plant. This could involve slowing the mining rate (running lower stockpiles of ore inventory for the plant) and lengthening maintenance schedules. Consumables and spare part demand would remain, but at potentially lower levels.
Relatively favourable equipment characteristics: Atlas Copco’s equipment exposure tends to exhibit relatively high (10-14x) ratios of aftermarket revenue to initial capex. Although generally focused on mining operations, Atlas also offers mobile crushing systems. These offer considerable benefits to the processing operations, but are only suitable for relatively static mining operations due to the expense incurred in moving the complementary infrastructure.
Valuation remains expensive given uncertainties: Atlas is currently trading on 13x 2014E P/E and 9x EV/EBIT, not significantly out of line with historical levels (14x and 10x), suggesting investors are not discounting significant declines in the mining business. We regard this as complacent in the face of record quarters last year in Q1 and Q2, a business that has only just started seeing a meaningful organic revenue decline and the recent Boart Longyear profit warning. We derive our price target from a blend of trading multiples, sum-of-the-parts and DCF valuations.
Sell Rating system
Current price
SEK 162.50
Relative
Price target
SEK 165.00 01/07/2013 Stockholm Close Market cap SEK 196,717 m Reuters ATCOa.ST Bloomberg ATCOA SS
Changes made in this note Rating Sell (no change) Price target SEK 165.00 (no change) Chg 2013E 2014E 2015E
old Δ% old Δ% old Δ%
Sales 86,841 - 91,007 - 97,040 -
EBIT 18,695 - 20,068 - 21,947 -
EPS 11.59 - 12.53 - 13.71 -
Source: Berenberg estimates
Share data
Shares outstanding (m) 1,213 Enterprise value (SEK m) 199,098 Daily trading volume 4,751,987
Performance data
High 52 weeks (SEK) 189 Low 52 weeks (SEK) 143 Relative performance to SXXP SXNP 1 month -2.3 % -2.9 % 3 months -11.6 % -8.0 % 12 months -5.8 % -10.9 %
Key data
Price/book value 4.8 Net gearing -1.0% CAGR sales 2012-2015 2.3% CAGR EPS 2012-2015 4.8%
2 July 2013
Alexander Virgo Analyst +44 20 3207 7856 [email protected]
Benjamin Glaeser
Analyst +44 20 3207 7918 [email protected]
Y/E 31.12., SEK m 2011 2012 2013E 2014E 2015E
Sales 81,203 90,533 86,841 91,007 97,040
EBITDA 19,595 21,892 21,406 22,975 25,055
EBIT 17,560 19,228 18,695 20,068 21,947
Net profit 13,173 13,901 13,445 14,586 16,016
Y/E net debt (net cash) 12,946 7,303 -389 -6,789 -13,617
EPS (reported) 10.82 11.44 11.07 12.01 13.19
EPS (recurring) 10.75 11.96 11.59 12.53 13.71
DPS 5.00 5.50 6.00 6.50 6.50
Gross margin 38.4% 38.4% 38.8% 39.4% 39.9%
EBITDA margin 24.1% 24.2% 24.6% 25.2% 25.8%
EBIT margin 21.6% 21.2% 21.5% 22.1% 22.6%
Dividend yield 3.4% 3.5% 3.7% 4.0% 4.0%
ROCE 34.3% 32.3% 28.0% 27.1% 26.7%
EV/sales 2.4 2.2 2.3 2.1 1.9
EV/EBITDA 9.8 9.2 9.3 8.4 7.4
EV/EBIT 10.7 10.0 10.2 9.2 8.2
P/E 14.1 13.7 14.0 12.9 11.8
Source: Company data, Berenberg
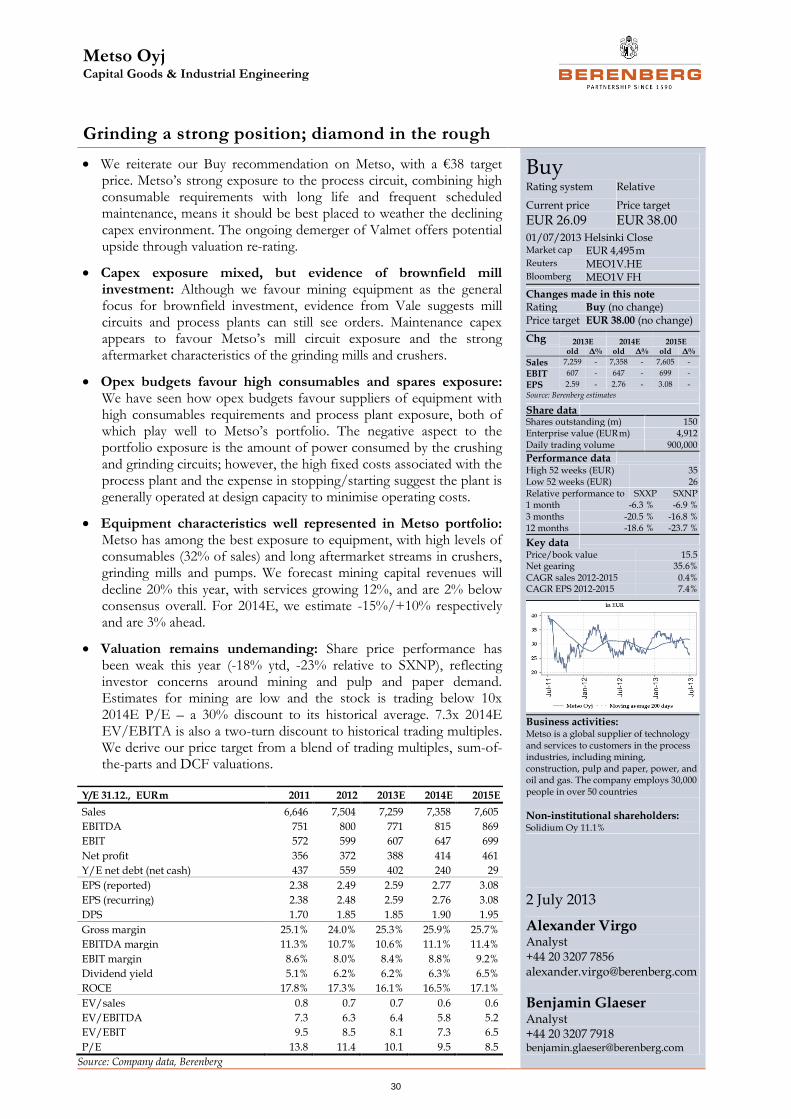
Metso Oyj Capital Goods & Industrial Engineering
30
Grinding a strong position; diamond in the rough
We reiterate our Buy recommendation on Metso, with a €38 target price. Metso’s strong exposure to the process circuit, combining high consumable requirements with long life and frequent scheduled maintenance, means it should be best placed to weather the declining capex environment. The ongoing demerger of Valmet offers potential upside through valuation re-rating.
Capex exposure mixed, but evidence of brownfield mill investment: Although we favour mining equipment as the general focus for brownfield investment, evidence from Vale suggests mill circuits and process plants can still see orders. Maintenance capex appears to favour Metso’s mill circuit exposure and the strong aftermarket characteristics of the grinding mills and crushers.
Opex budgets favour high consumables and spares exposure: We have seen how opex budgets favour suppliers of equipment with high consumables requirements and process plant exposure, both of which play well to Metso’s portfolio. The negative aspect to the portfolio exposure is the amount of power consumed by the crushing and grinding circuits; however, the high fixed costs associated with the process plant and the expense in stopping/starting suggest the plant is generally operated at design capacity to minimise operating costs.
Equipment characteristics well represented in Metso portfolio: Metso has among the best exposure to equipment, with high levels of consumables (32% of sales) and long aftermarket streams in crushers, grinding mills and pumps. We forecast mining capital revenues will decline 20% this year, with services growing 12%, and are 2% below consensus overall. For 2014E, we estimate -15%/+10% respectively and are 3% ahead.
Valuation remains undemanding: Share price performance has been weak this year (-18% ytd, -23% relative to SXNP), reflecting investor concerns around mining and pulp and paper demand. Estimates for mining are low and the stock is trading below 10x 2014E P/E – a 30% discount to its historical average. 7.3x 2014E EV/EBITA is also a two-turn discount to historical trading multiples. We derive our price target from a blend of trading multiples, sum-of-the-parts and DCF valuations.
Buy Rating system
Current price
EUR 26.09
Relative
Price target
EUR 38.00 01/07/2013 Helsinki Close Market cap EUR 4,495 m Reuters MEO1V.HE Bloomberg MEO1V FH
Changes made in this note Rating Buy (no change) Price target EUR 38.00 (no change) Chg 2013E 2014E 2015E
old Δ% old Δ% old Δ%
Sales 7,259 - 7,358 - 7,605 -
EBIT 607 - 647 - 699 -
EPS 2.59 - 2.76 - 3.08 -
Source: Berenberg estimates
Share data
Shares outstanding (m) 150 Enterprise value (EUR m) 4,912 Daily trading volume 900,000
Performance data
High 52 weeks (EUR) 35 Low 52 weeks (EUR) 26 Relative performance to SXXP SXNP 1 month -6.3 % -6.9 % 3 months -20.5 % -16.8 % 12 months -18.6 % -23.7 %
Key data
Price/book value 15.5 Net gearing 35.6% CAGR sales 2012-2015 0.4% CAGR EPS 2012-2015 7.4%
Business activities: Metso is a global supplier of technology and services to customers in the process industries, including mining, construction, pulp and paper, power, and oil and gas. The company employs 30,000 people in over 50 countries
Non-institutional shareholders: Solidium Oy 11.1%
2 July 2013
Alexander Virgo Analyst +44 20 3207 7856 [email protected]
Benjamin Glaeser
Analyst +44 20 3207 7918 [email protected]
Y/E 31.12., EUR m 2011 2012 2013E 2014E 2015E
Sales 6,646 7,504 7,259 7,358 7,605
EBITDA 751 800 771 815 869
EBIT 572 599 607 647 699
Net profit 356 372 388 414 461
Y/E net debt (net cash) 437 559 402 240 29
EPS (reported) 2.38 2.49 2.59 2.77 3.08
EPS (recurring) 2.38 2.48 2.59 2.76 3.08
DPS 1.70 1.85 1.85 1.90 1.95
Gross margin 25.1% 24.0% 25.3% 25.9% 25.7%
EBITDA margin 11.3% 10.7% 10.6% 11.1% 11.4%
EBIT margin 8.6% 8.0% 8.4% 8.8% 9.2%
Dividend yield 5.1% 6.2% 6.2% 6.3% 6.5%
ROCE 17.8% 17.3% 16.1% 16.5% 17.1%
EV/sales 0.8 0.7 0.7 0.6 0.6
EV/EBITDA 7.3 6.3 6.4 5.8 5.2
EV/EBIT 9.5 8.5 8.1 7.3 6.5
P/E 13.8 11.4 10.1 9.5 8.5
Source: Company data, Berenberg

Sandvik AB Capital Goods & Industrial Engineering
31
Underperformance belies breadth of portfolio
We reiterate our Buy recommendation on Sandvik, with a SEK115 price target, driven by our view that the ytd underperformance (relative to both the SXNP and its nearest peers) belies the benefits of the breadth of its mining portfolio and the aftermarket revenue streams of its products. Share price performance and valuation suggest expectations are already low enough.
Balanced exposure to capex trends: Of the mining-exposed suppliers we cover, Sandvik has the broadest portfolio. This should offer some benefit in a declining capex environment, particularly as original equipment sales are only 35% of revenue. Systems business (20%) should be more stable (albeit margin-dilutive) and is most exposed (60%) to iron ore. On the negative side, Sandvik has the highest coal exposure (22% of sales) of our coverage universe.
Opex budget exposure is generally favourable: Our preference for process plant opex provides some benefit for Sandvik, with its crushing and screening product offering, while the company’s exposure in mining operations comprises relatively high levels of aftermarket business. Similarly to Atlas, however, we have some concerns over the robustness of the mining operations exposure, with scope for consumables business to hold up less than expected.
Strong mix of equipment offering: Sandvik equipment demonstrates stay-in-business to initial capital ratios of between 10-16x, suggesting strong aftermarket revenue streams. Aftermarket (including consumables, 11%) accounts for 45% of mining revenue. Investors are focused on Systems, though, as this turnkey business is likely to hold up as the rest of the business declines, resulting in lower margins.
Valuation and performance reflect low expectations: Sandvik is the worst-performing stock in our coverage universe (-23% ytd) and expectations have fallen 20% since January (2013E EPS). Mining equipment sales declines of over 30% are built into current consensus expectations, suggesting, along with a 2014E P/E of <10x and EV/EBIT of 7x, investors are discounting considerable declines in the mining business. We derive our price target from a blend of trading multiples, sum-of-the-parts and DCF valuations.
Buy Rating system
Current price
SEK 80.90
Relative
Price target
SEK 115.00 01/07/2013 Stockholm Close Market cap SEK 99,917 m Reuters SAND.ST Bloomberg SAND SS
Changes made in this note Rating Buy (no change) Price target SEK 115.00 (no change) Chg 2013E 2014E 2015E
old Δ% old Δ% old Δ%
Sales 92,128 - 97,061 - 102,647 -
EBIT 14,014 - 16,201 - 18,000 -
EPS 7.07 - 8.51 - 9.65 -
Source: Berenberg estimates
Share data
Shares outstanding (m) 1,246 Enterprise value (SEK m) 120,765 Daily trading volume 5,710,970
Performance data
High 52 weeks (SEK) 108 Low 52 weeks (SEK) 80 Relative performance to SXXP SXNP 1 month -8.4 % -8.9 % 3 months -19.1 % -15.5 % 12 months -24.1 % -29.3 %
2 July 2013
Alexander Virgo Analyst +44 20 3207 7856 [email protected]
Benjamin Glaeser
Analyst +44 20 3207 7918 [email protected]
Y/E 31.12., SEK m 2011 2012 2013E 2014E 2015E
Sales 94,083 98,529 92,128 97,061 102,647
EBITDA 18,073 18,733 18,725 20,956 22,802
EBIT 13,410 14,411 14,014 16,201 18,000
Net profit 7,988 9,312 8,802 10,600 12,025
Y/E net debt (net cash) 25,217 21,132 13,806 8,596 3,308
EPS (reported) 4.63 6.50 6.87 8.51 9.65
EPS (recurring) 6.73 7.47 7.07 8.51 9.65
DPS 3.25 3.50 4.00 4.50 4.50
Gross margin 34.4% 35.2% 36.0% 37.9% 38.7%
EBITDA margin 19.2% 19.0% 20.3% 21.6% 22.2%
EBIT margin 14.3% 14.6% 15.2% 16.7% 17.5%
Dividend yield 3.0% 3.4% 4.4% 5.0% 5.6%
ROCE 22.4% 20.3% 18.6% 20.1% 20.6%
EV/sales 1.7 1.5 1.3 1.2 1.1
EV/EBITDA 8.8 7.7 6.4 5.5 4.8
EV/EBIT 11.9 10.0 8.6 7.1 6.1
P/E 16.1 12.9 11.4 9.4 8.3
Source: Company data, Berenberg

Weir Group plc Capital Goods & Industrial Engineering
32
Strongest aftermarket revenue exposure
The Minerals division has taken up the baton of investor concerns from Oil & Gas, but Weir’s Minerals product portfolio is one of the most favourably positioned of our coverage universe, with 60% of the business from aftermarket. High process plant exposure, high ratios of aftersales revenues to initial capital costs and balanced mineral exposure combine to support our Minerals forecasts. We reiterate our Hold recommendation given that we see limited positive earnings momentum in the near term (estimate changes due to FX only).
Capex exposure driven by replacement cycles: Weir products typically cost much less than $1m per unit, but high wear life and critical nature mean they are a key component of stay-in-business capex. Strong growth in the installed base is positive for aftermarket revenue, though management acknowledged low levels of project commissioning on the IMS call in May. The recent Barrick Gold announcement for Pascua-Lama (a project on which Weir has $53m revenue exposure to initial capex) shows that even projects as close to production as H2 2014E can still be delayed if required.
Opex budget exposure is key for Weir: Our preference for process plant exposure due to high utilisation rates and availability requirements is very favourable for Weir. Weir’s focus on wear life, longevity of equipment, through-life costs and energy savings should also appeal strongly to the end customer.
Very strong product portfolio: Weir’s average stay-in-business ratio is in excess of 25:1, showing just how strong its portfolio is in terms of high-margin aftersales revenue stream. High replacement rates for pumps and cyclones especially, driven by high availability requirements and wear rates, support a strong aftermarket business.
Valuation relatively undemanding, but near-term catalysts limited: Although the stock has pulled back 10% from the ytd highs in March and valuation is relatively undemanding (12x 2014E P/E; 7x 2014E EV/EBITA), we see limited scope for consensus expectations to move up in the near term and prefer to wait for better visibility on international shale development and mining project commissioning to become more constructive on the stock. We value Weir on a blend of trading multiples, sum-of-the-parts and DCF.
Hold Rating system
Current price
GBp 2,187
Relative
Price target
GBp 2,515 01/07/2013 London Close Market cap GBP 3,726 m Reuters WEIR.L Bloomberg WEIR LN
Changes made in this note Rating Hold (no change) Price target GBp 2,515 (no change) Chg 2013E 2014E 2015E
old Δ% old Δ% old Δ%
Sales 2,685 -1 2,858 -1 3,055 -1
EBIT 470 -1 508 0 557 0
EPS 160.41 -0.40 174.64 -0.30 193.36 -0.40
Source: Berenberg estimates
Share data
Shares outstanding (m) 211 Enterprise value (GBP m) 4,390 Daily trading volume 1,065,112
Performance data
High 52 weeks (GBp) 2,474 Low 52 weeks (GBp) 1,491 Relative performance to SXXP SXNP 1 month -1.7 % -2.2 % 3 months -4.1 % -0.5 % 12 months 25.7 % 20.5 %
Key data
Price/book value 3.0 Net gearing 27.4% CAGR sales 2012-2015 5.9% CAGR EPS 2012-2015 6.6%
Business activities: Founded in 1871, Weir employs in the region of 13,000 people globally. The company manufactures and services pumps, valves and rubber rollers & screening machines for the Minerals, Oil & Gas and Power end markets.
Non-institutional shareholders: None with >3%
2 July 2013
Alexander Virgo Analyst +44 20 3207 7856 [email protected]
Benjamin Glaeser
Analyst +44 20 3207 7918 [email protected]
Y/E 31.12., GBP m 2011 2012 2013E 2014E 2015E
Sales 2,292 2,538 2,665 2,818 3,013
EBITDA 450 535 571 609 661
EBIT 409 469 468 506 555
Net profit 279 312 309 339 379
Y/E net debt (net cash) 673 689 571 237 -40
EPS (reported) 130.83 146.39 144.61 158.86 177.40
EPS (recurring) 132.29 148.55 159.80 174.04 192.58
DPS 33.04 38.03 43.74 50.30 57.84
Gross margin 34.8% 35.0% 39.5% 39.8% 38.8%
EBITDA margin 19.6% 21.1% 21.4% 21.6% 21.9%
EBIT margin 17.0% 17.7% 17.6% 18.0% 18.4%
Dividend yield 1.5% 1.9% 2.5% 2.9% 3.3%
ROCE 19.3% 19.5% 20.0% 21.8% 24.2%
EV/sales 2.1 1.8 1.6 1.4 1.3
EV/EBITDA 10.5 8.4 7.7 6.7 5.7
EV/EBIT 11.5 9.3 8.6 7.4 6.3
P/E 14.3 11.9 13.5 12.4 11.2
Source: Company data, Berenberg

Mining machinery Capital Goods & Industrial Engineering
33
Please note that the use of this research report is subject to the conditions and restrictions set forth in the “General investment-related disclosures” and the “Legal disclaimer” at the end of this document.
For analyst certification and remarks regarding foreign investors and country-specific disclosures, please refer to the respective paragraph at the end of this document.
Disclosures in respect of section 34b of the German Securities Trading Act (Wertpapierhandelsgesetz – WpHG)
Company Disclosures Atlas Copco AB no disclosures Metso Oyj no disclosures Sandvik AB no disclosures Weir Group plc no disclosures (1) Joh. Berenberg, Gossler & Co. KG (hereinafter referred to as “the Bank”) and/or its affiliate(s) was Lead
Manager or Co-Lead Manager over the previous 12 months of a public offering of this company. (2) The Bank acts as Designated Sponsor for this company. (3) Over the previous 12 months, the Bank and/or its affiliate(s) has effected an agreement with this company
for investment banking services or received compensation or a promise to pay from this company for investment banking services.
(4) The Bank and/or its affiliate(s) holds 5% or more of the share capital of this company. (5) The Bank holds a trading position in shares of this company. Historical price target and rating changes for Atlas Copco AB in the last 12 months (full coverage)
Date Price target - SEK Rating Initiation of coverage
12 July 12 145.00 Hold 11 October 11
01 August 12 151.00 Hold
26 October 12 161.00 Hold
08 January 13 185.00 Hold
01 May 13 165.00 Sell
Historical price target and rating changes for Metso Oyj in the last 12 months (full coverage)
Date Price target - EUR Rating Initiation of coverage
14 September 12 38.00 Buy 14 September 12
06 November 12 35.00 Buy
08 January 13 38.00 Buy
Historical price target and rating changes for Sandvik AB in the last 12 months (full coverage)
Date Price target - SEK Rating Initiation of coverage
16 July 12 100.00 Hold 11 October 11
31 July 12 102.00 Hold
23 November 12 114.00 Buy
28 November 12 117.00 Buy
08 January 13 118.00 Buy
01 May 13 115.00 Buy
Historical price target and rating changes for Weir Group plc in the last 12 months (full coverage)
Date Price target - GBp Rating Initiation of coverage
08 August 12 2285.00 Buy 11 October 11
08 January 13 2380.00 Buy
18 March 13 2552.00 Hold
01 May 13 2515.00 Hold

Mining machinery Capital Goods & Industrial Engineering
34
Berenberg distribution of ratings and in proportion to investment banking services
Buy 41.43 % 50.00 % Sell 19.27 % 8.82 % Hold 39.31 % 41.18 %
Valuation basis/rating key
The recommendations for companies analysed by the Bank’s equity research department are either made on an absolute basis (“absolute rating system”) or relative to the sector (“relative rating system“), which is clearly stated in the financial analysis. For both absolute and relative rating system, the three-step rating key “Buy”, “Hold” and “Sell” is applied. For a detailed explanation of our rating system, please refer to our website at
http://www.berenberg.de/research.html?&L=1
NB: During periods of high market, sector or stock volatility, or in special situations, the rating system criteria as described on our website may be breached temporarily.
Competent supervisory authority
Bundesanstalt für Finanzdienstleistungsaufsicht -BaFin- (Federal Financial Supervisory Authority), Graurheindorfer Straße 108, 53117 Bonn and Marie-Curie-Str. 24-28, 60439 Frankfurt am Main, Germany.
General investment-related disclosures Joh. Berenberg, Gossler & Co. KG (hereinafter referred to as „the Bank“) has made every effort to carefully research all information contained in this financial analysis. The information on which the financial analysis is based has been obtained from sources which we believe to be reliable such as, for example, Thomson Reuters, Bloomberg and the relevant specialised press as well as the company which is the subject of this financial analysis. Only that part of the research note is made available to the issuer (who is the subject of this analysis) which is necessary to properly reconcile with the facts. Should this result in considerable changes a reference is made in the research note.
Opinions expressed in this financial analysis are our current opinions as of the issuing date indicated on this document. The companies analysed by the Bank are divided into two groups: those under “full coverage” (regular updates provided); and those under “screening coverage” (updates provided as and when required at irregular intervals).
The functional job title of the person/s responsible for the recommendations contained in this report is “Equity Research Analyst” unless otherwise stated on the cover.
The following internet link provides further remarks on our financial analyses: http://www.berenberg.de/research.html?&L=1&no_cache=1
Legal disclaimer This document has been prepared by Joh. Berenberg, Gossler & Co. KG (hereinafter referred to as „the Bank“). This document does not claim completeness regarding all the information on the stocks, stock markets or developments referred to in it. On no account should the document be regarded as a substitute for the recipient procuring information for himself/herself or exercising his/her own judgements. The document has been produced for information purposes for institutional clients or market professionals. Private customers, into whose possession this document comes, should discuss possible investment decisions with their customer service officer as differing views and opinions may exist with regard to the stocks referred to in this document.

Mining machinery Capital Goods & Industrial Engineering
35
This document is not a solicitation or an offer to buy or sell the mentioned stock.
The document may include certain descriptions, statements, estimates, and conclusions underlining potential market and company development. These reflect assumptions, which may turn out to be incorrect. The Bank and/or its employees accept no liability whatsoever for any direct or consequential loss or damages of any kind arising out of the use of this document or any part of its content.
The Bank and/or its employees may hold, buy or sell positions in any securities mentioned in this document, derivatives thereon or related financial products. The Bank and/or its employees may underwrite issues for any securities mentioned in this document, derivatives thereon or related financial products or seek to perform capital market or underwriting services.
Analyst certification I, Alexander Virgo, hereby certify that all of the views expressed in this report accurately reflect my personal views about any and all of the subject securities or issuers discussed herein.
In addition, I hereby certify that no part of my compensation was, is, or will be, directly or indirectly related to the specific recommendations or views expressed in this research report, nor is it tied to any specific investment banking transaction performed by the Bank or its affiliates.
I, Benjamin Glaeser, hereby certify that all of the views expressed in this report accurately reflect my personal views about any and all of the subject securities or issuers discussed herein.
In addition, I hereby certify that no part of my compensation was, is, or will be, directly or indirectly related to the specific recommendations or views expressed in this research report, nor is it tied to any specific investment banking transaction performed by the Bank or its affiliates.
Remarks regarding foreign investors The preparation of this document is subject to regulation by German law. The distribution of this document in other jurisdictions may be restricted by law, and persons into whose possession this document comes should inform themselves about, and observe, any such restrictions.
United Kingdom This document is meant exclusively for institutional investors and market professionals, but not for private customers. It is not for distribution to or the use of private investors or private customers.
United States of America This document has been prepared exclusively by the Bank. Although Berenberg Capital Markets LLC, an affiliate of the Bank and registered US broker-dealer, distributes this document to certain customers, Berenberg Capital Markets LLC does not provide input into its contents, nor does this document constitute research of Berenberg Capital Markets LLC. In addition, this document is meant exclusively for institutional investors and market professionals, but not for private customers. It is not for distribution to or the use of private investors or private customers.
This document is classified as objective for the purposes of FINRA rules. Please contact Berenberg Capital Markets LLC (+1 617.292.8200), if you require additional information.
Third-party research disclosures
Company Disclosures Atlas Copco AB no disclosures Metso Oyj no disclosures Sandvik AB no disclosures Weir Group plc no disclosures (1) Berenberg Capital Markets LLC owned 1% or more of the outstanding shares of any class of the subject
company by the end of the prior month.* (2) Over the previous 12 months, Berenberg Capital Markets LLC has managed or co-managed any public
offering for the subject company.* (3) Berenberg Capital Markets LLC is making a market in the subject securities at the time of the report.

Mining machinery Capital Goods & Industrial Engineering
36
(4) Berenberg Capital Markets LLC received compensation for investment banking services in the past 12 months, or expects to receive such compensation in the next 3 months.*
(5) There is another potential conflict of interest of the analyst or Berenberg Capital Markets LLC, of which the analyst knows or has reason to know at the time of publication of this research report.
* For disclosures regarding affiliates of Berenberg Capital Markets LLC please refer to the ‘Disclosures in respect of section 34b of the German Securities Trading Act (Wertpapierhandelsgesetz – WpHG)’ section above.
Copyright The Bank reserves all the rights in this document. No part of the document or its content may be rewritten, copied, photocopied or duplicated in any form by any means or redistributed without the Bank’s prior written consent.
© May 2013 Joh. Berenberg, Gossler & Co. KG

Mining machinery Capital Goods & Industrial Engineering
37
Contacts: Investment Banking
Equity Research E-mail: [email protected]; Internet www.berenberg.de
BANKS ECONOMICS MID-CAP GENERAL
Nick Anderson +44 (0) 20 3207 7838 Dr. Holger Schmieding +44 (0) 20 3207 7889 Gunnar Cohrs +44 (0) 20 3207 7894
James Chappell +44 (0) 20 3207 7844 Dr. Christian Schulz +44 (0) 20 3207 7878 Bjoern Lippe +44 (0) 20 3207 7845
Andrew Lowe +44 (0) 20 3465 2743 Robert Wood +44 (0) 20 3207 7822 Anna Patrice +44 (0) 20 3207 7863
Eoin Mullany +44 (0) 20 3207 7854 Stanislaus von Thurn und Taxis +44 (0) 20 3465 2631
Eleni Papoula +44 (0) 20 3465 2741 FOOD MANUFACTURING
Michelle Wilson +44 (0) 20 3465 2663 Fintan Ryan +44 (0) 20 3465 2748 OIL & GAS
Andrew Steele +44 (0) 20 3207 7926 Asad Farid +44 (0) 20 3207 7932
BEVERAGES James Targett +44 (0) 20 3207 7873 Jaideep Pandya +44 (0) 20 3207 7890
Philip Morrisey +44 (0) 20 3207 7892
Josh Puddle +44 (0) 20 3207 7881 GENERAL RETAIL & LUXURY GOODS REAL ESTATE
Bassel Choughari +44 (0) 20 3465 2675 Kai Klose +44 (0) 20 3207 7888
BUSINESS SERVICES John Guy +44 (0) 20 3465 2674 Estelle Weingrod +44 (0) 20 3207 7931
William Foggon +44 (0) 20 3207 7882
Simon Mezzanotte +44 (0) 20 3207 7917 HEALTHCARE TECHNOLOGY
Arash Roshan Zamir +44 (0) 20 3465 2636 Scott Bardo +44 (0) 20 3207 7869 Adnaan Ahmad +44 (0) 20 3207 7851
Konrad Zomer +44 (0) 20 3207 7920 Alistair Campbell +44 (0) 20 3207 7876 Sebastian Grabert +44 (0) 20 3207 7834
Charles Cooper +44 (0) 20 3465 2637 Daud Khan +44 (0) 20 3465 2638
CAPITAL GOODS Louise Hinds +44 (0) 20 3465 2747 Ali Khwaja +44 (0) 20 3207 7852
Frederik Bitter +44 (0) 20 3207 7916 Adrian Howd +44 (0) 20 3207 7874 Tammy Qiu +44 (0) 20 3465 2673
Benjamin Glaeser +44 (0) 20 3207 7918 Tom Jones +44 (0) 20 3207 7877
William Mackie +44 (0) 20 3207 7837 TELECOMMUNICATIONS
Margaret Paxton +44 (0) 20 3207 7934 HOUSEHOLD & PERSONAL CARE Wassil El Hebil +44 (0) 20 3207 7862
Alexander Virgo +44 (0) 20 3207 7856 Jade Barkett +44 (0) 20 3207 7937 Usman Ghazi +44 (0) 20 3207 7824
Felix Wienen +44 (0) 20 3207 7915 Seth Peterson +44 (0) 20 3207 7891 Stuart Gordon +44 (0) 20 3207 7858
Laura Janssens +44 (0) 20 3465 2639
CHEMICALS INSURANCE Paul Marsch +44 (0) 20 3207 7857
John Philipp Klein +44 (0) 20 3207 7930 Tom Carstairs +44 (0) 20 3207 7823 Barry Zeitoune +44 (0) 20 3207 7859
Evgenia Molotova +44 (0) 20 3465 2664 Peter Eliot +44 (0) 20 3207 7880
Jaideep Pandya +44 (0) 20 3207 7890 Kai Mueller +44 (0) 20 3465 2681 TOBACCO
Matthew Preston +44 (0) 20 3207 7913 Erik Bloomquist +44 (0) 20 3207 7870
CONSTRUCTION Sami Taipalus +44 (0) 20 3207 7866 Kate Kalashnikova +44 (0) 20 3465 2665
Chris Moore +44 (0) 20 3465 2737
Robert Muir +44 (0) 20 3207 7860 MEDIA UTILITIES
Michael Watts +44 (0) 20 3207 7928 Robert Berg +44 (0) 20 3465 2680 Robert Chantry +44 (0) 20 3207 7861
Emma Coulby +44 (0) 20 3207 7821 Andrew Fisher +44 (0) 20 3207 7937
DIVERSIFIED FINANCIALS Laura Janssens +44 (0) 20 3465 2639 Oliver Salvesen +44 (0) 20 3207 7818
Pras Jeyanandhan +44 (0) 20 3207 7899 Sarah Simon +44 (0) 20 3207 7830 Lawson Steele +44 (0) 20 3207 7887
Sales E-mail: [email protected]; Internet www.berenberg.de
Specialist Sales Sales Sales Trading
BANKS LONDON HAMBURG
Iro Papadopoulou +44 (0) 20 3207 7924 John von Berenberg-Consbruch +44 (0) 20 3207 7805 Paul Dontenwill +49 (0) 40 350 60 563
Matt Chawner +44 (0) 20 3207 7847 Alexander Heinz +49 (0) 40 350 60 359
CONSUMER Toby Flaux +44 (0) 20 3465 2745 Gregor Labahn +49 (0) 40 350 60 571
Rupert Trotter +44 (0) 20 3207 7815 Karl Hancock +44 (0) 20 3207 7803 Chris McKeand +49 (0) 40 350 60 798
Sean Heath +44 (0) 20 3465 2742 Fin Schaffer +49 (0) 40 350 60 596
INSURANCE David Hogg +44 (0) 20 3465 2628 Lars Schwartau +49 (0) 40 350 60 450
Trevor Moss +44 (0) 20 3207 7893 Zubin Hubner +44 (0) 20 3207 7885 Marvin Schweden +49 (0) 40 350 60 576
Ben Hutton +44 (0) 20 3207 7804 Tim Storm +49 (0) 40 350 60 415
HEALTHCARE James Matthews +44 (0) 20 3207 7807 Philipp Wiechmann +49 (0) 40 350 60 346
Frazer Hall +44 (0) 20 3207 7875 David Mortlock +44 (0) 20 3207 7850
Peter Nichols +44 (0) 20 3207 7810 LONDON
INDUSTRIALS Richard Payman +44 (0) 20 3207 7825 Mike Berry +44 (0) 20 3465 2755
Chris Armstrong +44 (0) 20 3207 7809 George Smibert +44 (0) 20 3207 7911 Stewart Cook +44 (0) 20 3465 2752
Kaj Alftan +44 (0) 20 3207 7879 Anita Surana +44 (0) 20 3207 7855 Simon Messman +44 (0) 20 3465 2754
Paul Walker +44 (0) 20 3465 2632 Stephen O'Donohoe +44 (0) 20 3465 2753
MEDIA
Julia Thannheiser +44 (0) 20 3465 2676 PARIS PARIS
Christophe Choquart +33 (0) 1 5844 9508 Sylvain Granjoux +33 (0) 1 5844 9509
TECHNOLOGY Dalila Farigoule +33 (0) 1 5844 9510
Jean Beaubois +44 (0) 20 3207 7835 Clémence La Clavière-Peyraud +33 (0) 1 5844 9521 SOVEREIGN WEALTH FUNDS
Olivier Thibert +33 (0) 1 5844 9512 Max von Doetinchem +44 (0) 20 3207 7826
TELECOMMUNICATIONS
Julia Thannheiser +44 (0) 20 3465 2676 ZURICH CORPORATE ACCESS
Stephan Hofer +41 (0) 44 283 2029 Patricia Nehring +44 (0) 20 3207 7811
UTILITIES Carsten Kinder +41 (0) 44 283 2024
Benita Barretto +44 (0) 20 3207 7829 Gianni Lavigna +41 (0) 44 283 2038 EVENTS
Benjamin Stillfried +41 (0) 44 283 2033 Natalie Meech +44 (0) 20 3207 7831
Sales Charlotte Kilby +44 (0) 20 3207 7832
FRANKFURT BENELUX Charlotte Reeves +44 (0) 20 3465 2671
Michael Brauburger +49 (0) 69 91 30 90 741 Miel Bakker (London) +44 (0) 20 3207 7808 Hannah Whitehead +44 (0) 20 3207 7922
Nina Buechs +49 (0) 69 91 30 90 735 Susette Mantzel (Hamburg) +49 (0) 40 350 60 694
André Grosskurth +49 (0) 69 91 30 90 734 Alexander Wace (London) +44 (0) 20 3465 2670 CRM
Boris Koegel +49 (0) 69 91 30 90 740 Greg Swallow +44 (0) 20 3207 7833
Joerg Wenzel +49 (0) 69 91 30 90 743 SCANDINAVIA Laura Cooper +44 (0) 20 3207 7806
Ronald Bernette (London) +44 (0) 20 3207 7828
Marco Weiss (Hamburg) +49 (0) 40 350 60 719
US Sales E-mail: [email protected]
BERENBERG CAPITAL MARKETS LLC
Member FINRA & SIPC
Andrew Holder +1 (617) 292 8222 Burr Clark +1 (617) 292 8282 Kieran O'Sullivan +1 (617) 292 8292
Colin Andrade +1 (617) 292 8230 Julie Doherty +1 (617) 292 8228 Emily Mouret +1 (646) 445 7204
Cathal Carroll +1 (646) 445 7206 Kelleigh Faldi +1 (617) 292 8288 Jonathan Saxon +1 (646) 445 7202

38