Berenberg Thematics - Battery Technology
174
ATLAS ALPHA • THOUGHT LEADERSHIP • ACCESS • SERVICE Berenberg Thematics Battery adoption at the tipping point 10 February 2016 Asad Farid, CFA Analyst +44 20 3207 7932 [email protected] Nick Anderson Analyst +44 20 3207 7838 [email protected] Jamie Rosser Analyst +44 20 3465 2732 [email protected] Chris Armstrong Specialist Sales +44 20 3207 7809 [email protected]
-
Upload
jamie-rosser -
Category
Documents
-
view
345 -
download
25
Transcript of Berenberg Thematics - Battery Technology

ATLAS ALPHA • THOUGHT LEADERSHIP • ACCESS • SERVICE
Berenberg Thematics
Battery adoption at the tipping point
10 February 2016
Asad Farid, CFA Analyst
+44 20 3207 7932 [email protected]
Nick Anderson Analyst
+44 20 3207 7838 [email protected]
Jamie Rosser Analyst
+44 20 3465 2732 [email protected]
Chris Armstrong Specialist Sales
+44 20 3207 7809 [email protected]

Berenberg Thematics
What is Berenberg Thematics?
Under our Thematics brand, we will focus on big, longer-term themes --- specifically, disruptive technologies, demographics and corporate governance issues --- which we feel investors should be looking at. Within each note, we will highlight trends and issues that we believe to be of interest to investors, and the effect of these on sectors and stocks which we view as beneficiaries or at risk from the specific theme. The companies that we will consider will include those already under coverage, those not covered, and also relevant privately-owned
businesses, which we believe will be affected.
THE TEAM
Asad Farid has been working at Berenberg for the past four years. His previous focus was
on the oil and gas sector where he was the lead analyst for oil field services. Before joining Berenberg, he worked as an economist and banking analyst at AKD Securities and has eight years of sell-side research experience. Asad is an MBA from University of Cambridge and is a CFA charter holder. As apart of his MBA programme, Asad completed internships at Google and with Berenberg’s Technology Hardware team.
Nick Anderson joined the Thematics team in 2016 having previously built up and led the
banking team; he joined Berenberg in 2010. Nick has over 20 years’ experience as a top-ranked sell-side equity analyst including spells as co-head of the Lehman Brothers European banks team and as a transport analyst at both Lehman Brothers and HSBC James Capel. In addition, he has worked as a management consultant at McKinsey. Nick
has degrees in economics and management studies from the University of Cambridge and in wine production from the University of Brighton.
Jamie Rosser joined Berenberg in September 2014 on the graduate scheme. Having
successfully completed the programme, he joined the Thematics team in November 2015. Prior to this, Jamie gained experience through internships with Grant Thornton, Ignis Asset
Management and the Phoenix Group. Jamie graduated from the University of Bath with a BSc in Mathematics and has passed the CFA level I exam.
Chris Armstrong has 20 years of experience on both the buy-side (as an analyst and
portfolio manager) and on the sell-side, most recently as industrial specialist sales. Chris joined Berenberg as a Swiss equity salesman in 2006, before specialising in industrials in 2009. He has previously been a portfolio manager/analyst at Axa Framlington, Bank of Tokyo-Mitsubishi and NatWest, and holds a BA in Economics from Durham University.
For our disclosures in respect of section 34b of the German Securities Trading Act (Wertpapierhandelsgesetz – WpHG) and our disclaimer please see the end of this document.
Please note that the use of this research report is subject to the conditions and restrictions set forth in the disclosures and the disclaimer at the end of this document.

Berenberg Thematics
3
Table of contents
Battery adoption at the tipping point 4
Battery technology – drivers and implications 5
Section 1: Batteries – market overview 18
Cost evolution for lithium ion 23
Section 2: Energy storage for autos – mass adoption is nearing 32
EV uptake – impressive growth but mass adoption yet to be achieved 36
Regulatory incentives – a key growth driver for energy storage in autos 54
Charging infrastructure 57
Mass transit 70
Implications for autos – identifying the winners 76
Section 3: Energy storage for renewables/utilities 98
Uptake of utility-scale battery storage by the power sector 107
Outlook and implications: structural growth guaranteed; storage likely to replace gas-fired peaker plants 121
Implications for utilities – battery storage is more of an opportunity than an “existential” threat 124
Section 4: Implications of the growth in lithium ion batteries for the lithium sector 141
Lithium supply outlook 2015-2025 146
Lithium demand outlook 2015-25: strong structural growth driven by automotive and power sectors 149
Lithium market headed towards supply demand imbalance – prices are headed upwards 152
Risk to thesis 165
Disclosures in respect of section 34b of the German Securities Trading Act
(Wertpapierhandelsgesetz – WpHG) 168

Berenberg Thematics
Battery adoption at the tipping point
● Disruptive technologies cannot be ignored by investors. In this, our first Berenberg Thematics report, we explore potential disruption to the automotive and utilities industries (7% of Europe’s market cap), among others, from the mass adoption of new battery technologies. We forecast the combined market for electric passenger vehicles (EVs), electric buses (EBs) and battery storage to increase eight-fold to over $200bn by 2020, a five-year CAGR of more than 50%. The tipping point is nearing as battery economics become cost-effective, helped by favourable regulation, expanding product offerings and infrastructure, and surging renewable generation. Many automotive OEMs will survive (those with scale and vision) but some incumbent utilities are at risk (especially those focused on a centralised distribution model). We also identify nine stocks to watch within the extended lithium ion battery value chain.
● Introducing Berenberg Thematics: Our new Thematics product will focus on major, five-year themes that have a material impact across several sectors. A collaborative effort involving all of Berenberg’s sector teams, reports will combine a deep-dive on the theme with a detailed stock analysis of the winners and losers. Our initial focus is on three sub-themes: disruptive technology, demographics and corporate governance.
● Why read this report? Disruptive technologies matter: In 1980, McKinsey forecast that the size of the US mobile phone market would reach 900,000 handsets by 2000. The actual number was 109m. Such new technologies can be “sustaining”, which favour incumbent producers, or “disruptive”, which allow new entrants, after an initial slow rate of adoption, to unexpectedly replace established ones. Digital cameras and mobile phones are recent examples; we think batteries come next. Investors must engage in the debate as transformational change is likely.
● Why now? Battery technology is coming of age: There have been many false dawns in the mass adoption of batteries in the automotive and utilities industries in the last 20 years. But as the comparative cost of batteries finally moves towards parity with incumbent hydrocarbon solutions, mass market adoption is close to tipping point.
● Automotive disruption – the EV market will grow 14-fold to $140bn by 2020: Favourable regulation, falling battery/EV costs, improving product range and expansion in charging infrastructure will drive rapid growth. Scale and vision will separate winners from losers. We think Daimler (Buy), BMW (Hold), Renault (Buy), Volkswagen (Buy) and GM will transition successfully to join Tesla (Sell). Toyota and Peugeot (Sell), in contrast, are challenged. EBs offer an additional $60bn market by 2020 – three-fold growth.
● Utilities disruption – battery storage will be a $14bn market by 2020 – a 28-fold growth: Demand will be driven by renewables investment (creating unpredictable generation), a reduction in battery costs and regulation. Distributed power generation and micro grids threaten the centralised distribution model. Incumbent utilities will be disrupted, but in Europe, RWE (Sell), E.ON (Sell) and Enel (Buy) will be the least threatened given their renewable/storage exposure.
● The lithium ion battery industry offers opportunities: We expect lithium ion to be the dominant battery technology. Consolidation and barriers to entry key to sustained returns for suppliers. Well-placed suppliers within an extended value chain include: low-cost lithium miners, energy storage battery producers, renewables/micro grid equipment suppliers, selected semiconductor manufacturers, and suppliers of next-generation lithium ion batteries.
● Nine stocks to watch: Stocks well placed to benefit from the battery revolution include: Infineon Technologies (Buy), Umicore (Sell), Albemarle, Maxwell, Orocobre, RedT, SMA, BYD and Solar City.
10 February 2016
Asad Farid, CFA Analyst +44 20 3207 7932 [email protected]
Nick Anderson Analyst +44 20 3207 7838 [email protected]
Jamie Rosser Analyst +44 20 3465 2732 [email protected]
Chris Armstrong Specialist Sales +44 20 3207 7809 [email protected]

Berenberg Thematics
5
Battery technology – drivers and implications
Source: Berenberg

Berenberg Thematics
6
Battery adoption at the tipping point
“Mastery itself was the prize” was how Churchill described his initially controversial decision to change the Royal Navy’s fuel from locally-sourced coal to insecure petroleum supplies from Persia (now Iran). History might have unfolded quite differently had the UK delayed this transformative shift to a superior technology prior to the outbreak of World War I. Today, regulatory bodies, automotive companies, power utilities and a diverse array of other sectors are again faced with the question of how to deal with a prospective disruptive shift to battery energy storage which is still considered by many market participants as economically unviable. For the forerunners investing heavily in battery storage, mastery again is the prize.
There have, however, been a number of false dawns in the adoption of rechargeable batteries, leading to classic failures such as GM’s EV1 electric vehicle in 1996. Similarly, over the last decade, the euphoria about the anticipated demand for raw materials required for batteries created expectations of a sharp spike in lithium prices along with price increases for other minerals, too, such as graphite, nickel and cobalt. This led to a number of lithium mining project failures for the smaller mining companies when the price increase failed to materialise.
The Achilles heel of rechargeable batteries has always been their comparative cost versus hydrocarbon-based power generation, whether for automotive propulsion or electricity generation/storage for utilities. We think that this disadvantage is close to being bridged and that battery technology adoption is at the tipping point. Over the next three years, we believe that batteries will break into the automotive and stationary storage mass markets. Three sectors – automotive, utilities and mass transport – will drive the market for batteries. We expect lithium ion to be the dominant battery technology for the next five years.
Automotives – size of the EV market set to grow from $10bn in 2014
to $140bn by 2020
We expect sales of plug-in electric vehicles (PEVs) to grow from ~0.3m cars in 2014 to 4m by 2020 – a 4% market penetration rate, split equally between all-electric battery electric vehicles (BEVs) and plug-in hybrid electric vehicles (PHEVs). Assuming an average EV price of $35,000, this translates into EV market/sales growing from $10bn in 2014 to $140bn by 2020. This growth will be driven by regulatory requirements for emissions reduction, EV price reduction due to economies of scale in battery manufacturing, wider availability of charging infrastructure and greater diversity of EV offerings by OEMs over the next five years.
In our view, there are four factors that will drive electrification of the automotive sector.
Factor #1 Factor #1 Factor #1 Factor #1 –––– high regulatory support for EVs to reduce the air high regulatory support for EVs to reduce the air high regulatory support for EVs to reduce the air high regulatory support for EVs to reduce the air pollution that is pollution that is pollution that is pollution that is plaguing urban centresplaguing urban centresplaguing urban centresplaguing urban centres
Transport-related air pollution is responsible for $0.9tn of economic losses in OECD countries, according to OECD research: Air pollution causes 0.5m premature deaths per annum in OECD countries and 1.6m deaths per annum in China. Economic loss from transport-based air pollution is estimated at $0.9tn per annum in OECD countries (50% of air pollution is attributable to transport, according to the OECD) and $0.6tn for China (assuming transport is responsible for 40% of air pollution in China).
Electrification of transportation is a priority for major OECD countries and China in order to reduce transport-related air pollution: Direct purchase subsidies form more than 20% of a car’s purchase price in larger economies. However, the level of direct subsidies for EVs across different countries pales in comparison to the economic loss from air pollution (see chart below). Hence, despite some market concerns, we do not think that the risk of an abrupt end to EV subsidies is very high. We expect subsidies for PHEVs to be phased out sooner than those for BEVs. Continued subsidies for BEVs will provide an impetus to their adoption as manufacturing costs for batteries come down. There is also a possibility that there will be a shift from direct EV subsidies to subsidies for building infrastructure.

Berenberg Thematics
7
EV purchase subsidies – 20% of an EV’s purchase price is subsidised
Source: WHO, OECD, US Department of Energy (DoE), CAAM, Berenberg
FactorFactorFactorFactor #2 #2 #2 #2 –––– the economics of mass production: battery costs are to decline by the economics of mass production: battery costs are to decline by the economics of mass production: battery costs are to decline by the economics of mass production: battery costs are to decline by $130/kWh (down by 43%) to reach $170/kWh by 2020$130/kWh (down by 43%) to reach $170/kWh by 2020$130/kWh (down by 43%) to reach $170/kWh by 2020$130/kWh (down by 43%) to reach $170/kWh by 2020
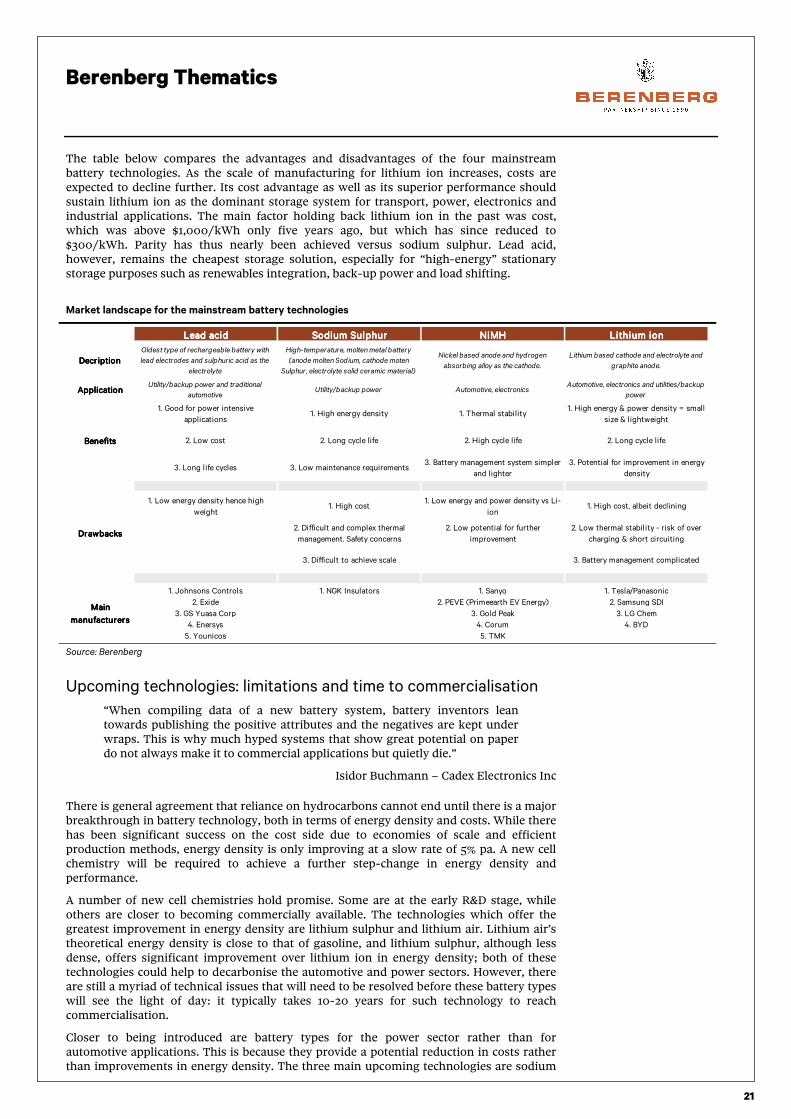
Cell level economies of scale – cost reduction of $70/kWh: Battery manufacturing plans announced by Tesla (in partnership with Panasonic), BYD, LG and Samsung will increase global automotive lithium ion battery manufacturing capacity (currently at ~27GWh) by 4x to 110GWh over 2015-2020. Assuming that global production of lithium ion cells (including automotive) doubles by 2020, this should lead to cost savings of 35% (ie $70/kWh) in cell manufacturing.
Pack level economies of scale of $60/kWh: Currently, battery pack manufacturing per plant is well below 100,000 packs per annum. However, Tesla’s battery pack manufacturing capacity at its new Gigafactory facility in Nevada will increase from 100,000 packs in 2017/18 to 500,000 packs by 2020/21. We estimate that this will lead to cost savings of 20-25% at the pack level, ie $60/kWh.
If battery pack costs decline to $170/kWh by 2020, then the price premium which EVs have versus ICVs will end
Source: Berenberg
Factor #3 Factor #3 Factor #3 Factor #3 –––– a vast improvement in EV product offering by traditional OEMs: at a vast improvement in EV product offering by traditional OEMs: at a vast improvement in EV product offering by traditional OEMs: at a vast improvement in EV product offering by traditional OEMs: at least 13 BEV and 25 PHEV models will be introduced over 2016least 13 BEV and 25 PHEV models will be introduced over 2016least 13 BEV and 25 PHEV models will be introduced over 2016least 13 BEV and 25 PHEV models will be introduced over 2016----20202020
Traditional OEMs are entering the EV space, led by Volkswagen, Daimler, GM and Ford: Currently, there are only a few BEV models available in the US and Europe, produced by three main manufacturers: Tesla, BMW and Renault-Nissan. The competitive environment and the number of EV options available to consumers are set to radically alter over the next five years. Traditional OEMs such as Volkswagen, Daimler, GM and Ford have aggressive medium-term EV roll-out plans. Based on their officially announced plans, at least 13 new BEV models and 25 PHEV models across the entire price spectrum (mass market to luxury) will be launched by 2020.
No . o f de a t hs
from a ir
po llu t ion 2 0 12
E c onomic
loss
($ bn)
US 114804 568
China 1600000 1400
G e rma ny 72000 277
UK 52430 202
Fra nc e 52600 185
6975
7700
0
6600
6500
0 10000
USUSUSUS
ChinaChinaChinaChina
GermanyGermanyGermanyGermany
UKUKUKUK
FranceFranceFranceFrance
Direct purchase subsidies on new EV (EUR)
300
170
70
60
0
50
100
150
200
250
300
350
Battery packcost 2015
Cell leveleconomies of
scale
Pack leveleconomies of
scale
Battery packcost 2020
$/kWh
Price premium vs Price premium vs Price premium vs Price premium vs
battery cost savingsbattery cost savingsbattery cost savingsbattery cost savings$'000$'000$'000$'000
Tesla S (70kWh) price
premium over Jaguar
XJ Saloon excl. subsidy
5
Battery price reduction
(2015-20)-9
21
12
49
49
0 20 40 60 80
2015
2020
Battery pack cost $'000 Others

Berenberg Thematics
8
The mass market is where the war will be fought: The main growth market which is likely to open up for EV manufacturers as a result of reduction in battery costs will be the mass market (ie cars priced under $35,000). Although currently the Nissan Leaf and the Renault Zoe are targeted at the mass market, adoption is significantly hindered by their low effective range of below 100 miles. This is set to change in 2016 and 2017, with the launch of two prominent new models – the $35,000 Chevrolet Bolt and the $35,000 Tesla Model 3, both of which will offer a range of ~200 miles. We think that falling battery costs and rising range for smaller EVs will open the mass market for electrification.
The number of EV models available to consumers will rise to 58
by 2020
A 200-mile range (ie the Bolt and Model 3 EVs) will significantly
lower “range anxiety” among mass market EV owners
Source: Berenberg, Company press releases and news reports Source: Berenberg
Factor #4 Factor #4 Factor #4 Factor #4 –––– rapid expansion in charging infrastructure to cut range anxiety rapid expansion in charging infrastructure to cut range anxiety rapid expansion in charging infrastructure to cut range anxiety rapid expansion in charging infrastructure to cut range anxiety –––– China is targeting 5m charging points by 2020China is targeting 5m charging points by 2020China is targeting 5m charging points by 2020China is targeting 5m charging points by 2020
The level of investment in EV charging infrastructure has increased sharply: Global annual spending on EV charging infrastructure rose by more than 3x in 2013-14 versus the prior four years. National, state and city administrations along with automotive OEMs, utilities and charging equipment manufacturers are financing the ongoing investment in charging infrastructure. In countries such as the US, the UK, France and Norway), financial support is available for both residential and high power inter-/intra-city charging points.
The global EV charging network is fast expanding: As a result of the high level of investment, the global EV charging network has more than doubled in terms of the number of slow-charging points and risen by 8x for fast-charging points since end-2012. The US is currently leading in the deployment of public EV charging. However, China has announced plans to set up 5m charging points by 2020 in its attempt to raise EV sales to 5m cars by then. This would likely to ease charging network constraints in its main cities, such as Shanghai and Beijing.
National and state level support resulting in strong growth in public EV charging network
Source: IHS, China 13th five-year development plan, US DoE, Berenberg estimates
0
10
20
30
40
50
60
70
2015 2020BEV PHEV
20202020
58585858
Number
Number
Number
Numberof available EV models
of available EV models
of available EV models
of available EV models
No. o f E V
c ha rg ing
po in t s re la t ive
t o pe t ro l
st a t ions ra t io
Na t iona l support a nd t a rge t s
Ch ina 0.3National target to install 5mn charging
points by 2020
US 0.3
US DoE has invested >0.4bn in
elec trification of the t ransportat ion sec tor.
Numerous state level funding schemes for
charging infrast ruc ture
G e rma ny 0.9 No national support apart from R&D
UK 2.0
EUR44mn spent on set t ing up charging
infrast ruc ture. Subsidy on resident ial
equipment at £700.
Fra nc e 2.0EUR50m allocated to finance 50% of EV
infrast ruc ture charging costs
34,504

Berenberg Thematics
9
Utilities – battery storage to grow from ~$0.5bn to a ~$14bn market
by 2020
In 2015, ~0.5GW of storage was added globally. With an energy to power ratio of ~2x, this translates into ~1GWh of storage capacity added. We expect the energy to power ratio for energy storage systems to rise to 4-5x by 2020 as more load shifting storage systems are installed to integrate renewables. We expect both grid scale and residential/commercial storage to more than double per annum over 2016-2020 as power networks move from being centralised to distributed interconnected systems. By 2020, we expect annual storage installations to rise to 10GW, which translates into ~45GWh of annual storage. Assuming all-in battery costs of ~$300/kWh, this will translate into a market size of ~$14bn by 2020. Rising renewable generation, reduction in battery costs and regulatory requirements will be the main growth drivers.
We believe there are three factors which will drive stationary storage uptake by utilities, the commercial sector and households over the next five years.
Factor #1 Factor #1 Factor #1 Factor #1 –––– rising renewable investment leading to unpredictable generation; rising renewable investment leading to unpredictable generation; rising renewable investment leading to unpredictable generation; rising renewable investment leading to unpredictable generation; there is an increased need for storage for load/frequency management there is an increased need for storage for load/frequency management there is an increased need for storage for load/frequency management there is an increased need for storage for load/frequency management
Battery storage market for frequency smoothing has emerged as renewable generation has increased: Solar and wind power generation as a percentage of total electricity has more than doubled in large economies since 2010. Rising renewables in the electricity mix are making generation more unpredictable and grid balancing more difficult. As a result, battery storage requirements at grid level for frequency smoothing have been increasing globally, led by the US. We expect lithium ion batteries to remain the dominant technology for frequency regulation and other high-power applications.
Renewables integration will require battery storage for load shifting: Currently, the global share of wind and solar as a percentage of electricity generation is ~5% (up from 2% in 2010). In the OECD region, it is relatively higher at ~7% (3.2% in 2010), although it is lower (ie 3%) in China and India. The International Renewable Agency (IRENA) expects a 4x increase in the share of renewables by 2030. This radical jump in variable renewable generation will increase the need for storage in our view, especially for load shifting. Flow batteries could potentially be the preferred technology for load shifting applications.
Stationary energy storage is headed towards strong long-term structural growth
Source: Navigant Research (Jaffe and Adamson, 2014)
Factor #2 Factor #2 Factor #2 Factor #2 –––– the economics of residential “storage plus solar” are improving: the economics of residential “storage plus solar” are improving: the economics of residential “storage plus solar” are improving: the economics of residential “storage plus solar” are improving: microgrids/electricity trading platforms will emergemicrogrids/electricity trading platforms will emergemicrogrids/electricity trading platforms will emergemicrogrids/electricity trading platforms will emerge
Solar and storage costs are fast declining as the scale of manufacturing rises: Battery storage is at the same position of the learning curve as solar PVs were 10-15 years ago. As the scale of manufacturing increases for batteries, we expect the cost of small-scale residential and commercial battery storage to decline from $900/kWh to $500/kWh by 2020E. We also expect the cost of solar PVs to decline by 35% by 2020, in line with its current ongoing downward price trajectory.
Global forecast for utility scale battery storage (MW)
0
2000
4000
6000
8000
10000
12000
14000
16000
18000
0
2000
4000
6000
8000
10000
12000
14000
16000
2014 2015 2016 2017 2018 2019 2020 2021 2022 2023
Annual revenue (USD thousands)
Annual revenue (USD thousands)
Annual revenue (USD thousands)
Annual revenue (USD thousands)
MW
MWMWMW
Annual Capacity (MW) Annual Revenue (USD Thousands)

Berenberg Thematics
10
We expect the cost of electricity for solar PV and storage to fall below retail tariffs in a number of countries: Currently, residential solar generation plus storage is close to breakeven with retail electricity tariff rate only in Germany. Based on the ongoing reduction in battery costs as well as in solar PVs, we estimate the levelised cost (the cost in $/kWh of building and operating the facility over its lifetime) of electricity (LCOE) for solar generation plus storage to fall below the retail electricity tariff in Germany, Australia, the UK and in a number of states in the US by 2020. We expect microgrids – which allow for electricity trading – to emerge in these countries on the back of rising battery adoption.
Batteries plus solar to become cost-effective by 2020 Lithium ion battery costs have more than halved over the last
five years as production has increased
Source: Berenberg, Company press releases and news reports Source: Berenberg
Factor #3 Factor #3 Factor #3 Factor #3 –––– regulatory requirements are bosting storageregulatory requirements are bosting storageregulatory requirements are bosting storageregulatory requirements are bosting storage
Aggressive renewable energy generation targets: High renewable energy targets in Europe and the US are driving uptake of grid scale storage. The state of New York is aiming to produce 50% of its electricity through renewables by 2030. Hawaii is targeting 100% through renewable generation by 2030. Europe has an ambitious target of 20% renewables by 2020.
High regulatory requirements for grid storage in California: The California state authorities have issued direct requirements for grid scale storage; its three largest utilities are required to add more than 1.3GW storage by 2020.
The state of California requires its three largest utilities to add 1.3GW of grid scale storage by 2020
Source: US DoE
US
(California)
US
(average)
Australia
Germany
UK
France
China
0.0
0.1
0.2
0.3
0.4
0.0 0.1 0.2 0.3 0.4
2015 Residential2015 Residential2015 Residential2015 Residential retail tariff rates ($/kWh)retail tariff rates ($/kWh)retail tariff rates ($/kWh)retail tariff rates ($/kWh)
2020 Residential
2020 Residential
2020 Residential
2020 ResidentialSolar plus Storage
Solar plus Storage
Solar plus Storage
Solar plus Storage
LCOE ($/kWh)
LCOE ($/kWh)
LCOE ($/kWh)
LCOE ($/kWh)
2001
2002
2003
2004
2005
2006 2007 20082009
20102011 2012
201320142015y = -15.6x + 718
R² = 89%
0
100
200
300
400
500
600
700
800
900
0 5 10 15 20 25 30 35 40
Production (GWh)
Price ($/kWh)
Renewable target Renewable target Renewable target Renewable target
as % of total by as % of total by as % of total by as % of total by
2030203020302030
New York 50%
Hawaii 100%
Vermont 75%
Europe20% of total
generation by 2020
0 100 200 300 400 500
2014
2016
2018
2020
Southern California Edison
Pacific Gas & Electric
San Diego & Electric
Sorage requirement (MW)Sorage requirement (MW)Sorage requirement (MW)Sorage requirement (MW)

Berenberg Thematics
11
Mass transport – electric bus market to grow from $18bn to $60bn
by 2020
We expect the number of hybrid and pure (battery-only) electric buses (PEBs) to grow on the back of regulatory requirements, a decline in costs and the introduction of new battery and charging technology which will increase their range. Chinese bus manufacturers, led by BYD, are going to drive this growth. Lithium iron phosphate (LFP)-based technology is likely to dominate in the medium term. Similar to our house view on Tesla (see our Great start but sleepy giants are waking up report, dated 2 February 2016), the bus manufacturing “giants” have small to non-existent pure electric bus offerings, which has given smaller OEMs (such as Wright Bus) a head start. This is soon to change, with Daimler’s offering set to enter production after 2018 and MAN’s by 2020. We see Volvo and BYD as the best plays on electric transit – Volvo because of its first-mover advantage relative to other large European OEMs (it is currently testing its pure electric offering in Gothenburg) and BYD because its scale, international success and ability to partner with other OEMs such as ADL to break into new markets.
We dislike smaller OEMs and producers which outsource their electric drivetrains as they will suffer from pricing pressure (unable to sacrifice margin to reduce pricing unlike larger OEMs) and lower margins (giving away too much margin to drivetrain manufacturers in a low margin business) respectively.
We see three reasons for the expected growth in the number of EBs.
Reason #1 Reason #1 Reason #1 Reason #1 –––– regulatory support in China, Europe and US, encouraging electric regulatory support in China, Europe and US, encouraging electric regulatory support in China, Europe and US, encouraging electric regulatory support in China, Europe and US, encouraging electric bus adoption to reduce air pollution blighting urban centresbus adoption to reduce air pollution blighting urban centresbus adoption to reduce air pollution blighting urban centresbus adoption to reduce air pollution blighting urban centres
National funding schemes are financing the electrification of mass transit sector: National funding schemes in the US, Europe and China are supporting the hybridisation of the mass transit sector. China is also providing a hefty purchase subsidy of $75,000 on new EBs.
City/state authorities are taking an active role in phasing out traditional buses: In London, all single-decker buses passing through its ultra emission zone are required to be zero emission by 2020. The city authorities in Copenhagen are aiming for all city buses to be zero emission by 2025, while in California all buses will need to be zero-emission by 2040.
Significant national/local government funding is being provided
for the electrification of mass transit
China’s production has grown by 858% yoy, Yutong has emerged
as a market leader
Source: Berenberg Source: chinabuses.org
Reason #2 Reason #2 Reason #2 Reason #2 –––– EB and charging infrastructure costs are declining with mass EB and charging infrastructure costs are declining with mass EB and charging infrastructure costs are declining with mass EB and charging infrastructure costs are declining with mass adoptionadoptionadoptionadoption
Ongoing reductions in battery costs are making EBs more affordable: Battery pack costs for EBs have declined markedly from c$1,200/kWh in 2009 to c$250-350/kWh today. This has resulted in PEB prices – ie the Proterra – falling from c$1.2m in 2010 to closer to $750,000 today.
Cost of fast-charging equipment for buses is also declining with increased adoption: The cost of a Proterra 500kW charger declined from c$1m in 2010 to c$350k in 2015.
Targets and Targets and Targets and Targets and
subsidiessubsidiessubsidiessubsidies
ChinaChinaChinaChina
Targetting to raise share of new energy buses to 80% by 2019. Purchase subsidy of $75k on an all electric bus
LondonLondonLondonLondon
UKUKUKUK
All single decker vehicles passing through London's ultra low emission zone must be zero emission.
ParisParisParisParis
FranceFranceFranceFrance
RATP Paris to replace its entire 4,800 bus fleet with zero emission vehicles by 2025
55
24
25
135
0 50 100 150
US
Low/No Emission Vehicle
deployment prog.
California
Zero Emission Truck &
Bus P ilot Project
Europe
Zero Emission Urban Bus
projec t
UK
Green Bus fund
US$ m

Berenberg Thematics
12
The cost of EBs and charging infrastructure has more than halved since 2010
Source: Berenberg
Reason #3 Reason #3 Reason #3 Reason #3 –––– new battery and charging new battery and charging new battery and charging new battery and charging technology will reduce range problemstechnology will reduce range problemstechnology will reduce range problemstechnology will reduce range problems
Adoption of LTO-based batteries: Lithium titanate (LTO)-based batteries are able to charge at 10-20x the speed of other lithium-ion-based cells. The adoption of LTO-based cells in mass transport could significantly reduce “range anxiety” by allowing for quick charging at bus stops.
Adoption of high-power electric charging equipment as well as inductive charging reduces recharging times: Proterra and ABB are introducing very high-power charging equipment. Bombardier and Conductix Wampfler offer inductive charging technology.
High-power fast-charging technologies can improve bus
range
Source: Berenberg
We identify six sub-sectors and 18 interesting companies which will
be benefit from greater battery adoption over the next five years
We expect lithium ion batteries to be the dominant technology over the next five years. We believe that a number of sectors across the battery value chain will benefit from strong demand growth for batteries in the power and automotive sectors.
SubSubSubSub----sector #1 sector #1 sector #1 sector #1 –––– automotive/bus OEMs that are focusing on electrification of automotive/bus OEMs that are focusing on electrification of automotive/bus OEMs that are focusing on electrification of automotive/bus OEMs that are focusing on electrification of their product portfoliotheir product portfoliotheir product portfoliotheir product portfolio
We expect rapid expansion in EV penetration over the next five years led by China, the US and Europe. In the US and Europe, Tesla, the Nissan-Renault alliance and BMW are spearheading the electrification of the automotive sector, especially in the BEV space. In China, the EV market is dominated by four local players, led by BYD. These four players have invested strongly over the last five years in 1) lithium ion battery technology, 2)
0
0.2
0.4
0.6
0.8
1
1.2
All electric bus Cost of high power charging point (500kW)
2010 2015
US$ m
$260k costof diesel bus
TechnologyTechnologyTechnologyTechnology Charging powerCharging powerCharging powerCharging power
Charging Charging Charging Charging
time for time for time for time for
300kWh 300kWh 300kWh 300kWh
batterybatterybatterybattery
Proterra Conductive 500kW 36min
ABB Conductive200kW; 400kW
(15s)45-90min
Bombardier Inductive 200kW 45 min
Conductix
WampflerInductive 60-180kW
100-
300min

Berenberg Thematics
13
upgrading their manufacturing facilities to accommodate EVs and 3) setting up their own battery manufacturing facilities or striking partnerships with dominant battery suppliers. We expect them to benefit from the structural demand growth for the next 5-10 years.
We think that the automotive OEMs with the scale and the strongest EV offering will prevail. Traditional OEMS led by Volkswagen, Daimler, GM and Ford have impressive plans for launching new EV models over the next 3-5 years. Their manufacturing scale and strong operating cash flows from their established internal combustion vehicle (ICV) business lines should help finance the investment required to build EV product portfolio while absorbing the associated losses/margin dilution in the mid-term. We discuss the automotive OEMs that we expect to lose out on this growth in the next section.
Autos ranking grid – Tesla in the US and Europe along with BYD in China are likely to retain a significant market share while
traditional OEMs will catch up in the EV space
Source: Berenberg
SubSubSubSub----sector #2 sector #2 sector #2 sector #2 –––– lithium miners: lowlithium miners: lowlithium miners: lowlithium miners: low----cost players will benefit from continued cost players will benefit from continued cost players will benefit from continued cost players will benefit from continued structural increases in structural increases in structural increases in structural increases in lithium prices in the medium termlithium prices in the medium termlithium prices in the medium termlithium prices in the medium term
Lithium prices are headed for a structural bull run, with demand from the automotive and power sectors to exceed supply, even under conservative assumptions for EV penetration rates and stationary storage uptake by utilities. We expect global lithium demand to increase by ~60% by 2020. Supply constraints in the medium term due to the long five- to 10-year project development lead times and stringent regulatory requirements are likely to exacerbate the supply demand imbalance. We expect the lithium majors, especially Albemarle, to benefit from the positive price momentum due to the low-cost profile of its projects. Lithium mining “juniors” such as Orocobre and Western Lithium will play a central role in bringing relatively higher-cost resources into the market. Under our base case scenario, we estimate that global supply of lithium will rise by ~25% by 2020. Hence, we expect a structural increase in lithium prices over the next five years.
Lithium miners ranking grid: lithium major Albemarle and minors Orocobre and Western Lithium are bringing 57.5kT (25% of current
capacity) of new lithium manufacturing capacity over the next five years
Source: Berenberg
CompanyCompanyCompanyCompany
(Country, Market cap)
Lithium ion battery and EV Lithium ion battery and EV Lithium ion battery and EV Lithium ion battery and EV
power train technology power train technology power train technology power train technology Charging infrastructureCharging infrastructureCharging infrastructureCharging infrastructure Battery manufacturingBattery manufacturingBattery manufacturingBattery manufacturing
Depth of EV offering Depth of EV offering Depth of EV offering Depth of EV offering
(current/target over 2016-20)(current/target over 2016-20)(current/target over 2016-20)(current/target over 2016-20)Mass transportMass transportMass transportMass transport
Overall exposure to Overall exposure to Overall exposure to Overall exposure to
growth in batteriesgrowth in batteriesgrowth in batteriesgrowth in batteries
TeslaTeslaTeslaTesla
US - USD 21.3bn
VERY HIGHVERY HIGHVERY HIGHVERY HIGH
BYDBYDBYDBYD
China - HKD 125.8bn
VERY HIGHVERY HIGHVERY HIGHVERY HIGH
BMWBMWBMWBMW
Germany - EUR 45.5bn
MEDIUM-HIGHMEDIUM-HIGHMEDIUM-HIGHMEDIUM-HIGH
Renault-NissanRenault-NissanRenault-NissanRenault-Nissan
France - EUR 20.8bn
Japan - JPY 4.9tn
HIGHHIGHHIGHHIGH
VWVWVWVW
Germany - EUR 53.9bn
HIGHHIGHHIGHHIGH
GMGMGMGM
US - USD 44.1bn
HIGHHIGHHIGHHIGH
DaimlerDaimlerDaimlerDaimler
Germany - EUR 64.1bn
HIGHHIGHHIGHHIGH
FordFordFordFord
US - USD 45.4bn
MEDIUMMEDIUMMEDIUMMEDIUM
Note: Level of exposure ranking. 5 Stars= VERY HIGH, 4 Stars = HIGH, 3 stars= MEDIUM, 2 Stars= LOW-MEDIUM,1 Star=LOW
CompanyCompanyCompanyCompany
(Country, Market cap)
Cost profile of the Cost profile of the Cost profile of the Cost profile of the
projectsprojectsprojectsprojects
Status of expansion Status of expansion Status of expansion Status of expansion
projectsprojectsprojectsprojectsPast experiencePast experiencePast experiencePast experience ScaleScaleScaleScale
Share of Lithium in Share of Lithium in Share of Lithium in Share of Lithium in
EarningsEarningsEarningsEarnings
Overall exposure to Overall exposure to Overall exposure to Overall exposure to
growth in batteriesgrowth in batteriesgrowth in batteriesgrowth in batteries
AlbemarleAlbemarleAlbemarleAlbemarle
US - USD 5.8bn
VERY HIGHVERY HIGHVERY HIGHVERY HIGH
OrocobreOrocobreOrocobreOrocobre
Australia - AUD 0.5bn
HIGHHIGHHIGHHIGH
Western LithiumWestern LithiumWestern LithiumWestern Lithium
Canada - CAD 0.1bn
MEDIUMMEDIUMMEDIUMMEDIUM
Note: Level of exposure ranking. 5 Stars= VERY HIGH, 4 Stars = HIGH, 3 stars= MEDIUM, 2 Stars= LOW-MEDIUM,1 Star=LOW

Berenberg Thematics
14
SubSubSubSub----sector #3 sector #3 sector #3 sector #3 –––– cathode manufacturerscathode manufacturerscathode manufacturerscathode manufacturers
The chemicals required for manufacturing lithium ion cells are the main determinants of a battery pack’s performance (ie in terms of storage capacity, life, safety). They are hence the most value added components of the battery storage system and f0rm the bulk of its cost. This is especially true for the active cathode material which forms more than half of the lithium ion cell cost. Specific cathode chemistries have been perfected after years of R&D and are protected by patents. As a result, we believe that speciality chemical companies such as Umicore and BASF hold a significant pricing advantage in an environment where demand for cathode materials is rapidly rising on the back growth in EVs and stationary storage.
We expect that chemical companies with the IPs for the cathode materials such as nickel manganese cobalt (NMC) and nickel cobalt aluminium (NCA) (which are important for automotive applications) to experience the strongest pricing improvement because only a few companies can manufacture battery grade NMC and NCA cathode materials. In contrast, a number of companies in Asia manufacture LFP and LCO (lithium cobalt oxide) cathodes. While demand from storage and EBs is likely to grow strongly for LFP over the next five years, the increasing levels of competition between these players are likely to limit any pricing increase.
Umicore and BASF are the market leaders in NMC- and NCA-based cathode materials and are likely to benefit as rising EV penetration
leads to demand growth over the next five years
Source: Berenberg
SubSubSubSub----sector #4 sector #4 sector #4 sector #4 –––– energy storage battery providersenergy storage battery providersenergy storage battery providersenergy storage battery providers
There has been robust growth in the stationary storage segment (yearly installations have doubled since 2010), driven by frequency smoothing requirements. Lithium ion technology is hence dominating because of its high power density. We expect that there will be strong growth in storage for load shifting purposes in order to integrate renewables. IHS expects grid storage to grow to 40GW by 2020 from only 538MW in 2015. We think that flow batteries could prove ideal for load management purposes while lithium ion will continue to dominate the frequency management space. Companies that provide low-cost stationary storage systems are likely to experience strong growth in earnings.
ElectronicsElectronicsElectronicsElectronics EVsEVsEVsEVs BusesBusesBusesBuses Stationary storageStationary storageStationary storageStationary storage
Umicore: Umicore: Umicore: Umicore: Belgium - EUR 3.7bn LCO, NMC, NCA, LFPLCO, NMC, NCA, LFPLCO, NMC, NCA, LFPLCO, NMC, NCA, LFP
JMAT: JMAT: JMAT: JMAT: UK - GBP 4.4bn LFP
BASF: BASF: BASF: BASF: Germany - EUR 52.9bn NMC, LFP
Nichia: Nichia: Nichia: Nichia: Japan - Private LCO, NCM, LMO
Toda Kogyo: Toda Kogyo: Toda Kogyo: Toda Kogyo: Japan - JPY 16.4bn LCO, LMO, LFP
Sumitomo Chemicals: Sumitomo Chemicals: Sumitomo Chemicals: Sumitomo Chemicals: Japan - JPY 917.1bn LMO
Tanaka Chemicals: Tanaka Chemicals: Tanaka Chemicals: Tanaka Chemicals: Japan - JPY 12.2bn NMC
Nippon Chemicals: Nippon Chemicals: Nippon Chemicals: Nippon Chemicals: Japan - JPY 20.5bn LCO, NMC
3M: 3M: 3M: 3M: US - USD 94.5bn NMC
AGC Seimi Chemicals: AGC Seimi Chemicals: AGC Seimi Chemicals: AGC Seimi Chemicals: Japan - Private NMC
Targray: Targray: Targray: Targray: Canada - Private LCO, LFP, NCM, NCA
Merck KGaA: Merck KGaA: Merck KGaA: Merck KGaA: Germany - EUR 32.1bn LCO, LFP
L&F Material: L&F Material: L&F Material: L&F Material: South Korea - Private LCO, LFP
Fuji Pigment: Fuji Pigment: Fuji Pigment: Fuji Pigment: Japan - Private LCO, LFP
Honjo ChemicaHonjo ChemicaHonjo ChemicaHonjo Chemical: Japan - Private LCO, LFP
Citic Guoan Mengguli: Citic Guoan Mengguli: Citic Guoan Mengguli: Citic Guoan Mengguli: China - Private LCO, LFP
Reshine New Material: Reshine New Material: Reshine New Material: Reshine New Material: China - Private LCO, LFP
Pulead Technology: Pulead Technology: Pulead Technology: Pulead Technology: China - Private LCO, LFP
Seimi Tongda Lithium Energy: Seimi Tongda Lithium Energy: Seimi Tongda Lithium Energy: Seimi Tongda Lithium Energy: China - Private LCO, LFP
Shanshan Tech: Shanshan Tech: Shanshan Tech: Shanshan Tech: China - Private LCO, LFP
B&M Science and Technology: B&M Science and Technology: B&M Science and Technology: B&M Science and Technology: China - Private LCO, LFP
Henan Kelong New Energy Co: Henan Kelong New Energy Co: Henan Kelong New Energy Co: Henan Kelong New Energy Co: China - Private NCM
NEI Corp: NEI Corp: NEI Corp: NEI Corp: US - Private LTO, LMNO, LMO, NCA
Target marketTarget marketTarget marketTarget marketType of Cathode Type of Cathode Type of Cathode Type of Cathode
MaterialsMaterialsMaterialsMaterials
CompanyCompanyCompanyCompany
(Country, Market cap)(Country, Market cap)(Country, Market cap)(Country, Market cap)

Berenberg Thematics
15
Exposure by key market – Maxwell, RedT, Leclanché, Ceres and Intelligent Energy all represent potentially attractive technology
acquisitions for larger automotive OEMs and battery manufacturers
Source: Berenberg
SubSubSubSub----sector #5sector #5sector #5sector #5 –––– solar integrators, power management, residential storage solar integrators, power management, residential storage solar integrators, power management, residential storage solar integrators, power management, residential storage vendors and microvendors and microvendors and microvendors and micro----grid operatorsgrid operatorsgrid operatorsgrid operators
We think that the ongoing reduction in the cost of batteries and solar panels will expedite the move towards distributed power generation and distribution. We think that micro grids and energy trading platforms will develop in countries with high electricity retail tariffs and fixed grid charges such as Germany, Australia, the UK and a number of states in the US. Solar PV providers, residential storage and other important equipment suppliers such as invertors are expected to benefit.
Exposure by key market
Source: Berenberg
SubSubSubSub----sector #6sector #6sector #6sector #6 –––– nextnextnextnext----generation lgeneration lgeneration lgeneration lithium ion technology providersithium ion technology providersithium ion technology providersithium ion technology providers
We think that the next stage in the evolution of battery technology will follow on from the intensive R&D currently being carried out to develop advanced lithium ion batteries, which have a higher proportion of active materials than other battery types and hence greater energy storage capacity. At the same time, the development of new cell chemistries which can simplify manufacturing methods and reduce costs could be a game-changer in terms of battery adoption. There are promising signs that ongoing R&D into semi-solid and solid-state lithium ion batteries could deliver the next step-up in energy density for batteries.
CompanyCompanyCompanyCompany
(Country, Market cap)
Grid scale Grid scale Grid scale Grid scale
storage/generationstorage/generationstorage/generationstorage/generation
Residential/commeResidential/commeResidential/commeResidential/comme
rcial storage/ rcial storage/ rcial storage/ rcial storage/
generationgenerationgenerationgeneration
Transportation - Transportation - Transportation - Transportation -
Electric Electric Electric Electric
cars/buses/truckscars/buses/truckscars/buses/truckscars/buses/trucks
Overall exposure to Overall exposure to Overall exposure to Overall exposure to
transport electrification, transport electrification, transport electrification, transport electrification,
distributed distributed distributed distributed
generation/storagegeneration/storagegeneration/storagegeneration/storage
DetailsDetailsDetailsDetails
Maxwell TechnologiesMaxwell TechnologiesMaxwell TechnologiesMaxwell Technologies
US - USD 0.2bn
VERY HIGHVERY HIGHVERY HIGHVERY HIGH
Leading supplier of ultracapacitors ideal for the start stop car
market to grow from 22m to 56m vehicles by 2020. Other target
growth market is for ultracapacitors are renewable energy capacity
firming at the grid level, wind turbine (pitch control) etc
Johnson ControlJohnson ControlJohnson ControlJohnson Control
US - USD 23.2bn
MEDIUMMEDIUMMEDIUMMEDIUM
Johnson Control is investing $555m in increasing its capacity to
manufacture advanced lead-acid batteries to be used in the start
stop market for cars and buses. The company also sees the
possibility of targeting stationary storage market
Saft Saft Saft Saft
France - EUR 0.6bn
VERY HIGHVERY HIGHVERY HIGHVERY HIGH Major Li-ion battery manufacturer supplying industrial, aerospace
and stationary storage application at grid and residential level.
RedT EnergyRedT EnergyRedT EnergyRedT Energy
UK - GBP 35m
VERY HIGHVERY HIGHVERY HIGHVERY HIGH
RedT is one of the leading companies working on flow batteries for
large scale load management purposes. The demand for load
management is expected to see strong growth as renewable
generation continues to rise
LeclancheLeclancheLeclancheLeclanche
Switzerland - CHF 90m
VERY HIGHVERY HIGHVERY HIGHVERY HIGH Lithium ion battery manufacturer for stationary storage (grid and
residential scale) and automotiove applications.
CeresCeresCeresCeres
UK - GBP 50m
HIGHHIGHHIGHHIGHDeveloper of low cost fuel cells able to run on natural gas.The key
markets for its fuel cells are residential electricity and heat
generation units and back up power for the commercial market.
Intellligent EnergyIntellligent EnergyIntellligent EnergyIntellligent Energy
UK - GBP 55m
HIGHHIGHHIGHHIGH
Leading developer of hydrogen fuel cells for automotive, back up
power and electronics. The company has won an important power
management contract to provide backup electricity to Telecom
stations in India
Note: Level of exposure ranking. 5 Stars= VERY HIGH, 4 Stars = HIGH, 3 stars= MEDIUM, 2 Stars= LOW-MEDIUM,1 Star=LOW
CompanyCompanyCompanyCompany
(Country, Market cap)
Renewable Renewable Renewable Renewable
generationgenerationgenerationgenerationResidential storageResidential storageResidential storageResidential storage
Microgrid-electrity Microgrid-electrity Microgrid-electrity Microgrid-electrity
trading platformtrading platformtrading platformtrading platform
Battery management Battery management Battery management Battery management
systemssystemssystemssystems
Overall exposure to Overall exposure to Overall exposure to Overall exposure to
renewable generation & renewable generation & renewable generation & renewable generation &
storagestoragestoragestorage
DetailsDetailsDetailsDetails
Solar City Solar City Solar City Solar City
US - USD 2.9bn
HIGHHIGHHIGHHIGHSolar City is the leading seller, Installer and financier of solar panale in US
and has 33% of the residential market. It now be selling/leasing Tesla's
storage products together with its solar panels in the US market.
SMA SMA SMA SMA
Germany - EUR 1.3bn
HIGHHIGHHIGHHIGHSMA is globally the largest proider of inverters for residential solar
generation. It also has an extyensive product portfolio of inverters for
residential and commercial storage market.
InfineonInfineonInfineonInfineon
Germany - EUR 11.9bn
HIGHHIGHHIGHHIGH
Infineon is the third largest supplier of semiconductors for the automotive
sector. These are used in the power train, battrey management systems
and sensors within the vehicle. EVs have more than double semi content
versus an ICV. Rising EV penetration should benefit Infineon.
Note: Level of exposure ranking. 5 Stars= VERY HIGH, 4 Stars = HIGH, 3 stars= MEDIUM, 2 Stars= LOW-MEDIUM,1 Star=LOW
Berenberg Thematics
16
Companies working on advanced lithium ion batteries
Source: Berenberg
Conversely, we identify four sub-sectors which could see significant
disruption over the next 5-10 years
SubSubSubSub----sector #1 sector #1 sector #1 sector #1 –––– traditional automotive OEMs that lack lithium ion battery and EV traditional automotive OEMs that lack lithium ion battery and EV traditional automotive OEMs that lack lithium ion battery and EV traditional automotive OEMs that lack lithium ion battery and EV technologytechnologytechnologytechnology
We believe that companies which are still relying on nickel metal hydride (NiMH) batteries – which are obsolete in our view because have a low energy density compared with lithium ion batteries – and are not taking aggressive measures to either acquire or build up lithium ion technology will be left behind in the EV space. While hydrogen-based fuel cell technology (which is Toyota’s focus) might become a viable technology over the next 10-15 years, fuel cell electric vehicles (FCEVs) are unlikely to overtake BEVs in terms of popularity – at least not over the next five years – because of hydrogen infrastructure constraints. Hence, Toyota and Peugeot will be unable to benefit from the expected strong growth in PHEVs over the next five years.
SubSubSubSub----sector #2 sector #2 sector #2 sector #2 –––– gas turbine and diesel peaker power plant providersgas turbine and diesel peaker power plant providersgas turbine and diesel peaker power plant providersgas turbine and diesel peaker power plant providers
Over the medium term, the expected increase in utility-scale stationary storage facilities will have an impact on use of peaker plants, which are currently predominantly used for balancing seasonal fluctuations in load. These peaker plants are mainly gas-fired because they are cheaper to run than diesel and coal plants. The leading manufacturers of gas-fired combustion turbine (CT) plants are GE, Siemens, Alstom and Mitsubishi Heavy Industries (MHI). These peaker plants suffer from c40% higher operating costs than combined cycle (CC) gas plants and poor utilisation rates (on average below 5%). With storage prices continuing to decline, the economic rationale for gas and diesel peak plants should significantly erode.
SubSubSubSub----sector #3 sector #3 sector #3 sector #3 –––– power utilities with a low power utilities with a low power utilities with a low power utilities with a low focusfocusfocusfocus on/exposure to renewables and on/exposure to renewables and on/exposure to renewables and on/exposure to renewables and storagestoragestoragestorage
We expect that distributed power generation coupled with storage and an interconnected grid will replace existing centralised power generation, transmission and distribution models. We think that utilities which are not focusing on: 1) phasing out centralised power generation and replacing it with distributed renewable energy, 2) installing grid scale storage, 3) developing retail offerings of residential storage and power management and 4) installing charging infrastructure, will face a similar disruptive impact to that experienced by regulated utilities over the last decade due to the growth in solar generation.
24M 24M 24M 24M
US - Private
Semi solid Lithium ion batteries which can be produced at half the cost
and have higher energy density
Alevo Alevo Alevo Alevo
US - PrivateDeveloping low cost Lithium ion batterues with inorganic electrolyte
Sakti3Sakti3Sakti3Sakti3
US - Acquired by Dyson (UK)Developing solid state Lithium ion battery
Seeo Seeo Seeo Seeo
US - Acquired by Bosch (Germany)Developing solid state Lithium ion battery

Berenberg Thematics
17
Utilities ranking grid – RWE, E.ON and Enel have the lowest risk of disruption among European utilities because of their exposure to
renewables and storage
Source: Berenberg
SubSubSubSub----sector sector sector sector #4 #4 #4 #4 –––– largelargelargelarge----scale lithium ion battery manufacturers scale lithium ion battery manufacturers scale lithium ion battery manufacturers scale lithium ion battery manufacturers are are are are likely to suffer likely to suffer likely to suffer likely to suffer from capacity overhang anfrom capacity overhang anfrom capacity overhang anfrom capacity overhang andddd weak battery pricing weak battery pricing weak battery pricing weak battery pricing
There continues to be 40-50% overcapacity in lithium ion battery manufacturing for both the electronics and automotive sectors. Continued capacity expansion by Asian players such as LG Chem, Samsung and Panasonic over the last decade have commoditised the market. The level of competition and capacity overhang should rise further as a result of the giant battery manufacturing facilities being set up by the likes of Tesla/Panasonic and BYD. Margins for battery manufacturers are likely to remain under pressure in the mid-term.
Risk to thesis
The risks associated with the growth of lithium ion batteries in automotive and stationary storage relate to regulation, incentives, environmental impacts and security of supply for critical materials. These are long-term risks and can negatively affect the cost trajectory for batteries and their adoption in the transportation and power sectors.
1) Regulatory risk: Any abrupt elimination or lowering of subsidies/incentives on EVs or continued restrictions on stationary storage at grid level in Europe could impede growth in batteries.
2) Security of supply: Cobalt and natural graphite have high supply risk, according to the European Commission. This is because supply of both materials is highly concentrated, 56% of global cobalt production comes from the Congo and 69% of natural graphite from China. Both materials are critical for lithium ion battery manufacturing.
3) Environmental: Only 1% of lithium ion batteries are recycled. Virgin manufacturing of cathode materials for batteries is more pollutive than recycled cathode materials.
CompanyCompanyCompanyCompany
(Country, Market cap)
Distributed renewable Distributed renewable Distributed renewable Distributed renewable
generation (excl. generation (excl. generation (excl. generation (excl.
hydro)hydro)hydro)hydro)
Grid scale storageGrid scale storageGrid scale storageGrid scale storageRetail residential Retail residential Retail residential Retail residential
storage offeringstorage offeringstorage offeringstorage offering
Charging infrastructure Charging infrastructure Charging infrastructure Charging infrastructure
deploymentdeploymentdeploymentdeployment
RISK OF RISK OF RISK OF RISK OF
DISRUPTIONDISRUPTIONDISRUPTIONDISRUPTION
RWERWERWERWE
Germany - EUR 7.4bnLOWLOWLOWLOW
E.ONE.ONE.ONE.ON
Germany - EUR 18.1bnLOWLOWLOWLOW
EnelEnelEnelEnel
Italy - EUR 33.1bnLOWLOWLOWLOW
FortumFortumFortumFortum
Finland - EUR 10.8bnHIGHHIGHHIGHHIGH
GDF Suez - EngieGDF Suez - EngieGDF Suez - EngieGDF Suez - Engie
France - EUR 34.0bnHIGHHIGHHIGHHIGH
IberdrolaIberdrolaIberdrolaIberdrola
Spain - EUR 39.5bnMEDIUMMEDIUMMEDIUMMEDIUM
VerbundVerbundVerbundVerbund
Austria - EUR 3.7bnHIGHHIGHHIGHHIGH
CentricaCentricaCentricaCentrica
UK - GBP 9.7bnVery HIGHVery HIGHVery HIGHVery HIGH
Red ElectricaRed ElectricaRed ElectricaRed Electrica
Spain - EUR 9.9bnVery HIGHVery HIGHVery HIGHVery HIGH
EDFEDFEDFEDF
France - EUR 22.4bnHIGHHIGHHIGHHIGH
SSESSESSESSE
UK - GBP 13.8bnMEDIUMMEDIUMMEDIUMMEDIUM
TernaTernaTernaTerna
Spain - EUR 9.3bnLOW-MEDIUMLOW-MEDIUMLOW-MEDIUMLOW-MEDIUM
National GridNational GridNational GridNational Grid
UK - GBP 35.7bnLOW-MEDIUMLOW-MEDIUMLOW-MEDIUMLOW-MEDIUM
Note: Level of exposure ranking. 5 Stars= VERY HIGH, 4 Stars = HIGH, 3 stars= MEDIUM, 2 Stars= LOW-MEDIUM,1 Star=LOW

Berenberg Thematics
18
Section 1: Batteries – market overview
“The Stone Age did not end due to the scarcity of stones; the oil age will not end with the scarcity of oil.”
Sheik Yamani – former oil minister, Saudi Arabia
● The evolution of battery technology has accelerated in recent years with the discovery of new cell chemistries. Lead times for new technology development from discovery to mass adoption can be 10-15 years.
● We believe that lithium ion will dominate and will provide the next leg of growth for rechargeable batteries. This is due to the rapid reduction in its cost over the last five years as well as continued improvement storage capacity (energy density). There are other new technologies which hold promise (ie lithium sulphur and lithium air) but which are still at the concept stage.
● Rechargeable batteries are moving closer to mass adoption in the automotive and power sector over the next five years due to:
o tightening emission and fuel consumption requirements for the automotive sector, aimed at encouraging OEMs to focus on their EV offerings (CO2 emission target by regulators 2021: Europe – 95g/km from 130g/km in 2015; the US – 106.9g/km from 140g/km in 2016; China – the 2020 fuel consumption requirement: 5litres/100km from 6.9L/100km in 2015);
o rising renewable power generation (at 22% of global power generation in 2013), which is making electricity generation unpredictable and hence would encourage utilities to adopt stationary storage for frequency and load management purposes – further, demand for utility scale storage to intensify with the International Energy Agency (IEA) projecting that non-hydro renewable sources will form ~half (ie 600GW) of all global capacity additions over 2014-20;
o lithium ion battery development following a similar learning curve as electronics and solar PVs – battery cell costs have halved in just the last five years from $440/kWh to $200/kWh in 2015.
o a fall in lithium ion battery costs by 40-45% by 2020 resulting from a 30-35% cost reduction from economies of scale at the cell level economies of scale and a 20% cost reduction from economies of scale at the pack level.
Energy storage has long appealed to our imagination in ways it can potentially transform the way we live. However, technological limitations and high costs have meant that their use in automotive and power applications have been limited. As a result, our reliance on traditional and more reliable energy sources, predominantly fossil fuels, remains. Increasing adoption of renewable power over the last decade has increased volatility in electricity generation. As a result, the need to develop better and more cost-effective battery systems to make power distribution systems more efficient has increased. At the same time, tightening regulatory limits on car emissions have prompted OEMs to increase their focus on EV offerings to consumers. The recent scandal at Volkswagen, when the company was caught using cheat devices manipulating car emission results, has undermined the credibility of the diesel engine as the right technology to meet future emission requirements and should further enhance OEMs’ R&D focus on EVs. The ongoing steep decline in battery prices should spur adoption of battery storage for power and automotive applications.
How does a battery work?
There are a number of different components to a battery, each made from a material which performs a specific function to trigger the electrochemical reaction that converts stored chemical energy into electrical energy. The chemical reaction in a battery involves the transfer of electrons through the movement of ions and is known as an oxidation-reduction reaction, or “redox” reaction.

Berenberg Thematics
19
Key parts of a battery, their function and the materials used
Source: Berenberg CGGC
How does a battery work? Batteries work via redox reactions Structure of a cylindrical battery
Source: Berenberg, epg.eng.ox.ac.uk
Introduction to energy storage technologies
Battery storage systems’ evolution has been marked by jumps in performance through the discovery of new materials, followed by long periods of efficiency improvements through experimentation with battery composition/structure.
The timeline below illustrates the development of battery storage systems since the creation of the early form of lead acid battery in 1859. Of note:
1) new battery technologies have generally not replaced but complemented the older
systems;
2) there has been no major breakthrough in battery technology for more than two
decades since the introduction of lithium ion batteries in the 1990s.
The first point can be explained by the varying attributes of different battery storage systems such as cost, weight, thermal stability, product life and energy to power requirements. These differences determine the applications for which each battery technology is suitable.
PartPartPartPart FunctionFunctionFunctionFunction MaterialsMaterialsMaterialsMaterials
Anode
(Negative Electrode)
Receives Lithium-ions from the Cathode when charging and emits
to Cathode when discharging.
Made from metals/compounds with very few electrons in their
valence shells
Cathode
(Positive Electrode)
Receives Lithium-ions from the Anode when discharging and emits
to Anode when charging.
Made from metals/compounds that have nearly full valence shells
such as compounds including oxygen, chlorine or both.
ElectrolyteIonic conductor and electric insulator that allows Lithium-ions to
pass between Anode and Cathode
Typically an acid/base (alkaline) or salt solution e.g. Lithium salts
or an organic solvent
SeparatorProvides insultaion between the Anode and Cathode. If the Anode
and Cathode were not separated, the battery would short circuit.Micro-porous membranes
Can The outer container for the chemicals inside Metal

Berenberg Thematics
20
Battery technology timeline Energy storage characteristics
Source: Continental Source: Berenberg estimates
There are four mainstream secondary/rechargeable battery technologies – lead acid, sodium sulphur, NiMH and lithium ion. Lead acid batteries are predominantly used as common car batteries, for uninterrupted power systems (UPS) back-up power and grid support for utilities. NiMH is predominantly used in electronics and in hybrid EVs. However, it is increasingly being replaced by high density lithium ion as the latter’s cost declines. Sodium sulphur batteries, also called molten salt batteries, have been used for peak power management, especially in Japan; however, they have suffered from serious operational and safety issues. Utilities are increasingly using lithium ion storage systems for grid support, as they perform better and cost less. However, utility scale applications will always require a mix of battery systems as each type has its own relative advantages.
Energy density, cost and stage of development for different battery technologies
Source: Thermodynamic analysis on energy density of batteries, DOE/EPRI Electricity Storage Handbook in Collaboration with NRECA Continental, Berenberg estimates
Specific EV battery Specific EV battery Specific EV battery Specific EV battery
requirementsrequirementsrequirementsrequirementsMetricMetricMetricMetric
1. Energy densityAlso called volumetric energy density.
kWh per unit volume i.e. kWh/l
2. Specific Energy kWh/kg
3. Power DensityPeak power per unit of battery volume i.e.
W/l
4. Cost $/kWh
5. Durability Cycle life
0
100
200
300
400
500
600
700
800
900
1000
Lead acid SodiumSulphur
NiMH Li-ion AdvancedLi-ion
Sodium ion SodiumNickelChloride
Li-Sulphur Li air Sodium air
Energy density (Wh/kg)
Price ($/kWh) 269 270 900 300 <200 <200 400 380 n.a. n.a.
MainstreamUnder
DevelopmentR&D
High temperature batteries
Berenberg Thematics
21
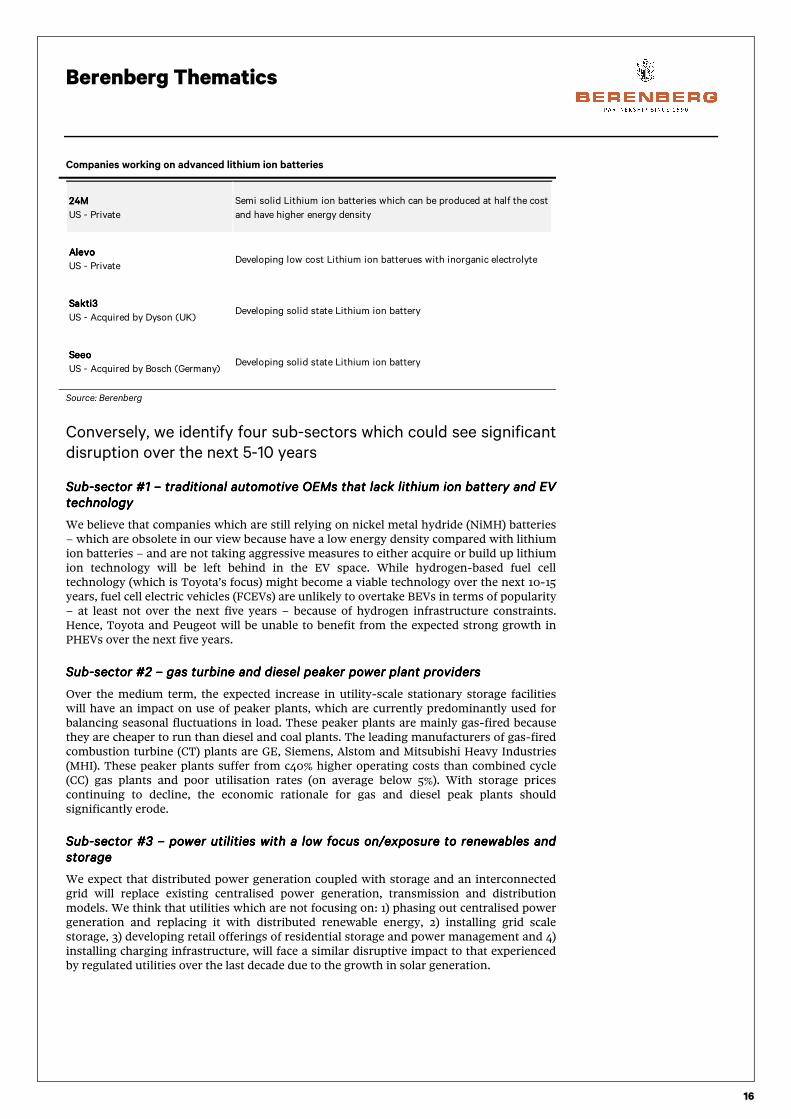
The table below compares the advantages and disadvantages of the four mainstream battery technologies. As the scale of manufacturing for lithium ion increases, costs are expected to decline further. Its cost advantage as well as its superior performance should sustain lithium ion as the dominant storage system for transport, power, electronics and industrial applications. The main factor holding back lithium ion in the past was cost, which was above $1,000/kWh only five years ago, but which has since reduced to $300/kWh. Parity has thus nearly been achieved versus sodium sulphur. Lead acid, however, remains the cheapest storage solution, especially for “high-energy” stationary storage purposes such as renewables integration, back-up power and load shifting.
Market landscape for the mainstream battery technologies
Source: Berenberg
Upcoming technologies: limitations and time to commercialisation
“When compiling data of a new battery system, battery inventors lean towards publishing the positive attributes and the negatives are kept under wraps. This is why much hyped systems that show great potential on paper do not always make it to commercial applications but quietly die.”
Isidor Buchmann – Cadex Electronics Inc
There is general agreement that reliance on hydrocarbons cannot end until there is a major breakthrough in battery technology, both in terms of energy density and costs. While there has been significant success on the cost side due to economies of scale and efficient production methods, energy density is only improving at a slow rate of 5% pa. A new cell chemistry will be required to achieve a further step-change in energy density and performance.
A number of new cell chemistries hold promise. Some are at the early R&D stage, while others are closer to becoming commercially available. The technologies which offer the greatest improvement in energy density are lithium sulphur and lithium air. Lithium air’s theoretical energy density is close to that of gasoline, and lithium sulphur, although less dense, offers significant improvement over lithium ion in energy density; both of these technologies could help to decarbonise the automotive and power sectors. However, there are still a myriad of technical issues that will need to be resolved before these battery types will see the light of day: it typically takes 10-20 years for such technology to reach commercialisation.
Closer to being introduced are battery types for the power sector rather than for automotive applications. This is because they provide a potential reduction in costs rather than improvements in energy density. The three main upcoming technologies are sodium
Lead acidLead acidLead acidLead acid Sodium SulphurSodium SulphurSodium SulphurSodium Sulphur NiMHNiMHNiMHNiMH Lithium ionLithium ionLithium ionLithium ion
ApplicationApplicationApplicationApplicationUtility/backup power and traditional
automotiveUtility/backup power Automotive, electronics
Automotive, electronics and utilities/backup
power
1. Good for power intensive
applications1. High energy density 1. Thermal stability
1. High energy & power density = small
size & lightweight
2. Low cost 2. Long cycle life 2. High cycle life 2. Long cycle life
3. Long life cycles 3. Low maintenance requirements3. Battery management system simpler
and lighter
3. Potential for improvement in energy
density
1. Low energy density hence high
weight1. High cost
1. Low energy and power density vs Li-
ion1. High cost, albeit declining
2. Difficult and complex thermal
management. Safety concerns
2. Low potential for further
improvement
2. Low thermal stability - risk of over
charging & short circuiting
3. Difficult to achieve scale 3. Battery management complicated
1. Johnsons Controls 1. NGK Insulators 1. Sanyo 1. Tesla/Panasonic
2. Exide 2. PEVE (Primeearth EV Energy) 2. Samsung SDI
3. GS Yuasa Corp 3. Gold Peak 3. LG Chem
4. Enersys 4. Corum 4. BYD
5. Younicos 5. TMK
High-temperature, molten metal battery
(anode molten Sodium, cathode moten
Sulphur, electrolyte solid ceramic material)
Nickel based anode and hydrogen
absorbing alloy as the cathode.
Lithium based cathode and electrolyte and
graphite anode.
BenefitsBenefitsBenefitsBenefits
DrawbacksDrawbacksDrawbacksDrawbacks
Main Main Main Main
manufacturersmanufacturersmanufacturersmanufacturers
DecriptionDecriptionDecriptionDecription
Oldest type of rechargeable battery with
lead electrodes and sulphuric acid as the
electrolyte

Berenberg Thematics
22
ion, sodium nickel chloride and flow batteries, which could open up bulk storage opportunities for utilities in the power sector, provided that storage costs can be reduced below $100/kWh.
However, in our view, the batteries that offer the most scope for commercial success over the next five years are advanced lithium ion batteries. Advanced lithium ion batteries are the next evolutionary step for traditional lithium ion, and could potentially double energy density and be cheaper to operate. Measures to increase the energy density of traditional lithium ion include:
1) doping the graphite anode with silicon to increase its charge carrying capacity;
2) experimenting with lithium-based cathode material;
3) reducing the inactive materials used in cell construction;
4) moving towards semi-solid and solid-state lithium ion batteries.
The following table outlines the upcoming battery technologies and their key benefits and drawbacks.
Market overview of upcoming battery technologies
Source: Berenberg estimates
Sodium ionSodium ionSodium ionSodium ionSodium Nickel Sodium Nickel Sodium Nickel Sodium Nickel
ChlorideChlorideChlorideChlorideFlow batterriesFlow batterriesFlow batterriesFlow batterries
Semi solid/solid state Semi solid/solid state Semi solid/solid state Semi solid/solid state
Lithium ionLithium ionLithium ionLithium ionLithium SulphurLithium SulphurLithium SulphurLithium Sulphur Lithium airLithium airLithium airLithium air
Based on molten Sodium
and nickel electrodes
A solid state battery with
oxidation of Lithium at the
anode and oxygen reduction
at cathode to generate
current
ApplicationsApplicationsApplicationsApplications Utilitity/backup power Utility/backup power
and automotiveUtility/backup power
Automotive and
utility/backup power
Initially niche applications:
Military, aerospace etc
Initially niche applications:
Military, aerospace etc
1. Low cost (<
$200/kWh)
1. Good for long duration
energy storage
applications
1. Costs lower versus
traditional lithium ion
batteries
1. 5x theoretical energy
density as Li-ion
1. Theoretical energy
approaching that for
gasoline
2. Thermal stability.
Relatively safe versus
Lithium ion
2. Ability to handle large
energy capacity
2. Low capex to set up
manufacturing facilities2. Thermally stable
3. Manufacturing
process similar to
Lithium ion
3. Higher energy density
versus traditional Li-ion
3. Indefinite shelf life and not
demaged by overcharging
1. Low energy density
1. High operating
temperature
requirements.
1. High cost 1. Low cycle life 1. In experimental stage
2. Premature
degradation of
memberane material
Acquion Energy Fiamm EnerVault 24M Oxis Energy IBM
Faradion GE UniEnergy Technologies Google Sion Power Liox Power
Vanadis Power STMicroelectronics PolyPlus PolyPlus
Rongke PowerFront Edge Technology
(FET)
ViZn Energy Bosch (Seeyo)
BenefitsBenefitsBenefitsBenefits
DrawbacksDrawbacksDrawbacksDrawbacks
Main R&D playersMain R&D playersMain R&D playersMain R&D players
Battery with Lithium cathode
and Sulphur anodeDescriptionDescriptionDescriptionDescription
Uses sodium ions as
charge carriers
Electrolytes are stored
externally and have the
electroactive elements
dissolved in them.
Lithium ion batteries with a
semisolid/solid electrolyte
Concept stageConcept stageConcept stageConcept stage

Berenberg Thematics
23
Cost evolution for lithium ion
“I invented nothing new. I simply assembled the discoveries of other men behind whom were centuries of work.”
Henry Ford
Moore’s law in semiconductors and now the Swanson law for photovoltaic solar cells are examples of new technologies experiencing continued cost reduction through efficiency gains as well as economies of scale through mass adoption. While lithium ion batteries were invented in the early 1990s, their use has until now been restricted to electronic, aerospace and defence because of initially low energy density, thermal instability and high costs.
Adoption in automotive and bulk energy storage systems is gathering pace, as 1) production levels rise, 2) cell chemistry and design are perfected and 3) the supply chain deepens/diversifies. Recent improvements include a reduction in battery weight (improved energy density), greater safety (through efficient battery management system and liquid based cooling) and greater affordability (through reduced cell manufacturing costs).
The energy density of lithium ion cells has risen to 690Wh/L in 2015 from 450Wh/L in 2005. This development has also resulted in lower costs as battery packs are now smaller but store the same amount of energy as the old, larger ones. Automotive/energy storage company Tesla’s founder Elon Musk believes that battery technology will see a ~5% improvement in energy density per annum, resulting in a doubling of energy density within 15 years. The current lithium ion technology is reaching its limit and will likely require a complete redesign to produce a step-change improvement in energy density, in our view. This could come from the replacement of graphite with silicon as the anode material, or from a move towards semi-solid and solid state advanced lithium ion batteries.
The energy density of lithium ion cells has by ~5% pa over the last 10 years; we believe that
conventional lithium ion battery technology is now reaching its limits and that further improvements
in energy density will require the use of new cell materials and cell design
Source: Berenberg estimates
In their recent research study entitled Rapidly falling costs of battery packs for electric vehicles, authors Björn Nykvist and Måns Nilsson highlighted that battery pack costs have declined by 8% annually over the last 10 years. For BEVs, the cost of a lithium ion battery pack has fallen from ~$1,000/kWh in 2007 to ~$300/kWh in 2015.
There is a general perception is that the cost of lithium ion battery packs will have to fall to ~$150/kWh to encourage mass adoption in the automotive space over the traditional internal combustion engine.
180
450
690
0
100
200
300
400
500
600
700
800
1990 1992 1994 1996 1998 2000 2002 2004 2006 2008 2010 2012 2014
Energy density(Wh/L)

Berenberg Thematics
24
Lithium battery costs have declined by 8% annually over the last decade and have now reached
$300/kWh
Source: “Rapidly falling costs of battery packs for electric vehicles” by Björn Nykvist and Måns Nilsson
The key question currently is: by how much further are costs likely to come down in the next five years? The unit cost of a battery pack will depend on the raw materials (active and inactive cell chemicals) and the manufacturing costs associated with the cell, modules and the pack. The current pack cost of $300/kWh can be broken down as ~$200/kWh for the cell and the remaining $100/kWh cost associated with the module and pack integration (which includes power and thermal/cooling management systems). Of the $200/kWh cell cost, $130/kWh also relates to materials cost and the rest to manufacturing.
Cost split of a lithium ion battery pack
Source: Berenberg estimates; Argonne National Laboratory
Cell material costs ($/kWh)Cell material costs ($/kWh)Cell material costs ($/kWh)Cell material costs ($/kWh) NCA cathode material cost ($/kWh)NCA cathode material cost ($/kWh)NCA cathode material cost ($/kWh)NCA cathode material cost ($/kWh)
124
19 31
30
90
293
-
50
100
150
200
250
300
Cell materials(& purchaseditems)
Cellmanufacturing
Materials formodule andbattery pack
Module/packassembly andwarranty costs
Fixed costs(SG&A, Profit,Depreciation,R&D etc)
Total cost ofbattery pack
$/kWh
CellCellCellCell cost =$188/kWh cost =$188/kWh cost =$188/kWh cost =$188/kWh (including half of the other costs)
Pack cost =$106/kWh Pack cost =$106/kWh Pack cost =$106/kWh Pack cost =$106/kWh (including half of the other costs)
Other cost =$90/kWh Other cost =$90/kWh Other cost =$90/kWh Other cost =$90/kWh (which is equally split between
cell manufacturing and pack
assembly)
Cathode,
61
Anode, 18
Electrolyt
e, 12
Seperato
r, 14
Others,
19Lithium,
11
Nickel, 10
Cobalt, 4
Others
(includes
manufact
uring
costs), 36

Berenberg Thematics
25
Hence, there are three primary variables which will determine the cost evolution for lithium ion systems in the medium term:
1) cell level economies of scale through increased manufacturing capacity and
production;
2) battery level of economies of scale through larger pack manufacturing facilities (such
as Tesla’s new Gigafactory);
3) external factors – especially the cost of important raw materials such as cobalt, nickel,
lithium and graphite.
We analyse these three factors in this report to assess the future for further cost reduction for lithium ion battery systems.
Cell level economies of scale should lead to a 30Cell level economies of scale should lead to a 30Cell level economies of scale should lead to a 30Cell level economies of scale should lead to a 30----35% reduction in costs if cell 35% reduction in costs if cell 35% reduction in costs if cell 35% reduction in costs if cell demand doubles over the next five years demand doubles over the next five years demand doubles over the next five years demand doubles over the next five years
Over the last decade, the price of a typical 18650 format lithium ion cylindrical has declined from ~$500/kWh to below $200/kWh. The following graph plots the cell price data versus global lithium ion cell production data since 2001. It shows that nearly 90% of the decline in lithium ion cell prices can be explained by rising production levels/economies of scale in cell manufacturing. Every doubling of cell production has historically led to a 35% reduction in cell prices.
Nearly 90% of the reduction in lithium ion cell prices over the last decade can be explained by rising production levels – historically,
every doubling of global cell production has led to a 35% reduction in cell price
Source: Berenberg estimates, TESLA, Total Battery Consulting, Aveccena Energy
There are currently three dominant manufacturers of lithium ion cells. In 2013, Samsung, LG Chem and Panasonic together produced cells with an energy capacity of ~23GWh out of total global production at 34GWh. Global manufacturing capacity stands at ~75GWh. Panasonic, AESC and LG Chem were the top suppliers of automotive batteries for EVs in 2014, with total supply at ~7GWh (ie ~20% of global lithium ion battery supply).
2001
2002
2003
2004
2005
2006 2007 20082009
2010 2011 2012
201320142015y = -15.6x + 718
R² = 89%
0
100
200
300
400
500
600
700
800
900
0 5 10 15 20 25 30 35 40
Production (GWh)
Price ($/kWh)

Berenberg Thematics
26
Total lithium ion battery production (GW): Samsung, LG Chem
and Panasonic dominate the global lithium ion market
Automotive battery production (GW) in 2014: Panasonic/Tesla,
AESC/Nissan and LG Chem dominate the automotive supply of
lithium ion batteries
Source: Tesla Source: Tesla
Tesla/Panasonic’s giant Gigafactory battery manufacturing facility in Nevada will have a manufacturing capacity of 7GWh by 2017 and potentially a 36GWh manufacturing capacity by 2020. Chinese EV players BYD in 2014 produced EV batteries with total energy capacity of 0.46GW. Its manufacturing capacity currently stands at 4GWh and will increase to 10GWh by the end of 2015. The company believes that it can continue this run rate by adding 6GWh of capacity every year if there is demand. LG Chem will also be increasing its lithium ion manufacturing capacity by 7GWh in 2015. Based on the capacity additions announced by these three manufacturers, global lithium ion production capacity could nearly double over the next five years if expansion plans remain on track.
Lithium ion cell manufacturing capacity will nearly double over the next five years if capacity
expansions by Tesla/Panasonic, BYD and LG Chem remain on track
Source: Berenberg estimates
We note that there is significant overcapacity in the lithium ion battery segment even without the capacity additions announced by Tesla and BYD. This might explain why the other main lithium ion manufacturers have not yet announced significant increases in manufacturing capacity: they are already sitting on significant level of excess capacity.
According to the Clean Energy Manufacturing Analysis Centre (CEMAC), current global lithium ion manufacturing capacity (including capacity additions made in 2015) stands at ~76GWh, and for automotive applications at 27GWh. This shows that capacity utilisation is less than 50% for lithium ion battery manufacturers. We thus believe that even if capacity additions are delayed, there is significant room for growth in production as demand increases. Hence economies of scale in lithium ion cell manufacturing will be achieved with or without the influence of Tesla’s Gigafactory.
4.8 6.6 8.2 9.63.6
4.55.6
6.96.46.0
5.66.2
0
10
20
30
40
2010 2011 2012 2013
Samsung
LG Chem
Panasonic
Sony
Maxell
ATL
BAK
BYD
Lishen
Others
GWh
2.73
1.62
0.89
0.46
0.45
0.31 0.40Panasonic
AESC
LG Chem
BYD
Mitsubishi
Samsung
Others
0
20
40
60
80
100
120
140
160
180
2014 2015 2016 2017 2018 2019 2020
Current manufacturing capacity LG Chem TESLA/Panasonic BYD
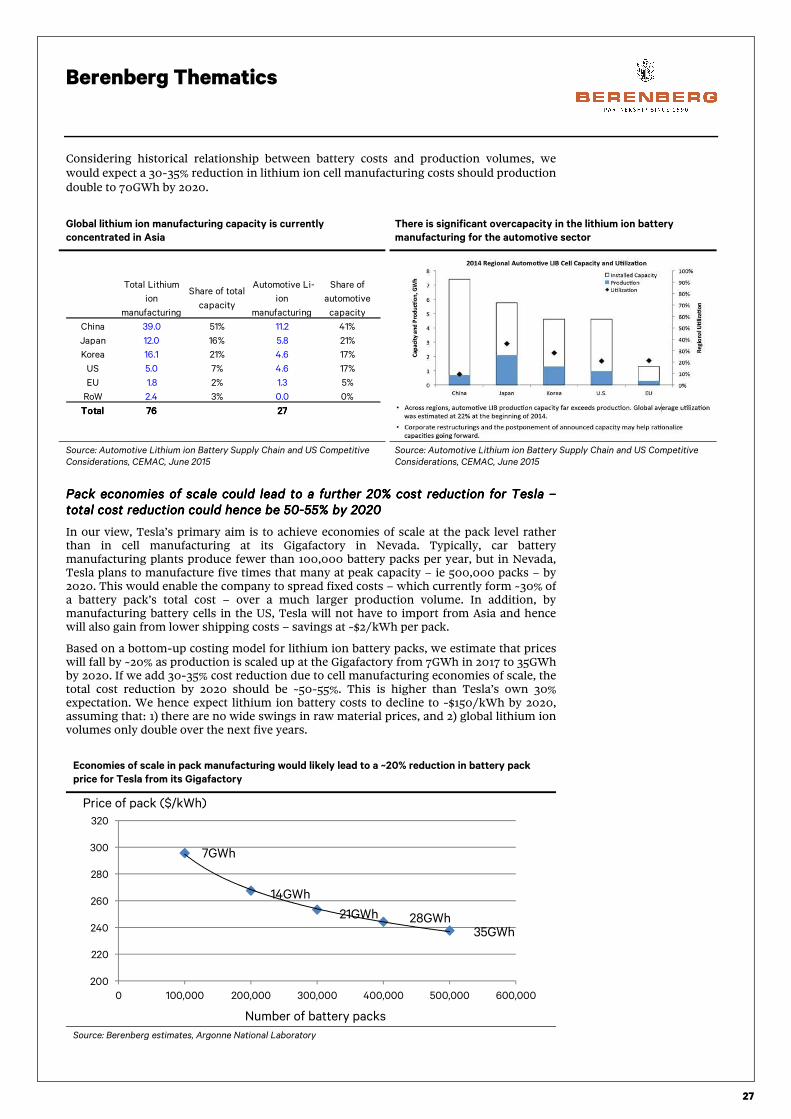
Berenberg Thematics
27
Considering historical relationship between battery costs and production volumes, we would expect a 30-35% reduction in lithium ion cell manufacturing costs should production double to 70GWh by 2020.
Global lithium ion manufacturing capacity is currently
concentrated in Asia
There is significant overcapacity in the lithium ion battery
manufacturing for the automotive sector
Source: Automotive Lithium ion Battery Supply Chain and US Competitive Considerations, CEMAC, June 2015
Source: Automotive Lithium ion Battery Supply Chain and US Competitive Considerations, CEMAC, June 2015
Pack economies of scale could lead to a further 20% cost reduction for Tesla Pack economies of scale could lead to a further 20% cost reduction for Tesla Pack economies of scale could lead to a further 20% cost reduction for Tesla Pack economies of scale could lead to a further 20% cost reduction for Tesla –––– total cost reduction could hence be 50total cost reduction could hence be 50total cost reduction could hence be 50total cost reduction could hence be 50----55% by 2020 55% by 2020 55% by 2020 55% by 2020
In our view, Tesla’s primary aim is to achieve economies of scale at the pack level rather than in cell manufacturing at its Gigafactory in Nevada. Typically, car battery manufacturing plants produce fewer than 100,000 battery packs per year, but in Nevada, Tesla plans to manufacture five times that many at peak capacity – ie 500,000 packs – by 2020. This would enable the company to spread fixed costs – which currently form ~30% of a battery pack’s total cost – over a much larger production volume. In addition, by manufacturing battery cells in the US, Tesla will not have to import from Asia and hence will also gain from lower shipping costs – savings at ~$2/kWh per pack.
Based on a bottom-up costing model for lithium ion battery packs, we estimate that prices will fall by ~20% as production is scaled up at the Gigafactory from 7GWh in 2017 to 35GWh by 2020. If we add 30-35% cost reduction due to cell manufacturing economies of scale, the total cost reduction by 2020 should be ~50-55%. This is higher than Tesla’s own 30% expectation. We hence expect lithium ion battery costs to decline to ~$150/kWh by 2020, assuming that: 1) there are no wide swings in raw material prices, and 2) global lithium ion volumes only double over the next five years.
Economies of scale in pack manufacturing would likely lead to a ~20% reduction in battery pack
price for Tesla from its Gigafactory
Source: Berenberg estimates, Argonne National Laboratory
Total Lithium
ion
manufacturing
Share of total
capacity
Automotive Li-
ion
manufacturing
Share of
automotive
capacity
China 39.0 51% 11.2 41%
Japan 12.0 16% 5.8 21%
Korea 16.1 21% 4.6 17%
US 5.0 7% 4.6 17%
EU 1.8 2% 1.3 5%
RoW 2.4 3% 0.0 0%
TotalTotalTotalTotal 76767676 27272727
200
220
240
260
280
300
320
0 100,000 200,000 300,000 400,000 500,000 600,000
Price of pack ($/kWh)
Number of battery packs
7GWh
14GWh
21GWh 28GWh35GWh

Berenberg Thematics
28
Volatility in cathode materials pricing is only a limited riskVolatility in cathode materials pricing is only a limited riskVolatility in cathode materials pricing is only a limited riskVolatility in cathode materials pricing is only a limited risk
The materials required to manufacture any battery can be divided into active materials (those involved in the electrochemical process of storing and releasing electrical charge) and inactive materials (which provide structural integrity to the cell or help but are not directly involved in the electrochemical process).
There are three active materials in a lithium ion cell:
1) the cathode (a lithium-based oxide);
2) the anode (graphite) and
3) the electrolyte (lithium salt – ie lithium hexafluorophosphate, LiPF6, dissolved in an organic compound such as ethyle or dimethyl carbonate).
Inactive materials in a lithium ion cell include:
1) a polymer separator between the anode and the cathode;
2) copper foil as the electron collector;
3) an insulator; and
4) a steel can for the cylindrical cell.
These active and inactive cell materials together form ~40% (ie $120/kWh) of the lithium ion battery pack cost. The cathode material costs for NCA chemistry (being used by Tesla) currently amount to ~$31/kg. We estimate that every 1% increase in cathode material costs will result in a ~0.2% increase in the overall battery cost. Hence for NCA-based lithium ion cells, the cathode material forms nearly half (ie $57/kWh) of the overall cell material cost. Based on its share within the overall material and pack level costs, if the price of the cathode material doubles to $62/kg (or $114/kWh), the battery pack cost would rise by 19%. In order to completely neutralise the ~50-55% pack level cost reduction (ie $150-165/kWh) that we foresee over the next five years, the active material cost would hence need to nearly triple.
With the cathode material being the most expensive part of the battery pack, there are naturally concerns in the market about the impact that significant volatility in the prices of the three metals that form the NCA/NMC cathode material (lithium, nickel and cobalt) would have on battery costs. While we expect a structural rise in lithium carbonate and lithium hydroxide prices over the next five years (due to strong battery-led demand and long lead times for new project development), we do not think that any volatility in cathode material prices would be able to markedly slow down the decline in lithium ion battery costs.
The cathode forms half (ie $57/kWh) of the cell level material cost and would need to triple in order
to completely neutralise the 50-55% cost reduction we expect for NCA-based lithium ion battery
packs by 2020
Source: Berenberg estimates, Argonne National Laboratory
y = 1.8618x + 240.21
200
250
300
350
400
450
500
0 20 40 60 80 100 120 140
Battery pack cost $/kWhBattery pack cost $/kWhBattery pack cost $/kWhBattery pack cost $/kWh
costcostcostcost of active cathode materrial ($/kg)of active cathode materrial ($/kg)of active cathode materrial ($/kg)of active cathode materrial ($/kg)
CurrentCurrentCurrentCurrent positionpositionpositionposition:Battery pack cost: ~$300/kWhNCA cathode material cost: $31/kg
Every 1%Every 1%Every 1%Every 1% increase in the increase in the increase in the increase in the
active cathode material active cathode material active cathode material active cathode material onlyonlyonlyonlyresults in a ~0.2% increase in results in a ~0.2% increase in results in a ~0.2% increase in results in a ~0.2% increase in the battery pack costthe battery pack costthe battery pack costthe battery pack cost.
Doubling of the active cathode material will result in a 19% increase in battery pack cost to $356 /kWh from current ~$300/kWh

Berenberg Thematics
29
Approximately 1.8kg/kWh of NCA (ie a similar quantity to NMC) is used to manufacture a lithium ion cell. According to the estimates given below by Argonne National Laboratory, 0.246kg/kWh of lithium (or 1.3kg of lithium carbonate) is required in an NCA-based battery. At the same time, 0.9kg/kWh of nickel and 0.18kg/kWh of cobalt are also required.
The price of battery grade lithium carbonate is around $7,000-8,000 per tonne or $8/kg. Hence the cost of lithium carbonate used would be ~$11/kWh, which is 19% of the cathode material cost but only 9% of the cell material cost and just 3.6% of the battery pack cost.
Nickel currently costs $1,100/tonne ($11/kg). This translates into a cost of $9.9/kWh which is 13% of the cathode material cost (6.3% of the cell material cost and 2.5% of the battery pack cost). Cobalt is the most expensive part of the cathode material and currently costs $24,000/tonne (or $24/kg). This is equivalent to $4.32/kWh.
According to Argonne National Laboratory, 1.8kg/kWh of cathode material is required in NCA-based
batteries
Source: Argonne National Laboratory; http://www.rmi.org/Content/Images/Lithium%20ion.PDF
There are three reasons why we think that price volatility in these three active materials does not pose a significant risk for EV and stationary storage battery packs.
Reason #1 – nickel prices are depressed and are linked with steel manufacturing and global industrial activity. The price of nickel is predominantly determined by the level of demand for it for the manufacture of steel and alloys. Less than 5% of the nickel produced is used to manufacture batteries. It is hence unlikely that strong growth in battery demand would have a significant impact on nickel prices or, in turn, on battery costs.
Nickel price and production evolution since 2000
Source: US DoE
0
5,000
10,000
15,000
20,000
25,000
30,000
35,000
40,000
0
500,000
1,000,000
1,500,000
2,000,000
2,500,000
World production Unit value ($/t)

Berenberg Thematics
30
Reason #2 – cobalt prices have been trending downwards as they are directly linked with copper prices. Cobalt is a bi-product of copper mining and hence its supply and price are linked with the copper market, which again is dependent on the global industrial growth rate.
Cobalt price and production evolution since 2000
Source: US DoE
Reason #3 – we expect lithium prices to trend upwards but they form only 3.6% of a battery pack’s cost. We expect the lithium market to tighten over the next five years and thus we expect a structural increase in prices on the back of it. However, we do not think that an increase in lithium prices would alter the downward cost trajectory for lithium ion prices. As explained above, only 0.246kg/kWh of lithium (or 1.3kg of lithium carbonate) is required in an NCA-based battery. Battery grade lithium carbonate costs around $7,000-8,000/tonne or $7-8/kg. This means that out of the $300/kWh price of the battery, the cost of lithium is $57, ie 3.6% of the total. Even if the price of battery grade lithium carbonate was to double, we do not think that it will have a meaningful impact on battery prices, especially as some of the price increase will also be absorbed by cathode as well as cell manufacturers.
Lithium carbonate price and production evolution since 2000
Source: US DoE
0
10,000
20,000
30,000
40,000
50,000
60,000
70,000
80,000
0
20,000
40,000
60,000
80,000
100,000
120,000
20002001 20022003200420052006200720082009 2010 2011 2012 2013
World mine production Unit value ($/t)
0
1,000
2,000
3,000
4,000
5,000
6,000
0
100,000
200,000
300,000
400,000
500,000
600,000
700,000
2000 2001 20022003200420052006200720082009 2010 2011 2012 2013 2014 2015
Global Gross Production in tons (LHS) Unit Value in $/t (RHS)

Berenberg Thematics
31
Battery value chain from raw materials to recycling
Source: Berenberg
Raw material Raw material Raw material Raw material
(high value (high value (high value (high value
added) minersadded) minersadded) minersadded) miners
Cell input material Cell input material Cell input material Cell input material
manufacturersmanufacturersmanufacturersmanufacturersCell manufacturerCell manufacturerCell manufacturerCell manufacturer
EV manufacturing EV manufacturing EV manufacturing EV manufacturing
equipment suppliersequipment suppliersequipment suppliersequipment suppliers
Invertors, battery management Invertors, battery management Invertors, battery management Invertors, battery management
system and Traction drive system and Traction drive system and Traction drive system and Traction drive
motor manufacturersmotor manufacturersmotor manufacturersmotor manufacturers
OEMsOEMsOEMsOEMs
Residential Solar and Residential Solar and Residential Solar and Residential Solar and
battery storage battery storage battery storage battery storage
providersprovidersprovidersproviders
Charging Charging Charging Charging
infrastructure service infrastructure service infrastructure service infrastructure service
providersprovidersprovidersproviders
Charge point Charge point Charge point Charge point
manufacturersmanufacturersmanufacturersmanufacturers
Power Power Power Power
electronics electronics electronics electronics
supplierssupplierssupplierssuppliers
Commercial and Commercial and Commercial and Commercial and
utility scale utility scale utility scale utility scale
Stationary Stationary Stationary Stationary
storage battery storage battery storage battery storage battery
vendorsvendorsvendorsvendors
Stationary Stationary Stationary Stationary
storage storage storage storage
integratorsintegratorsintegratorsintegrators
Recycling Recycling Recycling Recycling
/second life/second life/second life/second life
Lithium minersLithium minersLithium minersLithium miners Cathode materialCathode materialCathode materialCathode materialLithium ion (NCA Lithium ion (NCA Lithium ion (NCA Lithium ion (NCA
& NCM)& NCM)& NCM)& NCM)
Automotive/industrAutomotive/industrAutomotive/industrAutomotive/industr
ial robotsial robotsial robotsial robots
Top 10 automotive traction Top 10 automotive traction Top 10 automotive traction Top 10 automotive traction
drive invertor suppliersdrive invertor suppliersdrive invertor suppliersdrive invertor suppliersBEVsBEVsBEVsBEVs
Talison Lithium UmicoreUmicoreUmicoreUmicore Tesla Kuka Toyota/DENSO BYD SolarCity SolarCity SolarCity SolarCity Tesla BoschBoschBoschBosch ABB SMA Xtreme Power RecyclingRecyclingRecyclingRecycling
SQM Nichia Panasonic ABB Mitsubishi Electric CODA SunPower Corporation Charge your car Chargemaster Plc Alstom Solutronics 1Energy Johnson Control
Rockwood Lithium
(Albemarle)Toda Kogyo Samsung SDI
Bosch Rexroth
CorporationHitachi FiatFiatFiatFiat First Solar, Inc. Polar Network Chargepoint Central Schneider Electric
ABB
Greensmith Umicore
FMC Lithium Sumitomo Chemicals LG Chem Adept technology Toshiba BMWBMWBMWBMW Kyocera Solar, Inc. EcotricityChargePoint
Services
Princton Power
Systems BoschGeli Retriev
Tianqi Tanaka Chemicals BYD Applied Robotics Continental Nissan Renesola PodPointCharging Solutions
Ltd
Dyanapower
company
Dow KokamSolarGrid storage Xtrata
Genfeng BASFBASFBASFBASFAmperex
Technology Ltd
ATI Industrial
AutomationBosch TeslaTeslaTeslaTesla Solutronic Zero Carbon World Ecosynrg Ltd Siemens Saft
Green Charge
NetworkLithoRec
Orocobre Nippon Chemicals Lishen TianjinHi-Tech Tool
IndustriesHyundai Mobis Smart (Daimler) SMA Clever Electric Village Sharp Aquion Energy Sunverge Tesla?
Western Lithium 3M Hitachi Kawasaki Robotics Calsonic Kansei Kia BoschBoschBoschBosch Elektromotive Ltd Ideal Power Beacon PowerTangent energy
solutionsApple?
Bacanora AGC Semi Chemicals Rethink Robotics TDK Wheego ABB EV charging centre Nidec K2 Energy Demand energy JCI?
Pilbara JMATJMATJMATJMATLithium ion (LFP & Lithium ion (LFP & Lithium ion (LFP & Lithium ion (LFP &
LMO)LMO)LMO)LMO)Staubil Corp. Edrive Honda Sharp Npower Coda
Others Saft RenaultRenaultRenaultRenault Tesla POD Point Ltd Lishen Second lifeSecond lifeSecond lifeSecond life
Alevo SonnebatterieSonnebatterieSonnebatterieSonnebatterie Rolec Services Ltd EnerVault Freewire
ElectrolyteElectrolyteElectrolyteElectrolyte A123 systems EV traction drive electric motorEV traction drive electric motorEV traction drive electric motorEV traction drive electric motor Saft Schneider ElectricSchneider ElectricSchneider ElectricSchneider Electric A123 Mitsubishi
Nickel minersNickel minersNickel minersNickel miners Cheil Boston Power
Automation Automation Automation Automation
hardware and hardware and hardware and hardware and
software and software and software and software and
computingcomputingcomputingcomputing
Toshiba PHEVsPHEVsPHEVsPHEVs LG The New Motion BV RedTRedTRedTRedT EDF
NMC Norilsk Nickel
- 286ktUbe Industries BYD
GE intelligent
PlatformsToyota Toyota Redflow Viridian EV Alevo
Vale SA - 206kt Mitsubishi Chemicals Samsung HTE, Inc Tesla BMWBMWBMWBMW BYD
Jinchuan - 127MTTomiyama Pure
ChemicalsValence Hitachi Ford RWERWERWERWE
BHP BillitonBHP BillitonBHP BillitonBHP Billiton Guatsa Huasong Voltronix Honda General Motors E3DC
Sumitomo Metal
MiningNovolyteNovolyteNovolyteNovolyte European Batteries ZF
Cadillac/ General
MotorsLeclanche
Eramet BASFBASFBASFBASF Sony Automation toolingAutomation toolingAutomation toolingAutomation tooling ContinentalContinentalContinentalContinentalPorche/ Porche/ Porche/ Porche/
VolkswagenVolkswagenVolkswagenVolkswagenEnphase
Anglo American Anglo American Anglo American Anglo American Samsung Boston Power Hydromat Renault/Nissan McLauren Panasonic
Sherritt
International
Industrial Tech
ServicesMagna VolkswagenVolkswagenVolkswagenVolkswagen
Minara Anode/cathode Anode/cathode Anode/cathode Anode/cathode IPR Sonar Plastics BoschBoschBoschBosch FordArchema Isra Vision Systems General Motors General Motors
Cobalt producersCobalt producersCobalt producersCobalt producers Kureha KeenTec North AC Proputsion Mitsubishi
Sumitomo Metal
MiningLeoni Elocab,Ltd Aisin Toyota
Leibherr Automation
SystemsEM-Motive Daimler
Copper foilsCopper foilsCopper foilsCopper foils AnodeAnodeAnodeAnode Fuji Machinery
Furukawa Electric Hitachi Chemicals Hyundai Mobis FCEVFCEVFCEVFCEV
Nippon Foil Nippon Carbon
Advanced Lithium Advanced Lithium Advanced Lithium Advanced Lithium
ion (solid state ion (solid state ion (solid state ion (solid state
amd semisolid)amd semisolid)amd semisolid)amd semisolid)
Automotive Automotive Automotive Automotive
assembly and test assembly and test assembly and test assembly and test
systemssystemssystemssystems
Meinsha Toyota
BTR Energy 24MICA Cinetic
Automation corp.Honda
JFE Holdings Google SOLTEC Corp.Power/Battery management Power/Battery management Power/Battery management Power/Battery management
systemsystemsystemsystemHyundai
ShanShan STMicroelectronics International RectifierInternational RectifierInternational RectifierInternational Rectifier
Mitsubishi ChemicalsFront Edge
Technology (FET)Renesas Electronics Corporation
Oak Mitsui Bosch (Seeyo)
Automation Automation Automation Automation
installation/integratinstallation/integratinstallation/integratinstallation/integrat
ion contractorsion contractorsion contractorsion contractors
Toshiba
Total Carbon Sakti3 Industrial automation Infineon TechnologiesInfineon TechnologiesInfineon TechnologiesInfineon Technologies
SEC Carbon QuantumScape Koops Fairchild semiconductors
Mitsui Mining and
Smelting
TranTek Automation
Corp.Vishay Intertechnology
Timcal STMicoelectronicsSTMicoelectronicsSTMicoelectronicsSTMicoelectronics
Advanced lead Advanced lead Advanced lead Advanced lead
acidacidacidacidAlpha and Omega Semiconductors
Johnsons Controls ON Semiconductors
Battery speratorBattery speratorBattery speratorBattery sperator Exide NXP
Asahi Kasei GS Yuasa Corp
CelgardCelgardCelgardCelgard Enersys InvertorInvertorInvertorInvertor
Tonen/Toray Younicos SMA
Ube Industries SolaX power
SKNickel Metal Nickel Metal Nickel Metal Nickel Metal
Hydride (NiMH)Hydride (NiMH)Hydride (NiMH)Hydride (NiMH)Selectronic
Sumitomo Chemicals Panasonic (Sanyo) Analytic systems
Mitsubishi ChemicalsPEVE (Primeearth
EV Energy)Sustainable Energy
Mitsui Mining Gold Peak Xantrex
Idemitsu Kosan Corum Bejing Epsolar Technology
TMK China Ningbo Star Solar
Chint PowerSodium Salt Sodium Salt Sodium Salt Sodium Salt
batteriesbatteriesbatteriesbatteriesCRSNB
NGK Insulators ET Solar Energy Limited
Fiamm Goland Century
GE Gorzi
KLNE
Flow BatteriesFlow BatteriesFlow BatteriesFlow Batteries Medke
EnerVaultNingbo National Hi-Tech Park
Sunshine Technology
UniEnergy
TechnologiesReneSola
Vanadis Power Sungrow
Rongke Power Schneider Electric
ViZn Energy Centrosolar
Phocos
Sodium ionSodium ionSodium ionSodium ion
Acquion Energy
Faradion
Lithium SulphurLithium SulphurLithium SulphurLithium Sulphur
Oxis Energy
Sion Power
PolyPlus
Lithium airLithium airLithium airLithium air
IBM
Liox Power
PolyPlus

Berenberg Thematics
32
Section 2: Energy storage for autos – mass adoption is nearing
“Let us not forget that technology starts small and grows slowly before technology improves and costs go down.”
Bill Gates
Battery-powered EVs have existed for more than a century and initially were favoured over the internal combustion engine (ICE) for the same reasons which are encouraging its adoption today. However, while ICEs underwent radical improvements in efficiency, durability and affordability, battery technology did not move beyond the low energy density lead acid formula until the 1990s. As a result, later forays by car-makers into EV manufacturing such as GM’s EV1 were commercial failures because of the low performance of the early battery systems. It was only with the development of the higher energy density NiMH batteries by ECD Ovonic in 1998 that hybrid EVs such as the Toyota Prius became commercially successful. Lithium ion battery technology, which has nearly double the energy density of NiMH and four times than that of lead acid, is now propelling the next phase of EV adoption.
While the cost of lithium ion battery systems is still holding back EV adoption, initial safety issues have largely been resolved. In addition, the roll-out of fast-charging networks by the likes of Tesla is likely to ease concerns about range. We believe that lithium ion batteries and its advanced versions will dominate the EV space for both hybrids and plug-ins because of their better performance versus other battery technologies. Toyota which has
Superior performance (handing and acceleration), lower operating costs and fiscal incentives are driving the initial phase of growth for EVs.
● We believe that mass adoption of EVs will take place over the next five years. EV penetration is currently being impeded by its price premium and an inadequate global charging network. We expect battery pack costs to decline by more than 40% by 2020 which along with continued expansion in charging network should spur EV penetration.
● Lithium ion dominates the automotive battery space. We think that Tesla will continue to maintain its competitive advantage versus its peers because 1) it uses higher energy density NCA cathode chemistries in its lithium ion batteries, 2) it uses a cost-effective cylindrical cell format versus pouch or prismatic formats, 3) it has an exclusive network of fast-charging stations, and 4) it achieves scale benefits through its Gigafactory.
● Lithium ion is not a mature technology and its energy density can potentially double over the next five years due to availability of new electrode materials and by moving towards solid-state cell structure.
● Regulatory incentives are currently a key driver for EVs in their initial growth phase. We do not think that they provide a sustainable route to mass penetration.
● The winners in this segment who will see strong demand growth and margin expansion are:
1. EV manufacturing equipment suppliers (manufacturers of industrial robots, automation hardware, software and installation contractors);
2. manufacturers of battery packs and power trains (inverters and battery management systems);
3. charge point manufacturers;
4. public charging network providers;
5. utilities and battery recycling companies.
● The losers will be 1) the incumbent ICV manufacturers and 2) car maintenance services providers.

Berenberg Thematics
33
historically relied on NiMH batteries for its hybrids, but recently decided to use lithium ion for 50% of its Prius cars in North America and Japan by 2016.
EVs come in different degrees of hybridisation (ie level of
electrification)
There are different types of EV hybrid, depending on the degree of reliance on electric power versus internal combustion power. At a lower level of this “hybridisation” are the non-plug-in hybrids (HEVs) such as the Toyota Prius, while at the other extreme are the BEVs such as the Nissan Leaf, the Renault Zoe, the Tesla S and the BMW i3 which rely solely on electric power. In the middle of the hybridisation range are the PHEVs such as the Chevrolet Volt, the Ford Fusion and the Porsche Panemera.
EVs across the hybridisation range (0-100%) EV electrical equipment layout
Source: McKinsey Source: Ricardoknowledge

Berenberg Thematics
34
EV adoption – EVs increasingly surpass ICVs in performance
Historically, manufacturers of EVs have touted the green credentials of their cars as their unique selling point. However, what is clear from the low EV penetration over the last five years is that environmental friendliness is not the most the important factor in car purchasing decisions. Indeed, according to a recent study by consultant Strategic Vision, environmental friendliness comes 30th among consumer purchase preferences, a long way down the list compared to car performance (ie handling, agility and comfort), the most important factor in the purchasing decision.
EVs’ weak performance in the past has mainly been due to the drawbacks of the prevailing lead acid (ie GM’s EV1) and NiMH (ie the Prius) batteries. The lower energy/power density of the previous automotive batteries meant that they offered poor range. This is now changing with the wider adoption of lithium ion battery technology, which is rapidly improving and at the same time reducing in cost. As a result, EVs are now surpassing ICVs in both comfort and performance.
Car performance and driving experience rather than fuel
economy or environmental friendliness are the main
determinants driving customers’ purchasing decisions
PEVs (BEVS and PHEVs) are considered to be environmentally
friendly but lag on performance versus ICVs – this explains why
EV penetration remains low
Source: Strategic Vision presentation: The Electric Customer, presented at The Battery Conference 2015
Source: Strategic Vision presentation: The Electric Customer, presented at The Battery Conference 2015
Three main factors are encouraging early adopters to move to EVs.
FactorFactorFactorFactor #1 #1 #1 #1 –––– EVs increasingly offer superior performance EVs increasingly offer superior performance EVs increasingly offer superior performance EVs increasingly offer superior performance
Tesla’s vehicles exhibit the best of what EVs currently have to offer. Tesla’s Model S easily beats ICV peers in terms of acceleration and comfort. It also boasts a range of more than 200 miles on a single charge, as well as a network of fast-charging stations across the US, Europe and China which can provide a ~80% charge in less than 30 minutes. While charging time remains far from ideal, the duration has fallen since the introduction of advanced lithium ion batteries which use LTO instead of graphite as the anode material. LTO batteries can charge in less than 10 minutes. Similarly the range for EVs is also improving with increasing doping of graphite anode with silicon which increases the energy density of the battery.
Rank Rank Rank Rank
(of 45)(of 45)(of 45)(of 45)Customer AttitudesCustomer AttitudesCustomer AttitudesCustomer Attitudes
Top Top Top Top
BoxBoxBoxBox
1 I prefer a balance of comfort and performance 46%
2 When I drive for fun, I mainly prefer to relax and listen to music or talk 41%
4 Value equals balance of costs, comfort & performance 37%
5 I prefer vehicles that provide superior handling and cornering agility 36%
7 I want [a vehicle] that I love so much that I look forward to nice enjoyable drives 31%
9 I want a vehicle that provides the quietest interior 27%
10101010 Fuel economy is a leading consideration in my purchase decisionFuel economy is a leading consideration in my purchase decisionFuel economy is a leading consideration in my purchase decisionFuel economy is a leading consideration in my purchase decision 26%26%26%26%
11 I prefer a vehicle that has the capability to outperform others 25%
12 I prefer vehicles that provide seperior straight ahead power 24%
13 I want to look good when driving my vehicle 23%
14 I see my vehicle as an extension of my personality 21%
13 … …
39393939 I would pay significantly more for environmentaly friendly vehicleI would pay significantly more for environmentaly friendly vehicleI would pay significantly more for environmentaly friendly vehicleI would pay significantly more for environmentaly friendly vehicle 10%10%10%10%
Customer AttitudesCustomer AttitudesCustomer AttitudesCustomer Attitudes (% Extremely Important - Top Box)
GasGasGasGas DieselDieselDieselDiesel PEVPEVPEVPEV HEVHEVHEVHEV
Powerful 21% 66%66%66%66% 6%6%6%6% 5%5%5%5%
Bold 11% 26%26%26%26% 3%3%3%3% 2%2%2%2%
Leader 5% 19%19%19%19% 14%14%14%14% 6%
Environmentally friendly 5% 13%13%13%13% 65%65%65%65% 62%62%62%62%
Technologically advanced 28% 32% 60%60%60%60% 63%63%63%63%
Economical 23% 24% 52%52%52%52% 59%59%59%59%
Sensible 21% 8%8%8%8% 21% 38%38%38%38%
Innovative 6% 5% 29%29%29%29% 21%21%21%21%
Reliable 31% 18%18%18%18% 8%8%8%8% 37%
Safe 28% 23% 7%7%7%7% 25%
Image Incidence (%)Image Incidence (%)Image Incidence (%)Image Incidence (%)
● EVs increasingly offer superior acceleration and handling versus their ICV peers. Significant progress is also being made to increase their range and lower the required charging time which should help ease their range anxiety.
● EVs transfer more than 80% of the stored chemical energy into kinetic energy versus only 20% for an ICV. This means that EV fuel economy can easily be double that of an ICV.
● EVs also benefit from significant purchase incentives such as direct subsidies as well as lower congestion/toll charges and access to bus lanes.

Berenberg Thematics
35
FactorFactorFactorFactor #2 #2 #2 #2 –––– EVs easily superior to ICVs in terms of fuel economy/operating costsEVs easily superior to ICVs in terms of fuel economy/operating costsEVs easily superior to ICVs in terms of fuel economy/operating costsEVs easily superior to ICVs in terms of fuel economy/operating costs
According to Strategic Vision, fuel economy comes 10th in the car purchasing preferences list. This is where EVs easily beat their ICV counterparts. In EVs, ~80% of the grid energy is transferred to the wheel; this compares to only 20% of gasoline energy being converted to kinetic energy in ICVs. As a result, energy consumption for EVs is significantly lower. According to estimates by researcher Fuigenbaum and Kolbenstvedt, energy consumption in BEVs is less than half that in both petrol and diesel power ICVs. Fuel efficiency savings will vary from region to region, as they depend on local electricity tariffs and gasoline prices.
EVs operating costs (fuel and maintenance) is significantly lower versus ICVs
Source: Fuigenbaum and Kolbenstvedt (2013)
FactorFactorFactorFactor #3 #3 #3 #3 –––– strong fiscal incentives strong fiscal incentives strong fiscal incentives strong fiscal incentives
Incentives on both the supply and demand side for EVs vary greatly by country, and also within states and cities in countries such as the US, Canada and China. For the consumer, these incentives typically include fiscal subsidies such as no value-added tax (VAT) on purchase and a one-time purchase grant. The total effect of all the subsidies makes an EV’s purchase price comparable to that of an ICV in some markets. Other perks also include exception from other tolls, such as the congestion charge in London or charges on toll roads, parking permits in some cities, and access to car-pool or buses lanes.
Petrol VehiclePetrol VehiclePetrol VehiclePetrol Vehicle Diesel VehicleDiesel VehicleDiesel VehicleDiesel Vehicle HybridHybridHybridHybrid BEVBEVBEVBEV
Energy consumption (MJ/KM) 2.3 1.7 1.4 0.7
CO2 (g/km) 160 122 100 0
Nox (g/km) 0.265 0.43 0.006 0
HC (g/km) 0.083 0.017 0.058 0
CO (g/km) 1.092 0.053 0.258 0
PM (g/km) 0.003 0.022 0 0
Energy consumption and emissions for vehicles in 2010 - carbon free electricityEnergy consumption and emissions for vehicles in 2010 - carbon free electricityEnergy consumption and emissions for vehicles in 2010 - carbon free electricityEnergy consumption and emissions for vehicles in 2010 - carbon free electricity
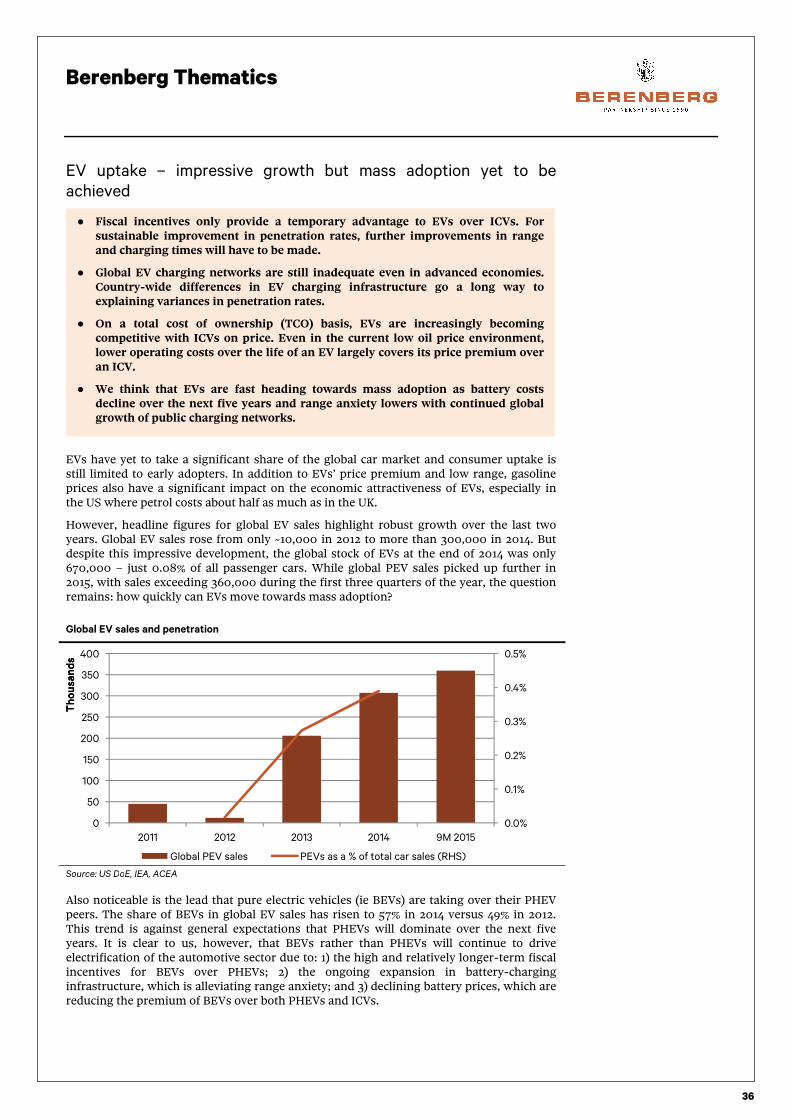
Berenberg Thematics
36
EV uptake – impressive growth but mass adoption yet to be
achieved
EVs have yet to take a significant share of the global car market and consumer uptake is still limited to early adopters. In addition to EVs’ price premium and low range, gasoline prices also have a significant impact on the economic attractiveness of EVs, especially in the US where petrol costs about half as much as in the UK.
However, headline figures for global EV sales highlight robust growth over the last two years. Global EV sales rose from only ~10,000 in 2012 to more than 300,000 in 2014. But despite this impressive development, the global stock of EVs at the end of 2014 was only 670,000 – just 0.08% of all passenger cars. While global PEV sales picked up further in 2015, with sales exceeding 360,000 during the first three quarters of the year, the question remains: how quickly can EVs move towards mass adoption?
Global EV sales and penetration
Source: US DoE, IEA, ACEA
Also noticeable is the lead that pure electric vehicles (ie BEVs) are taking over their PHEV peers. The share of BEVs in global EV sales has risen to 57% in 2014 versus 49% in 2012. This trend is against general expectations that PHEVs will dominate over the next five years. It is clear to us, however, that BEVs rather than PHEVs will continue to drive electrification of the automotive sector due to: 1) the high and relatively longer-term fiscal incentives for BEVs over PHEVs; 2) the ongoing expansion in battery-charging infrastructure, which is alleviating range anxiety; and 3) declining battery prices, which are reducing the premium of BEVs over both PHEVs and ICVs.
0.0%
0.1%
0.2%
0.3%
0.4%
0.5%
0
50
100
150
200
250
300
350
400
2011 2012 2013 2014 9M 2015
Thousands
Thousands
Thousands
Thousands
Global PEV sales PEVs as a % of total car sales (RHS)
● Fiscal incentives only provide a temporary advantage to EVs over ICVs. For sustainable improvement in penetration rates, further improvements in range and charging times will have to be made.
● Global EV charging networks are still inadequate even in advanced economies. Country-wide differences in EV charging infrastructure go a long way to explaining variances in penetration rates.
● On a total cost of ownership (TCO) basis, EVs are increasingly becoming competitive with ICVs on price. Even in the current low oil price environment, lower operating costs over the life of an EV largely covers its price premium over an ICV.
● We think that EVs are fast heading towards mass adoption as battery costs decline over the next five years and range anxiety lowers with continued global growth of public charging networks.

Berenberg Thematics
37
Globally, BEVs are taking a lead over PHEVs and their share in global EV sales has risen to 57% in
2014 versus 49% in 2012
Source: US DoE, IEA, ACEA, EV Obsession
China has now replaced the US as the largest PEV market on the back of aggressive subsidies and battery-charging infrastructure roll-out plans: After strong growth since 2013, in 9M 2015 China replaced the US as the world’s largest PEV market. While the share of PHEVs has been falling in Europe and the US, it has been rising in Asia. We believe this highlights the still insufficient electric charge point coverage in Asia (ex-Japan). This is likely to change, as the Chinese government is reportedly planning to spend $16bn between now and 2020 to increase coverage of PEV charging stations in the country: China’s 13th five-year development plan is targeting 5m more charging points and an PEV sales target of 5m (which is nearly a quarter of China’s car sales in 2014).
China became the largest PEV market in 9M 2015
Source: US DoE, IEA, ACEA, EV Obsession
-
20,000
40,000
60,000
80,000
100,000
120,000
140,000
160,000
180,000
200,000
2011 2012 2013 2014
BEVs PHEVs
+57%
+39%
96
116
87
65
98
115
18
75
137
30 33
20
0
20
40
60
80
100
120
140
160
2013 2014 9M 2015
Thousands
Thousands
Thousands
Thousands
US Europe China Japan

Berenberg Thematics
38
BEVs: strong growth in all markets in 2014… …But Asia is showing the strongest PHEV growth potential, while
the share of PHEVs in the US and Europe has declined
Source: US DoE, IEA, ACEA, EV Obsession Source: US DoE, IEA, ACEA, EV Obsession
US – Tesla and Nissan dominates the all-electric space while GM’s Volt is the best-selling PHEV since 2012: In the US, the BEV market is clearly dominated by three players – Nissan (the Leaf), Tesla (the Model S) and BMW (the BMW i3). It is a similar story in the US PHEV market, with the four top car models comprising 96% of PHEV sales in 2014. We expect the level of competition in both the BEV and PHEV markets to ramp up over the next three years, as all the major car manufacturers (including the US giants such as GM) are focusing on bringing EV offerings to the market despite the risk that this will cannibalise their traditional ICV offering.
US BEVs – the Nissan Leaf, Tesla S and BMW i3 are driving EV
sales growth in the US
US PHEV – based on tentative numbers total sales fell in 2015.
Chevrolet Volt remains the best selling PHEV
Source: US DoE, IEA, ACEA, EV Obsession Source: US DoE, IEA, ACEA, EV Obsession
Europe – Norway and the UK are spearheading EV adoption; however, market penetration remains at ~1% in most of Europe’s largest economies: In Europe, the EV market is a lot more diversified than in the US. While the Renault Zoe, Nissan Leaf and Daimler FourTwo together had a market share of 77% of total BEV sales in 2013, a number of other recently introduced BEVs such as the BMW i3 are fast gaining share. In terms of regions, UK and Norway are leading PEV sales in Europe (please see LHS chart below), but sales penetration remains low at ~1% in most of its largest economies.
0
10000
20000
30000
40000
50000
60000
70000
80000
US Europe Asia & RoW
2013 2014 2015
+31%+73%
+81%
+17%
0
10000
20000
30000
40000
50000
60000
US Europe Asia & RoW
2013 2014 2015
+11%
+26%
+162%
-20%
9,674 9,819
22,610 30,200
17,269- 2,400
19,400
16,750
26,566
--
-
6,092 11,024
-
10,000
20,000
30,000
40,000
50,000
60,000
70,000
80,000
2011 2012 2013 2014 2015
Leaf Tesla Model S* BMW I3 Others
7,671
23,461 23,094 18,805 15,393
-
20,000
40,000
60,000
2011 2012 2013 2014 2015
Chevrolet Volt Prius PHEV Ford C-Max Energi
Ford Fusion Energi Others

Berenberg Thematics
39
Europe PEVs by region – growth is being led by Norway and UK EV sales penetration remains low at ~1% in most of Europe’s
largest economies – Scandinavian countries are the only exception
Source: US DoE, IEA, ACEA, EV Obsession Source: US DoE, IEA, ACEA, EV Obsession
China is now the largest EV market in the world in terms of annual sales. In 2014, China only accounted for ~12% of global stock of EVs in 2014, which placed it well behind the US at 39% and Japan at 16%: however, in 9M 2015, Chinese EV sales accounted for more than a third of the global EV sales. The share of PHEVs in the sales mix has also been rising. In our view, this is mainly because China has been relatively slow in its roll-out of battery-charging infrastructure (although as highlighted above, this weakness is being fixed). EV growth in China is being led by local players such as BYD (fiscal purchase incentives currently do not cover international manufacturers such as Tesla).
China – Both BEVs and PHEVs experiencing stellar growth but
share of PHEVs is rising in the sales mix
China accounted for just ~12% of global stock of EVs in 2014, but
in 2015 its share has risen well above 30%
Source: US DoE, IEA, ACEA, EV Obsession Source: IEA 2015 EV outlook report
Despite spending RMB11bn on charging infrastructure, Chinese cities lag European ones in terms of charge point coverage – this is
likely to change considering the Chinese government has recently announced aggressive plans to install 5m charging points by 2020
to support its EV sales targets
Source: McKinsey, “Supercharging the development of electric vehicles in China”, published April 2015
8
4
22
810
13
20
1513 13 12
2425
2118
15 15
21
0
5
10
15
20
25
30
Norway UK Netherland
Germany France Others
Thousands
Thousands
Thousands
Thousands
2013 2014 9M 2015
22.2%
1.0%
6.0%
0.6% 1.1%
0%
5%
10%
15%
20%
25%
Norway UK Netherland
Germany France
PEVs as a % of total car sales in 9M 2015
3
30
57
15
45
114
0
20
40
60
80
100
120
2013 2014 2015 (till Oct)
Thousands vehicles
Thousands vehicles
Thousands vehicles
Thousands vehicles
PHEVs BEVs
12%
16%
39%
33%
China
Japan
USA
RoW
TOP 3% of
global EV
0 0.5 1 1.5 2
Charging poleper square km
Charging poleper thousand people
Beijing Shanghai Berlin London Oslo

Berenberg Thematics
40
Analysing the role of fiscal incentives for EV adoptionAnalysing the role of fiscal incentives for EV adoptionAnalysing the role of fiscal incentives for EV adoptionAnalysing the role of fiscal incentives for EV adoption
The chart below plots EV penetration in the key end-markets in 2013-14. We make three observations. 1) Market penetration remains low in all markets, the exceptions being Norway and the Netherlands. We think that exceptionally high fiscal incentives, along with the relatively higher purchasing power of consumers in Scandinavian countries, explain the higher EV penetration there. 2) Market penetration achieved through high fiscal purchase incentives alone is not sustainable. This is clear from the declining, albeit high, share of EVs in total car sales in the Netherlands, where the phasing out of fiscal incentives on PHEVs in 2013 has been followed by declining sales. 3) Market penetration did not improve significantly in 2013-14, despite the high fiscal incentives in a number of these countries.
Market penetration for EVs has remained weak in most markets apart from Norway and the Netherlands
Source: IEA Global EV Outlook 2015
Weak relationship between fiscal incentives and EV mass penetration: The following chart plots EV penetration against fiscal purchase incentives per EV for the important end-markets. As can be seen, fiscal incentives do not seem to have a significant bearing on consumers’ preferences to switch to EVs from ICVs (R square is only ~40%). Examples are Denmark, China and France, where despite high fiscal incentives, market penetration remains weak for EVs.

Berenberg Thematics
41
There is a weak relationship between EV market penetration and the one-off fiscal incentives being offered for car purchase
Source: Berenberg estimates; IEA
Range anxiety is the primary factor holding back EV mass adoptionRange anxiety is the primary factor holding back EV mass adoptionRange anxiety is the primary factor holding back EV mass adoptionRange anxiety is the primary factor holding back EV mass adoption
We think that range anxiety is the primary factor influencing consumer acceptance of EV technology. The average range for mid-priced EVs (such as the Nissan Leaf and the Renault Zoe) remains around 150 miles on a single charge, which is half the average ICV petrol tank size (300 miles). The higher-end 85kWh Tesla Model S has a range of 265 miles, but at a cost of ~$100,000, it is beyond the reach of most consumers.
While battery costs continue to fall, we think that mid-end EVs will still be unable to compete with ICVs on range without a radical improvement in advanced lithium ion battery technology. We doubt that this will happen in the foreseeable future. As explained in Section 1, the chemistry of high energy density battery technologies such as lithium sulphur and lithium is still at an early stage of development, and we believe it could take 15-20 years for these battery types to be suitable for automotive use.
Hence we believe that EV range anxiety will persist. However, we think that low EV range would be less of an issue if adequate charging infrastructure could be installed. Global annualised charging infrastructure spending for EVs has risen by more than 3x during 2013-14 versus 2008-12, according to data by the IEA’s Global EV Outlook report. As a result, public fast charge points have risen by ~8x and slow charging points by 2x since 2012.
Annual infrastructure spending has risen by more than 3x in
2013-14 versus the prior four years; in contrast, annual fiscal
spending has been stable
Charging infrastructure has more than doubled for slow-charging
points and has risen by 8x for fast-charging points since end-
2012
Source: IEA Global EV Outlook 2015
Norway
DenmarkChinaFranceUK
JapanUSA
Netherland
ItalyPortugalGermany
R² = 0.4127R² = 0.4127R² = 0.4127R² = 0.4127
(2.0%)
0.0%
2.0%
4.0%
6.0%
8.0%
10.0%
12.0%
14.0%
0 2000 4000 6000 8000 10000 12000 14000 16000 18000
2014 Fiscal incentives for EV purchase (EUR per vehicle)
EV salespenetration 2014
0
0.5
1
1.5
2
2.5
3
3.5
4
2008-12 2013-14
Infrastructure Fiscal Incentives
Annualized infrastructure spending has risen by
more than 3x in 2013-14
versus 2008-12.
46000
1900
94000
15000
0
20000
40000
60000
80000
100000
Slow charging points Fast charging points
end 2012 end 2014
up by up by up by up by
>2x>2x>2x>2x
up by up by up by up by
8x8x8x8x

Berenberg Thematics
42
The global EV charging network is still insufficientThe global EV charging network is still insufficientThe global EV charging network is still insufficientThe global EV charging network is still insufficient
In our view, for EV penetration to over-reach ICVs’, the global electric charge point network will need to become many times larger than the petrol station network. This is because of the significantly higher “refill turnover” of a petrol terminal compared to even a fast electric charge point – charging times are a lot longer for EVs versus the time taken for ICVs to refill. In most end-markets, the EV charging network is still insufficient and not comparable to the network of gasoline stations. The Netherlands, Norway and to a lesser extent Japan are the three countries where the electric charge network is starting to reach significant scale.
EV charging infrastructure is still not comparable to the petrol station network in most end-markets
Source: Berenberg estimates, IEA
The variance in the coverage of charging infrastructure explains the difference in EV penetration from country to country: The chart below (EV sales penetration by country versus respective EV charge point/petrol station ratios) demonstrates the country-wide differences in EV sales penetration (R square is 80%).
EV charging network coverage significantly explains country wide differences in EV penetration
Source: Berenberg estimates, AFDC, Chargemap, IEA
0.3
0.8
2.0
0.9
0.1
0.8
2.9
4.3
0.2
0.7
0.3 -
1
1
2
2
3
3
4
4
5
-
20
40
60
80
100
120
140
Thousands
Thousands
Thousands
Thousands
Number of charging points No. of Gasoline stations EV charge points to Gasoline station ratio (RHS)
China
Denmark FranceGermany
ItalyJapan
Netherlands
Norway
PortugalSpain
Sweden
R² = 80%R² = 80%R² = 80%R² = 80%
-2%
0%
2%
4%
6%
8%
10%
12%
14%
- 0.50 1.00 1.50 2.00 2.50 3.00 3.50 4.00 4.50
EV salespenetration 2014
EV charge point to Gasoline station ratio

Berenberg Thematics
43
Market researcher IHS forecasts that global battery-charging coverage will rise by more than 4x over 2015-17. In our view, the fastest roll-out of charging points will likely be in China, considering the extent of fiscal outlay planned there.
Global cumulative charging station deployments, IHS forecasts (m units)
Source: HIS
Price premium is justifiedPrice premium is justifiedPrice premium is justifiedPrice premium is justified
The high price premium of EVs over ICVs is a major deterrent for mass adoption. The price premium results from the high cost of the battery, which forms more than 25% of an EV’s total cost.
Björn Nykvist’s and Måns Nilsson’s recent “Rapidly falling cost of battery packs for electric vehicles” study suggests that for EVs to become cost competitive with an ICV, a battery pack would need to cost $150/kWh (currently cost at $300/kWh). In our view, this estimate ignores the long-term cost savings resulting from the lower fuel and maintenance costs of an EV versus an ICV. Indeed, in a 2013 research study, IEA estimated that price parity would be reached when battery pack costs fall to $300/kWh. Based on a bottom-up cost model (as explained in Section 1), we believe that Tesla’s EV battery packs already cost less than this. In our view, considering the significantly lower operating cost, EVs are already near the level to be cost competitive versus ICVs.
In order to demonstrate this, we compare 1) the EV Tesla S with ICV peer Jaguar XJ Saloon in the mid-end luxury space and 2) the Nissan Leaf EV with ICEV peer Ford Focus in the mass market. For these two vehicle peers, we estimate the annual fuel savings in three important end-markets – the US, the UK and Germany. The following two charts show the price differential between these two EV-ICV pairings versus the five-year operational cost savings in the UK and the US. Due to the high cost of fuel in the UK, EVs are already competitive at both the mid-end luxury and mass-market level there as the operational cost savings over a five-year period exceed the price premium. In the US, fuel costs are significantly lower, and EVs are more competitive in the mid-end luxury space rather than in the mass market.
0
2
4
6
8
10
12
14
2011 2012 2013 2014 2015E 2016E 2017E 2018E 2019E 2020E

Berenberg Thematics
44
EV versus ICV – price differential versus estimated lower operating cost analysis
Source: Berenberg estimates, US DoE (www.fueleconomy.gov), EIA
(UK) TESLA-S vs Jaguar XJ Saloon - price premium versus operational savings over 5 years in £(UK) TESLA-S vs Jaguar XJ Saloon - price premium versus operational savings over 5 years in £(UK) TESLA-S vs Jaguar XJ Saloon - price premium versus operational savings over 5 years in £(UK) TESLA-S vs Jaguar XJ Saloon - price premium versus operational savings over 5 years in £
(US) TESLA-S vs Jaguar XJ Saloon - price premium versus operational savings over a 5 years in US$(US) TESLA-S vs Jaguar XJ Saloon - price premium versus operational savings over a 5 years in US$(US) TESLA-S vs Jaguar XJ Saloon - price premium versus operational savings over a 5 years in US$(US) TESLA-S vs Jaguar XJ Saloon - price premium versus operational savings over a 5 years in US$
(UK) Nissan Leaf vs Ford Focus- price premium versus operational savings over 5 years in £(UK) Nissan Leaf vs Ford Focus- price premium versus operational savings over 5 years in £(UK) Nissan Leaf vs Ford Focus- price premium versus operational savings over 5 years in £(UK) Nissan Leaf vs Ford Focus- price premium versus operational savings over 5 years in £
(US) Nissan Leaf vs Ford Focus- price premium versus operational savings over 5 years in US$(US) Nissan Leaf vs Ford Focus- price premium versus operational savings over 5 years in US$(US) Nissan Leaf vs Ford Focus- price premium versus operational savings over 5 years in US$(US) Nissan Leaf vs Ford Focus- price premium versus operational savings over 5 years in US$
9,475
-5,000+3,791
-13,305
-2,500
-900-750
-20000
-15000
-10000
-5000
0
5000
10000
15000
Tesla Premium EV Subsidy Depreciation Fuel Insurance Road Tax Maintenance
3,855-5000
-173
-13,442
-695 -150
-2,532
-20000
-15000
-10000
-5000
0
5000
Leaf Premium EV Subsidy Depreciation Fuel Insurance Road Tax Maintenance
-9735
18682
-7500 +8259.2-97467
-710
-5000
0
5000
10000
15000
20000
25000
Tesla Premium EV Subsidy Depreciation Fuel Insurance Maintenance
13,837
-7,500
+5,129-4,481
+828 -1,138
0
2000
4000
6000
8000
10000
12000
14000
16000
Leaf Premium EV Subsidy Depreciation Fuel Insurance Maintenance

Berenberg Thematics
45
EV versus ICV – price differential versus estimated lower operating cost analysis
Source: Berenberg estimates, US DoE (www.fueleconomy.gov), EIA
The chart above illustrates the sensitivity of fuel cost savings under different oil price scenarios. Our deductions are supported by the TCO study by consultancy PWC released in 2013. The following graph shows PWC’s TCO assessment for different types of EVs and ICVs. It forecasts that by 2024, the TCO for a BEV will be significantly lower than for an ICV as well as for a PHEV or non-plug-in HEV.
Consultant EC forecasts that BEVs will become significantly
cheaper than ICVs and PHEVs by 2024 based on TCO…
…This will occur due to the declining costs for lithium ion battery
packs as production reaches industrial levels from 2016
Source: PWC Source: PWC
EV outlook EV outlook EV outlook EV outlook –––– heading towards mass adoptionheading towards mass adoptionheading towards mass adoptionheading towards mass adoption
Global EV sales were ~300,000 in 2014, which represents market penetration of only 0.35%. Assuming an average EV price at $40,000, this translates into a market size of ~$12bn. In a base-case scenario where market penetration rises to 4% by 2020, global EV sales could reach ~4m units: this would translate into a global EV market size of more than $200bn by 2020, implying a five-year CAGR of 75%.
We believe that 4% market penetration is possible considering:
1) the declining TCO for BEVs as a result of the ongoing reduction in lithium ion pack costs as production reaches industrial scale;
2) lower range anxiety due to growing coverage of public electric charging;
3) aggressive national targets in China, Europe and the US;
4) increasing EV product launches by automotive OEMs over the next 3-5 years.
Percentage ChangePercentage ChangePercentage ChangePercentage Change -60.0%-60.0%-60.0%-60.0% -40.0%-40.0%-40.0%-40.0% -20.0%-20.0%-20.0%-20.0% 0.0%0.0%0.0%0.0% 20.0%20.0%20.0%20.0% 40.0%40.0%40.0%40.0% 60%60%60%60%
WTI Price ($/bbl) 12.56 18.85 25.13 31.41 37.69 43.97 50.26
Brent Price ($/bbl) 13.26 19.88 26.51 33.14 39.77 46.40 53.02
Premium Gasoline Price (US) cents/litre 40.55 48.69 56.82 64.96 73.10 81.23 89.37
Regular Gasoline Price (US) cents/litre 30.79 37.66 44.54 51.41 58.28 65.15 72.02
Super Unleaded Petrol Price (UK) pence/litre 54.59 73.93 93.28 112.62 131.96 151.31 170.65
Unleaded Petrol Price (UK) pence/litre 49.78 67.42 85.06 102.70 120.34 137.98 155.62
Fuel Cost Savings (5 Years)Fuel Cost Savings (5 Years)Fuel Cost Savings (5 Years)Fuel Cost Savings (5 Years)
UK Tesla vs. Jaguar (£) 5,880 8,495 11,110 13,725 16,341 18,956 21,571
UK Nissan vs. Ford (£) 3,426 5,095 6,765 8,434 10,103 11,773 13,442
US Tesla vs. Jaguar ($) 3,148 4,247 5,347 6,447 7,547 8,647 9,747
US Nissan vs. Ford ($) 579 1,229 4,481 2,530 3,180 3,831 4,481
Assumptions:
1) Jaguar runs on Premium Gasoline in the US and Super Unleaded Petrol in the UK 4) Ford averages 30 Miles/US Gallon and c36Miles/Imperial Gallon
2) Ford runs on Regular Gasoline in the US and Unleaded Petrol in the UK 5) 1 Imperial Gallon = 1.20095 US Gallons
3) Jaguar averages 21 Miles/US Gallon and c25 Miles/Imperial Gallon 6) 15,000miles per year travelled by a car on average
5 Year Fuel Cost Savings5 Year Fuel Cost Savings5 Year Fuel Cost Savings5 Year Fuel Cost Savings
0
200
400
600
800
1000
2008 2009 2010 2011 2012 2013 2014 2015 2016 2017 2018 2019 2020
STAGE 1
Limited Capacity Limited SuppliersPilot Volumes
STAGE 2
Over-CapacitySlow Volume Ramp-upNew Market EntrantsTechnical Advances
STAGE 3
Sustainable Industrial VolumesConsolidated CompetitrosOperational ImprovementsContinued Technical Advances

Berenberg Thematics
46
The chart below gives EV sales by 2020 on a bear-case assumption of a 1% market penetration and a bull-case assumption of a 7% market penetration.
EV sales would reach 4m units if market penetration rises to 4% by 2020
Source: Berenberg estimates; HIS
Rising EV sales have interesting implications for global electricity demand. We estimate that global automotive annual demand for electricity would rise by 15x to ~25,000GWh (or 2.9GW) per annum by 2020 if EV market penetration rises to 4%. This is based on the following assumptions:
1) EV fuel economy improves from the current ~30kWh/100 miles to 28kWh/100 miles by 2020; and
2) average annual car usage is 15,000 miles.
Global electricity demand from automotive use will more than triple to 22,500GWh by 2020 under
our base case EV penetration of 5% over the next five years
Source: Berenberg estimates; IHS
0
1
2
3
4
5
6
7
8
2013 2014 2015E 2016E 2017E 2018E 2019E 2020E
PEV sales in PEV sales in PEV sales in PEV sales in MillionsMillionsMillionsMillions
EVpenetration2020 = 7%(Bull case)
EVpenetration2020 = 4%(Base case)
EVpenetration2020 = 1%(Bear case)
25,843
0
5,000
10,000
15,000
20,000
25,000
30,000
35,000
40,000
45,000
2014 2015E 2016E 2017E 2018E 2019E 2020E
EV penetration2020 = 7% (Bullcase)
EV penetration2020 = 4%(Base case)
EV penetration2020 = 1%(Bear case)
GWh per annumGWh per annumGWh per annumGWh per annum

Berenberg Thematics
47
StartStartStartStart----stop (also called mild hybrids) functionality is likely to become widespread stop (also called mild hybrids) functionality is likely to become widespread stop (also called mild hybrids) functionality is likely to become widespread stop (also called mild hybrids) functionality is likely to become widespread –––– ultraultraultraultra----capacitors the ideal technology capacitors the ideal technology capacitors the ideal technology capacitors the ideal technology
The start-stop function in vehicles, also known as “mild-hybrids”, uses an onboard battery which takes over when the vehicle is sitting idle in traffic and provides all the power requirements for the vehicle’s electric and electronic devices (ie electric seat adjustment, telematics, temperature control). This allows the internal combustion engine to remain switched off during these periods, providing a 5-10% fuel saving. The difference between a mild hybrid and an EV is that the battery in a mild hybrid does not provide power to the wheels.
Power requirements are rising – start-stop systems are moving from low-voltage (12V) to high-voltage (48V) systems: Power requirements for cars are on the increase, including the need for larger size and higher voltage start-stop systems. Manufacturers are already reaching the limits of the power supplied by a 12V traditional lead acid battery. European OEMs Volkswagen, Daimler and BMW are moving towards the adoption of 48V start-stop systems which either require an additional 48V lithium ion battery or an advanced version of the 12V lead acid battery such as absorbent glass mat (AGM) batteries or enhanced flooded batteries (EFPs). Lead acid battery manufacturers such as Johnsons Controls and Exide, as well as electronics giant Bosch, have launched 48V systems based both on advanced lead acid batteries and lithium ion batteries. Other lithium ion battery manufacturers such as Samsung have also launched 48V battery systems.
48V start-stop systems can provide auxiliary power supply to a car while the vehicle is
moving – this can help improve fuel economy by more than 10%
Source: AVL
Nearly 22% of new cars global sold currently come with start-stop functionality; Europe has the highest adoption at 60-70% while the US is only at 7%: There has been strong growth in start-stop systems in Europe over the last five years. Nearly half of new cars sold in Europe currently come with start-stop systems. This is because of higher fuel prices as well as tougher regulations on emissions in Europe. In the US, there are only a few OEMs which offer start-stop and in 2014 only around 7% of the vehicles sold had the system, according to IHS. The weak adoption in US can be explained by the cost (on average ~$300) of the start-stop system.
40% (ie 40m) of all new cars are likely to be equipped with start-stop by 2020, up from 22% in 2015 – leading to a rise in battery demand from 6GWh in 2015 to 20GWh: Adoption of start-stop systems will need to pick up in the US if manufacturers are to meet their 54.5mpg fuel efficiency requirement for new cars by 2025. While initial growth of start-stop in the US is likely to be in the 12V category (cheaper and less complex), 48V start-stop systems based on two batteries are likely to increase in number due to their higher potential to improve fuel efficiency. Due to the potential for growth in the US, we expect global adoption to rise to 40% of new cars sales by 2020 (market researcher Navigant is forecasting 55% by 2024) from the current level of 22%. 12V start-stop batteries have an average size of 0.36kWh, but we expect the average size to rise to 0.5kWh by 2020 due to adoption of the bigger 48V systems which have two batteries. Based on these assumptions, we expect battery demand for start-stop systems to rise from ~6GWh in 2015 to 20GWh by 2020.

Berenberg Thematics
48
Ultra-capacitors coupled with standard car batteries could become the dominant start-stop technology in the long term, but lithium ion will dominate over the next five years: We think that ultra-capacitors will prove to be the dominant technology for start-stop systems due to their very high power density (1.5kW/kg) and long life potential (the result of their very low degradation rate). All batteries suffer during constant cycling (discharging and recharging cycles), which degrades the electrolyte separating the membrane and the electrodes. This means that both ICVs and EVs have to have over-sized batteries to overcome limitations related to charging/discharging. Because there is no electrode dissolution in ultra-capacitors, they have a very long life (15 years or more) and are ideal for applications such as start-stop, which requires release or storage of sharp bursts of power. According to research carried out by the US-based Argonne National Laboratory, the use of ultra-capacitors in a hybrid EV can lead to a 15-30% improvement in fuel economy with the use of 50-100Wh ultra-capacitors.
The same is true for kinetic energy recovery systems (KERs), which recover the energy lost in braking. In our view, a combination of a battery and ultra-capacitor (in both ICVs and EVs) provide a highly efficient system and could significantly increase the life of a battery (by up to 2x). According to Argonne National Laboratory, such a combination reduces the issue of battery oversizing which adds to costs and weight.
The main factor holding back adoption of ultra-capacitors has been their high cost (above $100/kW). However, costs are reducing as production levels increase with higher adoption rates. Ultra-capacitors are already being used in start-stop systems in PSA Peugeot Citroen and the Mazda 6 which are being supplied by ultra-capacitor leader Maxwell (US) and Nippon Chemi-Con Corp. GM will be the first US OEM to use the super-capacitors manufactured by Maxwell in its new range of Cadillacs.
Ultra-capacitor versus batteries as energy sources in start-stop Start-stop system
Source: Maxwell Source: Bosch (https://www.bosch-automechanika.com/en/wp-
content/uploads/sites/3/2014/09/S_Start-Stopp-Kompetenz_en.pdf)
Mainstream battery technologies
Up to now, EVs have primarily relied on three battery chemistries: lead acid, NiMH and lithium ion. Each offers different energy and power densities and cycle life.
● Lead acid, NiMH and lithium ion are the three mainstream battery technologies for automotive purposes. Lithium ion is now the dominant one due to its higher energy density.
● There are a range of lithium ion cathode chemistries. We expect higher energy density NCA (relied on by Tesla) and NMC batteries to continue to dominate the BEV space. LFP and lithium manganese oxide LMO batteries have a greater application in EBs because they have lower space and weight limitations.
● The cylindrical cell format relied upon by Tesla is the most cost-effective and also offers higher energy density versus other cell formats. We think that Tesla’s use of cylindrical cells will continue to provide it with a competitive advantage over peers.

Berenberg Thematics
49
Energy density, power density and cycle life are the main battery requirements Energy density, power density and cycle life are the main battery requirements Energy density, power density and cycle life are the main battery requirements Energy density, power density and cycle life are the main battery requirements for automotive purposes for automotive purposes for automotive purposes for automotive purposes
High energy density is an important requirement for automotive applications as it determines the range as well as weight of the vehicle. Range anxiety is one of the main drawbacks of EVs as their average 100-mile range puts them at a disadvantage to ICVs with their 300-mile range.
Power density is also important as it determines a car’s acceleration capability. EVs are more efficient at converting chemical energy into kinetic energy. This means that EVs’ acceleration is on average better than that offered by a comparable ICV. Both energy and power density for automotive batteries have risen as we move from lead acid to NiMH and then to lithium ion batteries.
The third important battery requirement for EVs is cycle life. Considering that lithium ion battery packs can account for more than a quarter of EVs’ cost, they need to be durable. For EVs, cycle stability over at least 1,000 cycles is imperative.
Lithium ion has emerged as the dominant battery technology for EVs in the Lithium ion has emerged as the dominant battery technology for EVs in the Lithium ion has emerged as the dominant battery technology for EVs in the Lithium ion has emerged as the dominant battery technology for EVs in the quest for high range quest for high range quest for high range quest for high range
Currently, NiMH and lithium ion are the only two battery types being used in EVs. NiMH batteries are restricted to HEVs as energy density requirements are low for a hybrid. PHEVs and BEVs predominantly rely on lithium ion. PHEVs’ and BEVs’ higher level of hybridisation (ie their greater reliance on electricity for propulsion) means that they require a better battery with higher energy density which is able to provide the required range.
EVs’ acceleration and range rise as lead acid battery systems
make way for lithium ion The schematics of a battery pack
Source: CGGC Source: Axeon
Lithium ion Lithium ion Lithium ion Lithium ion –––– high high high high energy density NMC and NCA technologies will dominate the energy density NMC and NCA technologies will dominate the energy density NMC and NCA technologies will dominate the energy density NMC and NCA technologies will dominate the EV storage spaceEV storage spaceEV storage spaceEV storage space
We believe NCA and NMC cathode-based lithium ion batteries will dominate the EV space due to their higher energy density versus LFP batteries and their better thermal stability versus LCO batteries. While NMC-based cathode materials are currently being used by most EV manufacturers, Tesla is using higher energy density NCA-based materials.

Berenberg Thematics
50
The range of lithium ion battery systems
Source: Berenberg
Comparison of different Comparison of different Comparison of different Comparison of different lithium ion cell types lithium ion cell types lithium ion cell types lithium ion cell types –––– the cylindrical format is the most the cylindrical format is the most the cylindrical format is the most the cylindrical format is the most costcostcostcost----effectiveeffectiveeffectiveeffective
The lithium ion cells used in EVs come in three formats/shapes: prismatic (rectangular), cylindrical and pouch (polymer-shaped). The shape of the cell has a bearing on how much active material can fit into one cell. This affects the energy density of the cell. Prismatic and pouch configurations produce a higher quantum of active materials per cell and have a higher energy density than cells with a cylindrical configuration.
Cylindrical configurations are significantly cheaper than prismatic and pouch configurations, however. This is because they are produced in far greater volumes by a multitude of manufacturers for common primary as well as secondary cells for electronics applications. The greater economies of scale mean that cylindrical configurations can be $100/kWh lower in cost versus prismatic and pouch configurations.
It is because of the lower cost that Tesla/Panasonic are relying on the cylindrical configuration for the lithium ion cells used in Tesla’s cars. All other car manufacturers have adopted either the pouch or prismatic configuration.
Cathode Cathode Cathode Cathode
materialmaterialmaterialmaterialLCOLCOLCOLCO LMOLMOLMOLMO NMCNMCNMCNMC NCANCANCANCA LFPLFPLFPLFP
Lithium Cobalt OxideLithium Cobalt OxideLithium Cobalt OxideLithium Cobalt OxideLithium Manganese Lithium Manganese Lithium Manganese Lithium Manganese
OxideOxideOxideOxide
Lithium Nickel Lithium Nickel Lithium Nickel Lithium Nickel
Manganese Cobalt Manganese Cobalt Manganese Cobalt Manganese Cobalt
OxideOxideOxideOxide
Lithium Nickel Cobalt Lithium Nickel Cobalt Lithium Nickel Cobalt Lithium Nickel Cobalt
Aluminium OxideAluminium OxideAluminium OxideAluminium Oxide
Lithium Iron Lithium Iron Lithium Iron Lithium Iron
PhosphatePhosphatePhosphatePhosphate
Energy Energy Energy Energy
densitydensitydensitydensity
High energy
density
Very high energy
density
Very high energy
density
Very high energy
density
Low energy
density
Power Power Power Power
densitydensitydensitydensityLow power density
Very high power
densityHigh power density High power density
Very high power
density
Thermal Thermal Thermal Thermal
stability/safstability/safstability/safstability/saf
Poor thermal
stability
Poor thermal
stability
Better thermal
stability
Better thermal
stability
Good thermal
stability
CostCostCostCost Very high cost Low cost High cost High cost Low cost
Cycle LifeCycle LifeCycle LifeCycle Life The most stable Low cycle life The most stableSlightly lower
versus NMCBest
EV usageEV usageEV usageEV usage Tesla roadster
Leaf, Volt, IMiEV,
Fiat 500, Renault
Zoe
Daimler Smart,
Mitsubishi i-MEV,
Daimler Smart,
Tesla S, plug-in
PriusFisker EV
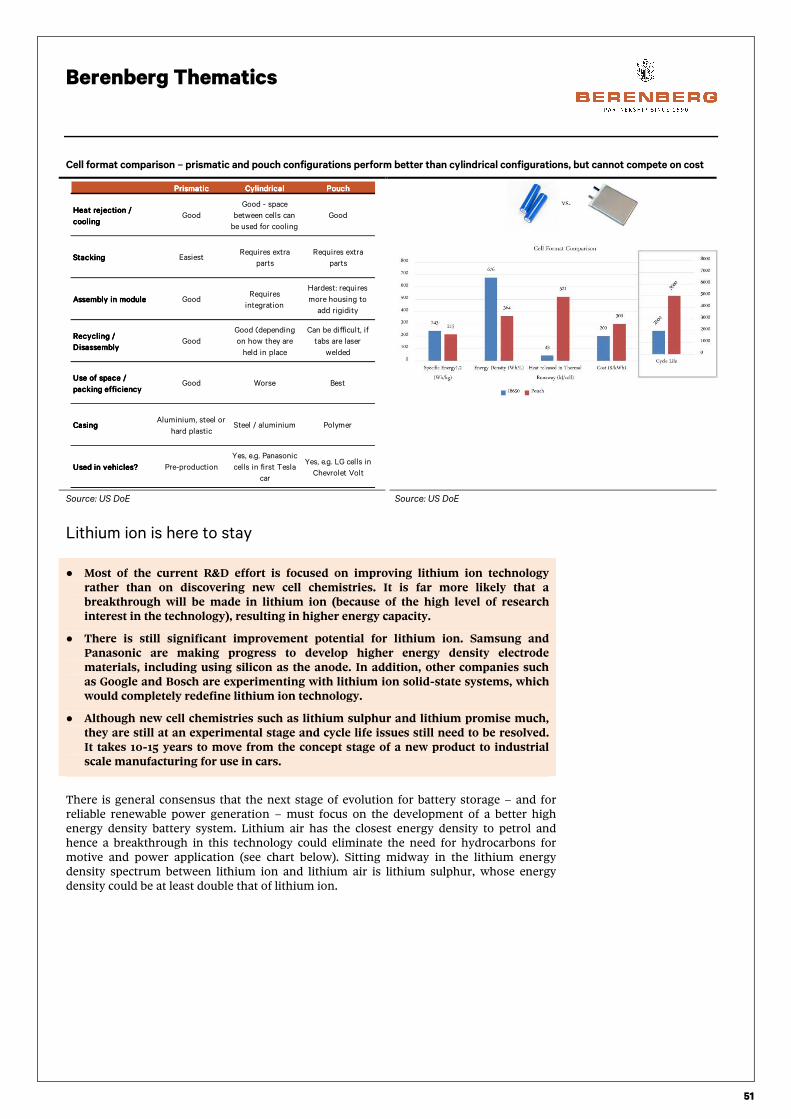
Berenberg Thematics
51
Cell format comparison – prismatic and pouch configurations perform better than cylindrical configurations, but cannot compete on cost
Source: US DoE Source: US DoE
Lithium ion is here to stay
● Most of the current R&D effort is focused on improving lithium ion technology rather than on discovering new cell chemistries. It is far more likely that a breakthrough will be made in lithium ion (because of the high level of research interest in the technology), resulting in higher energy capacity.
● There is still significant improvement potential for lithium ion. Samsung and Panasonic are making progress to develop higher energy density electrode materials, including using silicon as the anode. In addition, other companies such as Google and Bosch are experimenting with lithium ion solid-state systems, which would completely redefine lithium ion technology.
● Although new cell chemistries such as lithium sulphur and lithium promise much, they are still at an experimental stage and cycle life issues still need to be resolved. It takes 10-15 years to move from the concept stage of a new product to industrial scale manufacturing for use in cars.
There is general consensus that the next stage of evolution for battery storage – and for reliable renewable power generati0n – must focus on the development of a better high energy density battery system. Lithium air has the closest energy density to petrol and hence a breakthrough in this technology could eliminate the need for hydrocarbons for motive and power application (see chart below). Sitting midway in the lithium energy density spectrum between lithium ion and lithium air is lithium sulphur, whose energy density could be at least double that of lithium ion.
PrismaticPrismaticPrismaticPrismatic CylindricalCylindricalCylindricalCylindrical PouchPouchPouchPouch
Heat rejection / Heat rejection / Heat rejection / Heat rejection /
coolingcoolingcoolingcoolingGood
Good - space
between cells can
be used for cooling
Good
StackingStackingStackingStacking EasiestRequires extra
parts
Requires extra
parts
Assembly in moduleAssembly in moduleAssembly in moduleAssembly in module GoodRequires
integration
Hardest: requires
more housing to
add rigidity
Recycling / Recycling / Recycling / Recycling /
DisassemblyDisassemblyDisassemblyDisassemblyGood
Good (depending
on how they are
held in place
Can be difficult, if
tabs are laser
welded
Use of space / Use of space / Use of space / Use of space /
packing efficiencypacking efficiencypacking efficiencypacking efficiencyGood Worse Best
CasingCasingCasingCasingAluminium, steel or
hard plasticSteel / aluminium Polymer
Used in vehicles?Used in vehicles?Used in vehicles?Used in vehicles? Pre-production
Yes, e.g. Panasonic
cells in first Tesla
car
Yes, e.g. LG cells in
Chevrolet Volt

Berenberg Thematics
52
Lithium sulphur and lithium air are the too new chemistries which hold the most
promise and offer many times the energy density of mainstream technologies
Source: Report “From Lithium to Sodium: cell chemistry of room temperature sodium air and sodium sulphur batteries” by Philipp Adelhelm, Pascal Hartmann, Conrad L. Bender, Martin Busche, Christine Eufinger and Juergen Janek
While we appreciate the revolutionary impact that a breakthrough in higher energy density would have on cell chemistry, we do not think that such a breakthrough is imminent.
Reason #1 Reason #1 Reason #1 Reason #1 –––– research focus is mainly on lithium ionresearch focus is mainly on lithium ionresearch focus is mainly on lithium ionresearch focus is mainly on lithium ion
All the new non-lithium cell chemistries suffer from technical challenges related to cycle life and cost. We think that despite the interest in new cell chemistries, R&D efforts are still focused on lithium ion and its variants. According to a survey carried out by market researcher Frost & Sullivan, only 40% of the key players in the battery industry are currently carrying out research into new cell chemistries. More than 80% of battery manufacturers are concentrating their efforts on lithium ion batteries.
Most companies are focusing their R&D efforts on improving lithium ion batteries rather than in
developing new cell chemistries
Source: Frost & Sullivan
Reason #2 Reason #2 Reason #2 Reason #2 –––– lithium ion has significant potential for improvementlithium ion has significant potential for improvementlithium ion has significant potential for improvementlithium ion has significant potential for improvement
Much scope remains in improving the performance, energy capacity and rate of charging of lithium ion batteries. The researchers are exploring new electrode materials which can help achieve these aims. Silicon is one of the elements that could become a viable alternative to graphite as the anode material. The scale of improvement could be significant as a silicon anode can store about 10 times more (per unit volume) lithium ions than a graphite anode. While an all-silicon anode still presents technical difficulties as it has only a short cycle life,

Berenberg Thematics
53
silicon can still be used to dope the graphite material in the anode in order to raise its energy density. Lithium ion battery manufacturer Samsung SDI is currently developing a graphene-covered silicon anode which could help solve these cycle issues. According to Samsung SDI, these batteries have nearly double the energy density of conventional lithium ion batteries.
In addition, a number of companies are working to completely redesign lithium ion cells and produce solid-state systems where the electrolyte is solid:
● 24M is developing a semi-solid lithium ion battery solution;
● Bosch (which recently acquired Seeyo) and partner Ionic Material are working on solid-state lithium ion batteries featuring a polymer electrolyte;
● STMicroelectronics, Front Edge Technology (FET) and Google have joined forces to develop a thin-film solid-state battery.
Solid-state battery structure versus conventional lithium ion Solid-state lithium ion offers higher energy density versus
conventional lithium ion
Source: Google presentation Source: Google presentation
Reason #3 Reason #3 Reason #3 Reason #3 –––– new chemistries are still in the very early stage of developmentnew chemistries are still in the very early stage of developmentnew chemistries are still in the very early stage of developmentnew chemistries are still in the very early stage of development
It takes 10-15 years for a new cell chemistry to move through the various stages of development: finalising the cell chemistry by resolving all of the technical issues; refining the structure of the cell so that it meets all the automotive requirements; working out the optimal battery management systems and power electronics to integrate the new cells into battery packs; and, finally, scaling up to an industrial level of production in order to become cost-competitive.
R&D effort is still being expended on resolving the new cell chemistries’ numerous limitations so they are able to meet the required cycle life and energy density for automotive purposes. To achieve both high energy density and high cycle level is difficult, however, and improvement in one area is usually at the expense of the other.
New chemistries take 10-15 years to develop Future battery systems still at the proof of concept stage
Source: US DoE Source: US DoE
Development time of chemistries from proof of concept to commercial cellDevelopment time of chemistries from proof of concept to commercial cellDevelopment time of chemistries from proof of concept to commercial cellDevelopment time of chemistries from proof of concept to commercial cell
ChemistryChemistryChemistryChemistry First paper / patentFirst paper / patentFirst paper / patentFirst paper / patentFirst commercial First commercial First commercial First commercial
rechargeable cellrechargeable cellrechargeable cellrechargeable cell
First use in series car First use in series car First use in series car First use in series car
(small series)(small series)(small series)(small series)
Lithium LCO 1979 1991 2008 (Tesla)
Lithium LMO 1983 1996 2009 (iMieV)
Lithium LFP 1994 2006 2007 (MODEC van)
Ni-MH 1967 1990 1997 (Prius)
Battery TypeBattery TypeBattery TypeBattery TypeVoltage Voltage Voltage Voltage
(V)(V)(V)(V)
Theoretical Theoretical Theoretical Theoretical
capacity (mAh/g)capacity (mAh/g)capacity (mAh/g)capacity (mAh/g)
Theoretical specific Theoretical specific Theoretical specific Theoretical specific
energy (Wh/kg)energy (Wh/kg)energy (Wh/kg)energy (Wh/kg)
Conventional
lithium-ion3.8 155 387
Li-S 2.2 1672 2567
Li-air (non-
aqueous)3 3862 11248
Al-air 2.7 2980 8100
Zn-air 1.65 820 1086

Berenberg Thematics
54
Lithium sulphur suffers from poor cycle life: The use of sulphur as the anode material in lithium sulphur batteries could lead to a tenfold improvement in the energy density of a conventional lithium ion. Sulphur has further advantages: it is abundant, cheap and also non-toxic (unlike the graphite used in lithium ion cells).
A number of players such as chemicals manufacturer BASF and Oxis Energy, PoyPlus and Sion Power are developing lithium sulphur batteries. None of them have yet resolved a life cycle issue with the lithium sulphur cells where the anode material permanently degrades at a very fast rate. Until now, efforts to improve cycle life have led to compromises on energy density. The use of graphene in conjunction with a sulphur anode could resolve some of these issues in the future.
While lithium sulphur offers significant advantages over lithium ion, it has a poor cycle life which
significantly limits its adoption in the automotive sector
Source: Oxis Energy
Lithium air is still at an early stage of development: Lithium air batteries could be the next significant evolutionary step for battery storage. It is formed by combining a pure lithium anode with air/oxygen acting as the anode. This cell combination has very high theoretical energy capacity which is close to that of petrol and could help give EVs the same range as ICVs. However, lithium air is still very much at the experimental stage.
Regulatory incentives – a key growth driver for energy storage in autos
Incentives on both the supply and demand side for EVs vary greatly by country, and also within states and cities in countries such as the US, Canada and China. For the consumer, these incentives typically include fiscal subsidies (ie no VAT on purchase) and a one-time purchase grant. The total effect of such subsidies makes EVs more comparable in cost to ICVs in some markets. Other perks include exception from tolls, such as the congestion charge in London or charges on toll roads, parking permits in some cities, and access to car-pool or bus lanes.
National purchasing subsidies in 2014, EVs compared to IVCs (EUR)
Source: McKinsey. Recurring benefit assumes a five-year holding period in comparison to equivalent ICE vehicles
Advantages of Li-S in Electric VehiclesAdvantages of Li-S in Electric VehiclesAdvantages of Li-S in Electric VehiclesAdvantages of Li-S in Electric Vehicles
Using Full Toyota RAV4 EV Pack Volume
NiMHNiMHNiMHNiMH
(27kWh)(27kWh)(27kWh)(27kWh)
Li-IonLi-IonLi-IonLi-Ion
(30kWh)(30kWh)(30kWh)(30kWh)
Li-LsLi-LsLi-LsLi-Ls
(54kWh)(54kWh)(54kWh)(54kWh)
Li-LsLi-LsLi-LsLi-Ls
(70kWh)(70kWh)(70kWh)(70kWh)
Driving Range 81 94 170 226
Total Module Weight (lbs) 995 600 475 426
Total Module Volume (cu ft)Total Module Volume (cu ft)Total Module Volume (cu ft)Total Module Volume (cu ft) 6.76.76.76.7 6.76.76.76.7 6.76.76.76.7 6.76.76.76.7
Max Vehicle Payload (lbs) 766 766 1286 1335
15395 15260
7221 6500 6022 5976 5512
2625 3000
519
1515390
325
2740810
495150
1691015650
75466500 6022 5976 5512 5365
3810
1014150
0
2000
4000
6000
8000
10000
12000
14000
16000
18000
One-time benefit Annual Benefit

Berenberg Thematics
55
In Norway, the country with the highest EV penetration, the government offers some of the biggest incentives of any government, worth almost €17,000 per car. The majority of these savings arise from tax incentives, free electricity, free public charging stations, reduced company car tax and toll road exemptions. In May 2015, once EV sales had hit 50,000, the government said it would review tax breaks and incentives, many of which will be phased out from 2017.
In the UK, current subsidies are set to be reviewed when 50,000 EVs have been sold; for now, the incentives include a grant of up to £5,000, and exemption from road tax and the congestion charge.
In China, the government has invested over RMB37bn to accelerate EV uptake, with cRMB15bn offered in purchase subsidies, and RMB3bn in tax reductions/exemptions. China awards EV purchase subsidies only for locally-produced models in order to build up its domestic EV production market, and c150 different models currently qualify as EVs. However, local subsidies differ in some cities: Beijing and Shanghai, for example, have their own shortlist of EV models, creating an advantage for local manufacturers over both imported vehicles excluded from national subsidies as well as other domestic producers not on the local shortlists. Unlike other countries that either impose a zero (or an extremely reduced) import tariff on EVs, China still imposes a 25% tariff on both foreign EVs and ICVs. As a result, uptake of foreign EVs is low; the Chinese government’s aim, however, is promote a domestic value chain.
The US government offers various tax credits worth between $2,500 and $7,500 depending on vehicle size and battery capacity; there are also various local state incentives. The credits will be phased out for each manufacturer once a manufacturer has sold a minimum of 200,000 qualifying vehicles in the US; however, at current-run rates, that should not occur for the most popular model, the Nissan Leaf, until 2019.
Other than the fiscal benefits on purchase and exemption from annual taxes, other incentives vary from country to country. These include access to bus lanes, free charging points and freedom from toll fees. In some busy Chinese cities, the number of cars is restricted by limiting the amount of number plates available. Drivers are then further restricted to driving at peak hours on alternate days only. This is to reduce congestion and pollution at peak times; EVs, however, are exempt from these restrictions.
Incentives have clearly been key to inducing demand among consumers; however, the timeframe for the duration of schemes is unclear. Many governments state that incentives will be available until a certain year, or when a pre-determined level of sales has been reached. With the recent acceleration of EV penetration, the sales targets are fast approaching, and it is unclear what governments’ future policy will be. The cost of subsidies and lost taxes has been significant, but without these initiatives, EV prices will remain uncompetitive compared to ICV prices, and uptake will suffer.
Many Western nations, however, have committed to reduce their greenhouse gas emissions by significant levels, and it will be difficult for them to achieve this without continuing to reduce the effects of ICVs. Currently, transportation accounts for c22% of global greenhouse gas emissions, roughly the same amount that many of the G20 nations are aiming to reduce their emissions by over the next decade. If governments are to meet these targets, it seems likely that they will have to continue to invest in EV subsidies to reduce greenhouse gas emissions, until the cost differential between EVs and ICVs is much narrower.
Emissions regulation motivates supplyEmissions regulation motivates supplyEmissions regulation motivates supplyEmissions regulation motivates supply----side developmentside developmentside developmentside development
On the supply side, OEMs are forced to reduce their CO2 emissions from cars or face penalties, but in some countries, they can benefit from R&D tax credits. Their main incentive to develop EVs, though, comes from rising consumer demand and a rapidly expanding EV market. We believe that demand for EVs will soon overtake that for ICVs, as fossil fuels become more obsolete and improvements in technology and economies of scale make EVs less expensive.
CO2 regulations in a number of countries limit the average fleet emissions of OEMs. Car manufacturers have to reduce the average emissions across all their vehicle range or pay a tax penalty; any vehicle emitting over the threshold needs to be offset by more low-emission cars. In the EU, for example, 2015 target for CO2 emissions is 135g/km, which all manufacturers had met by 2013. By 2020, the target will be 95g CO2/km, with

Berenberg Thematics
56
manufacturers facing a tax of up to €95 per car per g CO2/km above this level. Car manufactures will thus have to reduce emissions by 28% on average from 2012 levels.
CO2 emissions targets 2000-25: restrictions on CO2 emissions will force car manufacturers to
increase uptake in EVs, in our view
Source: International Council on Clean Transportation
In the US, the Corporate Average Fuel Economy (CAFE) regulation states that the average fuel consumption for a manufacturer’s fleet must reach a normalised level equivalent to 93g CO2/km or less by 2025, or again the manufacturer will have to pay a penalty. The CAFE regulations further stipulate that passenger cars must attain a minimum fuel economy of 54.5mpg or pay a $5.50 fine per vehicle for every 0.1mpg below this. This size of this fine, however, has risen by less than the rate of inflation since CAFE regulations were first introduced in 1975, and hence the penalty is relatively small compared to the value of the more expensive cars, reducing its effectiveness. A number of manufacturers have simply chosen to pay the CAFE penalties rather than attempt to comply with the regulations, especially in the case of high-end models.
Most OEMs already reached the 2015 target of 135g CO2/km by 2013, but need to decrease emissions on average by 28% to reach 2020
targets
Source: The European Commission
95101 101 103
94 93 97 94 95 94 93 93 93 9488
132
148141 139
144137 134
129134 132 129
121 122 122 120
-28%
-32%-28% -26% -35%
-32% -28%-27%
-29% -29% -28%-23% -24% -23% -27%
0
20
40
60
80
100
120
140
160
Average 2012 EU-Target 2020

Berenberg Thematics
57
Charging infrastructure
Infrastructure development still in its infancy, but growingInfrastructure development still in its infancy, but growingInfrastructure development still in its infancy, but growingInfrastructure development still in its infancy, but growing
The development of a comprehensive battery-charging infrastructure will be essential if consumers are to switch to driving EVs, given that EVs’ range and charging time are key concerns for users. Refuelling an ICV a petrol station takes only a few minutes, yet even the fastest EV re-charge cycle takes 20-30 minutes, and slow charging at home usually takes several hours. EVs will continue to have limited long-distance travel capability until more infrastructure is developed – the Nissan Leaf has a nominal range of 200km, for example – and so EVs are restricted to short trips, such as the commute to and from work, and are not yet suitable for long-distance inter-city travel.
Battery-charging infrastructure is fast developing, however, with several charging methods becoming more readily available, with varying degrees of success. The easiest and most common form of battery-charging is wired charging. This comes in the form of either a conventional AC charge via a plug, or fast-charging DC power. The power level of the charging station (in kW), the current used, the plug and the type of battery all determine how quickly a battery can be charged. Battery-swapping has been trialled on a small scale in a number of countries (ie the US, Israel): in this process, depleted batteries are swapped for fully-charged batteries, allowing for a full recharge within five minutes, comparable to petrol/diesel refill times. Another method – induction charging, where a battery is charged wirelessly from an electromagnetic field generated under the car – is also being trialled, but is not yet commercially available.
Charging speed depends on the power output (in kW) of the charger: There are three different levels of charging currently available: level one – 120V single-phase AC; level two – 240V three-phase AC; and level three – 200-600V DC. Level one charging can be carried out by drivers at home; levels two and three are most common at public charging points. Level three DC chargers have the highest voltage and power and hence charge at the fastest rate. In contrast, power levels vary from as low as 1.92kW for a level one charger, which would take an EV anywhere from 6-24 hours, depending on the size of the battery. Tesla’s DC Superchargers have power output of 120kW, which will be able to re-charge batteries c35x more quickly than level two chargers.
Level one chargers are primarily for use at home or at the office, where the car is parked for an
extended period of time; level two/three chargers are primarily used for public charging facilities
Source: US Electric Vehicle Transportation Center
On average, level one charging provides five miles-worth of energy per hour of charging, level two 10-20 miles per hour of charging and DC fast-charging 170 miles per hour of charging.
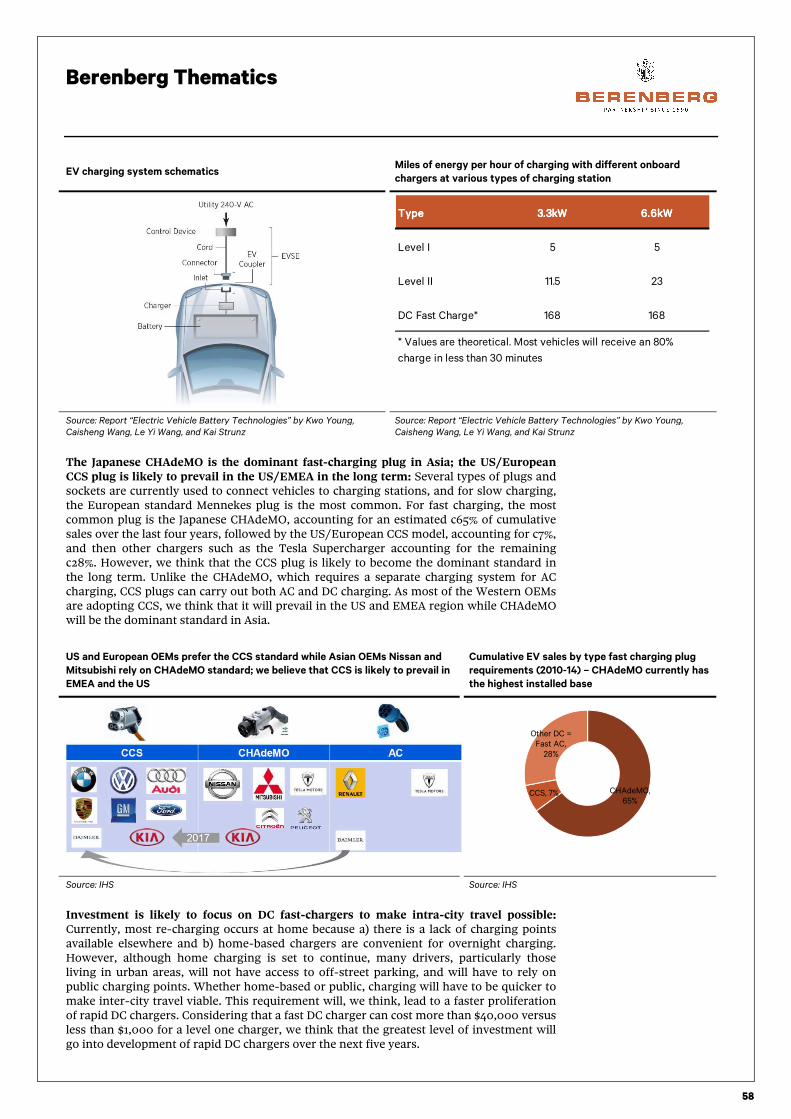
Berenberg Thematics
58
EV charging system schematics Miles of energy per hour of charging with different onboard
chargers at various types of charging station
Source: Report “Electric Vehicle Battery Technologies” by Kwo Young, Caisheng Wang, Le Yi Wang, and Kai Strunz
Source: Report “Electric Vehicle Battery Technologies” by Kwo Young, Caisheng Wang, Le Yi Wang, and Kai Strunz
The Japanese CHAdeMO is the dominant fast-charging plug in Asia; the US/European CCS plug is likely to prevail in the US/EMEA in the long term: Several types of plugs and sockets are currently used to connect vehicles to charging stations, and for slow charging, the European standard Mennekes plug is the most common. For fast charging, the most common plug is the Japanese CHAdeMO, accounting for an estimated c65% of cumulative sales over the last four years, followed by the US/European CCS model, accounting for c7%, and then other chargers such as the Tesla Supercharger accounting for the remaining c28%. However, we think that the CCS plug is likely to become the dominant standard in the long term. Unlike the CHAdeMO, which requires a separate charging system for AC charging, CCS plugs can carry out both AC and DC charging. As most of the Western OEMs are adopting CCS, we think that it will prevail in the US and EMEA region while CHAdeMO will be the dominant standard in Asia.
US and European OEMs prefer the CCS standard while Asian OEMs Nissan and
Mitsubishi rely on CHAdeMO standard; we believe that CCS is likely to prevail in
EMEA and the US
Cumulative EV sales by type fast charging plug
requirements (2010-14) – CHAdeMO currently has
the highest installed base
Source: IHS Source: IHS
Investment is likely to focus on DC fast-chargers to make intra-city travel possible: Currently, most re-charging occurs at home because a) there is a lack of charging points available elsewhere and b) home-based chargers are convenient for overnight charging. However, although home charging is set to continue, many drivers, particularly those living in urban areas, will not have access to off-street parking, and will have to rely on public charging points. Whether home-based or public, charging will have to be quicker to make inter-city travel viable. This requirement will, we think, lead to a faster proliferation of rapid DC chargers. Considering that a fast DC charger can cost more than $40,000 versus less than $1,000 for a level one charger, we think that the greatest level of investment will go into development of rapid DC chargers over the next five years.
TypeTypeTypeType 3.3kW3.3kW3.3kW3.3kW 6.6kW6.6kW6.6kW6.6kW
Level I 5 5
Level II 11.5 23
DC Fast Charge* 168 168
* Values are theoretical. Most vehicles will receive an 80%
charge in less than 30 minutes
CHAdeMO, 65%
CCS, 7%
Other DC = Fast AC, 28%

Berenberg Thematics
59
There are currently more level one (standard) and level two
(accelerated) chargers available than level three (rapid)
Source: US DoE, Berenberg
Charging station rollCharging station rollCharging station rollCharging station roll----out plans out plans out plans out plans –––– China, Europe and USChina, Europe and USChina, Europe and USChina, Europe and US
China’s 13th five-year plan aims to improve patchy charging infrastructure: Targets for
EV penetration and charging infrastructure in China are set at the national government level. Two state-owned grid companies, State Grid Corporation and China Southern Power Grid Company, are responsible for rolling out most of the public charging network based on national targets and with the help of state- and city-level administrations. Based on this national strategy, China has invested more than $1.65bn in rolling out charging infrastructure out of total EV investment of more than $5.6bn. Despite this investment, China’s EV charging network still lags the targets set by the government for 2015 and 2020, and major Chinese cities such as Shanghai and Beijing still have a smaller EV charging network compared with Western cities such as London and Oslo. Its poor charging infrastructure explains why EV adoption in China is way behind both near- and medium-term targets. The government’s goal is to have 5m (including 0.2m electric buses and 0.3m electric taxis) by 2020.
China has invested more than RMB11bn out of total EV
investment of RMB37bn
Despite the investment, Chinese charging infrastructure has
lagged behind London and Oslo
Source: McKinsey, “Supercharging the Development of Electric Vehicles in China”, published in April 2015
Source: McKinsey, “Supercharging the Development of Electric Vehicles in China”, published in April 2015
China’s latest five-year plan, released in October 2015, aims to resolve this weakness in EV charging infrastructure. The government has an ambitious target to build 4.8m charging poles in 2015-2020 to service the 5m EVs it aims to have on the roads by 2020. 2.8m charging points will be established in residential areas and 1.5m in commercial locations such as office car parks and industrial parks. It further plans to build one public charging station for every 2,000 EVs, translating into 12,000 stations in total – 3,850 for public buses, 2,500 for taxis, 2,450 for special vehicles and 2,400 for public usage.
As well as speeding up charging point installation, China has also reportedly invested RMB10bn in China Tower Company to develop EV stations. China Tower Company already owns the infrastructure assets of China’s three biggest telecommunications companies and
Standard Accelerated Rapid
CanadaCanadaCanadaCanada 11% 82% 8%
DenmarkDenmarkDenmarkDenmark 5% 74% 20%
FranceFranceFranceFrance 83% 14% 3%
GermanyGermanyGermanyGermany 43% 52% 5%
ItalyItalyItalyItaly 55% 31% 14%
NetherlandsNetherlandsNetherlandsNetherlands 42% 53% 5%
NorwayNorwayNorwayNorway 86% 5% 9%
PortugalPortugalPortugalPortugal 95% 3% 2%
SpainSpainSpainSpain 85% 8% 7%
SwedenSwedenSwedenSweden 71% 13% 16%
UKUKUKUK 51% 31% 18%
Source:
Number of electric stations by typeNumber of electric stations by typeNumber of electric stations by typeNumber of electric stations by type
Charging infrastructur
e, 11
Other investment in EV
ecosystem, 26
00.20.40.60.811.21.41.61.8
Charging pole per km2 charging pole per thousand
people
Beijing Shanghai Berlin London Oslo

Berenberg Thematics
60
this investment will enable it to leverage on this extensive telecoms tower network by setting up EV charging stations.
While EV sales in China picked up sharply in 2015, total EV
penetration lags the national targets for 2015 and 2020
China is now focused on developing the charging infrastructure
required to support its 2020 target
Source: Chinese Association of Automobile Manufacturers (CAAM)
Source: Source: China’s 13th five-year plan; McKinsey, “Supercharging the Development of Electric Vehicles in China”, published in April 2015
US: At the national level, the charging station roll-out is being driven by the US Department of Energy (DoE), which has since 2009 invested close to $400m in its transport electrification project, which is part of its “Clean Cities” programme aimed at reducing petroleum usage in the transportation sector. The US DoE has used the funding to provide grants to finance partnerships with private electricity charging providers (such as Chargepoint and Ecotality) and with cities to roll out charging infrastructure.
In addition, as part of its Clean Cities initiative, the DoE launched the “Workplace Charging Challenge” in 2013. Its aim here is to encourage 500 US employers to install charging infrastructure at the workplace by 2018. More than 250 employers have joined the programme so far and have between them installed 5,500 charging points at more than 600 workplaces, providing more than 1m employees with access to chargers. While most of the financing for the workplace charging infrastructure has come from employers, the greatest participation has been in those cities which benefit from some level of state level funding.
More than 600 workplaces in the US have charging facilities,
which is equivalent to 5,500 charging points servicing c1m
employees
Funding breakdown for installation of workplace charging
stations in the US, June 2014-June 2015
Source: US DOE Source: US DOE
The chart overleaf summarises the state level funding available across the US and the scale of public charging infrastructure in different cities. California is leading the development of charging infrastructure through numerous funding programmes at state and city level.
Europe is leading the EV charging station roll-out: Norway, the Netherlands and the UK have the most developed EV charging network in Europe. EV infrastructure development in the UK is being carried out under its “Plugged-in-Places” programme which has
330
5715
45
114
020406080100120140160180
2013 2014 2015 (till Oct)
Thousands vehicles
Thousands vehicles
Thousands vehicles
Thousands vehicles
PHEVs BEVs
2020 2020 2020 2020
targettargettargettarget
5mn5mn5mn5mn
12000120001200012000
4.8mn4.8mn4.8mn4.8mn
0 0.1 0.2 0.3 0.4 0.5 0.6
EV (BEV &PHEVS) Salesin mn units
End 2014End 2014End 2014End 2014EndEndEndEnd 2015201520152015targettargettargettarget
0 500 1000 1500 2000 2500
Charging stationsin units End 2014End 2014End 2014End 2014
EndEndEndEnd 2015201520152015targettargettargettarget
0 0.1 0.2 0.3 0.4 0.5
Charging polesin mn units
EndEndEndEnd----14141414EndEndEndEnd----15151515targettargettargettarget
0
100
200
300
400
500
600
700
2007 2008 2009 2010 2011 2012 2013 2014 2015
Workplaces with charging stations in the US
Employer, 88%
Grants, 9%
Tax incentives, 2%
Utility incentives,
1%

Berenberg Thematics
61
available funding of £30m. Municipalities and private companies can bid for these funds to build EV stations and charging points. The UK government has a target to install 13,500 residential and 1,500 on-street points by 2015. It aims to have 8,500 on-street charging points installed. The UK has already exceeded its near-term targets with the number of on-street charging points currently amounting to nearly 4,000. In terms of residential charging infrastructure, the UK government will also finance 75% of the cost of each new charging point (to a maximum of £7,000).

Berenberg Thematics
62
EV charging network across the US, and state level incentives and initiatives for charging infrastructure roll-out
Source: US DoE
AreaAreaAreaArea StateStateStateState
State Home State Home State Home State Home
Charger Charger Charger Charger
Incentive, Incentive, Incentive, Incentive,
Support Support Support Support
State Public State Public State Public State Public
Charging Charging Charging Charging
City EV City EV City EV City EV
supply supply supply supply
equipment equipment equipment equipment
financingfinancingfinancingfinancing
City-owned City-owned City-owned City-owned
EV ChargersEV ChargersEV ChargersEV Chargers
EV-ready EV-ready EV-ready EV-ready
building building building building
codecodecodecode
Utility Utility Utility Utility
preferential preferential preferential preferential
rates EV rates EV rates EV rates EV
charging charging charging charging
Utility Home Utility Home Utility Home Utility Home
charger charger charger charger
supportsupportsupportsupport
Chargers Chargers Chargers Chargers
per capita per capita per capita per capita
(per million (per million (per million (per million
population)population)population)population)
Charger Charger Charger Charger
coverage coverage coverage coverage
(per 0.1mn (per 0.1mn (per 0.1mn (per 0.1mn
new new new new
vehicles)vehicles)vehicles)vehicles)
Charger Charger Charger Charger
Density Density Density Density
(per 100 (per 100 (per 100 (per 100
square square square square
mile)mile)mile)mile)
State level Public Charging Incentive DescriptionState level Public Charging Incentive DescriptionState level Public Charging Incentive DescriptionState level Public Charging Incentive Description
San Francisco X X X X X X 248 463 17
Los Angeles X X X X X X 122 173 32
San Diego X X X 159 276 19
Riverside X X X X 55 113 0
Washington Washington X 90 133 8
Portland Oregon X X X 264 560 7Business owners are eligible for a tax credit of 35% of eligible costs for EV infrastructure projects. The credit is available through
December 31, 2018.
Charlotte North Carolina X X X 75 128 5
Philadelphia Pennsylvania X X X 35 52 4
New York New York X X X 26 52 7
Atlanta Georgia X X 90 133 4Georgia Power offers a rebate to business/residential customers who install Level 2 cahrgers. Businesses are eligible for a $500 rebate
through December 31, 2015, residential customers are eligible for a $250 rebate.
Chicago Illnois X 60 81 7
Illinois Department of Commerce provides rebates which cover 50% of the cost of equipment and installation (including materials and
labor), up to $3,750 per networked single station; $3,000 per non-networked single station; $7,500 per networked dual station; $6,000 per
non-networked dual station; $15,000 per networked DC fast charge station; and $12,500 per non-networked DC station. The maximum
possible total rebate award is $50,000. Eligible applicants include government entities, private businesses and dindividual residents.
Boston Massachusetts X X 105 143 12
Denver Colorado X X 91 128 2
Seattle Washington X X X 209 434 7Puget Sound Energy (PSE) provides a $500 rebate to qualified customers for the purchase and installation of Level 2 charger.PSE
expects the rebate program to remain open until November 1, 2016, depending on available funds.
Houston Texas X 43 52 3
St. Louis Missouri X X 34 57 1
Baltimore Maryland X X 130 180 12
Dallas Texas X 74 94 5
Phoenix Arizona X X 122 178 2
San Antonio Texas X 80 103 3
Detroit Michigan 52 37 5
Tampa Florida X 59 91 5
Miami Florida 34 42 3
Minneapolls Minnesota X 69 111 3
Pittsburgh Pennsylvania 35 52 1
EV Charging Station Financing Program provides loans for chargers in California. The Program may provide up to 100% coverage to
lenders. On approval it will pay a premium into the lender's loan loss reserve account for up to 20% of the loan amount and contribute an
additional 10% for installations in multi-unit dwellings and disadvantaged communities.
Small businesses are eligible for a rebate of 50% of the loan loss reserve amount. Eligible borrowers must be small businesses with 1,000
or fewer employees and must maintain legal control of the EVSE for the entire loan period. The maximum loan amount is $500,000 per
qualified small business and can be insured for up to four years.
Southern California Edison (SCE) offers a discounted rate to customers for electricity used to charge PEVs. Two rate schedules are
available for PEV charging during on- and off-peak hours, the Residential Time-of-Use Plan and the Electric Vehicle Plan.
Pacific Gas & Electric (PG&E) offers discounted Residential Time-of-Use rates for electricity used for plug-in electric vehicle charging.
Discounted rates are also available for compressed or uncompressed natural gas used in natural gas vehicle (NGV) home fueling
appliances.
California
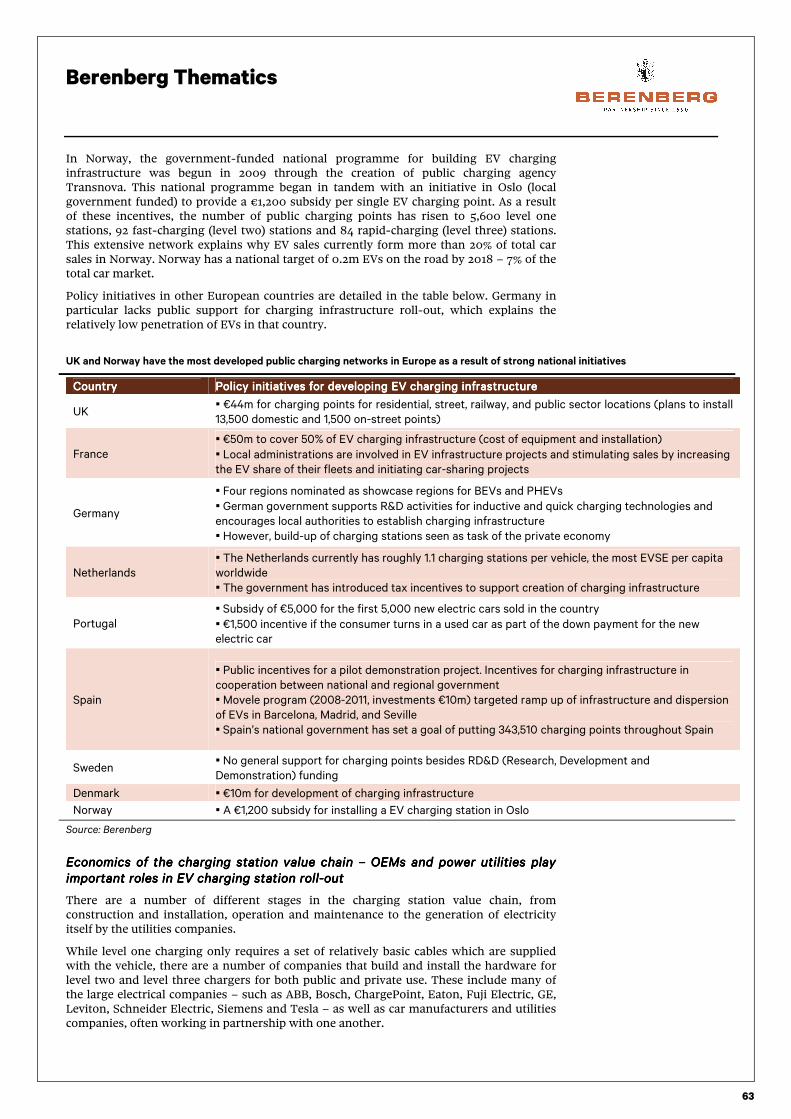
Berenberg Thematics
63
In Norway, the government-funded national programme for building EV charging infrastructure was begun in 2009 through the creation of public charging agency Transnova. This national programme began in tandem with an initiative in Oslo (local government funded) to provide a €1,200 subsidy per single EV charging point. As a result of these incentives, the number of public charging points has risen to 5,600 level one stations, 92 fast-charging (level two) stations and 84 rapid-charging (level three) stations. This extensive network explains why EV sales currently form more than 20% of total car sales in Norway. Norway has a national target of 0.2m EVs on the road by 2018 – 7% of the total car market.
Policy initiatives in other European countries are detailed in the table below. Germany in particular lacks public support for charging infrastructure roll-out, which explains the relatively low penetration of EVs in that country.
UK and Norway have the most developed public charging networks in Europe as a result of strong national initiatives
Country Country Country Country Policy initiatives for developing EV charging infrastructurePolicy initiatives for developing EV charging infrastructurePolicy initiatives for developing EV charging infrastructurePolicy initiatives for developing EV charging infrastructure
UK ▪ €44m for charging points for residential, street, railway, and public sector locations (plans to install 13,500 domestic and 1,500 on-street points)
France
▪ €50m to cover 50% of EV charging infrastructure (cost of equipment and installation) ▪ Local administrations are involved in EV infrastructure projects and stimulating sales by increasing the EV share of their fleets and initiating car-sharing projects
Germany
▪ Four regions nominated as showcase regions for BEVs and PHEVs ▪ German government supports R&D activities for inductive and quick charging technologies and encourages local authorities to establish charging infrastructure
▪ However, build-up of charging stations seen as task of the private economy
Netherlands
▪ The Netherlands currently has roughly 1.1 charging stations per vehicle, the most EVSE per capita worldwide
▪ The government has introduced tax incentives to support creation of charging infrastructure
Portugal
▪ Subsidy of €5,000 for the first 5,000 new electric cars sold in the country ▪ €1,500 incentive if the consumer turns in a used car as part of the down payment for the new electric car
Spain
▪ Public incentives for a pilot demonstration project. Incentives for charging infrastructure in cooperation between national and regional government
▪ Movele program (2008-2011, investments €10m) targeted ramp up of infrastructure and dispersion of EVs in Barcelona, Madrid, and Seville
▪ Spain’s national government has set a goal of putting 343,510 charging points throughout Spain
Sweden ▪ No general support for charging points besides RD&D (Research, Development and Demonstration) funding
Denmark ▪ €10m for development of charging infrastructure
Norway ▪ A €1,200 subsidy for installing a EV charging station in Oslo
Source: Berenberg
Economics of the charging station value chain Economics of the charging station value chain Economics of the charging station value chain Economics of the charging station value chain –––– OEMs and power utilities play OEMs and power utilities play OEMs and power utilities play OEMs and power utilities play important roles in EV charging station rollimportant roles in EV charging station rollimportant roles in EV charging station rollimportant roles in EV charging station roll----out out out out
There are a number of different stages in the charging station value chain, from construction and installation, operation and maintenance to the generation of electricity itself by the utilities companies.
While level one charging only requires a set of relatively basic cables which are supplied with the vehicle, there are a number of companies that build and install the hardware for level two and level three chargers for both public and private use. These include many of the large electrical companies – such as ABB, Bosch, ChargePoint, Eaton, Fuji Electric, GE, Leviton, Schneider Electric, Siemens and Tesla – as well as car manufacturers and utilities companies, often working in partnership with one another.
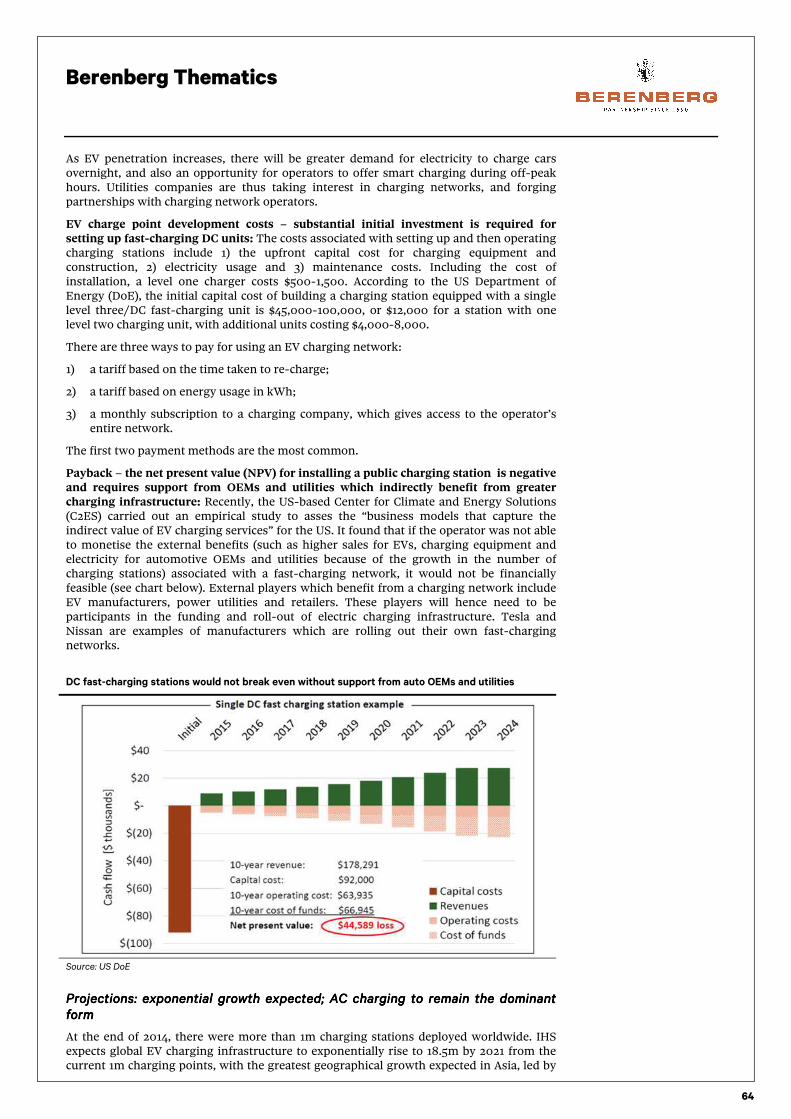
Berenberg Thematics
64
As EV penetration increases, there will be greater demand for electricity to charge cars overnight, and also an opportunity for operators to offer smart charging during off-peak hours. Utilities companies are thus taking interest in charging networks, and forging partnerships with charging network operators.
EV charge point development costs – substantial initial investment is required for setting up fast-charging DC units: The costs associated with setting up and then operating charging stations include 1) the upfront capital cost for charging equipment and constructi0n, 2) electricity usage and 3) maintenance costs. Including the cost of installation, a level one charger costs $500-1,500. According to the US Department of Energy (DoE), the initial capital cost of building a charging station equipped with a single level three/DC fast-charging unit is $45,000-100,000, or $12,000 for a station with one level two charging unit, with additional units costing $4,000-8,000.
There are three ways to pay for using an EV charging network:
1) a tariff based on the time taken to re-charge;
2) a tariff based on energy usage in kWh;
3) a monthly subscription to a charging company, which gives access to the operator’s entire network.
The first two payment methods are the most common.
Payback – the net present value (NPV) for installing a public charging station is negative and requires support from OEMs and utilities which indirectly benefit from greater charging infrastructure: Recently, the US-based Center for Climate and Energy Solutions (C2ES) carried out an empirical study to asses the “business models that capture the indirect value of EV charging services” for the US. It found that if the operator was not able to monetise the external benefits (such as higher sales for EVs, charging equipment and electricity for automotive OEMs and utilities because of the growth in the number of charging stations) associated with a fast-charging network, it would not be financially feasible (see chart below). External players which benefit from a charging network include EV manufacturers, power utilities and retailers. These players will hence need to be participants in the funding and roll-out of electric charging infrastructure. Tesla and Nissan are examples of manufacturers which are rolling out their own fast-charging networks.
DC fast-charging stations would not break even without support from auto OEMs and utilities
Source: US DoE
Projections: Projections: Projections: Projections: exponential growth expected; AC charging to remain the dominant exponential growth expected; AC charging to remain the dominant exponential growth expected; AC charging to remain the dominant exponential growth expected; AC charging to remain the dominant formformformform
At the end of 2014, there were more than 1m charging stations deployed worldwide. IHS expects global EV charging infrastructure to exponentially rise to 18.5m by 2021 from the current 1m charging points, with the greatest geographical growth expected in Asia, led by

Berenberg Thematics
65
China. Even based on a conservative assumption of EV penetration over the next five years, global charging infrastructure is likely to grow several times over.
The strongest growth in terms of charging types is expected to be in level one AC charging residential units, and we expect the main market for BEVs will be drivers who are able to install their own home-charging units. We expect that most of the off-street charging points installed by local municipalities in residential areas will also be level one chargers. However, with the increasing range of EVs and the emergence of national charging network expansion plans, we think that most investment will go into level three/rapid DC chargers, partly because these are more expensive than level one charging points, and partly to make inter-city travel possible. We believe that the share of DC chargers will increase to 5% of the total (from 1% currently) and that level two chargers will increase to 15% of the total (from the current ~8-9%). As public charging networks offering three-phase AC and DC charging points proliferate, we believe that the current 90% of total charging that is carried out at home will decline to 80% by 2020.
IHS expects level one and level two AC stations to remain dominant, because a) they cost less than other charger types and b) level one/two chargers do not require a significant upgrade of the grid. It also expects DC charging stations to rise from 1,600 units in 2014 to 22,400 units by 2021. With an average cost of $45,000-50,000 per DC charger, this will equate to total investment of at least $1bn over the period, IHS estimates.
IHS expects that the global charging network will grow to 18.5m
chargers by 2021, up from 1m units in 2014
HIS estimates that there will be 22,400 DC fast-charging units by
2021
Source: IHS Source: IHS
Hydrogen-based fuel cell EVs – the technology has potential over
the next 10 years but is unlikely to gain traction by 2020
How does the technology work? How does the technology work? How does the technology work? How does the technology work?
In hydrogen-powered FCEVs, electricity for propulsion is generated through a lightweight electrochemical system which uses hydrogen stored in an onboard storage tank. In the fuel cell, the hydrogen will first react with a catalyst made of platinum which strips out its electrons; the hydrogen ions then react with atmospheric oxygen to form water. A number of the fuel cells combine to form a cell stack which powers the vehicle. In contrast to other types of EV, an FCEV does not require a cooling system for the cell stack as the water produced removes the heat which is generated.
1.6
22.4
0
5
10
15
20
25
charging units in thousands
charging units in thousands
charging units in thousands
charging units in thousands
DC Charging Deployments Cumulative

Berenberg Thematics
66
Hydrogen fuel cell Advantages and disadvantages of hydrogen fuel cells
Source: Intelligent Energy, IEA
FCEV drive trains are similar to those of hybrid EV
Source: Intelligent Energy, Toyota
Pure hydrogen is required for an FCEV; currently, hydrogen is mainly sourced Pure hydrogen is required for an FCEV; currently, hydrogen is mainly sourced Pure hydrogen is required for an FCEV; currently, hydrogen is mainly sourced Pure hydrogen is required for an FCEV; currently, hydrogen is mainly sourced from natural gas for industrial uses from natural gas for industrial uses from natural gas for industrial uses from natural gas for industrial uses
Global hydrogen consumption is more than 7EJ (1 EJ =10^18 joules). Hydrogen is mainly used in the chemical and refining industry. It can either be produced from hydrocarbons (the primary source) or through electrolysis (a secondary source). Currently, only 4% of hydrogen is generated through electrolysis. Primary sources of hydrogen include natural gas and coal, and it can also be produced as a by-product of the petroleum refining process. Nearly half of the hydrogen produced is from reformation of natural gas, 30% through petroleum refining and 18% through coal.
List of hydrogen suppliers
Source: IEA
AdvantagesAdvantagesAdvantagesAdvantages
1. Hydrogen is ready available and is a renewable
source
2. No harmfull emmision at the point of use
3. Potentially 2-3x more efficient than traditional
combustion technology ( 33-35% efficiency for a
fossil fuiel based power plant versus 65-70% for
hydrogen fuel cells
DisadvanatgesDisadvanatgesDisadvanatgesDisadvanatges
1. Hydrogen is expensive to produce.
2. Difficult to store and move around
3. Hydrogen fuel stations cost $1.5mn to set up
USUSUSUS NorwayNorwayNorwayNorway UKUKUKUK
Air Liquide Hystorsys ITM Power
Cella Energy NEL Hydrogen
Element 1 ZEG Power GermanyGermanyGermanyGermany
H2scan Linde
HY9
IGX CanadaCanadaCanadaCanada
PDC Machines Powertech
Proton Onsite

Berenberg Thematics
67
Automotive applications Automotive applications Automotive applications Automotive applications –––– strong strong strong strong interest from OEMs but high cost barriers for interest from OEMs but high cost barriers for interest from OEMs but high cost barriers for interest from OEMs but high cost barriers for adoptionadoptionadoptionadoption
Although the first FCEV concepts were developed in the 1960s, it has only been in the last 10 years that the technology has developed to such a level that car manufacturers can launch their first models. Toyota introduced its Mirai model in Japan in 2014, Hyundai is planning to begin selling FCEVs in the near future (the Hyundai Tucson FCEV has been available for lease since summer 2014), and in 2015 Honda announced plans to launch an FCEV later in 2016.
Other leading car OEMs such as GM, Ford and Nissan are also working on FCEV-related projects. Ford, in partnership with Honda, recently announced that it has been able to significantly reduce the cost and weight of the fuel cell stack, for example. The strong interest in FCEVs by traditional OEMs is due to a lack of range issues (the range of an FCEV is similar to that of an ICV) which have been such a major barrier to EV adoption. Refuelling time (about four minutes) for FCEVs is also similar to that for traditional ICVs.
FCEV fuel economy is better than an ICV but lower than a BEV: Currently, on-road fuel economy for an FCEV is around 1 kg of hydrogen per 100 km travelled, and demonstration cars have ranges of around 500-650km. Conventional cars’ refuelling time is about the same, but FCEVs can provide the mobility service of conventional cars at much lower carbon emissions.
Strong interest in FCEVs is being shown by established OEMs FCEV refuelling is similar to that of ICVs and they can be served
by a smaller refuelling footprint compared to EVs
Source: Intelligent Energy, company reports
FCEV adoption remains significantly behind targetsFCEV adoption remains significantly behind targetsFCEV adoption remains significantly behind targetsFCEV adoption remains significantly behind targets
FCEVs are in the very early stage of deployment. Globally, around 550 FCEVs (passenger cars and buses) are running in several demonstration projects. According to the IEA, assuming a fast ramp-up of FCEV sales, a self-sustaining market could be achieved within 15 to 20 years after the introduction of the first 10,000 FCEVs.
FCEV prices are high: Vehicle costs remain high. FCEV prices announced to date have been set at around $60,000 (Toyota, 2015) during the early market introduction phase. A lowering of FCEV prices would first require a reduction in the cost of manufacturing fuel cells and “balance of plant”.
Technology and FCEV offeringTechnology and FCEV offeringTechnology and FCEV offeringTechnology and FCEV offering ProductProductProductProduct TargetsTargetsTargetsTargets
Toyota
Toyota Mirai introduced in 2015 (US retail
price 57'500 without subsidy). 2016 model
will have a range of 312miles and fuel
economy of 66miles per galon equivalent.
Toyota expects to build 700 Mirai for sale in
2015. Expects to sell 30'000 FCEVs p.a. by
2020
Hyundai
Tuscan fuel introduced outside US in
2013.Retail price in Korea at $76000. Only
lease based offering in US at $499/month.
(exc fees and taxes)
Currently behind target to sell 1000 Tuscan
by end 2015 (mid 2015 total sales were at
273 with 76 in 2013 & 128 in 2014).
Honda
Honda Clarity introduced in 2008 and
discontinued in 2014. Were leased at
$600/month
Technology but no FCEV offeringTechnology but no FCEV offeringTechnology but no FCEV offeringTechnology but no FCEV offering
GM
Ford (research partnership with Honda)
Nissan
Developing fuel cell technologyDeveloping fuel cell technologyDeveloping fuel cell technologyDeveloping fuel cell technology
VW
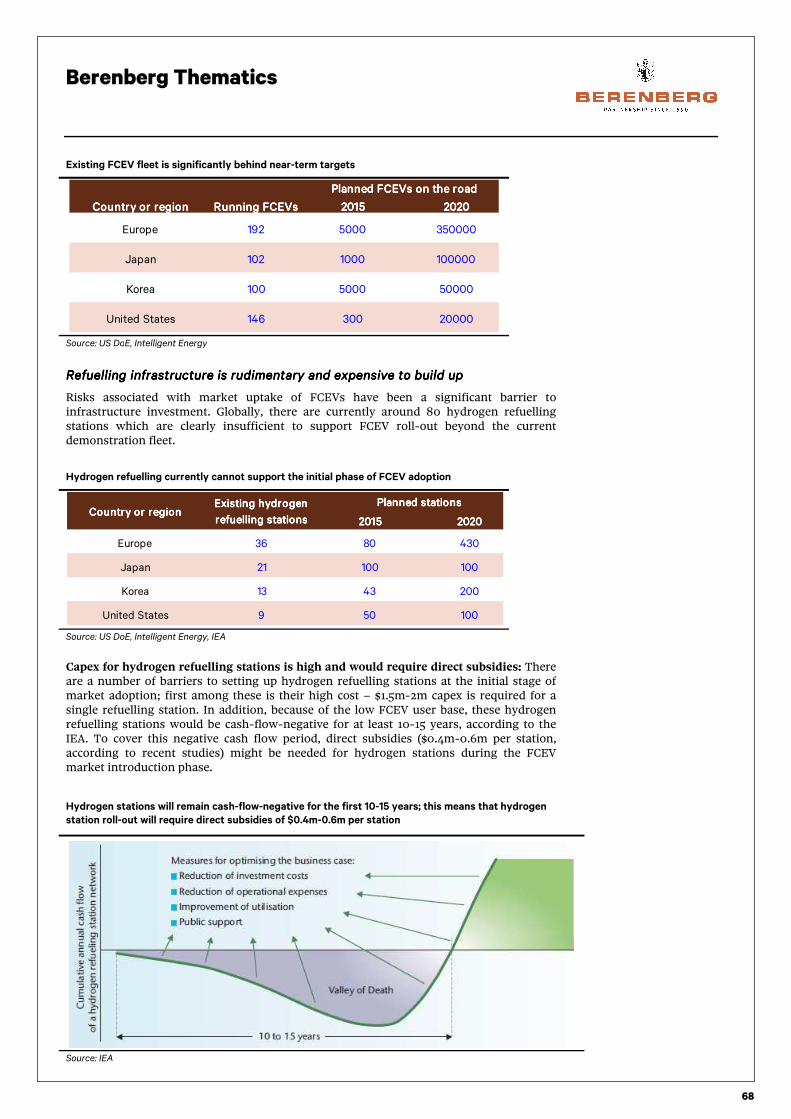
Berenberg Thematics
68
Existing FCEV fleet is significantly behind near-term targets
Source: US DoE, Intelligent Energy
Refuelling infrastructure is rudimentary and expensive to build up Refuelling infrastructure is rudimentary and expensive to build up Refuelling infrastructure is rudimentary and expensive to build up Refuelling infrastructure is rudimentary and expensive to build up
Risks associated with market uptake of FCEVs have been a significant barrier to infrastructure investment. Globally, there are currently around 80 hydrogen refuelling stations which are clearly insufficient to support FCEV roll-out beyond the current demonstration fleet.
Hydrogen refuelling currently cannot support the initial phase of FCEV adoption
Source: US DoE, Intelligent Energy, IEA
Capex for hydrogen refuelling stations is high and would require direct subsidies: There are a number of barriers to setting up hydrogen refuelling stations at the initial stage of market adoption; first among these is their high cost – $1.5m-2m capex is required for a single refuelling station. In addition, because of the low FCEV user base, these hydrogen refuelling stations would be cash-flow-negative for at least 10-15 years, according to the IEA. To cover this negative cash flow period, direct subsidies ($0.4m-0.6m per station, according to recent studies) might be needed for hydrogen stations during the FCEV market introduction phase.
Hydrogen stations will remain cash-flow-negative for the first 10-15 years; this means that hydrogen
station roll-out will require direct subsidies of $0.4m-0.6m per station
Source: IEA
Country or regionCountry or regionCountry or regionCountry or region Running FCEVsRunning FCEVsRunning FCEVsRunning FCEVs 2015201520152015 2020202020202020
Europe 192 5000 350000
Japan 102 1000 100000
Korea 100 5000 50000
United States 146 300 20000
Planned FCEVs on the roadPlanned FCEVs on the roadPlanned FCEVs on the roadPlanned FCEVs on the road
2015201520152015 2020202020202020
Europe 36 80 430
Japan 21 100 100
Korea 13 43 200
United States 9 50 100
Planned stationsPlanned stationsPlanned stationsPlanned stationsExisting hydrogen Existing hydrogen Existing hydrogen Existing hydrogen
refuelling stationsrefuelling stationsrefuelling stationsrefuelling stationsCountry or regionCountry or regionCountry or regionCountry or region

Berenberg Thematics
69
Fuel cell developers
Source: Fuelcells.org
USUSUSUS UKUKUKUK GermanyGermanyGermanyGermany CanadaCanadaCanadaCanada
Acumentrics SOFC Corporation AFC Energy elcore GmbH DDI Energy Inc.
Altergy Systems Intelligent Energy SFC Energy AG Automotive Fuel Cell Cooperation Corp.
BIC Consumer Products eZelleron GmbH Ballard Power Systems
Bloom Energy FutureE Fuel Cell Solutions GmbH Palcan Energy Corporation
ClearEdge Power sunfire GmbH Hydrogenics
Delphi Automotive Systems, LLC
EnerFuel
FuelCell Energy
Fuji Electric Corp. of America
Infinity Fuel Cell and Hydrogen, Inc.
Nuvera Fuel Cells
Oorja Protonics Inc.
US Hybrid
Versa Power Systems
VP Energy LLC
Infintium Fuel Cell Systems
ReliOn
Plug Power Inc.
Lilliputian Systems/Nectar Mobile Power

Berenberg Thematics
70
Mass transit
“The VW scandal changes everything. The brand of ‘clean diesel’ is dead. It was not real, they faked the test result.”
Ryan Popple, Proterra CEO.
The electric bus (EB) market is set for strong growth over the next five years, driven by governments’ efforts to reduce carbon emissions, address air quality concerns and save money. These efforts are being spearheaded by the Chinese.
Supercharged growth to comeSupercharged growth to comeSupercharged growth to comeSupercharged growth to come
EBs come in many forms – trolleys (powered by overhead cables), hybrids (part-IC engine and part-electric) and pure EBs (battery-only) – and sizes – mini-buses, midi-buses and coaches. Looking across the spectrum of EB research, there is broad consensus that this market is set for 15-30% annual growth over the next 5-10 years (see chart below left).
Research projections suggest consensus of more than 20%
growth in the EB market for the next 3-5 years
China’s production has grown by 858% yoy; Yutong has emerged
as a market leader
Source: Research reports – Consultancies listed; Frost & Sullivan figure calculated based on data supplied by the company
Source: chinabuses.org
China: the supreme leaderChina: the supreme leaderChina: the supreme leaderChina: the supreme leader
In this research on EBs, there is strong agreement that China will continue to dominate the EB space. SCI Verkehr estimates that over 90% of EB orders between 2013-14 came from China and Pike Research forecasts that over 75% of EBs will be sold in the Asia-Pacific region in 2018.
This is backed up by figures taken from chinabuses.org that suggest that China’s EB industry has grown by 858% yoy, producing nearly 25,000 vehicles between January and August 2015 (see chart above right). The world’s market-leading EB manufacturer, Yutong, expanded production by 14,200% in the same period, producing 7,026 EBs. To give an idea of the scale of the ramp-up, Yutong produces around 325 vehicles per day compared to 5-10 vehicles among European producers.
The scale that Chinese OEMs have achieved has been largely due to the Chinese government’s anti-emission, pro-EV stance and $15bn funding through its “10 cities, thousand vehicles” programme. China’s air pollution “red alert” in 2015 highlighted that air quality is now a very real global concern, with the World Health Organization estimating that air pollution causes about 100,000 deaths per year in Europe.
Operationally, economically, environmentally soundOperationally, economically, environmentally soundOperationally, economically, environmentally soundOperationally, economically, environmentally sound
Gap buses – specifically, PEBs and hybrids – travel along pre-determined, fixed-length routes every day with scheduled breaks incorporated into their timetables, making it easier for operators to plan necessary charge points. They drive mostly at slow speeds, frequently use their brakes (allowing for energy recovery) and spend a lot of time idling (thus making the most of start-stop technology).
16.26%
19.40% 19.60%
26.40%28.00%
0.00%
5.00%
10.00%
15.00%
20.00%
25.00%
30.00%
Tech-Navio
Frost &Sullivan
P&SMarket
Research
Pike PersistenceMarket
Research

Berenberg Thematics
71
Relative to diesel buses and hybrids, PEBs are far cleaner and quieter (see charts below). Despite requiring a large initial investment, their high utilisation rate, lower maintenance requirements and cheaper fuel costs result in a comparatively short the payback period and can yield significant savings throughout the life of the bus (see p46).
Electric engines are significantly quieter (dBs) than ICEs EBs have zero tailpipe emissions (Lbs CO2/year)
Source: Proterra Source: Proterra
PEBs also present public health cost savings. The Chicago Transit Authority has calculated that each PEB could save up to $660,000 in public health costs over its 12-year expected life versus a diesel equivalent.
EBs also make sense in the context of future regulation. Over the last 20 years, a number of major markets have tightened limits on truck and urban bus pollutants, such as the EU’s Euro I-VI standards. Starting in 1992 with the voluntary Euro I standards, EU heavy-duty diesel emission regulation has evolved into the mandatory Euro VI standards, which specify that new buses should emit a third or less of the emissions released by buses purchase under the original standards. We expect standards to progressively tighten over the next decade, towards the ultimate goal of zero emission transit.
EB technology: battery power and hybrids are the way forwardEB technology: battery power and hybrids are the way forwardEB technology: battery power and hybrids are the way forwardEB technology: battery power and hybrids are the way forward
The broad range of technology associated with EVs can be organised into three main categories: charging infrastructure, energy storage and propulsion systems.
There is a broad choice of hybrid and electric technology
Source: Fraunhofer MOEZ
EB charging: plugEB charging: plugEB charging: plugEB charging: plug----ins favoured for price and simplicityins favoured for price and simplicityins favoured for price and simplicityins favoured for price and simplicity
Overhead lines are typically associated with trams and trolley buses where the electrical charge is passed via conductive poles from the charged lines to the vehicle below. Recently, however, we have seen the development of pantographs, which are fast-charging systems, where rooftop batteries are recharged by an overhead charge point using a robotic arm (see illustration below right).
Induction: For wireless charging, a magnetic field is created using inductive plates on the ground. This allows buses to recharge both while stationary and on the move.
Plug-in: Direct charging from a charging station (in a bus depot) by traditional means, standardised by mode/type by the International Electro-technical Commission (IEC).
The other option is battery swapping – however, this is far too expensive in practice due to the additional cost of infrastructure, warehouses and staff. The majority of operators opt
70 - 78
65
Diesel Diesel Hybrid CNG Proterra EV
209
154
216
0
Diesel Diesel Hybrid CNG Proterra EV
Alternative Bus Technologies
Charging Infrastructure
Overhead Line Induction Plug-In
Energy Storage Systems
Ultra Capacitor Battery Fuel Cell
Propulsion System
Pure Electric Hybrid Motor

Berenberg Thematics
72
for plug-ins/overhead charging. We expect plug-ins to maintain a larger share than pantographs as fast-chargers are more expensive and complicated to install (the work includes laying cables, strengthening the local sub-station, logistics and timing concerns). With a plug-in system, however, the operator can simply replace the diesel bus and, assuming there are no range issues, it can be used as normal and then be recharged at the depot every night. Wireless charging is still at a very early stage of development.
Energy storage: batteries gaining share with all electric and hybrids Energy storage: batteries gaining share with all electric and hybrids Energy storage: batteries gaining share with all electric and hybrids Energy storage: batteries gaining share with all electric and hybrids
Batteries and fuel cells provide the main means of energy storage. Despite a small number of manufacturers offering ultra-capacitor power, due to their far lower energy densities, we do not see the technology as a viable long-term option. We expect batteries to gain share here, either through battery-only EVs or used in tandem with fuel cells in hybrids. Due to high infrastructure costs, higher maintenance costs and inferior fuel efficiency (c3.5mpg versus c4mpg for diesel), we believe that CNG buses will enter structural decline. Also, due to the sheer cost of hydrogen fuel cell buses ($0.8m-1.5m), we do not expect hydrogen buses to gain a large share.
OpportunityOpportunityOpportunityOpportunity----charging makes sense for nowcharging makes sense for nowcharging makes sense for nowcharging makes sense for now
Opportunity-charging (used by opportunity buses) is where buses engage in short bursts of fast-charging at regular intervals (every three to four stops) using overhead or inductive fast-charge points. Overnight charged buses, on the other hand, are buses that employ a plug-in, slow charge overnight and tend to carry much heavier loads of batteries, allowing them to drive throughout the day.
Fast charging is usually carried out using LTO or NMC batteries as they can handle faster charge/discharge rates, resulting in better acceleration. Plug-in, slow charging is commonly used in conjunction with LFP batteries which have higher energy densities and slower discharge rates, making it the “workhorse” of batteries, perfect for buses that travel long distances between charges.
Opportunity charging Pantograph charger
Source: Berenberg Source: gas2.org, Volvo
Opportunity-charging in the short term, with larger fleets, makes commercial sense. The bus industry is highly focused on weight and passenger numbers. Opportunity-charged buses (50-100kWh) require fewer batteries than overnight-charged buses (200-400kWh). Less weight means more passengers and higher revenues. Although infrastructure costs are higher, buses in fleets of three or more (see p46) that are “opportunity-charged” are cheaper to run over their lifetime than overnight buses.
As charging requirements are unique to each bus route, we believe opportunity-buses will hold a fair share of the PEB market for some time. The long-term winners, however, will be overnight buses. When energy densities improve and overnight buses can perform a full day’s service (c250km) with range to spare (c50km), across various gradients, transporting heavy loads, in harsh conditions, the plug-in will win out for being cheaper and simpler.
Range, faster charging and optionality are key differentiators
The key participants in the EB market are OEMs, battery manufacturers and charging infrastructure providers.

Berenberg Thematics
73
OEMs include either the large international players (such as Volvo) or smaller, more specialist companies (ie ADL). The largest bus manufacturers in the world are Yutong, Daimler, King Long, Volkswagen (Scania and MAN), Marcopolo and Toyota, which have a combined c40% share of the total bus market. For EBs, the biggest manufacturers are in China – Yutong, Xiamen King Long, Zhongtong, Nanjing Golden Dragon and BYD hold the lion’s share. In terms of PEBs, BYD is the biggest, followed by a number of small Western players such as Proterra, Optare, EBUSCO and Solaris.
Charging infrastructure providers: Most EB manufacturers partner with electronics specialists in order to provide a complete (bus-plus-charger) offering. Examples include Volvo and ABB, Wright Bus and Mitsui-ARUP and Solaris and Bombardier. We have also seen partnerships extend into drivetrains (ie Wright Bus and Siemens, New Flyer and BAE); however, OEMs which do not produce their own equipment are likely to lose out, as they are forced to work to another company’s innovation timetable, sacrificing valuable margin in a low-margin industry.
PEBs – LFP plug-ins with a range of more than 300km and charge times of less than three hours are preferable
Source: Berenberg. P = Plug-In, O = Overhead, W = Wireless
Looking to PEBs, most OEMs offer an LFP overnight-charged bus, with a slow and faster (opportunity-lite) plug-in charging option, where batteries can be partially recharged within 1-2 hours. Range requirements are around 300km in normal conditions, meaning many OEMs have a long way to go to compete with leaders such as BYD and Yutong.
OEM partnerships, such as BYD combining its chassis and electric drivetrain with ADL’s market leading Enviro200 body design, are becoming evermore prevalent. We believe more East-West partnerships will evolve as scaled Chinese producers look to introduce their buses into Western markets.
Horses for courses
Making PEBs economically viable is vital for mass adoption. Despite lifetime fuel cost savings of $200,000-400,000, PEBs cost c1.5-2x the amount of a diesel equivalent, and then is the charging infrastructure to add on top. However, battery pack costs have been gradually declining (from c$1,200/kWh in 2009 to c$250-350/kWh today), feeding through to PEB prices. For example, the cost of a Proterra PEB has fallen from c$1.2m in 2010 to closer to c$750,000 today.
Cost of bus by fuel type (USD) Lifetime cost of bus ownership (USD)
Source: Berenberg Source: Berenberg
OEMOEMOEMOEMSample Model Sample Model Sample Model Sample Model
namenamenamenameBattery TechBattery TechBattery TechBattery Tech Battery SizeBattery SizeBattery SizeBattery Size RangeRangeRangeRange OEM DeploymentOEM DeploymentOEM DeploymentOEM Deployment
Charging Charging Charging Charging
InfrastructureInfrastructureInfrastructureInfrastructureCharge timeCharge timeCharge timeCharge time PartnersPartnersPartnersPartners
Zhengzhou Yutong Group E12 Li-Ion 295kWh 320km Worldwide P 1-5hrs SAFT, DCG
Shenzen Wuzhoulong FDG6112EV LFP 160kWh / 260kWh 200km Worldwide P Guangdong Power, Wuzhou Dragon
Zhongtong Bus & Coach LCK6120EV Li-Ion 450Ah 200km Worldwide PO 5hrs, 30mins
BYD K9 LFP 360kWh 250km Worldwide P 3-5hrs Samsung, ADL
EBUSCO YTP-1 LFP 311kWh 300km Scandinavia, China P 2.5hrs
Proterra Catalyst NMC / LTO 321 kWh / 53kWh 400km, 40km US PO 1.5hrs, <10 mins Altairnano (Battery)
New Flyer Xcelsior NMC 300kWh 125km US, Canada O 6mins Siemens, Eaton
Solaris Urbino Li-Ion 240kWh / 90kWh 100km France PO 1.5-4hrs Ekoenergetyka, Vossloh, Bombardier
Wright Bus StreetLite EV NMC 150kWh 140km, 24km UK, US, Asia POW c10mins Mitsui, ARUP, Siemens
Optare Solo EV LFP 92kWh 120km India, UK P 2-6hrs
AB Volvo 7900 Electric LFP 76kWh 10km Scandinavia O 3-6 mins SAFT, ABB, Siemens
Linkker Oy Linkker 12 LTO 48kWh 30-50km Scandinavia O 3-7 mins Heliox, VISEDO
Complete Coach Works ZEPS LFP 213kWh / 242kWh 185km US PW 4-6hrs
Siemens eBus LFP 96kWh 120km Austria O c10 mins

Berenberg Thematics
74
In the context of lifetime cost of ownership, EBs are becoming increasingly viable. However, their limited range makes them unsuitable for some bus routes. We believe that operators will take a “horses for courses” approach to the phasing-in of EBs. For longer routes which run day and night, hybrids are the obvious choice at the moment as they can run for longer and be refuelled quicker than an EB and have better fuel economy than diesel or CNG buses. However, on those routes where busses can operate in the morning and in the evening but with a break in the middle of the day (allowing for opportunity-lite charging) electric buses seem very well suited. Until EBs can perform straight shifts of 300-350km with heavy passenger loads and in harsh climate conditions, hybrids will be the preferred option.
Having said this, we do expect more transit authorities, large cities and regions to pursue the zero-emissions label, mimicking projects pioneered by Paris (Bus2025), California (which has an all zero-emission passenger vehicle target by 2040) and Copenhagen (which aims to be the first zero-emissions city by 2025). In cases such as these, we would expect hydrogen buses to take the place of hybrids on energy intensive (ie 24 hours per day, seven days a week) service routes.
An alternative solution for the carbon-conscious has emerged in the form of retro-fitting – ie the installation of electric engines in non-EVs. Instead of paying a high premium for a new EB, operators can refit old diesel buses with electric engines for a fraction of the cost. We expect strong growth in this market over the next 5-10 years as operators respond to tighter air quality regulation.
Global subsidy support - China is in another league
Across the globe, there is broad regulatory support for mass transit. Government subsidies are helping the fledgling electric transit industry to gain scale and promote operator awareness. This in turn should allow manufacturers to reduce costs, encouraging further investment, creating a virtuous cycle of growth. We note the sheer scale of the Chinese government’s support (see chart below) compared to similar projects in the US/Europe: its $15.6bn funding is 280x the size of the US’s low/no emissions programme, offering cRMB500,000 (c$75,000) purchase subsidies on new EBs.
Figure 13: Global government support for a transition to EBs
Source: Berenberg
A $60bn market by 2020, led by China; Europe led by Volvo; insourced drivetrains preferred; more partnerships to come
We estimate that the current size of the total bus market is around $150bn, and it is expected to grow to c$210bn by 2020. Hybrids and EBs, we estimate, make up c12% of the total bus market (ie c$18bn), but their share is set to grow to 29% (over $60bn) by 2020.
We believe the market will continue to be dominated by China thanks to its generous subsidies programme and its current scale, with BYD and Yutong maintaining their leading positions in the PEB and EB spaces respectively. However, further partnerships with European OEMs will be required to bring their offerings up to the quality requirements of European and US operators.
In Europe, we see promise for the large OEMs which can invest in developing EB drivetrains, such as Volvo, Daimler and VW (Scania/MAN). Volvo is the only one to be trialling a PEB currently; Daimler’s offering set to enter production after 2018 and MAN’s
ProjectProjectProjectProject LocationLocationLocationLocation FundingFundingFundingFunding Program Description Program Description Program Description Program Description
Ten Cities, Thousand Vehicles
ProgramChina $15.6bn
Since 2009, China has spearheaded the deployment of EVs throughout the country, now having expanded the project to 25
cities, deploying thousands of battery buses and becoming a leading developer of battery EBs. China plans to invest RMB100bn
in new energy vehicles over the course of 10 years.
Low/No Emissions Vehicle
Deployment ProgramUSA $55m
US government initative to deploy the cleanest, more energy efficient, US made transit buses. $55m has been provided to Transit
authorities, of which $30m has been spent on 28 battery powered Proterra buses and 7 Proterra charging stations.
Zero Emissions Urban Bus Systems
(ZeEUS) ProjectEurope $25m
Launched across 8 cities in Europe in 2014by the International Association of Public Transport (UITP) with a total budget of
€22.5m, the ZeEUS project, co-ordinating 450 partners involves a 42 month demonstration to extend a fully electric solution to a
wider part of European bus networks.
Green Bus Fund UK $135m
The Green Bus Fund is supporting bus companies and local authorities in England to help them buy new low carbon buses. Its
main purpose is to support and hasten the introduction of hundreds of low carbon buses across England. It has so far contributed
close to £90m in grants across England to help local councils buy 1,240 new energy buses.

Berenberg Thematics
75
by 2020. This, along with its reputation in hybrid technology, should give Volvo a first-mover advantage. Smaller OEMs, such as Wright Bus, with more established offerings, may struggle with production capacity as larger orders come through, compounded by pricing pressure when larger players enter the market and are able to sacrifice margin for market share.
We would avoid companies that use other OEMs’ drivetrains such as New Flyer and Gillig as they will be forced to sacrifice margin in an already low-margin industry and work to another company’s innovation timetable when it comes to developing new technology. However, we do see more OEM partnerships emerging. These will take one of two forms: those that introduce foreign players into new markets (eg BYD/ADL) and those that link specialists in bus building and electronics (eg Volvo/Siemens).
Regional market price scenario 2014
Source: Frost & Sullivan
Other sectors
In compiling this report, we have listened to many expert calls and conference sessions and read significant amounts of industry research, and in so doing have noted a number of other end-markets which are set to benefit from the advancement in battery technology. We highlight some of these below.
Forklifts Forklifts Forklifts Forklifts
The €30bn global forklift market comprises around 1.1m new units per year. Around 40% of the market is made up of “warehouse trucks”, which are almost exclusively battery-powered, while another 15% are traditional counter-balanced trucks but powered by batteries rather than diesel engines.
While the forklift market is already well advanced in traditional battery technology, almost all operators in the e-truck and warehouse segment are using lead acid batteries. That these batteries are bulky and heavy is generally not an issue for forklift operators, as they provide the weight balance required for lifting heavy loads. However, they do have their drawbacks. For example, lead acid batteries need to be swapped out and re-charged between shifts, so two battery sets are needed if the forklift is to perform successive shifts. Lithium ion batteries, meanwhile, can be charged quickly on the truck (in less than an hour) and do not need to be switched out. Lithium ion powered trucks manufactured by KION and Jungheinrich can also run for 1-2 full shifts, thus saving time and energy.
Lithium ion batteries are also more suitable in situations when high power levels are required, for high shelf-stacking in warehouses for example, or in cold environments. Lithium ion trucks are also maintenance-free. Cost still remains an issue, however, with some of the leading players suggesting that lithium ion solutions still cost c€450/kWh versus €150/kwh for lead acid.
KION and Jungheinrich announced their first lithium-ion based trucks in 2013/14 but are expecting these to garner more interest among buyers as costs come down. The emerging

Berenberg Thematics
76
markets are increasingly shifting towards warehouse trucks and e-trucks (due to increasing regulation prohibiting the use of combustion engines inside warehouses, as well as Western warehouse companies operating e-trucks as standard there), and this could become a high-growth, niche market where companies such as KION, Raymond (part of Toyota) and Jungheinrich could dominate given their advanced technology in integrating and managing battery power (they buy their batteries from third parties) – giving them an advantage over smaller local players.
Testing companies Testing companies Testing companies Testing companies
Global players such as Intertek are required to certify both battery systems and also charging equipment. As the number of battery packs and charging stations increases over the coming years, the demand for testing will increase significantly. However, for companies such as SGS, Intertek and Bureau Veritas, battery testing forms only a relatively small part of their diversified businesses.
TrucksTrucksTrucksTrucks
Companies are rolling out solutions for Class 8 trucks which require idle power when the driver is off-duty to run utility services such as heating and also electric appliances such as televisions. Newer, more powerful lithium ion batteries are able to replace up to 10 lead acid batteries, reducing weight and space.
Works trucksWorks trucksWorks trucksWorks trucks
Companies such as Odyne are providing retrofit hybrid solutions for construction trucks. By combining a battery to the drivetrain, the truck can be powered while stationary without using the engine. This can provide savings of around 30% in terms of fuel and CO2 emissions and an 80% reduction in NOx. These solutions are now starting to be adopted by utility companies (on their maintenance trucks) and construction trucks.
Emergency vehicle auxiEmergency vehicle auxiEmergency vehicle auxiEmergency vehicle auxiliary powerliary powerliary powerliary power
The Detroit ambulance fleet is one example of an emergency vehicle operator using battery power to reduce engine idling time. All of the auxiliary and medical equipment is then run off a separate battery system, reducing both fuel consumption and CO2/NOx emissions. NextEnergy and Navitas are the suppliers of this equipment in Detroit.
Implications for autos – identifying the winners
Tesla, NissanTesla, NissanTesla, NissanTesla, Nissan----Renault and BMW are the frontrunners in the EV spaceRenault and BMW are the frontrunners in the EV spaceRenault and BMW are the frontrunners in the EV spaceRenault and BMW are the frontrunners in the EV space
In the US and Europe, Tesla, the Nissan-Renault alliance and BMW are spearheading the electrification of the automotive sector, especially in the all-electric BEV space. In China, the EV market is dominated by local players led by BYD. These four players have invested strongly over the last five years in 1) lithium ion battery technology, 2) upgrading their manufacturing facilities to handle EVs and 3) either setting up their own battery manufacturing facilities or striking partnerships with dominant battery suppliers.
Tesla – its best-in-class NCA-based EV technology and vertical integration in cell manufacturing could help it transition towards and maintain a competitive edge in the mass EV space: As a new entrant and a pure EV manufacturer, Tesla’s product development strategy has been based on engineering its cars from the bottom-up without the influence of any legacy issues. This has helped it create its high-performance, stylish and durable all-electric family saloon, the Model S (launched in 2012) and its recently launched SUV cross-over, the Model X. Its exceptional quality product offering has allowed it to gain a price premium over competing EVs, dominate the high-end pure electric space and compete with comparable traditional ICVs on price.
Tesla is also unique among incumbent OEMs as it controls its entire supply chain, including in-house battery manufacturing, direct sales to customers (rather than through external dealers) as well as its exclusive rapid charging infrastructure. This highly vertically-integrated approach to building up its EV offering can be explained by the fact that as a new entrant it lacked the scale and access to an established supply chain enjoyed by traditional OEMs and hence had to build these capabilities in-house. What is apparent is

Berenberg Thematics
77
that Tesla’s approach has been successful, and in our view its backward integration – with lithium ion cell manufacturing taking place at its Gigafactory – could give the company a competitive advantage as it transitions towards the mass market EV segment.
Tesla is aiming to complete in the mass market with the launch of its $30,000-35,000 Model 3 – a market currently dominated by the Nissan Leaf and the Renault Zoe. While we think that the EV space will become increasingly crowded over the next five years, Tesla will likely maintain a significant share in this rapidly growing market. Tesla is a rare example of a company which has opened up most of its technology patents to peers in order to expedite the broader electrification of transportation. While there might be a moral thrust behind this move, we think that Tesla has established a strong brand name and a compelling product offering and will gain significantly from the industry-wide shift away from the internal combustion engine.
The Nissan-Renault alliance dominates the mid-end EV space: In 2011, the Nissan-Renault alliance announced its ambitious EV growth strategy. It targeted 1.5m EV on the road by 2016. The two companies have invested more than €4bn in their EV business. While growth has been slower than the alliance initially expected, the two companies carved out a high share of the mid-end space, competing with ICVs in the $30,000 price range. As part of its alliance, Renault has focused on Europe while Nissan concentrates on Asia and the US.
Renault introduced three EV models in 2011 (the Fluence ZE, the Kangoo ZE and the Twizy), followed by the Renault Zoe in 2012. Renault has avoided backward integration by using LG to manufacture its EV batteries. Nissan, on the other hand, sources its batteries from AESC – a JV between NEC and Nissan – in which the two have jointly invested $1.1bn.
BMW – strong EV technology but its product offering stuck between the mid- and the high-end: BMW has been carrying out R&D in the EV space for the last 40 years. At the 1972 Olympics in Munich, the company operated two EVs running on lead acid batteries as part of its support fleet. However, compared to both Tesla and Nissan-Renault, BMW is a relatively new player in the space: its all-electric BMWi3 was only launched in 2014.
BMW strategy is unique in that its BMW i3 is priced at ~$50,000 (before subsidies) and thus targets neither the mid-end mass market dominated by Nissan and Renault nor the high-end addressed by Tesla. This might explain why BMW i3 has lagged the Tesla Model S, Renault Zoe and Nissan Leaf in sales over the last two years. However, its BMW i8 PHEV (with a 7.1kWh lithium ion battery offering an all-electric range of 15-23 miles) introduced in 2015 has been relatively successful. In 2016, it has launched two PHEVs – the BMWX5 xDrive40e and the BMW330e.
The company has yet to confirm rumours that it will launch an extended version of the BMWi3 (to be named the BMWi5) in 2018 to compete with the Tesla S. However a new version of the BMW i3 will be launched in 2017 and will have a higher range of 130 miles as compared to the 100-mile range of its current versions.
Volkswagen, GM and Ford are fast catching up; the EV space will be crowded Volkswagen, GM and Ford are fast catching up; the EV space will be crowded Volkswagen, GM and Ford are fast catching up; the EV space will be crowded Volkswagen, GM and Ford are fast catching up; the EV space will be crowded within three years within three years within three years within three years
The dominance currently enjoyed by the three players in the EV space will soon be over. Larger OEMs have for a very long time chosen to stay at the margins despite having the lithium ion EV technology. With the emerging markets too small, it did not make economic sense for them to rush in and cannibalise their existing traditional ICV business. To the conspiracy theorists, this is why companies like GM killed off its early EV offering based on NiMH battery technology during the 1990s – although the truth might lie in the high cost and poor energy density of NiMH, which made the company’s EVs commercially unviable.
Conditions have changed markedly since the introduction of the superior (higher energy density) lithium ion battery technology and the subsequent fall in its manufacturing cost which continues as the scale of manufacturing rises. With lithium ion pack prices now below $300/kWh and likely to nearly halve to $170/kWh by 2020, automotive giants Volkswagen (and its brands Audi and Porsche), GM and Ford have entered the fray and have launched aggressive EV capex plans over the next three years. At the same time, Volkswagen has also announced plans and partnerships to expedite the roll-out of charging infrastructure in the US and Europe.
Its EV strategy is slightly different to Tesla’s in that it is focusing on producing electric versions of its current ICV offering and thus lowering costs by sharing ICV parts and assembly lines. We think this strategy will be effective, especially in the mid-end mass

Berenberg Thematics
78
market for EVs (ie ~$30,000 price bracket/100-200 miles range category), which is currently led by Nissan-Renault and is the target market for Tesla’s 2017 launch of its Model 3. The sheer manufacturing scale of Volkswagen, GM and Ford this strategy will give them an edge in the lower-end EV space, in our view.
Volkswagen brands Porsche and Audi are spearheading its entry into the high-end EV space while electrification of its current ICVs (Golf and Polo) will help it target the mass market EV segment: Porsche has announced plans for the launch of its Mission E (an EV with a 310-mile range and equipped with a 800V fast DC charger) which will be produced at its new €700m manufacturing facility in Stuttgart, Germany. The Mission E will be launched in 2020 and will be a direct competitor to Tesla’s Model S.
Audi is investing €3bn in 2016 and a total of €22bn by 2018 in the development of new technologies, new vehicles and for upgrading/expanding its manufacturing facility. On the back of these investments and upgrades of its assembly lines, it will be introducing the all-electric e-tron quattro (with a 310-mile range based on a 95kWh battery) in 2018. The e-tron quattro will be an SUV cross-over and a direct competitor for the recently launched Tesla Model X. In 2014, Audi also released its A3 Sportback e-tron PHEV (an all-electric car with a 31-mile all-electric range based on an 8.8kWh lithium ion battery). The company is reportedly aiming to add one new PHEV every year to its product portfolio.
Volkswagen is focusing on the mid-end market and currently has a BEV e-Up! Car on offer (with a 100-mile range and a 18.7kWh lithium ion battery) costing €27,000. It will be launching a new version of its all electric e-Golf SE priced at $30,000 (before subsidies) by late 2016, almost $5,000 cheaper than the $34,500 prior version. In 2017, it will be launching an all electric e-Polo.
On the charging infrastructure side, Volkswagen has entered into a partnership with BMW and Chargepoint (a leading charging station company) and will invest $10m in setting up 100 DC fast-charging stations in the US. This is part of its initiative to set up the largest EV charging network on heavily travelled routes along the US west and east coasts.
GM is aiming to become a major player in the mass market BEV space through its Bolt EV, while its 2016 launch of the Volt will help it reinforce its position in the PHEVs market: GM was a pioneer in EVs. It launched its all-electric EV1 based on lead acid batteries in 1996 on a lease-only basis in the US. However, the EV1 was not profitable and GM abandoned production in 1999 and recalled and crushed all the EV1s ever produced (bar one survivor at the Smithsonian in the US). After this commercial failure, GM has been relatively conservative in terms of EV roll-out.
Despite having no BEV offering, GM has been the most successful player in PHEVs. Its Chevrolet Volt PHEV, introduced in 2011, remains the highest selling PHEV in the US. We expect the company to maintain its lead in the PHEV space as its next-generation 2016 version of Volt, priced at $33,000 (before subsidies), will have a pure electric range of 53 miles which is far superior to any other PHEV in the market.
GM has also announced plans to re-enter the all-electric space and will launch its Chevrolet Bolt priced at $37,500 before subsidies in 2017. It will have a range of 200 miles, which exceeds anything being offered by any of its competitors in the mass market. This, in our view, will make Chevrolet Bolt the real competitor to Tesla’s Model 3, provided that it is introduced as currently planned in 2017.
Further, the company will be investing $384m in its Hamtramck assembly facility in Michigan and $65m to upgrade its lithium ion pack manufacturing facility (the Brownstown battery assembly plant). GM will be building the Chevrolet Bolt at its Orion Assembly Plant, in which it is investing $245m. These investments follow the $17.8bn it has broadly invested in its manufacturing facilities over the last few years to produce greener cars.
Ford is investing $4.5bn over the next five years to achieve a 40% electrification of its nameplate manufacturing capacity: Ford introduced the all-electric Ford Focus (23kWh; a 76-mile range) in 2012, priced at $30,000. It also has two versions of the C Max Energi PHEV. Over the next five years, Ford will radically step up the electrification of its product offering. It will invest $4.5bn by 2020, which will allow it to introduce 13 new EVs to its product portfolio. The company will be launching the new version of the Ford Focus this year; it will have DC fast-charging capability, allowing it to charge two hours quicker than the current Ford Focus.

Berenberg Thematics
79
Toyota and Peugeot lack the technology and we expect they will be left behind Toyota and Peugeot lack the technology and we expect they will be left behind Toyota and Peugeot lack the technology and we expect they will be left behind Toyota and Peugeot lack the technology and we expect they will be left behind in the EV racein the EV racein the EV racein the EV race
In our opinion, companies which are still relying on NiMH batteries and are not taking aggressive measures to either acquire or build up lithium ion technology will be left behind in the EV space. While hydrogen-based fuel cell technology (which is being targeted by Toyota) might become a viable technology over the next 10 years, FCEVS are unlikely to gain much traction versus all-electric BEVs over the next 3-5 years, in our view. We hence do not expect Toyota, Daimler and Peugeot to benefit from the strong growth in both plug-in hybrids and all-electric BEVs over the next five years.
We think Toyota – the pioneer in hybrids – will fall behind in EVs as it is focused on fuel cell technology and also hindered by its dependence on other OEMs for lithium ion battery technology: Toyota was a pioneer in the early hybridisation of ICVs and the Toyota Prius is still the leader in the non-plug-in hybrid segment. Toyota was also – along with GM – an early leader in all-electric EVs when in 1997 it launched the RAV4 EV (27.4kWh, with a NiMH battery providing an impressive 95-mile range) in California on a lease basis. However, production was reportedly discontinued in 2003 due to a patent infringement dispute between its battery supplier Panasonic and Ovonics. This early successful experience with NiMH battery technology is one reason in our view why it still prefers to use it in the Prius hybrid Prius. At the same time, this also highlights its weakness in lithium ion battery technology, which is far superior in energy density terms to NiMH technology. Indeed, for its second-generation all electric RAV4 EV – launched in 2012 – it relied on a lithium ion battery pack and power train supplied by Tesla. Toyota discontinued production of RAV4 EV after its agreement with Tesla expired in September 2014.
Despite this long history in all-electric EVs and its leadership position in hybrids, Toyota’s current medium-term strategy does not include any plans to launch EVs in the US or Europe. Toyota’s strategy is unique as it is the only leading OEM with no BEV plans over the next five years. According Toyota’s management, this reluctance is based on the drawbacks of the current Lithium ion technology which is expensive and creates range issues for BEVs. Toyota instead believes that hydrogen-based FCEVs are the way forward, as they do not suffer from range issues. In late 2015, it launched the Toyota Mirai priced at $57,500 in the US.
We believe Toyota’s reluctance to develop BEVs is due to its weakness in lithium ion battery technology and its dependence on NiMH which in our view is an obsolete technology. FCEVs are unlikely to take off over the next five years outside of Japan – and possibly Germany – because of the lack of FCEV infrastructure and the difficulty in setting up a hydrogen-charging supply chain. We hence believe that with its current strategy, Toyota will be the main loser as EV penetration increases over the next five years.
Peugeot also lacks lithium-ion based BEV technology which could undermine its strategy to launch a BEV by 2020: Peugeot currently only produces three non plug-in hybrids based on the obsolete NiMH battery technology. It also sells pure EVs branded as the Peugeot iOn and Citroen C-Zero which are produced by Mitsubishi and also sold as the Mitsubishi-iMEV.
Peugeot has recently announced its intention to enter the EV space. It plans to launch a mass market BEV by 2020. In our view, this will present a challenge as it does not have its own lithium ion battery technology.

Berenberg Thematics
80
EV value chain
Source: Berenberg
Manufacturing equipmentManufacturing equipmentManufacturing equipmentManufacturing equipment Automotive suppliersAutomotive suppliersAutomotive suppliersAutomotive suppliers Car makersCar makersCar makersCar makers Charging infrastructureCharging infrastructureCharging infrastructureCharging infrastructure MaintenanceMaintenanceMaintenanceMaintenance RecyclingRecyclingRecyclingRecycling
(+) Strong outlook for EV production equipment
(+) Strong growth outlook for manufacturers of battery pack,
electric motor manufacturers and
power train
(-) Long term canabalization of demand for ICV by Evs. Threat
of new enterants high from
overlapping industris (Apple,
Google etc).
(+) Utilities and electrical charging infrastructure/
equipment providers to benefit
with the roll out of EV charging
stations for Evs
(-) Negative impact services providers as plugin Evs require
significantly lower maintenance
(+) New business for recyclining batterries to emerge
Automotive/industrial robotsAutomotive/industrial robotsAutomotive/industrial robotsAutomotive/industrial robots Automotive inverter suppliersAutomotive inverter suppliersAutomotive inverter suppliersAutomotive inverter suppliers FrontrunnersFrontrunnersFrontrunnersFrontrunnersCharging infrastructure Charging infrastructure Charging infrastructure Charging infrastructure
providersprovidersprovidersproviders
Kuka Toyoto/Denso Tesla Tesla
ABB Mitsubishi Electric BYD Charge your car
Bosch Rexroth Corporation Hitachi Nissan Polar Network
Adept technology Toshiba Renault Ecotricity
Applied Robotics Continental BMW PodPoint
ATI Industrial Automation Bosch Zero Carbon World
Hi-Tech Tool Industries Hyundai Mobis
Kawasaki Robotics Calsonic Kansei Fast catching upFast catching upFast catching upFast catching upCharge point equipment Charge point equipment Charge point equipment Charge point equipment
manufacturermanufacturermanufacturermanufacturer
Rethink Robotics TDK Volkwagen Bosch
Staubil Corp. Edrive General Motors Schneider Electric
Electromotive Ltd
EV electric motor EV electric motor EV electric motor EV electric motor
manufacturersmanufacturersmanufacturersmanufacturersFord Viridian EV
Toshiba Daimler Chargemaster Plc
Automation hardware and Automation hardware and Automation hardware and Automation hardware and
software and computingsoftware and computingsoftware and computingsoftware and computingToyota ChargePoint Services
GE intelligent Platforms Tesla Lagging behindLagging behindLagging behindLagging behind Charging Solutions
HTE, Inc Hitachi Toyota
Honda Kia
ZF Honda
Continental PSA
Automation toolingAutomation toolingAutomation toolingAutomation tooling Renault/Nissan
Hydromat Magna
Industrial Tech Services Bosch
IPR Sonar Plastics General Motors
Isra Vision Systems AC propulsion
KeenTec North America Alsin
Leoni Elocab,Ltd AM-Motive
Leibherr Automation Systems Fuji Machinery
Hyundai Mobis
Meinsha
Automotive assembly and test Automotive assembly and test Automotive assembly and test Automotive assembly and test
systemssystemssystemssystems
ICA Cinetic Automation corp.Power/battery management Power/battery management Power/battery management Power/battery management
systemsystemsystemsystem
SOLTEC Corp.
Infineon
Technologies/International
rectifier
STMicroelectronics
Renesas Electronics Corporation
Automation Automation Automation Automation
installation/integration installation/integration installation/integration installation/integration
contractorscontractorscontractorscontractors
Toshiba
Industrial automation Faichild semiconductors
Koops Vishay Intertechnology
TranTek Automation Corp.Alpha and Omega
Semiconductors
ONSemiconductors
NXP
Implications for margins and growthImplications for margins and growthImplications for margins and growthImplications for margins and growth
EV manufacturing equipment suppliers
Automotive suppliers for battery pack /power train equipment
Car makersCharging
infrstructure/equipment suppliers
Maintenance Recycling

Berenberg Thematics
81
Tesla (Sell, PT $165.00; market cap: $25.7bn)
Berenberg analyst: Adam HullBerenberg analyst: Adam HullBerenberg analyst: Adam HullBerenberg analyst: Adam Hull
Business description: Tesla is a high-quality and innovative company with strong battery technology. It has brought forward the adoption of EVs and will launching stationary storage products for utilities, commercial clients and households. Tesla has a unique brand led by a successful visionary. The company has attracted, retained, enthused and created the right environment for talented engineers to achieve impressive results.
Growth outlook and opportunities: The company has achieved very strong sales in the luxury large-saloon segment (second behind the Mercedes S-class). The Model 3 enters a very competitive and price-sensitive segment and is priced at c$35,000-55,000 (before government tax incentives), cheaper than the much more lucrative and less price-sensitive Model S/X segment costing c$70,000-plus. It also has a significant competitive advantage due to the chemistry of its cells giving it a total battery pack cost advantage of perhaps some $100/kWh over most competitors. The Gigafactory will lower the cost of the battery pack and to ensure access to sufficient batteries so that Tesla can meet its target for 2020 and beyond.
Tesla cars have been the only EVs with a range of well over 200 miles (but the Chevy Bolt will arrive by late 2016 and press reports suggest an updated e-Golf, expected in late 2016, may have a range of close to 200 miles). The cars are perceived to be well-engineered cars with high performance and a long battery range (for a relatively reasonable price); the Model S offers competitive performance relative to comparable premium ICE cars. Autopilot technology allows for a higher degree of autonomous driving than on other cars, and over-the-air updates enables Tesla to respond more quickly to competitor innovations and improve the system over time.
Key risks: 1) EV competition is about to increase sharply. Volkswagen, Daimler, GM and Ford are all bringing out new EV models over the next five years. 2) The strong US dollar has hurt margin directly, as Tesla’s costs are largely in US dollars, but it also raises the risk that the German OEMs and Japanese OEMs cut US prices. 3) The Model 3 segment is much more competitive than the Model S/X, and we think that Tesla will only be able to achieve a 16% gross margin in 2020 (it appears that consensus, however, assumes c20%). 4) Model S sales have done very well in the US but share there is peaking.
Summary: Tesla has done phenomenally well to design, develop and produce the Model S and achieve what appears to be a large cost advantage over competitors in its battery production. The question for investors is whether this is a good price to invest in the business. We think not and we note that the current enterprise value is roughly double that which we estimate the market is placing on Mercedes Cars. Tesla is a quality business and a better time to invest may come, but we cannot ignore the negative impact of the strong US dollar, the large investments being made by the German premium brands in EVs and autonomous driving and the structural scale advantages that they and the mass market OEMs have over Tesla. We do not think that the rise in the share of EVs is the dramatic game-changer for those OEMs which have invested in EVs and the modular strategy, eg the German premium brands, as some assume – indeed, in the end, customers buy cars not engines.

Berenberg Thematics
82
Tesla in pictures
Divisional revenue split (31 December 2014) Revenue progression
Source: Factset Source: Factset
Capex, CFO, CFF, cash (local Currency, m) Net debt/EBITDA
Source: Factset Source: Factset
Company information Share price and valuation
Source: Factset Source: Factset
Electric Vehicles & Electric Powertrain Components
-
500
1,000
1,500
2,000
2,500
3,000
3,500
2012 2013 2014
Group revenues
$ m
(500)
-
500
1,000
1,500
2,000
2,500
2012 2013 2014
Capex CFO CFF Cash
-10.0
-
10.0
20.0
30.0
40.0
50.0
60.0
2012 2013 2014
Net Debt / EBITDA
SharesSharesSharesShares
Share Price (LC) 162.60
Free float 74.6%
Shares Out (m) 130.951
Chairman / CEO Elon Reeve Musk
CFO Jason Wheeler
MUSK KIMBAL
ManagementManagementManagementManagement
Top Insiders / StakeholdersTop Insiders / StakeholdersTop Insiders / StakeholdersTop Insiders / Stakeholders
MUSK ELON REEVE
Toyota Motor Corp.
Panasonic Corp.
Valor Management Corp.
0
5
10
15
20
25
30
0
50
100
150
200
250
300
Share Price EV/Sales (RHS)

Berenberg Thematics
83
BYD (market cap: HKD126bn)
Business description: BYD is a leading Chinese automotive manufacturer with both a traditional ICV and EV offering. Similar to Tesla, BYD is vertically integrated and manufactures its own lithium ion (specifically LFP) batteries. It has three operating divisions: Rechargeable Batteries & Photovoltaic Systems, Automobiles and Mobile Handset Components & Assembly Services. The company is headquartered in Shenzhen, China and is listed on the Shenzhen and Hong Kong Stock Exchanges.
BYD developed its EV business with the creation of a JV with Daimler in 2011. It launched its Qin BEV (the best-selling EV in China) in 2014, which has helped it to sell more than twice the number of EVs than any of its domestic competitors (Zotye, BAIC and Cherry). BYD is also a global leader in electric public transportation: its EBs and taxis currently run in 160 cities in 40 countries. It has also developed a stationary storage business (residential and utility scale batteries) and last year supplied energy storage units with cumulative capacity of 57MWh.
Revenues generated by BYD’s EV business increased by nearly 6x to about RMB7,251m in 2014, accounting for 27.6% of the group’s Automobile business. Its sales volume of NEVs rose by 9x.
Growth outlook and opportunities: BYD remains the largest manufacturer of EVs in China and in H1 2015 it sold 19,789 vehicles (excluding buses), more than double the number that Zotye sold during the period (9,260). In order to grow its market share in EVs, its subsidiary, BYD Auto Finance Company, is collaborating with the Bank of Xi’an to provide loans to consumers and car dealers buying its vehicles.
BYD has also rapidly expanded its battery manufacturing capacity (to 10GWh at end-2015 from 6.5GWh). While this capacity should be enough for near-term demand growth, BYD intends to add 6GWh of battery manufacturing capacity per annum in case of stronger-than-anticipated demand for EVs and energy storage.
The company’s growth strategy is based on a “7+4” concept – ie it is introducing EVs in seven target markets (construction, trucks, inter-city transportation, sanitation vehicles, taxis, public buses and private cars) and four specific markets (ports, mines, airports and warehouses). The company has also opened an EB manufacturing plant in US and aims to expand its capacity over the next three years.
Key risks: 1) BYD’s primary exposure is to the Chinese transportation market and any abrupt end to state incentives for EVs will negatively affect BYD. 2) The company mainly relies on LFP technology (which has low energy density versus NMC and NCA) for its EVs, which as a result have a shorter range than the likes of the Tesla S. We think that BYD would need to move to NMC/NCA technology if it wants to grow its EV business outside of China. 3) The company is rapidly expanding its battery manufacturing capacity to 10GWh. If demand for its EVs fails to materialise (ie in the event of an economic slowdown in China), asset utilisation, margins and returns would be negatively affected.
Summary: BYD is one of the largest manufacturer of EVs and electric buses in China. It is rapidly expanding its battery manufacturing capacity over the next five years to cope with increased EV adoption globally. While the company has potential to expand its EV sales internationally it focus remains on China. While we remain bullish for EV growth outlook for China, rate of EV adoption could slowdown post 2017/18 as a result of the phased elimination of purchase subsidies on EVs by 2020. We think that BYD will need to target international markets which will require it to adopt NMC/NCA lithium ion technology.

Berenberg Thematics
84
BYD in pictures
Revenue split 31 December 2014 Revenue progression
Source: Factset
Source: BYD Annual Reports and Berenberg estimates. Note, “Battery” business here is defined as the rechargeable battery/PV business and the NEV business
Capex, CFO, CFF, cash (local currency, m) Net debt/EBITDA
Source: Factset Source: Factset
Company information Share price and valuation
Source: Factset Source: Factset
Automotive & Related Products
Cell Phone Accessories & Assembly
Rechargeable Battery Business
-
2,000
4,000
6,000
8,000
10,000
2012 2013 2014
Group revenues New energy division
$ m
(4,000)
(2,000)
-
2,000
4,000
6,000
8,000
10,000
12,000
2012 2013 2014
Capex CFO CFF Cash
-
2.0
4.0
6.0
8.0
10.0
2012 2013 2014
Net Debt / EBITDA
SharesSharesSharesShares
Share Price (LC) 36.20
Free float 75.3%
Shares Out (m) 915
Chairman & President Chuan Fu Wang
CFO Jing Sheng Wu, MBA, CPA
ManagementManagementManagementManagement
Top Insiders / StakeholdersTop Insiders / StakeholdersTop Insiders / StakeholdersTop Insiders / Stakeholders
Berkshire Hathaway, Inc.
WANG CHUAN FU
0
0.5
1
1.5
2
2.5
3
0
10
20
30
40
50
60
Share Price EV/Sales (RHS)

Berenberg Thematics
85
Maxwell Technologies (market cap: $0.2bn)
Business description: Maxwell Technologies is a leading global supplier of ultra-capacitors for transportation and grid applications. The company is headquartered in San Diego and has manufacturing and design facilities in the US, Switzerland and China. 75% of revenues come from selling ultra-capacitors, with 20% going into products for high-voltage grid equipment and 5% into specialist microelectronics (which the company views as non-core and has put up for sale).
Growth outlook and opportunities: The company generated $187m revenues in 2014 and $14m adjusted EBITDA. Consensus market expectations are for revenues to decline to $164m in 2015 and stay flat until 2017, the main reason for the fall being an expected reduction in sales in the Chinese hybrid bus market, which is changing incentive plans and which had grown rapidly in 2013/14. However, overall, Maxwell expects its addressable market to grow at a 20% CAGR from $600m in 2014 to $1.4bn by 2020, with growth particularly accelerating in 2018. This growth is expected to be driven by the increasing penetration of ultra-capacitors in: 1) stop-start technology in the automotive market, 2) the rail industry (brake-recuperation and wayside applications), 3) wind turbines (pitch control), 4) heavy duty trucks (engine start modules) and 5) power firming and microgrid markets within grid storage.
The company has been making good progress and has announced a number of large customer wins including supplying start-stop modules to GM for the Cadillac ATS Sedan, coupe and CTS, Peugeot, Lamborghini, Peterbilt, Kenworth, CAF and California Energy Commission. It is also in negotiations with automotive and truck OEMs on additional platforms and could announce wins in H1 2016.
Key risks: 1) The company has significant exposure to the Chinese hybrid bus market, which has seen booming sales due to incentives. However, these incentives have reduced from 1 January 2016 and hence could provide a significant headwind in 2016/17. 2) The company has yet to show a profit at the net profit line. 3) Ultra-capacitors remain a niche technology.
Summary: The company is set to see significant headwinds from its Chinese bus business in 2016 and the growth elsewhere may be more than offset by this. However, on a medium-term view, the company have a very strong market position in start-stop and in several niche applications highlighted above. The company has a net cash position and is also focusing on improving margins through a restructuring plan which also involves selling off non-core assets. Maxwell could be an interesting technology acquisition for one of the core battery companies. The stock has yet to break even at the bottom line but trades on sub-1x EV/sales.
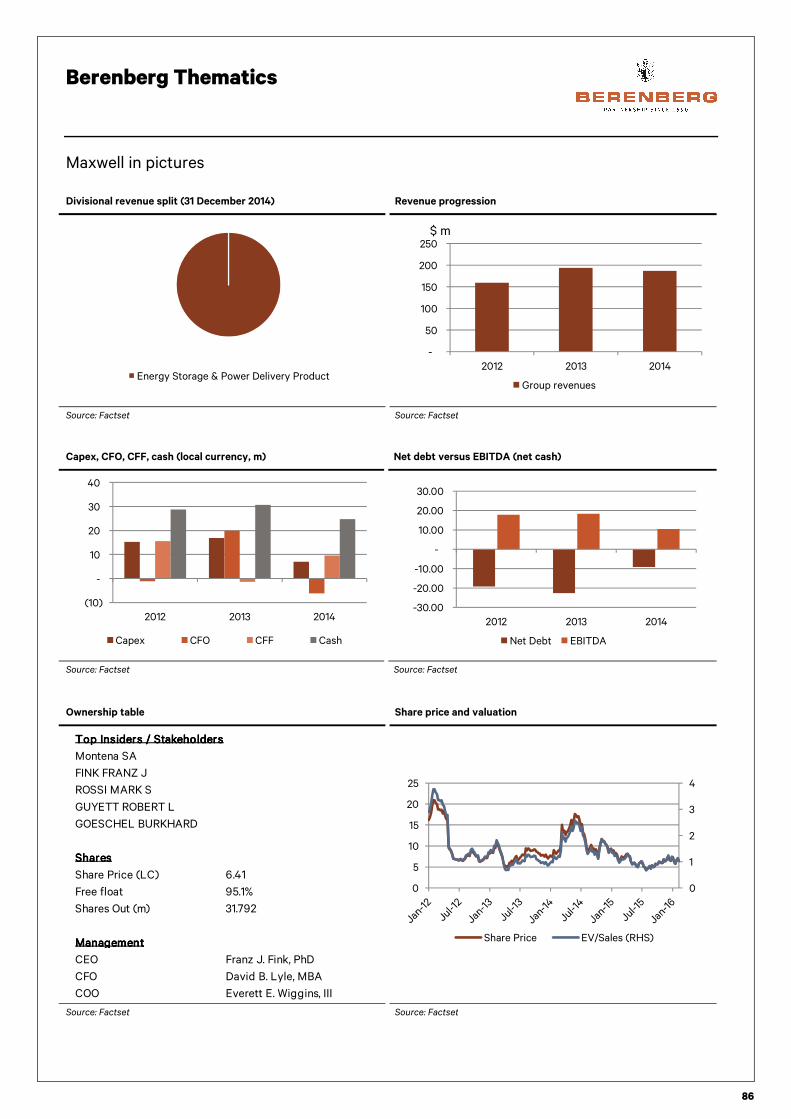
Berenberg Thematics
86
Maxwell in pictures
Divisional revenue split (31 December 2014) Revenue progression
Source: Factset Source: Factset
Capex, CFO, CFF, cash (local currency, m) Net debt versus EBITDA (net cash)
Source: Factset Source: Factset
Ownership table Share price and valuation
Source: Factset Source: Factset
Energy Storage & Power Delivery Product
-
50
100
150
200
250
2012 2013 2014
Group revenues
$ m
(10)
-
10
20
30
40
2012 2013 2014
Capex CFO CFF Cash
-30.00
-20.00
-10.00
-
10.00
20.00
30.00
2012 2013 2014
Net Debt EBITDA
SharesSharesSharesShares
Share Price (LC) 6.41
Free float 95.1%
Shares Out (m) 31.792
CEO Franz J. Fink, PhD
CFO David B. Lyle, MBA
COO Everett E. Wiggins, III
GOESCHEL BURKHARD
ManagementManagementManagementManagement
Top Insiders / StakeholdersTop Insiders / StakeholdersTop Insiders / StakeholdersTop Insiders / Stakeholders
Montena SA
FINK FRANZ J
ROSSI MARK S
GUYETT ROBERT L
0
1
2
3
4
0
5
10
15
20
25
Share Price EV/Sales (RHS)

Berenberg Thematics
87
Leclanché (market cap: CHF90m)
Business description: Leclanché is one of the oldest manufacturers of dry batteries (founded in 1909). It has restructured over the last 10 years to gain expertise in large format lithium ion technology and currently provides battery-based energy storage systems for stationary storage (utility scale off-grid and on-grid, residential and small industry) and mass transportation (buses, marine and industrial). The company also provides bespoke battery storage systems for different applications and this division, which contains some legacy activities, currently still forms more than 90% of its overall revenues. Leclanché’s headquarters are in Yverdon-les-Bains in Switzerland and it has a cell manufacturing plant in Germany.
Growth outlook and opportunities: The company generated CHF10.78m revenues in 2014 and -CHF16.92m adjusted EBITDA. In H1 2015, revenues fell by 37% yoy to CHF3.49 while losses at the EBITDA level expanded to CHF8.94m from a loss of CHF7.58m in H1 2014. High employee costs and financial expenses have been the main factors in the company’s deteriorating financial performance as Leclanché restructures from being a traditional dry cell manufacturer to a lithium ion battery manufacturer for the storage and transportation sectors. The company has been ramping up production from its new lithium ion cell manufacturing plant in Germany over the last 2-3 years and recently won a major $50m-70m contract in Ontario, Canada for one of the largest stationary systems ever installed with a capacity of 53MWh. Last year, Leclanché also won an €8m contract to install a 3.2MWh battery storage system at Graciosa island in the Azores, in partnership with Younicos.
Leclanché is one of the few battery manufacturers that specialise in LTO-based lithium ion cells which have a very high cycle life and charge faster than conventional lithium ion batteries. This makes these batteries ideal for transportation purposes (opportunity-based charging), for short-duration back-up power (for medical and telecoms applications, for example) and for renewables capacity firming and frequency smoothing at grid level. In addition, while the slow rate of charging exacerbates the range anxiety felt by many EB operators and car owners, LTO batteries could offer a solution as they charge up to four times faster than conventional lithium ion batteries (ie LFP, NCM, NCA) – although they are more expensive. Leclanché also produces on its same manufacturing plant graphite-NMC lithium-ion cells.
Key risks: 1) LTO-based batteries are more expensive than the LFP-based batteries because of their lower energy density and the lower manufacturing scale. Costs will need to come down before LTO batteries gain widespread adoption in the EB market. 2) Leclanché needs to increase manufacturing scale in order to compete. Leclanché’s battery plant can only manufacture 1m cells per annum, which is much smaller than the manufacturing capacity of the larger players such as Panasonic, LG Chem, Samsung and BYD. 3) Chinese players such as Yintong Group and Sichuan Xingneng have been adding LTO manufacturing capacity which could potentially commoditise the market, as they have already done for LFP-based cells in the past. 4) Leclanché’s funding requirements will remain high as it restructures and moves away from its legacy businesses. It also requires continued stream of new orders to improve plant utilisation and cover its high fixed costs.
Summary: Leclanché has gained expertise in both LTO- and NMC-based lithium ion technologies, which we think will be the two dominant technologies used in transportation and stationary storage. It now provides fully integrated battery energy storage systems dedicated to industrial applications. Leclanché needs to compete against the larger incumbents in a market where margins have already been competed away. In its selected niche markets, and despite its clear focus on industrial applications, it remains to be seen whether the company can successfully carve out a decent market share. The company continues to innovate on a cell level and needs to continue to restructure in order to improve margins and win contracts to meet its fixed cost base. We think that Leclanché could be an attractive acquisition target for the larger, traditional battery manufacturers that currently lack expertise in lithium ion technologies.

Berenberg Thematics
88
Leclanché in pictures
Divisional revenue split (31 December 2014) Revenue progression
Source: Factset Source: Factset
Capex, CFO, CFF, cash (local currency, m) Net debt versus EBITDA
Source: Factset Source: Factset
Ownership table Share price and valuation
Source: Factset Source: Factset
Portable Distribution
Stationery Group Central Costs
0
5
10
15
2012 2013 2014
Group revenues
$ m
(20)
(10)
-
10
20
30
40
2012 2013 2014
Capex CFO CFF Cash
-20.00
-15.00
-10.00
-5.00
-
5.00
10.00
15.00
2012 2013 2014
Net Debt EBITDA
SharesSharesSharesShares
Share Price (LC) 2.52
Free float 44.4%
Shares Out (m) 37.903
CEO Anil Srivastava, EMBA
CFO Hubert Angleys
ACE & Company SA
ManagementManagementManagementManagement
Top Insiders / StakeholdersTop Insiders / StakeholdersTop Insiders / StakeholdersTop Insiders / Stakeholders
Golden Partner International SA SPF
Recharge Holdings Ltd.
Logistable Ltd.
Castle & Key Fund Plc
0
2
4
6
8
10
12
14
0
5
10
15
20
Share Price EV/Sales (RHS)

Berenberg Thematics
89
Johnson Controls (market cap: $22.5bn)
Business description: Following the intended spin-off of its automotive seating business Adient in October 2016, Johnson Controls (JCI) is set to become a c$21bn business consisting of Power Solutions (batteries, $7bn) and Building Efficiency (HVAC, building controls, refrigeration systems, $14bn). The company is guiding for margins of around 17% in Power Solutions in 2016 and 9.5-10.5% in Building Efficiency with expected growth of 9-11% and 4-6% respectively. In the power solutions sector, in which it is the world’s largest player with a 36% market share and 146m batteries sold in 2014, 75% of sales are aftermarket-related, 99% of the batteries are recycled and 80% of each new battery is made up of recycled materials. Currently, 85% of battery revenue is in traditional SLI (starting, lighting and ignition) lead acid, although considerable investment is going into its AGM/EFB (absorbent glass mat and enhanced flood batteries) technology which is used in start-stop and micro-hybrid applications. It has a small (3%) exposure to lithium ion. 50% of sales are in North America, 33% in EMEA, 10% in Asia and 7% in Latin America. On 25 January 2016, JCI announced that it had entered into a definitive merger agreement with Tyco, a global fire and security provider. JCI shareholders will own 56% of the equity of the combined company and receive an aggregate cash consideration of $3.9bn. Following the merger, it will be a $32bn revenue business with EBITDA of $4.5bn. Its exposure to batteries will drop to 20% of revenues from 33%, although as they are higher-margin, EBITDA exposure will be around 27%.
Growth outlook and opportunities: Within its Power Solutions business, the key growth opportunity is in start-stop technology for automotive applications, where it sees the world market growing from 22m vehicles today to 56m by 2020, with penetration rates of 85% in Europe and 40% in the US/China. As global leader, it is investing $555m in new AGM capacity between 2011-2020 to maintain that advantage, doubling capacity to 27m units by 2020 from 12.5m in 2015. On top of the opportunities in automotive, it also sees a growth opportunity in global energy storage with lithium ion and lead acid batteries and synergies with its Building Controls business both in-front-of- and behind-the-meter. It predicts a $19bn distributed storage market by 2020 (a 7% CAGR).
Key risks: 1) Following the Adient spin-off, two-thirds of the business in terms of revenues remains outside of the high-growth, higher-margin Power Solutions business. 2) Heavy investments in new battery capacity/technology may dilute margins in the short to medium term. 3) JCI has only minimal exposure to lithium ion and ultra-capacitor technology, although it is investing to catch-up. 4) There is uncertainty about how the spin-off will affect the balance sheet and final P&L of JCI.
Summary: Given its dominant position in global automotive SLI batteries, JCI looks well positioned to capitalise on the move towards start-stop technology given its existing relationships with OEMs and trusted position within the supply chain. That is assuming that AGM technology can compete favourably with lithium ion and ultra-capacitors. Current consensus numbers still include the spun-off automotive business, inflating revenue by $17bn and EBIT by c$1bn. The remaining business should deliver around $21bn of revenues and $2.5bn of EBIT, according to management guidance. More details of the spin-off will be given in March or April. Following this, we should obtain greater clarity about the remaining business and how the market will value a business that should see strong top-line growth in the Power Solutions division and in its Building Efficiency business which should benefit from a recovery in US construction. If the company can successfully achieve its goal of closing the valuation gap with targeted multi-industry peers such as Eaton, Honeywell, 3M and Emerson, there would be a substantial re-rating impact on the shares.
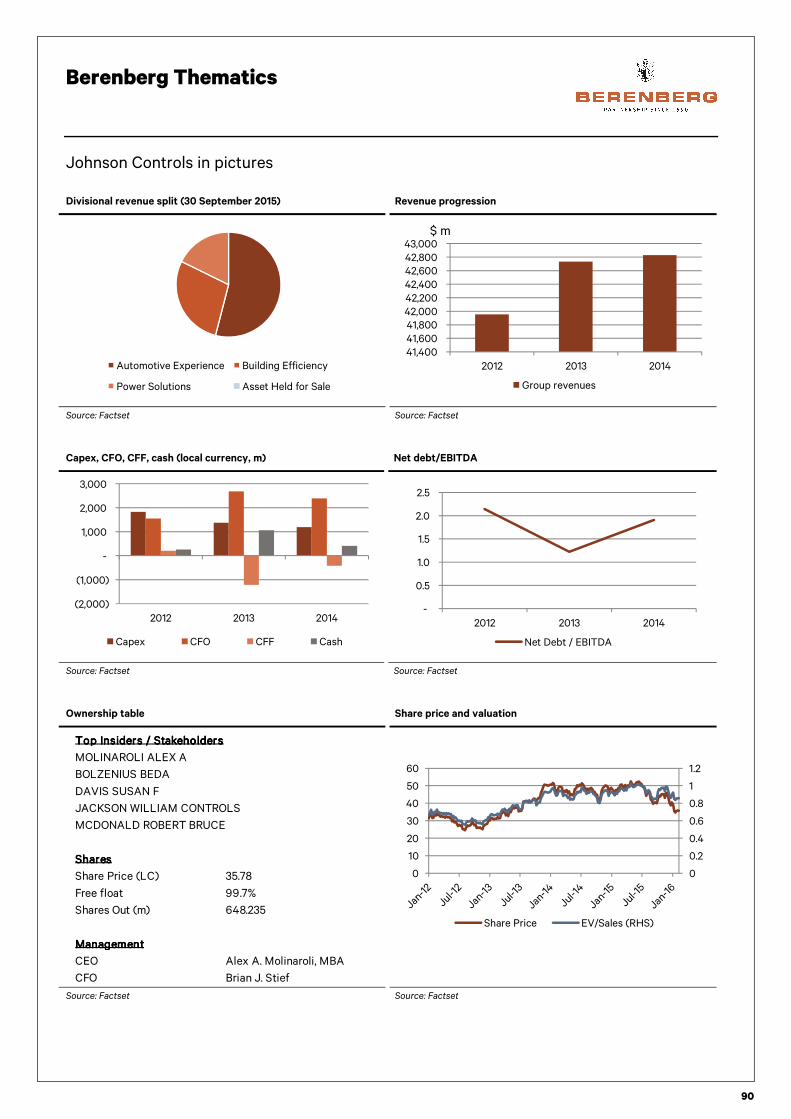
Berenberg Thematics
90
Johnson Controls in pictures
Divisional revenue split (30 September 2015) Revenue progression
Source: Factset Source: Factset
Capex, CFO, CFF, cash (local currency, m) Net debt/EBITDA
Source: Factset Source: Factset
Ownership table Share price and valuation
Source: Factset Source: Factset
Automotive Experience Building Efficiency
Power Solutions Asset Held for Sale
41,400
41,600
41,800
42,000
42,200
42,400
42,600
42,800
43,000
2012 2013 2014
Group revenues
$ m
(2,000)
(1,000)
-
1,000
2,000
3,000
2012 2013 2014
Capex CFO CFF Cash
-
0.5
1.0
1.5
2.0
2.5
2012 2013 2014
Net Debt / EBITDA
SharesSharesSharesShares
Share Price (LC) 35.78
Free float 99.7%
Shares Out (m) 648.235
CEO Alex A. Molinaroli, MBA
CFO Brian J. Stief
MCDONALD ROBERT BRUCE
ManagementManagementManagementManagement
Top Insiders / StakeholdersTop Insiders / StakeholdersTop Insiders / StakeholdersTop Insiders / Stakeholders
MOLINAROLI ALEX A
BOLZENIUS BEDA
DAVIS SUSAN F
JACKSON WILLIAM CONTROLS
0
0.2
0.4
0.6
0.8
1
1.2
0
10
20
30
40
50
60
Share Price EV/Sales (RHS)

Berenberg Thematics
91
Infineon Technologies (Buy, PT €15.00; market cap: €11.9bn)
Berenberg analyst: Tammy QiuBerenberg analyst: Tammy QiuBerenberg analyst: Tammy QiuBerenberg analyst: Tammy Qiu
Business description: Infineon Technologies is a world leader in semiconductor solutions. It supplies chips to the automotive, industrial power control, power management, chip card and security markets. It is the third-largest semiconductor chip vendor in the automotive, chip card and security market, and the biggest semiconductor chip vendor in the industrial power control and power management market. Infineon has four divisions: Automotive, Industrial Power Control (IPC), Power Management & Multimarket (PMM) and Chip Card and Security (CCS). Automotive is the largest. It generates close to c40% revenue in that market, c20% from IPC, 31% revenue from PMM after the IRF acquisition, and the remainder from CCS. Over time, the auto segment’s margin has proved relatively stable and has moved in line with the revenue level. IPC is very sensitive to revenue levels, which can fluctuate. PMM has the highest segment margin within the company. CCS’s margin has structurally improved from 2015 given the tailwind from EMV migration in China and the US.
Growth outlook and opportunities: Infineon’s key strength is its broad product offering, and its dominant share in the power semi market. It uses its power transistor, MCU and sensor expertise to build modules for a range of applications, such as energy efficiency improvement, power supply management and engine management for the auto/ industrial/consumer markets. Its chip card solutions improve security for bank card payments, mobile payments and IDs. It also manufactures radio frequency switches and silicon microphones for the mobile market, as well as power management solutions.
We expect semi content within vehicles to continue to grow, fuelled by rising requirements for ADAS, other safety applications and power efficiency improvement. EVs and HEVs will have a significant effect on semi content growth, but that market is still growing slowly.
EV/HEV vehicles use battery-stored electricity to power the engine. Such systems typically require 2x more semis. It is important for manufacturers to improve powertrain technology so they can address government emission mandates for fuel efficiency. Battery costs, however, are the biggest hurdle to wider adoption of EVs. We expect EVs to account for 4% of total vehicle volume sales by 2020. Infineon estimates that each PHEV will contain $710 of semi content, while PEVs will contain around $704-worth of chips per car. This is more than double the $338 of semi content in a typical ICV. The market growth is mainly driven by the higher power efficiency and, latterly, the adoption of EVs/HEVs in the auto market.
Key risks: 1) Macroeconomic weakness: Infineon generates c70% of its revenue from the auto and industrial markets, which are sensitive to the economic cycle. 2) Qimonda litigation may incur further payments. Qimonda was Infineon’s memory business, which it carved out in 2006. In 2009, Qimonda filed an insolvency application in Munich’s local court. As at the end of September 2015, Infineon had a €55m provision on its balance sheet, down from €315m in September 2014 following the payments it made in partial settlement. 3) FX rate movement: Infineon benefited from the depreciation of the EUR against the USD at the beginning of 2015. It reports in EUR and receives a big portion (~50%) of its revenue in foreign currencies including USD. The company has noted previously that a €0.01 appreciation against the USD would negatively affect its revenue by €8m a quarter, and operating profit by €2m-2.5m a quarter.
Summary: Infineon has broad exposure to autos and set to benefit from semi content growth from greater use of sensors in vehicles as they become smarter and eventually become driverless. In addition, semi content for a PEV is more than double versus and ICV and the increasing penetration for EVs should boost semi sales for the automotive sector. Infineon has built a sizable 9% market share in the automotive market and it is the third-largest supplier of semi conductors to the automotive sector after NXP & Freescale and Renesas. We think that the company is positioned well to benefit from the ongoing electrification of the transport sector.

Berenberg Thematics
92
Infineon in pictures
Divisional revenue split (30 September 2015) Revenue progression
Source: Factset Source: Factset
Capex, CFO, CFF, cash (local currency, m) Net debt versus EBITDA (Net cash)
Source: Factset Source: Factset
Ownership table Share price and valuation
Source: Factset Source: Factset
Automotive
Power Management & Multimarket
Industrial Power Control
Chip Card & Security
4,600
4,800
5,000
5,200
5,400
5,600
5,800
6,000
2012 2013 2014
Group revenues
$ m
(500)
-
500
1,000
1,500
2,000
2,500
3,000
2012 2013 2014
Capex CFO CFF Cash
-2,500.00
-2,000.00
-1,500.00
-1,000.00
-500.00
-
500.00
1,000.00
1,500.00
2012 2013 2014
Net Debt EBITDA
SharesSharesSharesShares
Share Price (LC) 11.07
Free float 100.0%
Shares Out (m) 1130.985
CEO Reinhard Ploss, PhD
CFO Dominik Asam, MBA
ManagementManagementManagementManagement 0
0.5
1
1.5
2
2.5
3
0
5
10
15
Share Price EV/Sales (RHS)

Berenberg Thematics
93
Ceres Power (market cap: £50m)
Business description: Ceres Power is leading developer of low-cost solid oxide fuel cells which are ideal for combined heat and power (CHP) systems for homes and for back-up power. The company was formed 10 years ago and is headquartered in Horsham, UK. Ceres fuel cells are able to function at significantly lower temperatures (ie 500-600°C) versus as high as 1,000°C for competing solid-oxide-based fuel cell technologies. This helps Ceres use standard equipment, manufacturing techniques and materials (low-cost steel and non-exotic ceramics) for cell construction, which leads to significantly lower manufacturing cost and greater durability of the cell (seven years versus less than five years for other high-temperature fuel cells).
Ceres believes that its strength lies in research and development rather than directly commercialising the technology. It hence aims to make money by licensing its technology to larger OEMs which have the manufacturing scale and established product base, clientele and brand.
Growth outlook and opportunities: Ceres fuel cells are able to work on natural gas which makes them ideal for distributed power generation through utilising existing natural gas infrastructure. The two key growth segments for Ceres are residential and commercial boiler markets as well as back-up power for data centres. Management believes that it has a long-term market opportunity to generate royalty revenues of more than £1bn from residential, commercial and back-up power for data centres, assuming a 20% global market share. The company aims to have five global OEMs licensing its technology within two years. It continues to have commercial success with partners including Navien (South Korea’s largest boiler company, selling 1m boilers pa), Cummins (a back-up power generator manufacturer in the US), Japan Power Co and Honda.
Key risks: 1) Ceres’s cash burn from operating activities is ~£8m pa and its cash balance at end-June 2015 stood at £12m. We believe Ceres will continue to raise funds to finance growth which creates dilution risks for current shareholders. 2) Ceres’s main assets are its technology and its people. Failure to protect its intellectual property and prevent key personnel from leaving are significant risks.
Summary: Ceres has developed a unique low-cost fuel cell technology which could disrupt the centralised power generation sector. The technology utilises existing natural gas infrastructure rather than pure hydrogen, which substantially improves its market appeal. Increasing the manufacturing scale to bring down costs will determine the speed of consumer adoption and the level of financial success for Ceres. The strength of its fuel cell technology seems apparent from the strong interest by global OEMs such as Honda, Navian and Cummings.

Berenberg Thematics
94
Ceres in pictures
Divisional revenue split (30 June 2015) Revenue progression
Source: Factset Source: Factset
Capex, CFO, CFF, cash (local currency, m) Net debt versus EBITDA (net cash)
Source: Factset Source: Factset
Ownership table Share price and valuation
Source: Factset Source: Factset
Fuel Cell Technology
0.0
0.5
1.0
1.5
2.0
2.5
2012 2013 2014
Group revenues
$ m
(20)
(15)
(10)
(5)
-
5
10
15
20
2012 2013 2014
Capex CFO CFF Cash
-18.00-16.00-14.00-12.00-10.00-8.00-6.00-4.00-2.00 -
2012 2013 2014
Net Debt EBITDA
SharesSharesSharesShares
Share Price (LC) 0.07
Free float 50.3%
Shares Out (m) 772.5379
CEO Philip Joseph Caldwell, MBA
CFO Richard Preston
COO James Falla
CALLAGHAN STEPHEN JAMES
ManagementManagementManagementManagement
Top Insiders / StakeholdersTop Insiders / StakeholdersTop Insiders / StakeholdersTop Insiders / Stakeholders
GRIFFITHS RICHARD IAN
IP Group Plc /Venture Capital/
GB Gas Holdings Ltd.
Imperial College London
-100
-50
0
50
100
150
200
0
0.02
0.04
0.06
0.08
0.1
0.12
Share Price EV/Sales (RHS)
Berenberg Thematics
95
Intelligent Energy (market cap: £55m)
Business description: UK AIM-listed Intelligent Energy (IE) develops high efficiency hydrogen fuel cells for the consumer, automotive and distributed power generation markets. In consumer electronics, the company manufactures portable hydrogen fuel cells to charge electronic devices such as mobile phones and laptops. We see this having significant potential in emerging economies with unreliable grid connections. On the automotive side, IE licenses its technology to OEMS and is currently licensing fuel cell technology to Suzuki and two other Asian and European OEMs. In distributed power generation and distribution, it recently won a 10-year £1.2bn contract to manage 27,400 telecoms towers in India.
Growth outlook and opportunities: IE has significantly improved its automotive fuel cell technology since 2008 and more than doubled the power density of its fuel cells. According to its own benchmarking exercise, its fuel cells have five times more volumetric power density versus competitors, even claiming that its technology is superior to leading FCEV manufacturer Toyota. We see the signing of a licensing agreement with a new OEM partner as a potential near-term catalyst. This is likely for two reasons: 1) increased deployment of hydrogen refuelling to meet aggressive national targets in Germany and Japan; and 2) the high R&D costs with long lead times (15-20 years) associated with developing fuel cells. We believe that licensing IE’s technology will be seen as a quicker and simpler route to develop FCEV offerings.
In Q4 2015, IE announced that it will purchase contracts from GTL Limited for £85m for providing power management services to 27,400 telecoms towers. The services agreement accounts for £1.2bn of revenues over the next 10 years with an annual run rate of £120m revenues and £17m EBITDA (margin 14.2%). Management claims that the EBITDA margin profile of the contract can be increased to more than 30% through efficiency gains achieved with the adoption of its proprietary remote engine health monitoring programme (-18% diesel usage reduction on test sites in four months) and through replacing diesel generators with fuel cells. IE is aiming to grow its power management business with a medium-term target of 125,000-135,000 telecoms towers (425,000 in India). The potential to grow is substantial, not just in India but in other emerging Asian and African countries with unreliable electricity grids.
Key risks: The key issue being faced by IE is funding. 1) The company is facing a monthly cash burn of £3.5m (down from £4.6m over 2014-15) and the closing cash balance at the end of Q3 2015 stood at £24.2m. 2) The company also needs to pay £25m for its acquisition of GTL contracts and hence the cash funding need for 2016 will be around £65m-75m. IE is already in negotiations with industrial partners such as Air Liquide to raise funding through convertible bonds or by selling a 24.9% stake in its Indian business through its subsidiary and holding company in Singapore. 3) We think that high execution risk is involved in its power management contract in India. Poor execution of the contract could eat away at the contract margins and the targets which have been set by IE.
Summary: IE is set to see significant growth in earnings provided that it is able to execute the large £1.2bn telecoms tower management contract in India over the next 10 years. On a medium-term view, signing of licensing agreements with new automotive OEMs for its hydrogen fuel cell technology would be a major catalyst for the stock. In addition, IE could be an attractive technology acquisition for larger OEMs lacking expertise in hydrogen fuel cells.

Berenberg Thematics
96
Intelligent Energy in pictures
Divisional revenue split (30 September 2015) Revenue progression
Source: Factset Source: Factset
Capex, CFO, CFF, cash (local currency, m) Net debt versus EBITDA
Source: Factset Source: Factset
Company information Share price and valuation
Source: Factset Source: Factset
Distributed Power & Generation
Motive
Consumer Electronics
-
20
40
60
80
2012 2013 2014
Group revenues
$ m
(100)
(50)
-
50
100
150
2012 2013 2014
Capex CFO CFF Cash
-100.00
-80.00
-60.00
-40.00
-20.00
-
20.00
2012 2013 2014
Net Debt EBITDA
SharesSharesSharesShares
Share Price (LC) 0.31
Free float 63.0%
Shares Out (m) 188.3255
CEO Henri Winand, PhD, MBA
CFO Mark Lawson-Statham, PhD
COO Garrett Forde, MBA
MITCHELL PHILIP
ManagementManagementManagementManagement
Top Insiders / StakeholdersTop Insiders / StakeholdersTop Insiders / StakeholdersTop Insiders / Stakeholders
Meditor Group Ltd.
Evolution Placements Corp.
Yukos International Uk BV
Royalton Percy LLC
0
10
20
30
40
50
0
0.5
1
1.5
2
2.5
3
3.5
Share Price EV/Sales (RHS)

Berenberg Thematics
97
24M (private)
Business description: US-based 24M is a private research and development start-up working on next-generation lithium ion batteries. It is experimenting with working on a radically different cell design for the lithium ion battery which can both significantly increase energy density and lower cost by lowering the number of manufacturing steps and by utilising standard manufacturing processes. The cell format is based on semi-solid electrodes and so does not require organic solvents or inactive separating layers in the cell. According to 24M, this cell design leads to an 84% reduction in inactive material and hence a subsequent increase in the energy density of the cell at half the manufacturing cost. The manufacturing process uses off-the-shelf machinery which means that the requi9red capex is 30-50% lower than conventional lithium ion technologies.
Growth outlook and opportunities: If 24M is able to remove any remaining operational issues with its technology and scale up the manufacturing process, we think that it could disrupt the traditional lithium ion battery manufacturers. We think that the strongest demand will be in the high-energy and lower-power storage applications, which are primarily storage requirements for utilities, residential scale and for powering electronics. We hence think that the battery manufacturers which will be the most severely affected would be the Chinese companies that currently dominate the LCO and LFP space.
Key risks: 1) 24M has not publically shared important specifications about its battery, such as the all-important cycle life. If the cycle life of the 24M battery technology is less than 5,000 cycles, we doubt that it will make much headway in residential or large-scale storage applications. 2) It will be a challenge for 24M to scale up from the laboratory to manufacturing level: a number of start-ups including A123 (which was established by same founders as 24M) failed due to execution challenges.
Summary: 24M is working on the fringes of research on the next-generation lithium ion batteries. Its semi-solid electrodes could potentially provide the next step-up in energy density while reducing cell costs to below $100/kWh. Provided that 24M has resolved the cycle issues suffered by most new battery technology such as lithium sulphur and lithium air, the semi-solid lithium ion technology could play a critical role in stationary storage applications at residential and grid level and power electronic devices.
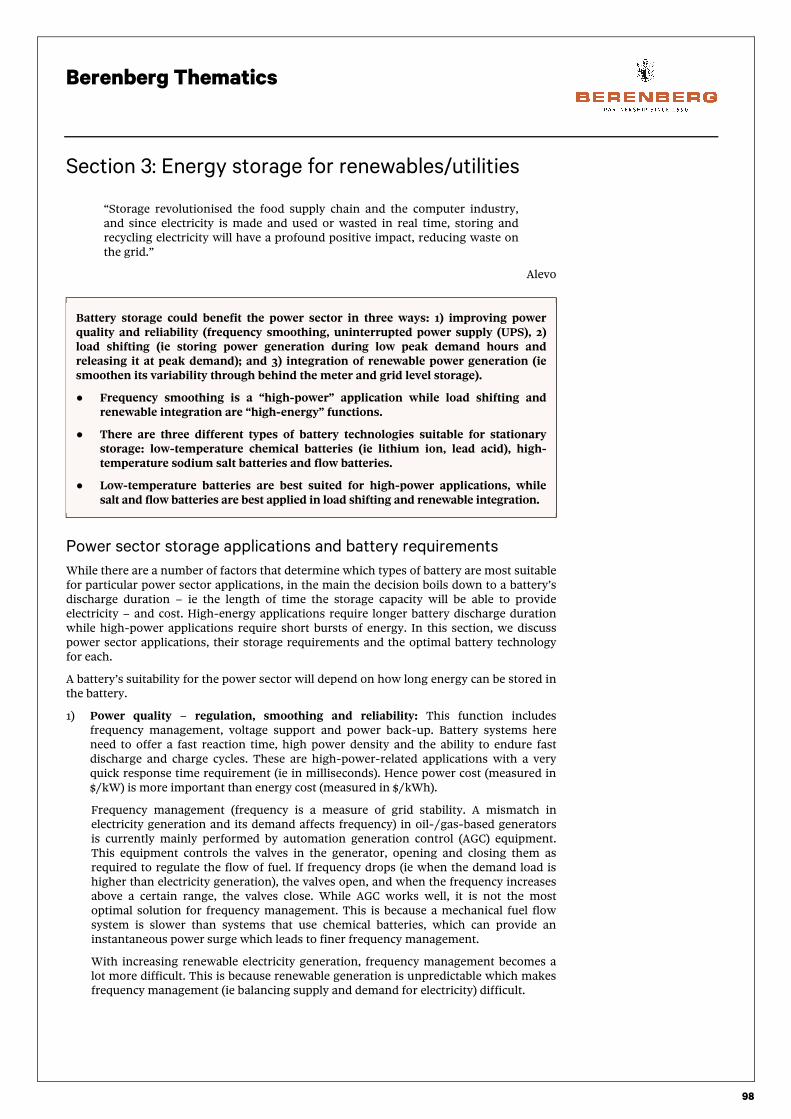
Berenberg Thematics
98
Section 3: Energy storage for renewables/utilities
“Storage revolutionised the food supply chain and the computer industry, and since electricity is made and used or wasted in real time, storing and recycling electricity will have a profound positive impact, reducing waste on the grid.”
Alevo
Power sector storage applications and battery requirements
While there are a number of factors that determine which types of battery are most suitable for particular power sector applications, in the main the decision boils down to a battery’s discharge duration – ie the length of time the storage capacity will be able to provide electricity – and cost. High-energy applications require longer battery discharge duration while high-power applications require short bursts of energy. In this section, we discuss power sector applications, their storage requirements and the optimal battery technology for each.
A battery’s suitability for the power sector will depend on how long energy can be stored in the battery.
1) Power quality – regulation, smoothing and reliability: This function includes frequency management, voltage support and power back-up. Battery systems here need to offer a fast reaction time, high power density and the ability to endure fast discharge and charge cycles. These are high-power-related applications with a very quick response time requirement (ie in milliseconds). Hence power cost (measured in $/kW) is more important than energy cost (measured in $/kWh).
Frequency management (frequency is a measure of grid stability. A mismatch in electricity generation and its demand affects frequency) in oil-/gas-based generators is currently mainly performed by automation generation control (AGC) equipment. This equipment controls the valves in the generator, opening and closing them as required to regulate the flow of fuel. If frequency drops (ie when the demand load is higher than electricity generation), the valves open, and when the frequency increases above a certain range, the valves close. While AGC works well, it is not the most optimal solution for frequency management. This is because a mechanical fuel flow system is slower than systems that use chemical batteries, which can provide an instantaneous power surge which leads to finer frequency management.
With increasing renewable electricity generation, frequency management becomes a lot more difficult. This is because renewable generation is unpredictable which makes frequency management (ie balancing supply and demand for electricity) difficult.
Battery storage could benefit the power sector in three ways: 1) improving power quality and reliability (frequency smoothing, uninterrupted power supply (UPS), 2) load shifting (ie storing power generation during low peak demand hours and releasing it at peak demand); and 3) integration of renewable power generation (ie smoothen its variability through behind the meter and grid level storage).
● Frequency smoothing is a “high-power” application while load shifting and renewable integration are “high-energy” functions.
● There are three different types of battery technologies suitable for stationary storage: low-temperature chemical batteries (ie lithium ion, lead acid), high-temperature sodium salt batteries and flow batteries.
● Low-temperature batteries are best suited for high-power applications, while salt and flow batteries are best applied in load shifting and renewable integration.

Berenberg Thematics
99
Gas-/diesel-based peaker plants are used for load levelling in the power sector; generators are used
for frequency smoothing
Source: Utility Scale Energy Storage Systems – State Utility Forecasting Group
2) Grid support for peak load management: Load shifting (ie storing excess generation at low electricity demand times and releasing them at peak demand) is required to meet changes in electricity demand on the grid during the course of each day. This is a high-energy requirement and the battery system needs to have sufficient energy capacity to cope with daily fluctuations in electricity demand. Hence high cycle life, thermal stability and low energy storage costs ($/kWh) are extremely important.
Currently gas-/diesel-based thermal power plants are used to generate additional electricity for load management. In addition utility companies generally also maintain reserve power equivalent to their largest power generating unit in case there is unplanned downtime. This reserve power is currently provided by expensive oil-/gas-fired peaker plants which have a fast response time. However, gas-/oil-fired generators and peaker plants suffer from poor utilisation rates. The use of batteries for both frequency smoothing and load management can radically improve the efficiency/ utilisation of the grid.
Batteries could play an important load management role, either “behind-the-meter” (ie via storage capacity installed by consumers) or provided by the utilities themselves. High cycle life, high-energy storage capacity and low-energy storage costs will determine whether batteries will be more cost effective than peaker plants.
The use of battery storage can lead to a flattening of the load
curve…
…which results in an improvement in the average utilisation of
the fuel-based turbines currently used for load shifting and
frequency smoothing
Source: IRENA, ERPI Source: IRENA, ERPI

Berenberg Thematics
100
3) Decentralised battery storage linked with distributed electricity generation: The growing use of renewable electricity from wind and solar sources significantly increases load management requirements for the power grid. Batteries can play an important role in the load shifting of renewable power generation especially for isolated communities where the costs associated with grid connection can be prohibitive.
Companies such as Tesla, Ambri and Acquin already offer energy storage for residential and commercial use. Stationary storage systems required for renewable generation should also be efficient at undergoing daily deep discharge cycles to charge during the day and provide electricity at night. High cycle life, low energy storage costs and high efficiency are thus very important qualities for batteries in applications such as these.
The share of renewable power generation in the total electricity
mix has been rising in OECD countries…
…creating a need for batteries in the load shifting of this
inherently unstable electricity supply
Source: IRENA 2015 Source: Alevo Battery Storage System
Revenue stacking Revenue stacking Revenue stacking Revenue stacking –––– utilityutilityutilityutility----scale battery storage can provide multiple benefits scale battery storage can provide multiple benefits scale battery storage can provide multiple benefits scale battery storage can provide multiple benefits
Power storage capability enables utilities to carry out functions such as load shifting to frequency regulation. These multiple services, also called revenue stacking, significantly improve the cost effectiveness of storage systems. According to a recent study by Electric Power Research Institute (EPRI) in California, revenue stacking allows utility-scale storage to achieve a breakeven cost of $664/kWh, far higher than the $250/kWh utility-scale storage system announced by Tesla. This highlights that the cost of batteries is moving significantly lower than the breakeven cost of batteries if they serve multiple services. Hence utilities would have significant interest in moving to stationary storage and away from inefficient peaker plants.
0% 20% 40% 60% 80%
DenmarkGermany
United KingdomAustraliaSpain
MoroccoUnited States
MexicoItaly
FranceSaudia Arabia
JapanUAE
WORLDChinaIndia
TurkeyArgentina
VRE share in
annual electricityproduction (2014)
Additional VREshare in annual
electricity
production (2014-
2030)

Berenberg Thematics
101
Utility-scale storage has a breakeven cost of $664/kWh according to EPRI, which is cost-effective at
the current levels
Source: Electric Power Research Institute (EPRI)
Optimal battery technology is different for each applicationOptimal battery technology is different for each applicationOptimal battery technology is different for each applicationOptimal battery technology is different for each application
As discussed earlier, electricity storage requirements for power, response time, energy capacity and cycle life vary according to different end-uses within the power sector.
Applications related to electricity quality, ie frequency smoothing, voltage support and back-up power, require:
1) high power density to provide a quick power surge; and
2) low power cost in $/kW terms.
The integration of renewables into the grid and load shifting applications for utilities are high energy applications thus require energy storage systems with:
1) high energy efficiency;
2) long discharge duration; and
3) a minimum cycle life of a few thousand charge/discharge cycles.
The chart on the left below summarises the power and energy capacity requirements for different end-uses. The chart below right shows different battery technologies and their rated power, energy and discharge duration.
Key Assumptions:Key Assumptions:Key Assumptions:Key Assumptions:
•••• Year = 2015• • • • California Market
• 50 MW, 4 hr battery
• Energy and Ancillary Services prices escalated
3%/yr (CAISO 2011 base yr)
• CapEx = $1,772/KW
• No Battery Replacements
• 11.5% discount rate
• 75% round trip efficiency
Key Findings:Key Findings:Key Findings:Key Findings:
• Breakeven cost = $2,657/KW; $664/kWh
0
50
100
150
200
250
Costs Benefits
Flow BatteryFlow BatteryFlow BatteryFlow Battery
Capital Expenditure
Synchronous Reserve(Spin)
Operating Costs
Non-synchronousReserve (Non-spin)
Financing Costs
System ElectricSupply Capacity
Taxes (refund or paid)
Frequency Regulation
Electricity Sales
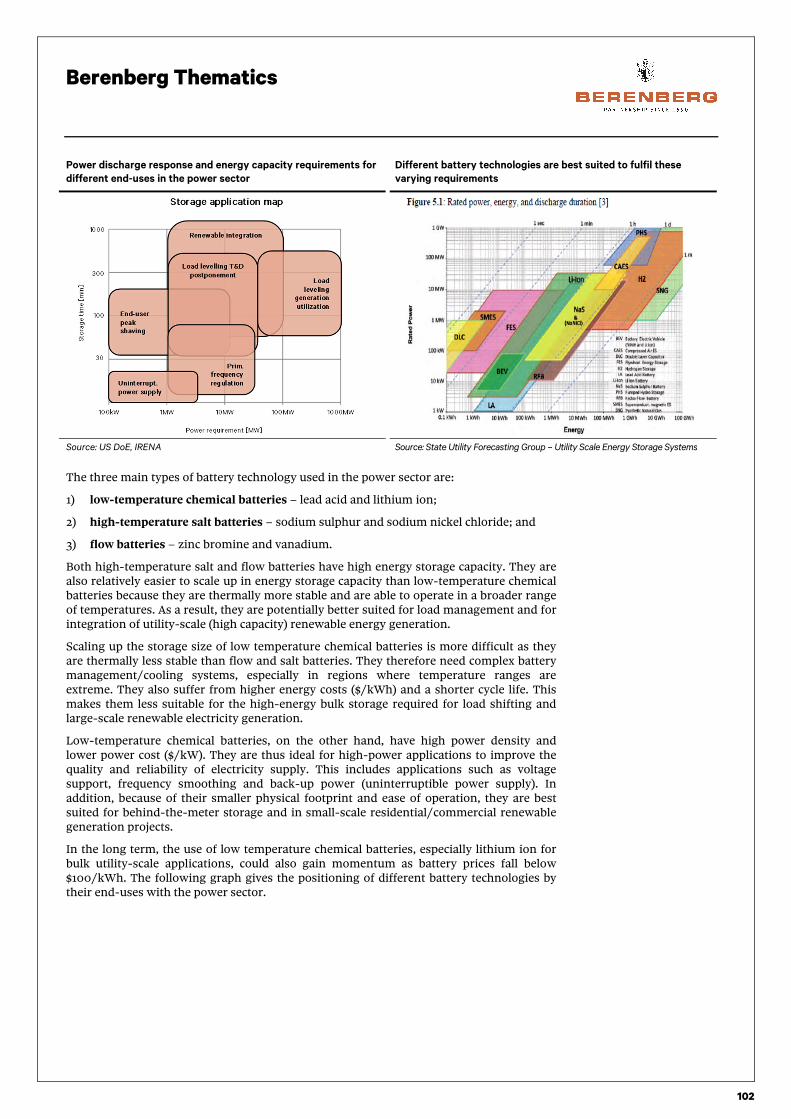
Berenberg Thematics
102
Power discharge response and energy capacity requirements for
different end-uses in the power sector
Different battery technologies are best suited to fulfil these
varying requirements
Source: US DoE, IRENA Source: State Utility Forecasting Group – Utility Scale Energy Storage Systems
The three main types of battery technology used in the power sector are:
1) low-temperature chemical batteries – lead acid and lithium ion;
2) high-temperature salt batteries – sodium sulphur and sodium nickel chloride; and
3) flow batteries – zinc bromine and vanadium.
Both high-temperature salt and flow batteries have high energy storage capacity. They are also relatively easier to scale up in energy storage capacity than low-temperature chemical batteries because they are thermally more stable and are able to operate in a broader range of temperatures. As a result, they are potentially better suited for load management and for integration of utility-scale (high capacity) renewable energy generation.
Scaling up the storage size of low temperature chemical batteries is more difficult as they are thermally less stable than flow and salt batteries. They therefore need complex battery management/cooling systems, especially in regions where temperature ranges are extreme. They also suffer from higher energy costs ($/kWh) and a shorter cycle life. This makes them less suitable for the high-energy bulk storage required for load shifting and large-scale renewable electricity generation.
Low-temperature chemical batteries, on the other hand, have high power density and lower power cost ($/kW). They are thus ideal for high-power applications to improve the quality and reliability of electricity supply. This includes applications such as voltage support, frequency smoothing and back-up power (uninterruptible power supply). In addition, because of their smaller physical footprint and ease of operation, they are best suited for behind-the-meter storage and in small-scale residential/commercial renewable generation projects.
In the long term, the use of low temperature chemical batteries, especially lithium ion for bulk utility-scale applications, could also gain momentum as battery prices fall below $100/kWh. The following graph gives the positioning of different battery technologies by their end-uses with the power sector.

Berenberg Thematics
103
Positioning of different battery technologies
Source: State Utility Forecasting Group – Utility Scale Energy Storage Systems

Berenberg Thematics
104
Cost evolution for stationary energy storage
The costs of utility-scale storage systems also continue to decline. Consultant Navigant Research expects costs to fall for all battery technologies over the next five years. It expects the sharpest drop to come in lithium ion for utility-scale storage applications, from $550/kWh in 2014 to $200/kWh by 2020.
It is not just the energy storage cost in $/kWh which is important but also the power cost in $/kW; also, as different storage systems vary in cycle and calendar life, it is important to look at levelised cost (ie average cost in $/kWh over the operating life of the system) across the life of the storage system.
Sharpest cost reduction expected for lithium ion utility storage systems over the next five years
Source: US DoE
Lithium is not best suited for highLithium is not best suited for highLithium is not best suited for highLithium is not best suited for high----energy storage applications; flow energy storage applications; flow energy storage applications; flow energy storage applications; flow batteries are batteries are batteries are batteries are more economicalmore economicalmore economicalmore economical
Despite falling costs, we do not think that lithium ion batteries can compete with other battery technologies on cost. The following graph shows US Department of Energy (DOE) estimates for the levelised cost for different large-scale battery storage systems for bulk load-shifting purposes over the life of the system. The graph shows that lithium ion is still the most expensive storage solution for load shifting. According to consensus opinion, lithium ion costs will need to fall well below $150/kWh for it to become economical for mass-market utility-scale applications such as load shifting.
Lead acid, sodium sulphur and flow batteries have far lower energy storage costs than lithium ion batteries and hence are better suited for bulk energy storage applications. They hence have potential for growth over the next 5-10 years provided the technical issues (both high temperature salt batteries and flow batteries are operationally difficult to manage) are resolved and the rising scale of battery manufacturing further reduces storage costs.
680
550
350
600550
500550
300
200
535 535500488 465
400
0
100
200
300
400
500
600
700
800
2014 2017 2020
USD/kWh
USD/kWh
USD/kWh
USD/kWh
Flow Batteries Advanced lead-acid Lithium-ion
Sodium sulphur Sodium metal halide
● Lithium ion battery costs are declining. The most significant drop in costs versus other technologies is expected in 2015-20. Despite the fall in costs, lithium ion will still not be able to compete with lead acid in bulk storage applications.
● Lithium ion batteries have the lowest cost of power ($/kW) versus competing technologies and hence offer the most cost-effective solution for high-power applications such as frequency smoothing, voltage support and back-up power.

Berenberg Thematics
105
Lead acid, sodium sulphur and zinc bromine flow batteries are best suited for large-scale load
management purposes
Source: US DoE
Lithium ion the most costLithium ion the most costLithium ion the most costLithium ion the most cost----effective for niche higheffective for niche higheffective for niche higheffective for niche high----power applications power applications power applications power applications
While lithium ion is currently not cost-effective for bulk utility-scale storage, it is the cheapest storage option for high-power applications such as frequency management, voltage support and back-up power. This explains why lithium ion is growing so rapidly in stationary storage (for improving utilities’ power quality) and back-up power (for data centre and telecommunications applications).
We think that high-power-density cathode chemistries (ie lithium ion) will naturally prevail for high-power applications. In addition, considering the sharp charge and discharge cycles of the storage systems required for frequency smoothing, thermal stability will be essential. We therefore think that LFP and LMO cathode chemistries will be more cost-effective than the lithium NCA batteries – to be manufactured at Tesla’s Gigafactory – and NCM batteries used in EVs. This is because NCA and NCM are more expensive to produce and have relatively poor thermal stability versus LFP-based lithium ion cells.
Lithium ion has the lowest power cost ($/kW) versus other storage technologies and is best suited
for high-power applications such as frequency smoothing, voltage support and back-up power
Source: US DoE
0.0
0.1
0.2
0.3
0.4
0.5
0.6
0.7
0.8
SodiumSulphur
SodiumNickel Chloride
VanadiumRedox
ZincBromide
Leadacid
Lithiumion
$/kWh$/kWh$/kWh$/kWh Lithium ion is currently not
competitive versus other battery technologies for large scale load
shifting purposes
0
1000
2000
3000
4000
5000
6000
7000
8000
SodiumSulphur
SodiumNickel Chloride
VanadiumRedox
ZincBromide
Leadacid
Lithiumion
$/kW$/kW$/kW$/kW Lithium ion is the most cost
effective solution for high power
applications because of its
lowest cost of power

Berenberg Thematics
106
Lithium ion is the cheapest residentialLithium ion is the cheapest residentialLithium ion is the cheapest residentialLithium ion is the cheapest residential----scale storage solution but still cannot scale storage solution but still cannot scale storage solution but still cannot scale storage solution but still cannot compete with the gridcompete with the gridcompete with the gridcompete with the grid
Behind-the-meter residential energy storage has received substantial media attention since the launch of Tesla’s Powerwall storage system for solar power generation in the home. The price point is attractive – $3,000 for a 7kWh storage system which can be cycled daily (ie one complete charge and discharge cycle) and comes with a 10 year warranty. Assuming a cycle life of 5,000 charge/discharge cycles (ie a life of c15 years), round trip efficiency of 92% (some of the electricity is lost as heat while charging and discharging) and depth of discharge of 80%, the total levelised cost is around $0.11/kWh/cycle ($582/kWh).
The retail price for Tesla’s Powerwall lithium ion-based storage system does not include the AC-DC inverters, which can cost $2,000-4,000 per unit. Assuming installation charges of c$500, a complete Tesla Powerwall system costs $7,000, which translates into total levelised cost per kWh/cycle of $0.3 (or $1,086/kWh). This represents a radical improvement over other lithium ion systems and lead acid and zinc bromine flow batteries. The table below provides cost statistics for different storage systems (source: the 2015 US DoE electricity storage handbook).
While Tesla’s Powerwall is cheaper than most other battery systems – it has a storage cost of $0.3/kWh/cycle – it still cannot compete with the cost of electricity supplied by the grid in most regions. However, a residential system such as Powerwall is an economical option in 1) remote locations with no or very expensive access to the grid, 2) countries/regions with high electricity tariffs such as Germany, Denmark, California, Hawaii and Australia and 3) for back-up power in developing countries with unreliable electricity supply such as India and Egypt.
As compared to other storage technologies, Tesla’s Powerwall
has the lowest cost of storing electricity
Tesla is targeting the residential market for renewable
integration
Source: DoE, Tesla, Berenberg estimates Source: Tesla
$/kWh$/kWh$/kWh$/kWh $/kW$/kW$/kW$/kW
Zinc Bromide 0.70 9000
Lead acid 0.85 11000
Lithium ion 1.20 13000
Tesla's Powerwall
(7kWh)0.26 2121
Lowest levelised cost per cycle for Lowest levelised cost per cycle for Lowest levelised cost per cycle for Lowest levelised cost per cycle for
residential storage applicationsresidential storage applicationsresidential storage applicationsresidential storage applications

Berenberg Thematics
107
Uptake of utility-scale battery storage by the power sector
Energy storage capacity requirements are significantly higher for the power grid and residential applications than for EVs, with the result that high battery costs have so far been a bigger drag (versus that for EVs) on uptake of stationary storage. While grid penetration of energy storage systems remains low, this is set to change as utilities become more comfortable with battery technology as a result of extensive pilot energy storage schemes in the US, Europe and Asia. Annual global battery capacity storage additions have more than doubled over the past five years, with the rate of adoption sharply picking up since 2013, reflecting the strong interest by utilities in storage systems.
As shown in the graph below, this growth is being led by two applications: 1) usage in storing renewable power generation and 2) improving the quality and reliability of electricity supply. Strong storage growth especially in high-power applications such as frequency/voltage management is being helped by the declining cost of lithium ion batteries.
What is clear is that batteries have as yet failed to make any significant contribution to load management applications for the utilities. As shown in the graph below, annual battery storage additions for load shifting have been stagnant for the past five years. Battery costs are still too high to compete with oil-/gas-fired thermal generators and peaker plants for mass market load-shifting purposes.
● There has been rapid growth in stationary energy storage but it is still at a very early stage of adoption. Global annual additions in stationary storage have more than doubled over the last five years.
● Growth is mainly being driven by the need for frequency smoothing and renewable integration. The bulk storage required for load shifting is still not economically or practically feasible because of the scale and battery costs.
● The US is leading the global growth in stationary storage because of favourable regulatory requirements and rising renewable electricity generation. In Europe, pairing renewable generation with stationary storage is not competitive compared with the grid.
● Lithium ion is fast becoming the dominant technology for stationary storage because of its high power density, which makes it ideal for frequency management and also for back-up power. As costs come down, lithium ion is becoming increasingly competitive for the integration of renewable energy into the power grid.
● We think that low-cost lithium ion cathode chemistries, ie LFP and LMO rather than the costlier NCM and NCA (Tesla’s Powerwall), will win the stationary storage race.
● Lead acid remains the cheapest option for bulk storage purposes. Sodium sulphur and flow batteries suffer operational shortcomings which will need to be resolved before they can be considered for high energy applications.
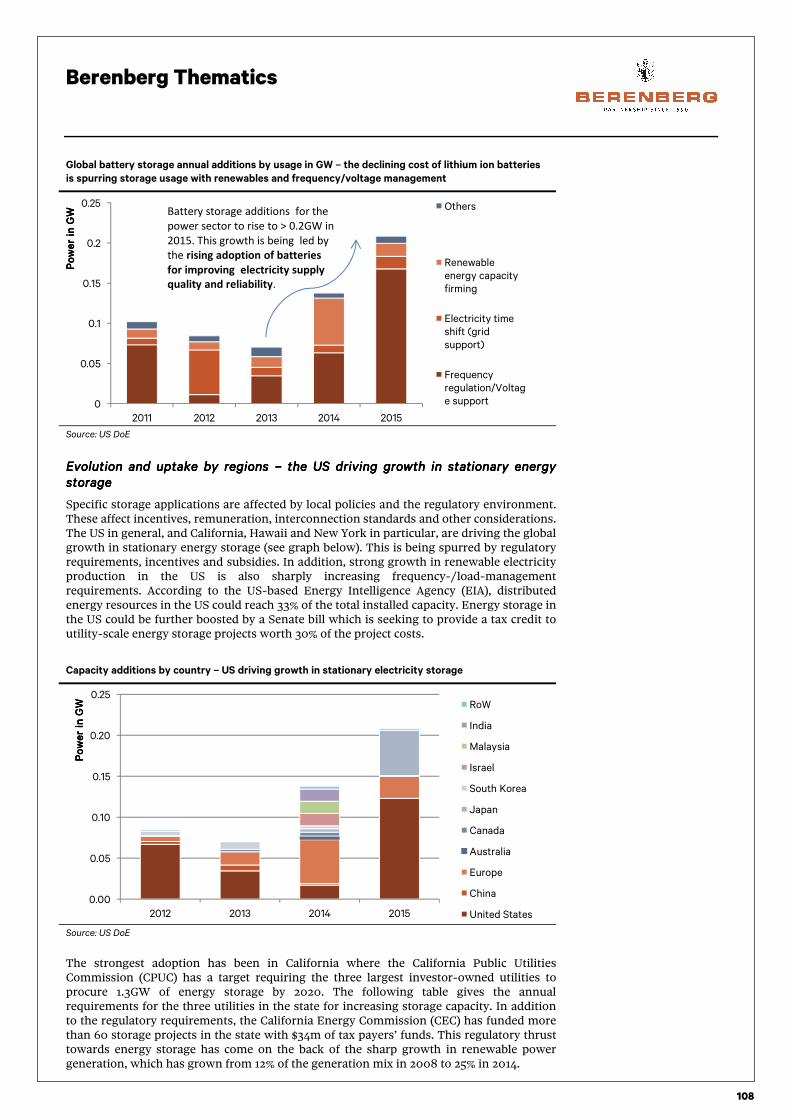
Berenberg Thematics
108
Global battery storage annual additions by usage in GW – the declining cost of lithium ion batteries
is spurring storage usage with renewables and frequency/voltage management
Source: US DoE
Evolution and uptake by regions Evolution and uptake by regions Evolution and uptake by regions Evolution and uptake by regions –––– the US driving growth in stationary energy the US driving growth in stationary energy the US driving growth in stationary energy the US driving growth in stationary energy storagestoragestoragestorage
Specific storage applications are affected by local policies and the regulatory environment. These affect incentives, remuneration, interconnection standards and other considerations. The US in general, and California, Hawaii and New York in particular, are driving the global growth in stationary energy storage (see graph below). This is being spurred by regulatory requirements, incentives and subsidies. In addition, strong growth in renewable electricity production in the US is also sharply increasing frequency-/load-management requirements. According to the US-based Energy Intelligence Agency (EIA), distributed energy resources in the US could reach 33% of the total installed capacity. Energy storage in the US could be further boosted by a Senate bill which is seeking to provide a tax credit to utility-scale energy storage projects worth 30% of the project costs.
Capacity additions by country – US driving growth in stationary electricity storage
Source: US DoE
The strongest adoption has been in California where the California Public Utilities Commission (CPUC) has a target requiring the three largest investor-owned utilities to procure 1.3GW of energy storage by 2020. The following table gives the annual requirements for the three utilities in the state for increasing storage capacity. In addition to the regulatory requirements, the California Energy Commission (CEC) has funded more than 60 storage projects in the state with $34m of tax payers’ funds. This regulatory thrust towards energy storage has come on the back of the sharp growth in renewable power generation, which has grown from 12% of the generation mix in 2008 to 25% in 2014.
0
0.05
0.1
0.15
0.2
0.25
2011 2012 2013 2014 2015
Power in GW
Power in GW
Power in GW
Power in GW
Others
Renewable
energy capacity
firming
Electricity time
shift (grid
support)
Frequency
regulation/Voltag
e support
Battery storage additions for the
power sector to rise to > 0.2GW in
2015. This growth is being led by
the rising adoption of batteries
for improving electricity supply
quality and reliability.
0.00
0.05
0.10
0.15
0.20
0.25
2012 2013 2014 2015
Power in GW
Power in GW
Power in GW
Power in GW RoW
India
Malaysia
Israel
South Korea
Japan
Canada
Australia
Europe
China
United States

Berenberg Thematics
109
California has mandated its three largest utilities to increase stationary storage capacity to 1.325GW
by 2020
Source: US DoE
In the rest of the US, there are currently no regulatory requirements for utilities to move towards stationary storage. However, energy storage requirements are rising sharply as a result of strong growth in renewable generation as well as tightening regulatory restrictions on greenhouse gas emissions. The state of New York has a mandate of 50% renewable generation by 2030, which also includes cutting greenhouse gas emissions by 40% from 1990 levels by 2030. The state of Hawaii wants to use 100% renewable energy within the next 30 years, higher than its earlier target of 40% by 2030. The same is true for Vermont, which wants to generate 75% of its energy from green sources within 17 years, versus a previous target of 20% by 2017.
In Europe, the reason why uptake of stationary storage has been relatively weak is because cheap electricity rates make pairing of distributed generation with battery storage uneconomical. Energy storage options are more viable in countries like Germany and Denmark, however, due to their high electricity tariff rates (see chart below left). According to a recent study by the International Renewable Energy Agency on the cost of battery storage systems for Germany (see chart below right), lithium ion costs €0.39/kWh/cycle while lead acid costs €0.44/kWh/cycle. This is still slightly higher than residential electricity tariffs at ~€0.3/kWh.
Germany and Denmark have the highest electricity tariffs in
Europe…
… Lithium ion storage systems in Germany are close to the point
at which they can compete on price with the grid
Source: Eurostat 2014 Source: IRENA 2015
0
0.05
0.1
0.15
0.2
0.25
0.3
0.35
Household Industry
EUR/kWhBattery Technology Lead-acid Li-ion Li-ion
Battery Power 5 5 5
Battery Capacity (kWh) 14.4 5.5 8
Usable Capacity (kWh) 7.2 4.4 8
Cycles 2800 3000 6000
Price (EUR) 8900 7500 18900
EUR/kW 1780 1500 3780
EUR/kWh 618 1364 2363
EUR/useable kWh 1236 1705 2363
EUR/useable kWh/cycle 0.44 0.57 0.39
Calculating the cost of battery storage systems available in the German market
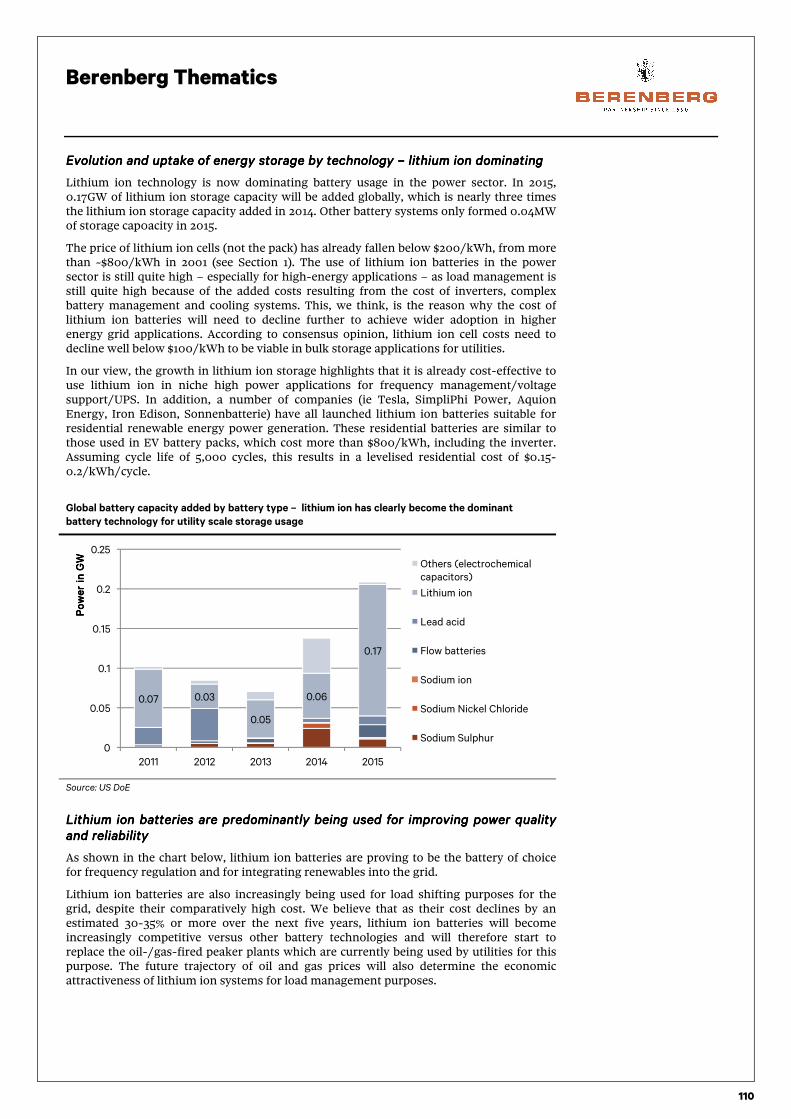
Berenberg Thematics
110
Evolution and uptake of energy storage by technology Evolution and uptake of energy storage by technology Evolution and uptake of energy storage by technology Evolution and uptake of energy storage by technology –––– lithium ion dominatinglithium ion dominatinglithium ion dominatinglithium ion dominating
Lithium ion technology is now dominating battery usage in the power sector. In 2015, 0.17GW of lithium ion storage capacity will be added globally, which is nearly three times the lithium ion storage capacity added in 2014. Other battery systems only formed 0.04MW of storage cap0acity in 2015.
The price of lithium ion cells (not the pack) has already fallen below $200/kWh, from more than ~$800/kWh in 2001 (see Section 1). The use of lithium ion batteries in the power sector is still quite high – especially for high-energy applications – as load management is still quite high because of the added costs resulting from the cost of inverters, complex battery management and cooling systems. This, we think, is the reason why the cost of lithium ion batteries will need to decline further to achieve wider adoption in higher energy grid applications. According to consensus opinion, lithium ion cell costs need to decline well below $100/kWh to be viable in bulk storage applications for utilities.
In our view, the growth in lithium ion storage highlights that it is already cost-effective to use lithium ion in niche high power applications for frequency management/voltage support/UPS. In addition, a number of companies (ie Tesla, SimpliPhi Power, Aquion Energy, Iron Edison, Sonnenbatterie) have all launched lithium ion batteries suitable for residential renewable energy power generation. These residential batteries are similar to those used in EV battery packs, which cost more than $800/kWh, including the inverter. Assuming cycle life of 5,000 cycles, this results in a levelised residential cost of $0.15-0.2/kWh/cycle.
Global battery capacity added by battery type – lithium ion has clearly become the dominant
battery technology for utility scale storage usage
Source: US DoE
Lithium ion batteries are predominantly being used for improving power quality Lithium ion batteries are predominantly being used for improving power quality Lithium ion batteries are predominantly being used for improving power quality Lithium ion batteries are predominantly being used for improving power quality and reliabilityand reliabilityand reliabilityand reliability
As shown in the chart below, lithium ion batteries are proving to be the battery of choice for frequency regulation and for integrating renewables into the grid.
Lithium ion batteries are also increasingly being used for load shifting purposes for the grid, despite their comparatively high cost. We believe that as their cost declines by an estimated 30-35% or more over the next five years, lithium ion batteries will become increasingly competitive versus other battery technologies and will therefore start to replace the oil-/gas-fired peaker plants which are currently being used by utilities for this purpose. The future trajectory of oil and gas prices will also determine the economic attractiveness of lithium ion systems for load management purposes.
0.07 0.03
0.05
0.06
0.17
0
0.05
0.1
0.15
0.2
0.25
2011 2012 2013 2014 2015
Power in GW
Power in GW
Power in GW
Power in GW Others (electrochemical
capacitors)
Lithium ion
Lead acid
Flow batteries
Sodium ion
Sodium Nickel Chloride
Sodium Sulphur

Berenberg Thematics
111
Global lithium ion battery storage for the power sector by application (2014-15) – while lithium ion is
still predominantly being used for niche high power applications, its use in bulk storage applications
such as load shifting and renewable power storage is rising
Source: US DoE
BYD, Toshiba and SaftBYD, Toshiba and SaftBYD, Toshiba and SaftBYD, Toshiba and Saft are emerging as the leading lithium ion battery suppliers are emerging as the leading lithium ion battery suppliers are emerging as the leading lithium ion battery suppliers are emerging as the leading lithium ion battery suppliers for the power sectorfor the power sectorfor the power sectorfor the power sector
Lithium ion suppliers market for the power sector is highly fragmented. Over the last two years, Saft, Samsung, Toshiba and BYD have carved out significant market shares. Panasonic will likely play an important role with Tesla becoming a battery storage provider for residential and grid use – Panasonic is Tesla’s lithium ion cell provider and a partner in its Gigafactory. In addition, there could be a number of potential new entrants in this space such as Alevo (working on extremely thermally stable battery systems based on an inorganic electrolyte) and 24M (semi-solid lithium ion batteries) which may offer advanced versions of the Lithium ion technology for grid storage.
These players have plans for significant capacity additions over the next five years. By 2020, Tesla’s Gigafactory is scheduled to produce 35GWh while energy service provider Alevo’s manufacturing plant is expected to deliver 16.2GWh. Further, Chinese battery and vehicle manufacturer BYD has announced plans to ramp up production capacity from 10GWh in 2015 to 34GWh in 2020.
Energy storage for lithium ion by battery supplier (2014-15) – it is a highly fragmented supplier
market in the power sector, but BYD, Toshiba and Saft are emerging as the leading suppliers
Source: US DoE
0%
10%
20%
30%
40%
50%
60%
70%
80%
90%
100%
2014 2,015
Others
Renewable energy storage
Load shifting
Frequency regulation/
Voltage support
0.00
0.02
0.04
0.06
0.08
0.10
0.12
2014 2,015
Power in GW
Power in GW
Power in GW
Power in GW
Others EnerDel
Hitachi Kokam
A123 (NEC) Toshiba
CODA BMW
Sony BYD
LG Chem Panasonic
Bosch Samsung SDI
Saft

Berenberg Thematics
112
Highly fragmented manufacturing baseHighly fragmented manufacturing baseHighly fragmented manufacturing baseHighly fragmented manufacturing base
Of the power electronics companies that produce battery systems, only ABB, Dynapower and Schneider have any meaningful market share. The table below right details the leading companies involved along the battery value chain for the power sector, including “integrator companies” such as Xtreme Power, Solar Grid and Greensmith, which provide services to integrate battery systems with the power generation and transmission network.
Lithium ion power electronics providers (2015): in a highly
fragmented market, only ABB, Dynapower and Schneider have
any meaningful market share
The power sector’s battery value chain
Source: US DoE Source: US DoE
LowLowLowLow----cost and thermally stable LFP and LMO chemistries likely to dominate cost and thermally stable LFP and LMO chemistries likely to dominate cost and thermally stable LFP and LMO chemistries likely to dominate cost and thermally stable LFP and LMO chemistries likely to dominate lithium stationary storage lithium stationary storage lithium stationary storage lithium stationary storage
Because of the high-energy requirements of most utility scale applications, cell chemistries which offer better thermal stability/safety and lower cost electricity storage per kWh – ie cathode chemistries that use lithium ion rather than expensive nickel or cobalt – will prevail, in our view. We think that LFP will remain the lithium ion technology of choice for the power sector, because it offers high power density, excellent thermal stability, good cycle life and low cost.
NMC and NCA, which are the preferred technologies for EVs due to their higher energy densities, are too expensive for power-related storage. This leads us to question whether Tesla’s Powerwall, which is based on NCA, can be successful in the long term – although the modular/flexible nature of Tesla’s Gigafactory might make the production of two different types of cells for EVs and power-related storage possible.
Comparison of different lithium ion battery systems: we believe that LFP’s low cost, high cycle life and good
thermal stability is the most suitable system for utility scale battery storage
Source: Berenberg estimates, VTT
7100
4400
ABB
Schneider
Alstom
Siemens
Sharp/Ideal Power
Dynapower
Nidec
Others
Cathode materialCathode materialCathode materialCathode material LMOLMOLMOLMO NMCNMCNMCNMC NCANCANCANCA LFPLFPLFPLFP LTOLTOLTOLTO
Lithium Lithium Lithium Lithium
Manganese OxideManganese OxideManganese OxideManganese Oxide
Lithium Nickel Lithium Nickel Lithium Nickel Lithium Nickel
Manganese Cobalt Manganese Cobalt Manganese Cobalt Manganese Cobalt
OxideOxideOxideOxide
Lithium Nickel Cobalt Lithium Nickel Cobalt Lithium Nickel Cobalt Lithium Nickel Cobalt
Aluminium OxideAluminium OxideAluminium OxideAluminium Oxide
Lithium Iron Lithium Iron Lithium Iron Lithium Iron
PhosphatePhosphatePhosphatePhosphateLithium TitanateLithium TitanateLithium TitanateLithium Titanate
Energy densityEnergy densityEnergy densityEnergy densityVery high
energy density
Very high
energy density
Very high energy
density
Low energy
density
Low energy
density
Power densityPower densityPower densityPower densityVery high power
density
High power
densityHigh power density
Very high power
density
Very high power
density
Thermal Thermal Thermal Thermal
stability/safetystability/safetystability/safetystability/safety
Poor thermal
stability
Better thermal
stability
Better thermal
stability
Good thermal
stability
Poor thermal
stability
CostCostCostCost Low cost High cost High cost Low cost Very high cost
Cycle LifeCycle LifeCycle LifeCycle LifeLow cycle life
(~2000)
Good cycle life
(4-5000)
Slightly lower
versus NMC
Excellent cycle life
(5-10'000)
Low cycle life
(~2000)
Prominent Prominent Prominent Prominent
manufacturersmanufacturersmanufacturersmanufacturers
LG, AESC,
Samsung
LG, Johnsons
Control, Saft
Panasonic,
Samsung
Sony, A123, BYD,
Amprex, Lishen
ATL, Toshiba, Le-
clanche, Microvast

Berenberg Thematics
113
Other technologies: flow batteries likely to play an important role in utility scale Other technologies: flow batteries likely to play an important role in utility scale Other technologies: flow batteries likely to play an important role in utility scale Other technologies: flow batteries likely to play an important role in utility scale load shifting applications; salt batteries face operational challenges load shifting applications; salt batteries face operational challenges load shifting applications; salt batteries face operational challenges load shifting applications; salt batteries face operational challenges
Lead acid: Lead acid storage systems are the most prevalent type in the battery storage space, if we include car batteries. Further, in remote locations, lead acid is the preferred battery type for power back-up in both residential and commercial applications. Lead acid batteries have a low environmental footprint as 99% of the battery is recycled; they also benefit from fast charge times and are highly efficient. While cycle life is relatively low, lead acid batteries can last 5-15 years, depending on usage.
The table below gives a market overview of lead acid batteries. The market is clearly highly fragmented. The top manufacturers include Johnsons Controls, Exide, GS, Enersys and Younicos. We think that lead acid will play an important role in both frequency regulation and bulk storage applications in the future.
Lead acid – market overview
Source: Berenberg estimates
Flow batteries offer very high cycle life and potentially low cost energy storage: In flow batteries, the electrolyte is stored in external tanks and is pumped through a central reaction unit which is separated in the reaction cell by a ceramic membrane (please see chart below left). Flow batteries have lower energy densities than other cutting-edge technologies, but are relatively cheap. Relative to lithium ion and lead acid storage systems, they are bulky and somewhat cumbersome to operate. Flow batteries have suffered technical issues related to the degradation of the membrane material over time. Because of their long life and good storage potential, they are best suited for utility scale storage for load shifting and for integrating renewables with the grid.
The top three manufacturers for utility scale flow batteries in 2014 were private companies UniEnergy, EnerVault and ViZn Energy Systems (see chart below left). Other companies which offer flow batteries for residential and commercial applications include Redflow, RedT and Gildemeister.
Flow batteries by battery supplier (2014) – three players
dominate the global flow battery space Flow battery structure
Source: US DoE Source: US DoE
Major battery Major battery Major battery Major battery
manufacturersmanufacturersmanufacturersmanufacturers
End market applications End market applications End market applications End market applications
(autos, Utilities, electronics)/ (autos, Utilities, electronics)/ (autos, Utilities, electronics)/ (autos, Utilities, electronics)/
applicationsapplicationsapplicationsapplications
Market by geographyMarket by geographyMarket by geographyMarket by geography
1. Johnsons Controls1. Transportation
Asia Pacific $15.3bn, 34%
2. Exide Technologies 2. Industrial North America 21.6%
3. GS Yuasa Corporation 3. Back up power/ grid storage Western Europe 18.7%
4. Enersys
5. Younicos (Germany)
325, 47%
250, 37%
80, 12%
30, 4%
UniEnergyTechnologies, VanadisPower, Rongke Power
EnerVault
ViZn Energy Systems
Others

Berenberg Thematics
114
Salt batteries: There are two main types of salt batteries – sodium sulphur and sodium nickel chloride batteries. Japanese player NGK is the sole manufacturer of sodium sulphur battery systems while GE and Fiam are the two dominant players in sodium nickel chloride batteries.
While high-temperature salt batteries can operate in a broad range of operating temperatures and also have lower costs than other battery types, they suffer from operational challenges. In recent years the Sodium Sulphur storage installations have experienced catastrophic accidents and fires. These technical issues will need to be resolved before widespread adoption could be possible.
Energy storage for salt batteries by battery provider (2014) –
Fiam and GE are the main suppliers of sodium nickel batteries
while NGK is the only supplier of sodium sulphur batteries
Structure of a sodium sulphur battery
Source: US DoE Source: US DoE
Uptake for residential scale storage systems
Behind-the-meter residential storage is currently at a similar stage to solar panels 10 years ago, when ongoing reductions in price reached a tipping point, enabling mass adoption. Residential storage systems are now being installed a) by early adopters or b) those with grid access or grid reliability issues. However, costs have fallen to such a degree that in countries with high cost electricity such as Germany and Australia they are close to parity with the grid.
Through the introduction of its Powerwall storage product, which is the lowest priced system in the market at only £3,000 for a 7kWh system, Tesla has reinvigorated the competitive forces in the residential storage market. We think that the price of residential storage systems could halve over the next five years in tandem with the overall decline in battery prices. Based on this assumption and considering the small installed base, we believe the sector is headed for exponential growth. This explains why every battery manufacturer has entered the fray.
In this section, we discuss the German and the Australian residential storage markets, which we believe will experience behind-the-meter mass market adoption before other regions due to the maturity of their distributed solar generation installed base.
German residential storage case studyGerman residential storage case studyGerman residential storage case studyGerman residential storage case study
There are currently c25,000 households in Germany with access to a storage product. The storage market has started to pick up and c30-40 players are now offering storage products. We expect strong growth ahead based on four key reasons.
● Reason #1 – high and growing solar PV installed base: In 2014, Germany’s PV installed base stood at 35GW, with 1.5m installations. While the rate of growth has slowed down, in 2015 1GW of PV systems (which is lower than the target of 2.5GW per annum) were added. Significantly higher additions in the range of 3-4GW per annum are required to reach the long-term national target of 80% renewables within the electricity generation mix by 2050. The high PV installed base in Germany highlights
1263, 4%
24000, 78%
5500, 18%
FIAM NGK GE

Berenberg Thematics
115
the maturity of the residential sector, with a good number of established retailers and installers. This level of infrastructure will ease the energy shift to decentralised residential energy storage over time, we believe.
● Reason #2 – feed-in tariffs (FITs) have fallen from €0.47/kWh in 2008 to €0.13/kWh in 2015, increasing the profitability of storage: Germany’s PV sector is moving from self-generation to a high level of self-consumption. Historically, self-consumption was not the primary aim of solar power as producers were receiving generous FITs to sell the electricity they were generating to the grid; these were guaranteed for 20 years. However, over the last 10 years the average FIT has declined from €0.54/kWh in 2005 to only €0.13/kWh in 2015 for a small PV residential system. Declining FITs and low wholesale electricity tariff rates (currently at €0.04/kWh) increases the profitability of residential storage solutions.
FITs have been declining Retrofit potential is huge
Source: IRENA Source: The Federal Environment Ministry 2014
● Reason #3 – high and rising retail electricity tariff makes solar and storage competitive with the grid: In Germany, solar PV FITs are paid via a surcharge which is borne by electricity users. Because of rising solar PV generation, this surcharge has risen to €0.062/kWh in 2015 taking overall retail electricity price to €0.294/kWh a jump from €0.218/kWh in 2008. In Germany, solar generation costs an average €0.11-0.13 depending on location. With solar generation costs declining and the EEG (renewable energy surcharge) surcharge rising, the gap between retail and solar generation is expanding. Hence the economic viability of battery storage systems has been improving. Currently, a 10kWh lithium ion system in Germany costs €6,000-8,000. Assuming 10,000 cycles over its lifetime, depth of discharge of 80% and system efficiency of 90%, the storage cost has come down to €0.08-0.1/kWh/cycle. Hence solar plus storage is already competitive with the grid in Germany, even in the absence of subsidy.
German retail prices have risen significantly since 2010
Source: VoA News
0
2000
4000
6000
8000
10000
2021 2023 2025 2027 2029 2031 2033
Battery Retrofit Potential: Installed PV Capacity Battery Retrofit Potential: Installed PV Capacity Battery Retrofit Potential: Installed PV Capacity Battery Retrofit Potential: Installed PV Capacity Exciting 20 Year FIT Period (MWp)Exciting 20 Year FIT Period (MWp)Exciting 20 Year FIT Period (MWp)Exciting 20 Year FIT Period (MWp)
Feed-in Tariff Period (MWp)
2.1 3.5 3.65.3 6.2 6.2
0
5
10
15
20
25
30
35
2006 2007 2008 2009 2010 2011 2012 2013 2014 2015
Procurement, distribution margin Concession fees Taxes
Fix grid charge EEG surcharge Other surcharges
Cost in /kWh
Cost in /kWh
Cost in /kWh
Cost in /kWh
CompositionCompositionCompositionComposition of German household electricity pricesof German household electricity pricesof German household electricity pricesof German household electricity prices
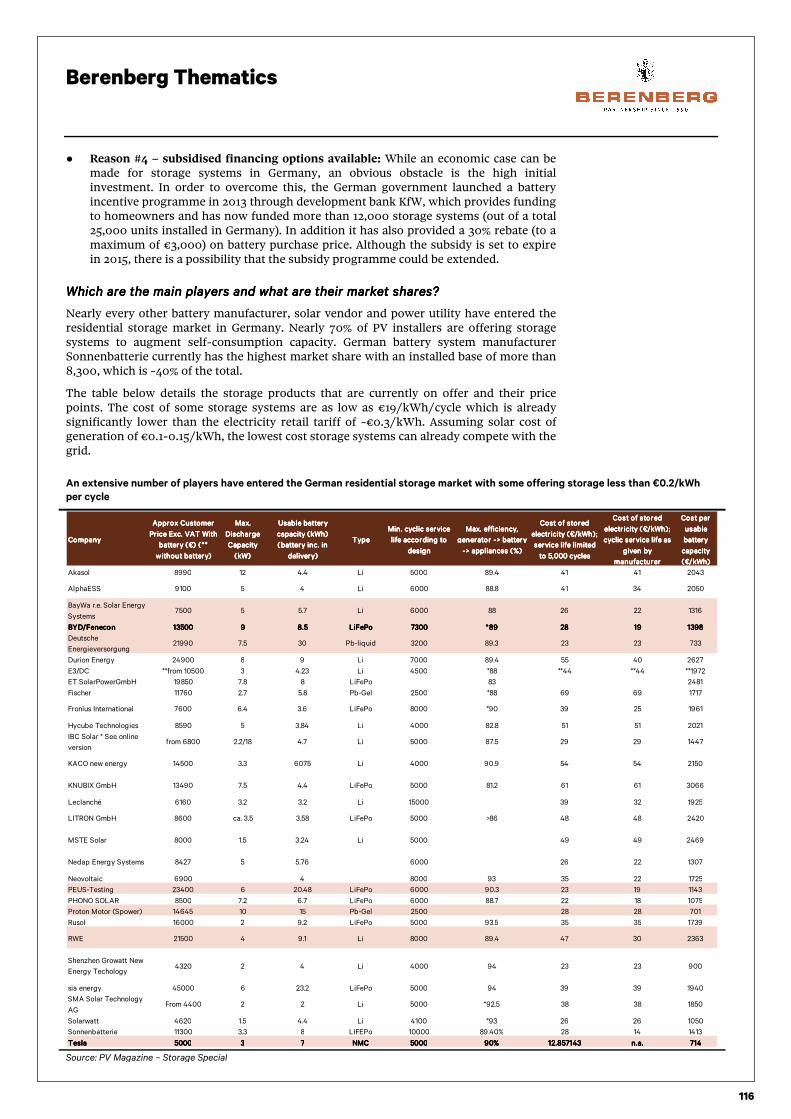
Berenberg Thematics
116
● Reason #4 – subsidised financing options available: While an economic case can be made for storage systems in Germany, an obvious obstacle is the high initial investment. In order to overcome this, the German government launched a battery incentive programme in 2013 through development bank KfW, which provides funding to homeowners and has now funded more than 12,000 storage systems (out of a total 25,000 units installed in Germany). In addition it has also provided a 30% rebate (to a maximum of €3,000) on battery purchase price. Although the subsidy is set to expire in 2015, there is a possibility that the subsidy programme could be extended.
WhichWhichWhichWhich are the main players and what are their market shares?are the main players and what are their market shares?are the main players and what are their market shares?are the main players and what are their market shares?
Nearly every other battery manufacturer, solar vendor and power utility have entered the residential storage market in Germany. Nearly 70% of PV installers are offering storage systems to augment self-consumption capacity. German battery system manufacturer Sonnenbatterie currently has the highest market share with an installed base of more than 8,300, which is ~40% of the total.
The table below details the storage products that are currently on offer and their price points. The cost of some storage systems are as low as €19/kWh/cycle which is already significantly lower than the electricity retail tariff of ~€0.3/kWh. Assuming solar cost of generation of €0.1-0.15/kWh, the lowest cost storage systems can already compete with the grid.
An extensive number of players have entered the German residential storage market with some offering storage less than €0.2/kWh
per cycle
Source: PV Magazine – Storage Special
CompanyCompanyCompanyCompany
Approx Customer Approx Customer Approx Customer Approx Customer
Price Exc. VAT With Price Exc. VAT With Price Exc. VAT With Price Exc. VAT With
battery (€) (** battery (€) (** battery (€) (** battery (€) (**
without battery)without battery)without battery)without battery)
Max. Max. Max. Max.
Discharge Discharge Discharge Discharge
Capacity Capacity Capacity Capacity
(kW)(kW)(kW)(kW)
Usable battery Usable battery Usable battery Usable battery
capacity (kWh) capacity (kWh) capacity (kWh) capacity (kWh)
(battery inc. in (battery inc. in (battery inc. in (battery inc. in
delivery)delivery)delivery)delivery)
TypeTypeTypeType
Min. cyclic service Min. cyclic service Min. cyclic service Min. cyclic service
life according to life according to life according to life according to
designdesigndesigndesign
Max. efficiency, Max. efficiency, Max. efficiency, Max. efficiency,
generator -> battery generator -> battery generator -> battery generator -> battery
-> appliances (%)-> appliances (%)-> appliances (%)-> appliances (%)
Cost of stored Cost of stored Cost of stored Cost of stored
electricity (€/kWh); electricity (€/kWh); electricity (€/kWh); electricity (€/kWh);
service life limited service life limited service life limited service life limited
to 5,000 cyclesto 5,000 cyclesto 5,000 cyclesto 5,000 cycles
Cost of stored Cost of stored Cost of stored Cost of stored
electricity (€/kWh); electricity (€/kWh); electricity (€/kWh); electricity (€/kWh);
cyclic service life as cyclic service life as cyclic service life as cyclic service life as
given by given by given by given by
manufacturermanufacturermanufacturermanufacturer
Cost per Cost per Cost per Cost per
usable usable usable usable
battery battery battery battery
capacity capacity capacity capacity
(€/kWh)(€/kWh)(€/kWh)(€/kWh)
Akasol 8990 12 4.4 Li 5000 89.4 41 41 2043
AlphaESS 9100 5 4 Li 6000 88.8 41 34 2050
BayWa r.e. Solar Energy
Systems7500 5 5.7 Li 6000 88 26 22 1316
BYD/FeneconBYD/FeneconBYD/FeneconBYD/Fenecon 13500135001350013500 9999 8.58.58.58.5 LiFePoLiFePoLiFePoLiFePo 7300730073007300 *89*89*89*89 28282828 19191919 1398139813981398
Deutsche
Energieversorgung21990 7.5 30 Pb-liquid 3200 89.3 23 23 733
Durion Energy 24900 8 9 Li 7000 89.4 55 40 2627
E3/DC **from 10500 3 4.23 Li 4500 *88 **44 **44 **1972
ET SolarPowerGmbH 19850 7.8 8 LiFePo 83 2481
Fischer 11760 2.7 5.8 Pb-Gel 2500 *88 69 69 1717
Fronius International 7600 6.4 3.6 LiFePo 8000 *90 39 25 1961
Hycube Technologies 8590 5 3.84 Li 4000 82.8 51 51 2021
IBC Solar * See online
versionfrom 6800 2.2/18 4.7 Li 5000 87.5 29 29 1447
KACO new energy 14500 3.3 6075 Li 4000 90.9 54 54 2150
KNUBIX GmbH 13490 7.5 4.4 LiFePo 5000 81.2 61 61 3066
Leclanché 6160 3.2 3.2 Li 15000 39 32 1925
LITRON GmbH 8600 ca. 3.5 3.58 LiFePo 5000 >86 48 48 2420
MSTE Solar 8000 1.5 3.24 Li 5000 49 49 2469
Nedap Energy Systems 8427 5 5.76 6000 26 22 1307
Neovoltaic 6900 4 8000 93 35 22 1725
PEUS-Testing 23400 6 20.48 LiFePo 6000 90.3 23 19 1143
PHONO SOLAR 8500 7.2 6.7 LiFePo 6000 88.7 22 18 1075
Proton Motor (Spower) 14645 10 15 Pb-Gel 2500 28 28 701
Rusol 16000 2 9.2 LiFePo 5000 93.5 35 35 1739
RWE 21500 4 9.1 Li 8000 89.4 47 30 2363
Shenzhen Growatt New
Energy Techology4320 2 4 Li 4000 94 23 23 900
sia energy 45000 6 23.2 LiFePo 5000 94 39 39 1940
SMA Solar Technology
AGFrom 4400 2 2 Li 5000 *92.5 38 38 1850
Solarwatt 4620 1.5 4.4 Li 4100 *93 26 26 1050
Sonnenbatterie 11300 3.3 8 LIFEPo 10000 89.40% 28 14 1413
TeslaTeslaTeslaTesla 5000500050005000 3333 7777 NMCNMCNMCNMC 5000500050005000 90%90%90%90% 12.85714312.85714312.85714312.857143 n.a.n.a.n.a.n.a. 714714714714

Berenberg Thematics
117
What is the growth outlook?What is the growth outlook?What is the growth outlook?What is the growth outlook?
Increasing numbers of PV systems are currently being sold with storage in Germany. We think that this will only increase over the next five years as the cost of the storage systems continues to decline. By 2020, we estimate that a third of PV systems will likely be sold with storage as compared to less than a quarter currently if the cost of storage comes down to less than €0.1/kWh/cycle (based on a 10,000 cycle life assumption) or ~€0.15-0.2/kWh/cycle (a 5,000 cycle assumption). Assuming annual PV system sales of ~200,000 per annum by 2020, residential storage system sales could reach 240,000 per annum by 2020 (including potential battery sales of 180,000 units for the residential installed base in 2015). This would translate in total revenues for storage providers of ~$400m in Germany by 2020.
Potential size of the residential storage market by 2020 ($m)
Source: Berenberg estimates, PV-magazine, SEIA
Australian Australian Australian Australian residential storage case study residential storage case study residential storage case study residential storage case study –––– PV installed base, declining FIT, high PV installed base, declining FIT, high PV installed base, declining FIT, high PV installed base, declining FIT, high grid charge and rising retail prices driving growthgrid charge and rising retail prices driving growthgrid charge and rising retail prices driving growthgrid charge and rising retail prices driving growth
At the end of 2014, stationary storage systems in Australia stood at 4-5MW, which pales in comparison to solar PV generation capacity of 4.9GW. Australia, Germany and the US are the three key markets, with strong near-term potential for growth in residential/ commercial storage uptake. There are four reasons why take-up in Australia has been so high.
● Reason #1 – high and growing solar PV installed base: At the end of 2014, there were around 1.4m solar PV systems in Australia with total generation capacity of 4.9GWh. The bulk of solar generation capacity was made up of small-scale residential units at 4.04GW (more than 80% of solar generation capacity) while commercial and large-scale solar generation stood at 0.79GW and 0.118GW respectively. While the rate of new solar system additions has slowed, they are becoming larger and more efficient. This explains why solar generation additions in terms of generation capacity were higher in 2014 than in 2013, despite the overall number of PV system additions falling by 8.5%. A rising solar installed base should encourage storage uptake especially as battery costs come down.
0
50
100
150
200
250
300
350
400
450
500
UK US Germany Australia
Size of the residential storage market by 2020 ($mn)

Berenberg Thematics
118
Solar PV installed capacity has been rising with the greatest growth coming from the residential
market
Source: Clean Energy Australia Report 2014
● Reason #2 – the FIT rate has fallen close to zero; storage is necessary to boost self-
consumption: State subsidies for solar generation in Australia have historically been through premium FIT rates. Apart from the Northern Territory (NT), these premium tariffs have long expired with current FITs close to zero (see table below). Consequently, without increasing self-consumption, solar generation would not make much sense. Battery storage is hence necessary to smoothen residential/commercial solar generation (which suffers from high variability, dependent on the sun) to meet daily loads.
FITs have declined to close to zero in Australia
Source: Berenberg estimates
● Reason #3 – a potential “sun tax” and rising fixed grid charges are set to reduce cross-tariff subsidies: Over the past five years, the fixed grid surcharge has on average doubled in Australia. In most regions in the country, the fixed grid surcharge is very high (see chart below), especially in Queensland and Victoria, where it exceeds AUD1 per day – nearly 20% of the yearly average electricity bill for a household unit. However, despite this high level of fixed charge on households, network cost on average forms more than 50% of the overall cost of delivering electricity for the power network. This means that households with solar PVs are indirectly being subsidised for their grid connection by households without PVs. This indirect cross-subsidy will increase as peak demand rises because of increased renewable generation which requires upgrades to the power network to meet peak loads. As a result, the fixed grid surcharge will continue to increase. A number of energy utilities in Australia are proposing to impose a sun tax on households with solar panels. A sun tax on top of
Feed in tariffs (AU$/kWh)Feed in tariffs (AU$/kWh)Feed in tariffs (AU$/kWh)Feed in tariffs (AU$/kWh) Current Old premium tariff
Australian Capital Territory (ACT) 0.06 -0.075$0.5/kWh gross tariff closed June'13.
Duration 20 years.
New South Wales (NSW) 0.051-0.08 $0.2/kWh gross tariff from Oct'10
Northern Territory (NT) 0.1923 Unchanged
Queensland (QLD) 0.06-0.12$0.44/kWh net tariff, closed Jun'13. Until
Jul'14
South Australia (SA) 0.053$0.44/kWh net tariff closed Oct'11.
Duration 15 years
Tasmania (TAS) 0.0555Equivalent to retail tariff, closed Aug'13.
Duration 7 years
Victoria (VIC) 0.062$0.6/kWh net tarriff closed Dec'11.
Duration 15 years.
Western Australia (WA) 0.07$0.4/kWh net tariff, closed Dec'11.
Duration 10 years

Berenberg Thematics
119
rising fixed network charges should incentivise households to move towards off-grid solutions, either through diesel generation and/or battery storage systems.
The fixed grid charge in Australia is high and has doubled over the last five years as a result of
declining demand for electricity amid rising solar generation
Source: Berenberg estimates
● Reason #4 – high and rising retail electricity tariffs make solar and storage competitive with the grid: The spending on poles-and-wire infrastructure by electricity network companies has been the primary driver of higher power prices in Australia over the past decade. Much of this investment was made on the common assumption that demand for electricity would continue to increase out to 2020 and beyond. While electricity demand has fallen over the past five years, peak demand has been rising due to increased renewable generation. As renewable generation continues to increase, pressure will mount on utilities to increase retail tariffs to finance investment in the power network to meet peak demand. Rising retail prices should encourage higher self-consumption of electricity by households with solar PVs through storage systems.
Australian retail prices have risen significantly over the past five years as a result of the high level
of investment in the power network to meet rising peak loads
Source: Berenberg
0
0.2
0.4
0.6
0.8
1
1.2
1.4
AustralianCapital Territory
(ACT)
New South Wales(NSW)
NorthernTerritory (NT)
Queensland(QLD)
South Australia(SA)
Tasmania (TAS) Victoria (VIC) WesternAustralia (WA)
Fixed grid charge (AU$ per day)
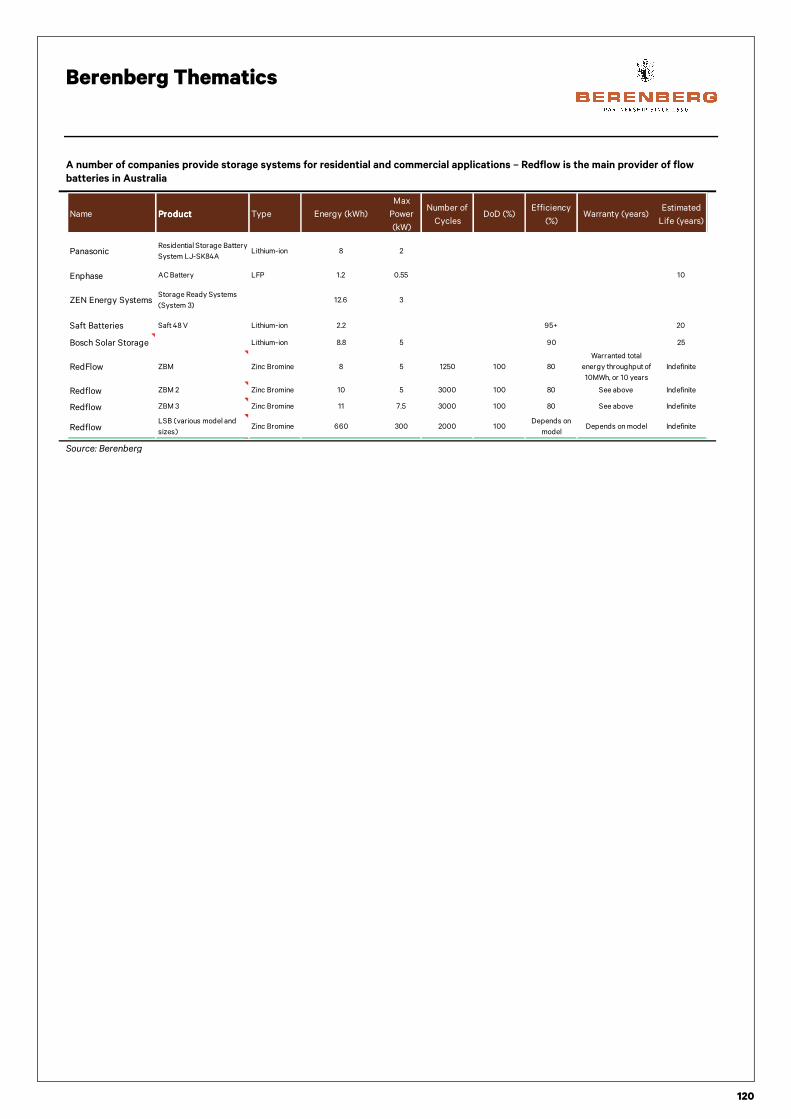
Berenberg Thematics
120
A number of companies provide storage systems for residential and commercial applications – Redflow is the main provider of flow
batteries in Australia
Source: Berenberg
Name ProductProductProductProduct Type Energy (kWh)
Max
Power
(kW)
Number of
CyclesDoD (%)
Efficiency
(%)Warranty (years)
Estimated
Life (years)
PanasonicResidential Storage Battery
System LJ-SK84ALithium-ion 8 2
Enphase AC Battery LFP 1.2 0.55 10
ZEN Energy SystemsStorage Ready Systems
(System 3)12.6 3
Saft Batteries Saft 48 V Lithium-ion 2.2 95+ 20
Bosch Solar Storage Lithium-ion 8.8 5 90 25
RedFlow ZBM Zinc Bromine 8 5 1250 100 80
Warranted total
energy throughput of
10MWh, or 10 years
Indefinite
Redflow ZBM 2 Zinc Bromine 10 5 3000 100 80 See above Indefinite
Redflow ZBM 3 Zinc Bromine 11 7.5 3000 100 80 See above Indefinite
RedflowLSB (various model and
sizes)Zinc Bromine 660 300 2000 100
Depends on
modelDepends on model Indefinite

Berenberg Thematics
121
Outlook and implications: structural growth guaranteed; storage
likely to replace gas-fired peaker plants
We believe that there will be strong growth in stationary storage for utilities and the residential and commercial sectors over the next 10-20 years. Companies with exposure to the power value chain, including battery technology providers and manufacturers, integrators and manufacturers of power electronic hardware and software, will benefit from robust demand growth for their products and services in the long term. We also believe that battery storage is likely to lead to the next wave of adoption of renewable generation, leading to a more flexible and also a smarter grid.
Power utilities will be challenged by the move from a centralised to a distributed energy network. However, widespread adoption of battery storage facilities is likely to help utilities to significantly defer or even partially eliminate the need for high capex upgrades to ageing power networks in most regions. This is based on the improved utilisation and lowered electricity losses that increased stationary storage will help to achieve. Benefits to the grid will be significant as it will 1) improve network availability and 2) optimise the use of energy.
IHS expects stationary energy storage to grow to 40GW of installation by 2020 versus 538MW in 2015. At the same time, it expects a 15x increase in energy storage used with renewables from 231MW in 2014 to 3.6GW by 2018. Navigant Research, on the other hand, expects installed energy storage systems for renewable integration to grow to 12.7GW by 2025. Hence, IHS also expects strong growth in power inverters for stationary storage.
Stationary energy storage is headed towards strong long-term structural growth
Source: Navigant Research (Jaffe and Adamson, 2014)
A smart and more flexible grid will be based on increased energy storage A smart and more flexible grid will be based on increased energy storage A smart and more flexible grid will be based on increased energy storage A smart and more flexible grid will be based on increased energy storage
With the growth of distributed renewable electricity generation comes the need for a more flexible grid. Adoption of stationary energy storage along with smart sensors and software will be core parts of this intelligent grid. These smart devices/sensors paired with stationary storage will result in interconnected decision-making (ie charging batteries and using non-critical home appliances at low-demand times) which will make distributed
Global forecast for utility scale battery storage (MW)
0
2000
4000
6000
8000
10000
12000
14000
16000
18000
0
2000
4000
6000
8000
10000
12000
14000
16000
2014 2015 2016 2017 2018 2019 2020 2021 2022 2023
Annual revenue (USD thousands)
Annual revenue (USD thousands)
Annual revenue (USD thousands)
Annual revenue (USD thousands)
MW
MWMWMW
Annual Capacity (MW) Annual Revenue (USD Thousands)
● Stationary storage is headed for strong structural growth over the next 5-10 years. IHS expects energy storage to grow to 40GW by 2020 versus 538MW in 2015.
● The use of smart meters along with distributed power generation and storage should lead to greater flexibility in electricity generation and demand; in the medium term, we expect this to help improve asset utilisation for utilities and defer/eliminate the need for capex to upgrade generation capacity.
● Long-term adoption of batteries for bulk storage, ie load shifting, could eventually lead to a complete flattening of the load curve and hence eliminate the need for new oil-/gas-fired peaker plants.

Berenberg Thematics
122
energy systems more reliable and efficient. It will also reduce the limits on transmission and make the power grid more dynamic, we believe.
In addition, we believe that the stationary storage sector needs to create and implement clear standards to help in the creation of plug-and-play architecture for the integration of distributed energy resources in the regional grid. The creation of microgrids through the aggregation of small energy storage systems could help to build a resilient system and lead to peak load sharing.
Creating a smart grid through the widespread use of stationary energy storage along with smart
sensors/software to help make interconnected demand and supply decisions
Source: ERPI, IRENA
Energy storage Energy storage Energy storage Energy storage will also lead to increased demand flexibilitywill also lead to increased demand flexibilitywill also lead to increased demand flexibilitywill also lead to increased demand flexibility
Demand for electricity is generally inflexible. It is the responsibility of the utility to alter generation to balance the varying demand requirements during the day and throughout the year. As discussed earlier, rising renewable power generation is eroding the control of utilities over the supply side. Adoption of battery storage by utilities should help recover this control over generation.
However what is more interesting is that demand could become more flexible and sensitive to price signals from the utilities. This will based on greater adoption of behind-the-meter energy storage coupled with an evolving internet of things which is leading to integrated residential appliances. A smart grid can help utilities adopt real-time pricing with consumers incentivised to shift the demand load from high-price to low-price times of the day. A smarter grid at its most efficient can help reshape the electricity demand load curve to mirror renewable electricity generation.

Berenberg Thematics
123
Demand flexibility can be achieved through the widespread adoption of behind-the-meter energy
storage systems
Source: Rocky Mountain Institute – “The Economics of Demand Flexibility”
Obsolescence risk for gas peaker power plants Obsolescence risk for gas peaker power plants Obsolescence risk for gas peaker power plants Obsolescence risk for gas peaker power plants
The medium-term disruptive impact of utility-scale stationary storage will be on peaker plants, which are predominantly used for balancing seasonal fluctuations in load. These are predominantly gas-fired because of the lower operating cost of gas, but some also run on diesel and coal. The leading manufacturers of gas-fired combustion turbine (CT) plants are GE, Siemens, Alstom and MHI. CT gas plant capacities range from 300MW to 500MW, with GE 7FA and Siemens-501 the two dominant CT gas models.
These peaker plants are designed to minimised fixed cost and hence suffer from high operating costs versus combined cycle (CC) gas plants (the cost difference is as high as 40%). However, the main issue with peaker plants is their poor utilisation rate, which on average is below 5%.
The total installed cost of a CT gas peaker plant is around $1,000/kW according to a 2014 study by consultant The Brattle Group, which analysed the cost of setting up a combustion turbine gas peaker plant in the US. Assuming 1) a 5% utilisation rate, 2) fuel efficiency of 0.1MWh/mmbtu, and 3) an average cost of gas of $5.5/mmbtu, we estimate the levelised cost of production to be $0.19-0.22/kWh. This is higher than the $0.15-0.2/kWh/cycle cost for utility-scale storage solutions. With storage prices continuing to decline, the economic rationale for gas and diesel peaker plants should significantly decline.
Capital cost for CT gas is ~$1,000/kWh Total levelised cost for CT gas peaker plants comes at $0.19-
0.22/kWh, higher than that for utility-scale storage solutions
Source: The Brattle Group, Berenberg estimates Source: Berenberg estimates, The Brattle Group
CATEGORYCATEGORYCATEGORYCATEGORY DEMAND FLEXIBILITY CAPABILITY DEMAND FLEXIBILITY CAPABILITY DEMAND FLEXIBILITY CAPABILITY DEMAND FLEXIBILITY CAPABILITY GRID VALUEGRID VALUEGRID VALUEGRID VALUE CUSTOMER VALUECUSTOMER VALUECUSTOMER VALUECUSTOMER VALUE
Category
Can reduce the grid's peak load and
flatten the aggregate demand profile
of customers
Avoided generation,
transmission, and
distribution investment;
grid losses; and equipment
degradation
Under rates that price peak
demand (e.g. demand
charges) lowers customer
bills
Energy Can shift load from high-price to low-
price times
Avoided production from
high-marginal-cost
resources
Under rates that provide
time-varying pricing (e.g.
time-of-use or real-time
pricing), lowers customer
bills
Renewable energy
integration
Can reshape load profiles to match
renewable energy production
profiles better (e.g. rooftop solar PV)
Mitigated integration
challenges (e.g. ramping,
minimum load)
Under rates that incentivize
onsite consumption (e.g.
reduced PV export
compensation), lowers
customer bills
Total equipment, 126
EPC costs, 191
Non EPC costs, 83
CapexCapexCapexCapex= = = = $400m for a $400m for a $400m for a $400m for a 400MW plant400MW plant400MW plant400MW plant
CT gas plantCT gas plantCT gas plantCT gas plant $/kWh$/kWh$/kWh$/kWh
Capex/kWh 0.11
Fuel cost/kWh 0.05
Maintenance/kWh 0.03-0.06
Total levelised costTotal levelised costTotal levelised costTotal levelised cost 0.19-0.220.19-0.220.19-0.220.19-0.22
Total levelised cost of Total levelised cost of Total levelised cost of Total levelised cost of
utility scale storageutility scale storageutility scale storageutility scale storage0.15-0.20.15-0.20.15-0.20.15-0.2

Berenberg Thematics
124
Implications for utilities – battery storage is more of an opportunity
than an “existential” threat
Solar PV cost continuesSolar PV cost continuesSolar PV cost continuesSolar PV cost continues to head downwards to head downwards to head downwards to head downwards –––– residential solar PVs will become residential solar PVs will become residential solar PVs will become residential solar PVs will become competitive with the grid even without subsidies by 2020competitive with the grid even without subsidies by 2020competitive with the grid even without subsidies by 2020competitive with the grid even without subsidies by 2020
Global solar PV installed capacity has risen from 40GW in 2010 to more than 180GW in 2015. This impressive growth has been on the back of generous subsidies in both the US and Europe in the form of investment tax rebates (ITRs) and feed-in-tariff (FIT) rates to export excess electricity to the grid. These subsidies have been necessary in the initial growth phase when solar PVs lacked manufacturing scale. The strategy has clearly worked: the prices for solar PVs have continued to drop sharply, which is improving the competitiveness of solar PVs over traditional sources of energy, even in the absence of subsides. In just the last five years, the price of solar PVs has fallen to around $0.6/W in 2015 from ~$13/W. While the ongoing cost reduction for solar PVs is fast making them competitive with the grid, most countries are now phasing out their generous FITs which have been incentivising households with solar PVs to increase self-consumption through storage products.
Solar PV prices have fallen by $1/W while the average total cost
is ~2.9/W Battery storage costs have halved over the last five years
Source: RolandBerger Source: Berenberg estimates
The LCOE generated through residential solar panels has fallen to a broad range of $0.14-0.46/kWh. Country level differences can be explained by variations in the level of irradiation, import tariffs on PVs and installation costs. As can be seen chart below left, the LCOE for small-scale residential solar PVs in southern Germany and Australia is already below residential electricity retail rates, even in the absence of subsidies. In Germany, the LCOE for residential PVs is $0.14/kWh lower than retail electricity tariff rates. If the ongoing cost decline of 7-10% pa for solar PVs continues over the next five years, residential solar PVs will be cheaper than the grid in most of the large economies and will not require direct subsidies.
1970 1975 1980 1985 1990 1995 2000 2005 2010 2015 2020
Solar PV Experience Curve [MW, USD/WATTP]Solar PV Experience Curve [MW, USD/WATTP]Solar PV Experience Curve [MW, USD/WATTP]Solar PV Experience Curve [MW, USD/WATTP]
Crystalline Silicon
0.1
1.0
10.0
100.0
PV module price [USD 2014/Wp] 2001
2002
2003
2004
2005
2006 2007 20082009
20102011 2012
201320142015y = -15.6x + 718
R² = 89%
0
100
200
300
400
500
600
700
800
900
0 5 10 15 20 25 30 35 40
Production (GWh)
Price ($/kWh)

Berenberg Thematics
125
Grid parity in 2014 – the LCOE for residential solar panels was
lower than retail tariff rates in Australia and Germany
Residential solar grid parity will be achieved in the US and the UK
by 2020 if the ongoing reduction in solar PV costs continues
Source: Berenberg estimates, IEA, Eurostat, EIA Source: Berenberg estimates, IEA, Eurostat, EIA
“Solar“Solar“Solar“Solar----plusplusplusplus----storage” systems will become competitive with the grid by 2020 storage” systems will become competitive with the grid by 2020 storage” systems will become competitive with the grid by 2020 storage” systems will become competitive with the grid by 2020
Currently the cost of residential battery storage system is greater than $800/kWh (including cost of inverter and installation). We project this to fall to $500/kWh by 2020. We believe the levelised cost of storage for the residential system should fall at a faster pace, from $0.17/kWh/cycle in 2015 to $0.06/kWh/cycle in 2020, because of the increase in cycle life of battery storage products from an average of 5,000 to 10,000 cycles following ongoing technological improvements. This would mean that “solar-plus-storage” systems will become competitive with the grid in the UK, Australia, China and in many more states in the US in addition to Germany by 2020.
Currently, residential battery storage coupled with solar PV has an LCOE ranging from $0.34/kWh to $0.63/kWh. Only in Germany and in some states in the US (Connecticut, Massachusetts, New York, Hawaii) and Australia (Queensland, Tasmania, Victoria), where electricity tariff rates are very high, can residential solar-plus-storage systems compete with the grid.
Solar-and-storage has not achieved grid parity in the absence of
subsidies – only in Germany is the LCOE for residential solar-
plus-storage close to the retail tariff rates
By 2020, residential solar-plus-storage should be competitive
with the grid even in the absence of subsidies in the UK and
Australia; in the US, it will vary from state to state due to the
sharp variation in retail tariff rates
Source: Berenberg estimates, IEA, Eurostat, EIA Source: Berenberg estimates, IEA, Eurostat, EIA
Globally ~0.7TWh per annum (global demand exceeds 24,000TWh) of electricity Globally ~0.7TWh per annum (global demand exceeds 24,000TWh) of electricity Globally ~0.7TWh per annum (global demand exceeds 24,000TWh) of electricity Globally ~0.7TWh per annum (global demand exceeds 24,000TWh) of electricity demand will be lost to residential storage products by 2020 demand will be lost to residential storage products by 2020 demand will be lost to residential storage products by 2020 demand will be lost to residential storage products by 2020
While residential storage is headed towards strong growth, we think that it represents only a limited medium-term risk to utilities. This is because even if we assume that 1) one in every three Solar PV systems are sold with battery storage systems by 2020 and 2) 20% of the current residential installed base adopts storage on a global basis, this would translate into ~20GWh of residential storage installed capacity. Even if we assume daily cycling of
US
(California)
US
(average)
AustraliaGermany
UK
France
China
0
0.1
0.2
0.3
0.4
0.5
0.00 0.10 0.20 0.30 0.40 0.50
2015 Residential2015 Residential2015 Residential2015 Residential retail tariff rates ($/kWh)retail tariff rates ($/kWh)retail tariff rates ($/kWh)retail tariff rates ($/kWh)
2014 Residential
2014 Residential
2014 Residential
2014 ResidentialSolar LCOE
Solar LCOE
Solar LCOE
Solar LCOE
($/kWh)
($/kWh)
($/kWh)
($/kWh) US
(California)
US
(average)
Australia
Germany
UK
France
China
0
0.1
0.2
0.3
0.4
0.00 0.10 0.20 0.30 0.40
2015 Residential2015 Residential2015 Residential2015 Residential retail tariff rates ($/kWh)retail tariff rates ($/kWh)retail tariff rates ($/kWh)retail tariff rates ($/kWh)
2020 Residential
2020 Residential
2020 Residential
2020 ResidentialSolar LCOE
Solar LCOE
Solar LCOE
Solar LCOE
($/kWh)
($/kWh)
($/kWh)
($/kWh)
US
(California)
US
(average)Australia
Germany
UK
France
China
0.00
0.10
0.20
0.30
0.40
0.50
0.60
0.70
0.00 0.20 0.40 0.60
2015 Residential2015 Residential2015 Residential2015 Residential retail tariff rates ($/kWh)retail tariff rates ($/kWh)retail tariff rates ($/kWh)retail tariff rates ($/kWh)
2015 Residential
2015 Residential
2015 Residential
2015 ResidentialSolar plus Storage
Solar plus Storage
Solar plus Storage
Solar plus Storage
LCOE ($/kWh)
LCOE ($/kWh)
LCOE ($/kWh)
LCOE ($/kWh)
US
(California)
US
(average)
Australia
Germany
UK
France
China
0.0
0.1
0.2
0.3
0.4
0.0 0.1 0.2 0.3 0.4
2015 Residential2015 Residential2015 Residential2015 Residential retail tariff rates ($/kWh)retail tariff rates ($/kWh)retail tariff rates ($/kWh)retail tariff rates ($/kWh)
2020 Residential
2020 Residential
2020 Residential
2020 ResidentialSolar plus Storage
Solar plus Storage
Solar plus Storage
Solar plus Storage
LCOE ($/kWh)
LCOE ($/kWh)
LCOE ($/kWh)
LCOE ($/kWh)

Berenberg Thematics
126
this storage capacity, on a yearly basis it would translate into ~7.3TWh of electricity storage. This is miniscule versus global electricity consumption per annum, which exceeds 24,000TWh.
Globally, we expect residential battery storage capacity to increase to 20GWh by 2020; this
translates into electricity demand loss of 7.3TWh per annum versus global demand of more than
24,000TWh
Source: Berenberg estimates, PV-magazine, SEIA
4% PEV sales penetration (5.7m all electric vehicles stock) by 2020 will add 4% PEV sales penetration (5.7m all electric vehicles stock) by 2020 will add 4% PEV sales penetration (5.7m all electric vehicles stock) by 2020 will add 4% PEV sales penetration (5.7m all electric vehicles stock) by 2020 will add 26TWh per annum to global demand for electricity 26TWh per annum to global demand for electricity 26TWh per annum to global demand for electricity 26TWh per annum to global demand for electricity
We expect the number of all-electric cars (ie BEVs) to exceed 5.7m globally by 2020, compared with c0.5m currently. Assuming 1) an average of 15,000miles run by a BEV during a year and 2) average BEV efficiency of 28kWh/100miles, we estimate that global demand for electricity for passenger transportation will exceed 26TWh by 2020. Adding potentially 10TWh of demand from mass transportation, total demand from transportation could exceed 36TWh. We think that this is an opportunity for utilities, and that transportation energy could develop as a higher-margin business for them with a margin profile greater than that for residential electricity usage. We believe that EV drivers would be willing to pay a price premium for accessing rapid DC charging stations (with high voltage and power) versus three-phase AC charging. In the long term (a 10-year horizon), the potential for growth is significant for utilities as electrification of the transportation sectors gather pace.
We expect number of all-electric cars on the roads globally to
rise to 5.7m by 2020 from fewer than 0.5m currently…
…This would translate into global demand for electricity to rise to
26TWh
Source: The Brattle Group, Berenberg estimates Source: Berenberg estimates, The Brattle Group
1.0 2.7
4.0 2.3
20
0
5
10
15
20
25
UK US Germany Australia Global
Residential storage installed capacity (2020)
GWh
7
4
1
0
1
2
3
4
5
6
7
8
PEVs sales in mnPEVs sales in mnPEVs sales in mnPEVs sales in mn EVpenetration2020 = 7%(Bull case)
EVpenetration2020 = 4%(Base case)
EVpenetration2020 = 1%(Bear case)
39
26 26 26 26
11
0
5
10
15
20
25
30
35
40
45
2014
2015E
2016E
2017E
2018E
2019E
2020E
TWh per annum
TWh per annum
TWh per annum
TWh per annum EV
penetration2020 = 7%(Bull case)
EVpenetration
2020 = 4%(Base case)
EVpenetration2020 = 1%
(Bear case)

Berenberg Thematics
127
The challenge for utilities is to create a more efficient and flexible power system The challenge for utilities is to create a more efficient and flexible power system The challenge for utilities is to create a more efficient and flexible power system The challenge for utilities is to create a more efficient and flexible power system
As discussed above, cost reduction for storage will make distributed power generation through renewables a viable competitor to the traditional centralised power generation, transmission and distribution model over the next five years. Old, expensive and inefficient centralised power generation capacity (such as single-cycle gas combustion turbine plants for load management) will likely need to be phased out over time. Instead, utilities will need to adapt to increased renewable electricity generation by increasing utility scale battery storage capacity. This would be necessary to meet the likely increased volatility in electricity demand because of rising renewable generation. Behind-the-meter storage systems (because of their limited scale) would be unable to smooth these demand variations completely.
At the same time, utilities will need to take measures to make electricity demand more flexible through the creation of an interconnected grid where smart meters and intelligent home appliances are able to respond to pricing signals. Another measure which could make the grid more efficient would be for utilities to create electricity trading platforms which allows for the sharing of behind-the-meter distributed generation and storage capacity. Households will hence have to pay the utilities for the distribution infrastructure and access to the grid for supply security. While we do think that solar and storage will become competitive, we do not believe that this would translate into consumers leaving the grid. This is because 100% grid independence would require households to either over-scale their expensive solar generation and storage capacity or to have inefficient and expensive back-up diesel power generation units to meet the seasonal/weather-related variation of electricity generation. Hence, while theoretically 100% grid independence is possible, it will remain economically impractical even in 2020. If we include network costs to the levelised cost of solar-plus-storage (see chart below), the cost of maintaining access to the grid will make the total cost of solar and storage higher than retail electricity tariff rates in most countries even in 2020.
Including network costs to solar-and-storage LCOE in 2020 will make it more expensive than
residential retail electricity tariffs in most countries excluding Germany and Australia
Source: Berenberg estimates, PV-magazine, SEIA
As we discussed in detail in Section 2, rising demand for electricity from EVs could place pressure on the grid considering its high voltage and power requirements – the load of a residential level one AC charger (2-10kW) is equivalent to an air conditioning unit, while that of a three-phase AC public charger (20kWh) is equivalent to the load of a large household. The 120kW level three DC chargers being installed by Tesla generate loads which are many times higher than level two chargers. While we expect annual demand for electricity from EVs to rise by 23GWh by 2020, peak demand is likely to jump even more. The increase in peak demand will depend on the relative roll-out of level one, level two and level three chargers (considering their different power requirements). Currently, ~90% of the charging is done at home via level one chargers. While the power requirement of an individual EV charger is not a concern, if everyone plugs their car intro the system as soon as they return home from work at 6pm-7pm, it would make supply-demand balancing
US
(California)
US
(average) Australia
GermanyUK
France
China
0.0
0.1
0.2
0.3
0.4
0.5
0.0 0.1 0.1 0.2 0.2 0.3 0.3 0.4 0.4 0.5 0.5
2015 Residential2015 Residential2015 Residential2015 Residential retail tariff rates ($/kWh)retail tariff rates ($/kWh)retail tariff rates ($/kWh)retail tariff rates ($/kWh)
2020 Residential
2020 Residential
2020 Residential
2020 Residential"Solar plus Storage" LCOE
"Solar plus Storage" LCOE
"Solar plus Storage" LCOE
"Solar plus Storage" LCOE
incl. network costs ($/kWh)
incl. network costs ($/kWh)
incl. network costs ($/kWh)
incl. network costs ($/kWh)

Berenberg Thematics
128
problematic, especially in countries where evening are the peak time for electricity consumption. Hence, utilities will need to play a role in altering demand by imposing demand-/time-based tariffs which incentivise charging later at night rather than in the evening.
Regulatory changes will be required Regulatory changes will be required Regulatory changes will be required Regulatory changes will be required –––– someone needs to pay for the grid someone needs to pay for the grid someone needs to pay for the grid someone needs to pay for the grid
Upgrades to create an interconnected grid which is able to meet increased peak loads (due to rising renewables and higher EVs) through higher utility scale storage will likely entail utilities charging more for their distribution assets in the form of a higher grid charge. In addition, consumers with higher levels of self-consumption through solar PVs and storage will need to pay more to access the grid compared to households which have complete reliance on the grid. This is because grid cost allocation based on the level of consumption penalises households with no solar. Higher grid charges for solar PV residential households is already being debated in regions such as the US and Australia. Although higher grid charges for consumer with self-generation/consumption will likely prove highly controversial, we think that eventually this will be required in order to incentivise utilities to invest in generation and distribution assets. Eventually, direct taxation on self-consumption could also be a possibility.
RWE, E.ON and Enel are leading European utilities in altering their business RWE, E.ON and Enel are leading European utilities in altering their business RWE, E.ON and Enel are leading European utilities in altering their business RWE, E.ON and Enel are leading European utilities in altering their business models towards renewables, storage and charging infrastrucmodels towards renewables, storage and charging infrastrucmodels towards renewables, storage and charging infrastrucmodels towards renewables, storage and charging infrastructure deploymentture deploymentture deploymentture deployment
Europe’s largest utilities, such as RWE, Enel and E.ON, are attempting to drastically refocus their businesses away from centralised power generation and transmission towards distributed renewable electricity generation and distribution. This is in the face of rising distributed renewable power generation, which has led to a continued drop in wholesale tariff rates across Europe. Until a year ago, the large traditional European utilities together accounted for less than 1% of the solar PV installed capacity in Europe. With distributed generation and storage likely to become the new normal in the power sector, European utilities are radically restructuring so that they do not experience a repeat of what has happened due to solar PVs over the last eight years. In addition, a number of them are playing a central role in rolling out EV charging stations across Europe. We think that this time around, utilities are likely to capture a significant share of this growing market, considering their extensive distribution network base and established consumer base. The chart below details the exposure of European utilities to renewable energy, storage and charging infrastructure.

Berenberg Thematics
129
European utilities exposure ranking grid– RWE, E.ON and Enel are currently leading in their exposure to distributed renewable generation, grid scale storage, retail energy products (battery packs)
and EV charging stations
Source: Berenberg, Company reports and presentations, Cleantecnica
Distributed renewable generation (Ex. Distributed renewable generation (Ex. Distributed renewable generation (Ex. Distributed renewable generation (Ex.
Hydro)Hydro)Hydro)Hydro)Installation of grid scale storageInstallation of grid scale storageInstallation of grid scale storageInstallation of grid scale storage
Retail offering: Residential storage and Retail offering: Residential storage and Retail offering: Residential storage and Retail offering: Residential storage and
energy management systems energy management systems energy management systems energy management systems Charging infrastructure deploymentCharging infrastructure deploymentCharging infrastructure deploymentCharging infrastructure deployment
Overall Exposure Overall Exposure Overall Exposure Overall Exposure (to renewables, grid scale & (to renewables, grid scale & (to renewables, grid scale & (to renewables, grid scale &
residential storage and charging residential storage and charging residential storage and charging residential storage and charging
infrastructure)infrastructure)infrastructure)infrastructure)
European UtilitiesEuropean UtilitiesEuropean UtilitiesEuropean Utilities
RWERWERWERWE MediumMediumMediumMedium Low Low Low Low HighHighHighHigh Very HighVery HighVery HighVery High HighHighHighHigh
c7% of energy generation capacity is from
renewable sources.
Currently only has 1MW grid storage. This is likely
change with company split
RWE well positioned in the residential storage
market. Selling residential storage products under
its brand name in Germany
Operates 2'700charging points in Europe
E.ONE.ONE.ONE.ON HighHighHighHigh Low Low Low Low Low Low Low Low HighHighHighHigh HighHighHighHigh
E.ON plans to spin off its conventional generation
and energy trading business (Uniper) and will now
focus on renewable energy and distribution
Has only installed 1MW of grod scale storage over
2010-14. 4MW of storage under construction and
20MW of storage project in US announced.
No residential or power management product
offering. E.ON will be rolling out smart monitors and
smart electricity mintors
Has installed more than 800 charging stations in
Germany and Denmark.
EnelEnelEnelEnel MediumMediumMediumMedium Very HighVery HighVery HighVery High Zero Zero Zero Zero HighHighHighHigh HighHighHighHigh
Enel Group has c8% capacity exposure to
renewables
Has added 214MW of grid storage over 2010-14.
Will likely be adding more capacity with the
merger with Enel Green Power
No residential or power management product
offering.
Has added 853 charging points in Spain over 2011-
14 and has increased its network by 2.5x.
FortumFortumFortumFortum LowLowLowLow Zero Zero Zero Zero Zero Zero Zero Zero HighHighHighHigh LowLowLowLow
Only c1% of power generation capacity comes from
renewable resources No grid storage installations No residential storage product
Operates 450 charging points in Norway, Sweden
and Finland.
GDF Suez - EngieGDF Suez - EngieGDF Suez - EngieGDF Suez - Engie Low-Medium Low-Medium Low-Medium Low-Medium Zero Zero Zero Zero Zero Zero Zero Zero Low Low Low Low Low Low Low Low
c5% of generation capacity sourced from
renewable technology.No grid storage installations No residential storage product Has installed a few charging points in Belgium
IberdrolaIberdrolaIberdrolaIberdrola Very HighVery HighVery HighVery High Low Low Low Low Low Low Low Low HighHighHighHigh MediumMediumMediumMedium
Over 30% of Iberdrola's installed capacity is
exposed to Renewables.Less than 1MW of grid storage capacity
No residential or power management product
offering. Will be rolling out smart meters
Iberdrola has offered a charging solution product
for public and private sector fleets which has
installed 224 charging points across Spain
VerbundVerbundVerbundVerbund Low-Medium Low-Medium Low-Medium Low-Medium Low Low Low Low Zero Zero Zero Zero Low-Medium Low-Medium Low-Medium Low-Medium Low Low Low Low
Primarily a hydro electric power business, only c4-
5% of Verbunds maxiumum electrical capacity is
from wind and solar.
Less than 1MW of grid storage (non hydro)
capacity No residential storage product Adding 115 fast charging stations in Eastern Europe
CentricaCentricaCentricaCentrica Low-Medium Low-Medium Low-Medium Low-Medium Low Low Low Low Zero Zero Zero Zero Low Low Low Low Low Low Low Low
c5% of Centrica's total installed capacity is from
renewable resources.
Less than 1MW of grid storage (non hydro)
capacity No residential storage product Insignificant exposure
Red ElectricaRed ElectricaRed ElectricaRed Electrica Low-Medium Low-Medium Low-Medium Low-Medium Low Low Low Low Zero Zero Zero Zero Low Low Low Low Low Low Low Low
Zero renewable generation ~1MW of grid storage (non hydro) capacity No residential storage product Insignificant exposure
EDFEDFEDFEDF LowLowLowLow Low-Medium Low-Medium Low-Medium Low-Medium Low Low Low Low HighHighHighHigh LowLowLowLow
Currently only 4-5% of energy generation is from
renewables.
Only 5MW of grid storage capacity added over
2010-15. 14MW of new storage proj. in progress
No residential or power management product
offering. EDF will be rolling out smart meters.
Its subsidiary Sodetrel is setting up charging
stations in France. Currently operats 200 stations
SSESSESSESSE HighHighHighHigh Low Low Low Low Low Low Low Low Low-Medium Low-Medium Low-Medium Low-Medium MediumMediumMediumMedium
c18% of SSE's genertion capacity is renewableWill be adding a 2MW Li-ion grid storage system in
UK
No residential storage product offering. Installs
smart meters in UK
Adding charging stations in UK (Hampshire,
Oxfordshore, Newport)
TernaTernaTernaTerna HighHighHighHigh Zero Zero Zero Zero Low Low Low Low Low-Medium Low-Medium Low-Medium Low-Medium
Has installed 47MW of grid stoarge over 2010-14.
Has 27MW of grid storage under construction and
plans to add 130MW of storage
No residential storage product Insignificant exposure
National GridNational GridNational GridNational Grid HighHighHighHigh Low Low Low Low Low-Medium Low-Medium Low-Medium Low-Medium Low-Medium Low-Medium Low-Medium Low-Medium
Will be 200MW of grid scale storage . Project to be
tendered in 1Q16
No residential storage product. Will be installing
smart meters.
Partnered with chargepoint and installing charging
stations in Massachussets and New York
Note: Level of exposure ranking. 5 Stars= VERY HIGH, 4 Stars = HIGH, 3 stars= MEDIUM, 2 Stars= LOW-MEDIUM,1 Star=LOW
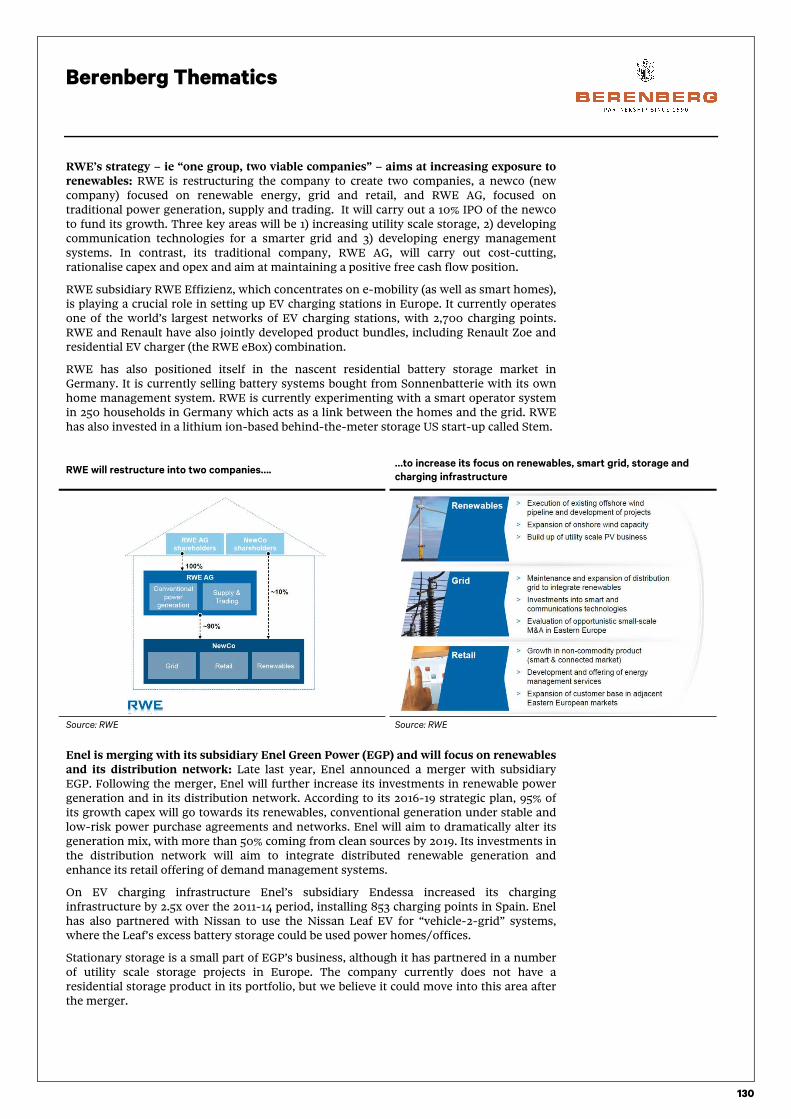
Berenberg Thematics
130
RWE’s strategy – ie “one group, two viable companies” – aims at increasing exposure to renewables: RWE is restructuring the company to create two companies, a newco (new company) focused on renewable energy, grid and retail, and RWE AG, focused on traditional power generation, supply and trading. It will carry out a 10% IPO of the newco to fund its growth. Three key areas will be 1) increasing utility scale storage, 2) developing communication technologies for a smarter grid and 3) developing energy management systems. In contrast, its traditional company, RWE AG, will carry out cost-cutting, rationalise capex and opex and aim at maintaining a positive free cash flow position.
RWE subsidiary RWE Effizienz, which concentrates on e-mobility (as well as smart homes), is playing a crucial role in setting up EV charging stations in Europe. It currently operates one of the world’s largest networks of EV charging stations, with 2,700 charging points. RWE and Renault have also jointly developed product bundles, including Renault Zoe and residential EV charger (the RWE eBox) combination.
RWE has also positioned itself in the nascent residential battery storage market in Germany. It is currently selling battery systems bought from Sonnenbatterie with its own home management system. RWE is currently experimenting with a smart operator system in 250 households in Germany which acts as a link between the homes and the grid. RWE has also invested in a lithium ion-based behind-the-meter storage US start-up called Stem.
RWE will restructure into two companies…. …to increase its focus on renewables, smart grid, storage and
charging infrastructure
Source: RWE Source: RWE
Enel is merging with its subsidiary Enel Green Power (EGP) and will focus on renewables and its distribution network: Late last year, Enel announced a merger with subsidiary EGP. Following the merger, Enel will further increase its investments in renewable power generation and in its distribution network. According to its 2016-19 strategic plan, 95% of its growth capex will go towards its renewables, conventional generation under stable and low-risk power purchase agreements and networks. Enel will aim to dramatically alter its generation mix, with more than 50% coming from clean sources by 2019. Its investments in the distribution network will aim to integrate distributed renewable generation and enhance its retail offering of demand management systems.
On EV charging infrastructure Enel’s subsidiary Endessa increased its charging infrastructure by 2.5x over the 2011-14 period, installing 853 charging points in Spain. Enel has also partnered with Nissan to use the Nissan Leaf EV for “vehicle-2-grid” systems, where the Leaf’s excess battery storage could be used power homes/offices.
Stationary storage is a small part of EGP’s business, although it has partnered in a number of utility scale storage projects in Europe. The company currently does not have a residential storage product in its portfolio, but we believe it could move into this area after the merger.

Berenberg Thematics
131
E.ON has spun off its conventional generation and energy trading business as a new company – Uniper. E.ON itself is now focusing on renewable energy generation and distribution: Similar to RWE, E.ON has spun off its traditional business as a separate company, called Uniper. E.ON will now focus on expanding its wind and solar power generation and in expanding and upgrading its distribution network across Europe. As part of its reorganisation, it will sell its business in Spain and Portugal (to Macquarie for €2.5bn) and Italy and is also reviewing its oil and gas assets in the North Sea.
E.ON operates e-mobility charging solutions across 10 European countries and operates more than 800 charging points in Germany and Denmark. Late last year, it also entered a partnership with charging network e-clearing.net. According to E.ON, its participation will allow the network to expand its network by about 800 charging points. The company is also working in partnership with BMW and Siemens to install DC fast-charging stations in Germany.
Value chain for the power sector
Source: Berenberg, company reports and presentations, Cleantecnica
Utilities Battery manufacturers Power electronics suppliers Energy Storage vendors Integrators
(+) Strong demand growth outlook for batteries for stationary storage
(~/+) Stationary storage will help utilities defer capital
expenditures, help in improving
utilization of generating assets and
increase grid reiliability and
efficiency
(+) Strong demand for power electronics to integrate stationary
storage in a distributed energy
network and a smarter grid
(+) Energy storage vendors will benefit from rising residential
demand for renewable electricity
storage systems
(+) Strong demand growth for integrating energy storage systems
with the grid
(+) Rising production of lithium ion cells will put upward pressure on
important raw materials such as
Lithium, Cobalt and Nickel.
Lithium ion (LFP & LMO)Lithium ion (LFP & LMO)Lithium ion (LFP & LMO)Lithium ion (LFP & LMO)Leading in renewables, storage and Leading in renewables, storage and Leading in renewables, storage and Leading in renewables, storage and
charging stationscharging stationscharging stationscharging stationsABB
SMASMASMASMAXtreme Power RecyclingRecyclingRecyclingRecycling
SaftSaftSaftSaft RWERWERWERWE Alstom Solutronics 1Energy Johnson ControlJohnson ControlJohnson ControlJohnson Control
Alevo E.ONE.ONE.ONE.ON Schneider Electric ABB Greensmith Umicore
A123 systems EnelEnelEnelEnel Princton Power Systems Bosch Geli Retriev
Boston Power Dyanapower company Dow Kokam SolarGrid storage Xtrata
BYDBYDBYDBYD Utilities catching up in exposureUtilities catching up in exposureUtilities catching up in exposureUtilities catching up in exposure Siemens Saft Green Charge Network LithoRec
Samsung National Grid Sharp Aquion Energy Sunverge Tesla?
Valence Terna Ideal Power Beacon Power Tangent energy solutions Apple?
Voltronix Iberdrola Nidec K2 Energy Demand energy JCI?
European Batteries Coda
Sony LaggingLaggingLaggingLagging Lishen Second lifeSecond lifeSecond lifeSecond life
EDF EnerVault Freewire
Red Electrica A123 Mitsubishi
Flow batteriesFlow batteriesFlow batteriesFlow batteries Verbund redflow EDF
UniEnergy GDF
EnerVault Centrica
ViZn Energy Systems
Gilemeister
RedTRedTRedTRedT
Redflow
Salt batteriesSalt batteriesSalt batteriesSalt batteries
NGK
GE
Fiam
Advanced lead acidAdvanced lead acidAdvanced lead acidAdvanced lead acid
Johnsons ControlJohnsons ControlJohnsons ControlJohnsons Control
Enersys
Exide
East Penn
Younicos
GS
Implications for margins and growthImplications for margins and growthImplications for margins and growthImplications for margins and growth
Battery manufacturers
Power utilities -generation,
transmission & distributions
Power electronics suppliers -software & hardware
Energy Storage vendors
IntegratorsRecycling/ second
life

Berenberg Thematics
132
SAFT (market cap: €0.6bn)
Business description: SAFT is a global leader in developing and manufacturing industrial batteries. The business is roughly evenly split evenly between North America, Europe and Asia. It specialises in nickel (batteries for industrial standby, aviation and telecoms applications), primary lithium (long-life, non-rechargeable batteries used in smart meters) and lithium ion technologies (used for telecoms back-up in harsh environments, buses, energy storage, transport and defence/space). Unlike the large-scale battery producers, SAFT is more focused on tailor-made solutions, with smaller batch sizes and high-performance applications in protected niches. The company has no exposure to the high-volume EV market.
Growth outlook and opportunities: The company highlighted in its November 2015 capital markets day that it expects its top line to growing by 4-5% pa on average to €900m by 2019.
1) Smart meters/civil electronics (c27% of sales): This business is expected to grow by 5% pa driven by mandated roll-outs of smart meters in key European markets and China. SAFT has a market share of c50-60%. It is also targeting Internet of Things applications and has been increasing capacity in these markets.
2) Industrial stand-by (c25% of sales): SAFT expects 2% annual growth here, driven by a move from lead acid to nickel and lithium ion, especially in emerging markets – again, it claims a c60% market share.
3) Space and defence (c11% of sales): The company is looking for growth of 1-4% in space and defence, a business characterised by long-term, stable contracts with big defence primes, with the ramp-up of production of the F35 battery a key driver, as is the move towards lithium ion in US army applications. In space, SAFT has a 60-70% market share in satellite batteries).
4) Transport (c21% of sales): SAFT aims for 6% annual growth of this division, based on aerospace order backlogs and a steady exposure to the aerospace replacement market (which accounts for about 80% of its transport business, with batteries having to be replaced every 4-5 years), new rail infrastructure investments and the hybridisation of buses (it is a supplier to Volvo).
5) Telecoms and grid (c10% of sales): This division is expected to grow rapidly (+30%) due to the amount of telecoms infrastructure investment rolling out in emerging markets (where due to heat and humidity, lithium ion is a key technology). The company has been disappointed with the level of growth in the ESS (Energy Storage System) market where larger players such as LG and Samsung are being very aggressive on price. As a result, SAFT will focus on more niche ESS projects in harsh environments.
SAFT also has a target to drive EBITDA margins to 16% (from the 14.5% estimated in 2015) due to operational leverage, low raw material costs and improved manufacturing. The company is also targeting a 40-50% dividend payout and announced a €60m buyback (c10%) recently. In areas such as aerospace, space and defence, the company has very high barriers to entry and elsewhere is usually a clear market leader with over 50% market shares.
Key risks: Given its reliance on predominantly industrial end-markets, the company is very much exposed to core underlying GDP growth. Within its industrial standby business, it has around a €50m exposure to the oil and gas markets. The company has already seen new entrants come into the grid ESS market and significantly affect price. Competition is tough – Panasonic in primary lithium, Samsung and LG in lithium ion ESS, and niche players such as Hoppecke and HBL Power Systems in nickel batteries.
Summary: SAFT is the largest listed pure-play battery company in Europe and hence receives a lot of attention from European investors. However, it is very much a specialist player in niche applications where the growth dynamics are very different to those being seen in the automotive markets. It does, however, have exposure to the utility/industry energy storage and also mass transportation markets, which we consider to be areas with significant growth opportunities. The stock has suffered from a volatile history, including a failed joint venture with JCI in automotive batteries. The growth expectations in management guidance would be at the lower end of the growth seen in some of the key end markets.

Berenberg Thematics
133
SAFT in pictures
Divisional revenue split (31 December 2014) Revenue progression
Source: Factset Source: Factset
Capex, CFO, CFF, cash (local currency, m) Net debt/EBITDA
Source: Factset Source: Factset
Company information Share price and valuation
Source: Factset Source: Factset
Industrial Battery Group Specialty Battery Group
Other
700
750
800
850
900
950
2012 2013 2014
Group revenues
$ m
(200)
(150)
(100)
(50)
-
50
100
150
200
2012 2013 2014
Capex CFO CFF Cash
-
0.2
0.4
0.6
0.8
1.0
1.2
2012 2013 2014
Net Debt / EBITDA
SharesSharesSharesShares
Share Price (LC) 23.77
Free float 94.0%
Shares Out (m) 26.50137
CEO Ghislain Lescuyer, MBA
CFO Bruno Dathis
DELACROIX XAVIER
ManagementManagementManagementManagement
Top Insiders / StakeholdersTop Insiders / StakeholdersTop Insiders / StakeholdersTop Insiders / Stakeholders
Saft Groupe SA
CECCHI FRANCK
LEDGER ELIZABETH
Saft Groupe SA Employee Stock Ownership Plan
0
0.5
1
1.5
2
0
10
20
30
40
50
Share Price EV/Sales (RHS)

Berenberg Thematics
134
Solar City (market cap: $4.8bn)
Business description: Solar City is a leading provider, installer and financier of PV solar generation systems in the US and is listed on NASDAQ. It is the largest provider of solar PV systems in the US with an overall market share of around 33% in residential systems. The company is backed by Tesla’s CEO and founder Elon Musk (21.8% ownership), who is also its chairman. The company is both vertically integrating in solar panel manufacturing and is moving into the storage market in partnership with Tesla’s stationary storage business. We believe that Solar City is poised to build upon its market-leading position in residential solar PVs by offering an integrated low-cost storage solution through Tesla.
Growth outlook and opportunities: Solar PV electricity generation capacity in the US is one of the highest in the world (22.7GW). This growth in PV installations has been underpinned by the 30% investment tax credit (ITC) deployed in 2006 for both the residential and commercial sectors. As a result, solar PV installations in the US have grown at a CAGR of more than 70% since 2006. The ITC was set to expire by the end of 2016, but has now been extended to expire after 2022. Prices for solar PV have fallen well below $3/watt and its electricity generation costs are already lower than the electricity tariffs being offered by utilities in the US. Assuming that PV cost reduction continues at the current rate, it would likely make solar generation competitive with the grid after the ITC has been phased out. Solar City has a 30% market share in the Solar PV market and is likely to gain from the extension of the ITC.
Solar City has recently shifted focus from growth towards cost reduction. It has previously been growing its PV installed base by more than 80% pa, but will now look to limit growth at ~40% pa. The company will seek new customers through referrals, which will reduce its selling and marketing expenses. Solar City aims to reduce the total system cost of solar PVs from the current $2.9/W ($2.2/W is the cost of the panel) to below $2.5/W by 2017 and become cash-flow-positive by the end of 2016.
The company will be significantly increasing its vertical integration into PV manufacturing with the start-up of its 1GW manufacturing facility in Buffalo, New York. The plant will be the largest solar panel plant in the US and Europe, and will be ramping up to its nameplate capacity by 2017, ultimately producing 10,000 solar panels per day. The plant will focus on producing higher efficiency panels (22% versus 15-18% for most others), which will help it to further reduce the cost of PV solar installation by ~9%. At a $2.2-2.3/kWh total system cost, Solar City should be able to compete with the grid even without the 30% ITC in the US.
Key risk: 1) Solar PV installation in the US is likely to fall off after peaking in 2016, as much of the planned capacity was to the benefit from the ITC before its initial expiry by end-2016. While we expect the slowdown will be temporary, Solar City may need to expedite its cost reduction measures to meet its target to become cash-flow-positive and reduce solar PV costs. 2) Solar City is partnering with Tesla to sell its storage products in the US. If Tesla opts for multiple vendors for its storage products, then the benefit to Solar City could be limited. 3) The company will be increasing manufacturing capacity for solar panels over the next few years, which will increase execution risk.
Summary: Solar City will be selling Tesla’s storage systems in conjunction with its solar generation systems to residential and commercial clients. Storage will likely improve the economic rationale of its solar offering. For commercial customers, storage capability will allow for lower demand charges; at the residential level, it will promote self-consumption. We think that Solar City’s partnership with Tesla will give it an advantage in capturing market share for integrated solar and storage systems for residential and commercial uses.

Berenberg Thematics
135
Solar City in pictures
Divisional revenue split (31 December 2014) Revenue progression
Source: Factset Source: Factset
Capex, CFO, CFF, cash (local currency, m) Net debt versus EBITDA
Source: Factset Source: Factset
Company information Share price and valuation
Source: Factset Source: Factset
Solar Energy Products & Services
-
50
100
150
200
250
300
2012 2013 2014
Group revenues
$ m
(500)
-
500
1,000
1,500
2,000
2012 2013 2014
Capex CFO CFF Cash
-400.00
-200.00
-
200.00
400.00
600.00
800.00
1,000.00
2012 2013 2014
Net Debt EBITDA
SharesSharesSharesShares
Share Price (LC) 29.57
Free float 63.4%
Shares Out (m) 97.589
CEO Lyndon R. Rive
CFO Brad W. Buss
Chariman Elon Reeve Musk
DBL Investors LLC
ManagementManagementManagementManagement
Top Insiders / StakeholdersTop Insiders / StakeholdersTop Insiders / StakeholdersTop Insiders / Stakeholders
MUSK ELON REEVE
Draper Fisher Jurvetson Management LLC
RIVE LYNDON R
RIVE PETER J
0
10
20
30
40
50
0
20
40
60
80
100
Share Price EV/Sales (RHS)
Berenberg Thematics
136
SMA Solar Technology (market cap: €1.3bn)
Business description: SMA is the world’s largest supplier of solar PV and battery inverters and monitoring systems. The company is listed on the Frankfurt Stock Exchange and has its headquarters in Niestetal, Germany. The company has five divisions: Medium Power Solutions (54% of revenues), High Power Solutions (35% of revenues), Services (5%), Railway technology (4%) and Zevesolar (2%).
Growth outlook and opportunities: SMA expects 11% pa growth in solar PV installation until 2018 on the back of national emission targets and long-term incentives programmes such as the 30% ITC (investment tax credit) in the US. On the back of this growth, it expects the global invertor market to grow by 6% pa to €5.6bn by 2018. The company expects the US, Latin American and Asian markets to be the main drivers of growth in solar PVs. It also expects invertor demand for storage systems to rise strongly, and adds that in the best-case scenario, could it form up to 22% of global invertor sales by 2018. Due to its broad invertor product portfolio, strong solar integration knowledge and international sales network, SMA could emerge as a major player in the storage invertor space, in our view.
Key risk: 1) Declining FITs in UK, Germany, Italy and France are likely to have a negative impact on solar uptake in Europe. 2) Increasing competition from Chinese players could erode prices in the long term.
Summary: SMA has a 21% market share in the global invertor market, which is more than double that of its closest competitor. The invertor market is consolidated, with the top five players accounting for 48% of the global sales in 2015. While the decline in FITs in Europe could provide headwinds to SMA’s inverter business in this region, the outlook remains robust in the US and Asia, which will likely make up for the weakness in Europe. We think that the company is well positioned to benefit from the growth in its storage invertor business as stationary storage systems adoption increases over the next five years.

Berenberg Thematics
137
SMA in pictures
Divisional revenue split (31 December 2014) Revenue progression
Source: Factset Source: Factset
Capex, CFO, CFF, cash (local currency, m) Net debt versus EBITDA (net cash)
Source: Factset Source: Factset
Company information Share price and valuation
Source: Factset Source: Factset
Medium Power Solution High Power Solutions
Service Railway Technology
Zevesolar
-
500
1,000
1,500
2,000
2012 2013 2014
Group revenues
$ m
(100)
-
100
200
300
400
500
2012 2013 2014
Capex CFO CFF Cash
-500.00
-400.00
-300.00
-200.00
-100.00
-
100.00
200.00
300.00
2012 2013 2014
Net Debt EBITDA
SharesSharesSharesShares
Share Price (LC) 42.63
Free float 34.3%
Shares Out (m) 34.7
CEO Pierre-Pascal Urbon
WETTLAUFER REINER
ManagementManagementManagementManagement
Top Insiders / StakeholdersTop Insiders / StakeholdersTop Insiders / StakeholdersTop Insiders / Stakeholders
Bitten og Mads Clausens Fond
KLEINKAUF UWE
CRAMER LARS
DREWS VERENA
0
0.5
1
1.5
2
0
10
20
30
40
50
60
Share Price EV/Sales (RHS)

Berenberg Thematics
138
RedT Energy Storage (market cap: £35m)
Business description: RedT is an AIM-listed provider of large-scale stationary energy storage systems based on vanadium flow technology. The storage business was started in 2000 and was previously a division of parent company Camco Clean Energy. Following a change in the company name to RedT at the end of 2015, it will now primarily focus on commercialising its stationary storage business. Hence it is selling legacy assets of the Camco group and in 2015 sold its US biogas assets for $4.6m. RedT will have two divisions: energy storage and Camco Clean Energy business (focusing on developing/financing renewable energy projects in Africa).
In contrast to traditional batteries with fixed total energy storage, the flow batteries that RedT manufactures have electrolyte-based energy storage capacity which is stored externally and pumped through the cell. This allows flow batteries to fulfil energy-intensive and long duration functions for commercial and utility scale applications. RedT vanadium redox flow technology is unique as it avoids contamination issues associated with other flow battery designs.
Growth outlook and opportunities: RedT storage technology has a cycle life which exceeds 10,000 cycles. In addition, the storage system: 1) offers 100% depth of discharge (versus ~80% for lithium ion, which hence needs to be oversized, because not all of the stored electricity can be used) and 2) is thermally stable (which means it does not require expensive cooling systems and is relatively low-maintenance). RedT’s storage systems are suitable for high-cycle applications and also multiple applications simultaneously (ie they have high “revenue stacking” capability). We believe that these factors will significantly enhance the system’s commercial attractiveness despite its higher cost ($600/kWh versus $250/kWh for Tesla’s utility-scale Powerpack storage system).
Diesel generation units are currently used in powering telecommunication towers, construction activity and other commercial activity in remote locations where grid instability is an issue, eg Africa and Asia. These diesel generation units have low utilisation rates and need to be oversized to meet the entire load. According to RedT, diesel generation units can run three times more efficiently at higher utilisation rates if they are coupled with storage systems.
Key risks: 1) RedT storage systems are currently in the trial phase and hence broader adoption will depend on the success of these trials. 2) The company needs to increase its manufacturing scale in order to bring down costs. It will be unable to compete against lithium ion if its scale of manufacturing does not increase over the next 3-5 years. 3) The funding needs of the company will rise as it moves from the trial phase to the commercial phase.
Summary: Over the last 15 years, RedT has gradually moved from the R&D phase to demonstration and now into the commercial phase, introducing its storage products to clients in 2015 through more than 10 seeding units on- and off-grid in the UK, Ireland, Germany and Africa. Based on these demonstration projects, RedT intends to introduce its next-generation storage units, which will be sold commercially for the first time in 2016. Within three years, assuming strong demand for its stationary storage systems, RedT expects to see a significant reduction in manufacturing costs (from the current ~$600/kWh to $350/kWh). We expect the load shifting storage market to grow strongly over the next five years as renewable generation increases globally. RedT along with other flow battery manufacturers are poised to benefit from this growth provided that they are able to bring down costs and eliminate the technical problems which have historically plagued flow batteries.

Berenberg Thematics
139
RedT in pictures
Divisional revenue split (31 December 2014)
Source: Factset
Capex, CFO, CFF, cash (local currency, m) Net debt versus EBITDA
Source: Factset Source: Factset
Company information Share price and valuation
Source: Factset Source: Factset
United States Africa Clean EnergyREDH (CCE) Share-based PaymentsGroup (Other)
(10)
(5)
-
5
10
2012 2013 2014
Capex CFO CFF Cash
-4.00
-2.00
-
2.00
4.00
6.00
8.00
2012 2013 2014
Net Debt EBITDA
SharesSharesSharesShares
Share Price (LC) 0.08
Free float 72.6%
Shares Out (m) 409.8332
CEO Scott James McGregor, MBA
CFO Jonathan Anthony Frank Marren
Greenergy International Ltd.
ManagementManagementManagementManagement
Top Insiders / StakeholdersTop Insiders / StakeholdersTop Insiders / StakeholdersTop Insiders / Stakeholders
Khazanah Nasional Bhd. (Investment Company)
ClearWorld Energy Ltd.
MCGREGOR SCOTT JAMES
MILLAR ANTHONY /CAMCO CLEAN/
0
0.5
1
1.5
2
2.5
3
3.5
0
0.02
0.04
0.06
0.08
0.1
0.12
Share Price EV/Sales (RHS)

Berenberg Thematics
140
Sonnenbatterie (private)
Business description: Sonnenbatterie, a private company founded in 2010, is the market leader in residential storage systems in Germany, where it currently has a battery installed base exceeding 8,500 units out of a total of 25,000 units installed. Leveraging on its large installed base, the company is to launch an electricity trading platform, called SonnenCommunity, where members with access to solar PVs and storage will be able to trade surplus electricity that they are generating but are unable to store. When the electricity network business line is introduced, Sonnenbatterie will be renamed Sonnen GmbH. The company is also expanding in the US, Italy, Australia and the UK.
Sonnenbatterie uses LFP cells, which it currently purchases from Sony. LFP is suitable for stationary storage due to its lower cost, higher cycle life and greater thermal stability. Sonnenbatterie systems have a cycle life of 10,000 cycles and do not need liquid cooling. By contrast, most lithium ion storage systems can only carry out 5,000-6,000 cycles – as is the case with Tesla’s Powerwall system. Sonnen will offer battery systems with storage capacity ranging from 2kWh to 16kWh, covering small to large households. The Tesla storage system only comes in 7kWh or 10kWh sizes.
Growth outlook and opportunities: Over the last three years, Sonnenbatterie has built an extensive and exclusive installer network of local battery centres. These are specialist companies which market, sell and install Sonnenbatterie systems. These resellers have signed binding order commitments with Sonnenbatterie. There are currently 50 Sonnenbatterie centres in Germany, five in Austria and 15 in Italy. We think that the scale of its exclusive network of resellers in Germany is impressive and gives Sonnenbatterie an edge over other battery manufacturers and new players such as Tesla.
Two key issues which have held back residential storage devices are: 1) they are high-cost and 2) storage systems and the solar panels currently need to be significantly over-scaled to achieve full grid independence. Both of these issues can be resolved through microgrids, which allows for electricity trading. Sonnen could emerge as a leader in this market through its SonnenCommunity venture. As part of the SonnenCommunity, members will be able to buy the storage system for only €3,599, buy electricity from members at below the rate they buy from the grid and sell to other members at higher than the FIT rate. We believe that the SonnenCommunity will help Sonnen gain greater traction in the German market and make money through the trading platform.
Sonnenbatterie is one of the few companies which are able offer a fully plug-and-play system. These systems are all monitored online and also come with a self-learning controller which is able to memorise the demand requirements of a household.
Key risks: 1) Competitive pressures in the residential storage markets are rising. This will likely erode pricing and margins for all players. 2) Power utilities have an edge in creating electricity trading platforms because of their ownership of the distribution network. If power utilities aggressively enter the storage and electricity trading business in the coming years, it could put pressure on companies like Sonnen which rely on the distribution network.
Summary: Sonnenbatterie is the market leader in residential storage systems in Germany where it has access to an extensive and exclusive network of resellers. Its high installed base in Germany has helped it launch an electricity trading platform which could significantly improve solar generation and storage potential and could make grid independence a possibility. Sonnenbatterie has invested heavily in software over the last few years and is one of the few companies which can offer plug-and-play systems. While competitive pressures are likely to rise, Sonnen’s asset-light strategy, where it relies on third-parties for cell batteries and pack manufacturing, could help it grow its client base as it expands into the US and the UK.
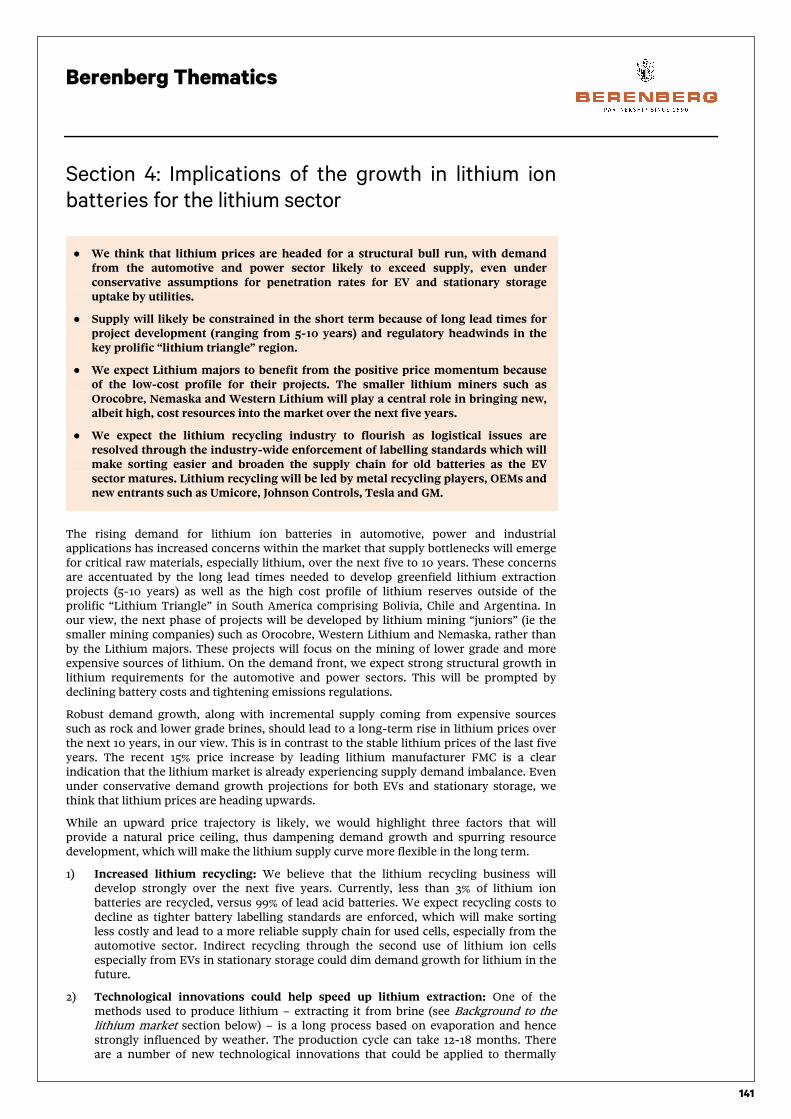
Berenberg Thematics
141
Section 4: Implications of the growth in lithium ion batteries for the lithium sector
● We think that lithium prices are headed for a structural bull run, with demand from the automotive and power sector likely to exceed supply, even under conservative assumptions for penetration rates for EV and stationary storage uptake by utilities.
● Supply will likely be constrained in the short term because of long lead times for project development (ranging from 5-10 years) and regulatory headwinds in the key prolific “lithium triangle” region.
● We expect Lithium majors to benefit from the positive price momentum because of the low-cost profile for their projects. The smaller lithium miners such as Orocobre, Nemaska and Western Lithium will play a central role in bringing new, albeit high, cost resources into the market over the next five years.
● We expect the lithium recycling industry to flourish as logistical issues are resolved through the industry-wide enforcement of labelling standards which will make sorting easier and broaden the supply chain for old batteries as the EV sector matures. Lithium recycling will be led by metal recycling players, OEMs and new entrants such as Umicore, Johnson Controls, Tesla and GM.
The rising demand for lithium ion batteries in automotive, power and industrial applications has increased concerns within the market that supply bottlenecks will emerge for critical raw materials, especially lithium, over the next five to 10 years. These concerns are accentuated by the long lead times needed to develop greenfield lithium extraction projects (5-10 years) as well as the high cost profile of lithium reserves outside of the prolific “Lithium Triangle” in South America comprising Bolivia, Chile and Argentina. In our view, the next phase of projects will be developed by lithium mining “juniors” (ie the smaller mining companies) such as Orocobre, Western Lithium and Nemaska, rather than by the Lithium majors. These projects will focus on the mining of lower grade and more expensive sources of lithium. On the demand front, we expect strong structural growth in lithium requirements for the automotive and power sectors. This will be prompted by declining battery costs and tightening emissions regulations.
Robust demand growth, along with incremental supply coming from expensive sources such as rock and lower grade brines, should lead to a long-term rise in lithium prices over the next 10 years, in our view. This is in contrast to the stable lithium prices of the last five years. The recent 15% price increase by leading lithium manufacturer FMC is a clear indication that the lithium market is already experiencing supply demand imbalance. Even under conservative demand growth projections for both EVs and stationary storage, we think that lithium prices are heading upwards.
While an upward price trajectory is likely, we would highlight three factors that will provide a natural price ceiling, thus dampening demand growth and spurring resource development, which will make the lithium supply curve more flexible in the long term.
1) Increased lithium recycling: We believe that the lithium recycling business will develop strongly over the next five years. Currently, less than 3% of lithium ion batteries are recycled, versus 99% of lead acid batteries. We expect recycling costs to decline as tighter battery labelling standards are enforced, which will make sorting less costly and lead to a more reliable supply chain for used cells, especially from the automotive sector. Indirect recycling through the second use of lithium ion cells especially from EVs in stationary storage could dim demand growth for lithium in the future.
2) Technological innovations could help speed up lithium extraction: One of the methods used to produce lithium – extracting it from brine (see Background to the lithium market section below) – is a long process based on evaporation and hence strongly influenced by weather. The production cycle can take 12-18 months. There are a number of new technological innovations that could be applied to thermally

Berenberg Thematics
142
assist this extraction process, however. South Korean steel company Posco, for example, is currently working with lithium miner Western Lithium to enable quicker extraction of Lithium from its brine project in Argentina. Traditional extraction methods for lithium salts dissolved in underground brines are based on evaporation and are similar to salt production from sea water. This is a 12- to 24-month extraction process.
3) There are natural substitutes in conventional applications: While lithium is important in conventional applications such as ceramics and glass manufacturing, it also has clear substitutes. For example, calcium and aluminium can be used in the manufacturing of a) greases, b) sodium and potassium compounds in ceramics and glass production and c) composite materials (boron, glass) for the manufacture of polymers.
We do not believe that rising lithium prices will affect the ongoing decline in the cost of lithium ion battery packs. This is because while the cathode material forms ~20% of the overall pack cost, lithium forms only 3.6% of the overall battery cost. Even if lithium prices were to double in the foreseeable future, we do not think that this would have more than a marginal impact on overall lithium ion battery pack prices.
Background to the lithium market
● Different compounds of lithium have multiple industrial uses in the manufacturing of glass, ceramics, polymers and greases, as well as in the manufacture of lithium ion cells.
● High-grade lithium reserves are controlled by just four companies. Brine resources in Chile and Argentina are controlled by SQM, FMC and Albemarle. High-grade rock mines are owned by Albemarle and Tianqi.
● Lower-grade brine and rock reserves are generally owned by the mining juniors and these mines operate at twice the cost of those controlled by the lithium majors. Their viability is dependent on future lithium prices.
Different lithium compounds can be produced from different resources. These compounds have important uses in both conventional industrial applications as well as in battery manufacturing. Lithium carbonate and lithium hydroxide are the main building blocks of the cathode material and the electrolyte in lithium ion batteries. Lithium carbonate is also used in manufacturing heat-resistant glass and ceramics. Lithium hydroxide is more costly to produce than lithium carbonate and is the preferred ingredient for producing the high-energy-density NCA cathode material which is preferred by Panasonic and Tesla. The higher cost is down to an additional step in the manufacture of lithium hydroxide, in which lime is added to lithium carbonate to produce lithium hydroxide.
Different compounds of lithium are used in various applications
Lithium resources by type of resources – continental brines
followed by rock-based (pegmatites) form the bulk of the global
lithium reserves
Source: FMC Source: Signumbox
Conventional Conventional Conventional Conventional
applicationsapplicationsapplicationsapplicationsEnergy storageEnergy storageEnergy storageEnergy storage PolymerPolymerPolymerPolymer AlloysAlloysAlloysAlloys
CarbonateCarbonateCarbonateCarbonateGlass
Ceramics
Electrical vehicles
Grid storage
Electronics
ChlorideChlorideChlorideChloride
Air-
dehumidification
Dyes
HydroxideHydroxideHydroxideHydroxide Grease
Electrical vehicles
Grid storage
Electronics
ButyllithiumButyllithiumButyllithiumButyllithiumPharmaceuticalos
Agrochemicals
Tires
Synthetic rubber
based materials
High purity metalHigh purity metalHigh purity metalHigh purity metal Primary batteriesRechareable
batteriesAerospace
Continental Brines, 61%
Pegmatites, 26%
Geothermal brines, 3%
Hectorite, 6%
Jadarite, 2% Oilfield brine, 2%

Berenberg Thematics
143
61% of the world’s lithium reserves are in the form of continental brines from dried-up lakes in South America and Tibet. Continental brines (underground saltwater containing dissolved lithium salts) are the cheapest sources of lithium and form the majority of the current production of lithium from brines. Lithium rock-based reserves are largely located in Australia and also in a number of other locations. However, apart from the Greenbushes mine in Australia, most of the other resources have not been developed because of the lower lithium content in the ore, which in a low lithium price environment makes them uneconomic. Clay sources based in the US and Serbia are the most expensive to develop due to their high magnesium content which makes the extraction of lithium difficult.
Global lithium reserves – lithium brine reserves are concentrated in South America
Source: DOE
Over the last five years, lithium production has been rising on the back of capacity increases by incumbent producers. While the demand for lithium for batteries has picked up, its demand for conventional uses which form the bulk of demand has remained weak because of the broader economic slowdown in both advanced and emerging economies. As a result, lithium prices have remained stagnant over the last five years with a dip in prices in 2011.
Lithium production and price evolution since 2000
Source: US DoE
0
500
1,000
1,500
2,000
2,500
3,000
3,500
4,000
4,500
5,000
0
100,000
200,000
300,000
400,000
500,000
600,000
700,000
2000 2001 2002 2003 2004 2005 2006 2007 2008 2009 2010 2011 2012 2013 2014
Global gross production (tons) Unit value ($/t)
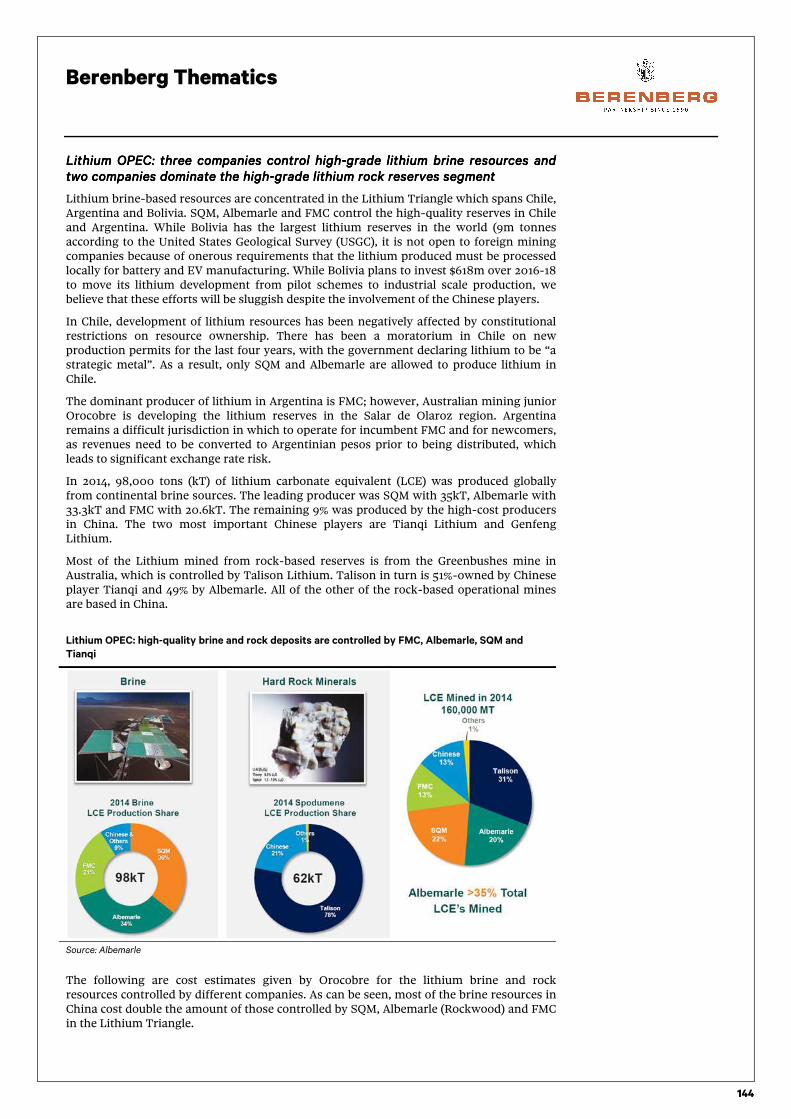
Berenberg Thematics
144
Lithium OPEC: three companies control highLithium OPEC: three companies control highLithium OPEC: three companies control highLithium OPEC: three companies control high----grade lithium brine resources and grade lithium brine resources and grade lithium brine resources and grade lithium brine resources and two companies dominate the hightwo companies dominate the hightwo companies dominate the hightwo companies dominate the high----grade lithium rock reserves segment grade lithium rock reserves segment grade lithium rock reserves segment grade lithium rock reserves segment
Lithium brine-based resources are concentrated in the Lithium Triangle which spans Chile, Argentina and Bolivia. SQM, Albemarle and FMC control the high-quality reserves in Chile and Argentina. While Bolivia has the largest lithium reserves in the world (9m tonnes according to the United States Geological Survey (USGC), it is not open to foreign mining companies because of onerous requirements that the lithium produced must be processed locally for battery and EV manufacturing. While Bolivia plans to invest $618m over 2016-18 to move its lithium development from pilot schemes to industrial scale production, we believe that these efforts will be sluggish despite the involvement of the Chinese players.
In Chile, development of lithium resources has been negatively affected by constitutional restrictions on resource ownership. There has been a moratorium in Chile on new production permits for the last four years, with the government declaring lithium to be “a strategic metal”. As a result, only SQM and Albemarle are allowed to produce lithium in Chile.
The dominant producer of lithium in Argentina is FMC; however, Australian mining junior Orocobre is developing the lithium reserves in the Salar de Olaroz region. Argentina remains a difficult jurisdiction in which to operate for incumbent FMC and for newcomers, as revenues need to be converted to Argentinian pesos prior to being distributed, which leads to significant exchange rate risk.
In 2014, 98,000 tons (kT) of lithium carbonate equivalent (LCE) was produced globally from continental brine sources. The leading producer was SQM with 35kT, Albemarle with 33.3kT and FMC with 20.6kT. The remaining 9% was produced by the high-cost producers in China. The two most important Chinese players are Tianqi Lithium and Genfeng Lithium.
Most of the Lithium mined from rock-based reserves is from the Greenbushes mine in Australia, which is controlled by Talison Lithium. Talison in turn is 51%-owned by Chinese player Tianqi and 49% by Albemarle. All of the other of the rock-based operational mines are based in China.
Lithium OPEC: high-quality brine and rock deposits are controlled by FMC, Albemarle, SQM and
Tianqi
Source: Albemarle
The following are cost estimates given by Orocobre for the lithium brine and rock resources controlled by different companies. As can be seen, most of the brine resources in China cost double the amount of those controlled by SQM, Albemarle (Rockwood) and FMC in the Lithium Triangle.

Berenberg Thematics
145
Cost profile of different lithium producers – lithium majors control the low-cost sources
Source: Orocobre, Roskill
Lower grade lithium rock resources would become commercially viable if lithium Lower grade lithium rock resources would become commercially viable if lithium Lower grade lithium rock resources would become commercially viable if lithium Lower grade lithium rock resources would become commercially viable if lithium prices were to riseprices were to riseprices were to riseprices were to rise
The economical viability of lithium rock-based deposits depends on the concentration of the lithium mineral. There is currently one main commercial mine in Australia – Greenbushes. Greenbushes is unique because of the high grade of its lithium reserves: a concentration of ~3.9% Li2O (lithium oxide). A number of earlier projects initiated by Canada Lithium and Galaxy to develop lithium rock resources in Canada and in Australia were commercial failures because the deposits were of too low a grade (ie a low lithium concentration in the ore). Albemarle also owns large rock-based lithium reserves of 380kT LCE at Kings Mountain in North Carolina, US, but the mine has an Li2O concentration of only 1.8-2% and hence is inactive. We think that if Lithium prices continue to rise, these lower grade Lithium rock mines will be brought into production.
Significant overcapacity Significant overcapacity Significant overcapacity Significant overcapacity –––– but but but but demand growth likley to exceed supply growth demand growth likley to exceed supply growth demand growth likley to exceed supply growth demand growth likley to exceed supply growth over the next five yearsover the next five yearsover the next five yearsover the next five years
Despite the strong growth in global lithium demand, it has been outpaced by the capacity additions made by the larger players over the last five years. As a result, all of the majors are operating significantly below capacity: the global utilisation rate for the leading lithium producer, Albemarle, was only 60% in 2014. This excess capacity explains why lithium prices have remained subdued, which in turn has derailed efforts in the past to develop new lower-grade lithium deposits. However, the recent 15% price increase by FMC shows that the Lithium majors are now comfortable with the demand outlook to allow smaller players to enter the market. Albemarle expects global lithium manufacturing capacity to rise from ~240kT LCE in 2014 to ~360kT by 2020. Despite this increase in manufacturing capacity, Albemarle still expects the average utilisation rate to improve to ~75% from 60% in 2014.

Berenberg Thematics
146
All lithium majors are sitting on significant excess capacity;
excess capacity explains why lithium prices have remained
subdued over the last five years
Albemarle expects global manufacturing capacity to rise by 50%
by 2020 but demand to rise by 80%: this should help the
utilisation rate to rise to ~75% from 60% in 2014
Source: Berenberg estimates Source: Orocobre
Lithium supply outlook 2015-2025
● Lithium supply from low-cost sources is constrained by regulatory barriers. Incremental supply will come from higher-cost, lower grade brine and rock resources. We expect supply growth to be led by smaller miners such as Nemaska, Orocobre and Western Lithium/Lithium Americas.
● We estimate that global manufacturing capacity will rise to 295kT by 2020 and 355kT by 2025 from 237kT in 2014. Three new brine projects will add 60kT LCE to global manufacturing capacity by 2017.
Lithium supply is controlled but not inflexible in the long tLithium supply is controlled but not inflexible in the long tLithium supply is controlled but not inflexible in the long tLithium supply is controlled but not inflexible in the long termermermerm
There are currently 5-6 new credible projects which are currently being developed. Most of these are currently in feasibility and pilot stages and include all three types of lithium source. These include three brine projects by Albemarle, Orocobre and Western Lithium/Lithium Americas, one rock project by Nemaska and two clay-based projects by Western Lithium/Lithium Americas and Bacanora Minerals.
5-6 new projects are currently in different stages of development
While previous efforts to develop new deposits were not
successful, the rise in lithium prices if sustained should
encourage additional supply over the next 10 years
Source: Albemarle Source: Albemarle
0%
20%
40%
60%
80%
100%
0
20
40
60
80
100
120
SQM FMC Abermarle Tianqi(Talison)
Production 2014 (KT) Production capacity (KT)
Utilization (RHS)
0
0.1
0.2
0.3
0.4
0.5
0.6
0.7
0.8
0
50
100
150
200
250
300
350
400
2014F 2015F 2016F 2017F 2018F 2019F 2020F
Demand Nameplate Capacity Utilization

Berenberg Thematics
147
Lithium supply modelLithium supply modelLithium supply modelLithium supply model
New brine projects are near the end of their development cycles: Bar a failure to gain environmental permits, the three brine projects in South America will most likely go ahead, in our view, as these are high-grade sources of lithium with only a low magnesium content in the brine and hence can be produced at low cost (less than $3,000/ton LCE), which makes them highly profitable as lithium carbonate prices currently stand above $6,000/ton.
On average, a Greenfield lithium brine project should take around six/eight years to bring to full operational speed, which includes two years of engineering and acquiring all the permits, two/three years for the construction work, and two/three years for production ramp-up, including c6-12 months for the qualification (ie testing of the sample by clients) of the product. Orocobre’s and Western Lithium’s developments in Argentina are greenfield projects which are near the end of their project development cycles. Together, these two projects will add 37.5kT LCE to global manufacturing capacity by end-2017. Albemarle has a brownfield brine project under construction and the company expects to be able to start production (up to 20kT pa) from the beginning of 2016. Together, therefore, these three brine projects will add ~60kT LCE manufacturing capacity in just two years. In addition, a second phase of the Orocobre development will increase LCE production by a further 20kT potentially by 2022.
We also believe that even if lithium prices remain at current levels, Nemaska’s rock projects in Canada will go ahead. With operating costs well below $4,000/ton and lithium carbonate prices currently at $6,000/ton it be a profitable venture. A typical rock project takes five/six years to become operational: two years for the design phase and to acquire all the permits, two years for construction and 12-18 months for project ramp-up/product qualifications. Nemaska has already gained all the permits necessary for its Canadian ramp-up. Due to the good transport infrastructure at the site, the project should benefit from a shorter construction period. Nemaska was planning to begin mine construction by the end of 2015, and we anticipate that this will be completed by end-2017. The mine could potentially be producing at full capacity (27.9kT LCE) by end of 2019.
There are currently no major clay-based lithium mining projects in operation. This is because of the high cost of extraction due to the amount of magnesium in the clay. In a low-lithium-price environment, these projects are not viable. The robust demand outlook for lithium is encouraging companies to tap clay-based resources, however, and currently there are two projects being considered, both of which are at a very early feasibility stage. Of the two, the more prolific (ie higher lithium levels in the reserves) is to develop the hectorite deposits in Kings Valley, Nevada (Western Lithium). The other is Bacanora’s Sonara project in Mexico. The Kings Valley site has better access to infrastructure, a strong customer base and will benefit from a better regulatory environment. Western Lithium is currently conducting permit and environmental studies and is aiming a phase one start-up with capacity of 13kT LCE by 2019. The company plans to complete phase two, with a further capacity of 26kT LCE, four years after the completion of phase one. Considering the complexity of the project, however, we only expect completion of phase one by 2021-22.
Bacanora expects to complete a pre-feasibility study for the Sonara project in Mexico by end-Q1 2016. If successful, this will be followed by two years of pilot plant operational work. Eventually, the company hopes for production capacity of 13kT LCE in phase one and a further 20kT LCE in phase two. However, we doubt that the project will progress in a stable lithium price environment because of its high-cost nature. In our best-case scenario, phase one should complete by 2024 and phase two after 2025.
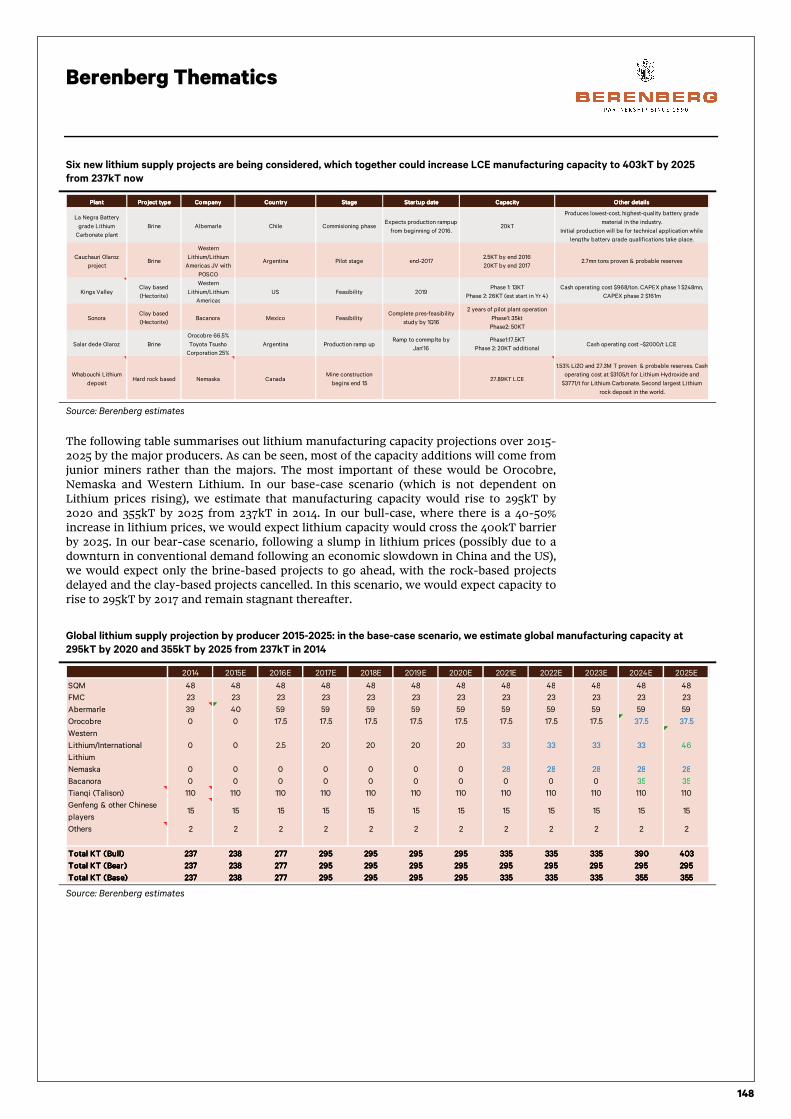
Berenberg Thematics
148
Six new lithium supply projects are being considered, which together could increase LCE manufacturing capacity to 403kT by 2025
from 237kT now
Source: Berenberg estimates
The following table summarises out lithium manufacturing capacity projections over 2015-2025 by the major producers. As can be seen, most of the capacity additions will come from junior miners rather than the majors. The most important of these would be Orocobre, Nemaska and Western Lithium. In our base-case scenario (which is not dependent on Lithium prices rising), we estimate that manufacturing capacity would rise to 295kT by 2020 and 355kT by 2025 from 237kT in 2014. In our bull-case, where there is a 40-50% increase in lithium prices, we would expect lithium capacity would cross the 400kT barrier by 2025. In our bear-case scenario, following a slump in lithium prices (possibly due to a downturn in conventional demand following an economic slowdown in China and the US), we would expect only the brine-based projects to go ahead, with the rock-based projects delayed and the clay-based projects cancelled. In this scenario, we would expect capacity to rise to 295kT by 2017 and remain stagnant thereafter.
Global lithium supply projection by producer 2015-2025: in the base-case scenario, we estimate global manufacturing capacity at
295kT by 2020 and 355kT by 2025 from 237kT in 2014
Source: Berenberg estimates
PlantPlantPlantPlant Project typeProject typeProject typeProject type CompanyCompanyCompanyCompany CountryCountryCountryCountry StageStageStageStage Startup dateStartup dateStartup dateStartup date CapacityCapacityCapacityCapacity Other detailsOther detailsOther detailsOther details
La Negra Battery
grade Lithium
Carbonate plant
Brine Albemarle Chile Commisioning phaseExpects production rampup
from beginning of 2016.20kT
Produces lowest-cost, highest-quality battery grade
material in the industry.
Initial production will be for technical application while
lengthy battery grade qualifications take place.
Cauchauri Olaroz
projectBrine
Western
Lithium/Lithium
Americas JV with
POSCO
Argentina Pilot stage end-20172.5KT by end 2016
20KT by end 20172.7mn tons proven & probable reserves
Kings ValleyClay based
(Hectorite)
Western
Lithium/Lithium
Americas
US Feasibility 2019Phase 1: 13KT
Phase 2: 26KT (est start in Yr 4)
Cash operating cost $968/ton. CAPEX phase 1 $248mn,
CAPEX phase 2 $161m
SonoraClay based
(Hectorite)Bacanora Mexico Feasibility
Complete pres-feasibility
study by 1Q16
2 years of pilot plant operation
Phase1: 35kt
Phase2: 50KT
Salar dede Olaroz Brine
Orocobre 66.5%
Toyota Tsusho
Corporation 25%
Argentina Production ramp upRamp to commplte by
Jan'16
Phase1:17.5KT
Phase 2: 20KT additionalCash operating cost ~$2000/t LCE
Whabouchi Lithium
depositHard rock based Nemaska Canada
Mine construction
begins end 1527.89KT LCE
1.53% Li2O and 27.3M T proven & probable reserves. Cash
operating cost at $3105/t for Lithium Hydroxide and
$3771/t for Lithium Carbonate. Second largest Lithium
rock deposit in the world.
2014 2015E 2016E 2017E 2018E 2019E 2020E 2021E 2022E 2023E 2024E 2025E
SQM 48 48 48 48 48 48 48 48 48 48 48 48
FMC 23 23 23 23 23 23 23 23 23 23 23 23
Abermarle 39 40 59 59 59 59 59 59 59 59 59 59
Orocobre 0 0 17.5 17.5 17.5 17.5 17.5 17.5 17.5 17.5 37.5 37.5
Western
Lithium/International
Lithium
0 0 2.5 20 20 20 20 33 33 33 33 46
Nemaska 0 0 0 0 0 0 0 28 28 28 28 28
Bacanora 0 0 0 0 0 0 0 0 0 0 35 35
Tianqi (Talison) 110 110 110 110 110 110 110 110 110 110 110 110
Genfeng & other Chinese
players15 15 15 15 15 15 15 15 15 15 15 15
Others 2 2 2 2 2 2 2 2 2 2 2 2
Total KT (Bull)Total KT (Bull)Total KT (Bull)Total KT (Bull) 237237237237 238238238238 277277277277 295295295295 295295295295 295295295295 295295295295 335335335335 335335335335 335335335335 390390390390 403403403403
Total KT (Bear)Total KT (Bear)Total KT (Bear)Total KT (Bear) 237237237237 238238238238 277277277277 295295295295 295295295295 295295295295 295295295295 295295295295 295295295295 295295295295 295295295295 295295295295
Total KT (Base)Total KT (Base)Total KT (Base)Total KT (Base) 237237237237 238238238238 277277277277 295295295295 295295295295 295295295295 295295295295 335335335335 335335335335 335335335335 355355355355 355355355355

Berenberg Thematics
149
Lithium demand outlook 2015-25: strong structural growth driven
by automotive and power sectors
● Global lithium demand is projected to jump to 279kT in 2020 and to 378kT by 2025 from 170kT in 2014.
● The primary source of demand will for automotive batteries even under the conservative assumption of only 1% global EV penetration by 2020. We estimate Lithium demand for EVs will rise to 60kT LCE by 2020 and to 125kT by 2025 from only 18kT in 2014.
● Stationary storage uptake is likely to pick up post-2017 because at current cost levels, lithium ion only caters to niche applications. However, by 2020, we estimate lithium demand for stationary storage will rise to 11kT by 2020 and to 26kT by 2020 from only 1kT in 2014.
Lithium ion batteries are finding applications in the automotive and stationary storage applications,
which we think will drive demand growth for lithium over the next decade
Source: Albemarle
Global lithium demand stood at 183kT LCE in 2014. The share of lithium destined for rechargeable batteries was only 33% (ie 61kT LCE), with conventional industrial uses such as in ceramics and glass manufacturing accounting for most of the demand. More than half of the demand for Lithium in secondary batteries is for electronic devices (such as mobile phones, notebooks and tablets). Transport applications accounted for 37% of the total use of lithium in secondary batteries, predominantly from hybrid and plug-in electric vehicles. Lithium used in stationary storage applications accounted for 1% of the lithium used in secondary batteries.

Berenberg Thematics
150
Batteries only accounted for 33% of total lithium demand of
183kT LCE in 2014
Electronic devices still dominate the use of lithium in batteries,
but share of the automotive sector rose to 33% in 2014
Source: Albemarle, Signum box, Berenberg estimates Source: Albemarle, Signum box, Berenberg estimates
Conventional Conventional Conventional Conventional applications still dominate lithium usage applications still dominate lithium usage applications still dominate lithium usage applications still dominate lithium usage –––– battery market share battery market share battery market share battery market share has been increasinghas been increasinghas been increasinghas been increasing
Over the last five years, the amount of lithium used in batteries has grown at a CAGR of 20%. This is significantly higher than the 9% CAGR for conventional uses. The use of lithium in conventional applications is mainly dependent on GDP growth rates in advanced and rapidly industrialising countries and has suffered from the general slowdown in global economic growth. We can expect lithium for conventional applications to grow in line with the global GDP growth rate.
While conventional uses of lithium still dominates most of the demand growth has come from the
sharp growth in its usage in batteries
Source: Roskill
Automotive sector likely to be the main demand Automotive sector likely to be the main demand Automotive sector likely to be the main demand Automotive sector likely to be the main demand driver over the next decadedriver over the next decadedriver over the next decadedriver over the next decade
We expect the automotive sector to be the main growth driver of lithium demand as car manufacturers make the shift towards hybrids and plug-in vehicles in order to meet stringent emission requirements. This process will be helped by declining automotive battery costs, which are reducing their price premium versus conventional internal combustion vehicles.
According to Signumbox, on average a HEV has a lithium content of 5kg LCE/vehicle; for a PEV, it ranges from 40-80kg LCE/vehicle, depending on whether it is a BEV or PHEV. In 2014, global HEV sales stood at 1.8m and PEV sales were 0.3m. Assuming a conservative global penetration rate of 1% for PEVs by 2020, we estimate that lithium demand for PEVs will rise to 60kT LCE by 2020 from only 18kT in 2014. For hybrids assuming a growth CAGR of 12%, we expect lithium demand to rise to 17.4kT LCE by 2020 versus 9kT LCE in 2014.
Secondary battery33%
Primary battery2%Ceramics &
glass33%
Metallurgical & Aluminium
7%
Greases & polymer12%
Others13%
183183183183 KT KT KT KT LCELCELCELCE Electronics
55%
Power1%
Automotive37%
Industrial7%
61 KT 61 KT 61 KT 61 KT LCELCELCELCE
-30%
-20%
-10%
0%
10%
20%
30%
40%
0
20
40
60
80
100
120
140
160
180
200
2008 2009 2010 2011 2012 2013 2014
Conventional uses Battery uses
Growth conventional (RHS) Growth battery (RHS)
'000 Tons LCE

Berenberg Thematics
151
Overall, we expect automotive demand for lithium to rise to 78kT LCE by 2020, which will be nearly three times higher than the 27kT LCE in 2014. Thereafter, we expect lithium demand for EVs to grow at a conservative demand CAGR of 10% to reach 125kT LCE by 2025.
Lithium demand from the power sector rise 11x by 2020 and 26x by 2025Lithium demand from the power sector rise 11x by 2020 and 26x by 2025Lithium demand from the power sector rise 11x by 2020 and 26x by 2025Lithium demand from the power sector rise 11x by 2020 and 26x by 2025
Lithium demand for stationary storage uses stood at only 1kT LCE in 2014, with a total stationary storage installed base of 1.1GW, of which the share of lithium ion was 25%, ie 0.3GW. This translates into lithium demand of 5.8 tons LCE per MW of storage.
Consultant Navigant expects the total stationary storage installed base to rise to ~22-23GW by 2023. We expect the share of lithium ion in the installed base to rise sharply after 2017 as a result of a 30-40% reduction in battery costs and we expect most of the storage additions from 2020 to be lithium-ion-based (please see chart below right). Assuming that the share of lithium ion rises to 35% by 2018 and exceeds 70% by 2023, we expect the lithium ion installed base to rise to 12.6GW by 2023. This will be driven by both utility scale storage and behind-the-meter decentralised storage for residential and commercial applications.
We hence estimate lithium demand from the power sector to rise to 11.3kT LCE by 2020 and 26kT LCE by 2025 from only 1kT in 2014. The share of lithium demand from the power sector would hence rise to 4% by 2020 and 7% by 2025 from less than 1% in 2014.
Stationary storage expected to exceed 10GW by 2020 and 30GW
by 2025
Most of the additions to stationary storage will be based on
lithium ion battery technology as its manufacturing costs decline
Source: Albemarle Source: Albemarle
Lithium demand expected to rise by ~60% by 2020 by ~120% by 2025Lithium demand expected to rise by ~60% by 2020 by ~120% by 2025Lithium demand expected to rise by ~60% by 2020 by ~120% by 2025Lithium demand expected to rise by ~60% by 2020 by ~120% by 2025
The following graph and table summarises our global Lithium demand projections by application. We expect total demand to rise from 170kT LCE in 2014 to 279kT by 2020 and 378kT by 2025. This growth will be driven predominantly by the automotive and the power sectors. While we expect industrial uses to rise sharply as well, they are expected to be only a marginal driver of growth.
0
5
10
15
20
25
30
35
2014 2015E 2016E 2017E 2018E 2019E 2020E 2021E 2022E 2023E
GWGWGWGW
Lithium installed base Others (NaS, Flow, flywheel etc)
0
1
2
3
4
5
2015E 2016E 2017E 2018E 2019E 2020E 2021E 2022E 2023E
Energy storage additions (GW) Lithium based additions (GW)
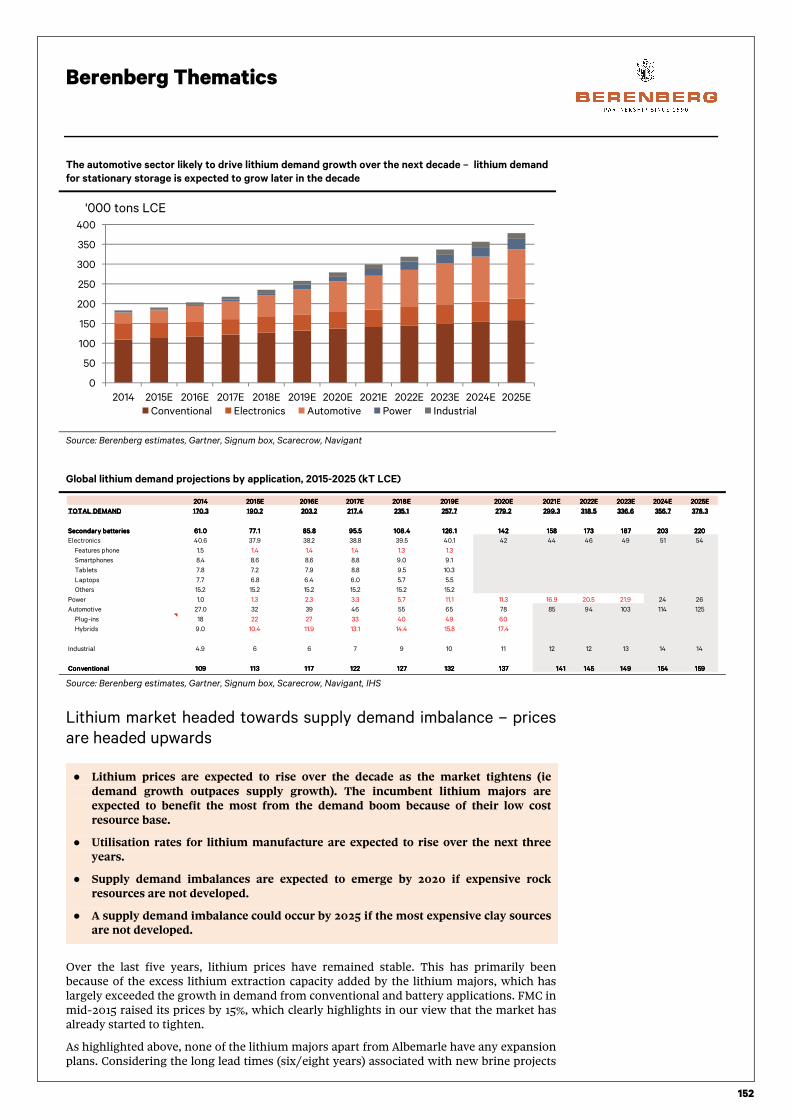
Berenberg Thematics
152
The automotive sector likely to drive lithium demand growth over the next decade – lithium demand
for stationary storage is expected to grow later in the decade
Source: Berenberg estimates, Gartner, Signum box, Scarecrow, Navigant
Global lithium demand projections by application, 2015-2025 (kT LCE)
Source: Berenberg estimates, Gartner, Signum box, Scarecrow, Navigant, IHS
Lithium market headed towards supply demand imbalance – prices
are headed upwards
● Lithium prices are expected to rise over the decade as the market tightens (ie demand growth outpaces supply growth). The incumbent lithium majors are expected to benefit the most from the demand boom because of their low cost resource base.
● Utilisation rates for lithium manufacture are expected to rise over the next three years.
● Supply demand imbalances are expected to emerge by 2020 if expensive rock resources are not developed.
● A supply demand imbalance could occur by 2025 if the most expensive clay sources are not developed.
Over the last five years, lithium prices have remained stable. This has primarily been because of the excess lithium extraction capacity added by the lithium majors, which has largely exceeded the growth in demand from conventional and battery applications. FMC in mid-2015 raised its prices by 15%, which clearly highlights in our view that the market has already started to tighten.
As highlighted above, none of the lithium majors apart from Albemarle have any expansion plans. Considering the long lead times (six/eight years) associated with new brine projects
0
50
100
150
200
250
300
350
400
2014 2015E 2016E 2017E 2018E 2019E 2020E 2021E 2022E 2023E 2024E 2025E
Conventional Electronics Automotive Power Industrial
'000 tons LCE
2014201420142014 2015E2015E2015E2015E 2016E2016E2016E2016E 2017E2017E2017E2017E 2018E2018E2018E2018E 2019E2019E2019E2019E 2020E2020E2020E2020E 2021E2021E2021E2021E 2022E2022E2022E2022E 2023E2023E2023E2023E 2024E2024E2024E2024E 2025E2025E2025E2025E
TOTAL DEMANDTOTAL DEMANDTOTAL DEMANDTOTAL DEMAND 170.3170.3170.3170.3 190.2190.2190.2190.2 203.2203.2203.2203.2 217.4217.4217.4217.4 235.1235.1235.1235.1 257.7257.7257.7257.7 279.2279.2279.2279.2 299.3299.3299.3299.3 318.5318.5318.5318.5 336.6336.6336.6336.6 356.7356.7356.7356.7 378.3378.3378.3378.3
Secondary batteriesSecondary batteriesSecondary batteriesSecondary batteries 61.061.061.061.0 77.177.177.177.1 85.885.885.885.8 95.595.595.595.5 108.4108.4108.4108.4 126.1126.1126.1126.1 142142142142 158158158158 173173173173 187187187187 203203203203 220220220220
Electronics 40.6 37.9 38.2 38.8 39.5 40.1 42 44 46 49 51 54
Features phone 1.5 1.4 1.4 1.4 1.3 1.3
Smartphones 8.4 8.6 8.6 8.8 9.0 9.1
Tablets 7.8 7.2 7.9 8.8 9.5 10.3
Laptops 7.7 6.8 6.4 6.0 5.7 5.5
Others 15.2 15.2 15.2 15.2 15.2 15.2
Power 1.0 1.3 2.3 3.3 5.7 11.1 11.3 16.9 20.5 21.9 24 26
Automotive 27.0 32 39 46 55 65 78 85 94 103 114 125
Plug-ins 18 22 27 33 40 49 60
Hybrids 9.0 10.4 11.9 13.1 14.4 15.8 17.4
Industrial 4.9 6 6 7 9 10 11 12 12 13 14 14
ConventionalConventionalConventionalConventional 109109109109 113113113113 117117117117 122122122122 127127127127 132132132132 137137137137 141141141141 145145145145 149149149149 154154154154 159159159159

Berenberg Thematics
153
as well as the lengthy project development times needed for new projects in Chile and Argentina, it is unlikely that new low-cost brine production will be added to the list of projects which are already in development. This means that additional supply will depend on higher-cost rock and clay sources which are being developed by lithium juniors such as Nemaska and Western Lithium. We estimate that if these high-cost sources are not developed, demand will exceed supply, even under the conservative growth assumptions for EVs and stationary storage.
We are hence confident that additional rock-based resources outside of Australia will likely be developed. This includes the Nemaska project in Canada and potentially Albemarle’s Kings Valley mine in Nevada. However, even if these rock sources are developed, we expect a supply and demand imbalance to emerge by the end of the decade, which will then require the development of even more costly clay-based sources.
We continue to anticipate a rise in lithium prices. Within a three-year horizon, price rises will be driven by rising capacity utilisation rates for incumbent lithium producers. Over a five- to 10-year horizon), prices would rise because of the higher cost of development of additional sources of Lithium, ie rock and clay.
We expect supply demand imbalance to emerge after 2020 if rock and clay lithium sources are not
developed
Source: Berenberg estimates
0
50
100
150
200
250
300
350
400
450
2014 2015E 2016E 2017E 2018E 2019E 2020E 2021E 2022E 2023E 2024E 2025E
TOTAL DEMAND Supply (Bull) Supply (bear) Supply (base)

Berenberg Thematics
154
Recycling places a ceiling on lithium prices
● The lithium recycling industry is ripe for development. Only 3% of lithium ion cells are recycled, versus 99% for lead acid.
● We expect the recycling industry to develop as logistical issues are resolved through the enforcement of labelling standards which makes sorting easier and will broaden the supply chain for old batteries as the EV sector matures.
● Second life use of EV cells for stationary storage applications could provide an important route for expediting reduction in lithium ion battery costs.
● Recycling players (Umicore, Johnson Controls), EV OEMs (Tesla, GM) and research start-ups will play an important role in developing the lithium ion recycling industry – and benefit from the new earnings stream.
There are key two factors which could constrain the future demand of lithium in secondary batteries: 1) the recycling of lithium either directly by extracting lithium from old lithium ion cells or 2) through the second use of automotive EV cells, which still account for 40-60% of the storage capacity for stationary storage.
Direct recycling could become economically viable as labelling standards are Direct recycling could become economically viable as labelling standards are Direct recycling could become economically viable as labelling standards are Direct recycling could become economically viable as labelling standards are established and a reliable supply chain is established for cell recyclersestablished and a reliable supply chain is established for cell recyclersestablished and a reliable supply chain is established for cell recyclersestablished and a reliable supply chain is established for cell recyclers
Only 3% of lithium ion batteries are recycled. There are no technological barriers to recycling and the three methods listed in the table below are well established. However, the problem is that the cost of extracting lithium from batteries is more expensive than extracting lithium from brine sources.
The higher cost of extraction is also due to logistical challenges resulting for the wide variety of lithium ion cells in the market with very different chemistries. With no international guidelines for battery manufacturers for labelling their cells it because time consuming and expensive to sort cells which is necessary for both recycling. We believe that the industry is heading in this direction and expect the manufacturers of automotive batteries to create labelling standards for lithium ion cells. This in our view would significantly reduce recycling costs in our view. In addition, we expect automotive OEMs, EV dealers and battery recyclers to help create a reliable supply chain to collect EV batteries for recycling.
A number of companies have shown interest in recycling lithium ion cells, including Johnsons Controls and Apple. Tesla also aims to incorporate recycling as an integral part of its Gigafactory. Recycling heavyweight Umicore currently recycles lithium ion cells through its smelter in Belgium, but this recycling is aimed at extraction of precious metals like nickel and cobalt rather than lithium, which is lost in the slag. With the cost of lithium recycling likely to decline as a result of easier sorting and lower battery collection costs, we think that Umicore along with other metal recyclers could invest in lithium recycling facilities, especially if lithium prices continue to rise. Further, companies such as Battery Resources LLC as well as Argonne National Laboratory are working on making recycling of lithium ion cells more economical.

Berenberg Thematics
155
There are three well known methods of Lithium ion cell recycling but only
hydrometallurgical and physical methods lead to the recovery of lithium
Source: Argonne National Laboratory
EV batteries could have a “second life” as stationary storage EV batteries could have a “second life” as stationary storage EV batteries could have a “second life” as stationary storage EV batteries could have a “second life” as stationary storage
After 5-8 years (depending on the number of miles travelled) of battery use, the energy capacity of an EV battery declines to ~80% of its original level. While the corresponding 20% reduction in the range of an EV might make the battery unsuitable for automotive purposes, old EV battery packs can have a useful second life as a stationary storage device. This is because space is less of a consideration in stationary storage. Already, a number of companies such as GM, Mercedes and Daimler have announced partnerships with stationary storage providers for the use of old EV batteries to create storage systems for residential and utility scale storage. A second life for EV batteries will in our view help to expedite overall battery costs and partially alleviate the demand pressure for lithium.
EV batteries with 50-80% of energy storage capacity are suitable for stationary storage purposes
Source: DoE
PyrometallurgicalPyrometallurgicalPyrometallurgicalPyrometallurgical HydrometallurgicalHydrometallurgicalHydrometallurgicalHydrometallurgical PhysicalPhysicalPhysicalPhysical
TemperatureTemperatureTemperatureTemperature HighHighHighHigh LowLowLowLow LowLowLowLow
Metals Metals Metals Metals
recovered recovered recovered recovered
Co, Ni, CuCo, Ni, CuCo, Ni, CuCo, Ni, Cu
(Li and Al to slag)(Li and Al to slag)(Li and Al to slag)(Li and Al to slag)
Metals or salts,Metals or salts,Metals or salts,Metals or salts,
LiLiLiLi2222COCOCOCO3333 or LiOH or LiOH or LiOH or LiOH
Cathode, anode, Cathode, anode, Cathode, anode, Cathode, anode,
electrolyte, metals electrolyte, metals electrolyte, metals electrolyte, metals
Feed Feed Feed Feed
requirementsrequirementsrequirementsrequirements
NoneNoneNoneNone Seperation desireable Seperation desireable Seperation desireable Seperation desireable Single chemistry requiredSingle chemistry requiredSingle chemistry requiredSingle chemistry required
CommentsCommentsCommentsComments New chemistries New chemistries New chemistries New chemistries
yield reduced yield reduced yield reduced yield reduced
product valueproduct valueproduct valueproduct value
New chemistries yield New chemistries yield New chemistries yield New chemistries yield
reduced product valuereduced product valuereduced product valuereduced product value
Recovers potentially high-Recovers potentially high-Recovers potentially high-Recovers potentially high-
value materials; could value materials; could value materials; could value materials; could
implement on home scrapimplement on home scrapimplement on home scrapimplement on home scrap

Berenberg Thematics
156
Value chain for the lithium sector
Identifying the winners
Source: Berenberg estimates
(+) Lithium prices likely to experience structural rise as demand growth outstrips capacity additions
(+) New business for recyclining batterries to emerge
Lithium Brine majorsLithium Brine majorsLithium Brine majorsLithium Brine majors Lithium ion recylersLithium ion recylersLithium ion recylersLithium ion recylers
SQM Umicore
Albemarle Xstrata
FMC Retriev
Chinese: Genfeng & Tianqi Tesla
Johnson Controls
Lithium Rock majorsLithium Rock majorsLithium Rock majorsLithium Rock majors Apple?
Tianqi (Talison) Battery Resources LLC
Albemarle (Talison)
SecondlifeSecondlifeSecondlifeSecondlife
Lithium brine juniorsLithium brine juniorsLithium brine juniorsLithium brine juniors Freewire
Western Lithium/ International Lithium GM
Orocobre Tesla
Lithium rock juniorsLithium rock juniorsLithium rock juniorsLithium rock juniors
Nemaska
Lithium clay juniorsLithium clay juniorsLithium clay juniorsLithium clay juniors
Bacanora
Western Lithium/ International Lithium
Implications for margins and growthImplications for margins and growthImplications for margins and growthImplications for margins and growth
Lithium miners Recyclers

Berenberg Thematics
157
Albemarle (market cap: $5.8bn)
Business description: Albermarle is a leading US-based speciality chemicals company which is listed on the New York Stock Exchange. The company has market-leading positions in chemicals required in a diverse range of industries including electronics, plastics, pharmaceuticals, metal processing and petroleum refining. The company operates three business segments: Performance Chemicals, Refining Solutions and Chemetall Surface Treatment.
After the acquisition of Lithium Major Rockwood for $6.2bn in 2014, Albemarle is now the world’s largest producer of lithium and its compounds. Albemarle’s lithium business contributed revenues of $369m (14% of group) and EBITDA of 157m (22% of group EBITDA) in 9M 2015. The business segment is highly margin-accretive for the group where its EBITDA margin is nearly double that of the rest of the group (c42% versus c24% in 9M 2015).
Growth outlook and opportunities: Albemarle’s number one global position in lithium production is based on its access to high-quality, lithium-rich assets. These include its joint ownership of the Salar De Atacama brine source in Chile (the world’s highest concentration of lithium chloride), a 49% stake in the Greenbushes lithium rock mine in Australia (which has the highest lithium oxide concentration in the world) and its Silver Peak brine operations in Nevada, US. Thanks to its high-quality assets, Albemarle is currently the lowest-cost producer of lithium carbonate and lithium hydroxide in the world, making it well-positioned to benefit from the structural rise in lithium ion battery demand over the next five years.
Albemarle has the potential to significantly increase production. Firstly, it announced in 2015 plans to add 50kT mineral conversion production capacity for both lithium carbonate and lithium hydroxide by 2020. Secondly, Albemarle’s 20kT lithium carbonate plant in La Negra, Chile, is expected to reach full production in 2016. Finally, Albemarle also owns the Kings Mountain spodumene mine in the US, which is currently inactive. This mine does not only have high reserves of LCE (380kT) but also has the second-highest concentration of lithium oxide (1.8-2%). If lithium carbonate demand and prices continue to rise, we think that there is very high likelihood that Albemarle will develop this resource.
Key risks: Albemarle’s projects are located in Chile where the regulatory environment remains tough. As a result, it could take longer than expected to obtain environmental and other permits for project expansions.
Summary: Albemarle is the world’s largest producer of Lithium. The company is best positioned to benefit from the rising demand for lithium ion batteries because its projects have the lowest cost base in the industry. We expect Lithium prices to increase going forward which should benefit Albemarle as it further increases its lithium manufacturing capacity.

Berenberg Thematics
158
Albemarle in pictures
Divisional revenue split (31 December 2014) Revenue progression
Source: Factset Source: Factset
Capex, CFO, CFF, cash (local currency, m) Net debt/EBITDA
Source: Factset Source: Factset
Company information Share price and valuation
Source: Factset Source: Factset
Performance Chemicals Catalyst Solutions
-
500
1,000
1,500
2,000
2,500
3,000
2012 2013 2014
Group revenues Revenues Lithium business
$ m
(500)
-
500
1,000
1,500
2,000
2,500
3,000
2012 2013 2014
Capex CFO CFF Cash
-
0.2
0.4
0.6
0.8
1.0
1.2
2012 2013 2014
Net Debt / EBITDA
SharesSharesSharesShares
Share Price (LC) 51.54
Free float 99.6%
Shares Out (m) 112.203
CEO Luke C. Kissam, IV
TOZIER SCOTT A
ManagementManagementManagementManagement
Top Insiders / StakeholdersTop Insiders / StakeholdersTop Insiders / StakeholdersTop Insiders / Stakeholders
KISSAM LUTHER C IV
Golden Gate Private Equity, Inc.
JUNEAU MATTHEW K
MAINE DOUGLAS L
0
1
2
3
4
5
0
20
40
60
80
Share Price EV/Sales (RHS)

Berenberg Thematics
159
Orocobre (market cap: AUD0.5bn)
Business description: Orocobre is an industrial minerals company which focuses on producing Lithium, Boron and Potassium in Argentina. Its headquarters are in Brisbane, Australia, and it is listed on both the ASX and TSX.
Orocobre is the only Lithium minor with access to a high-quality lithium resource in South America and the only company, apart from the lithium majors SQM, Albemarle and FMC, to have successfully developed a large lithium carbonate project. Over the last seven years, it has developed the Solar Olaroz brine project in Argentina in partnership with the Japanese trading company Toyota Tsusho Corporation (project stake: 25%) and local mining investment company JEMSE (project stake: 8.5%). $192m of project funding came from Mizuho Corporate Bank underwritten by the Japanese government. A partnership with Toyota Tsusho has helped the company link up with battery and cathode manufacturers in Asia.
Growth outlook and opportunities: Lithium reserves at Orocobre’s Salar Olaroz site amount to 6.4m tonnes of lithium-carbonate-equivalent. This high resource base underpins the continued growth trajectory for Orocobre, in our view. The plan in phase two of the project will be to increase production by 20kT by 2022 after the completion of phase one, which aims to ramp up to 17.5kT during the course of 2016. Through this project, Orocobre will be able to establish itself as a low-cost producer satisfying 10% of the global demand for lithium. Due to the high concentration of lithium chloride in the brine, the cash cost of extraction is low at ~$2,000/tonne LCE, which highlights the profitability of the project, with prices of lithium carbonate currently approaching $6,000/tonne.
In addition to the Salar Olaroz, Orocobre also holds rights to other lithium brine salars at Salinas Grandes, Cauchari, Guayatoyoc and 10 other salars (salt flats) in Argentina. The Salar Cauchari is similar to Salar Olaroz, only 20km away. Because of the short distance between the two mines, Cauchari brine could be integrated into the Olaroz development at some point in the future. Assuming the Salar Olaroz project is a success, it should create the cash flow necessary to partially finance project expansion at Olaroz and at new sites.
Key risks: Orocobre is currently having difficulties increasing production at its Olaroz facility in Argentina due to engineering and equipment issues. It is carrying out de-bottlenecking, and expects to complete this process early 2016. Monthly production has already increased to 365 tonnes in December 2015 from 143 tonnes in August 2015. The key risk is further technical problems after the completion of de-bottlenecking (which has cost c$8m).
Summary: Orocobre is only new lithium miner which has successfully been able to develop a large lithium carbonate project. The company has access to low cost and high quality lithium reserves. If the company is able to ramp up production successfully it should become a new major player in the sector.
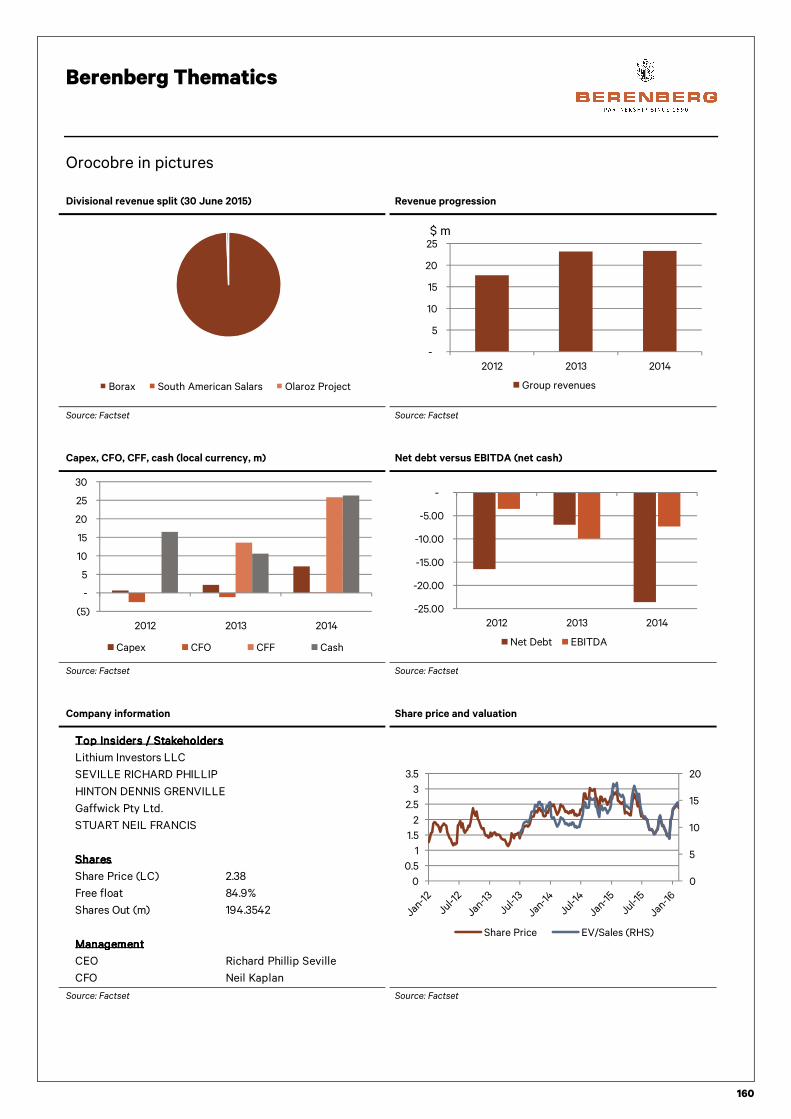
Berenberg Thematics
160
Orocobre in pictures
Divisional revenue split (30 June 2015) Revenue progression
Source: Factset Source: Factset
Capex, CFO, CFF, cash (local currency, m) Net debt versus EBITDA (net cash)
Source: Factset Source: Factset
Company information Share price and valuation
Source: Factset Source: Factset
Borax South American Salars Olaroz Project
-
5
10
15
20
25
2012 2013 2014
Group revenues
$ m
(5)
-
5
10
15
20
25
30
2012 2013 2014
Capex CFO CFF Cash
-25.00
-20.00
-15.00
-10.00
-5.00
-
2012 2013 2014
Net Debt EBITDA
SharesSharesSharesShares
Share Price (LC) 2.38
Free float 84.9%
Shares Out (m) 194.3542
CEO Richard Phillip Seville
CFO Neil Kaplan
STUART NEIL FRANCIS
ManagementManagementManagementManagement
Top Insiders / StakeholdersTop Insiders / StakeholdersTop Insiders / StakeholdersTop Insiders / Stakeholders
Lithium Investors LLC
SEVILLE RICHARD PHILLIP
HINTON DENNIS GRENVILLE
Gaffwick Pty Ltd.
0
5
10
15
20
0
0.5
1
1.5
2
2.5
3
3.5
Share Price EV/Sales (RHS)

Berenberg Thematics
161
Western Lithium (market cap: CAD0.1bn)
Business Description: Canada-based Western Lithium is a speciality chemicals company focused on manufacturing Lithium and its compounds. Western Lithium merged with Lithium Americas in June 2015 and currently has two projects in different stages of development in Argentina and the US. The company is listed on the Toronto Stock Exchange.
Growth outlook and opportunities: Western Lithium also has ownership of 83,000 hectares in Salar Olaroz and Salar Cauchari in Argentina, which it shares with Orocobre. Western Lithium is developing the two salars (salt flats) together as the Cauchari Olaroz project. These two salars together represent the third-largest Lithium brine resource in the world (the largest two are in Bolivia and Chile). Reserves at Western Lithium’s Cauchari Olaroz project stand at 2.7m tonnes LCE. The company believes that the project can easily support production of 40kT LCE pa over the next 40 years. With the pilot plant successfully completed, Western Lithium expects to reach 2.5kT LCE production by end-2016 with project ramp-up to 20kT LCE in 2017. Considering the large low-cost resource base, we believe that the company will be able to significantly grow manufacturing capacity in the future.
Western Lithium, is developing the Cauchario Olaroz project in partnership with POSCO, the largest steel company in South Korea. POSCO is contributing its proprietary Lithium extraction technology to the JV and has also agreed to finance the initial stage of project development to achieve 2.5kT LCE by the end of 2016. POSCO Lithium extraction technology was successfully deployed at the pilot plant and initial results have been positive according to the company. In contrast to evaporation, POSCO extraction technology has several advantages, including faster production, higher recovery rates and reduced environmental impact. Western Lithium expects to announce the final collaborative agreement with POSCO in the beginning of 2016. We think that this technology partnership is a positive, considering that the key reason for project failures in the past in the Lithium industry has been engineering failures.
Key risks: 1) The company has high execution risk associated with its new project as it utilises a new technology for extraction. 2) Western Lithium would likely have high funding requirements as it develops its new projects.
Summary: Western Lithium has access to large lithium reserves in Argentina. The company is using a new technology to speed up extraction of lithium from the brine reserves. If the company is able to execute the project on time, on budget and without engineering problems, it could become a major supplier of lithium in the market.

Berenberg Thematics
162
Western Lithium in pictures
Capex, CFO, CFF, cash (local currency, m) Net debt versus EBITDA (net cash)
Source: Factset Source: Factset
Company information Share price and valuation
Source: Factset Source: Factset
(10)
(5)
-
5
10
15
20
2012 2013 2014
Capex CFO CFF Cash
-12.00
-10.00
-8.00
-6.00
-4.00
-2.00
-
2012 2013 2014
Net Debt EBITDA
SharesSharesSharesShares
Share Price (LC) 0.43
Free float 98.5%
Shares Out (m) 289.997
CEO William Thomas Hodgson, MBA
CFO Eduard K. Epshtein, CA
HALDANE WILLIAM R
ManagementManagementManagementManagement
Top Insiders / StakeholdersTop Insiders / StakeholdersTop Insiders / StakeholdersTop Insiders / Stakeholders
MACKEN JOHN ANTHONY
Estate Of Raymond Edward Flood
CHMELAUSKAS JAY
EPSHTEIN EDUARD K
0
0.2
0.4
0.6
0.8
1
1.2
0
0.2
0.4
0.6
0.8
1
Share Price EV/Sales (RHS)

Berenberg Thematics
163
Umicore (Sell, PT €26.00; market cap: €3.7bn)
Berenberg analyst: Evgenia MolotovaBerenberg analyst: Evgenia MolotovaBerenberg analyst: Evgenia MolotovaBerenberg analyst: Evgenia Molotova
Business Description: Umicore was founded at the beginning of the 19th century as a mining operation in the then-Belgian Congo (Union Minière) and refining operations in Belgium. Today, Umicore is a global materials technology and recycling group, with more than 14,000 employees and a turnover of €8.8bn. Umicore is present in many areas where a high level of technology and innovation is required; for instance: precious metals recycling, cathode materials for EV batteries and CPVs.
Umicore consists of three divisions: Catalysis (39% of EBIT), Energy and Surface Technologies (19% of EBIT) and Recycling (42%): Umicore generates the majority of its revenues from – and dedicates most of its R&D efforts towards – clean technologies, such as emission-control catalysts, materials for rechargeable batteries and PVs, fuel cells and recycling. Umicore’s rechargeable batteries business unit produces cathode materials for lithium-ion batteries, for which it is the market leader. The business unit is part of its Energy Materials business which also includes cobalt and speciality materials business.
Growth outlook and opportunities: Umicore is currently the market leader in cathode materials manufacturing for electronics and EVs. It manufactures LCO cathode material for electronics, NCA and NCM for EVs and LFP for stationary storage and mass transport (buses). This gives Umicore the broadest exposure to the ongoing electrification of the transport sector and adoption in stationary storage versus all of its competitors which includes BASF, JMAT, Toda Kogyo, 3M and Nichia.
Umicore is also one of the first producers to invest in a recycling facility for EV batteries. In 2011, it inaugurated its ultra-high temperature (UHT) pilot plant in Hoboken (capex of c€25m). This is a unique technology which works at UHTs and allows a range of valuable metals to be extracted in a clean and efficient way.
Key risks: 1) While Umicore is the market leader in cathode material, it remains a small part of the group. The company remains in essence a recycling play and we believe that competition in this segment is intensifying. More and more non-ferrous metal smelting and mining companies are starting to treat residues in-house, which reduces availability of feedstocks for Umicore. We believe it will be challenging for Umicore to fill 40% of additional capacity, which will be brought on-stream at the end of 2016, and future returns of the company will suffer. 2) Umicore also faces a lawsuit from BASF and Argonne National Laboratory on patent infringement for its NMC cathode material. Umicore is a major NMC manufacturer for EVs and it needs to be seen how the lawsuit evolves. 3) electronics currently the main market for Umicore cathode material business. The economic slowdown in China could potentially affect the global demand growth for smartphones, tablets and other electronics devices.
Summary: Umicore is the market leader in cathode manufacturer and has the broadest exposure to lithium ion cells used in electronics, EVs, mas transportation and stationary storage. This positions the company well to benefit from the greater penetration of EV and stationary storage in the power sector over the next five years. However, currently the cathode manufacturing remains a small of part of the group and the company faces numerous risks to its recycling business which forms more than half of its revenues. Downward pressure on precious metal pricing, greater competition in recycling and its implications for asset utilisation, margins and returns are all medium term factors which underpin our in-house Sell rating on the stock. However cathode manufacturing could develop as a strong business line for Umicore in the long term.

Berenberg Thematics
164
Umicore in pictures
Divisional revenue split (31 December 2014) Revenue progression
Source: Factset Source: Factset
Capex, CFO, CFF, cash (local currency, m) Net debt/EBITDA
Source: Factset Source: Factset
Company information Share price and valuation
Source: Factset Source: Factset
Recycling Catalysis
Performance Materials Energy Materials
-
5,000
10,000
15,000
20,000
2012 2013 2014
Group revenues Revenues Energy division
$ m
(400)
(200)
-
200
400
600
2012 2013 2014
Capex CFO CFF Cash
- 0.1 0.2 0.3 0.4 0.5 0.6 0.7 0.8 0.9
2012 2013 2014
Net Debt / EBITDA
SharesSharesSharesShares
Share Price (LC) 33.27
Free float 83.4%
Shares Out (m) 112
CEO Marc Grynberg
CFO Filip Platteeuw
ManagementManagementManagementManagement
Top Insiders / StakeholdersTop Insiders / StakeholdersTop Insiders / StakeholdersTop Insiders / Stakeholders
Groupe Bruxelles Lambert SA
Compagnie du Bois Sauvage SA
0
0.1
0.2
0.3
0.4
0.5
0.6
0.7
0
10
20
30
40
50
Share Price EV/Sales (RHS)

Berenberg Thematics
165
Risk to thesis
The risks associated with the growth of lithium ion batteries in automotive and stationary storage are linked with regulation, incentives, environmental impacts and security of supply for critical materials. These are long-term risks and could negatively affect the cost trajectory for batteries and their adoption within transportation and power sectors.
Regulatory risks
Regulations framework for autos Regulations framework for autos Regulations framework for autos Regulations framework for autos
The regulatory environment in the shape of policies, incentives and taxation will play a key role in determining how the battery storage sector will develop. Currently, buyers of EVs receive both direct and indirect state support in most countries. The support includes direct purchase subsidies on EVs and home charging equipment, zero taxation, subsidised charging, and indirect benefits such as access to bus lanes and relief from congestion charges. This support will become unmanageable in the long term as EV sales continue to rise. Hence, we think that direct purchase subsidies will be phased out over the next 5-10 years in most countries. While a gradual phasing-out of support is unlikely to negatively affect EV adoption, abrupt changes would.
Currently, taxes on fuel usage in transportation forms considerable part of total taxation in most OECD countries and is one of the key sources of funding for maintaining public transportation – for example, £27.2bn (5% of total taxes) of fuel taxation in UK and €33bn (~3% of tax receipts) in Germany. Tax on electricity usage for charging for EVs is significantly lower and hence as more EVs replace ICVs in the future, governments will find it necessary to replace the lost revenues. Hence the risk of increased taxation on electricity usage is a real possibility in the long term.
Regulatory restrictioRegulatory restrictioRegulatory restrictioRegulatory restrictions on stationary storagens on stationary storagens on stationary storagens on stationary storage
Currently, a level playing field does not exist for storage in Europe, where regulation restricts growth in grid scale energy storage.
First, there is a lack of clarity about whether or not transmission network operators (TNOs) are allowed to own and operate storage assets to provide grid level services. Distribution network operators (DNOs) on the other hand are not allowed to own storage assets. This is because generation, transmission and distribution services have been unbundled in Europe and storage is currently classified as a generation asset. As storage affects the supply and demand for electricity, it thus comes under the responsibility of utilities. The regulatory framework does not incorporate the value storage can bring to grid balancing and renewable integration and is restricting its uptake for providing ancillary services such as frequency regulation and voltage support.
Second, in Norway, Austria, Belgium and Greece, grid scale storage faces double taxation. While charging, storage assets act as a consumer and the storage owners have to pay for using the grid. During discharge, storage asset acts like a generation asset and the storage owner again has to pay a charge for utilising the grid. This double taxation will need to end before storage picks up in Europe.
Based on the numerous discussions we have had with utilities, TSOs, DNOs and other market participants in writing this report, we have noted widespread support within Europe (among all players) to resolve both of these regulatory hindrances for grid scale storage.
Security of supply and cost – high supply risk for cobalt and natural
graphite
Security of supply (ie risk of disruption in the supply of critical materials) remains a key risk in the manufacture of lithium ion batteries. Any excessive volatility in pricing for important raw materials will affect manufacturing costs. The four key raw materials for battery manufacture are lithium, cobalt, nickel and graphite. Apart from lithium, the pricing for all of these minerals have been declining over the last few years as a result of

Berenberg Thematics
166
the global slowdown in the growth of industrial activity. Of these four minerals, the European Commission, in its 2014 report on critical materials for EU, highlighted cobalt and natural graphite as the ones with the highest supply risk. This is because the supply for both materials is highly concentrated: 56% of cobalt comes from the Congo while 69% of natural graphite comes from China. Any export restrictions or increases in taxation could have a marked impact on prices. While the supply risk is high, there are substitutes for both materials in battery manufacturing.
EU Commission highlighted that cobalt and natural graphite have
high supply risk….
… as their supply is highly concentrated – 56% of cobalt comes
from the Congo and 69% of natural graphite comes from China
Source: Albemarle Source: Albemarle
Environmental risks are numerous – the recycling industry needs to
develop to resolve these issues
Lack of recyclingLack of recyclingLack of recyclingLack of recycling
Only 1% of the lithium ion batteries produced are recycled and the majority end up in landfill. The reason for this is that recycling is not cost-effective as the supply chain for used cells does not exist and is difficult to establish (historically the main market has been the electronics market, where usage, although large, is diffused to millions of appliances and users). Secondly, lithium ion cells have different chemistries – currently there are no international standards for labelling requirements for these cells, which makes sorting difficult and hence recycling expensive. However, this is likely to change as the industry adopts labelling standards in the future.
Manufacturing of lithium ion cells is also pollutive for the environment especially the manufacture of the cathode material. According to Argonne National Laboratory, SOx emissions are high for cathode materials, which use nickel and cobalt as they are manufactured from their sulphide ores. According to Argonne National Laboratory estimates, recycling through any method, whether it is pyrometallurgical (smelting), hydrometallurgical (chemically, through the use of aqueous solutions) or mechanical, would lead to significantly lower SOx emissions versus virgin manufacturing of the cathode material (please see chart below).

Berenberg Thematics
167
Argonne National Laboratory estimates that SOx emissions from virgin LCO manufacturing are
many times higher than cathode recycling
Source: “Recycling Li-ion batteries” presentation by Linda Gaines, Sep 2015
Cobalt mining in Cobalt mining in Cobalt mining in Cobalt mining in the the the the CongoCongoCongoCongo affected byaffected byaffected byaffected by child labour issueschild labour issueschild labour issueschild labour issues,,,, according to according to according to according to Amnesty InternationalAmnesty InternationalAmnesty InternationalAmnesty International
In a recent report published by Amnesty International, there is a serious child labour issue in the cobalt mining industry in the Congo, and only very basic measures are taken to protect miners. More than 50% of the global cobalt manufacturing industry is based in the Congo. In the absence of lithium ion battery refining, the majority of the cobalt ores are sourced from the Congo and then refined in China.
Natural graphite mining a cause of air and water pollution in China Natural graphite mining a cause of air and water pollution in China Natural graphite mining a cause of air and water pollution in China Natural graphite mining a cause of air and water pollution in China
Graphite is used as the anode in most of the different types of lithium ion cells. The majority of the graphite is mined in China where it has been a major cause of air and water pollution. This has led to the Chinese authorities reportedly closing a number of mines in the past. A high amount of hydrochloric acid is used to leach out the impurities from natural graphite to create battery grade material. This has reportedly been a cause of acid rain in some parts of China.
There is an ongoing shift among lithium ion battery manufacturers for EVs towards using synthetic graphite, which is produced from petroleum coke and is less pollutive than the production of natural graphite for the environment. Currently 25-30% of the graphite used in batteries is synthetic. While the cost of synthetic graphite is nearly double versus natural graphite, it is more stable and hence improves battery cycle life.
0
5,000
10,000
15,000
20,000
25,000
30,000
Virgin LCO Pyrometallurgical Hyrdometallurgical Direct
SOx Emissions (g/tonne)SOx Emissions (g/tonne)SOx Emissions (g/tonne)SOx Emissions (g/tonne)
Recycling Methods
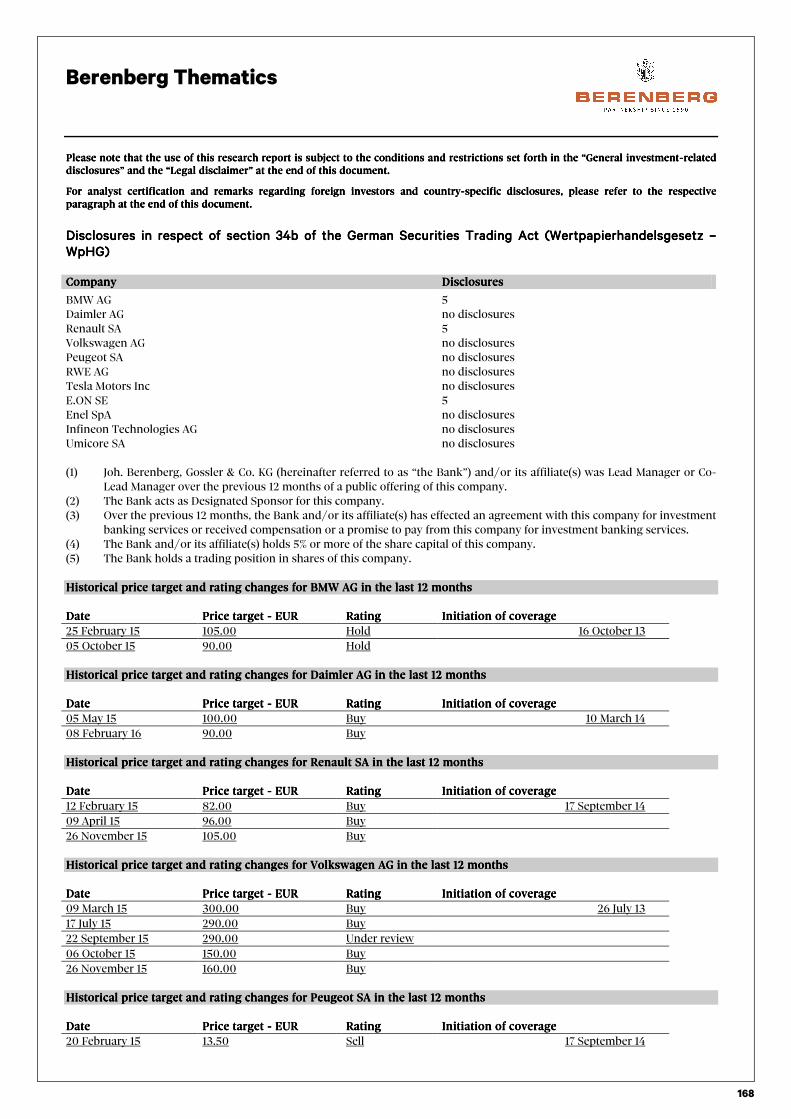
Berenberg Thematics
168
Please note that the use of this research report is subject to the conditions and restrictions set forth in the “General invePlease note that the use of this research report is subject to the conditions and restrictions set forth in the “General invePlease note that the use of this research report is subject to the conditions and restrictions set forth in the “General invePlease note that the use of this research report is subject to the conditions and restrictions set forth in the “General investmentstmentstmentstment----related related related related disclosures” and the “Legal disclaimer” at the end odisclosures” and the “Legal disclaimer” at the end odisclosures” and the “Legal disclaimer” at the end odisclosures” and the “Legal disclaimer” at the end of this document. f this document. f this document. f this document.
For analyst certification and remarks regarding foreign investors and countryFor analyst certification and remarks regarding foreign investors and countryFor analyst certification and remarks regarding foreign investors and countryFor analyst certification and remarks regarding foreign investors and country----specific disclosures, please refer to the respective specific disclosures, please refer to the respective specific disclosures, please refer to the respective specific disclosures, please refer to the respective paragraph at the end of this document.paragraph at the end of this document.paragraph at the end of this document.paragraph at the end of this document.
Disclosures in respect of section 34b of the German Securities Disclosures in respect of section 34b of the German Securities Disclosures in respect of section 34b of the German Securities Disclosures in respect of section 34b of the German Securities Trading Act (Wertpapierhandelsgesetz Trading Act (Wertpapierhandelsgesetz Trading Act (Wertpapierhandelsgesetz Trading Act (Wertpapierhandelsgesetz ––––
WpHG)WpHG)WpHG)WpHG)
CompanyCompanyCompanyCompany DisclosuresDisclosuresDisclosuresDisclosures BMW AG 5 Daimler AG no disclosures Renault SA 5 Volkswagen AG no disclosures Peugeot SA no disclosures RWE AG no disclosures Tesla Motors Inc no disclosures E.ON SE 5 Enel SpA no disclosures Infineon Technologies AG no disclosures Umicore SA no disclosures (1) Joh. Berenberg, Gossler & Co. KG (hereinafter referred to as “the Bank”) and/or its affiliate(s) was Lead Manager or Co-
Lead Manager over the previous 12 months of a public offering of this company. (2) The Bank acts as Designated Sponsor for this company. (3) Over the previous 12 months, the Bank and/or its affiliate(s) has effected an agreement with this company for investment
banking services or received compensation or a promise to pay from this company for investment banking services. (4) The Bank and/or its affiliate(s) holds 5% or more of the share capital of this company. (5) The Bank holds a trading position in shares of this company. Historical price target and rating changes for Historical price target and rating changes for Historical price target and rating changes for Historical price target and rating changes for BMW AGBMW AGBMW AGBMW AG in the last 12 months in the last 12 months in the last 12 months in the last 12 months DateDateDateDate Price target Price target Price target Price target ---- EUREUREUREUR RatingRatingRatingRating Initiation of coverageInitiation of coverageInitiation of coverageInitiation of coverage
25 February 15 105.00 Hold 16 October 13
05 October 15 90.00 Hold Historical price target and rating changes for Historical price target and rating changes for Historical price target and rating changes for Historical price target and rating changes for Daimler AGDaimler AGDaimler AGDaimler AG in the last 12 months in the last 12 months in the last 12 months in the last 12 months DateDateDateDate Price target Price target Price target Price target ---- EUREUREUREUR RatingRatingRatingRating Initiation of coverageInitiation of coverageInitiation of coverageInitiation of coverage
05 May 15 100.00 Buy 10 March 14
08 February 16 90.00 Buy Historical price target and rating changes for Historical price target and rating changes for Historical price target and rating changes for Historical price target and rating changes for Renault SARenault SARenault SARenault SA in the last 12 months in the last 12 months in the last 12 months in the last 12 months DateDateDateDate Price target Price target Price target Price target ---- EUREUREUREUR RatingRatingRatingRating Initiation of coverageInitiation of coverageInitiation of coverageInitiation of coverage
12 February 15 82.00 Buy 17 September 14
09 April 15 96.00 Buy
26 November 15 105.00 Buy Historical price target and rating changes for Historical price target and rating changes for Historical price target and rating changes for Historical price target and rating changes for Volkswagen AGVolkswagen AGVolkswagen AGVolkswagen AG in the last 12 months in the last 12 months in the last 12 months in the last 12 months DateDateDateDate Price target Price target Price target Price target ---- EUREUREUREUR RatingRatingRatingRating InitiationInitiationInitiationInitiation of coverageof coverageof coverageof coverage
09 March 15 300.00 Buy 26 July 13
17 July 15 290.00 Buy
22 September 15 290.00 Under review
06 October 15 150.00 Buy
26 November 15 160.00 Buy Historical price target and rating changes for Historical price target and rating changes for Historical price target and rating changes for Historical price target and rating changes for Peugeot SAPeugeot SAPeugeot SAPeugeot SA in the last 12 months in the last 12 months in the last 12 months in the last 12 months DateDateDateDate Price target Price target Price target Price target ---- EUREUREUREUR RatingRatingRatingRating Initiation of coverageInitiation of coverageInitiation of coverageInitiation of coverage
20 February 15 13.50 Sell 17 September 14

Berenberg Thematics
169
Historical price target and rating changes for Historical price target and rating changes for Historical price target and rating changes for Historical price target and rating changes for RWE AGRWE AGRWE AGRWE AG in the last 12 months in the last 12 months in the last 12 months in the last 12 months DateDateDateDate Price target Price target Price target Price target ---- EUREUREUREUR RatingRatingRatingRating Initiation of coverageInitiation of coverageInitiation of coverageInitiation of coverage
16 April 15 19.00 Sell 12 January 11
03 July 15 20.00 Hold
17 August 15 17.00 Hold
23 October 15 14.00 Hold
10 February 16 10.50 Sell Historical price target and rating changes for Historical price target and rating changes for Historical price target and rating changes for Historical price target and rating changes for Tesla Motors IncTesla Motors IncTesla Motors IncTesla Motors Inc in the last 12 months in the last 12 months in the last 12 months in the last 12 months DateDateDateDate Price target Price target Price target Price target ---- USDUSDUSDUSD RatingRatingRatingRating Initiation of Initiation of Initiation of Initiation of coveragecoveragecoveragecoverage
02 February 16 165.00 Sell 02 February 16 Historical price target and rating changes for Historical price target and rating changes for Historical price target and rating changes for Historical price target and rating changes for E.ON SEE.ON SEE.ON SEE.ON SE in the last 12 months in the last 12 months in the last 12 months in the last 12 months DateDateDateDate Price target Price target Price target Price target ---- EUREUREUREUR RatingRatingRatingRating Initiation of coverageInitiation of coverageInitiation of coverageInitiation of coverage
30 April 15 13.80 Hold 08 November 10
23 October 15 10.00 Hold
10 February 16 8.00 Sell Historical price target and rating changes for Historical price target and rating changes for Historical price target and rating changes for Historical price target and rating changes for Enel SpAEnel SpAEnel SpAEnel SpA in the last 12 months in the last 12 months in the last 12 months in the last 12 months DateDateDateDate Price target Price target Price target Price target ---- EUREUREUREUR RatingRatingRatingRating Initiation of coverageInitiation of coverageInitiation of coverageInitiation of coverage
10 September 15 4.60 Buy 14 July 11
10 February 16 4.00 Buy Historical price target and rating changes for Historical price target and rating changes for Historical price target and rating changes for Historical price target and rating changes for Infineon Technologies AGInfineon Technologies AGInfineon Technologies AGInfineon Technologies AG in the last 12 months in the last 12 months in the last 12 months in the last 12 months DateDateDateDate Price target Price target Price target Price target ---- EUREUREUREUR RatingRatingRatingRating Initiation of coverageInitiation of coverageInitiation of coverageInitiation of coverage
12 March 15 9.40 Hold 06 January 10
08 January 16 9.40 Under review
03 February 16 15.00 Buy Historical price target and rating changes for Historical price target and rating changes for Historical price target and rating changes for Historical price target and rating changes for Umicore SAUmicore SAUmicore SAUmicore SA in the last 12 months in the last 12 months in the last 12 months in the last 12 months DateDateDateDate Price target Price target Price target Price target ---- EUREUREUREUR RatingRatingRatingRating Initiation of coverageInitiation of coverageInitiation of coverageInitiation of coverage
15 July 13 Berenberg Equity Research ratings distribution and in proportion to investment banking services, Berenberg Equity Research ratings distribution and in proportion to investment banking services, Berenberg Equity Research ratings distribution and in proportion to investment banking services, Berenberg Equity Research ratings distribution and in proportion to investment banking services, as of 1 as of 1 as of 1 as of 1 JanuaryJanuaryJanuaryJanuary 2016 2016 2016 2016 in respect of section 5 paragraph 4 of the German Financial Analysis Regulation in respect of section 5 paragraph 4 of the German Financial Analysis Regulation in respect of section 5 paragraph 4 of the German Financial Analysis Regulation in respect of section 5 paragraph 4 of the German Financial Analysis Regulation (Finanzanalyseverordnung (Finanzanalyseverordnung (Finanzanalyseverordnung (Finanzanalyseverordnung –––– FinAnV)FinAnV)FinAnV)FinAnV) Buy 50.00 % 84.85 % Sell 14.23 % 0.00 % Hold 35.77 % 15.15 %
Valuation basis/rating keyValuation basis/rating keyValuation basis/rating keyValuation basis/rating key The recommendations for companies analysed by Berenberg’s Equity Research department are made on an absolute basis for which the following three-step rating key is applicable:
Buy:Buy:Buy:Buy: Sustainable upside potential of more than 15% to the current share price within 12 months;
Sell:Sell:Sell:Sell: Sustainable downside potential of more than 15% to the current share price within 12 months;
Hold:Hold:Hold:Hold: Upside/downside potential regarding the current share price limited; no immediate catalyst visible.
NB: During periods of high market, sector, or stock volatility, or in special situations, the recommendation system criteria may be breached temporarily.

Berenberg Thematics
170
Competent supervisory authorityCompetent supervisory authorityCompetent supervisory authorityCompetent supervisory authority
Bundesanstalt für Finanzdienstleistungsaufsicht -BaFin- (Federal Financial Supervisory Authority),
Graurheindorfer Straße 108, 53117 Bonn and Marie-Curie-Str. 24-28, 60439 Frankfurt am Main, Germany.
General investmentGeneral investmentGeneral investmentGeneral investment----related disclosuresrelated disclosuresrelated disclosuresrelated disclosures Joh. Berenberg, Gossler & Co. KG (hereinafter referred to as “the Bank”) has made every effort to carefully research all information contained in this financial analysis. The information on which the financial analysis is based has been obtained from sources which we believe to be reliable such as, for example, Thomson Reuters, Bloomberg and the relevant specialised press as well as the company which is the subject of this financial analysis.
Only that part of the research note is made available to the issuer (who is the subject of this analysis) which is necessary to properly reconcile with the facts. Should this result in considerable changes a reference is made in the research note.
Opinions expressed in this financial analysis are our current opinions as of the issuing date indicated on this document. The companies covered by Berenberg are continuously followed by the analyst. Based on developments with the relevant company, the sector or the market which may have a material impact on the research views, research reports will be updated as it deems appropriate.
The functional job title of the person/s responsible for the recommendations contained in this report is “Equity Research Analyst” unless otherwise stated on the cover.
The following internet link provides further remarks on our financial analyses:The following internet link provides further remarks on our financial analyses:The following internet link provides further remarks on our financial analyses:The following internet link provides further remarks on our financial analyses: http://www.berenberg.de/research.html?&L=1&no_cache=1http://www.berenberg.de/research.html?&L=1&no_cache=1http://www.berenberg.de/research.html?&L=1&no_cache=1http://www.berenberg.de/research.html?&L=1&no_cache=1
Legal disclaimerLegal disclaimerLegal disclaimerLegal disclaimer This document has been prepared by Joh. Berenberg, Gossler & Co. KG (hereinafter referred to as “the Bank”). This document does not claim completeness regarding all the information on the stocks, stock markets or developments referred to in it.
On no account should the document be regarded as a substitute for the recipient procuring information for himself/herself or exercising his/her own judgements.
The document has been produced for information purposes for institutional clients or market professionals.
Private customers, into whose possession this document comes, should discuss possible investment decisions with their customer service officer as differing views and opinions may exist with regard to the stocks referred to in this document.
This document is not a solicitation or an offer to buy or sell the mentioned stock.
The document may include certain descriptions, statements, estimates, and conclusions underlining potential market and company development. These reflect assumptions, which may turn out to be incorrect. The Bank and/or its employees accept no liability whatsoever for any direct or consequential loss or damages of any kind arising out of the use of this document or any part of its content.
The Bank and/or its employees may hold, buy or sell positions in any securities mentioned in this document, derivatives thereon or related financial products. The Bank and/or its employees may underwrite issues for any securities mentioned in this document, derivatives thereon or related financial products or seek to perform capital market or underwriting services.
Analyst certificationAnalyst certificationAnalyst certificationAnalyst certification I, Asad Farid, hereby certify that all of the views expressed in this report accurately reflect my personal views about any and all of the subject securities or issuers discussed herein.
In addition, I hereby certify that no part of my compensation was, is, or will be, directly or indirectly related to the specific recommendations or views expressed in this research report, nor is it tied to any specific investment banking transaction performed by the Bank or its affiliates.
I, Nick Anderson, hereby certify that all of the views expressed in this report accurately reflect my personal views about any and all of the subject securities or issuers discussed herein.
In addition, I hereby certify that no part of my compensation was, is, or will be, directly or indirectly related to the specific recommendations or views expressed in this research report, nor is it tied to any specific investment banking transaction performed by the Bank or its affiliates.
I, Jamie Rosser, hereby certify that all of the views expressed in this report accurately reflect my personal views about any and all of the subject securities or issuers discussed herein.
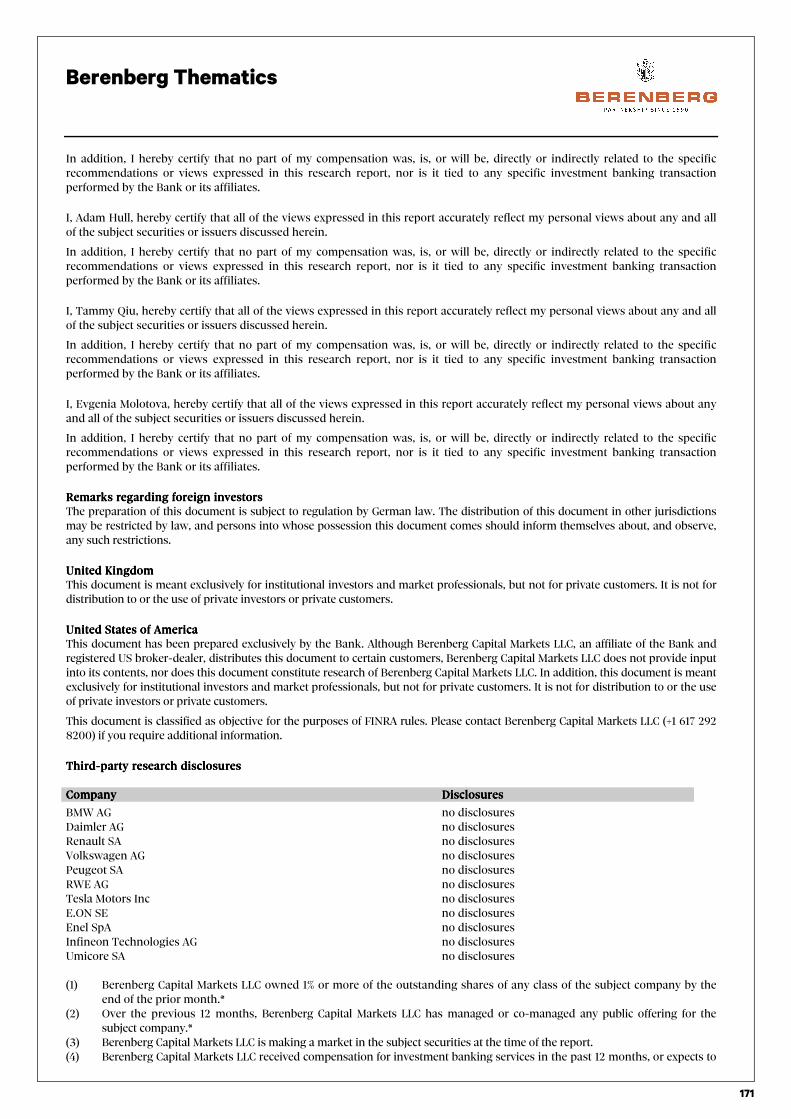
Berenberg Thematics
171
In addition, I hereby certify that no part of my compensation was, is, or will be, directly or indirectly related to the specific recommendations or views expressed in this research report, nor is it tied to any specific investment banking transaction performed by the Bank or its affiliates.
I, Adam Hull, hereby certify that all of the views expressed in this report accurately reflect my personal views about any and all of the subject securities or issuers discussed herein.
In addition, I hereby certify that no part of my compensation was, is, or will be, directly or indirectly related to the specific recommendations or views expressed in this research report, nor is it tied to any specific investment banking transaction performed by the Bank or its affiliates.
I, Tammy Qiu, hereby certify that all of the views expressed in this report accurately reflect my personal views about any and all of the subject securities or issuers discussed herein.
In addition, I hereby certify that no part of my compensation was, is, or will be, directly or indirectly related to the specific recommendations or views expressed in this research report, nor is it tied to any specific investment banking transaction performed by the Bank or its affiliates.
I, Evgenia Molotova, hereby certify that all of the views expressed in this report accurately reflect my personal views about any and all of the subject securities or issuers discussed herein.
In addition, I hereby certify that no part of my compensation was, is, or will be, directly or indirectly related to the specific recommendations or views expressed in this research report, nor is it tied to any specific investment banking transaction performed by the Bank or its affiliates.
Remarks regarding foreignRemarks regarding foreignRemarks regarding foreignRemarks regarding foreign investorsinvestorsinvestorsinvestors The preparation of this document is subject to regulation by German law. The distribution of this document in other jurisdictions may be restricted by law, and persons into whose possession this document comes should inform themselves about, and observe, any such restrictions.
United KingdomUnited KingdomUnited KingdomUnited Kingdom This document is meant exclusively for institutional investors and market professionals, but not for private customers. It is not for distribution to or the use of private investors or private customers.
UnitUnitUnitUnited States of Americaed States of Americaed States of Americaed States of America This document has been prepared exclusively by the Bank. Although Berenberg Capital Markets LLC, an affiliate of the Bank and registered US broker-dealer, distributes this document to certain customers, Berenberg Capital Markets LLC does not provide input into its contents, nor does this document constitute research of Berenberg Capital Markets LLC. In addition, this document is meant exclusively for institutional investors and market professionals, but not for private customers. It is not for distribution to or the use of private investors or private customers.
This document is classified as objective for the purposes of FINRA rules. Please contact Berenberg Capital Markets LLC (+1 617 292 8200) if you require additional information.
ThThThThirdirdirdird----party research disclosures party research disclosures party research disclosures party research disclosures CompanyCompanyCompanyCompany DisclosuresDisclosuresDisclosuresDisclosures BMW AG no disclosures Daimler AG no disclosures Renault SA no disclosures Volkswagen AG no disclosures Peugeot SA no disclosures RWE AG no disclosures Tesla Motors Inc no disclosures E.ON SE no disclosures Enel SpA no disclosures Infineon Technologies AG no disclosures Umicore SA no disclosures (1) Berenberg Capital Markets LLC owned 1% or more of the outstanding shares of any class of the subject company by the
end of the prior month.* (2) Over the previous 12 months, Berenberg Capital Markets LLC has managed or co-managed any public offering for the
subject company.* (3) Berenberg Capital Markets LLC is making a market in the subject securities at the time of the report. (4) Berenberg Capital Markets LLC received compensation for investment banking services in the past 12 months, or expects to

Berenberg Thematics
172
receive such compensation in the next 3 months.* (5) There is another potential conflict of interest of the analyst or Berenberg Capital Markets LLC, of which the analyst knows
or has reason to know at the time of publication of this research report.
* For disclosures regarding affiliates of Berenberg Capital Markets LLC please refer to the ‘Disclosures in respect of section 34b of the German Securities Trading Act (Wertpapierhandelsgesetz – WpHG)’ section above.
CopyrightCopyrightCopyrightCopyright The Bank reserves all the rights in this document. No part of the document or its content may be rewritten, copied, photocopied or duplicated in any form by any means or redistributed without the Bank’s prior written consent.
© September 2015 Joh. Berenberg, Gossler & Co. KG
Contacts – Investment Banking www.berenberg.com e-mail: [email protected] / e-mail US: [email protected]
173
EQUITY RESEARCH Internet www.berenberg.com E-mail: [email protected]
RESEARCH
AEROSPACE & DEFENCE CAPITAL GOODS (cont.) INSURANCE TECHNOLOGY
Andrew Gollan +44 20 3207 7891 Rizk Maidi +44 20 3207 7806 Trevor Moss +44 20 3207 7893 Jean Beaubois +44 20 3207 7835
Charlotte Keyworth +44 20 3753 3013 Horace Tam +44 20 3465 2726 Iain Pearce +44 20 3465 2665 Georgios Kertsos +44 20 3465 2715
Ross Law +44 20 3465 2692 Simon Toennessen +44 20 3207 7819 Sami Taipalus +44 20 3207 7866 Gal Munda +44 20 3465 2746
Tammy Qiu +44 20 3465 2673
AUTOMOTIVES CHEMICALS LUXURY GOODS
Adam Hull +44 20 3465 2749 Sebastian Bray +44 20 3753 3011 Zuzanna Pusz +44 20 3207 7812 TELECOMMUNICATIONS
Paul Kratz +44 20 3465 2678 Andrew Heap +44 20 3207 7918 Usman Ghazi +44 20 3207 7824
John Klein +44 20 3207 7930 MEDIA Siyi He +44 20 3465 2697
BANKS Evgenia Molotova +44 20 3465 2664 Robert Berg +44 20 3465 2680 Laura Janssens +44 20 3465 2639
Adam Barrass +44 20 3207 7923 Laura Janssens +44 20 3465 2639 Paul Marsch +44 20 3207 7857
James Burbridge +44 20 3753 3014 CONSTRUCTION Sarah Simon +44 20 3207 7830 Michael Summerville +44 20 3207 7914
James Chappell +44 20 3207 7844 Lush Mahendrarajah +44 20 3207 7896
Andrew Lowe +44 20 3465 2743 Robert Muir +44 20 3207 7860 METALS & MINING THEMATIC RESEARCH
Eoin Mullany +44 20 3207 7854 Michael Watts +44 20 3207 7928 Alessandro Abate +44 20 3753 3029 Nick Anderson +44 20 3207 7838
Peter Richardson +44 20 3465 2681 Fawzi Hanano +44 20 3207 7910 Chris Armstrong +44 20 3207 7809
Jonathan Sharpe +44 20 3753 3031 FOOD MANUFACTURING AND H&PC Yuriy Vlasov +44 20 3465 2674 Asad Farid +44 20 3207 7932
Fintan Ryan +44 20 3465 2748 Jamie Rosser +44 20 3465 2732
BEVERAGES James Targett +44 20 3207 7873 MID CAP GENERAL
Javier Gonzalez Lastra +44 20 3465 2719 Robert Chantry +44 20 3207 7861 TOBACCO
Batuhan Karabekir +44 20 3465 2631 GENERAL RETAIL Gunnar Cohrs +44 20 3207 7894 Jonathan Leinster +44 20 3465 2645
Adam Mizrahi +44 20 3465 2653 Conrad Bartos +44 20 3753 3053 Sam England +44 20 3465 2687
Michelle Wilson +44 20 3465 2663 Ned Hammond +44 20 3753 3017 UTILITIES
BUSINESS SERVICES, LEISURE & TRANSPORT Benjamin May +44 20 3465 2667 Robin Abrams +44 20 3465 2635
Najet El Kassir +44 20 3207 7836 HEALTHCARE Anna Patrice +44 20 3207 7863 Andrew Fisher +44 20 3207 7937
Stuart Gordon +44 20 3207 7858 Scott Bardo +44 20 3207 7869 Simona Sarli +44 20 3207 7834 Mehul Mahatma +44 20 3465 2698
Simon Mezzanotte +44 20 3207 7917 Jakob Berry +44 20 3465 2724 Owen Shirley +44 20 3465 2731 Lawson Steele +44 20 3207 7887
Josh Puddle +44 20 3207 7881 Alistair Campbell +44 20 3207 7876
Alastair Reid +44 20 3207 7841 Graham Doyle +44 20 3465 2634 REAL ESTATE
Klara Fernandes +44 20 3465 2718 Kai Klose +44 20 3207 7888
CAPITAL GOODS Tom Jones +44 20 3207 7877 Tina Munda +44 20 3465 2716 ECONOMICS
Sebastian Kuenne +44 20 3207 7856 Louise Pearson +44 20 3465 2747 Kallum Pickering +44 20 3465 2672
Philippe Lorrain +44 20 3207 7823 Laura Sutcliffe +44 20 3465 2669 Holger Schmieding +44 20 3207 7889
EQUITY SALES E-mail: [email protected]
SPECIALIST SALES UK SWITZERLAND, AUSTRIA & ITALY PARIS
BANKS & DIVERSIFIED FINANCIALS Matthew Chawner +44 20 3207 7847 Andrea Ferrari +41 44 283 2020 Vincent Klein +33 1 58 44 95-09
Iro Papadopoulou +44 20 3207 7924 Alexandra Clément +44 20 3753 3018 Stephan Hofer +41 44 283 2029 Antonio Scuotto +33 1 58 44 95 03
CONSUMER STAPLES Fabian De Smet +44 20 3207 7810 Carsten Kinder +41 44 283 2024
Rupert Trotter +44 20 3207 7815 Toby Flaux +44 20 3465 2745 Gianni Lavigna +41 44 283 2038 TRADING
CONSUMER DISCRETIONARY Karl Hancock +44 20 3207 7803 Jamie Nettleton +41 44 283 2026 LONDON
Victoria Maigrot +44 20 3753 3010 Sean Heath +44 20 3465 2742 Benjamin Stillfried +41 44 283 2033 Edward Burlison-Rush +44 20 3753 3055
HEALTHCARE David Hogg +44 20 3465 2628
Frazer Hall +44 20 3207 7875 Peter Kaineder +44 20 3753 3062 SALES TRADING ELECTRONIC TRADING
INDUSTRIALS James Matthews +44 20 3207 7807 HAMBURG Daniel Eichhorn +49 40 350 60 391
Chris Armstrong +44 20 3207 7809 David Mortlock +44 20 3207 7850 Alexander Heinz +49 40 350 60 359 Matthias Führer +49 40 350 60 597
MEDIA & TELECOMMUNICATIONS Eleni Papoula +44 20 3465 2741 Gregor Labahn +49 40 350 60 571
Julia Thannheiser +44 20 3465 2676 Bhavin Patel +44 20 3207 7926 Marvin Schweden +49 40 350 60 576 CRM
MATERIALS Richard Payman +44 20 3207 7825 Tim Storm +49 40 350 60 415 Jessica Jarmyn +44 20 3465 2696
Jina Zachrisson +44 20 3207 7879 George Smibert +44 20 3207 7911 Philipp Wiechmann +49 40 350 60 346 Edwina Lucas +44 20 3207 7908
Anita Surana +44 20 3207 7855 Christoffer Winter +49 40 350 60 559 Greg Swallow +44 20 3207 7833
SALES Paul Walker +44 20 3465 2632
BENELUX LONDON CORPORATE ACCESS
Miel Bakker +44 20 3207 7808 FRANCE Mike Berry +44 20 3465 2755 Lindsay Arnold +44 20 3207 7821
Martin de Laet +44 20 3207 7804 Thibault Bourgeat +33 1 5844 9505 Stewart Cook +44 20 3465 2752 Jennie Jiricny +44 20 3207 7886
Alexander Wace +44 20 3465 2670 Alexandre Chevassus +33 1 5844 9512 Mark Edwards +44 20 3753 3004 Stella Siggins +44 20 3465 2630
Dalila Farigoule +33 1 5844 9510 Tristan Hedley +44 20 3753 3006
GERMANY Clémence Peyraud +33 1 5844 9521 Peter King +44 20 3753 3139 EVENTS
Michael Brauburger +49 69 91 30 90 741 Benjamin Voisin +33 1 5844 9507 Christoph Kleinasser +44 20 3753 3063 Laura Hawes +44 20 3753 3008
Nina Buechs +49 69 91 30 90 735 Chris McKeand +44 20 3207 7938 Suzy Khan +44 20 3207 7915
André Grosskurth +49 69 91 30 90 734 SCANDINAVIA Simon Messman +44 20 3465 2754 Charlotte Kilby +44 20 3207 7832
Florian Peter +49 69 91 30 90 740 Frederik Angel +44 20 3753 3055 AJ Pulleyn +44 20 3465 2756 Natalie Meech +44 20 3207 7831
Joerg Wenzel +49 69 91 30 90 743 Marco Weiss +49 40 350 60 719 Paul Somers +44 20 3465 2753 Ellen Parker +44 20 3465 2684
Sarah Weyman +44 20 3207 7801
US SALES SALES E-mail: [email protected]
BERENBERG CAPITAL MARKETS LLC Kelleigh Faldi +1 617 292 8288 SALES TRADING CRM
Member FINRA & SIPC Isabella Fantini +1 646 445 4861 Scott Duxbury +1 646 445 5573 Laura Cooper +1 646 445 7201
Shawna Giust +1 646 445 7216 Christopher Kanian +1 646 445 5576
Zubin Hubner +1 646 445 5572 Lars Schwartau +1 646 445 5571 CORPORATE ACCESS
Jessica London +1 646 445 7218 Bob Spillane +1 646 445 5574 Olivia Lee +1 646 445 7212
Ryan McDonnell +1 646 445 7214
Emily Mouret +1 415 802 2525 ECONOMICS
Peter Nichols +1 646 445 7204 Mickey Levy +1 646 445 4842
Kieran O'Sullivan +1 617 292 8292
Jonathan Saxon +1 646 445 7202