Berenberg & Goldman Sachs German Corporate...
31
Dr. Immo Querner, CFO Munich, 23 September 2013 Berenberg & Goldman Sachs German Corporate Conference
-
Upload
nguyentuyen -
Category
Documents
-
view
215 -
download
0
Transcript of Berenberg & Goldman Sachs German Corporate...
Dr. Immo Querner, CFOMunich, 23 September 2013
Berenberg & Goldman Sachs
German Corporate Conference

2 Berenberg & Goldman Sachs German Corporate Conference, Munich, 23 September 2013
Talanx – „Strong roots, dynamic growth“
Where are we coming from?1
Where do we stand today?2
How are we going to move forward?4
Which return to expect from us?5
What is special about us and what makes us different to peers?3
APPENDIX

3 Berenberg & Goldman Sachs German Corporate Conference, Munich, 23 September 2013
HistoryOverview V.a.G.
� HDI V.a.G. is a mutual insurance company and majority-owner of the holding company Talanx AG
� Around 1900, a fast-growing German industry saw the need for a more efficient way to receive third-party liability insurance cover
� On 8 December 1903, 176 companies and 6 employers liability insurance associations founded the “Haftpflichtverband der deutschenEisen- und Stahlindustrie” (“liability association of the German steel industry”)
� The organisational setup reflects the historic roots of HDI, an association of important companies of the German industry that offers mutual insurance cover
� Approx. 0.8m members of HDI V.a.G.
1 Where are we coming from?
Foundation as ‘Haftpflichtverband der
deutschen Eisen- und Stahlindustrie‘ in
Frankfurt
Relocation to Hannover
Companies of all industry sectors are able
to contract insurance with HDI V.a.G.
Foundation of Hannover Rück-
versicherungs AG
Diversification into life insurance
IPO of Hannover Rückversicherung AG
Renaming of HDI Beteiligungs AG to
Talanx AG
Start transfer of insurance business from
HDI V.a.G. to individual entities
Acquisition of Gerling insurance group by
Talanx AG
IPO of Talanx AG
1903
1919
1953
1966
1991
1994
1998
2001
2006
2012
4 Berenberg & Goldman Sachs German Corporate Conference, Munich, 23 September 2013
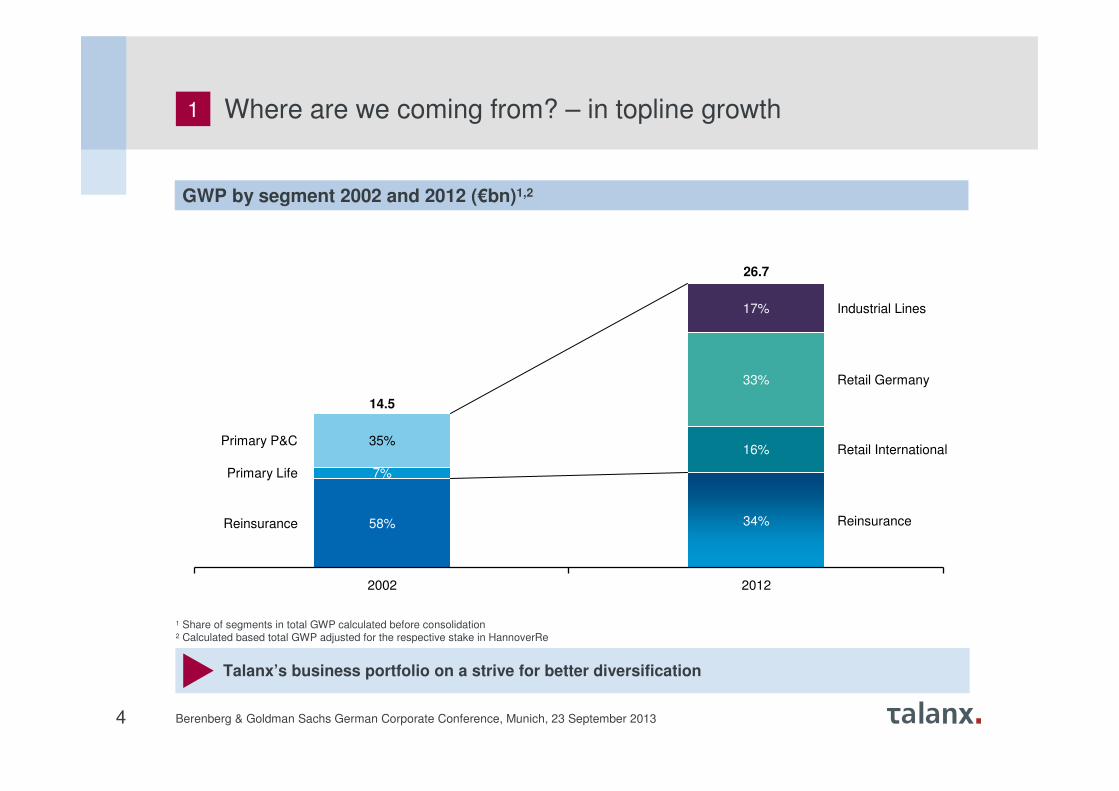
Where are we coming from? – in topline growth
GWP by segment 2002 and 2012 (€bn)1,2
Talanx’s business portfolio on a strive for better diversification
1 Share of segments in total GWP calculated before consolidation2 Calculated based total GWP adjusted for the respective stake in HannoverRe
2002 2012
14.5
26.7
58% 34%
16%
33%
17%
7%
35%
1
Primary P&C
Primary Life
Reinsurance
Industrial Lines
Retail Germany
Reinsurance
Retail International

5 Berenberg & Goldman Sachs German Corporate Conference, Munich, 23 September 2013
Location overview in primary insurance business
Where are we coming from? – in global presence
Talanx on the move to a global footprint
1
2000 2013
Branch / office locationCountries with local presence

6 Berenberg & Goldman Sachs German Corporate Conference, Munich, 23 September 2013
Our Mission
Optimised cooperation between our divisions
enables us to take advantage of promising
opportunities wherever they arise on the global
insurance markets – to the benefit of all our
stakeholders.
Our Vision
Talanx is the leading
global B2B insurance group.
Our Story
A leading German insurer with a unique global growth story
and an excellent risk / return profile.
2 Where do we stand today? – our corporate identity

7 Berenberg & Goldman Sachs German Corporate Conference, Munich, 23 September 2013
99.2
84.6
69.6
52.0
39.9
36.9
28.0
26.7
26.4
24.7
Allianz
Axa
Generali
Munich Re
Zurich
GPE Prudential
Aviva
CNP
Swiss Re
European insurers by global GWP (2012, €bn)German insurers by global GWP (2012, €bn)
Listed insurers
1
Where do we stand today? – our size versus peers
2
2
Third-largest German insurance group with leading position in Europe and strong roots in Germany
2
1 Cumulated individual financial statements 2 Gross premiums earnedSource: SNL Financial, annual reports
Top 10 European insurersTop 10 German insurers
99.2
52.0
26.7
11.9
9.3
6.9
5.6
5.5
4.2
4.0
Allianz
Munich Re
R+V
Debeka
Vk Bayern
Signal Iduna
HUK
Gothaer
W&W

8 Berenberg & Goldman Sachs German Corporate Conference, Munich, 23 September 2013
Where do we stand today? – our portfolio of brands
Talanx is an integrated international insurance group, anchored in Germany, running a multi-brand approach
2
Industrial Lines Retail Germany ReinsuranceCorporate
OperationsRetail International

9 Berenberg & Goldman Sachs German Corporate Conference, Munich, 23 September 2013
Industrial Lines Retail Germany Retail International Reinsurance
Life/HealthNon-Life
V.a.G.Free float
6.5 %79.1 %14.4 %
� Lead insurer of choice
� Extremely strong home market position, i.e. lead mandates
with most German DAX companies and
strong position with German Mittelstand
� Bluechip client base
in Europe
� Highly effective
network of distribution partners
� Market leader in
bancassurance
� Market leader in
employee affinity business
� Leading provider of
corporate pension solutions
� Hannover Re – world #3 reinsurer by GWP3
� Well diversified
between life/non-life and geographically
� Consistently amongst sector leaders on
profitability4
� Superior underwriting know-how
� Focused exposure to
CEE and LatAm (#2 insurer in Poland1, #6 in Brazilian motor2)
� Attractive rates of organic growth
� Experienced underwriter in motor
� Focused M&A track record
Where do we stand today? – our divisions
1 Combined ranking based on 2012 data of Polish regulator as per local GAAP 2 According to Siscorp based on local GAAP3 Based on A.M. Best ranking (September 2012)4 Based on S&P ranking by average RoE 2002-2010 and also number 1 by average RoE as per KPMG 2012
Integrated insurance group with leading market positions in all segments
2

10 Berenberg & Goldman Sachs German Corporate Conference, Munich, 23 September 2013
Industrial Lines Retail Germany Retail International Reinsurance
Operating segments
Groupreinsurance
Group-wide asset management unit
Central back-office service provider
Central IT service provider
Corporate operations
P&C reinsurance procurement
Where do we stand today? – our corporate functions
Talanx’s operating segments are supported by five specialised service functions
2
11 Berenberg & Goldman Sachs German Corporate Conference, Munich, 23 September 2013
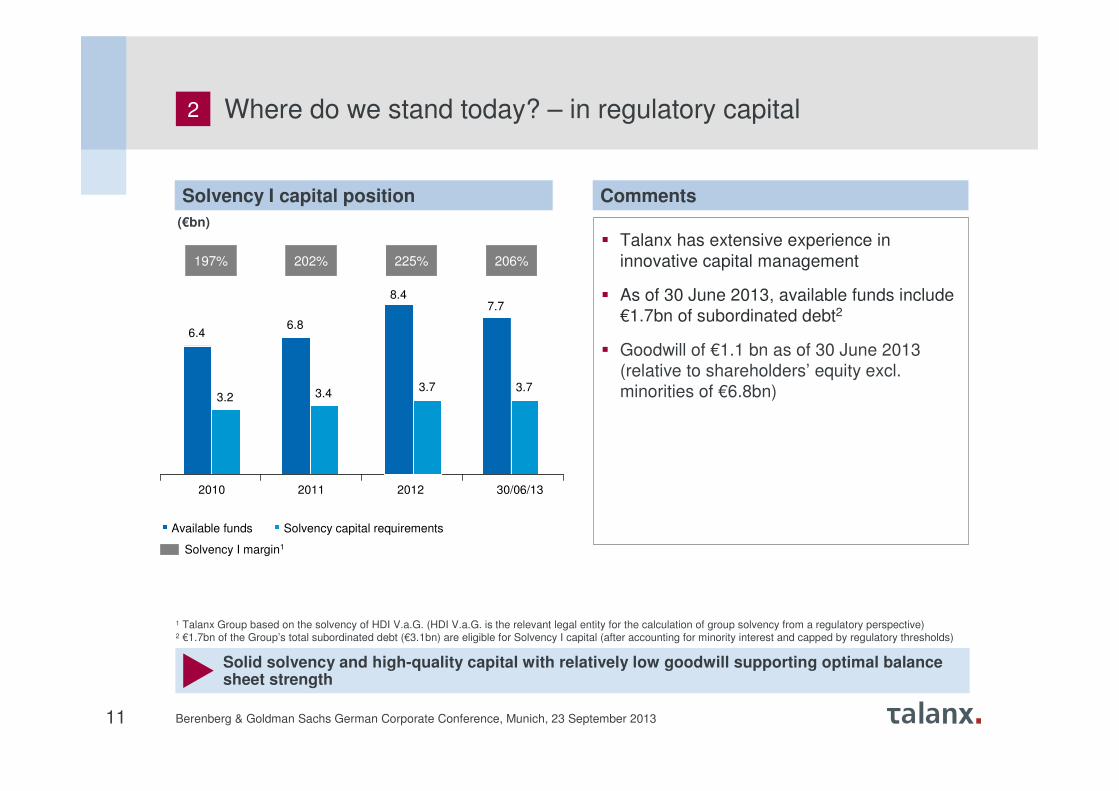
� Talanx has extensive experience in
innovative capital management
� As of 30 June 2013, available funds include
€1.7bn of subordinated debt2
� Goodwill of €1.1 bn as of 30 June 2013
(relative to shareholders’ equity excl.
minorities of €6.8bn)
(€bn)
Where do we stand today? – in regulatory capital2
Solid solvency and high-quality capital with relatively low goodwill supporting optimal balance sheet strength
1 Talanx Group based on the solvency of HDI V.a.G. (HDI V.a.G. is the relevant legal entity for the calculation of group solvency from a regulatory perspective)2 €1.7bn of the Group’s total subordinated debt (€3.1bn) are eligible for Solvency I capital (after accounting for minority interest and capped by regulatory thresholds)
CommentsSolvency I capital position
Solvency I margin1
197% 202% 225% 206%
6.46.8
7.7
3.2 3.43.7
2010 2011 2012 30/06/13
Available funds Solvency capital requirements
8.4
3.7

12 Berenberg & Goldman Sachs German Corporate Conference, Munich, 23 September 2013
16/05/1312/06/13
Standard & Poor’s A. M. Best
Grade Outlook Grade Outlook
Talanx Group1 A Stable
Talanx Primary Group2 A+ Stable
Hannover Re subgroup3 AA– Stable A+ Stable
Where do we stand today? – in ratings capital
rating of Talanx Primary GroupCurrent financial strength ratings
Financial strength underpinned by S&P and A.M. Best ratings
1 The designation used by A. M. Best for the Group is “Talanx AG and its leading non-life direct insurance operation and its leading life insurance operation”2 This rating applies to the core members of Talanx Primary Group (the subgroup of primary insurers in Talanx Group)3 This rating applies to Hannover Re and its major core companies. The Hannover Re subgroup corresponds to the Talanx Reinsurance segment4 Insurance Industry and Country Risk Assessment
2
Business Risk Profile
Strong
Financial Risk Profile
Very Strong
ERM
Strong
Management & Governance
Satisfactory
Capital & Earnings
Very Strong
IICRA 4)
Intermediate Risk
Risk Position
Intermediate Risk
Competitive Position
Strong
Risk Position
Strong
Liquidity
Exceptional
Anchor rating a+ Modifiers
13 Berenberg & Goldman Sachs German Corporate Conference, Munich, 23 September 2013
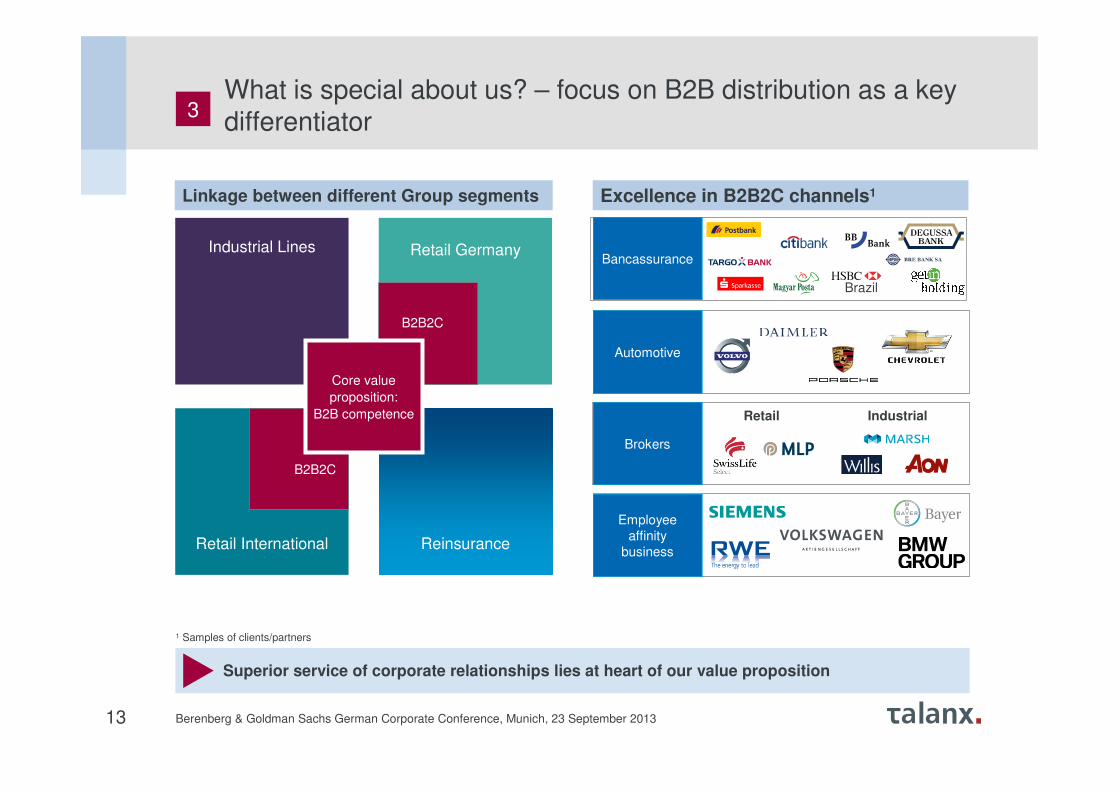
Brokers
Bancassurance
Automotive
Retail International
Retail GermanyIndustrial Lines
Reinsurance
Employee
affinity
business
Retail Industrial
Brazil
Core value
proposition:
B2B competence
B2B2C
B2B2C
What is special about us? – focus on B2B distribution as a key differentiator
Superior service of corporate relationships lies at heart of our value proposition
3
1 Samples of clients/partners
Excellence in B2B2C channels1Linkage between different Group segments

14 Berenberg & Goldman Sachs German Corporate Conference, Munich, 23 September 2013
Industrial Lines Retail GermanyRetail
InternationalReinsuranceIntra-group synergies
Reinsurance support
Talanx Systeme: Central IT service provider
Talanx Asset Management: Group-wide asset management unit
Talanx Reinsurance Broker: P&C reinsurance procurement
� Talanx leverages its
expertise across the
whole group
� Competences and
market intelligence
are actively shared
between segments
� Export of successful
business and
distribution models
� Joint use of carriers
� Integration benefits
from shared back-
office, IT and asset
management
functions
� Efficient use of
reinsurance /
centralised
procurement
Expansion of international business based on existing carriers
Talanx Service: Central back-office service provider
Transfer of bancassurance expertise
Selected examples
Leverage bancassurance
know-how for Poland/Hungary/Turkey/Russia
Talanx Retail International often provides license/ platforms to write industrial business
Centralised assessment of reinsurance requirements and purchase of external reinsurance in specialist function
Industrial Lines relationships have led to distribution of retail policies through work-site marketing and German auto dealerships
What is special about us? – B2B competence allows business integration across all divisions
3
11
2
3
4
2
3
4
Enhanced business activity and efficiency through close cooperation and best-practice approach across all segments
B2B2C business

15 Berenberg & Goldman Sachs German Corporate Conference, Munich, 23 September 2013
Market risk 3
Non-life risk 2
Further life risk
Operational riskOther risk
� Total market risk of 39%, of solvency capital requirements, which is comfortably below the 50% limit
� Risk capacity priority for insurance risk
� Non-life is the dominating insurance risk category, comprising premium and reserve risk, NatCat and counterparty default risk
� Equities ~1% of investments under own management
� GIIPS sovereign exposure 0.7% of total assets39%
39%
16%
5%1%
Talanx Group
What is special about us? – Sophisticated underwriter with low gearing to market risk
Market risk sensitivity (limited to less than 50% of solvency capital requirement) is deliberately low
1 Figures show approximate risk categorisation, in terms of solvency capital requirements, of the Talanx Group after minorities, after tax, post diversification effects asof 2012
2 Includes premium and reserve risk (non-life), net NatCat and counterparty default risk3 Refers to the combined effects from market developments on assets and liabilities
3
CommentsRisk components of Talanx Group1

16 Berenberg & Goldman Sachs German Corporate Conference, Munich, 23 September 2013
Talanx Group net income
+ Net profit – Net loss
+
+
+
+
+
+
+
+
+
+
+
+
+
+ –
+ +
+
+
+®
+
+
+
+
What is special about us? – Proven earnings resilience over cycle
Robust cycle resilience due to diversification of segments
1 Net income of Talanx after minorities, after tax based on restated figures as shown in annual reports;
2001–2003 according to US GAAP, 2004–2011 according to IFRS2 Adjusted on the basis of IAS 83 Top20 European peers, each year measured by GWPSource: FactSet / Annual reports of Talanx Group and Hannover Re Group
Ta
lan
x G
rou
p a
nd
pre
decesso
rs n
et in
co
me
1
Talanx Group net income1 (€m)
2
2
116
185
338
472
245
394
477
183
485
216
520
630
2001 2002 2003 2004 2005 2006 2007 2008 2009 2010 2011 2012
3
# o
f lo
ss
ma
kin
g
co
mp
etito
rs3
2 7 1 7 3 1 2 2

17 Berenberg & Goldman Sachs German Corporate Conference, Munich, 23 September 2013
Groupama
Ro
E
Standard Deviation
Low return - low varianceLow return – high variance
High return – high variance High return – low variance
CNPPrudential
Allianz
Aegon
Generali
Munich Re
Mapfre
AXA
Covea
Swiss Re2
Zurich
AvivaEureko
Fondiaria
24% 0%
0%
18%
R+V
12%
9%
What is special about us? – Attractive risk-return profile
Sustainable earnings development due to prudent risk management approach
Note: Calculation based on respective accounting standards used in respective years. Accounting standards may have changed over periods analysed� Median RoE and standard deviation of RoE 2001 – 2011 of selected European insurance groups; R+V 2001 – 2010, Groupama 2001 – 2010, Covea 2005 – 2010� Minority interests only given in 2010 and 2011, no adjustment for variable interest entitiesSource: Based on data of "Benchmarking of selected insurance companies” analysis by KPMG AG as of 27 April 2012
3
RoE standard deviation of selected European insurance companies

18 Berenberg & Goldman Sachs German Corporate Conference, Munich, 23 September 2013
How to move forward? – Overall Group strategy
Profit target
� RoE1>∅ TOP20 European insurers
� RoE1≥risk-free interest rate2
+750bps
Capital management
� Fulfill S&P “AA”capital requirement
� Efficient use of available financing instruments
Risk management
� Generate positive annual earnings with a probability of 90%
� Sufficient capital to withstand at least an aggregated 3,000-year shock
� Investment risk
≤50%
Growth target
� 50% of primary GWP from foreign operations
� Selective profitable growth in Retail Germany and Reinsurance
Human resource policy
� Continuous development and promotion of own workforce
� Individual responsibility and entrepreneurial spirit
Focus of the Group is on long-term increase in value by sustainable and profitable growth
and vigorous implementation of our B2B-expertise
Group and divisional strategies define goals and actions to be taken
1 In accordance with IFRS2 Risk-free rate is defined as the 5-year rolling average of the 10-year German government bond yield
4

19 Berenberg & Goldman Sachs German Corporate Conference, Munich, 23 September 2013
How to move forward? – Sources for growth
� Growth through globalisation
� Increase retentionIndustrial Lines
� Elimination of cost disadvantages
� Intelligent products and B2B focusRetail Germany
� Focus on emerging markets (LatAM / CEE)
� Consolidation and integration of acquisitionsRetail International
� Efficient cycle management
� Expansion into emerging marketsReinsurance
4
20 Berenberg & Goldman Sachs German Corporate Conference, Munich, 23 September 201320
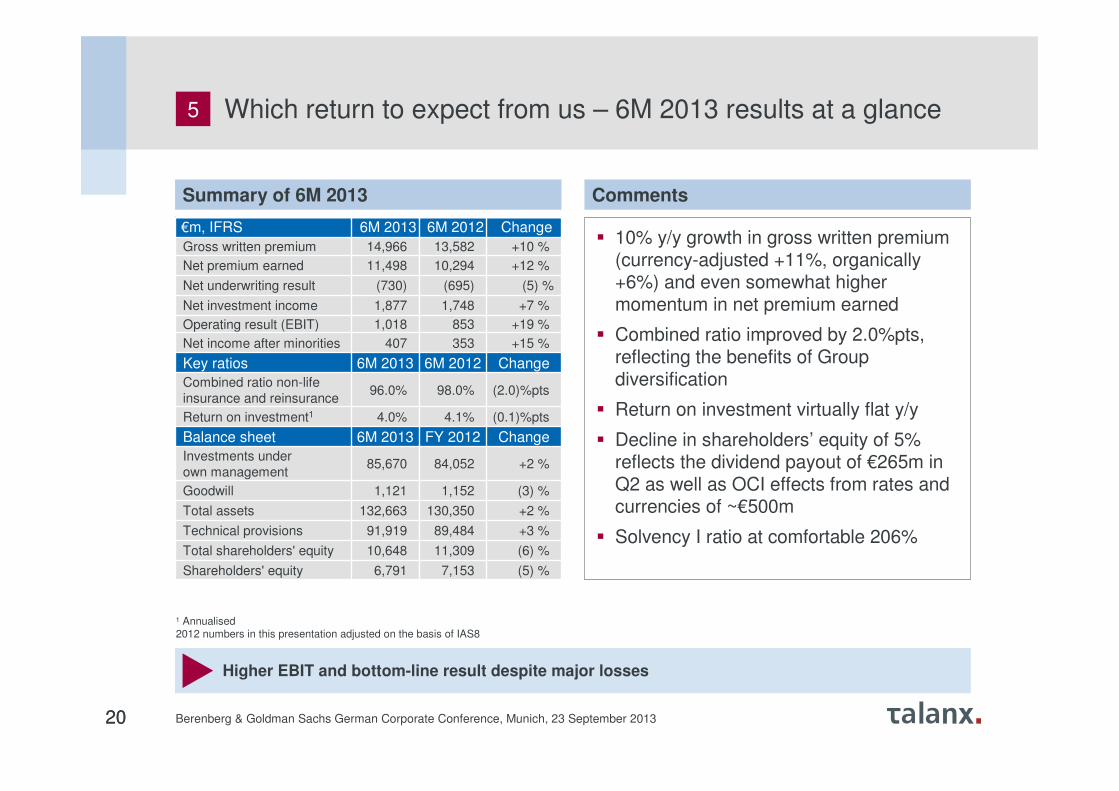
Summary of 6M 2013
Higher EBIT and bottom-line result despite major losses
€m, IFRS 6M 2013 6M 2012 Change
Gross written premium 14,966 13,582 +10 %
Net premium earned 11,498 10,294 +12 %
Net underwriting result (730) (695) (5) %
Net investment income 1,877 1,748 +7 %
Operating result (EBIT) 1,018 853 +19 %
Net income after minorities 407 353 +15 %
Key ratios 6M 2013 6M 2012 Change
Combined ratio non-life
insurance and reinsurance96.0% 98.0% (2.0)%pts
Return on investment1 4.0% 4.1% (0.1)%pts
Balance sheet 6M 2013 FY 2012 Change
Investments under
own management85,670 84,052 +2 %
Goodwill 1,121 1,152 (3) %
Total assets 132,663 130,350 +2 %
Technical provisions 91,919 89,484 +3 %
Total shareholders' equity 10,648 11,309 (6) %
Shareholders' equity 6,791 7,153 (5) %
Comments
� 10% y/y growth in gross written premium (currency-adjusted +11%, organically +6%) and even somewhat higher momentum in net premium earned
� Combined ratio improved by 2.0%pts, reflecting the benefits of Group diversification
� Return on investment virtually flat y/y
� Decline in shareholders’ equity of 5% reflects the dividend payout of €265m in Q2 as well as OCI effects from rates and currencies of ~€500m
� Solvency I ratio at comfortable 206%
1 Annualised2012 numbers in this presentation adjusted on the basis of IAS8
Which return to expect from us – 6M 2013 results at a glance5

21 Berenberg & Goldman Sachs German Corporate Conference, Munich, 23 September 2013
Targets are subject to no major losses exceeding budget (cat), no turbulences on capital markets (capital), and no material currency fluctuations (currency).
Gross Written Premium ≥ +4%
• Industrial Lines ~ +4-6%
• Retail Germany flat
• Retail International ~ +17-20%
• Non-Life Reinsurance ~ +3-5%
• Life and Health Reinsurance ~ +5-7%
Return on investment > 3.5%
Group net income ~ €700m
Return on equity ~ 10%
Dividend payout ratio 35-45% target range
Talanx Group
5 Which return to expect from us? – Outlook 2013
[Updated outlook as of 14/08/2013]
22 Berenberg & Goldman Sachs German Corporate Conference, Munich, 23 September 2013
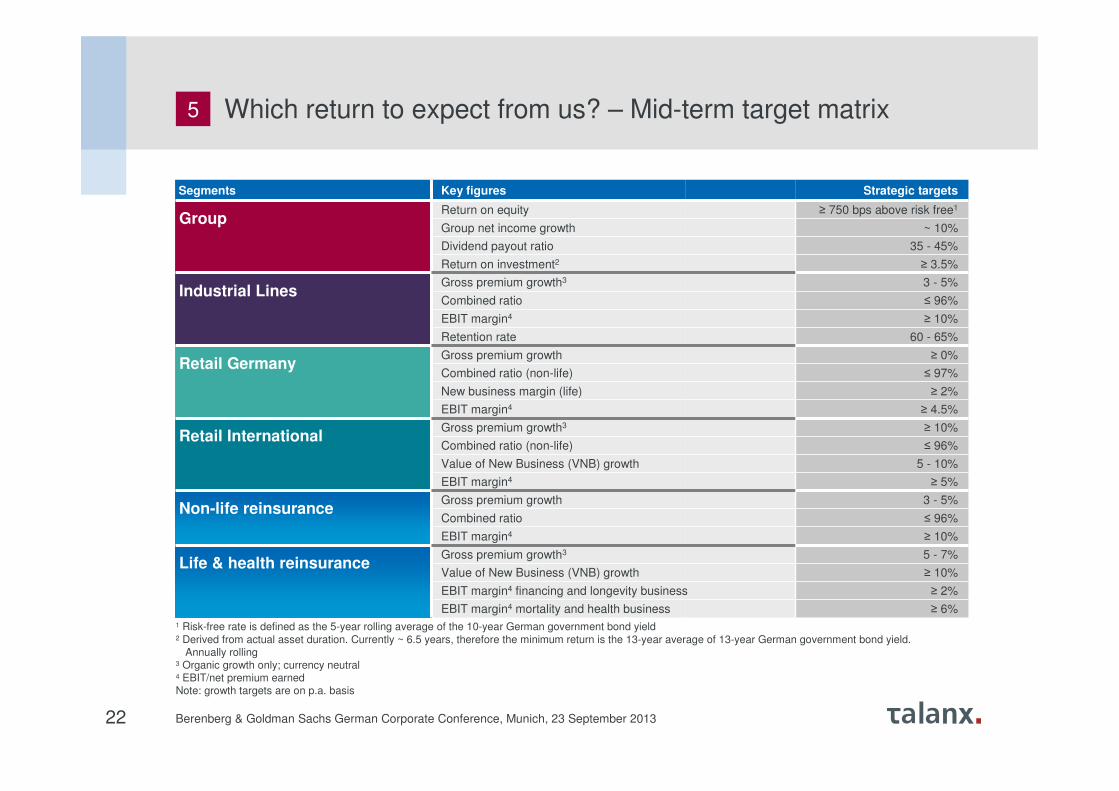
1 Risk-free rate is defined as the 5-year rolling average of the 10-year German government bond yield2 Derived from actual asset duration. Currently ~ 6.5 years, therefore the minimum return is the 13-year average of 13-year German government bond yield.
Annually rolling3 Organic growth only; currency neutral4 EBIT/net premium earnedNote: growth targets are on p.a. basis
Segments Key figures Strategic targets
GroupReturn on equity ≥ 750 bps above risk free1
Group net income growth ~ 10%
Dividend payout ratio 35 - 45%
Return on investment2 ≥ 3.5%
Industrial LinesGross premium growth3 3 - 5%
Combined ratio ≤ 96%
EBIT margin4 ≥ 10%
Retention rate 60 - 65%
Retail GermanyGross premium growth ≥ 0%
Combined ratio (non-life) ≤ 97%
New business margin (life) ≥ 2%
EBIT margin4 ≥ 4.5%
Retail InternationalGross premium growth3 ≥ 10%
Combined ratio (non-life) ≤ 96%
Value of New Business (VNB) growth 5 - 10%
EBIT margin4 ≥ 5%
Non-life reinsuranceGross premium growth 3 - 5%
Combined ratio ≤ 96%
EBIT margin4 ≥ 10%
Life & health reinsuranceGross premium growth3 5 - 7%
Value of New Business (VNB) growth ≥ 10%
EBIT margin4 financing and longevity business ≥ 2%
EBIT margin4 mortality and health business ≥ 6%
5 Which return to expect from us? – Mid-term target matrix

23 Berenberg & Goldman Sachs German Corporate Conference, Munich, 23 September 2013
� Strong solvency ratios
� State-of-the-art capital management
� TERM in final BaFin application process
SOUNDNESS
� B2B expertise as USP
� Strong integration of all divisions
� Focus on underwriting
EXCELLENCE
� Top-line growth from presence in growth markets
� Efficiency gains in Germany and cost synergies in Poland and Mexico
� Strategic increase of retention rate
PROFITABILITY
� Strategy for Industrial Lines, Retail International and Re
� Focus on growth regions
� Intelligent combination of organic and bolt-on
GROWTH
5 Talanx credentials in summary
24 Berenberg & Goldman Sachs German Corporate Conference, Munich, 23 September 2013
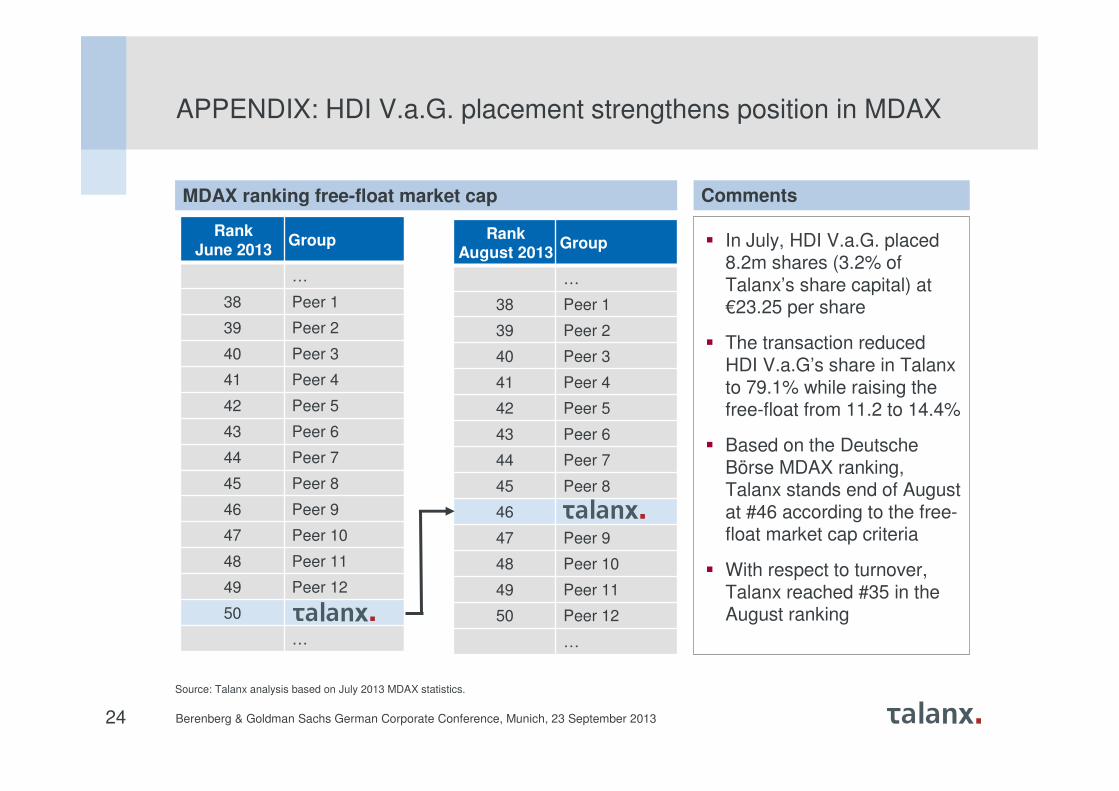
MDAX ranking free-float market cap
Rank June 2013
Group
…
38 Peer 1
39 Peer 2
40 Peer 3
41 Peer 4
42 Peer 5
43 Peer 6
44 Peer 7
45 Peer 8
46 Peer 9
47 Peer 10
48 Peer 11
49 Peer 12
50
…
Source: Talanx analysis based on July 2013 MDAX statistics.
APPENDIX: HDI V.a.G. placement strengthens position in MDAX
Rank August 2013
Group
…
38 Peer 1
39 Peer 2
40 Peer 3
41 Peer 4
42 Peer 5
43 Peer 6
44 Peer 7
45 Peer 8
46
47 Peer 9
48 Peer 10
49 Peer 11
50 Peer 12
…
Comments
� In July, HDI V.a.G. placed 8.2m shares (3.2% of Talanx’s share capital) at €23.25 per share
� The transaction reduced HDI V.a.G’s share in Talanx to 79.1% while raising the free-float from 11.2 to 14.4%
� Based on the Deutsche Börse MDAX ranking, Talanx stands end of August at #46 according to the free-float market cap criteria
� With respect to turnover, Talanx reached #35 in the August ranking

25 Berenberg & Goldman Sachs German Corporate Conference, Munich, 23 September 2013
‘German Mittelstand’
Private policy
holders
Large German corporates, e.g.
V.a.G.
79.1%
� HDI V.a.G. is a mutual insurance company and majority-owner of the holding company Talanx AG;
commitment to remain long-term majority shareholder post IPO
� Alignment of interests of HDI V.a.G. and Talanx
Group through
- Providing efficient and reliable insurance to
mutual members at market rates, often syndicate-based
- Same decision makers: Mr Haas, Dr Hinsch, Dr Querner
- HDI V.a.G. has no other investments besides
Talanx and is interested to further strengthen and enable Talanx to provide stable insurance
capacity to industrial clients
- Talanx and HDI V.a.G. committed to capital market oriented dividend policy
� No financial liabilities on mutual level
� Very limited business relations / intercompany
contracts between HDI V.a.G. and Talanx
Strong and reliable anchor shareholder with aligned interests
Relationship HDI V.a.G. – Talanx AGMembers of HDI V.a.G.
APPENDIX: HDI V.a.G. structure

26 Berenberg & Goldman Sachs German Corporate Conference, Munich, 23 September 2013
Selected acquisitions of Talanx since 2004
2002
neue leben
HSBC Seguros de Automoveis e Bens
S.A.
Genworth Seguros S.A.
Gerling-Konzern
PB Lebens-
versicherung AG, PB Versicherung
AG
HDI Sigorta A.S. (former IhlasSigorta A.S.)
HDI Seguros (former ISE Chile
Seguros)
PVI Holdings
Tryg Polska
L'Union de Paris
Cía de Seguros
Metropolitana
BHW Lebensvers. AG, BHW
Pensionskasse AG
HDI-Strakhuvannya
(former Alcona)
HDI Strakhovanie(previously Fortis
Insurance Company LLC)
Nassau Verzekeringen
Europa
Warta
2004 2005 2008 2009 20102006 2007 2011 2012
� M&A focus set on „Industrial
Lines“ and „RetailInternational“
� Key focus on Eastern European and Latin American markets withexisting footprint
� Main rationals: portfoliooptimization, increasingglobal efficiencies, expandinggroup competencies
� H1 2013 delivered positivecontribution in all targetmarkets proving M&Astrategy successful
Excellent track record in acquiring and integrating insurers in attractive growth markets
APPENDIX: How to move forward? – Profitable organic growth accelerated by focused acquisitions

27 Berenberg & Goldman Sachs German Corporate Conference, Munich, 23 September 2013
APPENDIX: Key financials by segments – 6M 2013
€m, IFRS 6M 2013 6M 2012 Change
P&L
Gross written premium 2,399 2,246 +7%
Net premium earned 895 782 +14%
Net underwriting result (11) 58 n.a.
Net investment income 108 113 (5%)
Operating result (EBIT) 78 157 (50%)
Net income after minorities 47 99 (53%)
Key ratios
Combined ratio non-life
insurance and reinsurance101.2% 92.6% 8.5%pts
Return on investment1 3.1% 3.4% (0.3)%pts
Industrial Lines
6M 2013 6M 2012 Change
3,623 3,516 +3%
2,663 2,610 +2%
(732) (711) n.a.
872 813 +7%
90 73 +23%
51 49 +4%
99.9% 108.6% (8.8)%pts
4.3% 4.3% 0.0%pts
6M 2013 6M 2012 Change
2,151 1,334 +61%
1,748 1,078 +62%
17 (21) n.a.
146 118 +24%
113 52 +117%
66 31 +114%
94.9% 99.0% (4.1)%pts
5.1% 6.1% (1.0)%pts
Retail Germany Retail International
1 Annualised
Note: Differences due to rounding may occur.
28 Berenberg & Goldman Sachs German Corporate Conference, Munich, 23 September 2013
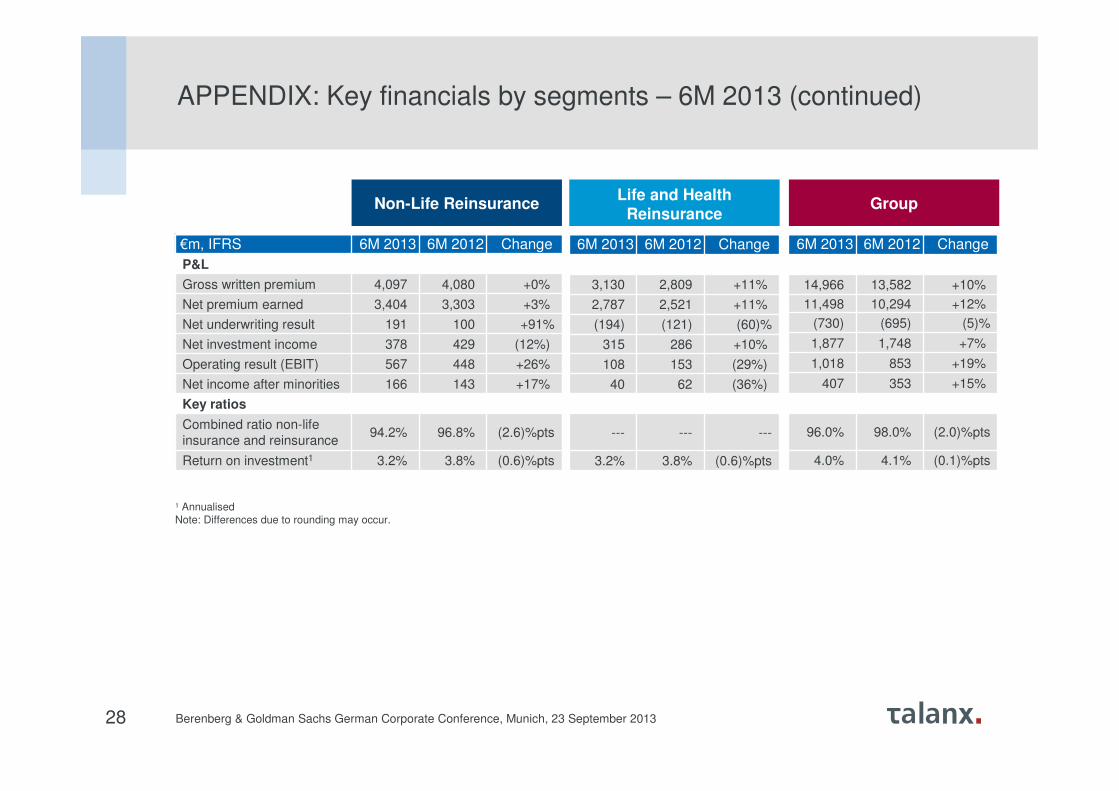
APPENDIX: Key financials by segments – 6M 2013 (continued)
€m, IFRS 6M 2013 6M 2012 Change
P&L
Gross written premium 4,097 4,080 +0%
Net premium earned 3,404 3,303 +3%
Net underwriting result 191 100 +91%
Net investment income 378 429 (12%)
Operating result (EBIT) 567 448 +26%
Net income after minorities 166 143 +17%
Key ratios
Combined ratio non-life
insurance and reinsurance94.2% 96.8% (2.6)%pts
Return on investment1 3.2% 3.8% (0.6)%pts
1 Annualised
Note: Differences due to rounding may occur.
6M 2013 6M 2012 Change
3,130 2,809 +11%
2,787 2,521 +11%
(194) (121) (60)%
315 286 +10%
108 153 (29%)
40 62 (36%)
--- --- ---
3.2% 3.8% (0.6)%pts
6M 2013 6M 2012 Change
14,966 13,582 +10%
11,498 10,294 +12%
(730) (695) (5)%
1,877 1,748 +7%
1,018 853 +19%
407 353 +15%
96.0% 98.0% (2.0)%pts
4.0% 4.1% (0.1)%pts
Non-Life ReinsuranceLife and Health
ReinsuranceGroup

29 Berenberg & Goldman Sachs German Corporate Conference, Munich, 23 September 2013
APPENDIX: 6M 2013 results – GWP of main risk carriers
Retail Germany Retail International
1 Entity results from Sept 2012 merger of HDI Direkt Versicherung AG and HDI-Gerling Firmen und Privat Versicherung AG
2 Talanx ownership 67.5%
3 includes HDI Asekuracja TU S.A., Poland; Talanx ownership of 75.74%
4 Talanx ownership 50% + 1 share; closed on 1 June 2012
5 includes Metropolitana
Numbers for main carriers represent data entry values
GWP, €m, IFRS 6M 2013 6M 2012 Change
Non-life Insurance 1,038 1,045 (1%)
HDI Versicherungs AG1 965 977 (1%)
Life Insurance 2,585 2,471 +5%
HDI Lebensversicherung AG 1,101 1,116 (1%)
neue leben Lebensversicherung AG2 525 499 +5%
TARGO Lebensversicherung AG 476 429 +11%
PB Lebensversicherung AG 384 354 +9%
Total 3,623 3,516 +3%
GWP, €m, IFRS 6M 2013 6M 2012 Change
Non-life Insurance 1,439 966 +49%
HDI Seguros S.A., Brazil 421 390 +8%
TUiR Warta S.A.3, Poland 444 127 n.a.
TU Europa S.A.4, Poland 76 10 n.a.
HDI Assicurazioni S. p. A., Italy (P&C) 172 162 +6%
HDI Seguros S.A. De C.V., Mexico5 87 67 +30%
HDI Sigorta A.Ş., Turkey 97 79 +22%
Life Insurance 712 368 +93%
TU Warta Zycie S.A., Poland 67 - n.a.
TU Europa4, Poland 194 7 n.a.
Open Life4 9 1 n.a.
HDI-Gerling Zycie, Poland 84 44 +91%
HDI Assicurazioni S. p. A., Italy (Life) 153 111 +37%
Total 2,151 1,334 +61%

30 Berenberg & Goldman Sachs German Corporate Conference, Munich, 23 September 2013
Talanx Investor Relations
Financial Calendar
14 November 2013Interim Report Q3 2013
24 March 2014Annual Report 2013
08 May 2014Annual General Meeting
15 May 2014Interim Report Q1 2014
Contact
Talanx AGRiethorst 230659 [email protected]
Dr. Wolfram SchmittPhone: +49 511 3747 [email protected]
Carsten Werle, CFAPhone: +49 511 3747 [email protected]
Marcus Sander, CFAPhone: +49 511 3747 [email protected]

31 Berenberg & Goldman Sachs German Corporate Conference, Munich, 23 September 2013
Disclaimer
This presentation contains forward-looking statements which are based on certain assumptions, expectations and opinions of the
management of Talanx AG (the "Company") or cited from third-party sources. These statements are, therefore, subject to certain known
or unknown risks and uncertainties. A variety of factors, many of which are beyond the Company’s control, affect the Company’s
business activities, business strategy, results, performance and achievements. Should one or more of these factors or risks or
uncertainties materialize, actual results, performance or achievements of the Company may vary materially from those expressed or
implied as being expected, anticipated, intended, planned, believed, sought, estimated or projected.in the relevant forward-looking
statement.
The Company does not guarantee that the assumptions underlying such forward-looking statements are free from errors nor does the
Company accept any responsibility for the the actual occurrence of the forecasted developments. The Company neither intends, nor
assumes any obligation, to update or revise these forward-looking statements in light of developments which differ from those
anticipated.
Where any information and statistics are quoted from any external source, such information or statistics should not be interpreted as
having been adopted or endorsed by the Company as being accurate.Presentations of the company usually contain supplemental
financial measures (e.g., return on investment, return on equity, gross/net combined ratios, solvency ratios) which the Company
believes to be useful performance measures but which are not recognised as measures under International Financial Reporting
Standards, as adopted by the European Union ("IFRS"). Therefore, such measures should be viewed as supplemental to, but not as
substitute for, balance sheet, statement of income or cash flow statement data determined in accordance with IFRS. Since not all
companies define such measures in the same way, the respective measures may not be comparable to similarly-titled measures used
by other companies. This presentation is dated as of 23 September 2013. Neither the delivery of this presentation nor any further
discussions of the Company with any of the recipients shall, under any circumstances, create any implication that there has been no
change in the affairs of the Company since such date. This material is being delivered in conjunction with an oral presentation by the
Company and should not be taken out of context.