
Benefits of Sponsoring a Football Club: An Event Study
44
STOCKHOLM SCHOOL OF ECONOMICS Department of Economics 5350 Master’s thesis in economics Spring 2014 Benefits of Sponsoring a Football Club: An Event Study Jonas Bukenas (40429) Abstract Motivated by an increasing interest in sports industry, this paper examined the relationship between a football club’s performance in the UEFA Champions League and its jersey sponsor’s stock price. The paper aims to quantify the benefits of football sponsorships, expand current academic knowledge about sport sponsorships and provide insights why companies are investing increasing amounts of money into football clubs. A total of 9 teams and 12 sponsoring companies were used in this analysis which covered 12 seasons, starting from 2001/02. Using the event study methodology it was found that despite the outcome, positive abnormal returns can be observed after every game. Additionally, size of a company and stock exchange where the company is listed seem to be important factors affecting abnormal returns. There is some evidence that pre-game probability of a team winning or losing a game decreases abnormal returns however these results lack statistical significance. Keywords: Football, Sponsorships, Event study, Champions League JEL: G14, L83 Supervisor: Erik Meyersson Date submitted: May 14, 2014 Date examined: May 26, 2014 Discussant: Michael Lemdal Examiner: Anders Olofsgård
Transcript of Benefits of Sponsoring a Football Club: An Event Study
STOCKHOLM SCHOOL OF ECONOMICS Department of Economics 5350 Master’s thesis in economics Spring 2014
Benefits of Sponsoring a Football Club: An Event Study
Jonas Bukenas (40429)
Abstract
Motivated by an increasing interest in sports industry, this paper examined the relationship between a
football club’s performance in the UEFA Champions League and its jersey sponsor’s stock price. The
paper aims to quantify the benefits of football sponsorships, expand current academic knowledge about
sport sponsorships and provide insights why companies are investing increasing amounts of money into
football clubs. A total of 9 teams and 12 sponsoring companies were used in this analysis which covered
12 seasons, starting from 2001/02. Using the event study methodology it was found that despite the
outcome, positive abnormal returns can be observed after every game. Additionally, size of a company
and stock exchange where the company is listed seem to be important factors affecting abnormal
returns. There is some evidence that pre-game probability of a team winning or losing a game decreases
abnormal returns however these results lack statistical significance.
Keywords: Football, Sponsorships, Event study, Champions League JEL: G14, L83 Supervisor: Erik Meyersson Date submitted: May 14, 2014 Date examined: May 26, 2014 Discussant: Michael Lemdal Examiner: Anders Olofsgård

Acknowledgements
I would like to thank my supervisor Erik Meyersson for his constructive comments and valuable insights
that enabled me to finish this project.

Table of contents
1. Introduction .......................................................................................................................................... 1
1.1 Relevance and purpose ................................................................................................................. 2
2. Literature review ................................................................................................................................... 5
3. Data ....................................................................................................................................................... 9
3.1 UEFA Champions League .............................................................................................................. 9
3.2 Teams and sponsors.................................................................................................................... 10
3.3 Data collection and probabilities of winning .............................................................................. 12
4. Method ............................................................................................................................................... 13
4.1 Event study.................................................................................................................................. 13
4.2 Extensions ................................................................................................................................... 15
4.3 Possible issues ............................................................................................................................. 17
5. Results ................................................................................................................................................. 19
5.1 Base case results ......................................................................................................................... 19
5.2 Split sample results ..................................................................................................................... 20
5.3 Extensions ................................................................................................................................... 21
5.4 Fixed effects regression results ................................................................................................... 22
6. Discussion ............................................................................................................................................ 24
7. Conclusion ........................................................................................................................................... 26
8. Refferences ......................................................................................................................................... 28
Appendix ..................................................................................................................................................... 32
1
1. Introduction
Sports in general and football in particular have become extremely commercialized in recent years. A
number of clubs are now publicly traded in stock exchanges, the income from TV rights has grown
significantly (for example Manchester United received £104 million broadcasting revenue during 2012),
the best players receive salaries equal to or even greater than those of the top CEOs and football clubs
are worth billions (according to Ozanian (2013) the value of Real Madrid is $3.3 billion, Manchester
United – $3.165 billion, FC Barcelona - $2.6 billion).
None of this could have happened without increased interest from firms, willing to sponsor clubs,
national teams or events like the Olympic Games or the Champions League. Often rival companies
compete for the right to be the main sponsor of a team or an event and this significantly increases the
value of a sponsorship. For example sports merchandise producer Nike offered $778 million to replace
its competitor Adidas as the kit supplier of the German national football team in 2007 (SportsBusiness
Daily, 2007), Gatorade paid around $500 million to the National Football League for the right to be “the
official sports beverage of the NFL” for 8 years (Clark et al, 2005) and Manchester United are currently in
talks with companies to secure a £65 million kit supplier sponsorship deal, which would be more than
twice the size of the current most profitable football kit supplier deal signed by Real Madrid, worth £31
million (Ogden, 2014).
This paper aims to quantify the benefits of football sponsorships and provide insights why may a
company want to invest in sponsorship campaigns. Furthermore, the current state of academic
knowledge about sport sponsorships is expanded by looking into (i) private football club (instead of
national team) kit sponsorship agreements and (ii) by looking if the outcome of the game is important to
sponsoring companies.
The main research question of this master thesis is thus: Does winning, losing or drawing a football
game in the UEFA Champions League affect the jersey sponsor’s stock price? Additionally:
a) Are the effects different for different stages of the competition?
b) Are the effects different when the result is expected/unexpected?

2
It may be of interest to analyze metrics other than stock price, such as sales or revenues, however this
study tries to determine if there is an immediate effect to the company after every game and certain
daily data may not be available or it may take more time for the results to reflect on e.g. number of
sales. Additionally, multiple equity valuation models rely upon assumption that stock price reflects
present value of future cash flows (see e.g. Bodie et al., 2005) and thus investors should consider future
sales, revenue and similar figures when pricing a stock.
As results indicate that sponsoring companies can expect increase in stock price after every game in the
Champions League this research may be of interest to companies (marketing departments in particular)
choosing between different advertising options or trying to price a sponsorship agreement and scholars
in the fields of marketing, finance and economics analyzing sports industry.
1.1 Relevance and purpose In football there are mainly two types of sponsorships: Kit supplier deals and Kit sponsorships (Pudasaini,
2014). When a team signs a kit supplier deal, it is paid by a sporting clothes manufacturer like Adidas,
Nike or Puma for the right to supply them with their original kits and sell them worldwide. Kit
sponsorship allows a company to place its logo on a team’s official kits in all or certain competitions.
Tables 1 and 5 summarize the most expensive kit supplier and kit sponsorship deals in football.
Table 1. Kit sponsorship deals in football
Club Company Annual
Manchester United Chevrolet £53 million Barcelona Qatar Airways £30 million
Arsenal Fly Emirates £30 million Bayern Munich Deutsche Telekom £25 million
Real Madrid Fly Emirates £24 million Liverpool Standard Chartered £20 million
Source: Arshad (2014)
A number of papers tried to investigate what payoff companies get from sponsoring a team, a league or
signing an endorsement deal with a celebrity and the risks associated with it. In the field of marketing,
Clark et al. (2005) mentions that the forms of marketing communications have changed significantly and
currently an increasing number of companies are looking into “non-traditional” forms of advertising,
including sponsoring a team. It is very intuitive that sponsoring a team or an event is a way of making
company’s brand more visible and thus increasing consumer awareness. However it can sometimes be
associated with bad publicity and have an opposite effect on sponsoring company, as found by Agrawal
3
and Kamakura (1995). Tiger Woods, a famous golfer, can be used as an example in this situation as well.
A report by market research firm YouGov found that after the player was involved in the sex scandal in
2009, the reputation of companies (Nike, Gatorade, Gillette) having endorsement deals with the golfer
dropped sharply and in the case of Gatorade showed significant recovery after the endorsement deal
was dropped (Brandweek Staff, 2009). In case of football, the outcome of the game can be associated
with good and bad publicity as well – it may be possible that investors view wins as good and losses as
bad publicity.
Several studies (Stadtmann, 2006, Renneboog and Vanbrabant, 2000) examined how performance of a
publicly listed football club affects its stock price and concluded that wins have a positive while losses
have a negative impact. These results are very intuitive, since an outcome of a game is the main
indicator of how well a team is doing (unlike profitability, market share and similar metrics for
corporations). One of the papers which try to explain irrational investor behavior was written by
Edmans, Garcia and Norli (2007). The authors used football game outcomes as a proxy of investor mood
and came to a conclusion that losses have a negative effect on the stock index of a competing nation.
Hanke and Kirchler (2010) researched how national football team’s performance affects the team’s
official kit supplier’s (Puma, Adidas, Nike) stock prices. Similarly to Hanke and Kirchler (2010) this paper
will examine the link between football team’s performance and the stock price of a sponsoring
company. However, this research will concentrate on analyzing private football teams and their kit
sponsors, instead of national teams and kit suppliers. The main motivation for concentrating on the kit
sponsors and not on kit suppliers is possibility to better measure the effectiveness of sponsorship as a
marketing campaign, the fact that economic incentives of such sponsorships are not that obvious and
lack of previous research in this field.
Kit suppliers gain money from every official jersey that is sold worldwide and it is intuitive that a team’s
performance affects these sales, thus affecting manufacturer’s profit. According to Miller (2012),
Manchester United and Real Madrid sold about 1.4 million shirts annually from 2007 until 2012
(additional shirt sales statistics are provided in table 6) and all of these shirts were produced by either
Nike or Adidas. Furthermore, the biggest companies (Nike, Adidas, Puma, Warrior and Umbro) supply
kits to teams and individuals worldwide, including different sports, so it might be very difficult to isolate
the effects of such sponsorship related to a particular team.
While kit suppliers directly increase their sales from their agreements, the economic benefits of
sponsoring a football team for an insurance (e.g. Aon, AIG) or automotive (e.g. FIAT, Pirelli) companies

4
are not that clear – these companies can expect to increase their brand awareness (e.g. via television
time or official team’s jerseys sold to fans, as they have company’s logo) but they do not earn money
from ticket, jersey or accessories sales. Nonetheless, as can be seen in table 1, these companies
continue to invest increasing amounts of money to sport sponsorships. As briefly mentioned before,
several marketing papers found that announcement of sponsorship agreement increases stock price of
the company, however these papers do not analyze if there are any effects afterwards. Although it is
possible to estimate how much publicity a team will generate in the following seasons, the contracts are
often signed for 4 or more years and multiple factors can affect success of the marketing campaign
during that period of time – performance of a club may be one of such factors.
The rest of the paper is organized as follows. A brief literature review is provided in chapter 2. Chapters
3 and 4 contain description of data and methods used in this paper. Chapter 5 provides interpretation of
results, chapter 6 discusses possible limitations of this research and conclusion can be found in chapter
7.
5
2. Literature review
This study builds upon a large number of researches, mainly in the fields of marketing and finance,
which analyze sports industry and try to connect it to stock price changes of sponsoring companies,
sports clubs or even stock indices of certain countries. In this section a brief literature review will be
provided in order to familiarize the reader with a current state of knowledge and draw the link between
sports industry and financial markets.
Following a number of initial public offerings of football clubs in the 1990s when at one point 27 teams
were listed in different stock exchanges (The Economist, 2012) several studies have analyzed how
performance of a publicly listed football club affects its stock price. One of the first ones were
Renneboog and Vanbrabant (2000), who used the sample of 17 football clubs listed on the London Stock
Exchange and Alternative Investment Market to see whether the stock price of a club is affected by
clubs performance. Using the event study methodology, the authors found that at the first trading day
after a victory, positive abnormal returns of 1% can be expected, while draws and defeats generate
negative abnormal returns of 0.6% and 1.4% respectively. The authors also found that the impact of the
match outcome extends throughout the week – losses and draws result in cumulative abnormal losses
of 2.5% and 1.7%. These results are consistent across the English and Scottish leagues, national Cup and
European competitions. Furthermore, promotion and relegation games were found to generate higher
abnormal returns.
Another similar study was done by Peenstra and Scholtens (2007). Authors based their study on the
semi-strong market efficiency hypothesis as formulated by Fama (1970). Semi-strong efficiency implies
that stock prices adjust to all publicly available information, not only on historical stock prices (weak
efficiency). Peenstra and Scholtens (2007) argue that in the case of a publicly listed football club, the
outcome of a match may be interpreted as new information by investors and would reflect in the pricing
of club’s stocks. In the study 8 teams from 5 different countries over the period of 4 years, starting
August 1, 2000 were analyzed. The results are similar to those of Renneboog and Vanbrabant (2000) –
market reacts positively to victories and negatively to defeats. The effect of a defeat on football clubs’
stock price is stronger than the effect of a victory and the effect of an international game is stronger
than that of a domestic one. Additionally, the authors tried to account for the effect of
expected/unexpected results by using betting quotes, obtained from betting companies. They found
6
that unexpected outcomes in European competitions cause stronger market reaction than expected
ones.
Stadtmann (2006) applied the news model in order to analyze how Borussia Dortmund football club’s
performance affected its stock price and used betting quotes as a variable, indicating
expected/unexpected results. The results of the study show that there is a link between the club’s
success and its stock price however the author found no statistically significant difference between
international and national games. The conclusions of these studies are intuitive and straightforward –
the stock price of a club depends on clubs performance. This may be due to several reasons – better
performance helps to attract more spectators, boosts sales of merchandise and helps to attract new
sponsors. All this reflects in the club’s balance sheet and is evaluated by the investors, thus supporting
the market semi-strong efficiency.
Motivated by psychological evidence of a link between sports results and mood, Edmans, Garcia and
Norli (2007) examined the relationship between national team’s performance in international
tournaments (World Cup, European Championship, etc.) and the local stock market. The main goal of
the paper was to investigate stock market reaction to sudden changes in investor mood where
international football results were used as the main mood variable. The results from international
tournaments from 1973 to 2004 were used in this research. Although not only football, but basketball,
rugby, cricket and ice hockey were analyzed, the authors found that football has the most significant
effect on the stock market. The paper concluded that there is a strong negative stock market reaction to
losses (however no reaction to wins) of a national football team which in monthly terms account to
excess returns of about -7%. According to the authors, these results indicate that stock markets are
affected by inter mood swings and that football games are an important determinant of mood. The
findings of this study also imply that investors are not rational.
Another related strand of research is the sponsorship event study literature in the field of marketing. A
number of studies have been done in order to measure the effects of sponsorship deals. Agrawal and
Kamakura (1995) tried to evaluate the impact of celebrity endorsement contracts on the expected
profitability of a company, as reflected in the abnormal returns. The study showed that on the day of
the announcement of the celebrity endorsement contract, sponsoring companies recorded (on average)
excess returns of 0.44% on their market value. However in several cases a negative effect was observed.
Authors explain this as a result of a negative publicity generated by some celebrities. Agrawal and
7
Kamakura (1995) conclude that investors react to sponsorship announcements and that market believes
that expected gain from sponsorship deals outweighs its costs and possible negative effects.
The impact of NASCAR sponsorship announcements on sponsoring company’s stocks were analyzed in
Clarke, Cornwell and Pruitt (2004). It was found that sponsorship announcements significantly increase
the shareholder wealth – an average NASCAR sponsor experienced an increase in shareholder wealth of
over $300 million, net of all of the costs associated with the sponsorships. Interestingly, a multiple
regression analysis showed that companies which were related to automotive industry or signed with
the best NASCAR teams were associated with higher increases in stock prices and that sponsorships
undertaken in the name of an entire corporation were received more favorably by investors than those
sponsorships which included single products or divisions.
Clarke, Cornwell and Pruitt (2005) did a similar analysis with a focus on official sponsorship
announcements (a total of 53) of five best known sport leagues in the United States – the National
Football League, Major League Baseball, the National Hockey League, the National Basketball
Association and the Professional Golfers Association. The results of the study showed that increase in
share values around the announcement date ranged from $123 million to $558 million. Additionally, the
results showed that products/companies which had lower market share prior to the announcements
gained more from sponsorship agreements. This implies that it is more beneficial to promote less visible
brands by sponsoring a league. Finally, sponsorships which were reasonably linked to the sponsored
event were found to be more effective than unrelated ones.
Inspired by the above mentioned researches Hanke and Kirchler (2010) studied effects of national
teams’ performance during international football tournaments (World Cup, European Championship) on
official kit suppliers’ (Adidas, Nike and Puma) stock returns. Authors found that outcomes of football
games have an effect on the stock price of its jersey sponsor. The analysis showed that (similarly to
previous research by Edmans et al., 2007) wins lead to positive excess returns, while losses lead to
negative excess returns of a sponsoring company. Furthermore, the knockout games had a stronger
effect, relating to the higher importance of such games relative to group stage.
It is evident that the impact of sports industry is very broad – it ranges from individual team (Renneboog
and Vanbrabant, 2000) to the stock index of a country (Edmans et al., 2007). Furthermore, there is an
increasing interest in analyzing the effects of sponsorships as it has become a major part of advertising
industry. However there seems to be a lack of academic literature analyzing how sporting performance
8
affects the value of a sponsoring company – marketing researches usually are limited to sponsorship
announcements and do not consider additional information which can affect the deal and finance
related papers rarely consider the effects of marketing. The fact that stock prices of sponsoring
companies increase following a sponsorship announcements may suggest that investors take into
account publicity generated by future exposure, including football games. However, as shown by
Edmans et al. (2007), football game outcomes may have an effect on investor mood and thus affect
investor decisions regarding companies associated with a particular club. What is even more important,
every game can influence consumer behavior, as fans may associate consumption of a certain product
with team’s performance (as mentioned by Clark et al. (2004) in case of NASCAR) and thus have an
impact on sponsoring company’s sales or revenue figures. This gives a reason to believe, that every
football game has an impact on sponsoring companies. As a result, one of the aims of this master thesis
is to extend current state of knowledge and provide additional insights about football (and sports in
general) sponsorships by analyzing the effects of football club’s performance in the Champions League
on its jersey sponsors stock price. Stock prices instead of other metrics (sales, revenues, etc.) are
analyzed due to the information availability and the fact that multiple asset pricing models rely on the
assumption that stock price reflects present value of future cash flows (see e.g. Bodie et al., 2005) and
thus investors should consider future sales, revenue and similar figures when pricing a stock.

9
3. Data
For this study the games in the UEFA Champions League only will be analyzed. This is done because of
several reasons. Firstly, some of previous researches (e.g. Peenstra and Scholtens, 2007) found that
international competitions have a stronger effect than national ones. Secondly, it is a prestigious
tournament and thus attracts a greater audience and more interest from sponsors. Thirdly, the number
of games is rather small in comparison to national leagues (e.g. 38 games are played in the English,
Spanish or Italian leagues and only 13 games in the Champions League if the club advances to the final)
and thus the importance of a single game is higher. Finally, it is harder for the investors to estimate in
advance how much publicity a team will generate in the Champions League (in comparison to national
competitions), as the team (i) needs to qualify to the tournament and (ii) the outcome of a single game
can prevent the team from advancing further in the competition.
3.1 UEFA Champions League
The UEFA Champions League is an annual football club competition organized since 1992 (European
Champion Clubs’ Cup before 1992). Since 2003/04 season it comprises of three qualifying rounds, a
group stage, a knockout phase and the final. In the previous seasons it comprised of three qualifying
rounds, first and second group stages, a knockout stage and the final. This research will concentrate on
matches starting with the group stage. The main reason is that most of the clubs analyzed in this
research qualified to the group stage through national tournaments and rarely had to play in qualifying
rounds.
32 clubs participate in the group stage and are divided into 8 groups. Each team plays 2 matches (home
and away) with every other team in the group, totaling to 6 matches for each team in the group stage
and the best 2 teams of each group advance to the next round. In the group stage 3 points are awarded
for a win, 1 point for a draw and 0 for a loss. In the seasons prior to 2003/04, the 16 teams were divided
into 4 groups of 4 teams and played 1 home and 1 away game with each other team in the group, as in
the first group stage and the best 2 teams in each group advanced to the knockout phase.
Currently, there is no second group stage and the top 16 clubs advance to the knockout stage. In this
stage clubs play two matches against each other on a home-and-away basis. The club which scores the
greater aggregate of goals qualifies for the next round, with away goals (i.e. the team which scores more
away goals advances to the next round) and then penalties used to determine the winner in the event of

10
a draw. In the last 16, group winners play runners-up other than teams from their own pool or nation,
while from the quarter-finals on the draw is free.
The final is decided by a single match. In the event of a draw two additional periods of 15 minutes are
played. If after the extra time the result is still tied, the teams shoot penalties to determine a winner.1
Note that drawing or even losing a game does not prevent a team from advancing to the final.
3.2 Teams and sponsors
As mentioned in the previous section, 32 clubs participate in the group stage. 10 of these clubs are the
winners of the qualifying rounds while the rest 22 qualify through national competitions. The places
awarded for national competitions vary according to UEFA rankings, but currently England, Germany,
and Spain hold 3 spots, Italy, Portugal, and France - 2 spots, and Russia, Netherlands, Ukraine, Belgium,
Turkey, Greece, Switzerland, Austria, and the Czech Republic hold 1 spot in the group stage.
Although teams participating in the tournament change every season, there are several clubs which play
in the Champions League consistently. In this study I will concentrate on these teams as they are more
likely to have a bigger fan base, attract more interest from sponsors, investors and spectators and thus
make a bigger impact on stock markets. As discussed in the introduction, there are mainly two types of
sponsorships in football: kit supplier’s and kit sponsorships. This paper will concentrate on the latter.
Due to data availability 12 most recent seasons in the Champions League will be analyzed, starting with
2001/02 and ending with 2012/13 season. The initial teams are: Manchester United F.C. (12 seasons),
Chelsea F.C. (10 seasons), Liverpool F.C. (8 seasons), Arsenal F.C. (12 seasons), FC Bayern Munich (11
seasons), FC Barcelona (11 seasons), Real Madrid CF (12 seasons), Juventus F.C. (9 seasons), A.C. Milan
(10 seasons), AS Roma (7 seasons), FC Internazionale Milano (10 seasons), F.C. Porto (10 seasons) and
AFC Ajax (10 seasons). In order to conduct this analysis, the club must have the main jersey sponsor and
the sponsoring company must be publicly listed and be a part of a market index (FTSE 100, S&P 500,
etc.). For example FC Barcelona had an agreement with UNICEF which is a non-profit organization and
thus cannot be included in the final sample, AC Milan had a sponsorship agreement with Opel until
2006, which is part of General Motors group, however General Motors was not publicly listed until 2010
thus the stock data crucial for this analysis is not available for this team. After applying the selection
criteria for the above listed teams, the final dataset is left with 9 teams and 12 different sponsoring
1 Official rules of the UEFA Champions League

11
companies. The table 2 lists the final sample of clubs selected for the analysis and some information
about sponsors.
Table 2. Teams and sponsoring companies included in the analysis
Team Sponsoring company Stock index Seasons
AFC Ajax Aegon AEX 2010-2013 (3)
Arsenal FC O22 FTSE100 2002-2006 (4)
FC Bayern Munich Deutsche Telekom DAX 2002-2007 (5) 2008-2013 (5)
Chelsea FC Samsung KOSPI 2005-2013 (8)
FC Internazionale Milano
Pirelli & C. SpA FTSE MIB 2002-2012 (10)
Juventus FC New Holland Jeep3
FTSE MIB 2008-2010 (2) 2012/2013 (1)
Liverpool FC The Carlsberg Group OMXC20 2001-2003 (2) 2004-2010 (6)
Manchester United FC
Vodafone Group plc. FTSE100 2001-2006 (5)
AIG, Inc. S&P 500 2006-2010 (4)
Aon plc. S&P 500 2010-2013 (3)
Real Madrid CF Siemens Mobile4 DAX 2001-2006 (5)
Bwin Party Digital Entertainment FTSE 100 2007-2013 (6)
Source: UEFA, Official club webpages and Yahoo! Finance database
Additional descriptive statistics of the final sample are provided in the table 7. The total sample consists
of 678 games (events) of which more than a half resulted in victories. The number of draws and losses in
the sample is almost identical. Such a large difference between wins and other outcomes in the games
can be explained by the fact that all of the teams in the sample are considered to be elite clubs and
usually have no trouble advancing to subsequent stages in the Champions League.
2 O2 was part of BT group until it was sold to Telefonica in 2005. In this analysis stock price movements of BT group
are analyzed. 3 Both New Holland and Jeep are part of FIAT group. Stock prices of FIAT are analyzed.
4 Siemens mobile was a division of Siemens AG, until it was sold to BenQ in 2005. Siemens AG remained the
sponsor of Real Madrid during the 2005/06 season. In the 2006/07 season the sponsoring company was BenQ-Siemens and is not included in the analysis.

12
3.3 Data collection and probabilities of winning
The stock market data (both stock prices and market capitalization) is collected from finance.yahoo.com
database. The closing prices of both sponsoring companies and market indexes are used and they are
adjusted for dividends and splits (provided by the database). The historical information about the results
of the football games (dates and results) is taken from espnfc.com webpage. Betting quotes will be used
in this study to extract the probabilities of winning, losing or drawing a game. www.betexplorer.com
provides such information. The betting quotes should account for factors such as home ground
advantage, injuries, new player signings, etc. and thus be a good proxy for determining the expectations
about match outcomes.
The odds in the database are provided by the European format. For example for the match between
Manchester United and Bayern Leverkusen on 17th of September, 2013 the given odds were 1.82 for
Manchester winning a game, 3.52 for a draw and 4.56 for Manchester losing a game. If one was to bet 1
dollar on a win, one would get 1.82 dollars if Manchester won. The betting odds can be easily converted
into probabilities:
,
,
According to these odds, the bookmakers expected Manchester United to win that game. Note that
summing up these probabilities yields a probability higher than 1 (in this case
0.549+0.284+0.219=1.052). The difference is the markup of the betting company and needs to be
controlled for. Since the markup is 5.2%, the probability of a certain outcome can be recalculated in a
following way:
,
and
The newly calculated probabilities now add up to 1. It is important to adjust all of the historical
probabilities in a following way because the historical data is collected from different companies which
have different markups, thus making comparison harder.

13
4. Method
4.1 Event study
Event study methodology will be used in this paper. This methodology has been developed in order to
measure the effect of an economic event on the value of a firm and has been widely used in the fields of
accounting, finance and marketing. As discussed in Campbell et al (1997), the event studies are
attractive because the effect of an event will be reflected immediately on the asset prices, given the
rationality in the market place. As a result, the economic impact can be measured using stock prices
over a relatively short period of time in contrast to direct measures, which may require several months
or even years of observation. Furthermore, event studies have been used in most of the researches
discussed in section 2, including football based papers, which makes it an attractive choice in this master
thesis.
In this case the event is a football game in the Champions League, which can result in a win, a loss or a
draw. Define the event day t = 0. The effect of the event on the stock price of a sponsoring company will
be examined during t ϵ [1,4], i.e. the first 4 trading days after the game. Some studies (for example Clark
et al., 2005) used longer event windows, however in this case events might overlap because some
games in the competition are played every week (playoff games) and overlapping events might distort
the results. In some cases the event window includes the days before the event as well as the event day,
however due to the frequency of the games, including days preceding the event might mean considering
effects of a game which was played a week earlier. There is no need to include the event day in the
event window as well, since games are played when the stock exchanges are closed and the investors
would not be able to react to match outcomes at the same day.
The abnormal returns are the main measure which allows one to evaluate the impact of a certain event.
The normal return is the return that would be expected if the event did not take place. The abnormal
returns are calculated as a difference between actual returns at time t and normal returns at time t:
(1) ( )
Where , and ( ) are abnormal, actual and normal returns for game i at time t. In order to
model normal returns, the market model will be used in this study. The market model assumes a stable
linear relation between the market return (a stock market index) and the security return (Brown and
Warner, 1985). According to Brown and Warner (1985) methodologies based on the market model and

14
using standard parametric tests are well specified under a variety of conditions. The normal returns are
thus calculated:
(2) ( ) ̂ ̂
Where ̂ and ̂ are OLS estimates based on actual returns and is the return of the market index at
time t (Brown and Warner, 1985). A particular market index (e.g. FTSE 100, S&P 500, DAX, etc.) is chosen
depending in which stock exchange a company is listed (e.g. AIG and AON are listed on NYSE and are
constitutes of S&P 500 index therefore this index is used to estimate normal returns for these
companies). Such estimation should be more accurate than using a single market index for all companies
as it considers factors associated with different countries and stock markets. The estimation period of
250 trading days will be used in order to estimate normal returns, following the approach of Brown and
Warner (1985) and Campbell et al. (1997). 250 trading days constitutes to roughly a year before the
event. The actual return of a firm is defined as:
(3) ,
-
Where is the closing stock price of a sponsoring company i at the end of period t, adjusted for
dividends and splits and is the stock price of a sponsoring company i at the end of period t-1.
After calculating the abnormal returns for every event, the next step is to regress these abnormal
returns against football related variables. The equation for the base case regression is specified as:
(4)
Where and are dummy variables which are assigned value 1 if the team won or draw the game and
the value of 0 otherwise. If both variables are assigned the value of 0, the outcome of the game was a
loss. is the error term, is a constant and and are regression coefficients. The regressions
are run for the event days 1 to 4, i.e. t ϵ [1,4]. The event day t = 4 in some cases will be a day before the
next game. Note that intercepts are allowed to be different on different event days. In order to measure
the impact of the event over the whole or part of the event window, cumulative abnormal returns
metric is used. It is calculated as a sum of abnormal returns for a certain security during the event
window:
(5) ( )
15
Where ( ) is the cumulative abnormal return for an event i from time to and
is the abnormal return of the event i at the time t. In this paper ( ), ( ) and ( )
will be calculated. Similarly to the previous step, cumulative abnormal returns will be regressed against
the football related variables and the regression is defined by the following equation:
(6) ( )
Where variables and are the same as in the previous regression. The null
hypothesis to be tested is that stocks of a sponsoring company are not affected by football match’s
outcome. All regression models are estimated with robust standard errors to account for
heteroscedasticity.
4.2 Extensions
As documented by Renneboog and Vanbrabant (2000), Peenstra and Scholstens (2007) and Hanke and
Kirchler (2010), some games are more important and thus have a larger effect on stock returns. It is
found, that for example playoff or promotion/relegation games cause stronger market reaction than
regular group stage games. As a result, the sample will be split into group games and playoff games
(including finals) and the regressions (4) and (6) will be run on these smaller samples to test if this holds
in this research. The economic intuition behind this is that playoff games attract more viewers as the
competing teams are stronger than in group stage and the sponsoring companies receive more brand
visibility (for example 2013 Champions League final between FC Bayern Munich and Borussia Dortmund
was aired in more than 200 countries to an estimated global average audience of 150 million, according
to Fcbusiness.co.uk). Group games are considered to be the first stage of the tournament (and the
second stage of the tournament during the 01/02 and 02/03 seasons, as the league had 2 group stage
system), as discussed in the data section while the playoff games consist of all games after the group
stage, including the final.
Additionally, several different control variables will be introduced to account for company or game
specific effects. Some of the papers, discussed in the literature review, suggested that expected
outcomes have a smaller effect than unexpected ones. To control for pre-game expectations, variables
probW and probL (corresponding to probabilities of winning or losing a game) will be introduced in the
regression and the probability of drawing a game will be used as a base case scenario (
). Furthermore, probabilities provided by betting companies should be a good proxy for
determining a team’s strength and it may be possible that games between more evenly matched teams

16
(i.e. draw is more likely than win or loss) attract more viewers – such games should be more competitive
and more interesting to neutral spectators. Interaction variables between game outcome dummies and
probability variables will be used in some specifications to check if expected/unexpected outcomes have
different effect.
A dummy variable toptm will be used to indicate games which are played against the best/elite teams in
the Champions League. Intuitively, a game between Manchester United and FC Barcelona should attract
more spectators than a game between Manchester United and Olympiacos, because FC Barcelona,
among other factors, has a bigger fan base than the Greek team. The top teams in this research are
considered to be Bayern Munich, Real Madrid, Manchester United, FC Barcelona, FC Liverpool, Juventus
FC, FC Internazionale Milano, AC Milan, Arsenal FC and Chelsea FC and were chosen by the number of
times they played in the Champions League’s quarterfinals over the analyzed period.
Company’s size is often included in event studies (e.g. Clark et al., 2004, Edmans et al., 2007) therefore
market capitalization (stock price multiplied by number of shares outstanding) will be used as a proxy
for company size in this analysis. As found by Clark et al. (2004), sponsorships undertaken in the name of
an entire corporation were received more favorably by investors than those sponsorships which
included single products or divisions. In order to test this, a dummy variable will be introduced which
achieves a value of 1 if the name of the company appeared on the sponsored team’s jersey and 0
otherwise. As companies are listed in several different stock exchanges dummy variables will be used to
control for factors associated with it.
Since the analysis covers 12 seasons (years) there might be year specific effects, which had an impact on
league, teams, companies or stock markets (e.g. financial crisis of 2008). It may also be the case that
with technological advancements (e.g. internet broadcasting) the Champions League was viewed by
more people in the 2012/13 season than in 2002/03 and as a result advertised brands gained more
visibility. To control for such factors, the regression equation will include dummy variables for every
season (the Champions League’s season starts in July and ends in May). The final regressions will be
defined by the following equations:
(7)

17
(8) ( )
Where and are dummies for winning and drawing a game, and ϵ [0,1] are
probabilities of a certain outcome of a game, is a dummy variable which takes the value of 1 if a
company has a market capitalization larger than $30 billion and 0 otherwise, takes value of 1
if the name of the company appears on the sponsored team’s jersey (e.g. Aon, AIG) and 0 if a product or
a subsidiary is being advertised (e.g. O2).
* + are dummy
variables indicating the stock exchange of a sponsoring company, and
* + are dummy variables for seasons 2001/2002 through
2012/2013. As a final robustness check fixed effects regression will be used instead of ordinary least
squares.
4.3 Possible issues
Brown and Warner (1985) discuss several possible issues when using event study methodology with
daily stock returns. Firstly, the distributions of daily stock returns do not follow the normal distribution.
However, according to Brown and Warner (1985) non-normality of daily returns has no obvious impact
to event study methodologies, as the mean excess returns in a cross-section of securities converges to
normality with an increasing number of securities. The authors conclude that even with samples of only
5 securities and even when event days are clustered the standard parametric tests for significance are
well specified.
Secondly, there is evidence that variance increases during the periods surrounding the event and this
affects the power of tests. Brown and Warner (1985) find that adjusting the estimated variance to
reflect the autocorrelation in time-series of mean daily excess returns improves the hypothesis testing
for multi-day intervals (CARs) however the improvements are minor and apply to specific cases only.
Non-synchronous trading (i.e. some stocks are traded more frequently than others) is mentioned as one
of the causes of autocorrelation however this should not be a problem in this analysis as sponsoring
companies are international corporations and are incorporated in market indexes. The conclusion of the
paper is that methodologies based on the OLS market model and using standard parametric tests are

18
well specified under a variety of conditions and the use of daily stock data in event studies is
straightforward.
19
5. Results
5.1 Base case results
Results from equations (4) and (6) are presented in tables 3, 8 and 9. Interestingly, neither “Win” nor
“Draw” variables are statically significant at least at 5% level, however the constant term is statistically
significant at 1% level and is equal to 0.0039 on the event day 1. This implies that independent of game
outcome, the stock price of a sponsoring company increases by almost 0.4 basis points on the first
trading day after the game was played. These results counter the findings of Hanke and Kirschel (2010)
and Peenstra and Scholtens (2007), who found that losses have a negative impact on stock prices.
Furthermore, the effects of the event do not extend throughout the week as observed in Renneboog
and Vanbrabant (2000) – none of the variables are statistically significant after the first trading day as
well as the cumulative abnormal returns. Although 0.4 basis points increase seems to be a small number
to have an economic impact, in real terms this would result in a change of $100 million for Aon
corporation (market capitalization of $25.12 bn) or $23.5 million for Pirelli & C. (market capitalization of
$5.88 bn).5
Although these results contradict the findings of above mentioned football based papers, they are in line
with the efficient market hypothesis of Fama (1970). The investors perceive a football game as new
information about the company and react to it. The fact that the outcome of a game is not important to
them may imply that investors are rational and consider the economic factors associated with a
particular game: the sponsoring company’s brand receives exposure among viewers (at least 90 minutes
in each game) independent of the outcome and this may increase company’s sales in the longer period.
Furthermore, companies might advertise their products during the half-time or before and after the
game and such advertisements may be more appealing to club’s supporters than regular TV or printed
media advertisements. As Brett Yormark, NASCAR’s vice president of corporate marketing has said in
his interview to the New York Times: “Our teams and drivers have done a wonderful job communicating
to the fan that the more Tide they buy, the faster Ricky Craven's going to go,” (Napoli, 2003) and this
may be the case with football as well – fans may believe that e.g. the more Carlsberg they drink, the
better Liverpool will play and every football game increases company’s sales.
5 finance.yahoo.com, March 14, 2014

20
Table 3. Abnormal and Cumulative abnormal returns after the Champions League’s game
Abnormal returns at event day t=1 CAR(1,4)
Full sample Group stage Playoff stage Full sample Group stage Playoff stage
-0.000502 0.000617 -0.00268 0.00797 0.00367 0.00360
(0.00257) (0.00261) (0.00588) (0.00902) (0.00525) (0.0108) -0.0151 -0.0243 0.00415 -0.00448 -0.00904 -0.0140
(0.0119) (0.0175) (0.00429) (0.0137) (0.0197) (0.0136)
0.00388*** 0.00372* 0.00406* -0.00633 -0.000782 0.00945*
(0.00149) (0.00198) (0.00227) (0.00888) (0.00382) (0.00510)
N 678 437 241 678 437 241
R2 0.006 0.012 0.004 0.004 0.002 0.007
Robust standard errors in parentheses
*** p<0.01, ** p<0.05, * p<0.1
5.2 Split sample results
As described in the section 4, it was found in previous researches that some games have stronger effects
than others (e.g. promotion/relegation, knockout stage games). To check this hypothesis, the full sample
was split into group (a total of 437 games) and playoff (a total of 241 games) stages and regressions (4)
and (6) were used to analyze these smaller samples. Abnormal returns at event day 1 and cumulative
abnormal returns for the days 1 through 4 are provided in the table 3.
As in the case of full sample, only constant term is statistically significant on the first trading day after
the event (abnormal returns for other days were not statistically different from zero and are not
reported in the table). As expected, the playoff games show a stronger impact on abnormal returns than
group stage games (0.00372 and 0.00406 respectively) however the results are significant only at 10%
level. Analysis of split samples shows that the effects of a playoff game extend throughout the week,
unlike in the cases with full sample or group games only. The constant term for CAR(1,4) is statistically
significant from zero at 10% level and is equal to 0.95 basis points, more than twice higher than the
increase on the first trading day after the football game. This provides further evidence that playoff
games may have a stronger impact on abnormal returns, as observed by Edmans et al. (2007) or Hanke
and Kirchler (2010). The increase in abnormal returns could be explained by higher popularity of playoff
games - companies would gain significantly more brand exposure than during group stage games and
this increase may be large enough to impact investor behavior (and consumer behavior as well, which
21
could result in higher sales of a certain product or service) several days after the event. In the
2012/2013 season 32 teams which played in the group stage were allocated ϵ8.6m of TV money each
(about ϵ1.4m per game), ϵ3.5m were granted to each team playing in the last 16 (ϵ1.75m per game),
ϵ3.9m to the quarter-finalists (ϵ1.95m per game), ϵ4.9m to the semi-finalists (ϵ2.45m per game), ϵ6.5m
to the runners-up and ϵ10.5m to the winners of the tournament.6 Although data on number of viewers
of a certain game is not available, the fact that clubs are allocated more TV money in the later stages of
the competition is a clear indication of increasing TV audience.
5.3 Extensions
As discussed in section 4, the base case regressions were extended to incorporate additional control
variables. The results are provided in tables 10-18. All of the tables include information obtained by
using full and split samples, as it was observed that playoff games increase abnormal returns.
As found in previous researches, company’s size decreases the abnormal returns – the variable size is
negative in all model specifications however it lacks statistical significance (it is statistically significant
only at 10% level and only in few specifications). The fact that smaller companies generate larger
abnormal returns than bigger ones is in line with findings of Clark et al. (2005) who found that
companies with smaller market share gained higher abnormal returns after sponsorship
announcements. Although there is a lack of statistical significance it is interesting that the coefficient for
group games is considerably smaller than for playoff games and would suggest that size of a company is
less important factor in playoffs.
Higher pre-game probabilities of winning or losing decrease abnormal returns as can be seen in tables
11-19, however only variable is statistically significant at 10% level and only in few specifications.
This suggests that games between more evenly matched teams (i.e. where bookmakers expect draw)
generate higher abnormal returns for sponsoring companies than games where one team is a clear
favorite. The intuition behind this is that such games are more competitive and may be more attractive
to neutral (i.e. not supporting a particular team) viewers, who have to choose a match from multiple
games being played at the same time. Games which attract a bigger TV audience should have a bigger
impact on a sponsoring company. Tables 12, 13 and 14 include interaction variables ,
and . None of the interaction variables are statistically significant, however
the positive coefficients for full sample and group stage games are counter-intuitive – it suggests that
6 Statistics provided by UEFA

22
expected outcomes would generate higher abnormal returns, contradicting the findings of several
football based papers discussed in chapter 2.
Neither variable nor were significantly different from 0 in any of the regressions.
While positive coefficients are in line with the findings of Clark et al. (2004), who found that
companies gain more from advertisements at corporate level, the negative coefficients (for
group and full samples) are counterintuitive. One possible explanation could be that due to sample
specifics, only 50 games out of 437 were played between top teams in the group stage, in comparison
with 141 out of 241 in the knockout stage. Additionally, a large number of games between top teams in
the playoff stage might help to explain the increase in abnormal returns generated by playoff games, as
observed in table 8 – it may be possible that if stronger teams played in the same group at the group
stage, the abnormal returns generated in different stages of the competition would not be that
different. Examination of stock exchange dummies indicates that company public listings in Milan,
Copenhagen or Amsterdam stock exchanges decreases the cumulative abnormal returns by about 5
basis points.
5.4 Fixed effects regression results
Finally, the table 15 lists results from a panel regression controlling for company fixed effects. These
may include factors such as stock exchange in which a particular company is listed, regions in which it
operates or industry related factors. Furthermore, since no company sponsored more than one club in
the sample, this model should consider club specific effects as well, e.g. size of a fan base or fan loyalty,
which may be an important determinant of marketing campaign’s success as discussed in Clark et al.
(2004).
The results observed in the table 15 to a large extent match the results from OLS regressions. Firstly, the
constant terms are positive and highly statistically significant for full sample and group stage. Variable
is significant at 1% level for the same samples and as observed before, it decreases the abnormal
returns. As previously observed higher probabilities of winning and losing decrease abnormal returns,
however none of the coefficients are statistically different from 0. Interestingly, the effects of playoff
games are not only statistically insignificant, but the coefficients are considerably smaller than for group
stage games.
23
Table 4. Abnormal and Cumulative abnormal returns after the Champions League’s game (Panel
regression, fixed effects)
Abnormal returns at event day t=1 CAR(1,4)
Full sample Group stage Playoff stage Full sample Group stage Playoff stage
9.17e-05 -0.000348 -0.00119 -0.000914 0.00116 -0.00371
(0.00218) (0.00303) (0.00635) (0.00561) (0.00868) (0.00463)
-0.0133 -0.0217 0.00358 -0.0129 -0.00867 -0.0215
(0.0154) (0.0224) (0.00611) (0.0198) (0.0245) (0.0184)
-0.182*** -0.203*** 0.00969 -0.192*** -0.210*** 0.00760
(0.0258) (0.0451) (0.00853) (0.0223) (0.0373) (0.0382)
-0.00294 -0.0126 0.000805 -0.00272 -0.0159 0.00720
(0.00618) (0.0136) (0.00694) (0.00967) (0.0203) (0.0114)
-0.0719 -0.111 -0.0559 -0.0452 -0.112 0.166
(0.0474) (0.0643) (0.0388) (0.0521) (0.0816) (0.181)
-0.0661 -0.121* -0.0460 -0.0374 -0.106 0.149
(0.0413) (0.0556) (0.0312) (0.0680) (0.106) (0.172)
0.131** 0.176** 0.0259 0.125** 0.180** -0.0996
(0.0440) (0.0644) (0.0258) (0.0491) (0.0774) (0.125)
N 678 437 241 678 437 241
R2
0.063 0.068 0.048 0.053 0.052 0.059
Season: Yes Yes Yes Yes Yes Yes
No of companies 12 12 11 12 12 11
Robust standard errors in parentheses
*** p<0.01, ** p<0.05, * p<0.1

24
6. Discussion
The main goal of this paper was to examine the link between a football club’s performance and its
sponsor’s stock price. Even though it was found that the sponsor’s stocks are not affected by how well a
club plays, the information gained during this research is still relevant. The fact that positive abnormal
returns were observed after every Champions League’s game could be used by a company to determine
the pricing of sponsorship agreements or used as an argument when choosing between different
marketing strategies. Furthermore, such results would help explain why clubs are able to sign larger
sponsorship agreements, even during the times of financial crisis and economic slowdown. At the same
time, the results could be used by sport clubs when trying to attract new sponsors or maximize the gain
from existing or future sponsorship agreements. However the study has several limitations and further
research would be needed in order to use the findings in the decision making process.
One of the biggest limitations of the paper is the sample size – only 678 observations were used in the
research (in comparison to 2600 observations in Edmans et al., 2007). However, this is due to the fact
that most of the teams participating in the tournament did not have a publicly listed sponsor. The
sample size could be extended by including different leagues (e.g. UEFA Europa League, Copa
Libertadores or national competitions) or different sports (basketball, handball, etc.). Additional concern
regarding the sample is that mostly elite teams were included in the research and sponsorships of
smaller/less popular clubs may have different effects. Unfortunately, there is no clear way how to fix
this, as smaller clubs are usually sponsored by private limited companies.
As it was found that there are positive abnormal returns after every game despite the outcome, it would
be wise to focus future research on other factors than winning or losing a game. One possible extension
could be to look at the games where overtime was played or games which ended with a penalty shoot-
out. Such games last longer, because two 15 minutes long overtimes are played in football, and during
that time sponsors receive additional coverage. Intuitively, the effects on companies should be larger
after 120 minutes television exposure than after 90. It may be of interest to control for factors such as
size of TV audience or fan base. Although such data may be hard to obtain, proxies like a number of
Twitter or Facebook followers or revenue generated from TV rights could be used. Additionally, factors
such as sales of official merchandise may indirectly affect the sponsoring company – its logo is on every

25
official jersey sold to club’s fans worldwide and this increases company’s visibility without any additional
costs.
Player transfers maybe another important aspect. When Cristiano Ronaldo transferred from Manchester
United to Real Madrid for a fee of £80 million the shirt sales of real Madrid increased significantly. Real
Madrid announced that shirt sales featuring the name and the number of the footballer surpassed the
transfer fee paid in the first season already (metro.co.uk, 2010). While the club and the kit supplier
benefit the most from such deals, it may be possible that signings like this affect the kit sponsors as well
and it may be worthwhile to analyze such deals.
26
7. Conclusion
Motivated by an increasing interest in sports industry, this paper examined the relationship between a
football club’s performance in the Champions League and its sponsor’s stock price. A total of 9 teams
and 12 sponsoring companies were used in this analysis which covered 12 seasons, starting from
2001/02. Although it was found that neither winning, losing nor drawing a game affects the abnormal
returns, several interesting observations can still be made.
Firstly, there is evidence that games in the Champions League generate positive abnormal returns for
the companies, independent of the result as the constant term was positive and in many cases
statistically significant. The coefficient differs depending on model specification, from 0.4 basis points in
the base case OLS regression, to 13 basis points in the fixed effects model. 0.4 basis point abnormal
returns in real terms would result in a change of around $100 million for Aon Corporation (market
capitalization of $25.12 bn) or $23.5 million for Pirelli & C. (market capitalization of $5.88 bn) after every
Champions League’s game. This implies that sponsoring a football club increases shareholder wealth and
companies should consider this option. The positive abnormal returns after every game can be
explained by increased brand visibility – the sponsor receives at least 90 minutes of TV time per game
independent of the game outcome and this may affect investor decisions. Additionally, as mentioned
before, football fans may believe that buying a particular product will make their team play better and
as a result every game might increase sponsor’s sales. These findings would help explain why the
sponsorship deals signed by football clubs are larger year-by-year – e.g. Manchester United have
recently signed an agreement with Chevrolet worth £53 million a year, more than twice the value of a
current Aon sponsorship of £20 million, even though the club is unlikely to qualify to the Champions
League (Ogden, 2009, 2014).
Secondly, it cannot be concluded that playoff stage of the competition generate higher abnormal
returns, as observed in several other football based papers. Although this trend was observed in the
base case regression, the results were not robust in later specifications. It may be possible that these
effects were due to the fact that top teams (as defined in section 4) played each other in the playoff
stage considerably more often than in the group stage. Intuitively, the games between more popular or
stronger teams should attract more viewers independent of the stage of the competition.

27
Thirdly, probabilities of winning, losing and drawing were used as control variables to check if
expectations about game outcome have any effect on abnormal returns. Although there is lack of
statistical significance, and coefficients were negative, implying that games where
bookmakers expected a draw generated higher abnormal returns. One possible explanation could be
that sports fans (especially those not supporting a particular team) may want to watch a game which is
more competitive, rather than the game which has a clear favorite and as a result games between more
evenly matched teams would attract higher TV audience, thus increasing sponsor’s brand visibility and
sales in the longer run.
Finally, it was found that higher market capitalization of a company decreases abnormal returns, which
is in line with findings of multiple event studies. Additionally, companies listed in Amsterdam,
Copenhagen or Milan stock exchanges had lower cumulative abnormal returns than those listed in New
York, London or Frankfurt. It cannot be concluded that effects of a football game extend throughout the
week, as the coefficients for cumulative abnormal returns are not robust to model specification
changes.
28
8. Refferences
Agrawal, J. & Kamakura, W. A.. (1995). The Economic Worth of Celebrity Endorsers: An Event Study
Analysis. Journal of Marketing. 59 (3), 56-62.
AJAX AFC. (2014). Official AJAX FC webpage. Available: http://english.ajax.nl/. Last accessed May 2,
2014.
Arsenal FC. (2014). Official Arsenal FC webpage. Available: http://www.arsenal.com/home. Last
accessed May 2, 2014.
Arshad, R. (2014). Football’s 10 Most Expensive Shirt Sponsorship Deal.Available: http://www.sportrichlist.com/football/most-expensive-shirt-sponsorship-deals/. Last accessed May 12, 2014.
BetExplorer.com. (2014). BetExplorer Soccer Stats & Soccer Odds - results, tables, odds comparison.
Available: http://www.betexplorer.com/soccer/europe/ Last accessed May 3, 2014.
Bodie, Z., Kane, A. and Marcus, A. (2005). Investments. 1st ed. Boston, Mass.: McGraw-Hill Irwin.
Brandweek Staff. (2009). Cutting Tiger Woods Generates Positive Buzz for Brands. Available:
http://www.adweek.com/news/advertising-branding/cutting-tiger-woods-generates-positive-buzz-
brands-101160. Last accessed May 2, 2014.
Brown, S. J., & Warner, J. B. (1985). Using Daily Stock Returns: The Case of Event Studies. Journal of
Financial Economics. 14, 3-31.
Campbell, J., Lo, A. and MacKinlay, A. (1997). The econometrics of financial markets. 1st ed. Princeton,
N.J.: Princeton University Press.
Chelsea FC. (2014). Official Chelsea FC webpage. Available: http://www.chelseafc.com/. Last accessed
May 2, 2014.
Clark, J. M., Cornwell, T. B., & Pruitt, S. W. (2004). The NASCAR Phenomenon: Auto Racing Sponsorships
and Shareholder Wealth.Journal of Advertising Research. 44 (3), 281-296.
29
Clark, J. M., Cornwell, T. B., & Pruitt, S. W. (2005). The relationship between major-league sports’ official
sponsorship announcements and the stock prices of sponsoring firms. Journal of the Academy of
Marketing Science. 33 (4), 401-412.
Edmans, A., Garcia, D., & Norli, O. (2007). Sports sentiment and stock returns. Journal of Finance. 62 (4),
1967-98.
Espnfc.com. (2014). Football / Soccer Live Scores and Match Results - ESPN FC. Available:
http://www.espnfc.com/scores?cc=5739 Last accessed May 3, 2014.
Fama, E. F. (1970). Efficient Capital Markets: a Review of Theory and Empirical Work. The Journal of
Finance. 25 (2), 383–417.
FC Bayern Munchen. (2014). Official FC Bayern webpage. Available: http://www.fcbayern.de/en/. Last
accessed May 2, 2014.
FC Internazionale Milano. (2014). Official Inter Milan webpage. Available: http://www.inter.it/en/hp.
Last accessed May 2, 2014.
Fcbusiness.co.uk, (2014). Champions League Final Draws TV Audience of 360 Million : F.C. Business.
Available:
http://fcbusiness.co.uk/news/article/newsitem=2434/title=champions+league+final+draws+tv+audienc
e+of+360+million. Last accessed May 3, 2014.
Hanke M., & Kirchler, M. (2010). Football Championships and Jersey Sponsors' Stock Prices: An Empirical
Investigation. Working Papers 2010-07, Faculty of Economics and Statistics, University of Innsbruck.
Juventus FC. (2014). Official Juventus FC webpage. Available:
http://www.juventus.com/juve/en/welcome. Last accessed May 2, 2014.
Liverpool FC. (2014). Official Liverpool FC webpage. Available: http://www.liverpoolfc.com/welcome-to-
liverpool-fc. Last accessed May 2, 2014.
Manchester United. (2014). Official Manchester United webpage. Available: http://www.manutd.com/.
Last accessed May 2, 2014.
30
Metro.co.uk. (2010). Cristiano Ronaldo shirt sales ‘have already paid off £80m’. Available:
http://metro.co.uk/2010/04/15/cristiano-ronaldo-shirt-sales-have-already-paid-off-80m-fee-to-
manchester-united-real-madrid-claim-242129/. Last accessed May 7, 2014.
Miller, A. (2012). EXCLUSIVE: Manchester United and Real Madrid top global shirt sale charts. Available:
http://www.sportingintelligence.com/2012/10/08/exclusive-manchester-united-and-real-madrid-top-
global-shirt-sale-charts-081001/. Last accessed May 2, 2014.
Napoli, L. (2003). Fan loyalty and a commitment to Nascar sponsors attract marketers.. Available:
http://www.nytimes.com/2003/07/14/business/media-business-advertising-fan-loyalty-commitment-
nascar-sponsors-attract.html. Last accessed May 12, 2014.
Ogden, M. (2009). Manchester United clinch shirt sponsorship with Aon Corp. Available:
http://www.telegraph.co.uk/sport/football/teams/manchester-united/5434986/Manchester-United-
clinch-shirt-sponsorship-with-Aon-Corp.html. Last accessed May 5, 2014.
Ogden, M. (2014). Manchester United put their shirt on new £65 million world-record deal. Available:
http://www.telegraph.co.uk/sport/football/teams/manchester-united/10603087/Manchester-United-
put-their-shirt-on-new-65-million-world-record-deal.html. Last accessed May 2, 2014.
Ogden, M. (2014). Manchester United's £53m shirt deal with Chevrolet unaffected despite likely absence
of Champions League. Available: http://www.telegraph.co.uk/sport/football/teams/manchester-
united/10637024/Manchester-Uniteds-53m-shirt-deal-with-Chevrolet-unaffected-despite-likely-
absence-of-Champions-League.html. Last accessed May 5, 2014.
Ozanian, M. (2013). Soccer's Most Valuable Teams: At $3.3 Billion, Real Madrid Knocks Manchester
United From Top Spot. Available: http://www.forbes.com/sites/mikeozanian/2013/04/17/soccers-most-
valuable-teams-real-madrid-dethrones-manchester-united-from-top-spot-at-3-3-billion/. Last accessed
May 2, 2014.
Peenstra, W., & Scholtens, B. (2009). Scoring on the stock exchange? The effect of football matches on
stock market returns: an event study. Applied Economics. 41 (25), 3231-3237.
Pudasaini, P. (2014). The 10 Most Expensive Kit Supplier Deals in Football. Available:
http://www.therichest.com/sports/soccer-sports/the-10-most-expensive-kit-supplier-deals-in-football/.
Last accessed May 12, 2014.
31
Real Madrid CF. (2014). Official Real Madrid webpage. Available:
http://www.realmadrid.com/en/football. Last accessed May 2, 2014.
Renneboog, L. & Vanbrabant, P. (2000). Share Price Reactions to Sporty Performances of Soccer Clubs
listed on the London Stock Exchange and the AIM. Discussion Paper 2000-19, Tilburg University, Center
for Economic Research.
SportsBusiness Daily. (2007). Nike Offers $778M To Oust adidas As Germany Soccer Sponsor. Available:
http://www.sportsbusinessdaily.com/Daily/Issues/2007/01/Issue-91/Sponsorships-Advertising-
Marketing/Nike-Offers-$778M-To-Oust-Adidas-As-Germany-Soccer-Sponsor.aspx. Last accessed May 2,
2014.
Stadtmann, G. (2006). Frequent News and Pure Sygnals: the Case of a Publicly Traded Football
Club. Scottish Journal of Political Economy. 53 (4), 485–504.
The Economist. (2012). IPOs in football: If at first you don’t succeed. Available:
http://www.economist.com/blogs/gametheory/2012/07/ipos-football-0. Last accessed May 2, 2014.
UEFA. (2014). UEFA Champions League. Available: http://www.uefa.com/uefachampionsleague/. Last
accessed May 2, 2014.
Yahoo Finance, (2014). Yahoo Finance - Business Finance, Stock Market, Quotes, News. Available:
http://finance.yahoo.com/. Last accessed May 3, 2014.

32
Appendix
Table 5. Kit supplier deals in football
Club Brand Annual Contract
Real Madrid Adidas £31 million 2012-2020 Arsenal Puma £30 million 2014-2019
Barcelona Nike £26.3 million 2006-2013 Liverpool Warrior £25 million 2012-2015
Manchester United Nike £23.5 million 2002-2015 Bayern Munich Adidas £22 million 2011-2020
Source: Ogden (2014)
Table 6. The world’s best-selling football club shirts
Team Average annual sales (2007-2011) Manufacturer
Manchester United 1 400 000 Nike Real Madrid 1 400 000 Adidas Barcelona 1 150 000 Nike Chelsea 910 000 Adidas
Bayern Munich 880 000 Adidas Liverpool 810 000 Adidas Arsenal 800 000 Nike
Juventus 480 000 Nike Inter Milan 425 000 Nike AC Milan 350 000 Adidas
Source: Miller (2012)
33
Table 7. Descriptive statistics
Sponsor Obs. Win Loss Draw Win % Loss % Draw %
Aegon 18 5 9 4 27.78% 50.00% 22.22%
BT group 43 20 8 15 46.51% 18.60% 34.88%
Deutshe
Telekom 95 50 26 19 52.63% 27.37% 20.00%
Samsung 79 40 15 24 50.63% 18.99% 30.38%
Pirelli &
C. 94 45 26 23 47.87% 27.66% 24.47%
FIAT
group 24 10 5 9 41.67% 20.83% 37.50%
Carlsberg
group 81 39 19 23 48.15% 23.46% 28.40%
Vodafone 52 27 12 13 51.92% 23.08% 25.00%
AIG 48 31 7 10 64.58% 14.58% 20.83%
Aon 26 14 4 8 53.85% 15.38% 30.77%
Siemens 58 32 12 14 55.17% 20.69% 24.14%
Bwin 60 34 15 11 56.67% 25.00% 18.33%
Total 678 347 158 173 51.18% 23.30% 25.52%
Table 8. Abnormal returns after the Champions League’s game (base case)
Event Day (1) (2) (3) (4)
-0.000502 -0.00976 0.00460 0.00797
(0.00257) (0.0136) (0.0157) (0.00902) -0.0151 -0.00833 0.0159 -0.00448
(0.0119) (0.0137) (0.0189) (0.0137) 0.00388*** 0.0105 -0.00419 -0.00633
(0.00149) (0.0135) (0.0156) (0.00888)
N 678 678 678 678
R2
0.006 0.002 0.002 0.004
Robust standard errors in parentheses
*** p<0.01, ** p<0.05, * p<0.1

34
Table 9. Cumulative abnormal returns after the Champions League’s game (base case)
CAR(1,2) CAR(1,3) CAR(1,4)
-0.0103 -0.00566 0.00232
(0.0140) (0.0100) (0.00504) -0.0235 -0.00752 -0.0120
(0.0184) (0.0194) (0.0140) 0.0144 0.0102 0.00388
(0.0137) (0.00937) (0.00313)
N 678 678 678
R2
0.005 0.000 0.003
Robust standard errors in parentheses
*** p<0.01, ** p<0.05, * p<0.1
Table 10. Abnormal and Cumulative abnormal returns after the Champions League’s game
Abnormal returns at event day t=1 CAR(1,4)
Full sample Group stage Playoff stage Full sample Group stage Playoff stage
-0.000378 0.00129 -0.00281 0.00249 0.00446 0.00324
(0.00262) (0.00282) (0.00577) (0.00513) (0.00550) (0.0106) -0.0150 -0.0237 0.00403 -0.0119 -0.00833 -0.0143
(0.0118) (0.0170) (0.00425) (0.0139) (0.0193) (0.0135)
-0.0118* -0.0160 -0.00392 -0.0160* -0.0189 -0.0107
(0.00714) (0.0106) (0.00492) (0.00851) (0.0119) (0.00993)
0.00895** 0.0102** 0.00586* 0.0108** 0.00693 0.0144**
(0.00348) (0.00487) (0.00335) (0.00492) (0.00637) (0.00689)
N 678 437 241 678 437 241
R2
0.011 0.018 0.006 0.009 0.009 0.010
Robust standard errors in parentheses
*** p<0.01, ** p<0.05, * p<0.1

35
Table 11. Abnormal and Cumulative abnormal returns after the Champions League’s game
Abnormal returns at event day t=1 CAR(1,4)
Full sample Group stage Playoff stage Full sample Group stage Playoff stage
0.000582 -0.00124 0.000523 0.00204 0.00169 0.00228
(0.00523) (0.00843) (0.00629) (0.00695) (0.0101) (0.0101) -0.0153 -0.0259 0.00474 -0.0127 -0.0109 -0.0145
(0.0123) (0.0185) (0.00435) (0.0142) (0.0205) (0.0132)
-0.0117 -0.0165 -0.00387 -0.0160* -0.0194 -0.0108
(0.00712) (0.0109) (0.00483) (0.00854) (0.0123) (0.00973)
-0.0720* -0.0852 -0.107 -0.0599 -0.105 0.0415
(0.0429) (0.0591) (0.0779) (0.0650) (0.0707) (0.162)
-0.0820 -0.124 -0.0916 -0.0771 -0.151 0.0386
(0.0555) (0.107) (0.0780) (0.0814) (0.124) (0.163)
0.0647* 0.0855 0.0775 0.0602 0.0988 -0.0145
(0.0364) (0.0606) (0.0573) (0.0540) (0.0716) (0.118)
N 678 437 241 678 437 241
R2
0.012 0.020 0.022 0.009 0.011 0.011
Robust standard errors in parentheses
*** p<0.01, ** p<0.05, * p<0.1
Table 12. Abnormal and Cumulative abnormal returns after the Champions League’s game
Abnormal returns at event day t=1 CAR(1,4)
Full sample Group stage Playoff stage Full sample Group stage Playoff stage
-0.00514 -0.0105 0.0142 0.0135 -0.00819 0.0357
(0.0238) (0.0379) (0.0128) (0.0280) (0.0400) (0.0319)
-0.0150 -0.0257 0.00414 -0.0136 -0.0107 -0.0159
(0.0124) (0.0192) (0.00442) (0.0144) (0.0211) (0.0137)
0.0126 0.0186 -0.0329 -0.0247 0.0198 -0.0806
(0.0595) (0.0911) (0.0246) (0.0692) (0.0963) (0.0824)
-0.0888 -0.107 -0.0769 -0.0321 -0.127 0.116
(0.0899) (0.124) (0.0722) (0.118) (0.129) (0.208)
-0.0931 -0.135 -0.0763 -0.0573 -0.161 0.0754
(0.0601) (0.0894) (0.0756) (0.0939) (0.102) (0.187)
0.0699 0.0910 0.0593 0.0359 0.103 -0.0592
(0.0529) (0.0742) (0.0531) (0.0750) (0.0794) (0.142)
N 678 437 241 678 437 241
R2 0.007 0.014 0.023 0.004 0.004 0.012
Robust standard errors in parentheses
*** p<0.01, ** p<0.05, * p<0.1
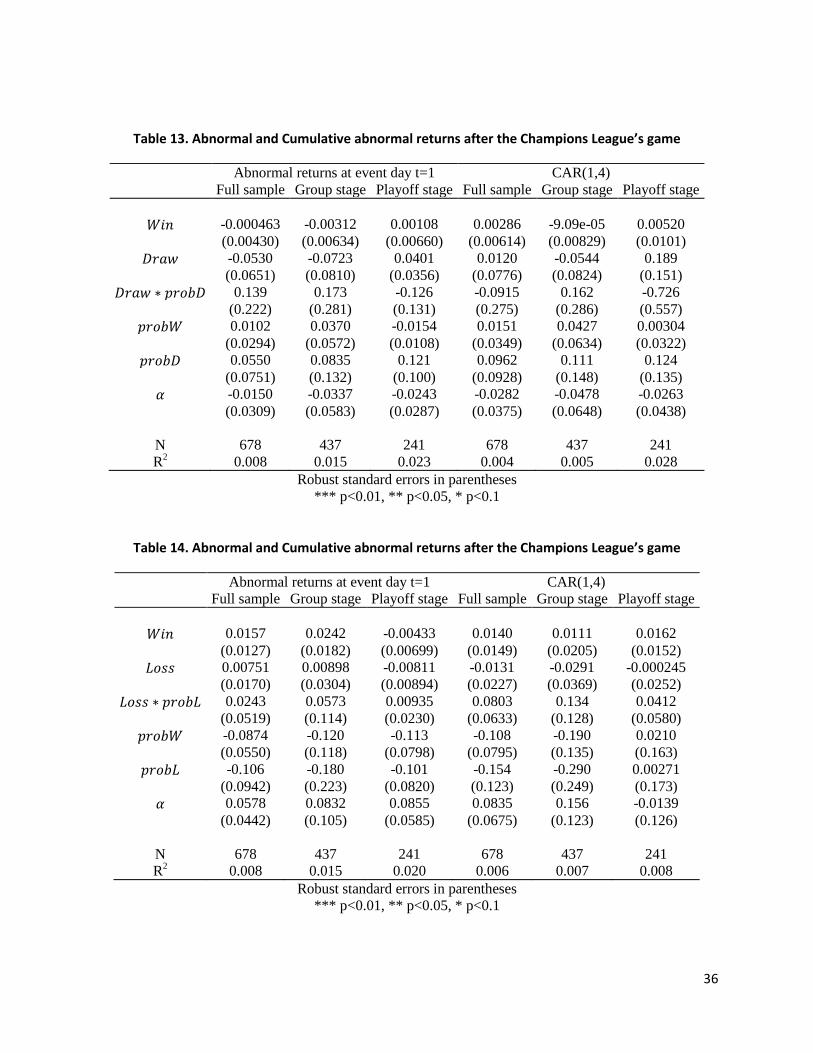
36
Table 13. Abnormal and Cumulative abnormal returns after the Champions League’s game
Abnormal returns at event day t=1 CAR(1,4)
Full sample Group stage Playoff stage Full sample Group stage Playoff stage
-0.000463 -0.00312 0.00108 0.00286 -9.09e-05 0.00520
(0.00430) (0.00634) (0.00660) (0.00614) (0.00829) (0.0101)
-0.0530 -0.0723 0.0401 0.0120 -0.0544 0.189
(0.0651) (0.0810) (0.0356) (0.0776) (0.0824) (0.151)
0.139 0.173 -0.126 -0.0915 0.162 -0.726
(0.222) (0.281) (0.131) (0.275) (0.286) (0.557)
0.0102 0.0370 -0.0154 0.0151 0.0427 0.00304
(0.0294) (0.0572) (0.0108) (0.0349) (0.0634) (0.0322)
0.0550 0.0835 0.121 0.0962 0.111 0.124
(0.0751) (0.132) (0.100) (0.0928) (0.148) (0.135)
-0.0150 -0.0337 -0.0243 -0.0282 -0.0478 -0.0263
(0.0309) (0.0583) (0.0287) (0.0375) (0.0648) (0.0438)
N 678 437 241 678 437 241
R2 0.008 0.015 0.023 0.004 0.005 0.028
Robust standard errors in parentheses
*** p<0.01, ** p<0.05, * p<0.1
Table 14. Abnormal and Cumulative abnormal returns after the Champions League’s game
Abnormal returns at event day t=1 CAR(1,4)
Full sample Group stage Playoff stage Full sample Group stage Playoff stage
0.0157 0.0242 -0.00433 0.0140 0.0111 0.0162
(0.0127) (0.0182) (0.00699) (0.0149) (0.0205) (0.0152)
0.00751 0.00898 -0.00811 -0.0131 -0.0291 -0.000245
(0.0170) (0.0304) (0.00894) (0.0227) (0.0369) (0.0252)
0.0243 0.0573 0.00935 0.0803 0.134 0.0412
(0.0519) (0.114) (0.0230) (0.0633) (0.128) (0.0580)
-0.0874 -0.120 -0.113 -0.108 -0.190 0.0210
(0.0550) (0.118) (0.0798) (0.0795) (0.135) (0.163)
-0.106 -0.180 -0.101 -0.154 -0.290 0.00271
(0.0942) (0.223) (0.0820) (0.123) (0.249) (0.173)
0.0578 0.0832 0.0855 0.0835 0.156 -0.0139
(0.0442) (0.105) (0.0585) (0.0675) (0.123) (0.126)
N 678 437 241 678 437 241
R2 0.008 0.015 0.020 0.006 0.007 0.008
Robust standard errors in parentheses
*** p<0.01, ** p<0.05, * p<0.1

37
Table 15. Abnormal and Cumulative abnormal returns after the Champions League’s game
Abnormal returns at event day t=1 CAR(1,4)
Full sample Group stage Playoff stage Full sample Group stage Playoff stage
0.000685 -0.000912 0.000522 0.00214 0.00205 0.00228
(0.00526) (0.00847) (0.00630) (0.00699) (0.0102) (0.0101) -0.0152 -0.0248 0.00479 -0.0126 -0.00971 -0.0145
(0.0122) (0.0178) (0.00432) (0.0141) (0.0199) (0.0133)
-0.00704 -0.0102 -0.00403 -0.0116* -0.0126 -0.0106
(0.00428) (0.00695) (0.00458) (0.00593) (0.00847) (0.00889)
0.0110 0.0143 -0.000387 0.0104 0.0156 0.000518
(0.00756) (0.00989) (0.00362) (0.00813) (0.0106) (0.00625)
-0.0715* -0.0897 -0.108 -0.0595 -0.110 0.0418
(0.0423) (0.0611) (0.0775) (0.0645) (0.0726) (0.162)
-0.0803 -0.128 -0.0920 -0.0756 -0.155 0.0390
(0.0543) (0.108) (0.0773) (0.0803) (0.125) (0.163)
0.0544* 0.0761 0.0780 0.0506 0.0885 -0.0152
(0.0314) (0.0559) (0.0561) (0.0499) (0.0667) (0.118)
N 678 437 241 678 437 241
R2
0.015 0.024 0.022 0.011 0.014 0.011
Robust standard errors in parentheses
*** p<0.01, ** p<0.05, * p<0.1

38
Table 16. Abnormal and Cumulative abnormal returns after the Champions League’s game
Abnormal returns at event day t=1 CAR(1,4)
Full sample Group stage Playoff stage Full sample Group stage Playoff stage
0.000538 -0.00272 0.000609 0.00219 -0.000215 0.00284
(0.00555) (0.00994) (0.00648) (0.00729) (0.0114) (0.0105) -0.0154 -0.0261 0.00488 -0.0125 -0.0114 -0.0139
(0.0125) (0.0188) (0.00433) (0.0144) (0.0208) (0.0133)
-0.00694 -0.00978 -0.00409 -0.0116* -0.0121 -0.0110
(0.00422) (0.00665) (0.00470) (0.00597) (0.00821) (0.00912)
0.0109 0.0137 7.17e-05 0.0104 0.0149 0.00351
(0.00745) (0.00955) (0.00427) (0.00807) (0.0103) (0.00772) -0.00270 -0.0242 0.00260 0.00105 -0.0303 0.0170
(0.00701) (0.0251) (0.00675) (0.0106) (0.0267) (0.0158)
-0.0728* -0.0793 -0.103 -0.0590 -0.0967 0.0739
(0.0424) (0.0539) (0.0690) (0.0632) (0.0669) (0.155)
-0.0777 -0.0940 -0.0910 -0.0766 -0.112 0.0454
(0.0522) (0.0766) (0.0755) (0.0821) (0.0991) (0.162)
0.0553* 0.0671 0.0738 0.0502 0.0772 -0.0429 (0.0319) (0.0480) (0.0488) (0.0492) (0.0604) (0.111)
N 678 437 241 678 437 241 R
2 0.015 0.029 0.023 0.011 0.020 0.017
Robust standard errors in parentheses
*** p<0.01, ** p<0.05, * p<0.1

39
Table 17. Abnormal and Cumulative abnormal returns after the Champions League’s game
Abnormal returns at event day t=1 CAR(1,4)
Full sample Group stage Playoff stage Full sample Group stage Playoff stage
0.00165 -0.00157 -0.000686 0.00217 0.00141 -0.00294
(0.00578) (0.0103) (0.00584) (0.00768) (0.0119) (0.0110)
-0.0122 -0.0221 0.00364 -0.00990 -0.00777 -0.0156
(0.00981) (0.0153) (0.00463) (0.0121) (0.0178) (0.0131)
-0.0563 -0.0767 0.00616 -0.0583 -0.0781 0.0120
(0.0394) (0.0510) (0.00831) (0.0404) (0.0518) (0.0244)
0.0456 0.0622 -0.0102 0.0447 0.0628 -0.0120
(0.0323) (0.0407) (0.00674) (0.0331) (0.0414) (0.0194)
-0.00560 -0.0228 0.00321 -0.00367 -0.0272 0.0150
(0.00799) (0.0241) (0.00678) (0.0111) (0.0259) (0.0148)
-0.123* -0.163 -0.0695 -0.104 -0.183 0.150
(0.0730) (0.107) (0.0539) (0.0883) (0.121) (0.144)
-0.119 -0.179 -0.0667 -0.0982 -0.186 0.123
(0.0785) (0.145) (0.0633) (0.103) (0.167) (0.147)
:
0.0275 0.0362 -0.00389 -0.00485 0.0134 -0.0546
(0.0231) (0.0301) (0.0100) (0.0302) (0.0392) (0.0362)
-0.00207 0.00286 -0.0420** -0.0300
(0.00934) (0.0249) (0.0188) (0.0330)
0.0962 0.130 -0.0176 0.0661 0.106 -0.0669
(0.0716) (0.0919) (0.0138) (0.0755) (0.0963) (0.0536)
0.0527 0.0683 -0.00417 0.0199 0.0432 -0.0530
(0.0408) (0.0530) (0.0112) (0.0458) (0.0593) (0.0395)
-0.0120 -0.0193 0.00410 -0.0469** -0.0508* -0.0320
(0.00827) (0.0121) (0.00801) (0.0198) (0.0270) (0.0277)
-0.00357 -0.0167* 0.0156 -0.0432** -0.0477* -0.0321
(0.00912) (0.00904) (0.0194) (0.0211) (0.0269) (0.0343)
0.0566* 0.0856 0.0582 0.0739 0.118 -0.0503
(0.0340) (0.0692) (0.0393) (0.0559) (0.0908) (0.0953)
N 678 437 241 678 437 241
R2
0.068 0.113 0.038 0.058 0.096 0.042
Robust standard errors in parentheses
*** p<0.01, ** p<0.05, * p<0.1

40
Table 18. Abnormal and Cumulative abnormal returns after the Champions League’s game
Abnormal returns at event day t=1 CAR(1,4)
Full sample Group stage Playoff stage Full sample Group stage Playoff stage
0.00150 -0.00107 -0.000268 0.00107 0.00112 -0.00347
(0.00635) (0.0113) (0.00658) (0.00827) (0.0129) (0.0120)
-0.0144 -0.0229 0.00359 -0.0149 -0.00998 -0.0230
(0.0108) (0.0158) (0.00492) (0.0129) (0.0180) (0.0150)
-0.0615 -0.0814 0.00878 -0.0701 -0.0857 -0.00274
(0.0423) (0.0532) (0.00956) (0.0434) (0.0542) (0.0256)
0.0497 0.0672 -0.0106* 0.0505 0.0676 -0.00550
(0.0349) (0.0434) (0.00600) (0.0359) (0.0445) (0.0195)
-0.00381 -0.0195 0.00194 -0.00303 -0.0231 0.00931
(0.00756) (0.0224) (0.00632) (0.0105) (0.0244) (0.0132)
-0.101 -0.154 -0.0595 -0.0807 -0.158 0.169
(0.0653) (0.104) (0.0540) (0.0832) (0.117) (0.166)
-0.0961 -0.177 -0.0491 -0.0758 -0.163 0.145
(0.0703) (0.143) (0.0577) (0.0978) (0.163) (0.170)
:
0.0202 0.0250 0.000110 -0.0113 0.000672 -0.0439
(0.0174) (0.0231) (0.0116) (0.0252) (0.0335) (0.0344)
-0.00247 0.00152 -0.0394** -0.0310
(0.00981) (0.0236) (0.0170) (0.0301)
0.0962 0.125 -0.0157 0.0725 0.101 -0.0413
(0.0695) (0.0872) (0.0132) (0.0727) (0.0910) (0.0476)
0.0564 0.0701 -0.00820 0.0302 0.0479 -0.0368
(0.0424) (0.0532) (0.0117) (0.0461) (0.0582) (0.0362)
-0.0150 -0.0239* 0.00844 -0.0508** -0.0568** -0.0255
(0.0108) (0.0143) (0.0102) (0.0206) (0.0286) (0.0274)
-0.0118 -0.0268** 0.0174 -0.0537** -0.0607** -0.0331
(0.0122) (0.0122) (0.0231) (0.0232) (0.0298) (0.0390)
:
0.00200 0.00326 0.00161 -0.00473 -0.00144 -0.0190
(0.00606) (0.00766) (0.00954) (0.00828) (0.0100) (0.0160)
-0.000152 -0.000486 0.00365 -0.00816 -0.00380 -0.0162
(0.00597) (0.00778) (0.0105) (0.00850) (0.0106) (0.0155)
-0.00764 -0.00600 -0.00242 -0.0135* -0.0110 -0.0175
(0.00577) (0.00768) (0.00661) (0.00772) (0.00966) (0.0130)
-0.00390 -0.00290 0.000196 -0.0136* -0.0116 -0.0156
(0.00584) (0.00714) (0.00943) (0.00782) (0.00913) (0.0160)
-0.0176 -0.0201* 0.00430 -0.0341** -0.0331** -0.0223
(0.0109) (0.0110) (0.00789) (0.0136) (0.0148) (0.0181)
-0.0111 -0.0283 0.0257 -0.0347 -0.0366* -0.0212
(0.0182) (0.0178) (0.0284) (0.0223) (0.0205) (0.0416)
-0.0118 -0.0174 0.00878 0.00901 -0.00793 0.0405
(0.0230) (0.0323) (0.0106) (0.0291) (0.0400) (0.0299)
-0.0329 -0.0342 0.00127 -0.0457* -0.0460 -0.0278
(0.0241) (0.0291) (0.0112) (0.0263) (0.0321) (0.0246)
-0.0277* -0.0293* -0.00324 -0.0382* -0.0349* -0.0308
(0.0158) (0.0161) (0.0150) (0.0202) (0.0191) (0.0364)
-0.0199 -0.0232 0.00828 -0.0292* -0.0311* -0.0226
(0.0137) (0.0142) (0.0120) (0.0159) (0.0173) (0.0271)
-0.00864 -0.0107 0.00827 -0.0248** -0.0277** -0.0204
(0.00894) (0.0103) (0.00996) (0.0120) (0.0138) (0.0233)
0.0539 0.0983 0.0414 0.0802 0.127 -0.0559
(0.0345) (0.0732) (0.0400) (0.0564) (0.0919) (0.110)
N 678 437 241 678 437 241
R2
0.082 0.126 0.068 0.079 0.110 0.092
Robust standard errors in parentheses; Ajax AFC did not play any playoff games during 2010-2013;
*** p<0.01, ** p<0.05, * p<0.1
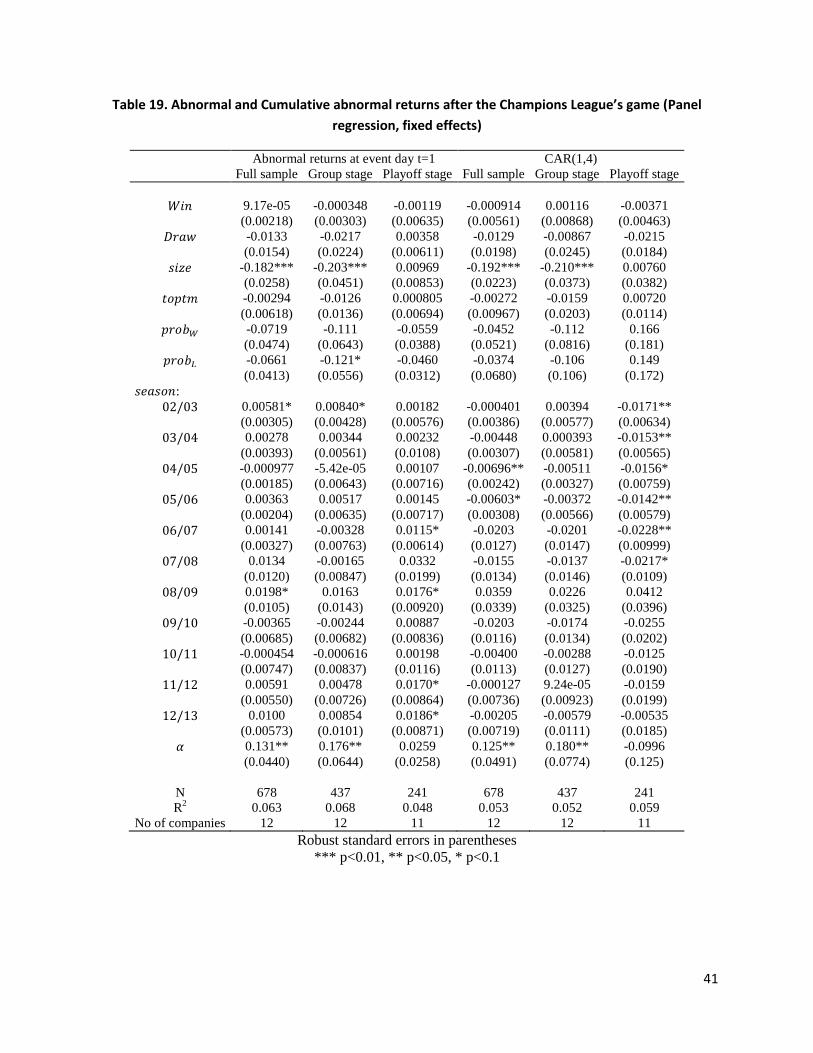
41
Table 19. Abnormal and Cumulative abnormal returns after the Champions League’s game (Panel
regression, fixed effects)
Abnormal returns at event day t=1 CAR(1,4)
Full sample Group stage Playoff stage Full sample Group stage Playoff stage
9.17e-05 -0.000348 -0.00119 -0.000914 0.00116 -0.00371
(0.00218) (0.00303) (0.00635) (0.00561) (0.00868) (0.00463)
-0.0133 -0.0217 0.00358 -0.0129 -0.00867 -0.0215
(0.0154) (0.0224) (0.00611) (0.0198) (0.0245) (0.0184)
-0.182*** -0.203*** 0.00969 -0.192*** -0.210*** 0.00760
(0.0258) (0.0451) (0.00853) (0.0223) (0.0373) (0.0382)
-0.00294 -0.0126 0.000805 -0.00272 -0.0159 0.00720
(0.00618) (0.0136) (0.00694) (0.00967) (0.0203) (0.0114)
-0.0719 -0.111 -0.0559 -0.0452 -0.112 0.166
(0.0474) (0.0643) (0.0388) (0.0521) (0.0816) (0.181)
-0.0661 -0.121* -0.0460 -0.0374 -0.106 0.149
(0.0413) (0.0556) (0.0312) (0.0680) (0.106) (0.172)
:
0.00581* 0.00840* 0.00182 -0.000401 0.00394 -0.0171**
(0.00305) (0.00428) (0.00576) (0.00386) (0.00577) (0.00634)
0.00278 0.00344 0.00232 -0.00448 0.000393 -0.0153**
(0.00393) (0.00561) (0.0108) (0.00307) (0.00581) (0.00565)
-0.000977 -5.42e-05 0.00107 -0.00696** -0.00511 -0.0156*
(0.00185) (0.00643) (0.00716) (0.00242) (0.00327) (0.00759)
0.00363 0.00517 0.00145 -0.00603* -0.00372 -0.0142**
(0.00204) (0.00635) (0.00717) (0.00308) (0.00566) (0.00579)
0.00141 -0.00328 0.0115* -0.0203 -0.0201 -0.0228**
(0.00327) (0.00763) (0.00614) (0.0127) (0.0147) (0.00999)
0.0134 -0.00165 0.0332 -0.0155 -0.0137 -0.0217*
(0.0120) (0.00847) (0.0199) (0.0134) (0.0146) (0.0109)
0.0198* 0.0163 0.0176* 0.0359 0.0226 0.0412
(0.0105) (0.0143) (0.00920) (0.0339) (0.0325) (0.0396)
-0.00365 -0.00244 0.00887 -0.0203 -0.0174 -0.0255
(0.00685) (0.00682) (0.00836) (0.0116) (0.0134) (0.0202)
-0.000454 -0.000616 0.00198 -0.00400 -0.00288 -0.0125
(0.00747) (0.00837) (0.0116) (0.0113) (0.0127) (0.0190)
0.00591 0.00478 0.0170* -0.000127 9.24e-05 -0.0159
(0.00550) (0.00726) (0.00864) (0.00736) (0.00923) (0.0199)
0.0100 0.00854 0.0186* -0.00205 -0.00579 -0.00535
(0.00573) (0.0101) (0.00871) (0.00719) (0.0111) (0.0185)
0.131** 0.176** 0.0259 0.125** 0.180** -0.0996
(0.0440) (0.0644) (0.0258) (0.0491) (0.0774) (0.125)
N 678 437 241 678 437 241
R2
0.063 0.068 0.048 0.053 0.052 0.059
No of companies 12 12 11 12 12 11
Robust standard errors in parentheses
*** p<0.01, ** p<0.05, * p<0.1