![[PPT]GIS Tutorial 1 - Basic Workbook - South Broward High …southbrowardreefdogs.com/resources/PPT_Lectures/Lecture1... · Web viewOutline GIS overview GIS data and layers GIS applications](https://static.fdocuments.in/doc/165x107/5b0762277f8b9a93418e1e82/pptgis-tutorial-1-basic-workbook-south-broward-high-viewoutline-gis-overview.jpg)
Basic GIS Work Book - University of Alaska...
37
Basic GIS Work Book For ArcMap 10.2
Transcript of Basic GIS Work Book - University of Alaska...

Basic GISWork Book
For ArcMap 10.2

What is GIS
What is ArcGIS License levels
Data view
Tool Bars Data frame Table of Contents Data Basemaps Symbology Tables Windows
ArcCatalog Folder Connections
Editing Edit data Create Data
Analysis Tools Buffer
Layout view
Insert elements Index map Grids Export

Basic GIS
Topic: Problem:
Solution:
Data used:
License:
GIS 4
Installing Class Data
USB Stick , CD or Zip file
Basic
All the data you need for this class is in one folder. Transfer the Folder BasicClass to C:\Student\. If the student folder doesn’t exist then create on first.

Basic GIS
GIS 5
Topic: Problem:
Solution:
Data used:
License:
First we will review some of the main tool bars
to Add data This open other windows Table of contents ArcCatalog / Search ArcTools / Python Graphic select (not for editing) HTML popup Model Builder
Hyperlink go to x,y Navigation tools Measure
The drawing tool bar is good for adding graphics or text to either the editing view or layout view
ArcMap So many windows buttons and tool bars
Explore ArcMap
Basic

Basic GIS
Topic: Problem:
Solution:
Data used:
License:
GIS 6
Rig
ht cl
ick
on em
pty
spac
e to
see
othe
r too
l ba
rs
Cre
ate
feat
ure
win
dow
Dat
a Fr
ame
Tabl
e of
C
onte
nts
Dat
a V
iew

Basic GIS
7 GIS
In the data frame properties you can change its appearance, the coordinate system and add grati-cules .
In the general tab

Basic GIS
GIS 8
Data Frame
Layers
Change the view of the TOC
List by drawing order
List by sourceList by visibilityList by selectionoptions
Check the box to make it selectable
Not selectable
Table of Contents: TOC
Basic GIS
GIS 9
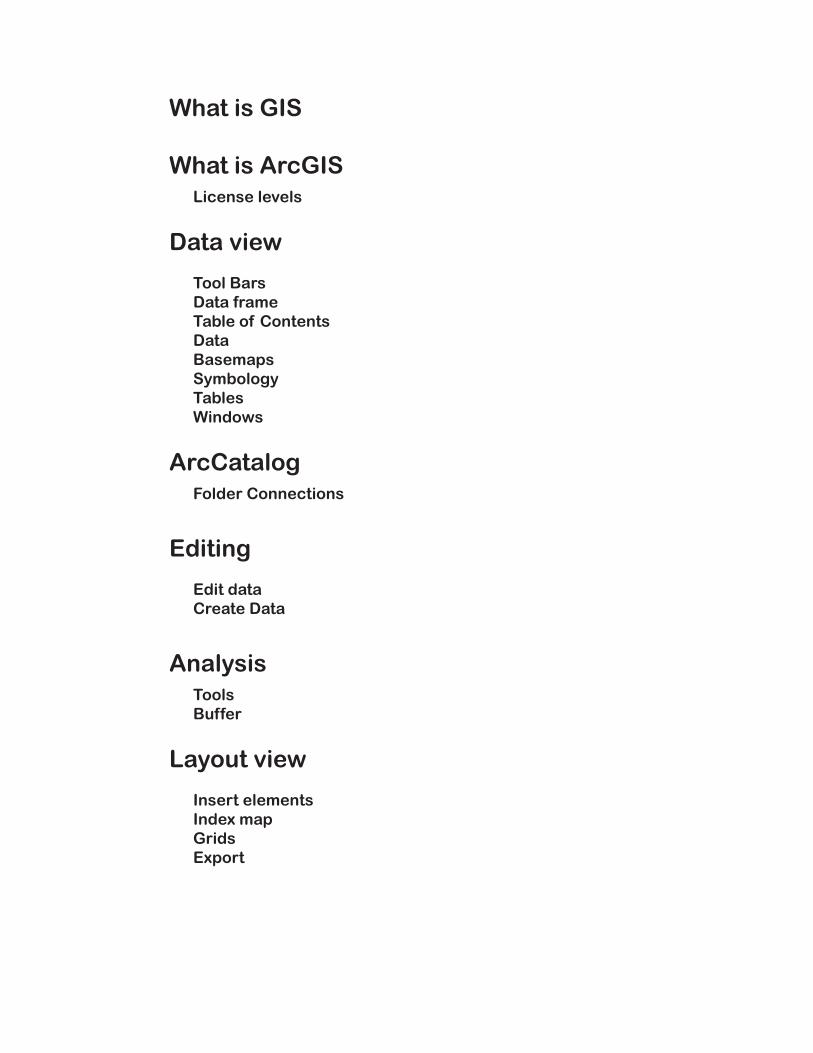
By right-clicking on the layer you can access its table and properties.
In the properties window you can change the symbology of the layer. You can also view or change the source, set transparencies or set scale limits.

Basic GIS
GIS 10
Symbology can be set by selecting from the library of symbols
or by selecting on the edit symbol button and customizing your own
In the table, you can view and edit attributes. You can also sort and calculate values as well as add and delete fields, create graphs and reports.

Basic GIS
11 GIS
Add Basemaps
Next to the add data button there is a black down arrow, if you click on that you will see more options.
The add basemap button will give you a set selection of base maps from ESRI
Add Data from ArcGIS Online will open a window that allows you to search for all layers available to the public contributed by the public.
Basic GIS
GIS 12
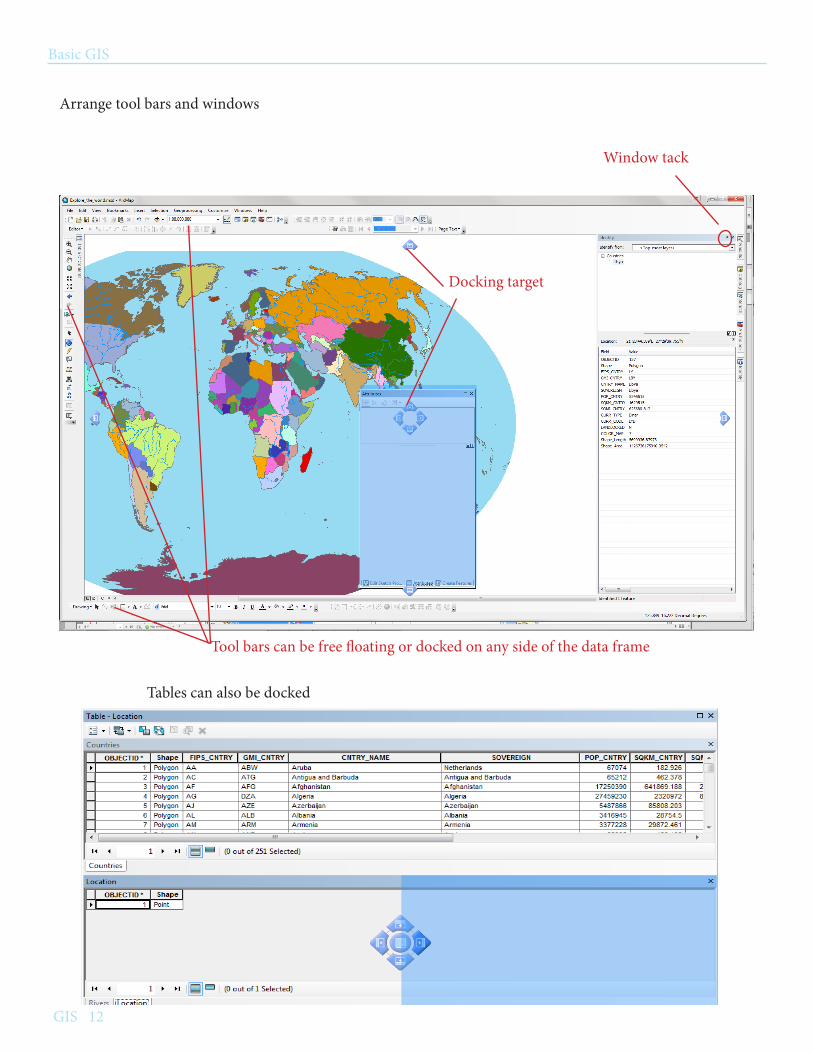
Arrange tool bars and windows
Docking target
Window tack
Tool bars can be free floating or docked on any side of the data frame
Tables can also be docked
Basic GIS
GIS 13
Topic: Problem:
Solution:
Data used:
License:
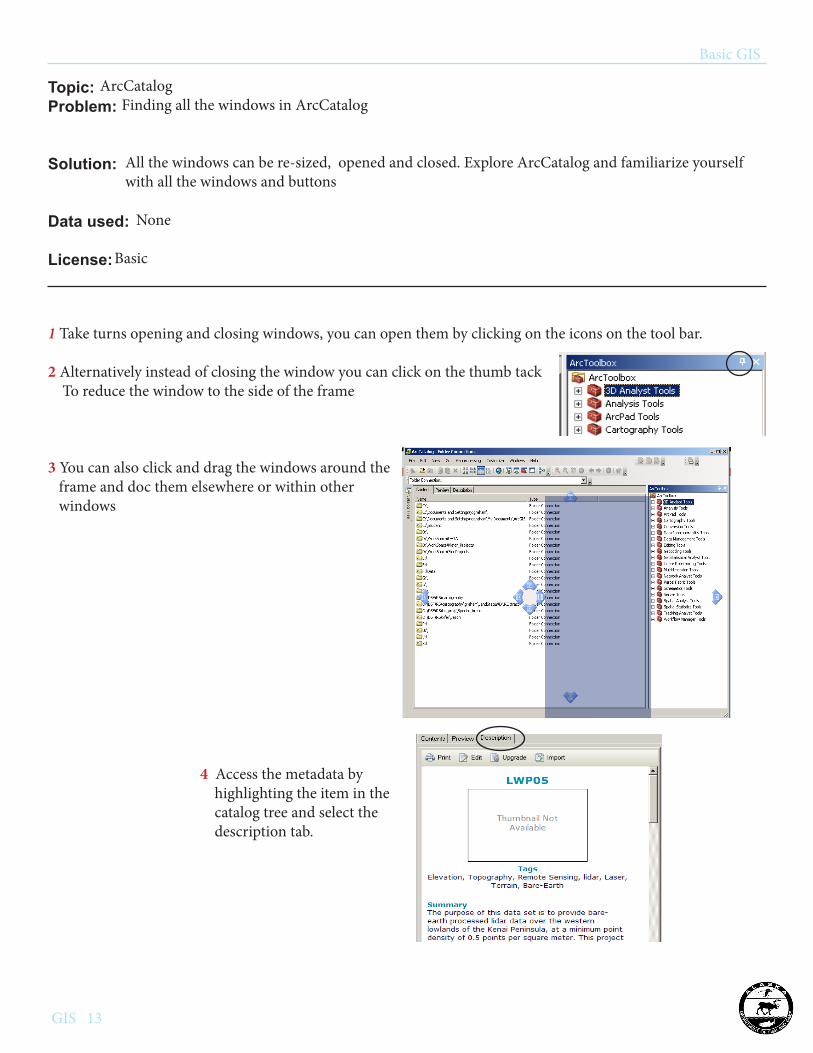
ArcCatalog Finding all the windows in ArcCatalog
All the windows can be re-sized, opened and closed. Explore ArcCatalog and familiarize yourself with all the windows and buttons
None
Basic
1 Take turns opening and closing windows, you can open them by clicking on the icons on the tool bar.
2 Alternatively instead of closing the window you can click on the thumb tack To reduce the window to the side of the frame
3 You can also click and drag the windows around the frame and doc them elsewhere or within other windows
4 Access the metadata by highlighting the item in the catalog tree and select the description tab.
Basic GIS
GIS 14
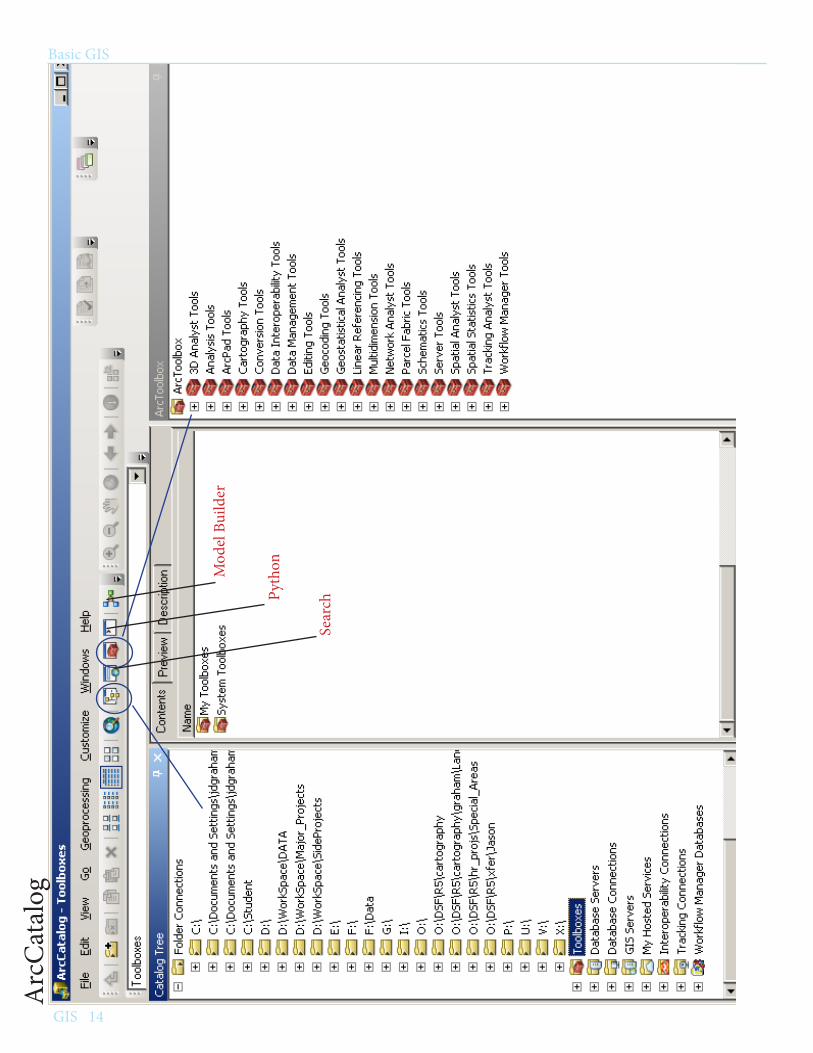
Arc
Cat
alog
Sear
chPyth
onMod
el B
uild
er

Basic GIS
GIS 15
Topic: Problem:
Solution:
Data used:
License:
Explore_the_world.mxd Try out arc map on your own
Explore_the_world.mxd
Basic
Navigate to the folder you installed the data to \GIS-CLass\Data\BasicClass\BigPicture and double click on the Explore_the_worls.mxd to open the ArcMap project
Open the table of contents and examine the data.
How many are selectable?
What country is the x on?
Zoom to the Danube River
Basic GIS
GIS 16
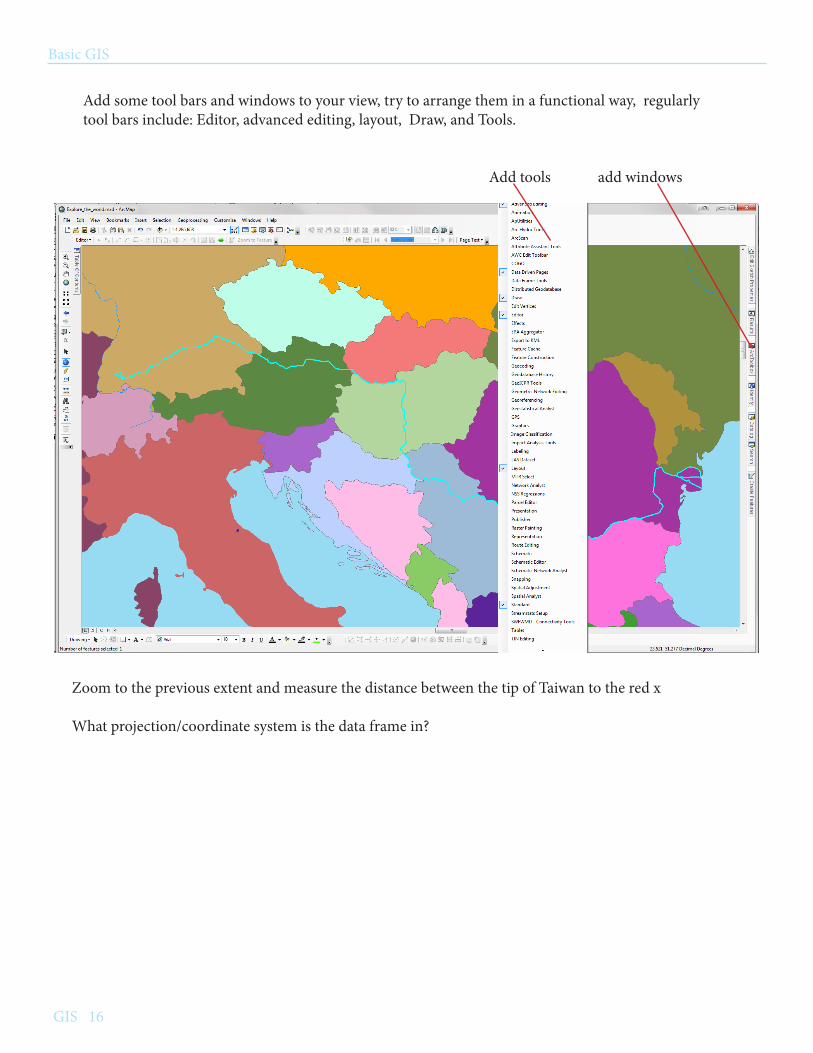
Add some tool bars and windows to your view, try to arrange them in a functional way, regularly tool bars include: Editor, advanced editing, layout, Draw, and Tools.
Add tools add windows
Zoom to the previous extent and measure the distance between the tip of Taiwan to the red x
What projection/coordinate system is the data frame in?

Basic GIS
GIS 17
Topic: Problem:
Solution:
Data used:
License:
Editing Learn how to create and edit points, lines and polygons
Basic
From Editng.gdb: Roads, Parcels, Facilities_Albers
Open a new arc map and add the Three layers to your map. Save the project as Editing.mxd. Open the layer properties for the parcels layer and go to the Symbology tab. Select Categories and in the Value Field pull down, select OWNTYPE and then on the row of buttons below click Add All Values
1 Right click on a symbol and select Properties for Selected Symbol, change its color
2 Click on Style References and check out some of the other styles available, check the box next to one to bring in.
3 Do the same for the facilities layer, set the value field to Category, select the symbol for Library,In the symbol selector window search for Li-brary and choose a new symbol, Change some of the other symbols

Basic GIS
GIS 18
Change the data frame view to Data View, find the Edit tool barClick on the Editor button and select start editing and select the Parcels layer
Click on the Editor button and select snapping, and open the snapping tool bar
Select all the buttons to enable snapping
On the main toolbar select Selection and Select by attribute and follow this example
Under Selection again, select zoom to selected
Parcel ID : 17504005

Basic GIS
19 GIS
From the Editor tool bar select the Cut Polygon Tool.
We are going to divide this parcel, the first step is to click on the center point on the bottom of the parcel. Follow the line to the right, then right-clickand select Perpendicular. Next, double click on the center of the top of the parcels, this will split the parcel in two
1
2
34
5
6
Now we will split in half the parcel on the left. With only that parcel highlighted, select the split polygon tool again, click in the space out side of the polygon to the right, then click on the midpoint tool as seen above. Now click on the four corners and double click outside of the polygon to the left, as the points are numbered to the left.
Right click on the northern parcel and select Attributes,in the Owner field, change the name to John Smith
Save your edits and stop editing
Basic GIS
GIS 20
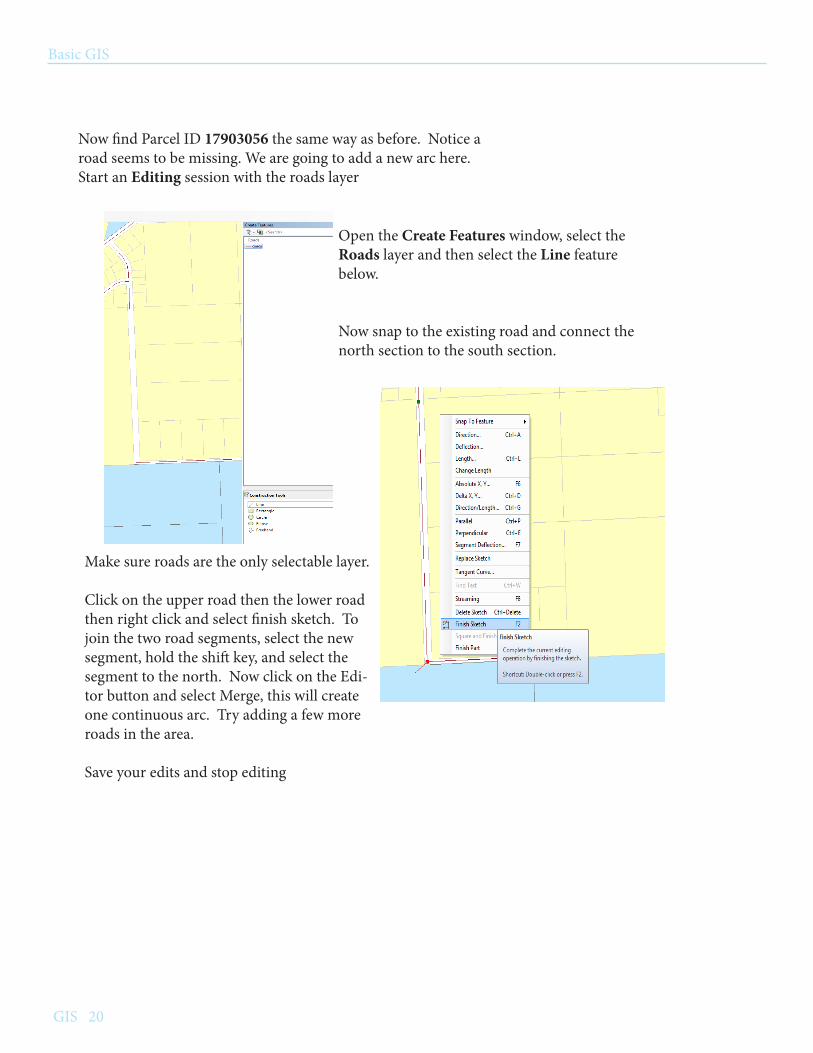
Now find Parcel ID 17903056 the same way as before. Notice aroad seems to be missing. We are going to add a new arc here. Start an Editing session with the roads layer
Open the Create Features window, select the Roads layer and then select the Line feature below.
Now snap to the existing road and connect the north section to the south section.
Make sure roads are the only selectable layer.
Click on the upper road then the lower road then right click and select finish sketch. To join the two road segments, select the new segment, hold the shift key, and select the segment to the north. Now click on the Edi-tor button and select Merge, this will create one continuous arc. Try adding a few more roads in the area.
Save your edits and stop editing

Basic GIS
GIS 21
Topic: Problem:
Solution:
Data used:
License:
Creating data Creating new data and adding it to a database
Parcels,Roads, NHD_Area., Facilities_Albers from Editing.gdb
Basic
Open the ArcCatalog window in ArcMap and locate the Editing.gdb
Right-click on the .gdb and select New/Feature Dataset. Name it New_Data and set the projection to Alaskan Albers. Leave the rest as default. Right-Click on the new dataset and add a new Feature Class
Name the new Feature Class New_Parcels,and set type as Polygon, click next. Next then add a new field named NAME and set data type to Text.
When finished the new layer will automat-ically come into the open project.
Start an Editing session for New_Parcels.Zoom to the Alaska Islands & Ocean visi-tor center and select the two parcels
If you dont know where it is, use the facili-ties layer
Select copy and paste and be sure to select the target as New_Parcelsthen merge the parcels

Basic GIS
GIS 22
I want to add this other three par-cels associated with the rebut not the portion under the water. For this we will use the trace tool.
Open the Create Feature windowand select the New_Parcels layer, now select on the Trace tool. To draw a new parcel click on the edge of the parcel, trace around, then double click when you reach the beginning point. Trace the selected parcels and exclude the hydrography.
Save and stop editing
Trace tool

Basic GIS
GIS 23
Topic: Problem:
Solution:
Data used:
License:
Analysis
Basic
Determining proximity and distribution of fire stations
Buffer and multi buffer
Facilities, Parcels, Roads, Editing.gdb
Turn off the Parcels layer and zoom to the full extent of the Facilities layers. We are only working with the Firestations so use a definition query in the layers properties, as below.
First we will use the geoprocessing tool from the tool bar. Select Geoprocessing from the tool bar then Buf-fer, use the Facilities layer and be sure to save it to your New_Data dataset, buffer to 3 miles and click OK.
With this analysis we can only see 3 miles out from the Fire station, what if we want to see at more intervals? Create More Buffers?

Basic GIS
GIS 24
Now we can use multi ring buffer. Open the ArcToolbar window, go to Analysis tools/ Proximity/ Multiple Ring Buffer and enter the wizard as below
Multiple rings should give us a bet-ter idea for response times of the fire trucks.
To add labels to the rings go to the layer Properties window
Under Labels select Expression and enter as it is on the left. click OK
Make the text and add a white halo so it shows up better. You can find it in Symbol/ Edit Symbol/ Mask
Be sure to select ALL rather then NONE under dissolve, this will give us rings rather than circles
Basic GIS
GIS 25
Topic: Problem:
Solution:
Data used:
License:
Clipping Sometimes layers over lap and need to be clipped to match the edges
The Clipping tool will automate this process
FH_Multi_Buffer, Alaska_Clipped, addressPoints in Editing.gdb
Basic
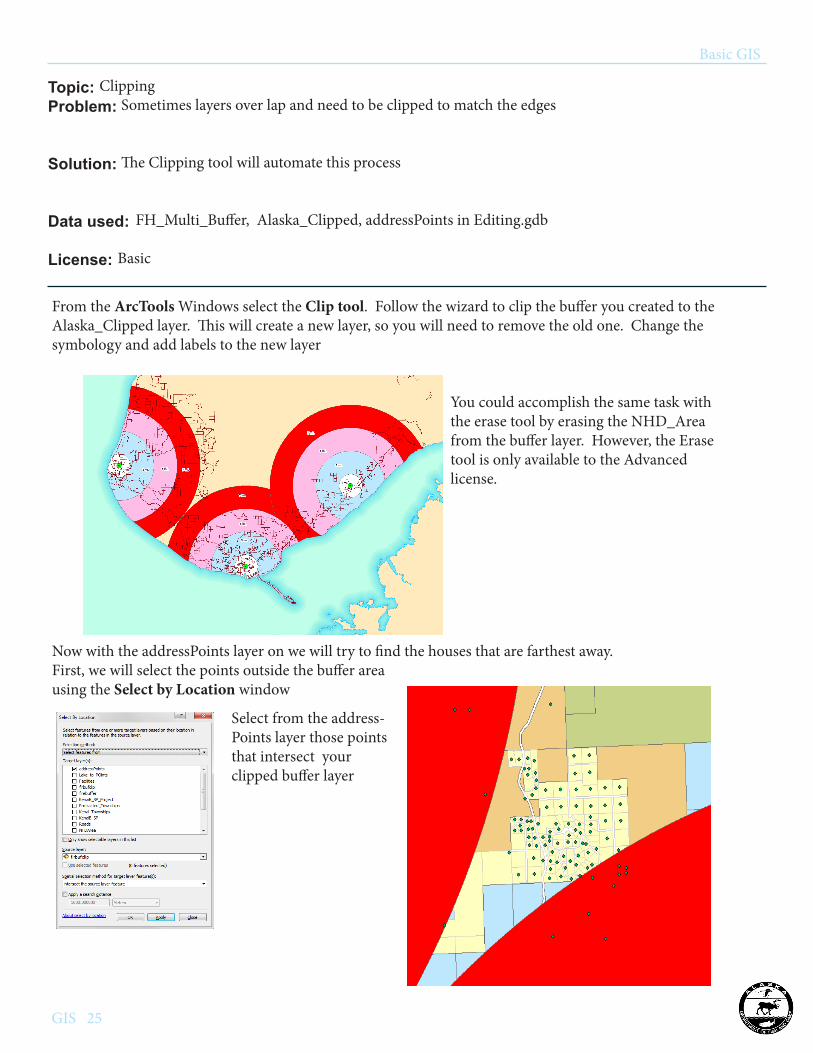
From the ArcTools Windows select the Clip tool. Follow the wizard to clip the buffer you created to the Alaska_Clipped layer. This will create a new layer, so you will need to remove the old one. Change the symbology and add labels to the new layer
You could accomplish the same task with the erase tool by erasing the NHD_Area from the buffer layer. However, the Erase tool is only available to the Advanced license.
Now with the addressPoints layer on we will try to find the houses that are farthest away.First, we will select the points outside the buffer areausing the Select by Location window
Select from the address-Points layer those points that intersect your clipped buffer layer

Basic GIS
GIS 26
Open the attribute table for Addresspts and select the Switch Selection buttonnow just the addressPoints out side the buffered areas should be selected.
Next, use the Select Features tool and select the 7 mile ring of the buffer layer. Be sure to hold down the Shift key or you will lose your other selection.
Now go back to the Select by Location and perform the same selection except:
select Add to the selections
and select Use Selected features
In the attribute table change the view to see only the selected records. Add a new field and call it FireType, type = short in-teger. and use the Field Calculator to set the selected records to 1.

Basic GIS
GIS 27
Topic: Problem:
Solution:
Data used:
License:
Finding anadromous water bodies Sorting through the data to find what you need
Using various methods to select out and manipulate wanted data
SwtPoints, SwtArcs, NHD_Lakes, StudyArea From AWCClass.gdb
Basic
Start a new project and add the listed layers. Examine the data , SwtPoints and SwtArcs are layers from the Anadromous Waters Catalog(AWC) for a portion of the Southwest region. The arcs are the portions of stream with known anadromous fish, the points indicate the upper and lower extents as well as mid points that depict life stage changes.
NHD_Lakes is a clipped portion from the National Hydrographic Dataset(NHD), the hydrographic standard used by the department. The Study area is clipped from the Hydrographic Units , a part of NHD that depicts watershed boundaries.
For this project we are tasked with investigating lakes to possibly add to the AWC catalog.
We want to find lakes that are connected to anadromous streams and create a GPS point for the mouth of each lake. Create a definition query on the SWTPoints layer. Open the layer proporties and navigate to the Defini-tion query tab, use the SQL statement TYPE = ‘UPPER’ Also create one for NHD_Lakes, use the SQL state-ment Shape_Area > 0.00005
Now use the Select by Location window to Select from the SWT_Points layer that are within distance of the source layer and apply a 100 meter search distance, how many more lakes did that add?
Right-click on the SWTPoints layer in the TOC and select Data / Export Data.
Save it to your AWCClass.gdb and turn off the NHD_Lakes layer.
Basic GIS
GIS 28
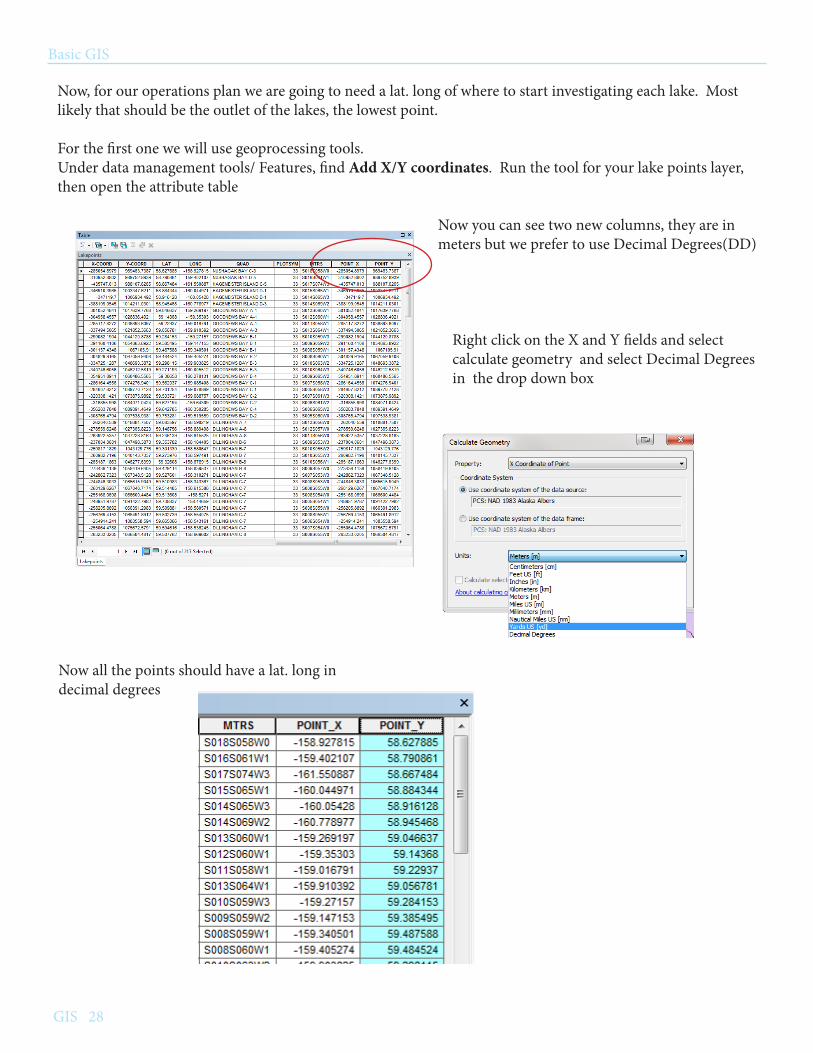
Now, for our operations plan we are going to need a lat. long of where to start investigating each lake. Most likely that should be the outlet of the lakes, the lowest point.
For the first one we will use geoprocessing tools. Under data management tools/ Features, find Add X/Y coordinates. Run the tool for your lake points layer, then open the attribute table
Now you can see two new columns, they are in meters but we prefer to use Decimal Degrees(DD)
Right click on the X and Y fields and select calculate geometry and select Decimal Degrees in the drop down box
Now all the points should have a lat. long in decimal degrees

Basic GIS
GIS 29
Topic: Problem:
Solution:
Data used:
License:
Layout View Exploring the Layout view
Basic
On the standard tool bar, click on File then select Page and Print Setup. If you are creat-ing a map to be printed, this is where you set the size and orientation of the page
On the same tool bar, click on View then select Layout

Basic GIS
GIS 30
Layo
ut V
iew
Fram
e 1
Fram
e 2
Exte
nts
Gra
ticul
es
IND
EX M
AP

Basic GIS
GIS 31
Insert elements in the layout view
The Insert tab on the standard tool bar give you the option to add the basic ele-ments of a map to your layout.
Title Legend Scale bar North Arrow Etc.
An index map can be created by inserting a second data frame. The new data frame can have a different extent and coordinate system.
In the Extent Indicators tab in the data frame propertieswindow, you can connect the two data frames in order to see the extent of one in the other.
Close the projectdon’t save

Basic GIS
GIS 32
All of the Elements have Wizards that allow you to customize them.
The layout tool bar only works in Layout view
Navigation tools change the focus to the data frame So that you can edit in layout view
You can also use templates to easily create an organized layout

Basic GIS
GIS 33
Topic: Problem:
Solution:
Data used:
License:
Layout: make a map
Once you have all your data looking the way you want, switch to layout view to make a final product. The map can then be saved into various digital formats or be printed
Facilities, Parcels_Albers, Roads , FH_Multi_Buffer, Alaska_Clipped, NHDArea, SwtArcs, NHD-Waterbody
Basic
Start a new project with the data listed above.
Open the File/ Page and printer setup
Change the layout to landscape
Insert the map elements(scale bar, North Arrow, Title) and a new Data frame
Add the Alaska layer to the new data frame
Go into the properties of the new data frame and change the name to “Inset”
Next, go to the Extent Indicator tab and move the Layers data frame into the box on the right. You can keep the defaults or go into the Options button and change the extents appearance.
Basic GIS
GIS 34
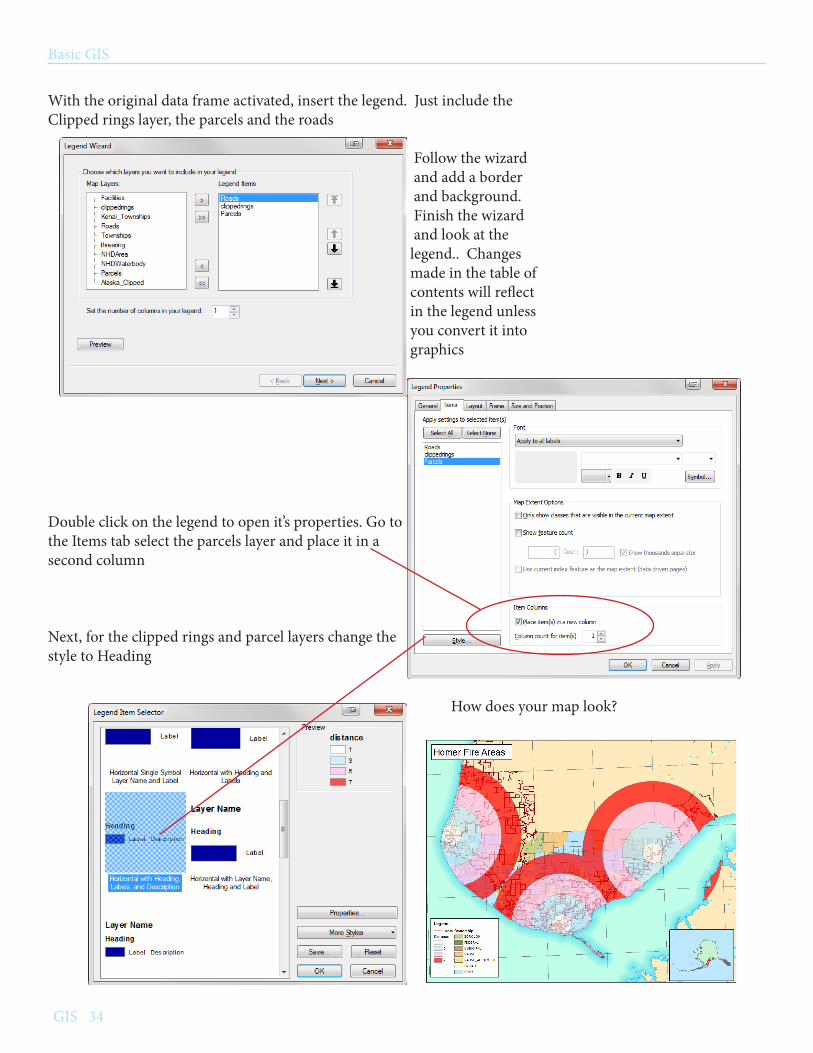
With the original data frame activated, insert the legend. Just include the Clipped rings layer, the parcels and the roads
Follow the wizard and add a border and background. Finish the wizard and look at the legend.. Changes made in the table of contents will reflect in the legend unless you convert it into graphics
Double click on the legend to open it’s properties. Go to the Items tab select the parcels layer and place it in a second column
Next, for the clipped rings and parcel layers change the style to Heading
How does your map look?

Basic GIS
GIS 35
Topic: Problem:
Solution:
Data used:
License:
Converting graphics into Feature Classes Clipping Data
\BasicClass\Editing\Editing.gdb Parcels
Basic
Polygons: Will create a polygon to use as a clipping feature
1. Add Parcels layer to ArcMap. With the Rectangle tool from the Draw toolbar draw a rectangle smaller that the Parcels area.
2. To convert the graphic into a feature, right-click the Data Frame name in the TOC & select “convert Graphics to Features”. Name the new feature Clipper. Also, check the “Automatically delet graphics after conversion” box at bottom. Add to map.
3. Got to Geoprocessing tab on the menu & choose Clip. Add Par-cels as Input Feature and Clipper as Clip Features. Then OK. You’ve created your own custom clipping shape.
Points: Will add points and coordinates to label on a map
1. Using GO TO XY tool – You can type in an XY coordinates to locate them; then make coordinates into a feature class.
Basic GIS
GIS 36
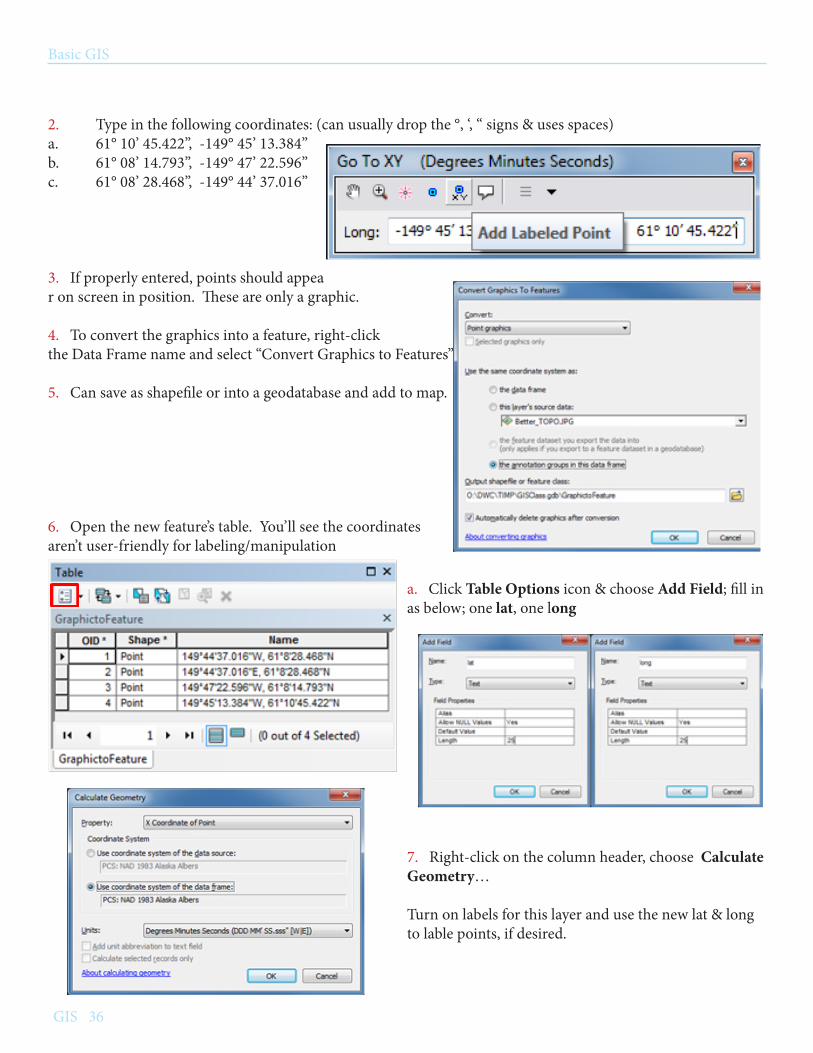
2. Type in the following coordinates: (can usually drop the °, ‘, “ signs & uses spaces)a. 61° 10’ 45.422”, -149° 45’ 13.384”b. 61° 08’ 14.793”, -149° 47’ 22.596”c. 61° 08’ 28.468”, -149° 44’ 37.016”
3. If properly entered, points should appear on screen in position. These are only a graphic.
4. To convert the graphics into a feature, right-click the Data Frame name and select “Convert Graphics to Features” 5. Can save as shapefile or into a geodatabase and add to map.
6. Open the new feature’s table. You’ll see the coordinates aren’t user-friendly for labeling/manipulation
a. Click Table Options icon & choose Add Field; fill in as below; one lat, one long
7. Right-click on the column header, choose Calculate Geometry…
Turn on labels for this layer and use the new lat & long to lable points, if desired.

Basic GIS
37 GIS
Data Sources
http://www.asgdc.state.ak.us/
http://www.alaskamapped.org/
http://nationalmap.gov/
http://nhd.usgs.gov/data.html
http://www2.borough.kenai.ak.us/GISDept/
https://github.com/
http://gis.stackexchange.com/questions
Resourceshttp://www.esri.com/training/main
esrihttp://www.esri.com/
ArcGIS Desktop Free TrialHttp://www.esri.com/software/arcgis/arcgis-for-desktop/free-trial