Bank of America Merrill Lynch Banking & Financial Services Conference · 2011-11-15 · Bank of...
36
November 15, 2011 Bank of America Merrill Lynch Banking & Financial Services Conference
Transcript of Bank of America Merrill Lynch Banking & Financial Services Conference · 2011-11-15 · Bank of...

November 15, 2011
Bank of America Merrill Lynch
Banking & Financial Services Conference

Forward-Looking Statements
This presentation contains statements that relate to the projected performance of Zions Bancorporation
and elements of or affecting such performance, including statements with respect to the beliefs, plans,
objectives, goals, guidelines, expectations, anticipations and estimates of management. These
statements constitute forward-looking information within the meaning of the Private Securities
Litigation Reform Act. Actual facts, determinations, results or achievements may differ materially from
the statements provided in this presentation since such statements involve significant known and
unknown risks and uncertainties. Factors that might cause such differences include, but are not limited
to: competitive pressures among financial institutions; economic, market and business conditions,
either nationally or locally in areas in which Zions Bancorporation conducts its operations, being less
favorable than expected; changes in the interest rate environment reducing expected interest margins;
changes in debt, equity and securities markets; adverse legislation or regulatory changes; and other
factors described in Zions Bancorporation’s most recent annual and quarterly reports. In addition, the
statements contained in this presentation are based on facts and circumstances as understood by
management of the company on the date of this presentation, which may change in the future. Zions
Bancorporation disclaims any obligation to update any statements or to publicly announce the result of
any revisions to any of the forward-looking statements included herein to reflect future events,
developments, determinations or understandings.
2

Agenda
Overview of Zions
Key Performance Drivers
–Capital
–Revenue
–Credit Quality
Outlook Summary

A Collection of Great Banks
Bank Headquarters Offices Assets Deposits
Zions Bank Salt Lake City 133 $16.2B $13.7B
CB&T San Diego 103 $10.8B $9.3B
Amegy Houston 82 $11.3B $8.8B
NBA Phoenix 74 $4.5B $3.7B
NSB Las Vegas 53 $4.2B $3.6B
Vectra Denver 39 $2.3B $1.9B
Commerce-WA Seattle 1 $0.9B $0.7B
Commerce-OR Portland 1 $0.07B $0.05B
Asset and deposit balances as of 3Q 2011
$51.5 billion in assets as of 9/30/2011
$3.0 billion market capitalization as of 11/10/2011
4

Multi-Bank Model Competitive Strengths
Superior lending capacity relative to community banks
Superior local customer access to bank decision makers relative to
big nationals
Sharing best practices among banks
– CEOs & division managers meet frequently
Community bank feel – local marketing and branding
Centralization of processing and other non-customer facing elements
of the business
Established market-leading small business lender
– Leading SBA and small business lender
– Superior treasury management products & services (Greenwich survey)
Strategic local “ownership” of market opportunities and challenges
5

Small Business Banking:
National Awards:
• Overall Satisfaction
• Overall Treasury Management
Regional Awards:
• Overall Satisfaction – West
• Overall Satisfaction – Treasury Management – West
What Others Say About Us
2010 Greenwich Excellence Awards
in Small Business and Middle Market Banking
Middle Market Banking
National Awards:
• Overall Satisfaction
• Relationship Manager Performance
• Credit Policy
• Overall Treasury Management
• Accuracy of Operations
• Customer Service
• Treasury Product Capabilities
• Treasury Sales Specialist Performance
Regional Awards:
• Overall Satisfaction – West
• Overall Satisfaction – Treasury Management – West
6

*Includes home equity, construction and other consumer real estate, bankcard and other revolving plans, FDIC and other loan types.
Strong Focus on Business Banking – Loan Mix
Loan Portfolio as of 3Q11
Commercial and CRE Loans: 79%
Retail & Other Loans: 21%
Change in portfolio composition since December 2007
-10%
-5%
0%
5%
10%
15%
20%
25%
30%
35%
C&
I
Ow
ner
Occ
CR
E T
erm
Resi C
on
str
Com
m'l
Con
str
Con
su
mer:
1-4
Fam
ily
Oth
er*
12/31/07 09/30/11 Change
7

Agenda
Overview of Zions
Key Performance Drivers
–Capital
–Revenue
–Credit Quality
Outlook Summary

0%
2%
4%
6%
8%
10%
12%
14%
16%
18%
ASB
C
EWB
C
BO
KF
BP
OP
FHN
CY
N
KE
Y
HB
AN
ZIO
N
FITB
CM
A
BB
T
SNV
STI
RF
WFC
USB
MT
B
Tier 1 Common Capital Total Reserves
Tier 1 Common + Reserves as a Percentage of Risk-Weighted Assets
Note: Peer group includes U.S. regional banks with assets greater than $20 billion and less than $200 billion plus footprint competitors WFC and USB.
Reserves include loan loss reserve plus reserve for unfunded lending commitments.
Source: Zions , company documents as of 3Q11; Peers, SNL as of 2Q11.
Capital Ratios as of 3Q11:
Tier 1 Common: 9.5%
Tier 1 Risk-Based: 16.0%
Total Risk-Based: 18.0%
9

Comparatively Stronger Loan Loss Coverage
Source: Zions , company documents as of 3Q11; Peers, SNL as of 2Q11.
Annualized charge-off ratio. Reserves include loan loss reserve plus reserve for unfunded lending commitments.
50%
100%
150%
200%
250%
300%
350%
20
08
Q1
20
08
Q2
20
08
Q3
20
08
Q4
20
09
Q1
20
09
Q2
20
09
Q3
20
09
Q4
20
10
Q1
20
10
Q2
20
10
Q3
20
10
Q4
20
11
Q1
20
11
Q2
20
11
Q3
Reserves to Net Charge-Offs Ratio
ZION Peer Median U.S. Comm'l Banks
10
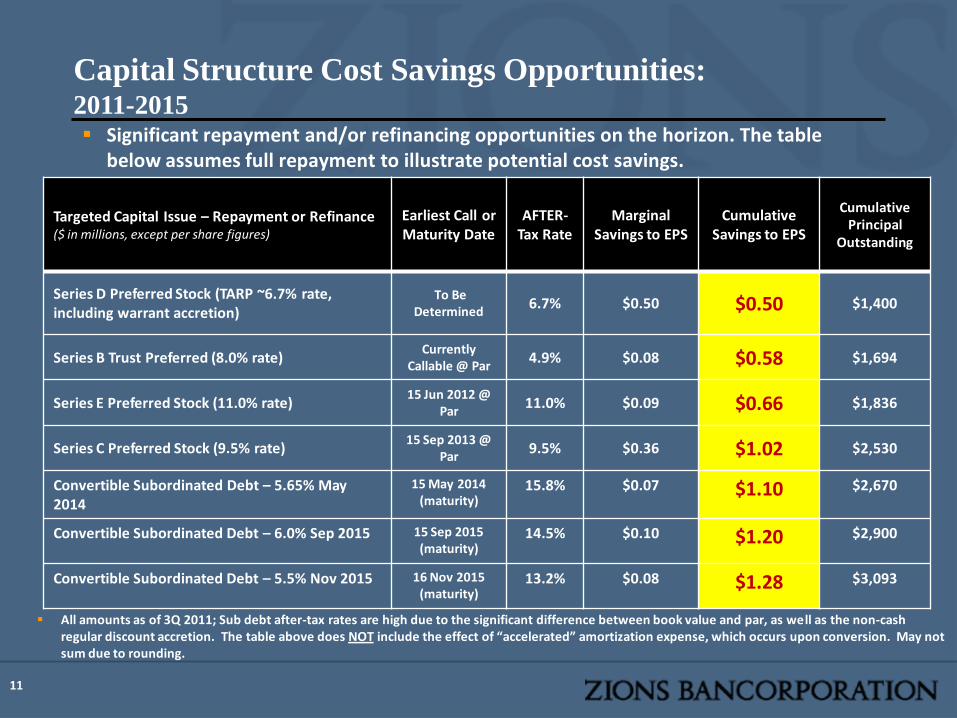
Capital Structure Cost Savings Opportunities:2011-2015
Targeted Capital Issue – Repayment or Refinance($ in millions, except per share figures)
Earliest Call or Maturity Date
AFTER-Tax Rate
Marginal Savings to EPS
Cumulative Savings to EPS
Cumulative Principal
Outstanding
Series D Preferred Stock (TARP ~6.7% rate, including warrant accretion)
To Be Determined
6.7% $0.50 $0.50 $1,400
Series B Trust Preferred (8.0% rate)Currently
Callable @ Par4.9% $0.08 $0.58 $1,694
Series E Preferred Stock (11.0% rate)15 Jun 2012 @
Par11.0% $0.09 $0.66 $1,836
Series C Preferred Stock (9.5% rate)15 Sep 2013 @
Par9.5% $0.36 $1.02 $2,530
Convertible Subordinated Debt – 5.65% May 2014
15 May 2014 (maturity)
15.8% $0.07 $1.10 $2,670
Convertible Subordinated Debt – 6.0% Sep 2015 15 Sep 2015 (maturity)
14.5% $0.10 $1.20 $2,900
Convertible Subordinated Debt – 5.5% Nov 2015 16 Nov 2015 (maturity)
13.2% $0.08 $1.28 $3,093
Significant repayment and/or refinancing opportunities on the horizon. The table below assumes full repayment to illustrate potential cost savings.
All amounts as of 3Q 2011; Sub debt after-tax rates are high due to the significant difference between book value and par, as well as the non-cash regular discount accretion. The table above does NOT include the effect of “accelerated” amortization expense, which occurs upon conversion. May not sum due to rounding.
11

CCAR and TARP Repayment
Zions expects to be part of the CCAR 2011 Federal Reserve stress test process
Capital plans and stress tests submitted are expected to frame capital actions for 2012, as they did for the 19 largest banks in 2011
Therefore, Zions does not expect to repay TARP until sometime after completion of the CCAR process
CCAR: Comprehensive Capital Analysis and Review
12

Agenda
Overview of Zions
Key Performance Drivers
–Capital
–Revenue
–Credit Quality
Outlook Summary

Loan Growth TrendExcludes Construction and FDIC-supported Loans
$31,000
$31,500
$32,000
$32,500
$33,000
$33,500
1Q09 2Q09 3Q09 4Q09 1Q10 2Q10 3Q10 4Q10 1Q11 2Q11 3Q11
Loan Balance
($800)
($600)
($400)
($200)
$0
$200
$400
$600
$800
1Q09 2Q09 3Q09 4Q09 1Q10 2Q10 3Q10 4Q10 1Q11 2Q11 3Q11
Gross Loan Change
MillionsMillions
Source: Company earnings releases
Excludes construction loans to both commercial and consumer borrowers
14

Core Net Interest Margin
Zions’ net interest margin excludes non-cash sub debt amortization expense and accretion on FDIC-acquired loans. Peer group net interest margin adjusted for accretion of interest income on
FDIC acquired loans, where applicable.
Source: SNL and company documents as of 3Q11.
0.0%0.5%1.0%1.5%2.0%2.5%3.0%3.5%4.0%4.5%
BPO
P
ZIO
N
WFC
MTB
FITB
USB
BB
T
STI
SNV
BO
KF
HB
AN
EWB
C
CY
N
ASB
C
FHN
CM
A
KEY R
F
Net Interest Margin
Strong NIM
Driven in part by Strong Demand Deposits
31.6%
22.1%
19.2%
0%
5%
10%
15%
20%
25%
30%
35%
3Q11
DDA as a % of Earning Assets
ZION Peer Median U.S. Comm'l Banks
15

Core NIM Trends
3.00%
3.25%
3.50%
3.75%
4.00%
4.25%
4.50%
1Q09 2Q09 3Q09 4Q09 1Q10 2Q10 3Q10 4Q10 1Q11 2Q11 3Q11
Core NIM Reported NIM
Zions expects net interest sensitive income to increase between an
estimated 6.2% and 9.4% if interest
rates were to rise 200 bps* in the first year
Core NIM (excludes discount accretion)
has been generally stable
– 2010 core NIM compression attributable to
a greater drag from cash balances
– 1Q09 experienced a temporary dip partially
due to an intentional build-up of excess
liquidity during the significant turmoil during
late 2008/early 2009
– Large senior note issuance in September
2009 had about 8 bps adverse impact on
the core NIM in 4Q09
(1) Cash drag refers to the adverse impact on the net interest margin due to the total balance of cash held in interest-bearing accounts. Assumptions used to compute the cash drag include
investing the cash at a rate of 4.5%, similar to the rate achieved on recent loan production. Liquidity targets and loan demand are factors that may prevent fully deploying such cash; the
cash drag is shown for illustrative purposes only.
*Assumes a parallel shift in the yield curve; key assumptions include a slow and a fast deposit repricing response (i.e. if deposit rates are slow to increase Zions expects a 9.4% increase in
interest sensitive income, and if deposits were to reprice quickly Zions expects a 6.2% increase in interest sensitive income); sensitivity analysis based on September 2011 data. Also
assumes $6.4 billion of DDA and interest-on-checking deposits are replaced with market rate funds.
Due to the extinguishment/ reissuance of subordinated debt in June 2009, Zions experiences non-cash discount accretion, which increases interest expense, reducing GAAP NIM
2009 2010 2011
1Q 2Q 3Q 4Q 1Q 2Q 3Q 4Q 1Q 2Q 3Q
Cash Drag (1) 24
bps
17
bps
16
bps
24
bps
20
bps
35
bps
46
bps
45
bps
41
bps
43
bps
50
bps
16
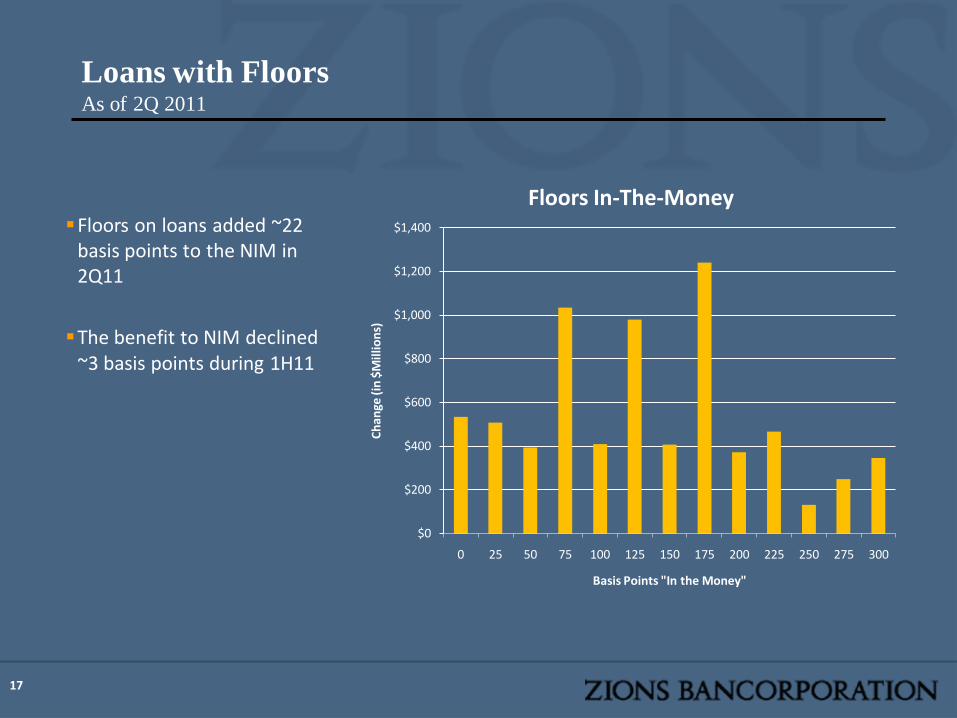
Loans with FloorsAs of 2Q 2011
Floors on loans added ~22 basis points to the NIM in 2Q11
The benefit to NIM declined ~3 basis points during 1H11
$0
$200
$400
$600
$800
$1,000
$1,200
$1,400
0 25 50 75 100 125 150 175 200 225 250 275 300
Ch
ange
(in
$M
illio
ns)
Basis Points "In the Money"
Floors In-The-Money
17
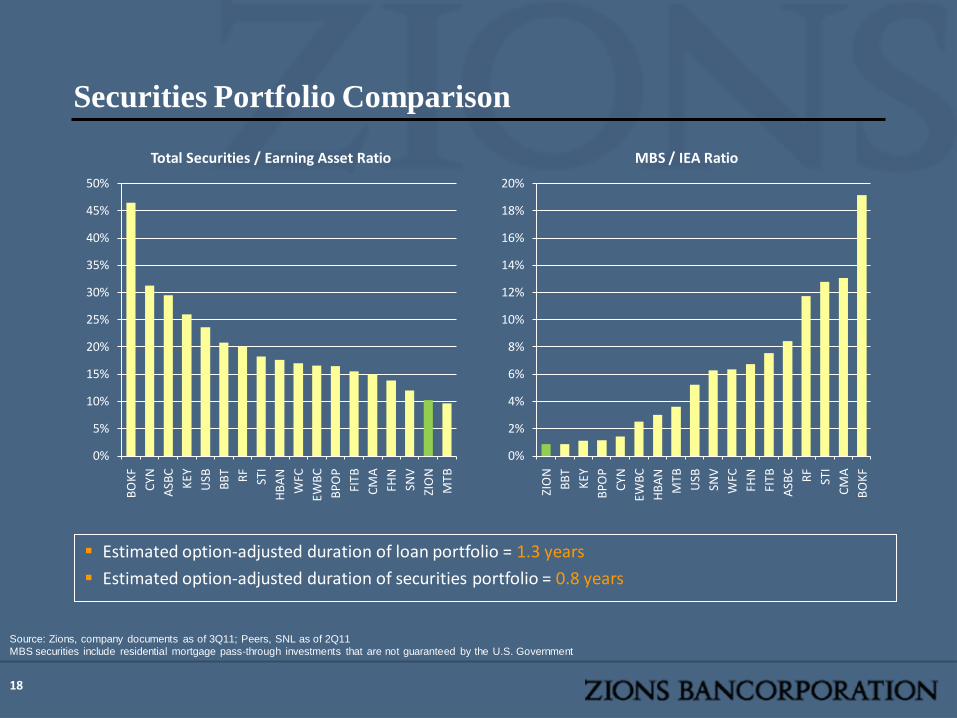
Securities Portfolio Comparison
0%
5%
10%
15%
20%
25%
30%
35%
40%
45%
50%
BO
KF
CY
N
ASB
C
KEY
USB
BB
T
RF
STI
HB
AN
WFC
EW
BC
BP
OP
FITB
CM
A
FHN
SNV
ZIO
N
MTB
Total Securities / Earning Asset Ratio
0%
2%
4%
6%
8%
10%
12%
14%
16%
18%
20%
ZIO
N
BB
T
KEY
BP
OP
CY
N
EW
BC
HB
AN
MT
B
USB
SNV
WFC
FHN
FITB
ASB
C RF
STI
CM
A
BO
KF
MBS / IEA Ratio
Source: Zions, company documents as of 3Q11; Peers, SNL as of 2Q11
MBS securities include residential mortgage pass-through investments that are not guaranteed by the U.S. Government
Estimated option-adjusted duration of loan portfolio = 1.3 years
Estimated option-adjusted duration of securities portfolio = 0.8 years
18
-5%
0%
5%
10%
15%
20%
-10
0 b
ps
0 b
ps
+1
00
bp
s
+2
00
bp
s
+3
00
bp
s
Op
. T
wis
t
% C
han
ge
Net Interest Income
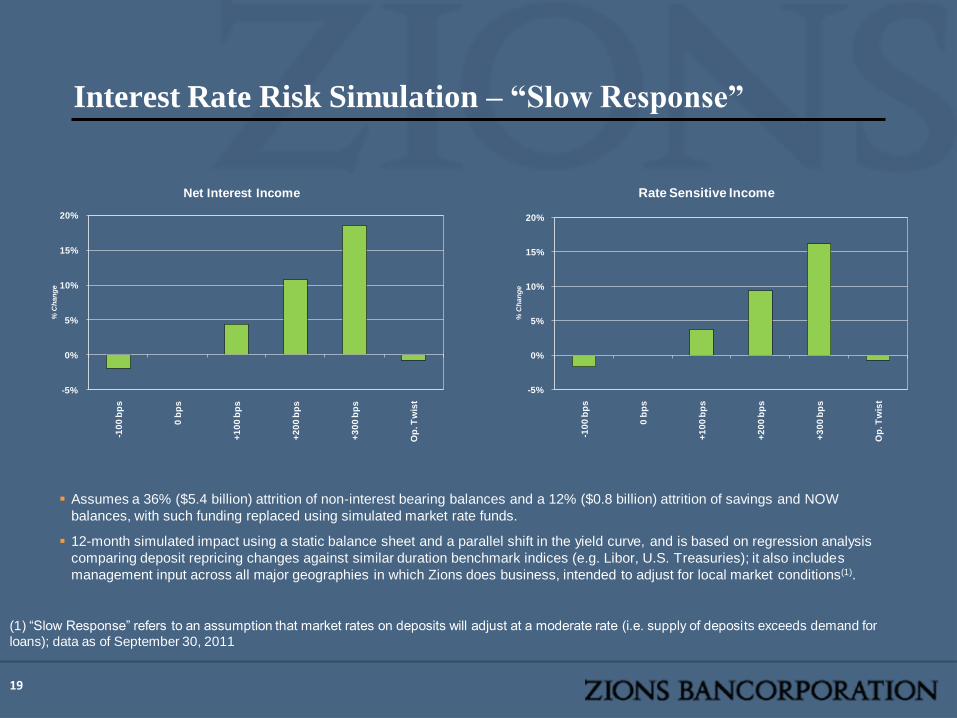
Interest Rate Risk Simulation – “Slow Response”
Assumes a 36% ($5.4 billion) attrition of non-interest bearing balances and a 12% ($0.8 billion) attrition of savings and NOW
balances, with such funding replaced using simulated market rate funds.
12-month simulated impact using a static balance sheet and a parallel shift in the yield curve, and is based on regression analysis
comparing deposit repricing changes against similar duration benchmark indices (e.g. Libor, U.S. Treasuries); it also includes
management input across all major geographies in which Zions does business, intended to adjust for local market conditions(1).
(1) “Slow Response” refers to an assumption that market rates on deposits will adjust at a moderate rate (i.e. supply of deposits exceeds demand for
loans); data as of September 30, 2011
-5%
0%
5%
10%
15%
20%
-10
0 b
ps
0 b
ps
+1
00
bp
s
+2
00
bp
s
+3
00
bp
s
Op
. T
wis
t
% C
han
ge
Rate Sensitive Income
19
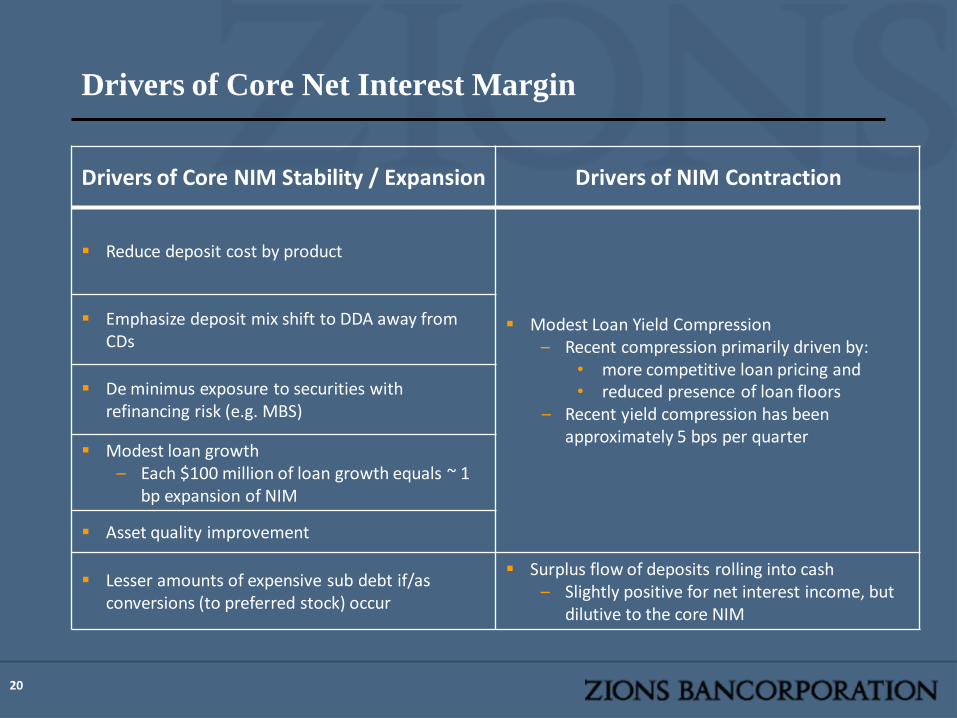
Drivers of Core Net Interest Margin
Drivers of Core NIM Stability / Expansion Drivers of NIM Contraction
Reduce deposit cost by product
Modest Loan Yield Compression – Recent compression primarily driven by:
• more competitive loan pricing and • reduced presence of loan floors
– Recent yield compression has been approximately 5 bps per quarter
Emphasize deposit mix shift to DDA away from CDs
De minimus exposure to securities with refinancing risk (e.g. MBS)
Modest loan growth– Each $100 million of loan growth equals ~ 1
bp expansion of NIM
Asset quality improvement
Lesser amounts of expensive sub debt if/as conversions (to preferred stock) occur
Surplus flow of deposits rolling into cash– Slightly positive for net interest income, but
dilutive to the core NIM
20

-$500
-$400
-$300
-$200
-$100
$0
$100
$200
$300
$400
1Q09 2Q09 3Q09 4Q09 1Q10 2Q10 3Q10 4Q10 1Q11 2Q11 3Q11
$ in
Mil
lio
ns
Core Pre-Tax, Pre-Credit Income
Net Reserve (Build) / Release
Core net income excludes items that are one time or non-recurring in nature. 2Q09 - 4Q09 included material gains from loan portfolio related interest rate swaps. Swaps are used to
manage interest rate risk and were generally added near the peak in the rate cycle. As hedges became ineffective, gains were realized.
Core Pre-Tax, Pre-Credit Income
21

Agenda
Overview of Zions
Key Performance Drivers
–Capital
–Revenue
–Credit Quality
Outlook Summary

Credit Quality Trends
0%
1%
2%
3%
4%
5%
6%
7%
8%
1Q
-07
2Q07
3Q
-07
4Q
-07
1Q
-08
2Q
-08
3Q
-08
4Q
-08
1Q
-09
2Q
-09
3Q
-09
4Q
-09
1Q-1
0
2Q
-10
3Q-1
0
4Q
-10
1Q
-11
2Q
-11
3Q
-11
Zions Peer Median
0%
1%
1%
2%
2%
3%
3%
4%
4%
1Q-0
7
2Q
07
3Q-0
7
4Q-0
7
1Q-0
8
2Q-0
8
3Q-0
8
4Q-0
8
1Q-0
9
2Q-0
9
3Q-0
9
4Q-0
9
1Q-1
0
2Q-1
0
3Q-1
0
4Q-1
0
1Q-1
1
2Q-1
1
3Q-1
1
Zions Peer Median
*Annualized
Note: Peer group includes U.S. publicly traded regional banks with assets greater than $20 billion and less than $200 billion plus footprint competitors WFC and USB
Source: SNL
Nonperforming assets as a %
of Loans & OREO
Net Charge-offs as
a % of Loans*
3.98%
3.43%
1.29%
1.11%
23

$0
$200
$400
$600
$800
$1,000
$1,200
4Q09 1Q10 2Q10 3Q10 4Q10 1Q11 2Q11 3Q11
Nonaccrual Loan Inflows
Millions
Source: Company documents
24

Problem Credit Resolution Trends
74%
28%
15%
20%
25%
30%
35%
0%
10%
20%
30%
40%
50%
60%
70%
80%
1Q10 2Q10 3Q10 4Q10 1Q11 2Q11 3Q11
Nonperforming Asset Resolution Rates
Favorable Resolutions as a Percent of Total Resolutions Resolutions as a Percent of Grossed-up NPAs (right)
Source: Company documents
Note: Charts reflect problem credits that were $50k or greater in size; “Favorable” resolutions include loans changed to accrual status, loans paid down/paid off, or proceeds from real estate
sales. Unfavorable resolutions include increases in balance, charge-offs, charge-downs, and valuation allowances on property held in REO. NPAs are grossed-up for new nonaccrual loan
inflows during the quarters.
25

Great Recession 3 Year Cumulative Net Charge-Off Comparison
Note: Peer group includes U.S. publicly traded regional banks with assets greater than $20 billion and less than $200 billion plus footprint competitors WFC and USB
Source: SNL regulatory data; Years 2008 thru 2010.
0%
2%
4%
6%
8%
10%
12%
14%
C&I Term CRE Owner Occupied Resi & Comm'l Construction
1-4 Family Home Equity & Consumer
3 Y
ea
r N
et
Ch
arg
e-O
ff R
ati
o
Zions Peer Median U.S. Comm'l Banks
26

Term CREUpdated LTV Stratification
The NCREIF Property Index is a national index that has been applied to Zions’ mostly regional CRE Portfolio
Zions loan data as of 3Q11; NCREIF Index as of 2Q11
Percentage of Loans within each bucket that are Nonaccrual
0.6% 2.8% 1.5% 3.5% 13.9% 10.0% 7.3%
0%
5%
10%
15%
20%
25%
30%
35%
40%
<50% 50-59% 60-69% 70-79% 80-89% 90-99% 100%+
Pe
rce
nt
of
Loan
Po
rtfo
lio
By attaching each loan to the NCREIF Property Index as of the date of the loans’ last appraisal we can see an estimate of the updated LTV ratios of the portfolio
27

Lessons Learned, Changes Made
Significant enhancement to credit administrative staff
– Chief Credit Administrators:
• C&I
• CRE
• Consumer
– Concentration Risk Manager
– Data Quality Assurance
– Enhanced Systems
– Training
Concentration Limits
Implementing Additional Early Warning Indicators
Comprehensive Stress Testing
28

Agenda
Overview of Zions
Key Performance Drivers
–Capital
–Credit Quality
–Revenue
Outlook Summary
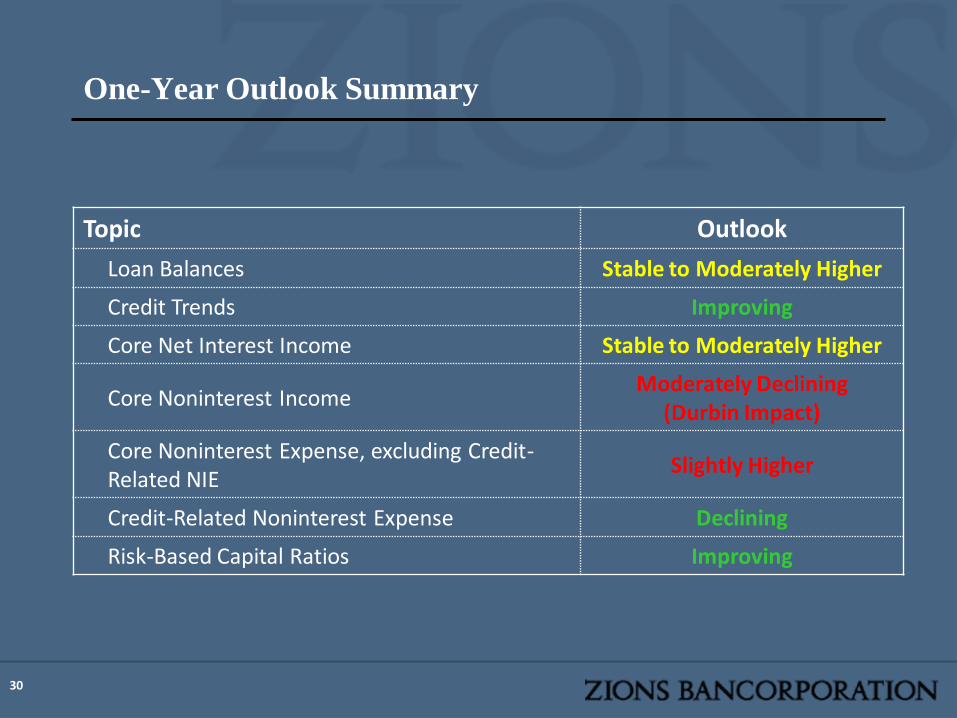
One-Year Outlook Summary
Topic Outlook
Loan Balances Stable to Moderately Higher
Credit Trends Improving
Core Net Interest Income Stable to Moderately Higher
Core Noninterest IncomeModerately Declining
(Durbin Impact)
Core Noninterest Expense, excluding Credit-Related NIE
Slightly Higher
Credit-Related Noninterest Expense Declining
Risk-Based Capital Ratios Improving
30
Appendix
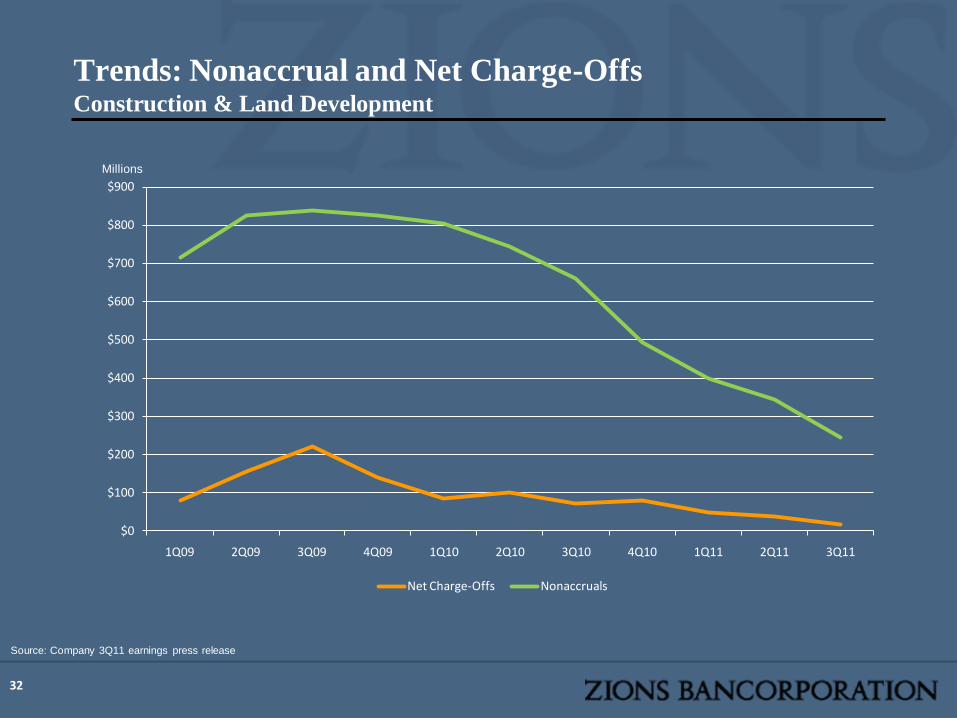
Source: Company 3Q11 earnings press release
Trends: Nonaccrual and Net Charge-OffsConstruction & Land Development
Millions
$0
$100
$200
$300
$400
$500
$600
$700
$800
$900
1Q09 2Q09 3Q09 4Q09 1Q10 2Q10 3Q10 4Q10 1Q11 2Q11 3Q11
Net Charge-Offs Nonaccruals
32

Source: Company 3Q11 earnings press release
Trends: Nonaccrual and Net Charge-OffsTerm CRE & Owner Occupied
Millions Millions
$0
$100
$200
$300
$400
$500
$600
$700
$800
$900
1Q09 2Q09 3Q09 4Q09 1Q10 2Q10 3Q10 4Q10 1Q11 2Q11 3Q11
Term CRE
Nonaccruals Net Charge-Offs
$0
$100
$200
$300
$400
$500
$600
$700
$800
$900
1Q09 2Q09 3Q09 4Q09 1Q10 2Q10 3Q10 4Q10 1Q11 2Q11 3Q11
Owner Occupied
Nonaccruals Net Charge-Offs
33

Universe of Bank Failures vs. Failures in Zions’ CDOs
2 2
9
12
21
24
50
37
4143
41
30
26
22
26
11
01
6 6
1113
18 17
13
16
9 97
4
10
1
0
10
20
30
40
50
601
Q0
8
2Q
08
3Q
08
4Q
08
1Q
09
2Q
09
3Q
09
4Q
09
1Q
10
2Q
10
3Q
10
4Q
10
1Q
11
2Q
11
3Q
11
*4
Q1
1
Universe
ZION CDOs
* As of 10-28-2011
34

Average Bank PD by Quarter (5 Year Cumulative)
0%
5%
10%
15%
20%
25%
30%
35%
40%
45%
50%
4Q09 1Q10 2Q10 3Q10 4Q10 1Q11 2Q11 3Q11
Deferring Banks Performing Private Banks Performing Public Banks
35