Bank of America Merrill Lynch Banking & Financial Services ...
28
November 13, 2014 Citi | Investor Relations Jamie Forese Co-President, Citigroup CEO, Institutional Clients Group Bank of America Merrill Lynch Banking & Financial Services Conference
Transcript of Bank of America Merrill Lynch Banking & Financial Services ...
November 13, 2014
Citi | Investor Relations
Jamie Forese
Co-President, Citigroup
CEO, Institutional Clients Group
Bank of America Merrill Lynch
Banking & Financial Services Conference

Agenda
ICG Overview
• Growing Our Franchise
• Productivity Initiatives
• ICG Returns & Industry Drivers
“Earn an attractive rate of return by offering a targeted set of clients
a full array of products around the globe in an integrated, cost-effective
and responsible manner.”
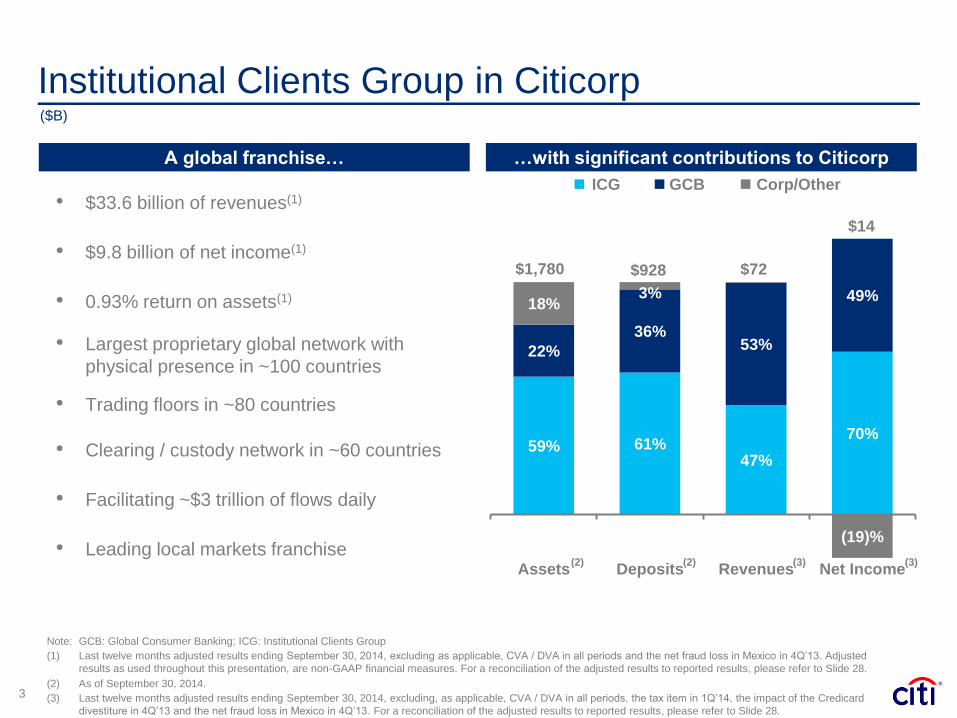
Institutional Clients Group in Citicorp
59% 61% 47%
70%
22%
36% 53%
49% 18%
3%
(19)%
Assets Deposits Revenues Net Income(3) (3)
$1,780 $72
$14
$928
…with significant contributions to Citicorp A global franchise…
($B)
ICG GCB
Note: GCB: Global Consumer Banking; ICG: Institutional Clients Group
(1) Last twelve months adjusted results ending September 30, 2014, excluding as applicable, CVA / DVA in all periods and the net fraud loss in Mexico in 4Q’13. Adjusted
results as used throughout this presentation, are non-GAAP financial measures. For a reconciliation of the adjusted results to reported results, please refer to Slide 28.
(2) As of September 30, 2014.
(3) Last twelve months adjusted results ending September 30, 2014, excluding, as applicable, CVA / DVA in all periods, the tax item in 1Q’14, the impact of the Credicard
divestiture in 4Q’13 and the net fraud loss in Mexico in 4Q’13. For a reconciliation of the adjusted results to reported results, please refer to Slide 28.
3
Corp/Other
(2) (2)
• $33.6 billion of revenues(1)
• $9.8 billion of net income(1)
• 0.93% return on assets(1)
• Largest proprietary global network with
physical presence in ~100 countries
• Trading floors in ~80 countries
• Clearing / custody network in ~60 countries
• Facilitating ~$3 trillion of flows daily
• Leading local markets franchise

Transformation of Institutional Clients Group
4
Reinvestment &
Repositioning
Strategic hires in
selected businesses /
geographies
Investments in key O&T
infrastructure
Resizing businesses
based on evolving
regulatory landscape
and market environment
2010-2012
Integration &
Realignment
2013-2014
Sharpen focus on target
clients and efficient
resource allocation
Diversify revenue base
with targeted growth
Eliminate S&B / CTS
management layer and
fully integrate O&T
Continuous expense
discipline
Optimize &
Execute
2014+
Deepen relationships
with target clients
Efficiently deliver
integrated services to
grow wallet share and
client profitability
Finalize integration and
de-layering of business
Continue to optimize to
regulatory environment

Unparalleled Global Presence
5
Trading Floors Physical Presence Serving Clients
Unparalleled ability to grow and transact with our clients around the world
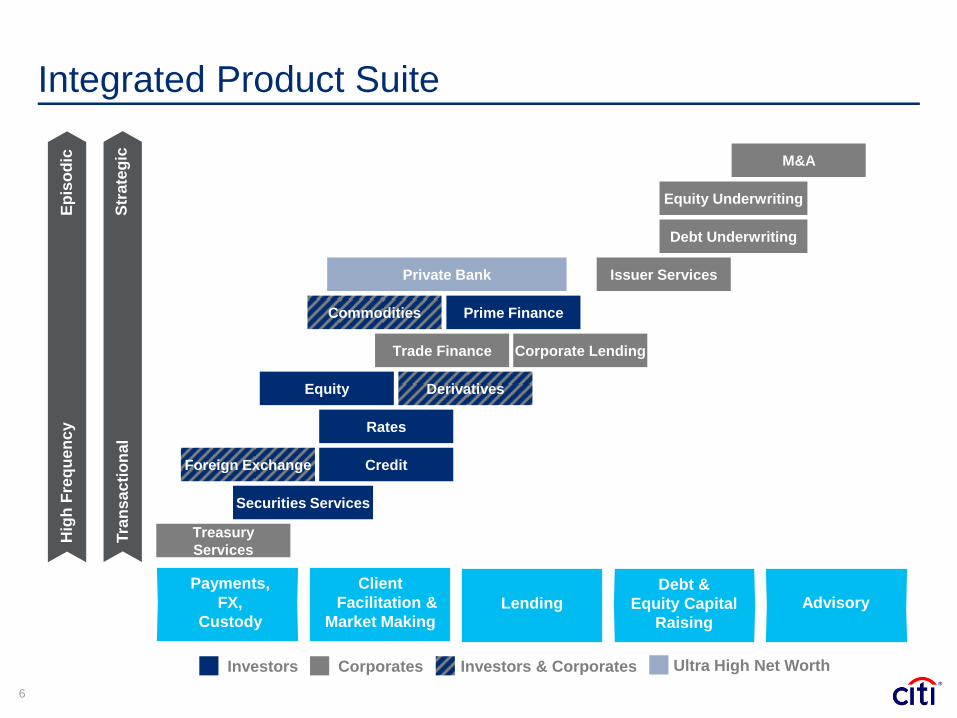
6
Integrated Product Suite
Treasury
Services
Hig
h F
req
ue
nc
y
Ep
iso
dic
Tra
nsa
cti
on
al
Str
ate
gic
Securities Services
M&A
Equity Underwriting
Issuer Services
Debt Underwriting
Credit
Rates
Derivatives
Prime Finance
Trade Finance Corporate Lending
Investors Corporates Investors & Corporates
Commodities
Equity
Foreign Exchange
Private Bank
Ultra High Net Worth
Client
Facilitation &
Market Making Lending
Debt &
Equity Capital
Raising
Advisory
Payments,
FX,
Custody

7
Target Client Franchise
Target Client Base Client Tiers
Single Product & Other
Target
Clients
• Global clients who value Citi’s
capabilities across multiple
products and markets
• Developed market multi-
nationals expanding into EM
• Emerging market champions
growing beyond their home
market / region
~10,000
92%
Target client model allocates resources to clients who most value Citi’s global capabilities
8%
92% 96%
8% 4%
Revenue CreditExposure
(2)
Note:
(1) Based on client revenues for the year ended December 31, 2013. Client revenues defined as those revenues directly attributable to a client transaction at the time of
inception. Client revenues exclude Private Bank, CVA / DVA and certain other items.
(2) Includes direct outstandings and unfunded commitments to lend. Based on corporate exposures as of December 31, 2013.
(1)
Citi’s target client is a sophisticated multinational corporation, public sector entity, financial
institution or global investor with a significant wallet for financial products and services
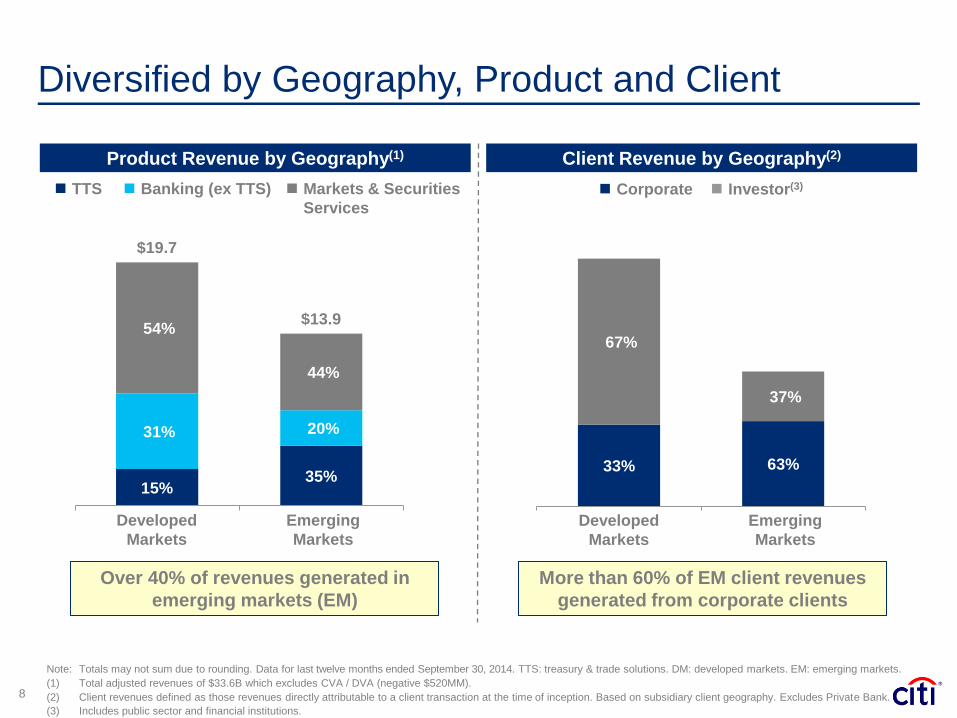
Diversified by Geography, Product and Client
8
More than 60% of EM client revenues
generated from corporate clients
Product Revenue by Geography(1) Client Revenue by Geography(2)
Over 40% of revenues generated in
emerging markets (EM)
Emerging
Markets
Corporate Investor(3) TTS Markets & Securities
Services
Banking (ex TTS)
15% 35%
31% 20%
54%
44%
$19.7
$13.9
DM EMDeveloped
Markets
Emerging
Markets
Note: Totals may not sum due to rounding. Data for last twelve months ended September 30, 2014. TTS: treasury & trade solutions. DM: developed markets. EM: emerging markets.
(1) Total adjusted revenues of $33.6B which excludes CVA / DVA (negative $520MM).
(2) Client revenues defined as those revenues directly attributable to a client transaction at the time of inception. Based on subsidiary client geography. Excludes Private Bank.
(3) Includes public sector and financial institutions.
33% 63%
67%
37%
DM Revenues EM RevenuesDeveloped
Markets
Emerging
Markets
Note: LTM’14: Last twelve months ended September 30, 2014.
(1) Adjusted results, which exclude, as applicable: CVA / DVA in all periods, 4Q’11 and 4Q’12 repositioning charges and the net fraud loss in Mexico in 4Q’13. For a reconciliation of
the adjusted results to the reported results, please refer to Slide 28.
(2) Percentage growth excludes gain/(loss) on loan hedges of $(698)MM in 2012 and $(109)MM in LTM’14. Including these gains/(losses), revenues grew 82% from 2012.
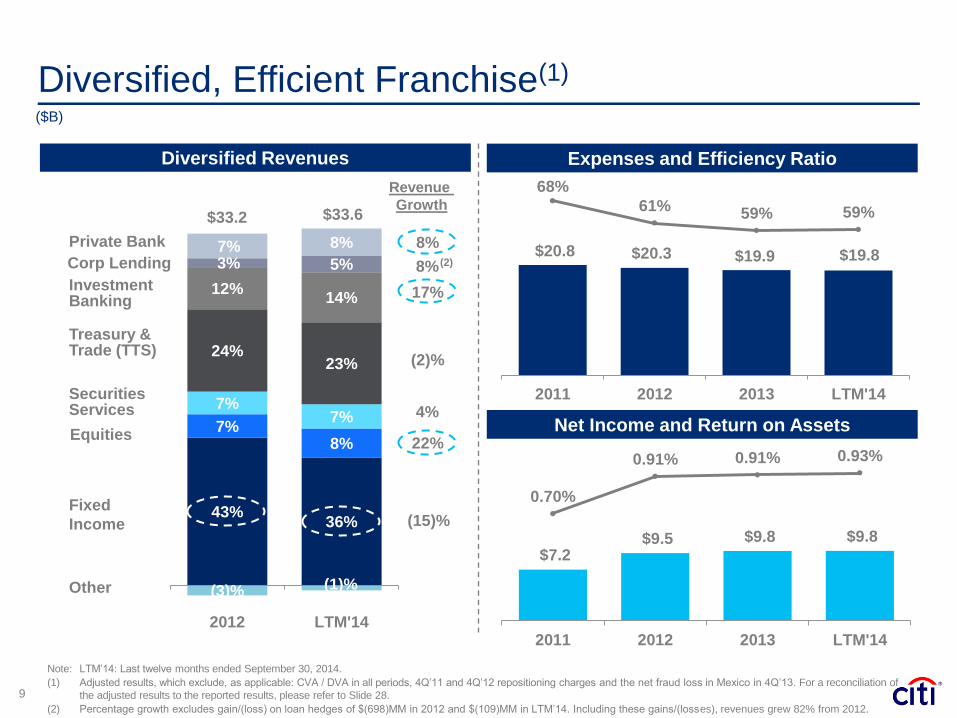
($B)
Expenses and Efficiency Ratio
9
Diversified, Efficient Franchise(1)
Diversified Revenues
43% 36%
7% 8%
7% 7%
(3)% (1)%
24% 23%
12% 14%
3% 5% 7% 8%
2012 LTM'14
Fixed
Income
Equities
Securities Services
Investment Banking
Treasury & Trade (TTS)
Corp Lending
Private Bank
Other
$33.2 $33.6
Revenue
Growth
8%
17%
22%
$20.8 $20.3 $19.9 $19.8
68%
61% 59% 59%
10%
20%
30%
40%
50%
60%
70%
(0.2)
4.8
9.8
14.8
19.8
24.8
29.8
34.8
2011 2012 2013 LTM'14
$7.2 $9.5 $9.8 $9.8
0.70%
0.91% 0.91% 0.93%
2011 2012 2013 LTM'14
Net Income and Return on Assets
8%
(2)%
4%
(15)%
(2)

Agenda
• ICG Overview
Growing Our Franchise
• Productivity Initiatives
• ICG Returns & Industry Drivers
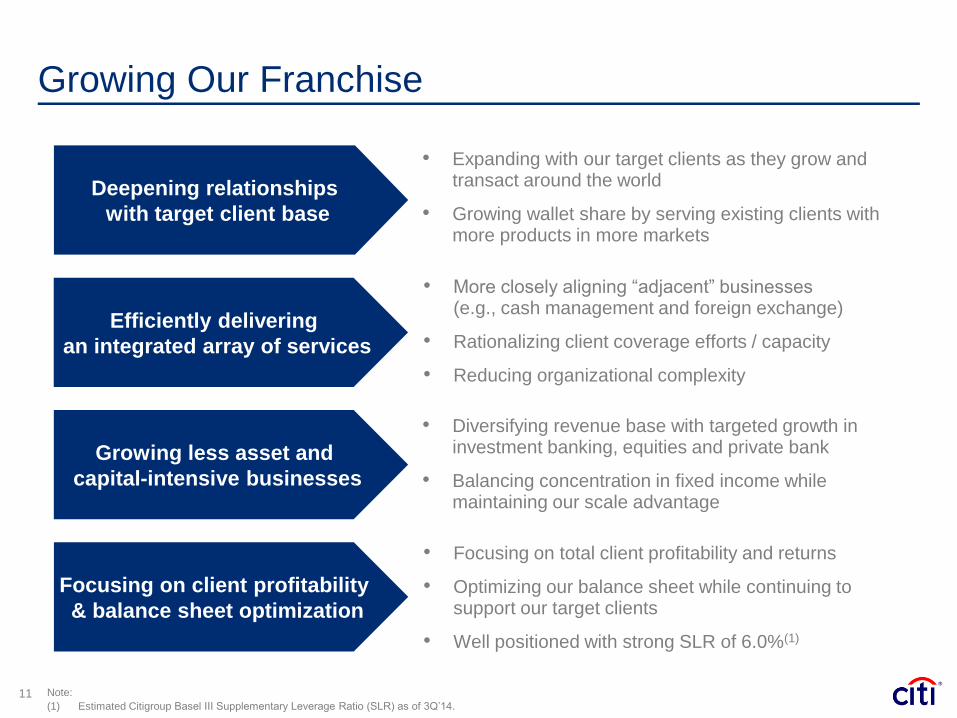
Growing Our Franchise C
on
su
mer
11
Deepening relationships
with target client base
Efficiently delivering
an integrated array of services
Growing less asset and
capital-intensive businesses
• Expanding with our target clients as they grow and transact around the world
• Growing wallet share by serving existing clients with more products in more markets
Focusing on client profitability
& balance sheet optimization
• More closely aligning “adjacent” businesses (e.g., cash management and foreign exchange)
• Rationalizing client coverage efforts / capacity
• Reducing organizational complexity
• Diversifying revenue base with targeted growth in investment banking, equities and private bank
• Balancing concentration in fixed income while maintaining our scale advantage
• Focusing on total client profitability and returns
• Optimizing our balance sheet while continuing to support our target clients
• Well positioned with strong SLR of 6.0%(1)
Note:
(1) Estimated Citigroup Basel III Supplementary Leverage Ratio (SLR) as of 3Q’14.
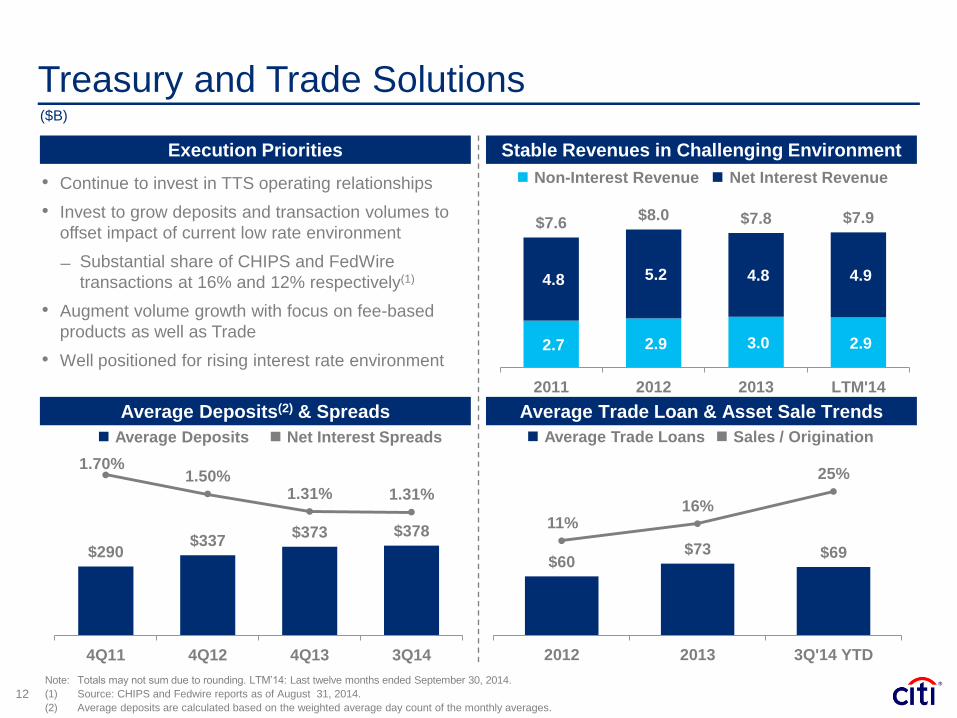
2.7 2.9 3.0 2.9
4.8 5.2 4.8 4.9
$7.6 $8.0 $7.8 $7.9
2011 2012 2013 LTM'14
Treasury and Trade Solutions
12
Execution Priorities
($B)
Stable Revenues in Challenging Environment
Average Deposits(2) & Spreads Average Trade Loan & Asset Sale Trends
Non-Interest Revenue Net Interest Revenue
$290 $337
$373 $378
1.70% 1.50%
1.31% 1.31%
-
100.00
200.00
300.00
400.00
500.00
600.00
700.00
800.00
4Q11 4Q12 4Q13 3Q14
Average Deposits Net Interest Spreads
• Continue to invest in TTS operating relationships
• Invest to grow deposits and transaction volumes to
offset impact of current low rate environment
Substantial share of CHIPS and FedWire
transactions at 16% and 12% respectively(1)
• Augment volume growth with focus on fee-based
products as well as Trade
• Well positioned for rising interest rate environment
$60 $73 $69
11% 16%
25%
-
20.00
40.00
60.00
80.00
100.00
120.00
140.00
160.00
180.00
200.00
2012 2013 3Q'14 YTD
Average Trade Loans Sales / Origination
Note: Totals may not sum due to rounding. LTM’14: Last twelve months ended September 30, 2014.
(1) Source: CHIPS and Fedwire reports as of August 31, 2014.
(2) Average deposits are calculated based on the weighted average day count of the monthly averages.

5.2%
5.4%
4.3%
5.2%
3.2%
5.3%
2011 2012 2013 3Q'14 YTD
2.3 2.7 2.5 2.5
0.8 0.7 1.1 1.3 0.7 0.7
0.9 1.0 $3.7
$4.1 $4.4
$4.8
2011 2012 2013 LTM'14
Investment Banking
13
Execution Priorities Revenue Growth Driven by M&A and ECM
In an Expanding Market(1)… …Growing Wallet Share(2)
Debt Underwriting Equity Underwriting Advisory
($B)
Debt Underwriting Equity Underwriting Advisory CAGR
9%
13%
22%
4%
• Efficiently allocate resources to target markets,
sectors and clients
• Increase wallet share with target clients to drive
growth in M&A, equity and debt underwriting
• Deliver integrated services across ICG (e.g., TTS,
corporate lending and markets)
• Hire selectively in markets and sectors where target
client fee wallets are significant and growing
Note: Totals may not sum due to rounding. LTM’14: Last twelve months ended September 30, 2014.
(1) Market wallet for total industry. Source: Dealogic 2011 - 2014 LTM data as of September 30, 2014.
(2) Citi wallet share of IB fee pool for total industry. Source: Dealogic 2011 - 2014 YTD data as of September 30, 2014.
(3) Source: Dealogic 2014 YTD data as of September 30, 2014. Overall wallet includes all eligible deals. Target market wallet represents Citi’s wallet share with the clients in
its coverage universe.
33.5 35.5 41.3 39.5
15.9 13.7 18.0 22.5
20.4 19.7 17.9 19.7
$69.7 $68.9 $77.3 $81.7
2011 2012 2013 LTM'14
Debt Underwriting Equity Underwriting Advisory
Overall Wallet(3): 5.3%
Target Market Wallet(3): 9.2%
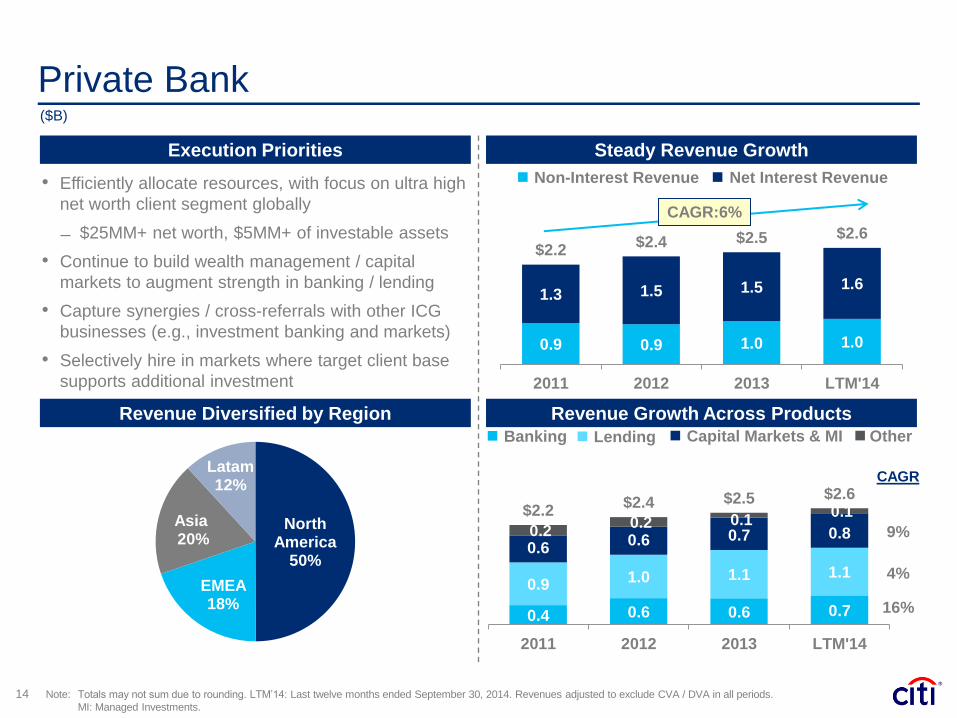
Private Bank
14
Execution Priorities
($B)
Steady Revenue Growth
Revenue Diversified by Region Revenue Growth Across Products
• Efficiently allocate resources, with focus on ultra high
net worth client segment globally
$25MM+ net worth, $5MM+ of investable assets
• Continue to build wealth management / capital
markets to augment strength in banking / lending
• Capture synergies / cross-referrals with other ICG
businesses (e.g., investment banking and markets)
• Selectively hire in markets where target client base
supports additional investment
0.9 0.9 1.0 1.0
1.3 1.5 1.5 1.6
$2.2 $2.4 $2.5 $2.6
2011 2012 2013 LTM'14
Note: Totals may not sum due to rounding. LTM’14: Last twelve months ended September 30, 2014. Revenues adjusted to exclude CVA / DVA in all periods.
MI: Managed Investments.
Non-Interest Revenue Net Interest Revenue
North America
50%
EMEA 18%
Asia 20%
Latam 12%
CAGR:6%
0.4 0.6 0.6 0.7
0.9 1.0 1.1 1.1
0.6 0.6 0.7 0.8 0.2 0.2 0.1
0.1 $2.2 $2.4 $2.5 $2.6
2011 2012 2013 LTM'14
Banking Lending Capital Markets & MI Other
CAGR
9%
4%
16%
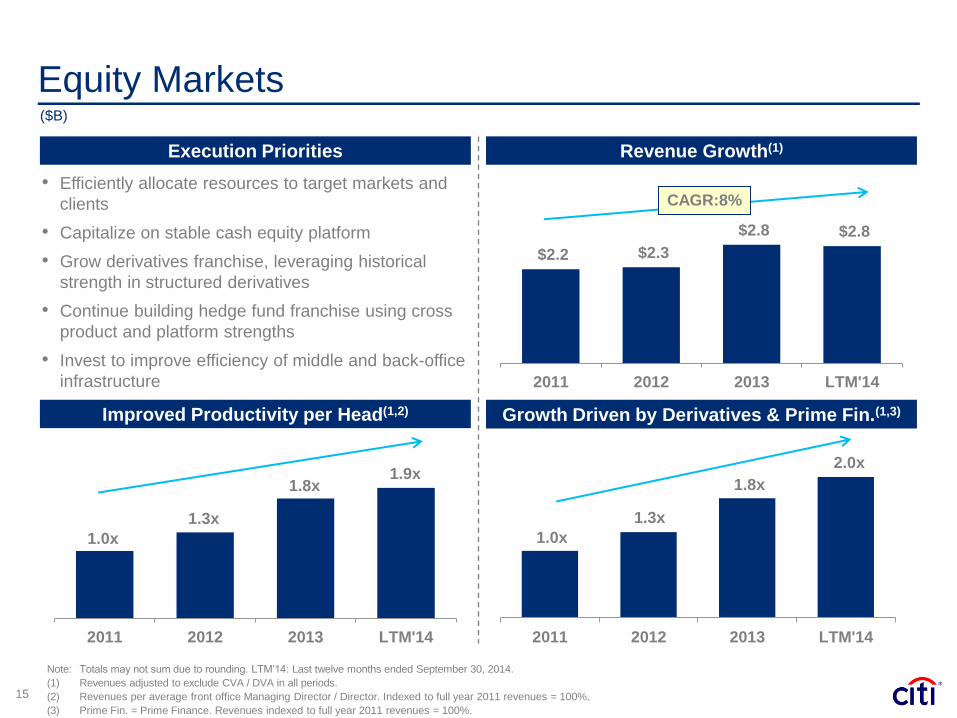
Equity Markets
15
Execution Priorities
($B)
Revenue Growth(1)
Improved Productivity per Head(1,2) Growth Driven by Derivatives & Prime Fin.(1,3)
• Efficiently allocate resources to target markets and
clients
• Capitalize on stable cash equity platform
• Grow derivatives franchise, leveraging historical
strength in structured derivatives
• Continue building hedge fund franchise using cross
product and platform strengths
• Invest to improve efficiency of middle and back-office
infrastructure
Note: Totals may not sum due to rounding. LTM’14: Last twelve months ended September 30, 2014.
(1) Revenues adjusted to exclude CVA / DVA in all periods.
(2) Revenues per average front office Managing Director / Director. Indexed to full year 2011 revenues = 100%.
(3) Prime Fin. = Prime Finance. Revenues indexed to full year 2011 revenues = 100%.
$2.2 $2.3
$2.8 $2.8
2011 2012 2013 LTM'14
CAGR:8%
2011 2012 2013 LTM'14
1.0x
1.3x
1.8x 1.9x
2011 2012 2013 LTM'14
1.0x
1.3x
1.8x
2.0x
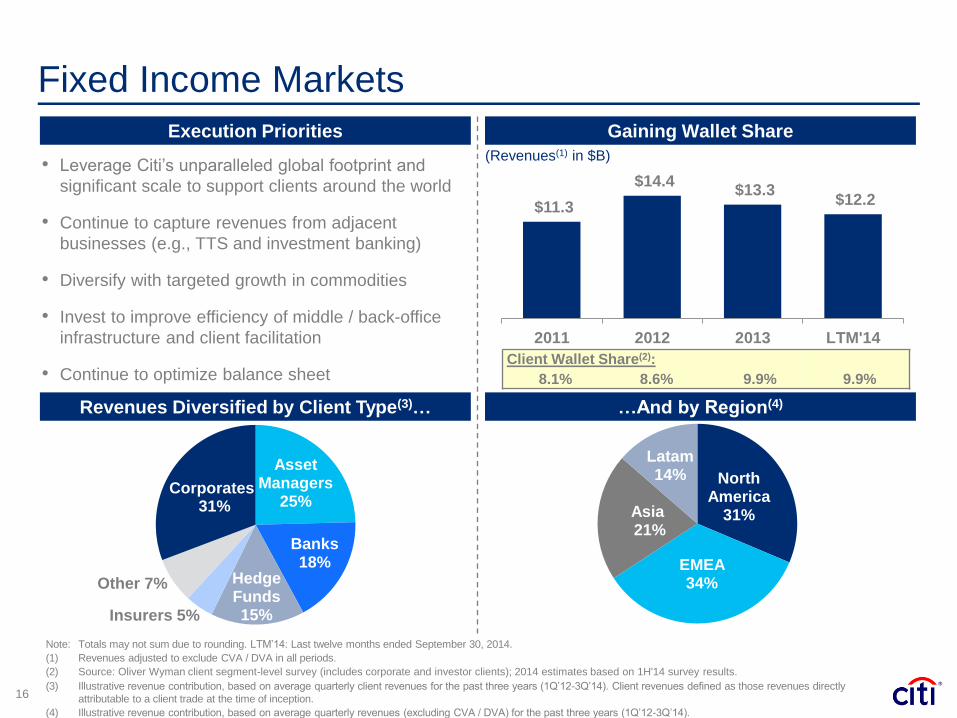
$11.3
$14.4 $13.3
$12.2
2011 2012 2013 LTM'14
North America
31%
EMEA 34%
Asia 21%
Latam 14%
Fixed Income Markets
16
Execution Priorities
(Revenues(1) in $B)
Gaining Wallet Share
Revenues Diversified by Client Type(3)… …And by Region(4)
• Leverage Citi’s unparalleled global footprint and
significant scale to support clients around the world
• Continue to capture revenues from adjacent
businesses (e.g., TTS and investment banking)
• Diversify with targeted growth in commodities
• Invest to improve efficiency of middle / back-office
infrastructure and client facilitation
• Continue to optimize balance sheet
Note: Totals may not sum due to rounding. LTM’14: Last twelve months ended September 30, 2014.
(1) Revenues adjusted to exclude CVA / DVA in all periods.
(2) Source: Oliver Wyman client segment-level survey (includes corporate and investor clients); 2014 estimates based on 1H'14 survey results.
(3) Illustrative revenue contribution, based on average quarterly client revenues for the past three years (1Q’12-3Q’14). Client revenues defined as those revenues directly
attributable to a client trade at the time of inception.
(4) Illustrative revenue contribution, based on average quarterly revenues (excluding CVA / DVA) for the past three years (1Q’12-3Q’14).
Asset Managers
25%
Banks 18%
Hedge Funds 15%
31%
Corporates
Insurers 5%
Other 7%
Client Wallet Share(2):
8.1% 8.6% 9.9% 9.9%
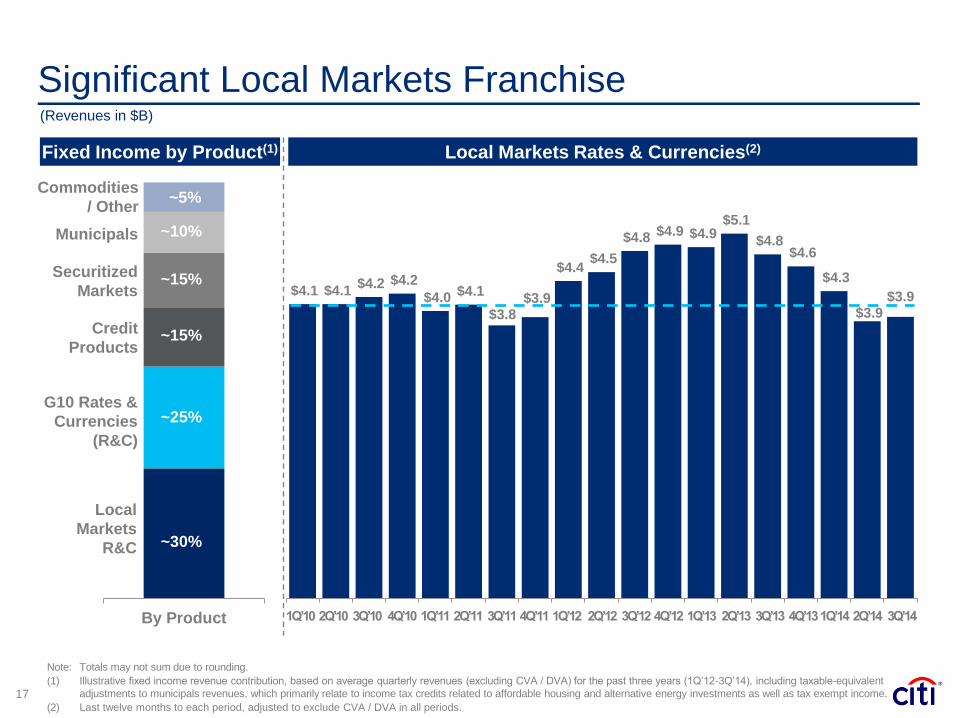
$4.1 $4.1 $4.2 $4.2
$4.0 $4.1
$3.8 $3.9
$4.4 $4.5
$4.8 $4.9 $4.9 $5.1
$4.8 $4.6
$4.3
$3.9 $3.9
Significant Local Markets Franchise
17
Fixed Income by Product(1)
(Revenues in $B)
Local Markets Rates & Currencies(2)
Note: Totals may not sum due to rounding.
(1) Illustrative fixed income revenue contribution, based on average quarterly revenues (excluding CVA / DVA) for the past three years (1Q’12-3Q’14), including taxable-equivalent
adjustments to municipals revenues, which primarily relate to income tax credits related to affordable housing and alternative energy investments as well as tax exempt income.
(2) Last twelve months to each period, adjusted to exclude CVA / DVA in all periods.
Credit
Products
By Product
Local
Markets
R&C
G10 Rates &
Currencies
(R&C)
Securitized
Markets
Municipals
Commodities
/ Other
1Q’10 2Q’10 3Q’10 4Q’10 1Q’11 2Q’11 3Q’11 4Q’11 1Q’12 2Q’12 3Q’12 4Q’12 1Q’13 2Q’13 3Q’13 4Q’13 1Q’14 2Q’14 3Q’14
~30%
~25%
~15%
~15%
~10%
~5%
Agenda
• ICG Overview
• Growing Our Franchise
Productivity Initiatives
• ICG Returns & Industry Drivers

19
(LTM, $B)
Expenses and Efficiency Ratio
Note: Totals may not sum due to rounding. LTM: Last twelve months.
(1) Adjusted results, which exclude CVA / DVA in all periods, 4Q’11 and 4Q’12 repositioning charges and the net fraud loss in Mexico in 4Q’13. Please refer to Slide 28 for a
reconciliation of this information to reported results.
20.7 20.7
20.3 20.2 20.0 19.9 19.9 19.7
19.5 19.3 19.2 19.3
0.1 0.1
0.3 0.2
0.3 0.2 0.1
0.3 0.3
0.4 0.5
0.5
$20.8 $20.8
$20.5 $20.4 $20.3
$20.2 $20.1 $20.0 $19.9
$19.8 $19.7
$19.8
68% 67% 66%
64%
61% 60%
58% 58% 59% 59% 60% 59%
15%
25%
35%
45%
55%
65%
4Q'11 1Q'12 2Q'12 3Q'12 4Q'12 1Q'13 2Q'13 3Q'13 4Q'13 1Q'14 2Q'14 3Q'14
Core Expenses Legal & Repositioning 2015 Target:
53-57%
Demonstrated Expense Discipline(1)

Efficiency Improvements Offsetting Headwinds(1)
$20.8 $20.7
$19.3
$19.8
(0.1)
(0.3)
(1.0)
(0.5)
0.4
0.5
2011Expenses
Legal&
Repos.
2011Core
Expenses
FX RepositioningSaves
OtherNet
Efficiencies
Regulatory & Compliance
LTM'14Core
Expenses
Legal&
LTM'14Expenses
20 Note: Totals may not sum due to rounding. LTM’14: Last twelve months ending September 30, 2014.
(1) Adjusted results, which exclude 4Q’11 repositioning charges and the net fraud loss in Mexico in 4Q’13. Please refer to Slide 28 for a reconciliation of this information to reported
results.
($B)
Repos.
(7)%
Agenda
• ICG Overview
• Growing Our Franchise
• Productivity Initiatives
ICG Returns & Industry Drivers

67
36
45
23
LTM'14
(1)%
(7)%
19%
15%
0.2 0.2 0.3 0.3
0.8 0.8 0.8 0.8
$1.0 $1.0 $1.1 $1.1
0.70%
0.91% 0.91% 0.93%
2011 2012 2013 LTM'14
Return on Assets and Allocated TCE(1)
22
Return on Assets Return on Average Allocated TCE(2)
Avg Loans Avg Trading & Other Assets ($B)
Note: Totals may not sum due to rounding. LTM: Last twelve months ending September 30, 2014.
(1) Net Income adjusted to exclude CVA / DVA in all periods, 4Q’11 and 4Q’12 repositioning charges and the net fraud loss in Mexico in 4Q’13. Adjusted RoTCE LTM results, which
exclude CVA / DVA in all periods, the impact of the mortgage settlement in 2Q’14, the tax item in 1Q’14, the impact of the Credicard divestiture in 4Q’13 and the net fraud loss
in Mexico in 4Q’13. For a reconciliation of the adjusted results to the reported results, please refer to Slide 28.
(2) Tangible common equity allocated to GCB, ICG and Citi Holdings based on estimated full year 2014 capital allocations. Tangible common equity is a non-GAAP financial
measure. For a reconciliation of this metric to the most directly comparable GAAP measure, please refer to Slide 27.
(3) Based on net income to common, net of $423 million of preferred dividends.
(4) Average TCE supporting DTA in Citicorp for LTM’14 equaled approximately $37 billion.
($T)
ICG
RoTCE
Citicorp(3) = 9%
(12%(4) ex DTA)
GCB
Citi Holdings
Corp / Other(3)
$170
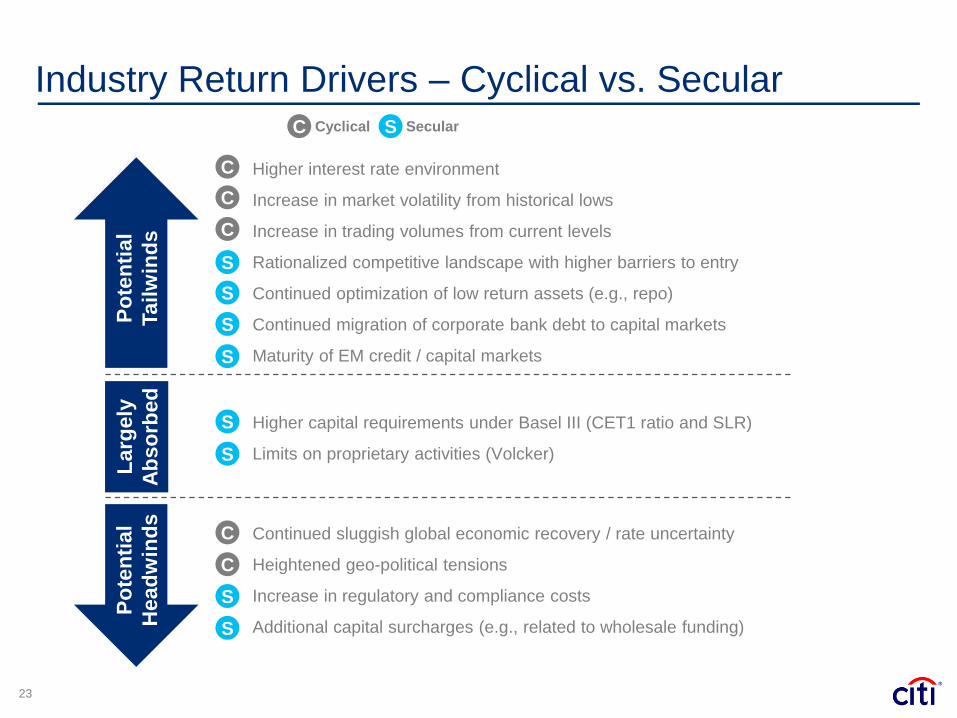
Industry Return Drivers – Cyclical vs. Secular
23
Po
ten
tial
Tailw
ind
s
Larg
ely
Ab
so
rbed
Po
ten
tial
Head
win
ds
Higher interest rate environment
Increase in market volatility from historical lows
Increase in trading volumes from current levels
Rationalized competitive landscape with higher barriers to entry
Continued optimization of low return assets (e.g., repo)
Continued migration of corporate bank debt to capital markets
Maturity of EM credit / capital markets
Higher capital requirements under Basel III (CET1 ratio and SLR)
Limits on proprietary activities (Volcker)
Continued sluggish global economic recovery / rate uncertainty
Heightened geo-political tensions
Increase in regulatory and compliance costs
Additional capital surcharges (e.g., related to wholesale funding)
C
C
C
S
S
S
S
S
S
C
C
S
S
C S Cyclical
Secular
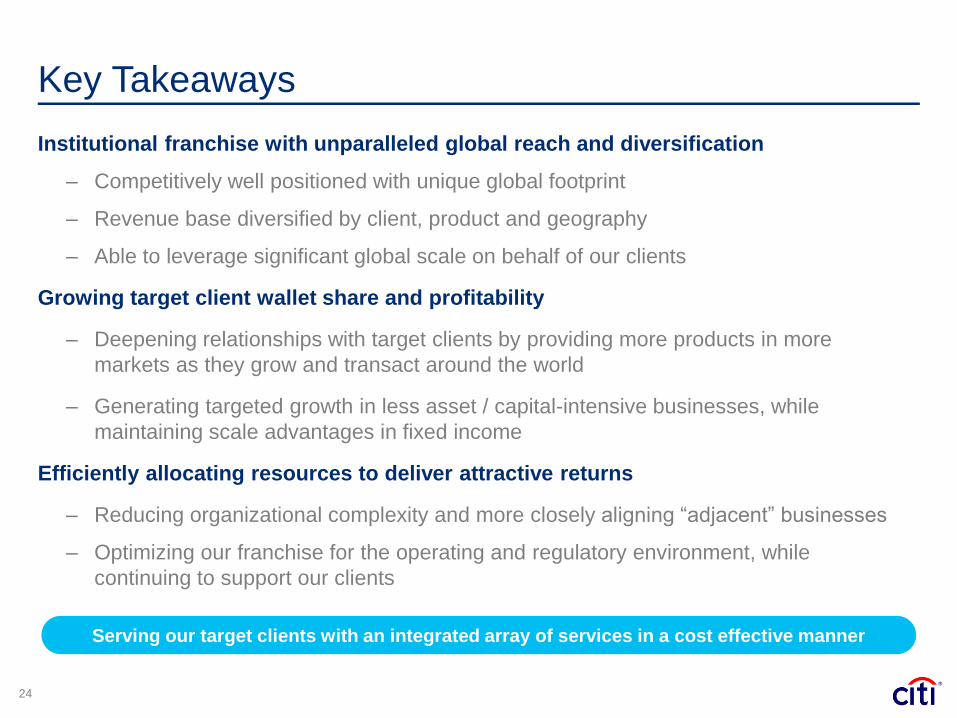
Key Takeaways
Institutional franchise with unparalleled global reach and diversification
– Competitively well positioned with unique global footprint
– Revenue base diversified by client, product and geography
– Able to leverage significant global scale on behalf of our clients
Growing target client wallet share and profitability
– Deepening relationships with target clients by providing more products in more
markets as they grow and transact around the world
– Generating targeted growth in less asset / capital-intensive businesses, while
maintaining scale advantages in fixed income
Efficiently allocating resources to deliver attractive returns
– Reducing organizational complexity and more closely aligning “adjacent” businesses
– Optimizing our franchise for the operating and regulatory environment, while
continuing to support our clients
24
Serving our target clients with an integrated array of services in a cost effective manner

Certain statements in this presentation are “forward-looking statements”
within the meaning of the U.S. Private Securities Litigation Reform Act.
These statements are based on management’s current expectations and
are subject to uncertainty and changes in circumstances. These
statements are not guarantees of future results or occurrences. Actual
results and capital and other financial conditions may differ materially from
those included in these statements due to a variety of factors, including
those factors contained in the “Risk Factors” section of Citigroup’s 2013
Form 10-K and in any of its subsequent filings with the U.S. Securities and
Exchange Commission. Any forward-looking statements made by or on
behalf of Citigroup speak only as to the date they are made, and Citi does
not undertake to update forward-looking statements to reflect the impact of
circumstances or events that arise after the date the forward-looking
statements were made.
25
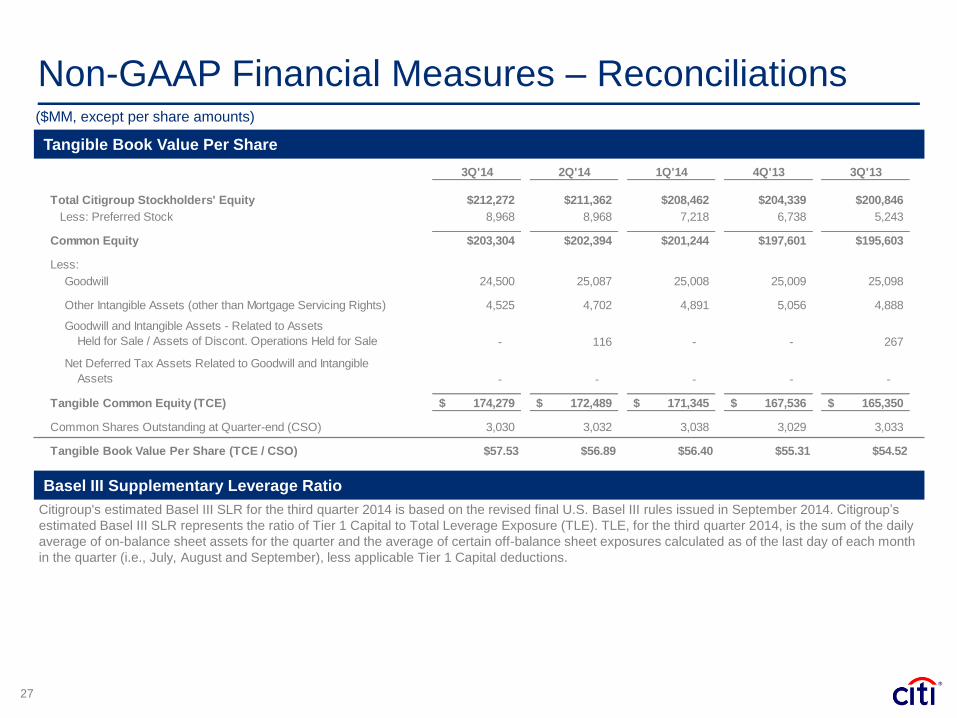
Non-GAAP Financial Measures – Reconciliations
27
Citigroup's estimated Basel III SLR for the third quarter 2014 is based on the revised final U.S. Basel III rules issued in September 2014. Citigroup’s
estimated Basel III SLR represents the ratio of Tier 1 Capital to Total Leverage Exposure (TLE). TLE, for the third quarter 2014, is the sum of the daily
average of on-balance sheet assets for the quarter and the average of certain off-balance sheet exposures calculated as of the last day of each month
in the quarter (i.e., July, August and September), less applicable Tier 1 Capital deductions.
Basel III Supplementary Leverage Ratio
Tangible Book Value Per Share
($MM, except per share amounts)
3Q'14 2Q'14 1Q'14 4Q'13 3Q'13
Total Citigroup Stockholders' Equity $212,272 $211,362 $208,462 $204,339 $200,846
Less: Preferred Stock 8,968 8,968 7,218 6,738 5,243
Common Equity $203,304 $202,394 $201,244 $197,601 $195,603
Less:
Goodwill 24,500 25,087 25,008 25,009 25,098
Other Intangible Assets (other than Mortgage Servicing Rights) 4,525 4,702 4,891 5,056 4,888
Goodwill and Intangible Assets - Related to Assets
Held for Sale / Assets of Discont. Operations Held for Sale - 116 - - 267
Net Deferred Tax Assets Related to Goodwill and Intangible
Assets - - - - -
Tangible Common Equity (TCE) 174,279$ 172,489$ 171,345$ 167,536$ 165,350$
Common Shares Outstanding at Quarter-end (CSO) 3,030 3,032 3,038 3,029 3,033
Tangible Book Value Per Share (TCE / CSO) $57.53 $56.89 $56.40 $55.31 $54.52

Non-GAAP Financial Measures – Reconciliations ($MM)
28 Note: Totals may not sum due to rounding.
Citi Holdings LTM'14 2013 2012 2011
Reported Net Income (GAAP) $(3,960) $(1,933) $(6,568) $(4,197)
Impact of:
CVA / DVA (26) 1 98 43
4Q Repositioning - - (49) (38)
MSSB - - (2,897) -
Mortgage Settlement (3,726) - - -
Adjusted Net Income $(208) $(1,934) $(3,720) $(4,202)
Institutional Clients Group LTM'14 2013 2012 2011Reported Revenues (GAAP) $33,112 $33,567 $30,762 $32,133
Impact of:
CVA/DVA (520) (345) (2,487) 1,732
Adjusted Revenues $33,632 $33,912 $33,249 $30,401
Reported Expenses (GAAP) $20,170 $20,218 $20,631 $21,090
Impact of:
Net Fraud Loss in Mexico (360) (360) - -
4Q Repositioning - - (332) (269)
Adjusted Expenses $19,810 $19,858 $20,299 $20,821
Reported Net Income (GAAP) $9,223 $9,304 $7,706 $8,082
Impact of:
CVA/DVA (318) (214) (1,543) 1,081
Net Fraud Loss in Mexico (235) (235) - -
4Q Repositioning - - (215) (174)
Adjusted Net Income $9,776 $9,753 $9,464 $7,175
Citicorp LTM'14 2013 2012 2011
Reported Revenues (GAAP) $71,035 $71,853 $69,995 $71,071
Impact of:
CVA/DVA (520) (345) (2,487) 1,732
HDFC - - 1,116 199
Akbank - - (1,605) -
SPDB - - 542 -
Adjusted Revenues $71,555 $72,198 $72,429 $69,140
Reported Net Income (GAAP) $13,379 $15,606 $14,109 $15,264
Impact of:
CVA/DVA (318) (214) (1,543) 1,081
HDFC - - 722 128
Akbank - - (1,037) -
SPDB - - 349 -
Net Fraud Loss in Mexico (235) (235) - -
Credicard 189 189 - -
Tax Item (210) 176 582 -
4Q Repositioning - - (604) (237)
Adjusted Net Income $13,953 $15,690 $15,640 $14,292
Corporate / Other LTM'14 2013 2012 2011
Reported Revenues (GAAP) $143 $121 $128 $807
Impact of:
HDFC - - 1,116 199
Akbank - - (1,605) -
SPDB - - 542 -
Adjusted Revenues $143 $121 $75 $608
Reported Net Income (GAAP) $(2,629) $(444) $(1,191) $(183)
Impact of:
HDFC - - 722 128
Akbank - - (1,037) -
SPDB - - 349 -
Credicard 189 189 - -
Tax Item (210) 176 582 -
4Q Repositioning - - (156) (21)
Adjusted Net Income $(2,608) $(809) $(1,651) $(290)