2015 Bank of America Merrill Lynch Banking & Insurance ... · 29 September 2015 2015 Bank of...
12
29 September 2015 2015 Bank of America Merrill Lynch Banking & Insurance Conference Group Chief Financial Officer Group Chief Operating Officer Tom Naratil
Transcript of 2015 Bank of America Merrill Lynch Banking & Insurance ... · 29 September 2015 2015 Bank of...
29 September 2015
2015 Bank of America Merrill Lynch
Banking & Insurance Conference
Group Chief Financial OfficerGroup Chief Operating Officer
Tom Naratil
Cautionary statement regarding forward-looking statementsThis presentation contains statements that constitute “forward-looking statements,” including but not limited to management’s outlook for UBS’s financial performance and statements relating to the anticipated effect of transactions and strategic initiatives on UBS’s business and future development. While these forward-looking statements represent UBS’s judgments and expectations concerning the matters described, a number of risks, uncertainties and other important factors could cause actual developments and results to differ materially from UBS’s expectations. These factors include, but are not limited to: (i) the degree to which UBS is successful in executing its announced strategic plans, including its cost reduction and efficiency initiatives and its planned further reduction in its Basel III risk-weighted assets (RWA) and leverage ratio denominator (LRD), and to maintain its stated capital return objective; (ii) developments in the markets in which UBS operates or to which it is exposed, including movements in securities prices or liquidity, credit spreads, currency exchange rates and interest rates and the effect of economic conditions and market developments on the financial position or creditworthiness of UBS’s clients and counterparties, and the degree to which UBS is successful in implementing changes to its business to meet changing market, regulatory and other conditions; (iii) changes in the availability of capital and funding, including any changes in UBS’s credit spreads and ratings, or arising from requirements for bail-in debt or loss-absorbing capital; (iv) changes in or the implementation of financial legislation and regulation in Switzerland, the US, the UK and other financial centers that may impose, or result in, more stringent capital (including leverage ratio), liquidity and funding requirements, incremental tax requirements, additional levies, limitations on permitted activities, constraints on remuneration or other measures; (v) uncertainty as to when and to what degree the Swiss Financial Market Supervisory Authority (FINMA) will approve reductions to the incremental RWA resulting from the supplemental operational risk capital analysis mutually agreed to by UBS and FINMA, or will approve a limited reduction of capital requirements due to measures to reduce resolvability risk; (vi) the degree to which UBS is successful in establishing a US intermediate holding company and implementing the US enhanced prudential standards, completing the squeeze-out of minority shareholders of UBS AG, and other changes which UBS may make in its legal entity structure and operating model, including the possible consequences of such changes and other similar changes that have been made previously, and the potential need to make further changes to the legal structure or booking model of UBS Group in response to legal and regulatory requirements, including capital requirements, resolvability requirements and proposals in Switzerland and other countries for mandatory structural reform of banks; (vii) changes in UBS’s competitive position, including whether differences in regulatory capital and other requirements among the major financial centers will adversely affect UBS’s ability to compete in certain lines of business; (viii) changes in the standards of conduct applicable to our businesses that may result from new regulation or new enforcement of existing standards, including measures to impose new or enhanced duties when interacting with customers or in the execution and handling of customer transactions; (ix) the liability to which UBS may be exposed, or possible constraints or sanctions that regulatory authorities might impose on UBS, due to litigation, contractual claims and regulatory investigations; (x) the effects on UBS’s cross-border banking business of tax or regulatory developments and of possible changes in UBS’s policies and practices relating to this business; (xi) UBS’s ability to retain and attract the employees necessary to generate revenues and to manage, support and control its businesses, which may be affected by competitive factors including differences in compensation practices; (xii) changes in accounting or tax standards or policies, and determinations or interpretations affecting the recognition of gain or loss, the valuation of goodwill, the recognition of deferred tax assets and other matters; (xiii) limitations on the effectiveness of UBS’s internal processes for risk management, risk control, measurement and modeling, and of financial models generally; (xiv) whether UBS will be successful in keeping pace with competitors in updating its technology, in trading businesses; (xv) the occurrence of operational failures, such as fraud, misconduct, unauthorized trading and systems failures; (xvi) restrictions to the ability of subsidiaries of the Group to make loans or distributions of any kind, directly or indirectly, to UBS Group AG; and (xvii) the effect that these or other factors or unanticipated events may have on our reputation and the additional consequences that this may have on our business and performance. The sequence in which the factors above are presented is not indicative of their likelihood of occurrence or the potential magnitude of their consequences. Our business and financial performance could be affected by other factors identified in our past and future filings and reports, including those filed with the SEC. More detailed information about those factors is set forth in documents furnished by UBS and filings made by UBS with the SEC, including UBS’s Annual Report on Form 20-F for the year ended 31 December 2014. UBS is not under any obligation to (and expressly disclaims any obligation to) update or alter its forward-looking statements, whether as a result of new information, future events, or otherwise.
Disclaimer: This presentation and the information contained herein are provided solely for information purposes, and are not to be construed as a solicitation of an offer to buy or sell any securities or other financial instruments in Switzerland, the United States or any other jurisdiction. No investment decision relating to securities of or relating to UBS Group AG, UBS AG or their affiliates should be made on the basis of this document. Refer to UBS's second quarter 2015 report and its Annual report on Form 20-F for the year ended 31 December 2014. No representation or warranty is made or implied concerning, and UBS assumes no responsibility for, the accuracy, completeness, reliability or comparability of the information contained herein relating to third parties, which is based solely on publicly available information. UBS undertakes no obligation to update the information contained herein.
© UBS 2015. The key symbol and UBS are among the registered and unregistered trademarks of UBS. All rights reserved.
1
Key messages
2015 and beyond: unlocking our full potential
The banking industry will require innovative adaptation in order to deliver further efficiencies
We continue to adapt our strategic execution to the changing regulatory and market environment
2
3
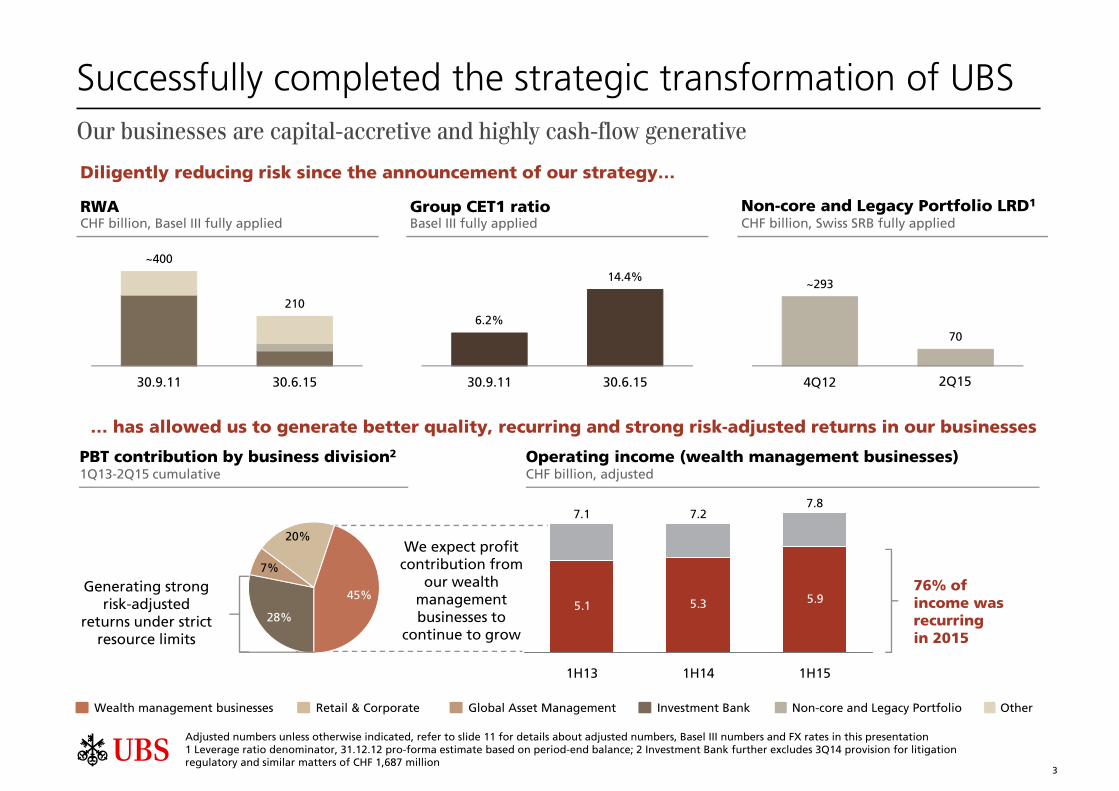
~400
210
30.9.11 30.6.15
Successfully completed the strategic transformation of UBSOur businesses are capital-accretive and highly cash-flow generative
Adjusted numbers unless otherwise indicated, refer to slide 11 for details about adjusted numbers, Basel III numbers and FX rates in this presentation1 Leverage ratio denominator, 31.12.12 pro-forma estimate based on period-end balance; 2 Investment Bank further excludes 3Q14 provision for litigation regulatory and similar matters of CHF 1,687 million
6.2%
14.4%
30.9.11 30.6.15
~293
70
31.12.12 30.6.15
Operating income (wealth management businesses) CHF billion, adjusted
5.1 5.3 5.9
1H15
7.8
1H14
7.2
1H13
7.1
76% of income was recurringin 2015
7%
20%
45%
PBT contribution by business division2
1Q13-2Q15 cumulative
28%
Generating strong risk-adjusted
returns under strict resource limits
We expect profit contribution from
our wealth management businesses to
continue to grow
OtherNon-core and Legacy PortfolioInvestment BankGlobal Asset ManagementRetail & CorporateWealth management businesses
RWACHF billion, Basel III fully applied
Non-core and Legacy Portfolio LRD1
CHF billion, Swiss SRB fully appliedGroup CET1 ratioBasel III fully applied
Diligently reducing risk since the announcement of our strategy…
… has allowed us to generate better quality, recurring and strong risk-adjusted returns in our businesses
4Q12 2Q15
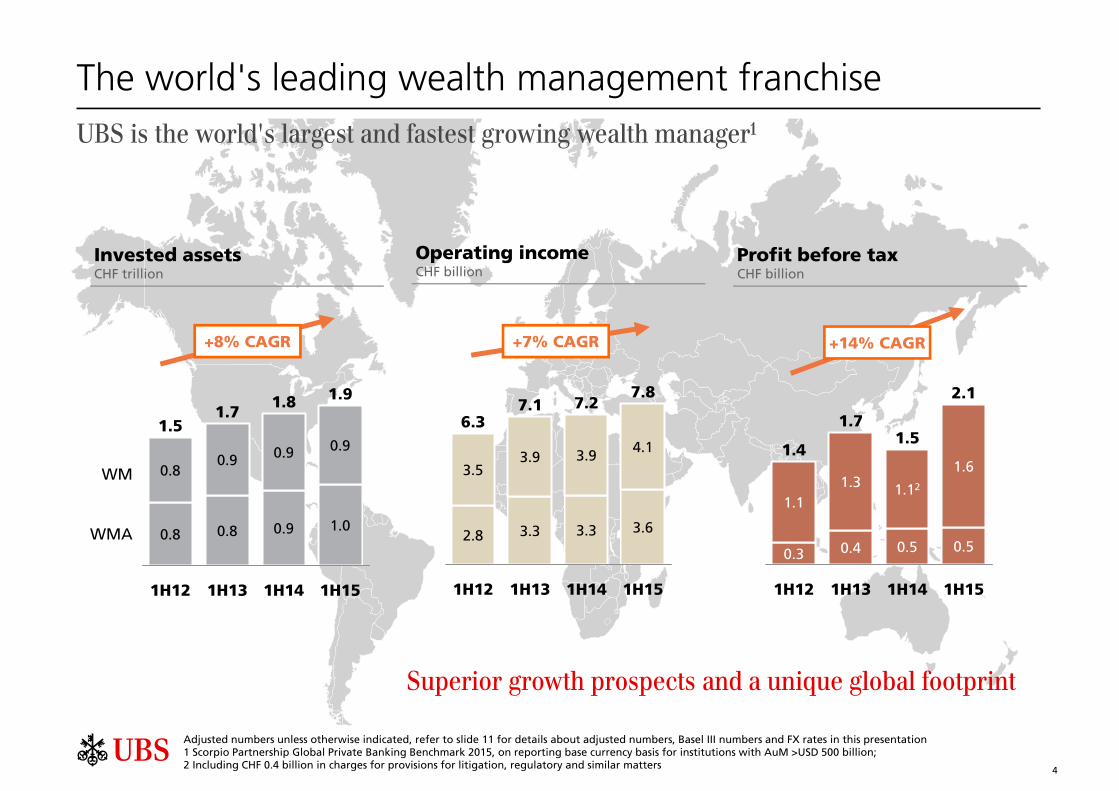
Profit before taxCHF billion
WM
WMA
Operating incomeCHF billion
Adjusted numbers unless otherwise indicated, refer to slide 11 for details about adjusted numbers, Basel III numbers and FX rates in this presentation1 Scorpio Partnership Global Private Banking Benchmark 2015, on reporting base currency basis for institutions with AuM >USD 500 billion; 2 Including CHF 0.4 billion in charges for provisions for litigation, regulatory and similar matters
1H12
1.4
0.3
1.1
0.5
1H151H13
1.12
0.5
1.5
1.6
2.1
1H14
1.3
0.4
1.7
0.9
1H15
1.0
1.9
0.9
1.8
1H13 1H14
1.7
0.90.90.8
0.80.8
1H12
1.5
3.6
1H141H12
3.3
3.5
1H15
3.3
3.9
7.1
3.9
1H13
2.8
6.3
4.1
7.27.8
+8% CAGR
Invested assetsCHF trillion
+7% CAGR +14% CAGR
Superior growth prospects and a unique global footprint
UBS is the world's largest and fastest growing wealth manager1
The world's leading wealth management franchise
4
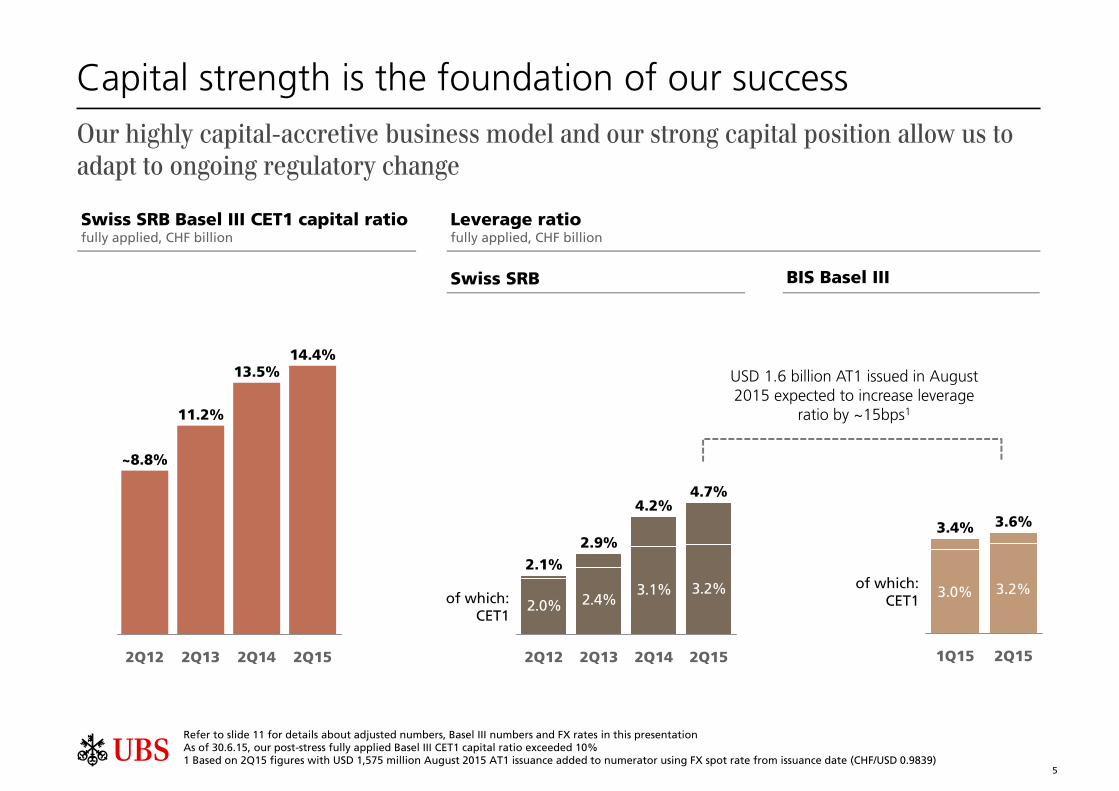
Swiss SRB Basel III CET1 capital ratiofully applied, CHF billion
Swiss SRB
Our highly capital-accretive business model and our strong capital position allow us to adapt to ongoing regulatory change
2Q15
14.4%
2Q14
13.5%
2Q13
11.2%
2Q12
~8.8%
2.0% 2.4%3.1% 3.2%
of which:CET1
2Q15
4.7%
2Q14
4.2%
2Q13
2.9%
2Q12
2.1%
Capital strength is the foundation of our success
BIS Basel III
of which:CET1
3.2%
2Q15
3.6%
1Q15
3.4%
3.0%
Leverage ratiofully applied, CHF billion
Refer to slide 11 for details about adjusted numbers, Basel III numbers and FX rates in this presentationAs of 30.6.15, our post-stress fully applied Basel III CET1 capital ratio exceeded 10%1 Based on 2Q15 figures with USD 1,575 million August 2015 AT1 issuance added to numerator using FX spot rate from issuance date (CHF/USD 0.9839)
USD 1.6 billion AT1 issued in August 2015 expected to increase leverage
ratio by ~15bps1
5
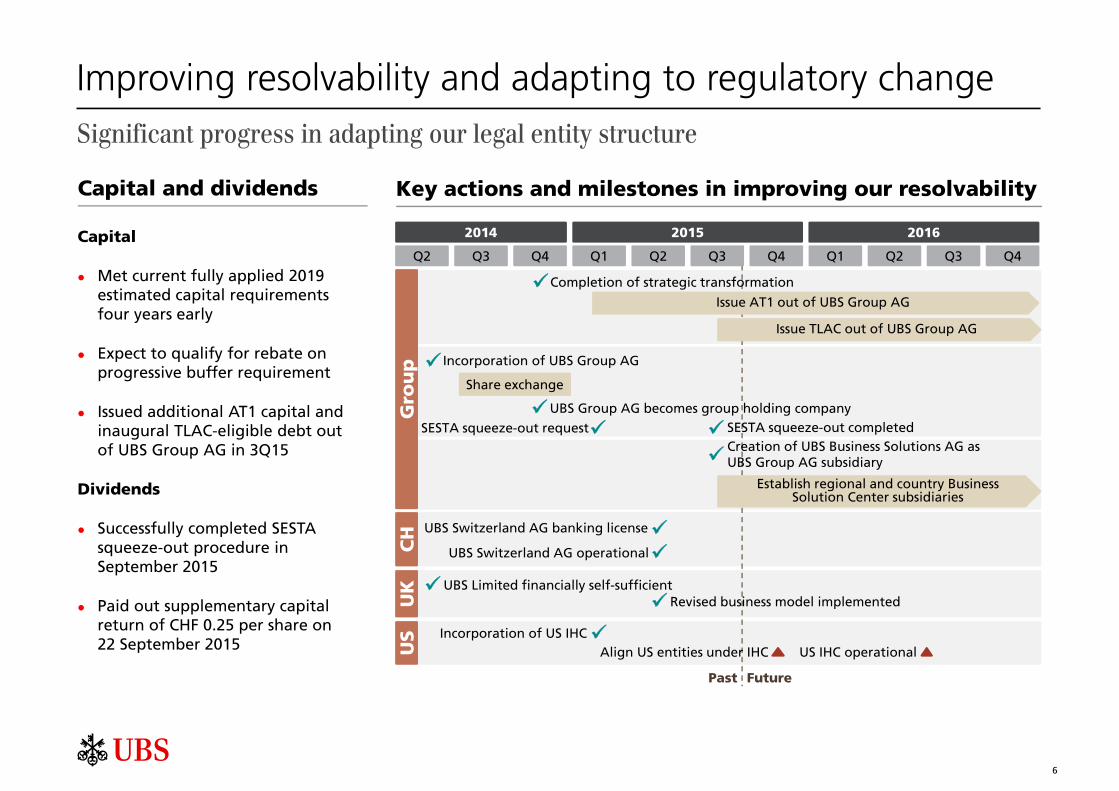
Improving resolvability and adapting to regulatory changeSignificant progress in adapting our legal entity structure
Capital
Met current fully applied 2019 estimated capital requirements four years early
Expect to qualify for rebate on progressive buffer requirement
Issued additional AT1 capital and inaugural TLAC-eligible debt outof UBS Group AG in 3Q15
Dividends
Successfully completed SESTA squeeze-out procedure in September 2015
Paid out supplementary capital return of CHF 0.25 per share on22 September 2015
Capital and dividends Key actions and milestones in improving our resolvability
2014 2016
Q2 Q3 Q4 Q1 Q2 Q4 Q1 Q2 Q3
Share exchange
Incorporation of UBS Group AG
SESTA squeeze-out request
UBS Switzerland AG banking license
UBS Switzerland AG operational
UBS Limited financially self-sufficient
Incorporation of US IHCUS IHC operational
Gro
up
CH
UK
US
UBS Group AG becomes group holding company
2015
Q4
Q3
Completion of strategic transformation
Revised business model implemented
Creation of UBS Business Solutions AG asUBS Group AG subsidiary
Align US entities under IHC
Issue TLAC out of UBS Group AG
Establish regional and country Business Solution Center subsidiaries
FuturePast
Issue AT1 out of UBS Group AG
6
SESTA squeeze-out completed
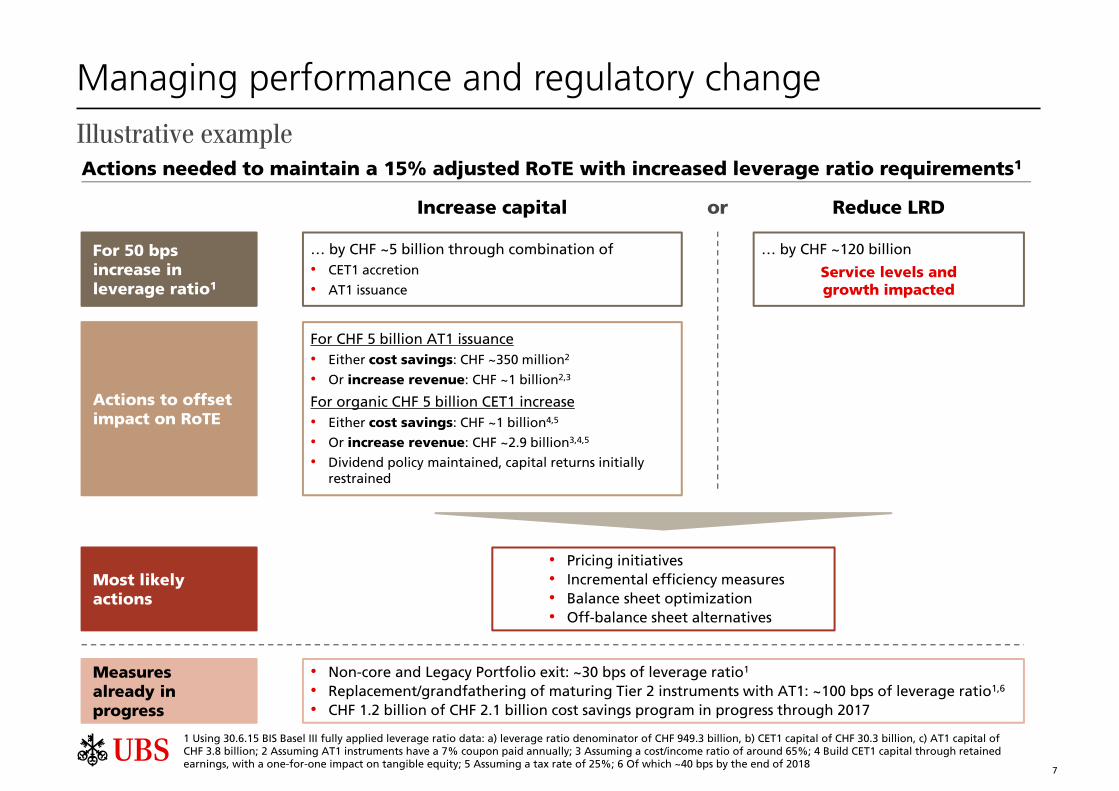
Managing performance and regulatory change
7
1 Using 30.6.15 BIS Basel III fully applied leverage ratio data: a) leverage ratio denominator of CHF 949.3 billion, b) CET1 capital of CHF 30.3 billion, c) AT1 capital of CHF 3.8 billion; 2 Assuming AT1 instruments have a 7% coupon paid annually; 3 Assuming a cost/income ratio of around 65%; 4 Build CET1 capital through retained earnings, with a one-for-one impact on tangible equity; 5 Assuming a tax rate of 25%; 6 Of which ~40 bps by the end of 2018
Actions needed to maintain a 15% adjusted RoTE with increased leverage ratio requirements1
Illustrative example
For 50 bps increase in leverage ratio1
Actions to offset impact on RoTE
Increase capital Reduce LRD
… by CHF ~5 billion through combination of• CET1 accretion
• AT1 issuance
… by CHF ~120 billion
Service levels andgrowth impacted
For CHF 5 billion AT1 issuance• Either cost savings: CHF ~350 million2
• Or increase revenue: CHF ~1 billion2,3
For organic CHF 5 billion CET1 increase• Either cost savings: CHF ~1 billion4,5
• Or increase revenue: CHF ~2.9 billion3,4,5
• Dividend policy maintained, capital returns initially restrained
Most likely actions
• Pricing initiatives• Incremental efficiency measures• Balance sheet optimization• Off-balance sheet alternatives
or
Measuresalready in progress
• Non-core and Legacy Portfolio exit: ~30 bps of leverage ratio1
• Replacement/grandfathering of maturing Tier 2 instruments with AT1: ~100 bps of leverage ratio1,6
• CHF 1.2 billion of CHF 2.1 billion cost savings program in progress through 2017
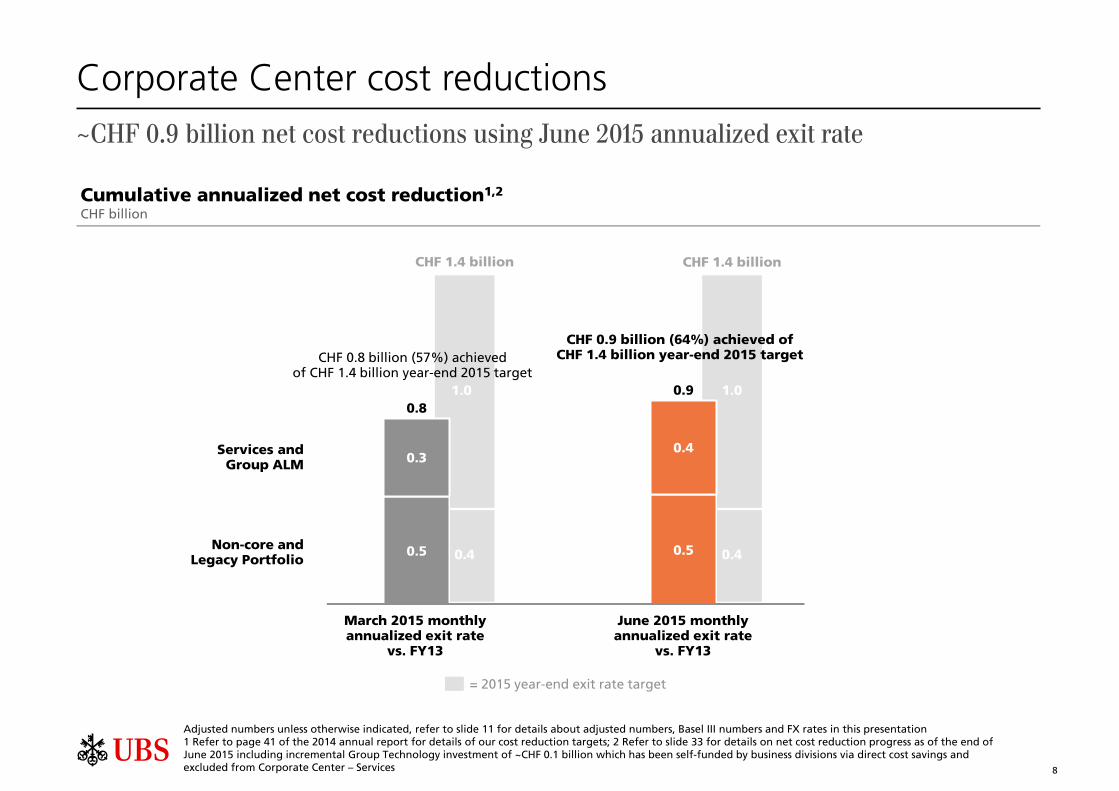
Adjusted numbers unless otherwise indicated, refer to slide 11 for details about adjusted numbers, Basel III numbers and FX rates in this presentation1 Refer to page 41 of the 2014 annual report for details of our cost reduction targets; 2 Refer to slide 33 for details on net cost reduction progress as of the end of June 2015 including incremental Group Technology investment of ~CHF 0.1 billion which has been self-funded by business divisions via direct cost savings and excluded from Corporate Center – Services
Services andGroup ALM
Non-core andLegacy Portfolio
March 2015 monthlyannualized exit rate
vs. FY13
June 2015 monthlyannualized exit rate
vs. FY13
CHF 1.4 billion
1.0
0.4
CHF 1.4 billion
1.0
0.4
Corporate Center cost reductions
= 2015 year-end exit rate target
CHF 0.9 billion (64%) achieved ofCHF 1.4 billion year-end 2015 targetCHF 0.8 billion (57%) achieved
of CHF 1.4 billion year-end 2015 target
~CHF 0.9 billion net cost reductions using June 2015 annualized exit rate
0.3
0.8
0.5
0.9
0.5
0.4
Cumulative annualized net cost reduction1,2
CHF billion
8
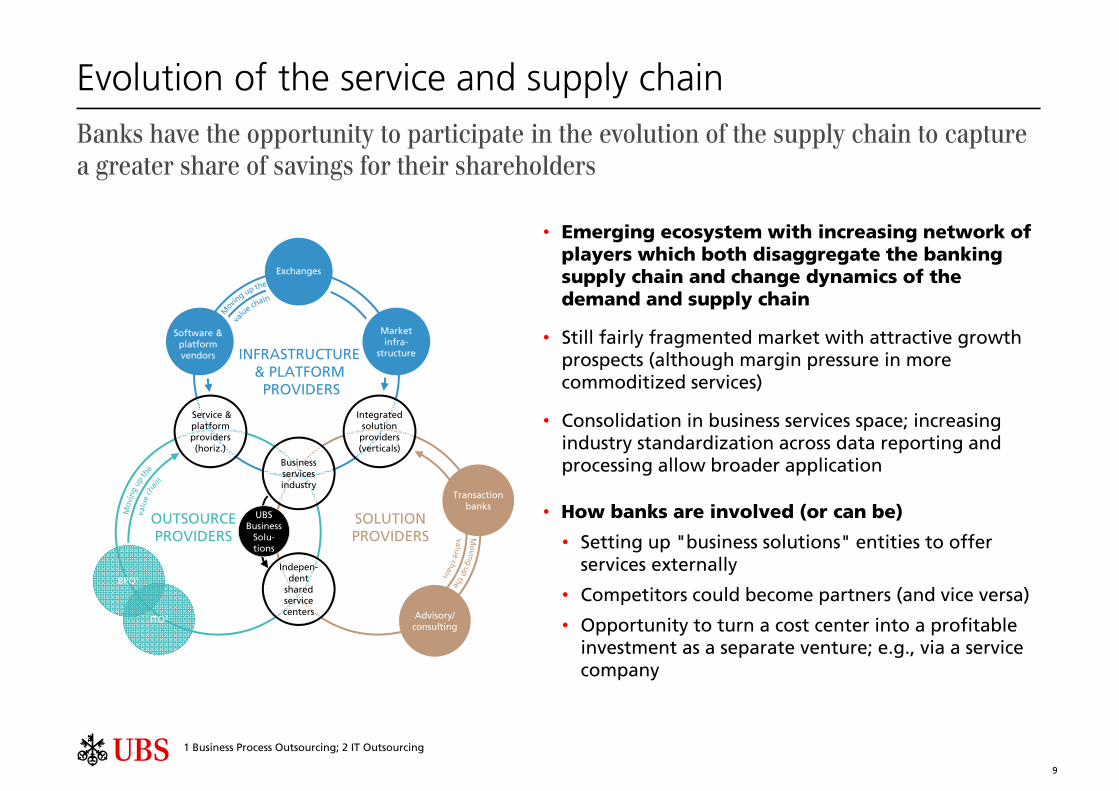
Evolution of the service and supply chain Banks have the opportunity to participate in the evolution of the supply chain to capture a greater share of savings for their shareholders
BPO1
ITO2 Advisory/ consulting
Business services industry
Integrated solution
providers (verticals)
Service & platform providers (horiz.)
Indepen-dent
shared service centers
UBS Business
Solu-tions
Software & platform vendors
Market infra-
structure
Exchanges
Transaction banks
SOLUTIONPROVIDERS
OUTSOURCEPROVIDERS
INFRASTRUCTURE & PLATFORM
PROVIDERS
• Emerging ecosystem with increasing network of players which both disaggregate the banking supply chain and change dynamics of the demand and supply chain
• Still fairly fragmented market with attractive growth prospects (although margin pressure in more commoditized services)
• Consolidation in business services space; increasing industry standardization across data reporting and processing allow broader application
• How banks are involved (or can be)
• Setting up "business solutions" entities to offer services externally
• Competitors could become partners (and vice versa)
• Opportunity to turn a cost center into a profitable investment as a separate venture; e.g., via a service company
9
1 Business Process Outsourcing; 2 IT Outsourcing
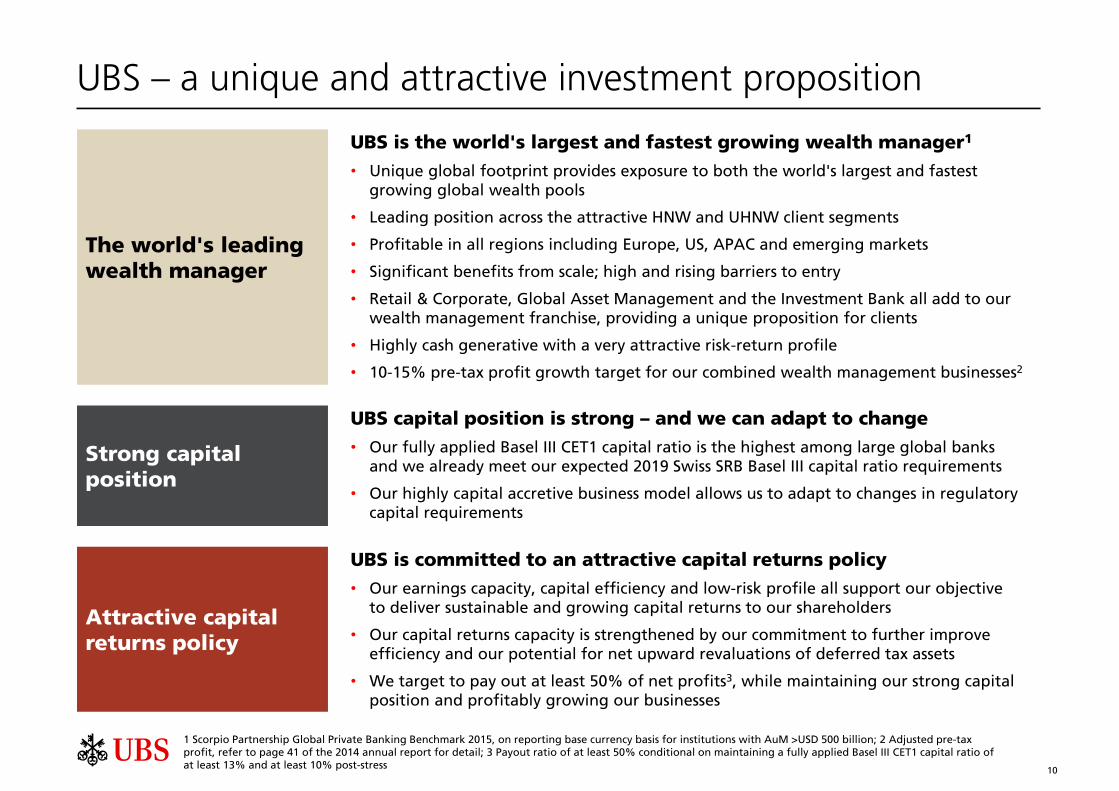
The world's leadingwealth manager
UBS is the world's largest and fastest growing wealth manager1
• Unique global footprint provides exposure to both the world's largest and fastest growing global wealth pools
• Leading position across the attractive HNW and UHNW client segments
• Profitable in all regions including Europe, US, APAC and emerging markets
• Significant benefits from scale; high and rising barriers to entry
• Retail & Corporate, Global Asset Management and the Investment Bank all add to our wealth management franchise, providing a unique proposition for clients
• Highly cash generative with a very attractive risk-return profile
• 10-15% pre-tax profit growth target for our combined wealth management businesses2
Strong capital position
UBS capital position is strong – and we can adapt to change
• Our fully applied Basel III CET1 capital ratio is the highest among large global banks and we already meet our expected 2019 Swiss SRB Basel III capital ratio requirements
• Our highly capital accretive business model allows us to adapt to changes in regulatory capital requirements
Attractive capital returns policy
UBS is committed to an attractive capital returns policy
• Our earnings capacity, capital efficiency and low-risk profile all support our objective to deliver sustainable and growing capital returns to our shareholders
• Our capital returns capacity is strengthened by our commitment to further improve efficiency and our potential for net upward revaluations of deferred tax assets
• We target to pay out at least 50% of net profits3, while maintaining our strong capital position and profitably growing our businesses
1 Scorpio Partnership Global Private Banking Benchmark 2015, on reporting base currency basis for institutions with AuM >USD 500 billion; 2 Adjusted pre-tax profit, refer to page 41 of the 2014 annual report for detail; 3 Payout ratio of at least 50% conditional on maintaining a fully applied Basel III CET1 capital ratio of at least 13% and at least 10% post-stress
UBS – a unique and attractive investment proposition
10
Use of adjusted numbersUnless otherwise indicated, “adjusted” figures exclude the adjustment items, to the extent applicable, on a Group and business division level. Adjusted results are a non-GAAP financial measure as defined by SEC regulations. Refer to page 14 of the 2Q15 financial report for an overview of adjusted numbers.
If applicable for a given adjusted KPI (i.e., adjusted return on tangible equity), adjustment items are calculated on an after-tax basis by applying indicative tax rates (i.e., 2% for own credit, 22% for other items, and with certain large items assessed on a case-by-case basis). Refer to page 24 of the 2Q15 financial report for more information.
Basel III RWA, Basel III capital and Basel III liquidity ratiosBasel III numbers are based on the BIS Basel III framework, as applicable for Swiss Systemically relevant banks (SRB). Numbers in the presentation are Swiss SRB Basel III numbers unless otherwise stated. Our fully applied and phase-in Swiss SRB Basel III and BIS Basel III capital components have the same basis of calculation, except for differences disclosed on page 96 of the 2Q15 financial report.
Basel III risk-weighted assets in this presentation are calculated on the basis of Basel III fully applied unless otherwise stated. Our RWA under BIS Basel III are the same as under Swiss SRB Basel III.
Leverage ratio and leverage ratio denominator in this presentation are calculated on the basis of fully applied Swiss SRB, unless otherwise stated.
Refer to the “Capital Management” section in the 2Q15 financial report for more information.
Currency translationMonthly income statement items of foreign operations with a functional currency other than Swiss francs are translated with month-end rates into Swiss francs. Refer to “Note 19 Currency translation rates” in the 2Q15 financial report for more information.
RoundingNumbers presented throughout this presentation may not add up precisely to the totals provided in the tables and text. Percentages, percent changes and absolute variances are calculated based on rounded figures displayed in the tables and text and may not precisely reflect the percentages, percent changes and absolute variances that would be derived based on figures that are not rounded.
Important information related to this presentation
11