Asset Management Plan - Junee Shire · 4.4 Changes in Technology ... What is an Asset Management...
53
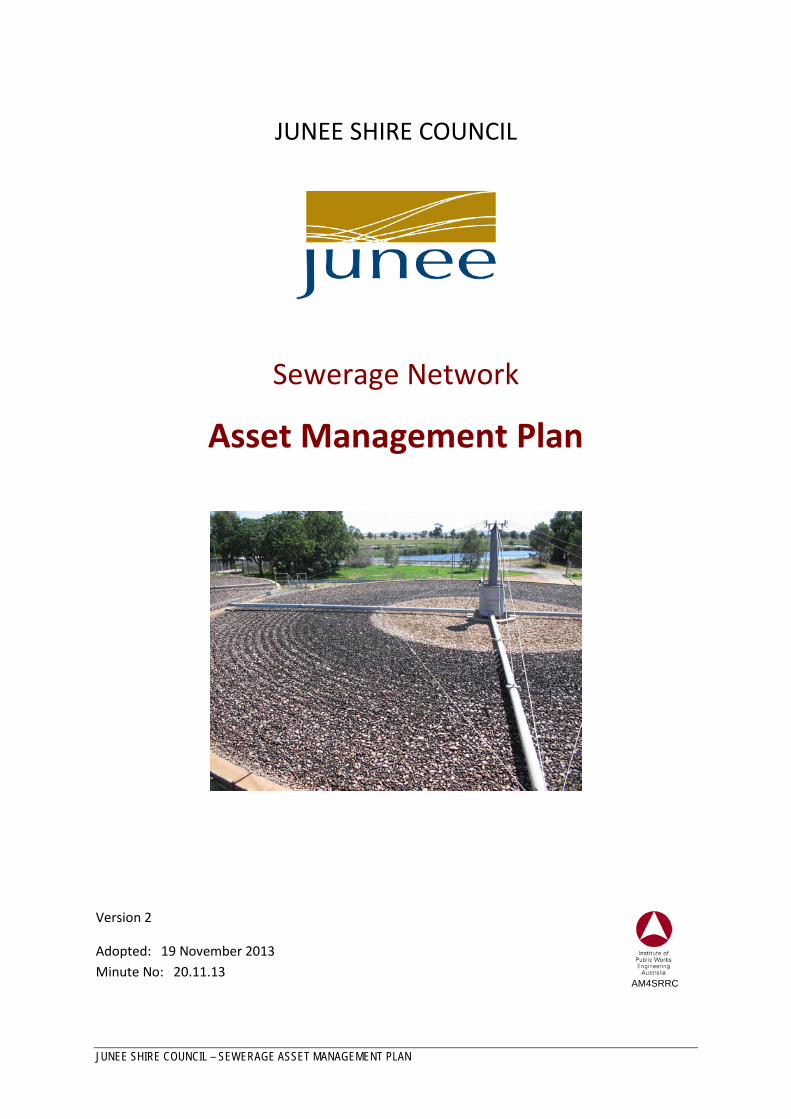
JUNEE SHIRE COUNCIL Sewerage Network Asset Management Plan Version 2 Adopted: 19 November 2013 Minute No: 20.11.13 AM4SRRC JUNEE SHIRE COUNCIL – SEWERAGE ASSET MANAGEMENT PLAN
Transcript of Asset Management Plan - Junee Shire · 4.4 Changes in Technology ... What is an Asset Management...
JUNEE SHIRE COUNCIL
Sewerage Network
Asset Management Plan
Version 2
Adopted: 19 November 2013 Minute No: 20.11.13
AM4SRRC
JUNEE SHIRE COUNCIL – SEWERAGE ASSET MANAGEMENT PLAN
Document Control Asset Management for Small, Rural or Remote Communities
Document ID: sewerage asset management plan.doc
Rev No Date Revision Details Author Reviewer Approver
1 February 2012 Original document DE DES Council
2 September 2013 Update valuations and forecast expenditure DE DES Council
Asset Management for Small, Rural or Remote Communities Practice Note
The Institute of Public Works Engineering Australia.
www.ipwea.org.au/AM4SRRC
© Copyright 2011 – All rights reserved.
JUNEE SHIRE COUNCIL – SEWERAGE SERVICES ASSET MANAGEMENT PLAN
- i -
TABLE OF CONTENTS
1. EXECUTIVE SUMMARY ................................................................................................................... iii 2. INTRODUCTION ............................................................................................................................... 1
2.1 Background ............................................................................................................................. 1 2.2 Goals and Objectives of Asset Management .......................................................................... 3 2.3 Plan Framework ...................................................................................................................... 3 2.4 Core and Advanced Asset Management ................................................................................. 5 2.5 Community Consultation ........................................................................................................ 5
3. LEVELS OF SERVICE .......................................................................................................................... 5 3.1 Customer Research and Expectations .................................................................................... 5 3.2 Strategic and Corporate Goals ................................................................................................ 5 3.3 Legislative Requirements ........................................................................................................ 6 3.4 Current Levels of Service......................................................................................................... 7 3.4 Desired Levels of Service ....................................................................................................... 11
4. FUTURE DEMAND ......................................................................................................................... 11 4.1 Demand Drivers .................................................................................................................... 11 4.2 Demand Forecast .................................................................................................................. 11 4.3 Demand Impact on Assets .................................................................................................... 11 4.4 Changes in Technology ......................................................................................................... 12 4.5 Demand Management Plan .................................................................................................. 12 4.4 Asset Programs to meet Demand ......................................................................................... 12
5. LIFECYCLE MANAGEMENT PLAN ................................................................................................... 14 5.1 Background Data ................................................................................................................... 14 5.2 Infrastructure Risk Management Plan .................................................................................. 16 5.3 Routine Maintenance Plan .................................................................................................... 17 5.4 Renewal/Replacement Plan .................................................................................................. 18 5.5 Creation/Acquisition/Upgrade Plan ...................................................................................... 20 5.6 Disposal Plan ......................................................................................................................... 22 5.7 Service Consequences and Risks ........................................................................................... 22
6. FINANCIAL SUMMARY ................................................................................................................... 23 6.1 Financial Statements and Projections ................................................................................... 23 6.2 Funding Strategy ................................................................................................................... 27 6.3 Valuation Forecasts ............................................................................................................... 27 6.4 Key Assumptions made in Financial Forecasts...................................................................... 29 6.5 Forecast Reliability and Confidence ...................................................................................... 30
7. PLAN IMPROVEMENT AND MONITORING .................................................................................... 31 7.1 Status of Asset Management Practices ................................................................................ 31 7.2 Asset Management Systems ................................................................................................. 31 7.3 Improvement Program.......................................................................................................... 32 7.4 Monitoring and Review Procedures ..................................................................................... 32 7.5 Performance Measures ......................................................................................................... 32
REFERENCES .......................................................................................................................................... 33 APPENDICES .......................................................................................................................................... 34
Appendix A Maintenance Response Levels of Service .................................................................... 35 Appendix B Projected 10 year Capital Renewal Works Program .................................................... 36 Appendix C Planned Upgrade/Exp/New 10 year Capital Works Program ...................................... 37 Appendix D Abbreviations ............................................................................................................... 41 Appendix E Glossary ........................................................................................................................ 42
JUNEE SHIRE COUNCIL – SEWERAGE ASSET MANAGEMENT PLAN
- ii -
This page is left intentionally blank.
JUNEE SHIRE COUNCIL – SEWERAGE SERVICES ASSET MANAGEMENT PLAN

- iii -
1. EXECUTIVE SUMMARY
Context Junee Shire is located in the south-west slopes of NSW, bordered by Wagga City to its south, Coolamon to its west, Temora and Cootamundra to the north and Gundagai to the east. The Local Government area (LGA) is centred on the township of Junee, population of the shire is approximately 6083.
Agriculture is the dominant industry for the LGA and the pressures of drought, rising input prices and lower commodity prices are shared across the Shire.
The sewerage network provides for the conveyance, treatment and re-use of wastewater for the town of Junee.
The majority of the network was constructed early in the 20th century and, as such, these assets are coming to the end of their useful life. This poses a major challenge for the Council in terms of funding the renewal of these assets whilst maintaining existing levels of service.
As the issue of water security receives more attention and a greater importance is placed on securing water resources, it is expected that mandatory or minimum levels of service – in terms of the quality of wastewater treatment – will be raised.
The Sewerage Service The sewerage network comprises: • Approximately 41km of gravity sewer main • A trickling filter wastewater treatment plant • A Pasveer Channel wastewater treatment plant • Treated-effluent storage ponds • Treated effluent reticulation network comprising
four pumps and approximately 4.5km of pressure main
These infrastructure assets have a replacement value of $20.06 million.
What does it Cost? The projected outlays necessary to provide the services covered by this Asset Management Plan (AM Plan) includes operations, maintenance, renewal and upgrade of existing assets over the 10 year planning period is $9,228,000 or $923,000 on average per year.
Estimated available funding for this period is $7,780,000 or $778,000 on average per year which is 84% of the cost to provide the service. This is a funding shortfall of $145,000 on average per year. Projected expenditure required to provide services in the AM Plan compared with planned expenditure
currently included in the Long Term Financial Plan are shown in the graph below.
The shortfall can be largely attributed to the forecast renewal of the wastewater treatment plant in 2020. To address this, low cost renewal options will be explored, as will the viability of increasing funding for these works.
What we will do Council plans to provide sewerage services for the following: • Operation, maintenance, renewal and upgrade of
sewer mains, treatment facilities and the re-use network to meet service levels set by the Council in annual budgets.
• Construction of a new treatment facility within the 10 year planning period to replace the existing facility.
Managing the Risks There are risks associated with providing the service and not being able to complete all identified activities and projects. We have identified major risks as: • High levels of inflow and infiltration • Increasingly tight restrictions on treatment
standards • Excess loading of treatment works • Blockages and collapse of gravity mains
We will endeavour to manage these risks within available funding by: • Continuing with programmed renewals, focusing
on areas of high inflow and; locating and terminating illegal connections
• Undertaking cost effective improvements to the treatment process
• Record and monitor faults in the network and understand why and when they happen
The Next Steps The actions resulting from this asset management plan are:
JUNEE SHIRE COUNCIL – SEWERAGE SERVICES ASSET MANAGEMENT PLAN
- iv -
• Develop system to link AM with financial services Questions you may have What is this plan about? This asset management plan covers the infrastructure assets that serve the Junee community’s wastewater treatment needs. These assets include sewer mains, man holes, treatment plants and the re-use reticulation network throughout the Council area that provides for the safe and effective treatment of wastewater and its reuse.
What is an Asset Management Plan? Asset management planning is a comprehensive process to ensure delivery of services from infrastructure is provided in a financially sustainable manner.
An asset management plan details information about infrastructure assets including actions required to provide an agreed level of service in the most cost effective manner. The Plan defines the services to be provided, how the services are provided and what funds are required to provide the services.
Is there a funding shortfall? Most of the Council’s sewerage network was constructed from government grants often provided and accepted without consideration of ongoing operations, maintenance and replacement needs.
Many of these assets are approaching the latter years of their life and require replacement; services from the assets are decreasing and maintenance costs are increasing.
The Councils’ present funding levels though are sufficient to continue to provide existing services at current levels in the medium term.
What options do we have? To protect against a funding shortfall several steps are involved: 1. Improving asset knowledge so that data
accurately records the asset inventory, how assets are performing and when assets are not able to provide the required service levels,
2. Improving our efficiency in operating, maintaining, replacing existing and constructing new assets to optimise life cycle costs,
3. Identifying and managing risks associated with providing services from infrastructure,
4. Making tradeoffs between service levels and costs to ensure that the community receives the best return from infrastructure,
5. Indentifying assets surplus to needs for disposal to make saving in future operations and maintenance costs
6. Consulting with the community to ensure that sewerage services and costs meet community needs and are affordable,
7. Developing partnership with other bodies, where available to provide services;
8. Seeking additional funding from governments and other bodies to better reflect a ‘whole of government’ funding approach to infrastructure services.
What happens if we don’t manage the assets? If not managed correctly, we will have a shortfall and it is likely that council will have to reduce service levels in some areas, unless new sources of revenue are found. For sewerage, the service level reduction may include increased response times to more frequent network failures, reduced quality of wastewater treatment or the loss of treated effluent as a resource for the community.
What can we do? Council can develop options and priorities for future sewerage services with costs of providing the services, consult with the community to plan future services to match the community services needs with ability to pay for services and maximise benefit to the community for costs to the community.
What can you do? Council will be pleased to consider your thoughts on the issues raised in this asset management plan and suggestions on how Council may change its sewerage services mix to ensure that the appropriate level of service can be provided to the community.
.
JUNEE SHIRE COUNCIL – SEWERAGE SERVICES ASSET MANAGEMENT PLAN
- 1 -
2. INTRODUCTION
2.1 Background
This asset management plan is to demonstrate responsive management of assets (and services provided from assets), compliance with regulatory requirements, and to communicate funding needed to provide the required levels of service.
The asset management plan is to be read with Council’s Asset Management Policy, Asset Management Strategy and the following associated planning documents:
• Strategic Business Plan – Sewerage 2011-2030 • Long Term Financial Plan 2013-14 • Delivery Plan 2014 • Operational Plan 2013-14 • Community Strategic Plan 2013-14
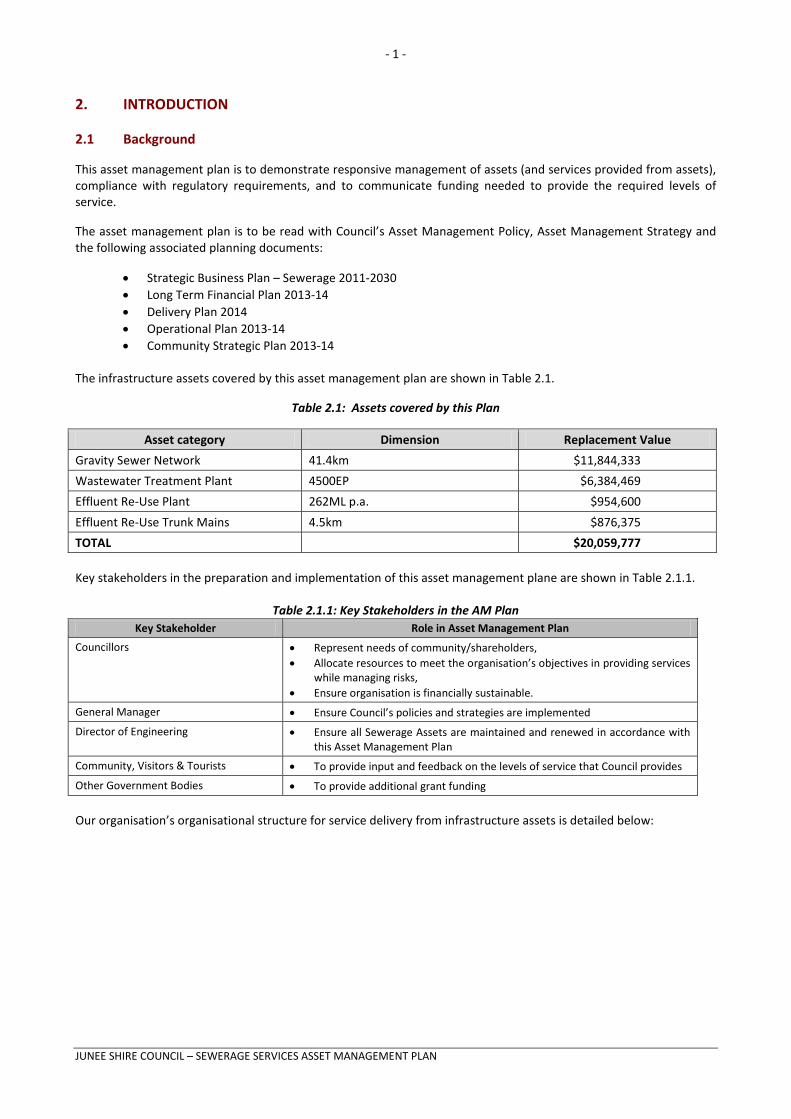
The infrastructure assets covered by this asset management plan are shown in Table 2.1.
Table 2.1: Assets covered by this Plan
Asset category Dimension Replacement Value Gravity Sewer Network 41.4km $11,844,333 Wastewater Treatment Plant 4500EP $6,384,469 Effluent Re-Use Plant 262ML p.a. $954,600 Effluent Re-Use Trunk Mains 4.5km $876,375 TOTAL $20,059,777 Key stakeholders in the preparation and implementation of this asset management plane are shown in Table 2.1.1.
Table 2.1.1: Key Stakeholders in the AM Plan Key Stakeholder Role in Asset Management Plan
Councillors • Represent needs of community/shareholders, • Allocate resources to meet the organisation’s objectives in providing services
while managing risks, • Ensure organisation is financially sustainable.
General Manager • Ensure Council’s policies and strategies are implemented
Director of Engineering • Ensure all Sewerage Assets are maintained and renewed in accordance with this Asset Management Plan
Community, Visitors & Tourists • To provide input and feedback on the levels of service that Council provides
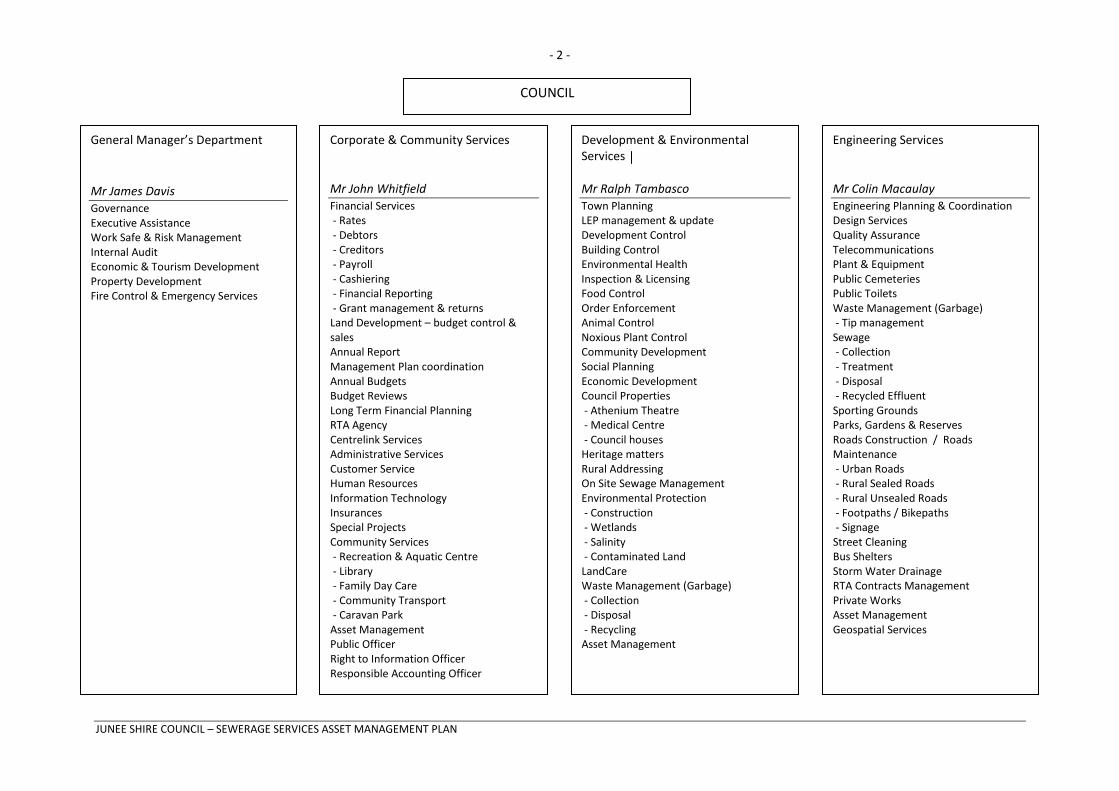
Other Government Bodies • To provide additional grant funding Our organisation’s organisational structure for service delivery from infrastructure assets is detailed below:
JUNEE SHIRE COUNCIL – SEWERAGE SERVICES ASSET MANAGEMENT PLAN
- 2 -
General Manager’s Department Mr James Davis Governance Executive Assistance Work Safe & Risk Management Internal Audit Economic & Tourism Development Property Development Fire Control & Emergency Services
Corporate & Community Services Mr John Whitfield Financial Services - Rates - Debtors - Creditors - Payroll - Cashiering - Financial Reporting - Grant management & returns Land Development – budget control & sales Annual Report Management Plan coordination Annual Budgets Budget Reviews Long Term Financial Planning RTA Agency Centrelink Services Administrative Services Customer Service Human Resources Information Technology Insurances Special Projects Community Services - Recreation & Aquatic Centre - Library - Family Day Care - Community Transport - Caravan Park Asset Management Public Officer Right to Information Officer Responsible Accounting Officer
Development & Environmental Services Mr Ralph Tambasco Town Planning LEP management & update Development Control Building Control Environmental Health Inspection & Licensing Food Control Order Enforcement Animal Control Noxious Plant Control Community Development Social Planning Economic Development Council Properties - Athenium Theatre - Medical Centre - Council houses Heritage matters Rural Addressing On Site Sewage Management Environmental Protection - Construction - Wetlands - Salinity - Contaminated Land LandCare Waste Management (Garbage) - Collection - Disposal - Recycling Asset Management
Engineering Services Mr Colin Macaulay Engineering Planning & Coordination Design Services Quality Assurance Telecommunications Plant & Equipment Public Cemeteries Public Toilets Waste Management (Garbage) - Tip management Sewage - Collection - Treatment - Disposal - Recycled Effluent Sporting Grounds Parks, Gardens & Reserves Roads Construction / Roads Maintenance - Urban Roads - Rural Sealed Roads - Rural Unsealed Roads - Footpaths / Bikepaths - Signage Street Cleaning Bus Shelters Storm Water Drainage RTA Contracts Management Private Works Asset Management Geospatial Services
COUNCIL
JUNEE SHIRE COUNCIL – SEWERAGE SERVICES ASSET MANAGEMENT PLAN
- 3 -
2.2 Goals and Objectives of Asset Management The organisation exists to provide sewerage services to its community. All of these services are provided by infrastructure assets. We have acquired infrastructure assets from construction by our staff, from government grants and rate income.
Our goal in managing infrastructure assets is to meet the defined level of service (as amended from time to time) in the most cost effective manner for present and future consumers. The key elements of infrastructure asset management are:
• Providing a defined level of service and monitoring performance, • Managing the impact of growth through demand management and infrastructure investment, • Taking a lifecycle approach to developing cost-effective management strategies for the long-term that meet
the defined level of service, • Identifying, assessing and appropriately controlling risks, and • Having a long-term financial plan which identifies required, affordable expenditure and how it will be
financed.
2.3 Plan Framework
Key elements of the plan are
• Levels of service – specifies the services and levels of service to be provided by the organisation, • Future demand – how this will impact on future service delivery and how this is to be met, • Life cycle management – how we will manage our existing and future assets to provide defined levels of
service, • Financial summary – what funds are required to provide the defined services, • Asset management practices, • Monitoring – how the plan will be monitored to ensure it is meeting the organisation’s objectives, • Asset management improvement plan.
A road map for preparing an asset management plan is shown below.
JUNEE SHIRE COUNCIL – SEWERAGE SERVICES ASSET MANAGEMENT PLAN
- 4 -
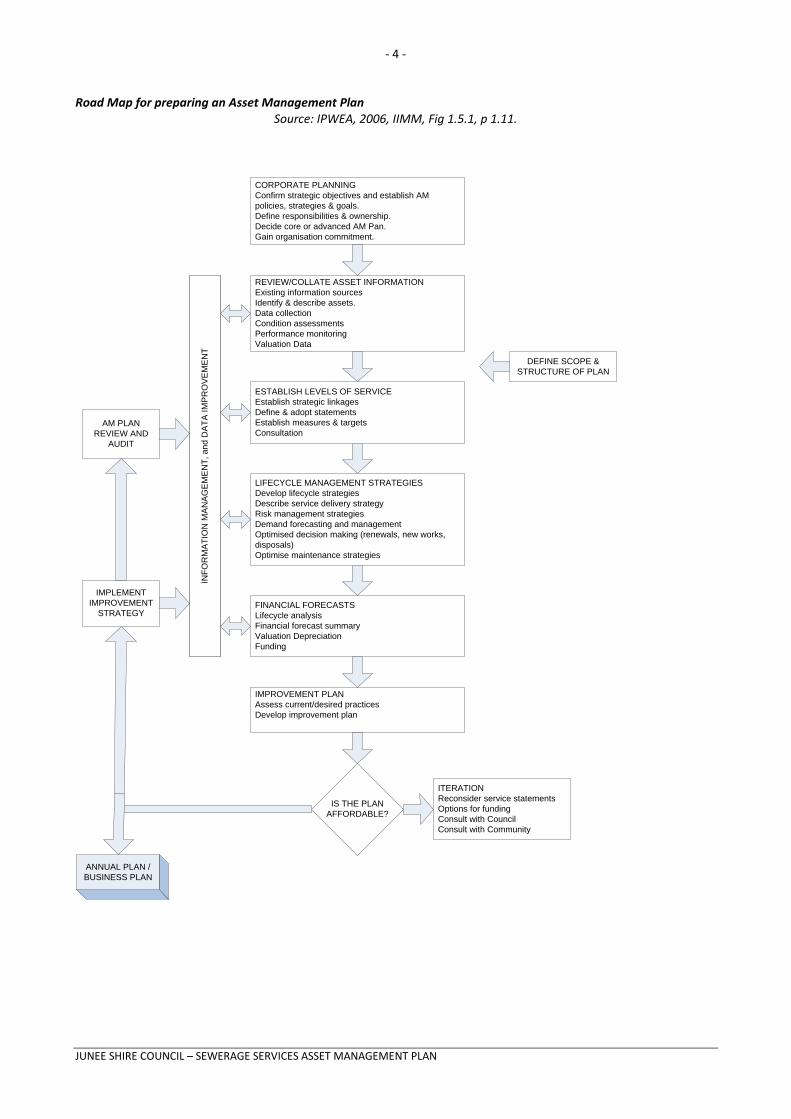
Road Map for preparing an Asset Management Plan Source: IPWEA, 2006, IIMM, Fig 1.5.1, p 1.11.
IS THE PLAN AFFORDABLE?
CORPORATE PLANNINGConfirm strategic objectives and establish AM policies, strategies & goals. Define responsibilities & ownership.Decide core or advanced AM Pan.Gain organisation commitment.
REVIEW/COLLATE ASSET INFORMATIONExisting information sourcesIdentify & describe assets.Data collectionCondition assessmentsPerformance monitoringValuation Data
ESTABLISH LEVELS OF SERVICEEstablish strategic linkagesDefine & adopt statementsEstablish measures & targetsConsultation
LIFECYCLE MANAGEMENT STRATEGIESDevelop lifecycle strategiesDescribe service delivery strategyRisk management strategiesDemand forecasting and managementOptimised decision making (renewals, new works, disposals)Optimise maintenance strategies
FINANCIAL FORECASTSLifecycle analysisFinancial forecast summaryValuation DepreciationFunding
IMPROVEMENT PLANAssess current/desired practicesDevelop improvement plan
ITERATIONReconsider service statementsOptions for fundingConsult with CouncilConsult with Community
DEFINE SCOPE & STRUCTURE OF PLAN
INFO
RM
ATI
ON
MA
NA
GE
ME
NT,
and
DA
TA IM
PR
OV
EM
EN
T
AM PLAN REVIEW AND
AUDIT
IMPLEMENT IMPROVEMENT
STRATEGY
ANNUAL PLAN / BUSINESS PLAN
INFO
RM
ATI
ON
MA
NA
GE
ME
NT,
and
DA
TA IM
PR
OV
EM
EN
T
JUNEE SHIRE COUNCIL – SEWERAGE SERVICES ASSET MANAGEMENT PLAN
- 5 -
2.4 Core and Advanced Asset Management
This asset management plan is prepared as a first cut ‘core’ asset management plan in accordance with the International Infrastructure Management Manual1. It is prepared to meet minimum legislative and organisational requirements for sustainable service delivery and long term financial planning and reporting. Core asset management is a ‘top down’ approach where analysis is applied at the ‘system’ or ‘network’ level.
2.5 Community Consultation
This ‘core’ asset management plan is prepared to facilitate community consultation initially through feedback on public display of draft asset management plans prior to adoption by Council. Future revisions of the asset management plan will incorporate community consultation on service levels and costs of providing the service. This will assist Council and the community in matching the level of service needed by the community, service risks and consequences with the community’s ability to pay for the service.
Future revisions of this asset management plan will move towards ‘advanced’ asset management using a ‘bottom up’ approach for gathering asset information for individual assets to support the optimisation of activities and programs to meet agreed service levels.
3. LEVELS OF SERVICE
3.1 Customer Research and Expectations
Junee Shire Council conducted a considerable community survey in 2011. From this survey, satisfaction with sewerage services were rated as being above average when compared to other services provided by council, however the importance of sewerage services were rated as being below average.
3.2 Strategic and Corporate Goals
This asset management plan is prepared under the direction of the organisation’s vision, mission, goals and objectives.
Our vision is:
“Junee will be a great place to live, with a healthy civic pride. That will come about because the amenity of the shire – social, recreational, cultural, environmental and visual – is the best quality possible given our circumstances. There will be an increase in population because of this, with the increase made up of people who are net contributors to the community.” “Junee will be prosperous and existing services and businesses will have been preserved and grown. The shire will have economic development strategies recognising the different circumstances of urban and rural areas.” “Junee will be a place where innovative, responsive leadership and management occurs in all facets of community life.” “It will be an independent Local Government area with a strong sense of identity.”
Our mission is:
“Through effective leadership and management, Junee Shire Council will enable the Shire to advance systematically towards its desired vision.”
Relevant organisation goals and objectives and how these are addressed in this asset management plan are:
1 IPWEA, 2006.
JUNEE SHIRE COUNCIL – SEWERAGE SERVICES ASSET MANAGEMENT PLAN
- 6 -
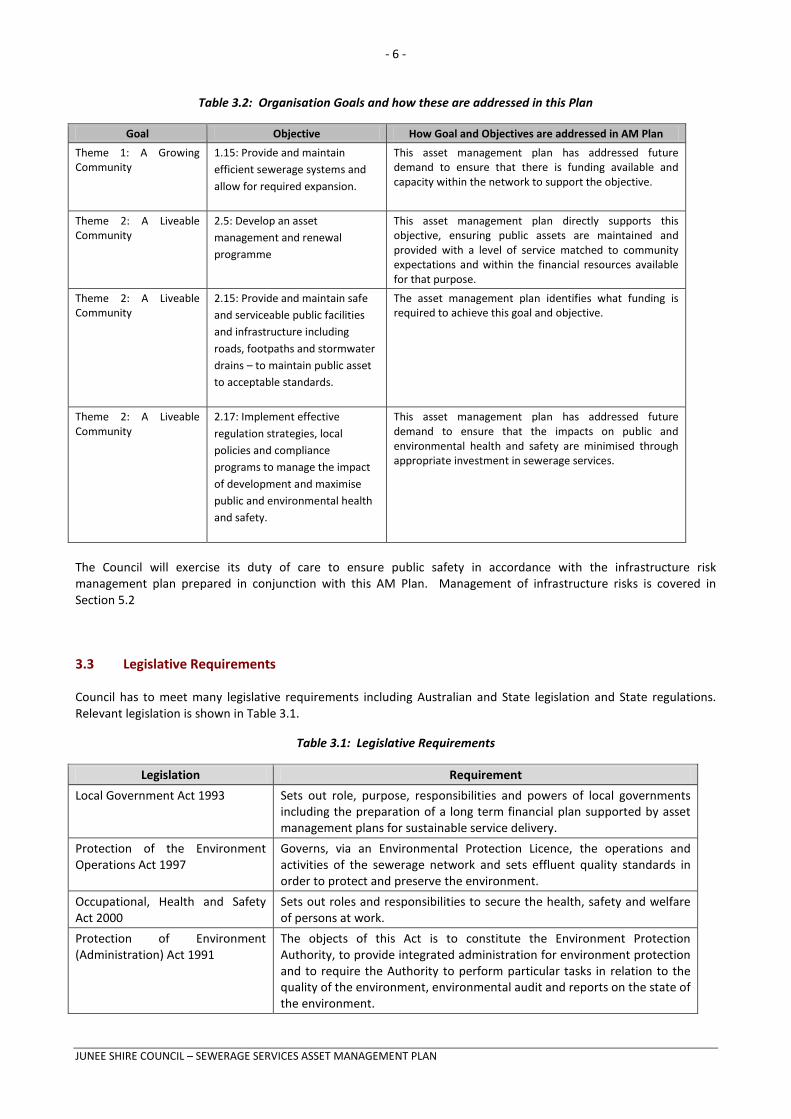
Table 3.2: Organisation Goals and how these are addressed in this Plan
Goal Objective How Goal and Objectives are addressed in AM Plan
Theme 1: A Growing Community
1.15: Provide and maintain efficient sewerage systems and allow for required expansion.
This asset management plan has addressed future demand to ensure that there is funding available and capacity within the network to support the objective.
Theme 2: A Liveable Community
2.5: Develop an asset management and renewal programme
This asset management plan directly supports this objective, ensuring public assets are maintained and provided with a level of service matched to community expectations and within the financial resources available for that purpose.
Theme 2: A Liveable Community
2.15: Provide and maintain safe and serviceable public facilities and infrastructure including roads, footpaths and stormwater drains – to maintain public asset to acceptable standards.
The asset management plan identifies what funding is required to achieve this goal and objective.
Theme 2: A Liveable Community
2.17: Implement effective regulation strategies, local policies and compliance programs to manage the impact of development and maximise public and environmental health and safety.
This asset management plan has addressed future demand to ensure that the impacts on public and environmental health and safety are minimised through appropriate investment in sewerage services.
The Council will exercise its duty of care to ensure public safety in accordance with the infrastructure risk management plan prepared in conjunction with this AM Plan. Management of infrastructure risks is covered in Section 5.2
3.3 Legislative Requirements
Council has to meet many legislative requirements including Australian and State legislation and State regulations. Relevant legislation is shown in Table 3.1.
Table 3.1: Legislative Requirements
Legislation Requirement Local Government Act 1993 Sets out role, purpose, responsibilities and powers of local governments
including the preparation of a long term financial plan supported by asset management plans for sustainable service delivery.
Protection of the Environment Operations Act 1997
Governs, via an Environmental Protection Licence, the operations and activities of the sewerage network and sets effluent quality standards in order to protect and preserve the environment.
Occupational, Health and Safety Act 2000
Sets out roles and responsibilities to secure the health, safety and welfare of persons at work.
Protection of Environment (Administration) Act 1991
The objects of this Act is to constitute the Environment Protection Authority, to provide integrated administration for environment protection and to require the Authority to perform particular tasks in relation to the quality of the environment, environmental audit and reports on the state of the environment.
JUNEE SHIRE COUNCIL – SEWERAGE SERVICES ASSET MANAGEMENT PLAN

- 7 -
Environmental Planning and Assessment Act 1979
Sets out to encourage the proper management, development and conservation of natural and artificial resources for the purpose of promoting the social and economic welfare of the community and a better environment and the protection of the environment, including the protection and conservation of native animals and plants, including threatened species, populations and ecological communities, and their habitats.
National Environmental Protection Measures (Implementation) Act 1998
The objects of this Act are to make provision for the implementation of national environmental protection measures to protect, restore and enhance the quality of the environment and to ensure that the community has access to relevant and meaningful information about pollution in Australia. It is based on an Intergovernmental Agreement on the Environment 1992 (‘the IGAE’), in which the Commonwealth, State and Territory Governments agreed to work together to develop uniform national environment protection standards for the control of air, water, land and noise pollution.
Workers Compensation Act 1987 Sets out to provide for the compensation and rehabilitation of workers in respect of work related injuries.
Public Health Act 1991 The objectives of this Act are to protect the public health of the community.
Waste Avoidance and Resource Recovery Act 2001
The objects of this Act are to encourage the most efficient use of resources, to provide for the continual reduction in waste generation, to minimise the consumption of natural resources, to ensure efficient funding of waste and resource management planning and to assist with the achievement of the objectives of the Protection of Environment Operations Act.
Public Works Act 1912 Sets out to provide the legal framework for an effective and transparent operation of Public Works in NSW.
Civil Liabilities Act 2002 Sets out to make provision in relation to the recovery of damages for death or personal injury caused by the fault or negligent of a person or organisations.
Native Vegetation Conservation Act 1997
The objects of this Act are to provide for the conservation and management of native vegetation, including protection, encouragement and promotion, improving the existing condition, encouraging revegetation and rehabilitation, preventing inappropriate clearing, and promoting the significance of native vegetation, all in accordance with the principles of ecologically sustainable development.
Other relevant Acts and Legislation As required. 3.4 Current Levels of Service Council has defined service levels in two terms.
Community Levels of Service - Relate to the service outcomes that the community wants in terms of safety, quality, quantity, reliability, responsiveness, cost effectiveness and legislative compliance.
Community levels of service measures used in the asset management plan are:
Quality How good is the service? Function Does it meet users’ needs? Safety Is the service safe?
Technical Levels of Service - Supporting the community service levels are operational or technical measures of performance. These technical measures relate to the allocation of resources to service activities that the council undertakes to best achieve the desired community outcomes.
JUNEE SHIRE COUNCIL – SEWERAGE SERVICES ASSET MANAGEMENT PLAN

- 8 -
Technical service covers:
• Operations – the regular activities to provide services such as opening hours, cleansing frequency, mowing frequency, etc. and licence conditions,
• Maintenance – the activities necessary to retain an assets as near as practicable to its original condition (eg road patching, unsealed road grading, building and structure repairs),
• Renewal – the activities that return the service capability of an asset up to that which it had originally (eg frequency and cost of road resurfacing and pavement reconstruction, pipeline replacement and building component replacement),
• Upgrade – the activities to provide a higher level of service (eg widening a road, sealing an unsealed road, replacing a pipeline with a larger size) or a new service that did not exist previously (eg a new library).
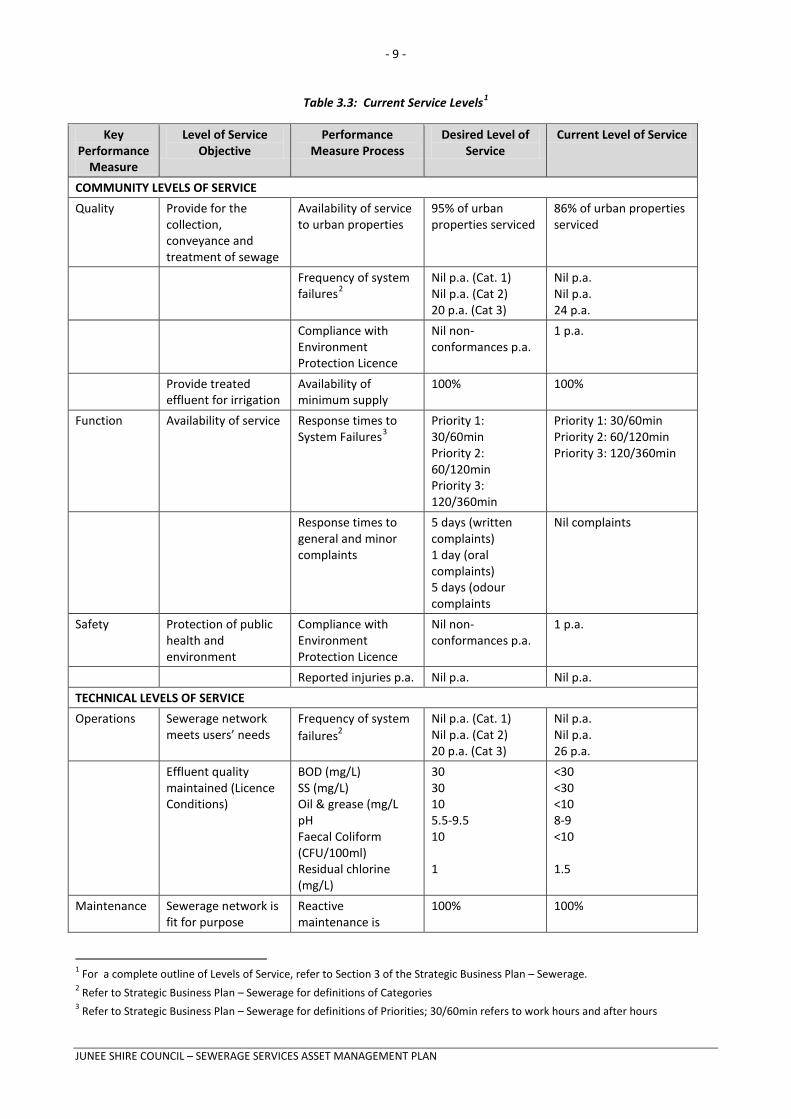
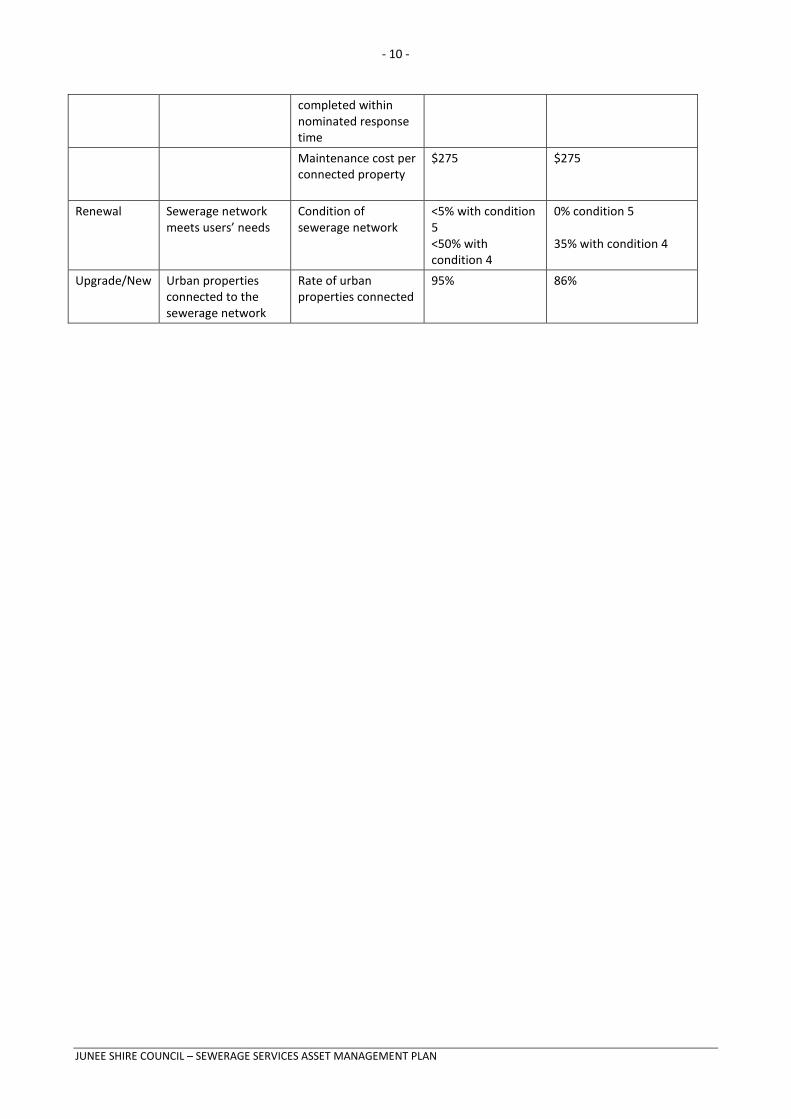
Council’s current service levels are detailed in Table 3.3.
JUNEE SHIRE COUNCIL – SEWERAGE SERVICES ASSET MANAGEMENT PLAN
- 9 -
Table 3.3: Current Service Levels1
Key Performance
Measure
Level of Service Objective
Performance Measure Process
Desired Level of Service
Current Level of Service
COMMUNITY LEVELS OF SERVICE Quality Provide for the
collection, conveyance and treatment of sewage
Availability of service to urban properties
95% of urban properties serviced
86% of urban properties serviced
Frequency of system failures2
Nil p.a. (Cat. 1) Nil p.a. (Cat 2) 20 p.a. (Cat 3)
Nil p.a. Nil p.a. 24 p.a.
Compliance with Environment Protection Licence
Nil non-conformances p.a.
1 p.a.
Provide treated effluent for irrigation
Availability of minimum supply
100% 100%
Function Availability of service Response times to System Failures3
Priority 1: 30/60min Priority 2: 60/120min Priority 3: 120/360min
Priority 1: 30/60min Priority 2: 60/120min Priority 3: 120/360min
Response times to general and minor complaints
5 days (written complaints) 1 day (oral complaints) 5 days (odour complaints
Nil complaints
Safety Protection of public health and environment
Compliance with Environment Protection Licence
Nil non-conformances p.a.
1 p.a.
Reported injuries p.a. Nil p.a. Nil p.a. TECHNICAL LEVELS OF SERVICE Operations Sewerage network
meets users’ needs Frequency of system failures2
Nil p.a. (Cat. 1) Nil p.a. (Cat 2) 20 p.a. (Cat 3)
Nil p.a. Nil p.a. 26 p.a.
Effluent quality maintained (Licence Conditions)
BOD (mg/L) SS (mg/L) Oil & grease (mg/L pH Faecal Coliform (CFU/100ml) Residual chlorine (mg/L)
30 30 10 5.5-9.5 10 1
<30 <30 <10 8-9 <10 1.5
Maintenance Sewerage network is fit for purpose
Reactive maintenance is
100% 100%
1 For a complete outline of Levels of Service, refer to Section 3 of the Strategic Business Plan – Sewerage. 2 Refer to Strategic Business Plan – Sewerage for definitions of Categories 3 Refer to Strategic Business Plan – Sewerage for definitions of Priorities; 30/60min refers to work hours and after hours
JUNEE SHIRE COUNCIL – SEWERAGE SERVICES ASSET MANAGEMENT PLAN
- 10 -
completed within nominated response time
Maintenance cost per connected property
$275
$275
Renewal Sewerage network meets users’ needs
Condition of sewerage network
<5% with condition 5 <50% with condition 4
0% condition 5 35% with condition 4
Upgrade/New Urban properties connected to the sewerage network
Rate of urban properties connected
95% 86%
JUNEE SHIRE COUNCIL – SEWERAGE SERVICES ASSET MANAGEMENT PLAN

- 11 -
3.4 Desired Levels of Service
At present, indications of desired levels of service are obtained from various sources including residents’ feedback to Councillors and staff, service requests and correspondence. Council has yet to quantify desired levels of service. This will be done in future revisions of this asset management plan.
4. FUTURE DEMAND
4.1 Demand Drivers
Factors affecting demand include population change, changes in demographics, seasonal factors, consumer preferences and expectations, economic factors, environmental awareness, etc.
4.2 Demand Forecast
Demand factor trends and impacts on service delivery are summarised in Table 4.1.
4.3 Demand Impact on Assets
The impact of demand drivers that may affect future service delivery and utilisation of assets are shown in Table 4.1.
Table 4.1: Demand Factors, Projections and Impact on Services
Demand factor Present position Projection Impact on services Population The sewerage network serves
approximately 4100 people across 1680 premises.
Population growth is forecast to continue at approximately 1% p.a.
This will increase the loading on the network. By the year 2031 an additional 932 people in 370 new properties will require sewerage services.
Demographics Junee Shire has an age distribution similar to that of the State with a slightly higher proportion of 18-64 year olds. 65+ accounts for approximately 15%
The biggest change will be in the 65+ age category which will see an increase to 23% by 2031 (Dept. Planning projections)
These demographic factors will shape the type of future development the Shire will see. The effect on the network will predominantly relate to the density of premise serviced.
Water security/Climate Change
Presently 100% of average flows are recycled. Recently, wetter than average months have led to unprecedented discharges to the environment.
Forecasts are for increased volatility in rainfall patterns leading to larger, more frequent extreme events, but an overall drying climate.
There will be an increased peak loading on the network based on current inflow and infiltration rates. An overall drying climate will place greater demands for capture and reuse of treated effluent. Effluent storages will require a greater storage capacity to provide effluent during longer periods of dry weather and drought.
JUNEE SHIRE COUNCIL – SEWERAGE SERVICES ASSET MANAGEMENT PLAN

- 12 -
4.4 Changes in Technology
Technology changes forecast to affect the delivery of services covered by this plan are detailed in Table 4.2.
Table 4.2: Changes in Technology and Forecast effect on Service Delivery
Technology Change Effect on Service Delivery Enhanced/improved communication and automation.
Reduced demand on staff lead to overall resource savings which in turn can be re-invested into bettering service delivery.
4.5 Demand Management Plan
Demand for new services will be managed through a combination of managing existing assets, upgrading of existing assets and providing new assets to meet demand and demand management. Demand management practices include non-asset solutions, insuring against risks and managing failures.
Non-asset solutions focus on providing the required service without the need for the council to own the assets. Examples of non-asset solutions include providing services from existing infrastructure such as aquatic centres and libraries that may be in another council area or public toilets provided in commercial premises.
Opportunities identified to date for demand management are shown in Table 4.3. Further opportunities will be developed in future revisions of this asset management plan.
Table 4.3: Demand Management Plan Summary
Service Activity Demand Management Plan Sewage collection and conveyance
Infiltration and inflow (I&I), if not managed correctly, may lead to localised network failures occurring on a more regular basis. In addressing I & I, a multi-pronged approach is to be taken involving a mains inspection program, monitoring of critical mains and the detection of illegal connections. Increased hydraulic loading may also occur on existing mains due to infill or upstream development. If not managed competently, these increases in hydraulic loading may result in surcharges downstream or costly capital upgrades of existing mains.
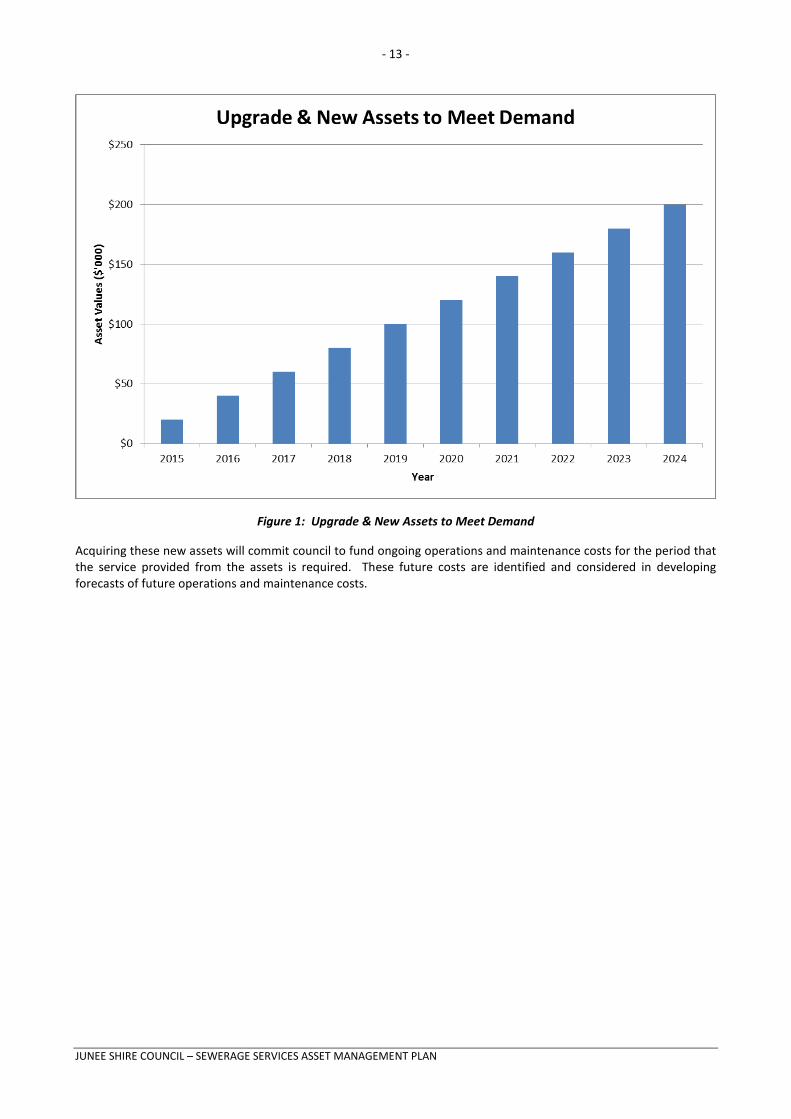
4.4 Asset Programs to meet Demand The new assets required to meet growth will be acquired free of cost from land developments and constructed/acquired by Council. The new contributed and constructed asset values are summarised in Figure 1.
JUNEE SHIRE COUNCIL – SEWERAGE SERVICES ASSET MANAGEMENT PLAN
- 13 -
Figure 1: Upgrade & New Assets to Meet Demand
Acquiring these new assets will commit council to fund ongoing operations and maintenance costs for the period that the service provided from the assets is required. These future costs are identified and considered in developing forecasts of future operations and maintenance costs.
JUNEE SHIRE COUNCIL – SEWERAGE SERVICES ASSET MANAGEMENT PLAN
- 14 -
5. LIFECYCLE MANAGEMENT PLAN
The lifecycle management plan details how Council plans to manage and operate the assets at the agreed levels of service (defined in Section 3) while optimising life cycle costs.
5.1 Background Data
5.1.1 Physical parameters
The assets covered by this asset management plan are shown in Table 2.1.
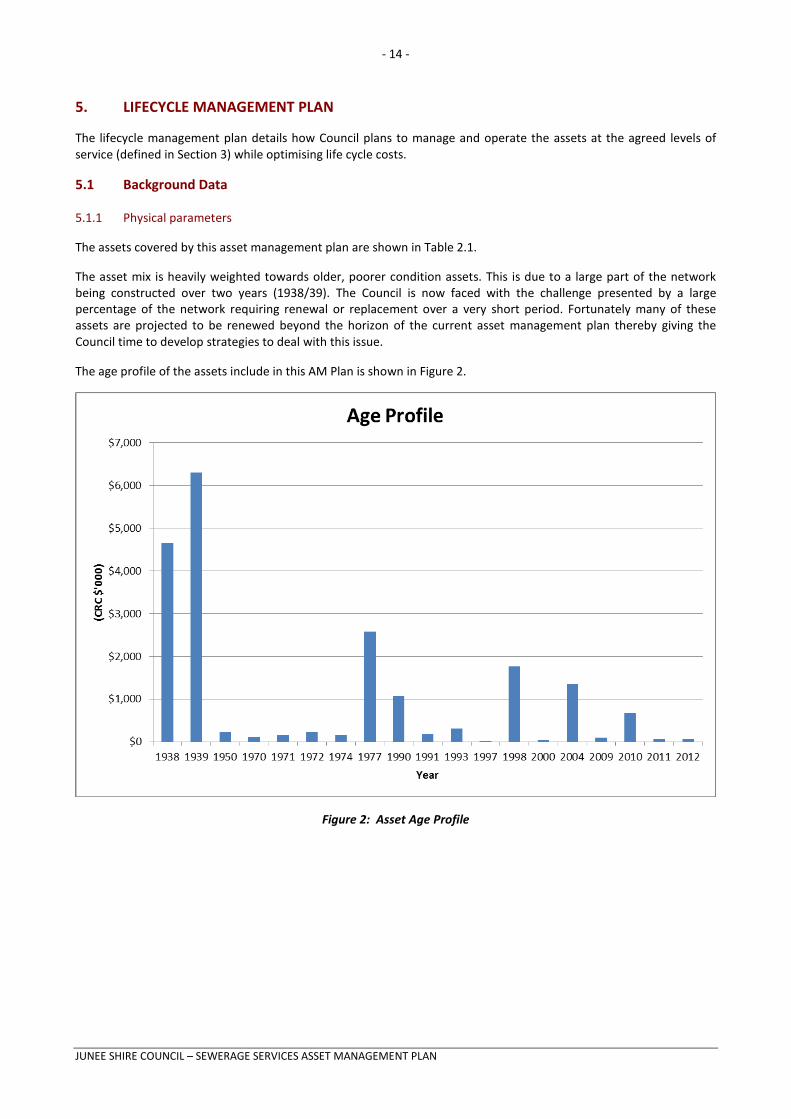
The asset mix is heavily weighted towards older, poorer condition assets. This is due to a large part of the network being constructed over two years (1938/39). The Council is now faced with the challenge presented by a large percentage of the network requiring renewal or replacement over a very short period. Fortunately many of these assets are projected to be renewed beyond the horizon of the current asset management plan thereby giving the Council time to develop strategies to deal with this issue.
The age profile of the assets include in this AM Plan is shown in Figure 2.
Figure 2: Asset Age Profile
JUNEE SHIRE COUNCIL – SEWERAGE SERVICES ASSET MANAGEMENT PLAN
- 15 -
5.1.2 Asset capacity and performance
Council’s services are generally provided to meet design standards where these are available.
Locations where deficiencies in service performance are known are detailed in Table 5.1.2.
Table 5.1.2: Known Service Performance Deficiencies
Location Service Deficiency Line GM (Laurie Daley/Loftus Oval) and Line MM0
Line is prone to surcharge during wet weather events and Correctional Centre discharge.
Line MM3-28 to MM3-35 Movement of pipes, high water table area and ground flush manhole lids lead to high rates of inflow and infiltration
Effluent Storage Storages are prone to algal outbreaks which in turn lead to a greatly reduced effluent quality and cause the blockage of irrigation sprays. Storages are marginally deficient in size, resulting in discharges to the environment during high flow seasons and effluent shortages during drier periods.
The above service deficiencies were identified from observations by Council staff and reports from the community.
5.1.3 Asset condition
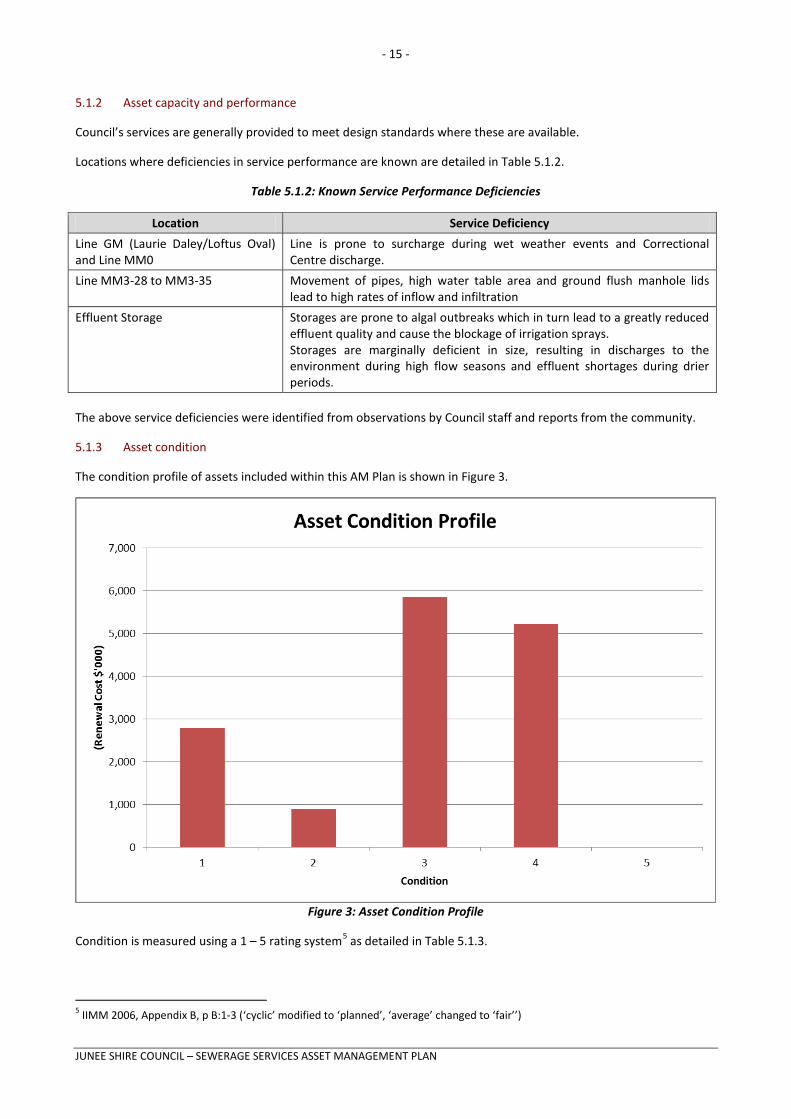
The condition profile of assets included within this AM Plan is shown in Figure 3.
Figure 3: Asset Condition Profile
Condition is measured using a 1 – 5 rating system5 as detailed in Table 5.1.3.
5 IIMM 2006, Appendix B, p B:1-3 (‘cyclic’ modified to ‘planned’, ‘average’ changed to ‘fair’’)
JUNEE SHIRE COUNCIL – SEWERAGE SERVICES ASSET MANAGEMENT PLAN
- 16 -
Residual Value
Depreciable Amount
Useful Life
Current Replacement
Cost
End of reporting period 1
Annual Depreciation
Expense
End of reporting period 2
Accumulated Depreciation
Depreciated Replacement
Cost
Table 5.1.3: IIMM Description of Condition
Condition Rating Description 1 Excellent condition: Only planned maintenance required. 2 Very good: Minor maintenance required plus planned maintenance. 3 Good: Significant maintenance required. 4 Fair: Significant renewal/upgrade required. 5 Poor: Unserviceable.
5.1.4 Asset valuations
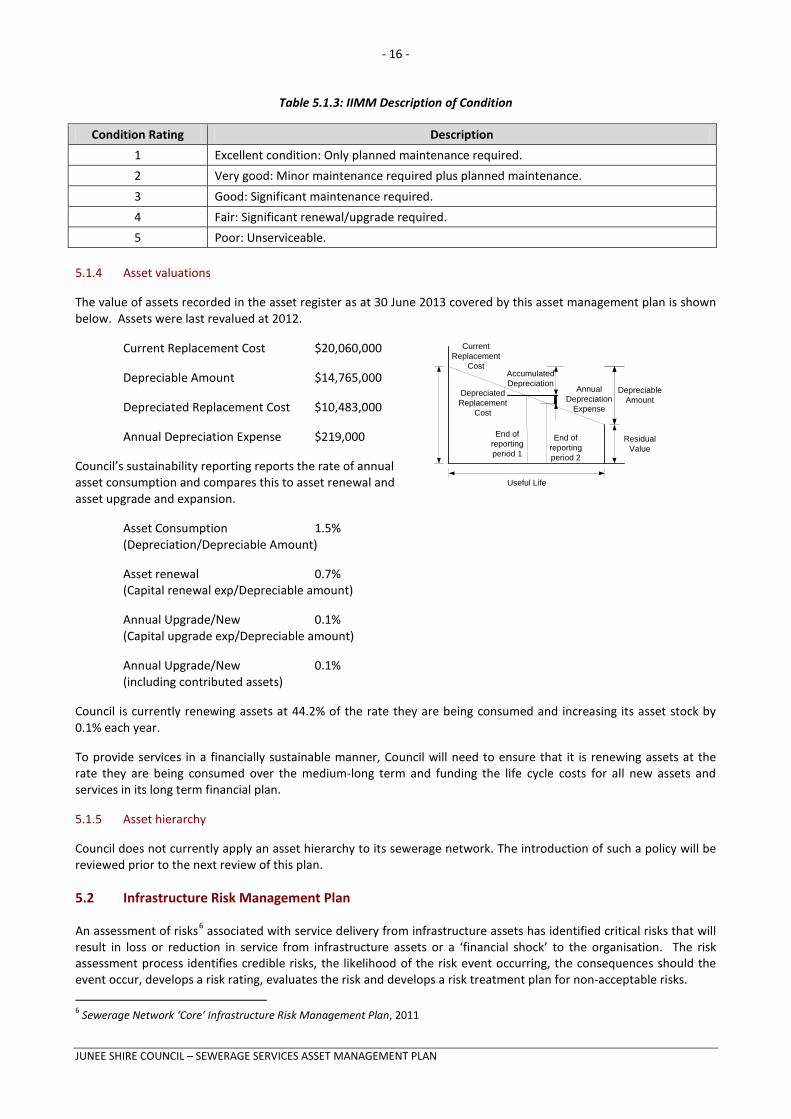
The value of assets recorded in the asset register as at 30 June 2013 covered by this asset management plan is shown below. Assets were last revalued at 2012.
Current Replacement Cost $20,060,000
Depreciable Amount $14,765,000
Depreciated Replacement Cost $10,483,000
Annual Depreciation Expense $219,000
Council’s sustainability reporting reports the rate of annual asset consumption and compares this to asset renewal and asset upgrade and expansion.
Asset Consumption 1.5% (Depreciation/Depreciable Amount)
Asset renewal 0.7% (Capital renewal exp/Depreciable amount)
Annual Upgrade/New 0.1% (Capital upgrade exp/Depreciable amount)
Annual Upgrade/New 0.1% (including contributed assets)
Council is currently renewing assets at 44.2% of the rate they are being consumed and increasing its asset stock by 0.1% each year.
To provide services in a financially sustainable manner, Council will need to ensure that it is renewing assets at the rate they are being consumed over the medium-long term and funding the life cycle costs for all new assets and services in its long term financial plan.
5.1.5 Asset hierarchy
Council does not currently apply an asset hierarchy to its sewerage network. The introduction of such a policy will be reviewed prior to the next review of this plan.
5.2 Infrastructure Risk Management Plan
An assessment of risks6 associated with service delivery from infrastructure assets has identified critical risks that will result in loss or reduction in service from infrastructure assets or a ‘financial shock’ to the organisation. The risk assessment process identifies credible risks, the likelihood of the risk event occurring, the consequences should the event occur, develops a risk rating, evaluates the risk and develops a risk treatment plan for non-acceptable risks.
6 Sewerage Network ‘Core’ Infrastructure Risk Management Plan, 2011
JUNEE SHIRE COUNCIL – SEWERAGE SERVICES ASSET MANAGEMENT PLAN
- 17 -
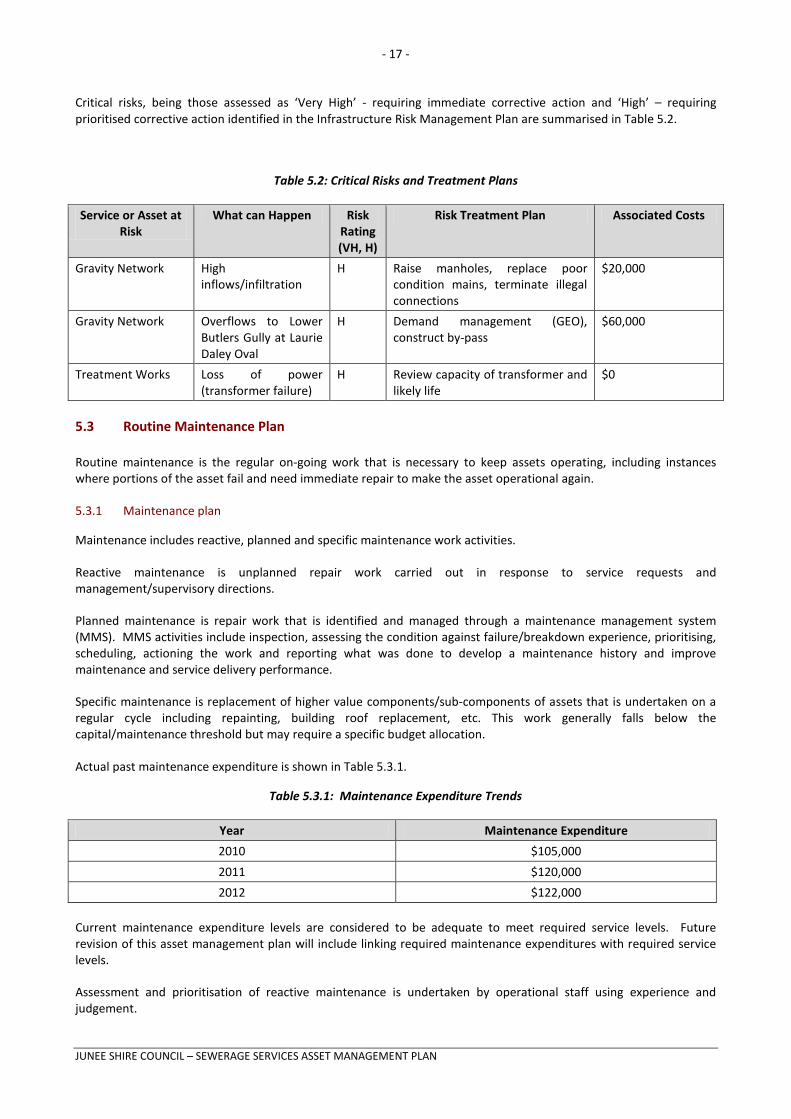
Critical risks, being those assessed as ‘Very High’ - requiring immediate corrective action and ‘High’ – requiring prioritised corrective action identified in the Infrastructure Risk Management Plan are summarised in Table 5.2.
Table 5.2: Critical Risks and Treatment Plans
Service or Asset at Risk
What can Happen Risk Rating (VH, H)
Risk Treatment Plan Associated Costs
Gravity Network High inflows/infiltration
H Raise manholes, replace poor condition mains, terminate illegal connections
$20,000
Gravity Network Overflows to Lower Butlers Gully at Laurie Daley Oval
H Demand management (GEO), construct by-pass
$60,000
Treatment Works Loss of power (transformer failure)
H Review capacity of transformer and likely life
$0
5.3 Routine Maintenance Plan
Routine maintenance is the regular on-going work that is necessary to keep assets operating, including instances where portions of the asset fail and need immediate repair to make the asset operational again.
5.3.1 Maintenance plan
Maintenance includes reactive, planned and specific maintenance work activities.
Reactive maintenance is unplanned repair work carried out in response to service requests and management/supervisory directions.
Planned maintenance is repair work that is identified and managed through a maintenance management system (MMS). MMS activities include inspection, assessing the condition against failure/breakdown experience, prioritising, scheduling, actioning the work and reporting what was done to develop a maintenance history and improve maintenance and service delivery performance.
Specific maintenance is replacement of higher value components/sub-components of assets that is undertaken on a regular cycle including repainting, building roof replacement, etc. This work generally falls below the capital/maintenance threshold but may require a specific budget allocation.
Actual past maintenance expenditure is shown in Table 5.3.1.
Table 5.3.1: Maintenance Expenditure Trends
Year Maintenance Expenditure 2010 $105,000 2011 $120,000 2012 $122,000
Current maintenance expenditure levels are considered to be adequate to meet required service levels. Future revision of this asset management plan will include linking required maintenance expenditures with required service levels.
Assessment and prioritisation of reactive maintenance is undertaken by operational staff using experience and judgement.
JUNEE SHIRE COUNCIL – SEWERAGE SERVICES ASSET MANAGEMENT PLAN
- 18 -
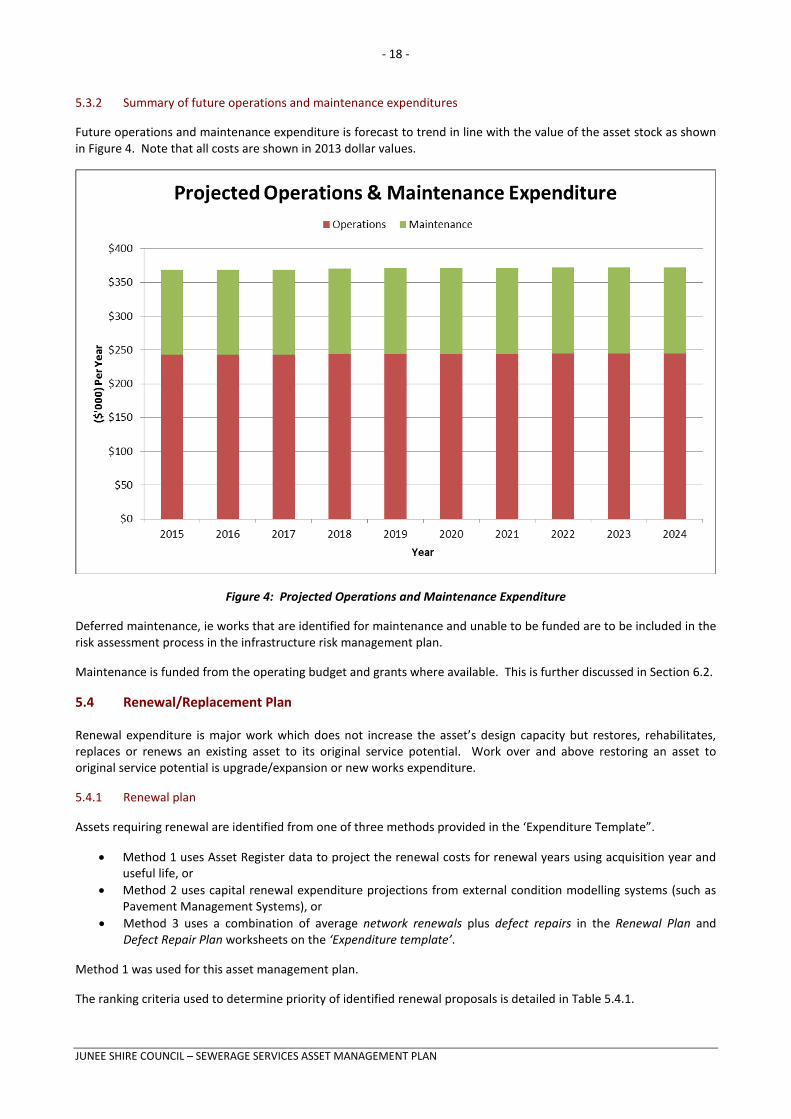
5.3.2 Summary of future operations and maintenance expenditures
Future operations and maintenance expenditure is forecast to trend in line with the value of the asset stock as shown in Figure 4. Note that all costs are shown in 2013 dollar values.
Figure 4: Projected Operations and Maintenance Expenditure
Deferred maintenance, ie works that are identified for maintenance and unable to be funded are to be included in the risk assessment process in the infrastructure risk management plan.
Maintenance is funded from the operating budget and grants where available. This is further discussed in Section 6.2.
5.4 Renewal/Replacement Plan
Renewal expenditure is major work which does not increase the asset’s design capacity but restores, rehabilitates, replaces or renews an existing asset to its original service potential. Work over and above restoring an asset to original service potential is upgrade/expansion or new works expenditure.
5.4.1 Renewal plan
Assets requiring renewal are identified from one of three methods provided in the ‘Expenditure Template”.
• Method 1 uses Asset Register data to project the renewal costs for renewal years using acquisition year and useful life, or
• Method 2 uses capital renewal expenditure projections from external condition modelling systems (such as Pavement Management Systems), or
• Method 3 uses a combination of average network renewals plus defect repairs in the Renewal Plan and Defect Repair Plan worksheets on the ‘Expenditure template’.
Method 1 was used for this asset management plan.
The ranking criteria used to determine priority of identified renewal proposals is detailed in Table 5.4.1.
JUNEE SHIRE COUNCIL – SEWERAGE SERVICES ASSET MANAGEMENT PLAN
- 19 -
Table 5.4.1: Renewal Priority Ranking Criteria
Criteria Weighting Risk posed by asset failure (including the risk to the public, environment, legal/financial and surrounding infrastructure)
50%
Importance of asset 25% Overall benefit to network operation 25% Total 100%
Renewal will be undertaken using ‘low-cost’ renewal methods where practical. The aim of ‘low-cost’ renewals is to restore the service potential or future economic benefits of the asset by renewing the assets at a cost less than replacement cost.
Examples of low cost renewal include pipe relining or bursting. Either of these methods eliminate the need for excavation of trenches and the former can be completed with a live main.
5.4.2 Renewal standards
Renewal work is carried out in accordance with the following Standards and Specifications.
• Relevant Australian Standards
• Relevant Industry Specifications and Codes of Practice
• Relevant ‘manuals’ provided with specialised equipment (e.g. filters, mixers, screens, pumps, etc)
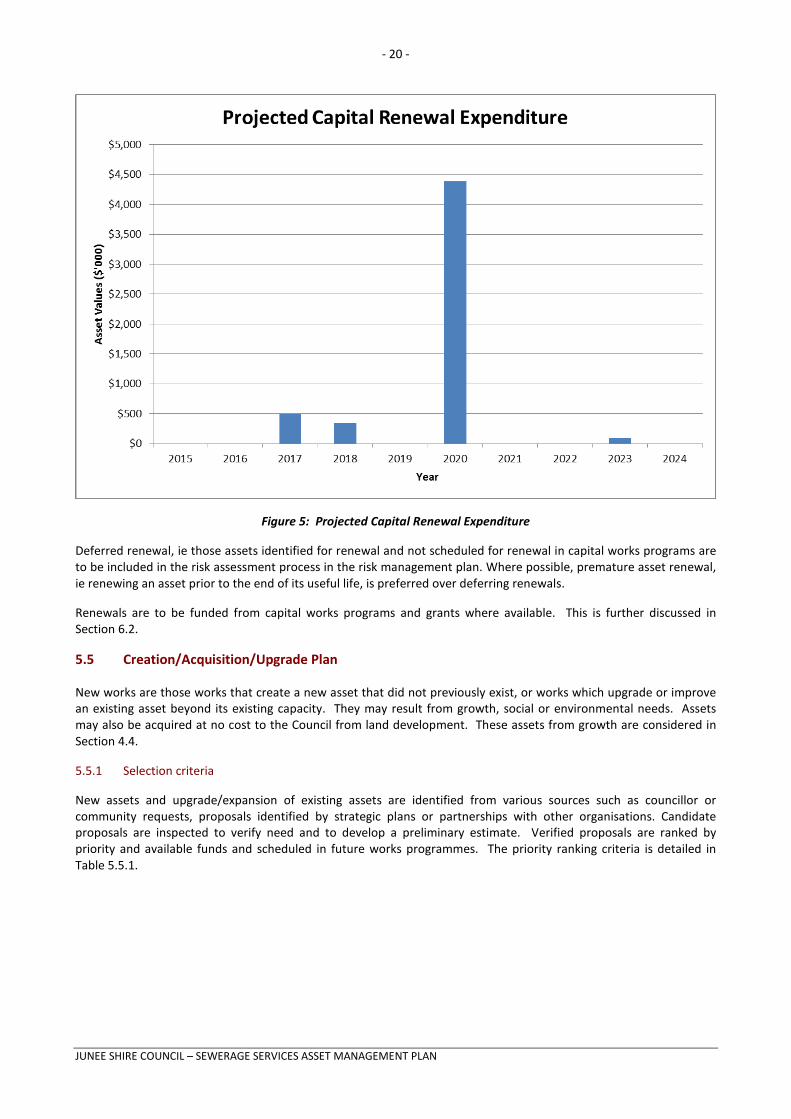
5.4.3 Summary of projected renewal expenditure
Projected future renewal expenditures are forecast to increase over time as the asset stock ages. The costs are summarised in Figure 5. Note that all costs are shown in 2013 dollar values.
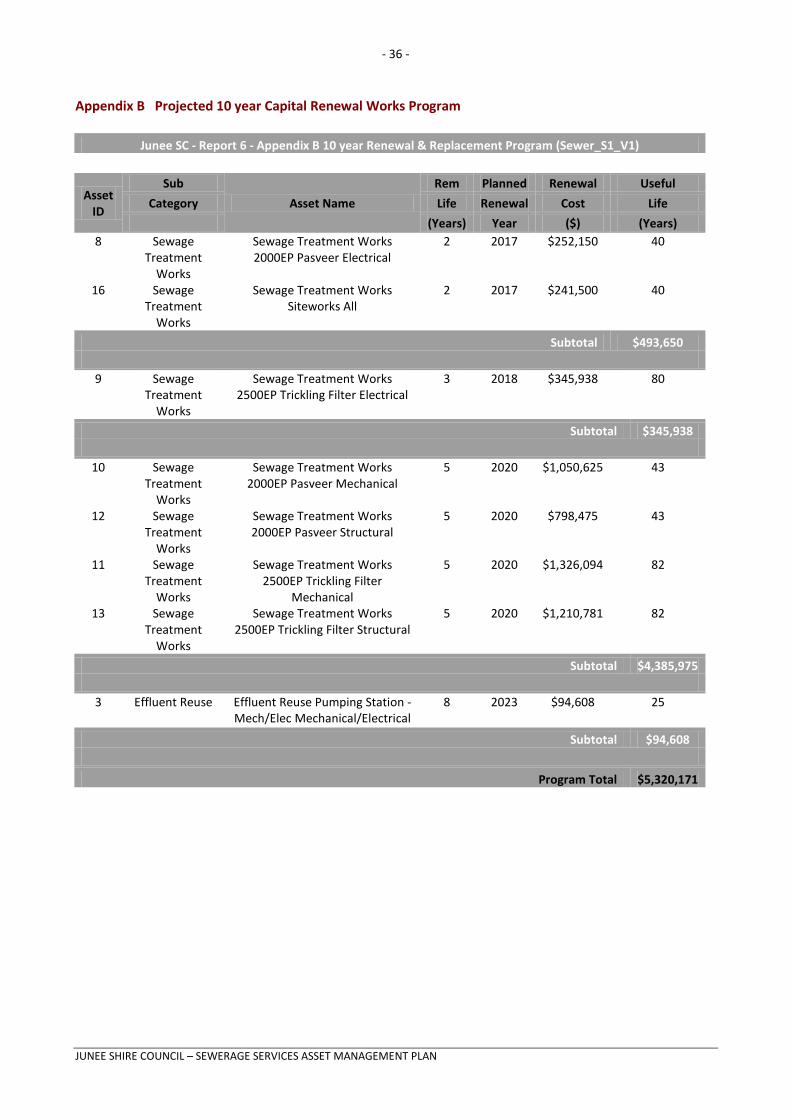
The projected capital renewal program is shown in Appendix B.
JUNEE SHIRE COUNCIL – SEWERAGE SERVICES ASSET MANAGEMENT PLAN
- 20 -
Figure 5: Projected Capital Renewal Expenditure
Deferred renewal, ie those assets identified for renewal and not scheduled for renewal in capital works programs are to be included in the risk assessment process in the risk management plan. Where possible, premature asset renewal, ie renewing an asset prior to the end of its useful life, is preferred over deferring renewals.
Renewals are to be funded from capital works programs and grants where available. This is further discussed in Section 6.2.
5.5 Creation/Acquisition/Upgrade Plan
New works are those works that create a new asset that did not previously exist, or works which upgrade or improve an existing asset beyond its existing capacity. They may result from growth, social or environmental needs. Assets may also be acquired at no cost to the Council from land development. These assets from growth are considered in Section 4.4.
5.5.1 Selection criteria
New assets and upgrade/expansion of existing assets are identified from various sources such as councillor or community requests, proposals identified by strategic plans or partnerships with other organisations. Candidate proposals are inspected to verify need and to develop a preliminary estimate. Verified proposals are ranked by priority and available funds and scheduled in future works programmes. The priority ranking criteria is detailed in Table 5.5.1.
JUNEE SHIRE COUNCIL – SEWERAGE SERVICES ASSET MANAGEMENT PLAN
- 21 -
Table 5.5.1: Upgrade/New Assets Priority Ranking Criteria
Criteria Weighting Network benefit 30% User benefit 30% Environmental benefit 20% Economic benefit 20% Total 100% 5.5.2 Standards and specifications
Standards and specifications for new assets and for upgrade/expansion of existing assets are the same as those for renewal shown in Section 5.4.2.
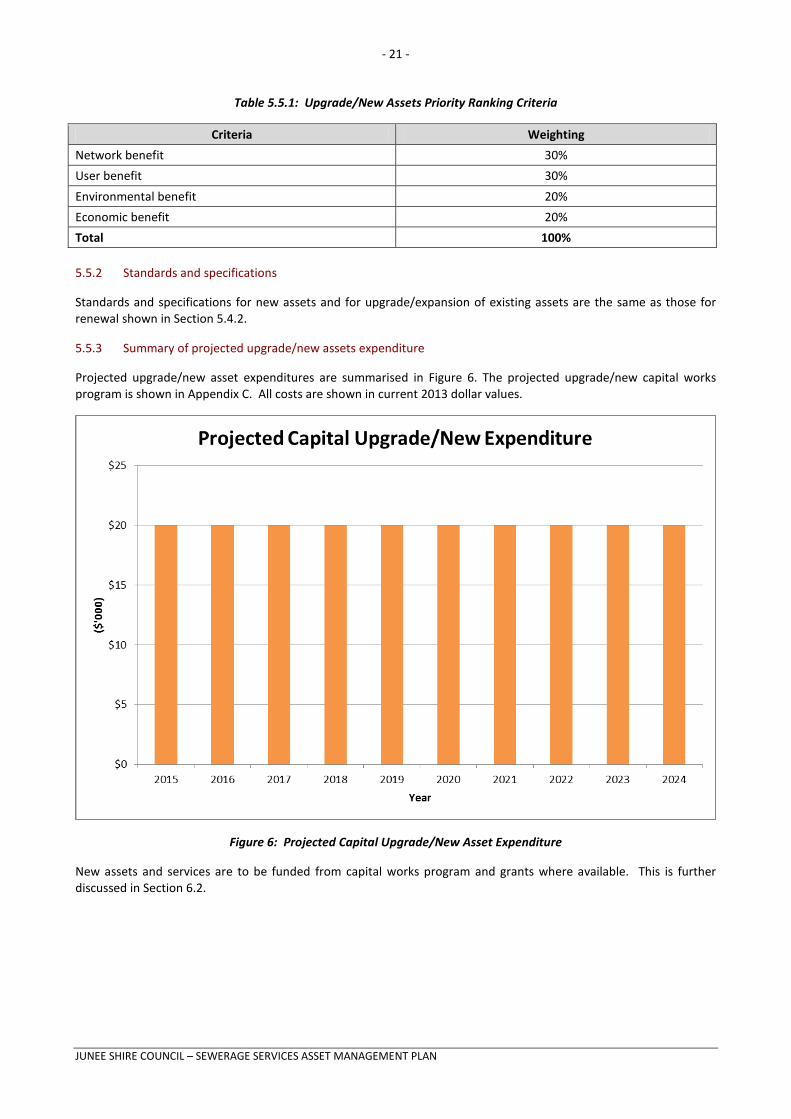
5.5.3 Summary of projected upgrade/new assets expenditure
Projected upgrade/new asset expenditures are summarised in Figure 6. The projected upgrade/new capital works program is shown in Appendix C. All costs are shown in current 2013 dollar values.
Figure 6: Projected Capital Upgrade/New Asset Expenditure
New assets and services are to be funded from capital works program and grants where available. This is further discussed in Section 6.2.
JUNEE SHIRE COUNCIL – SEWERAGE SERVICES ASSET MANAGEMENT PLAN
- 22 -
5.6 Disposal Plan
Disposal includes any activity associated with disposal of a decommissioned asset including sale, demolition or relocation. Assets identified for possible decommissioning and disposal are shown in Table 5.6, together with estimated annual savings from not having to fund operations and maintenance of the assets. These assets will be further reinvestigated to determine the required levels of service and see what options are available for alternate service delivery, if any.
Where cashflow projections from asset disposals are not available, these will be developed in future revisions of this asset management plan.
Table 5.6: Assets identified for Disposal
Asset Reason for Disposal Timing Net Disposal Expenditure (Expend
+ve, Revenue –ve)
Operations & Maintenance Annual
Savings Nil - - - -
5.7 Service Consequences and Risks
The organisation has prioritised decisions made in adopting this AM Plan to obtain the optimum benefits from its available resources. Decisions were made based on the development of 3 scenarios of AM Plans.
Scenario 1 - What we would like to do based on asset register data
Scenario 2 – What we should do with existing budgets and identifying level of service and risk consequences (i.e. what are the maintenance and capital projects we are unable to do, what is the service and risk consequences associated with this position). This may require several versions of the AM Plan.
Scenario 3 – What we can do and be financially sustainable with AM Plans matching long-term financial plans.
The development of scenario 1 and scenario 2 AM Plans provides the tools for discussion with the Council and community on trade-offs between what we would like to do (scenario 1) and what we should be doing with existing budgets (scenario 2) by balancing changes in services and service levels with affordability and acceptance of the service and risk consequences of the trade-off position (scenario 3).
JUNEE SHIRE COUNCIL – SEWERAGE SERVICES ASSET MANAGEMENT PLAN
- 23 -
6. FINANCIAL SUMMARY
This section contains the financial requirements resulting from all the information presented in the previous sections of this asset management plan. The financial projections will be improved as further information becomes available on desired levels of service and current and projected future asset performance.
6.1 Financial Statements and Projections
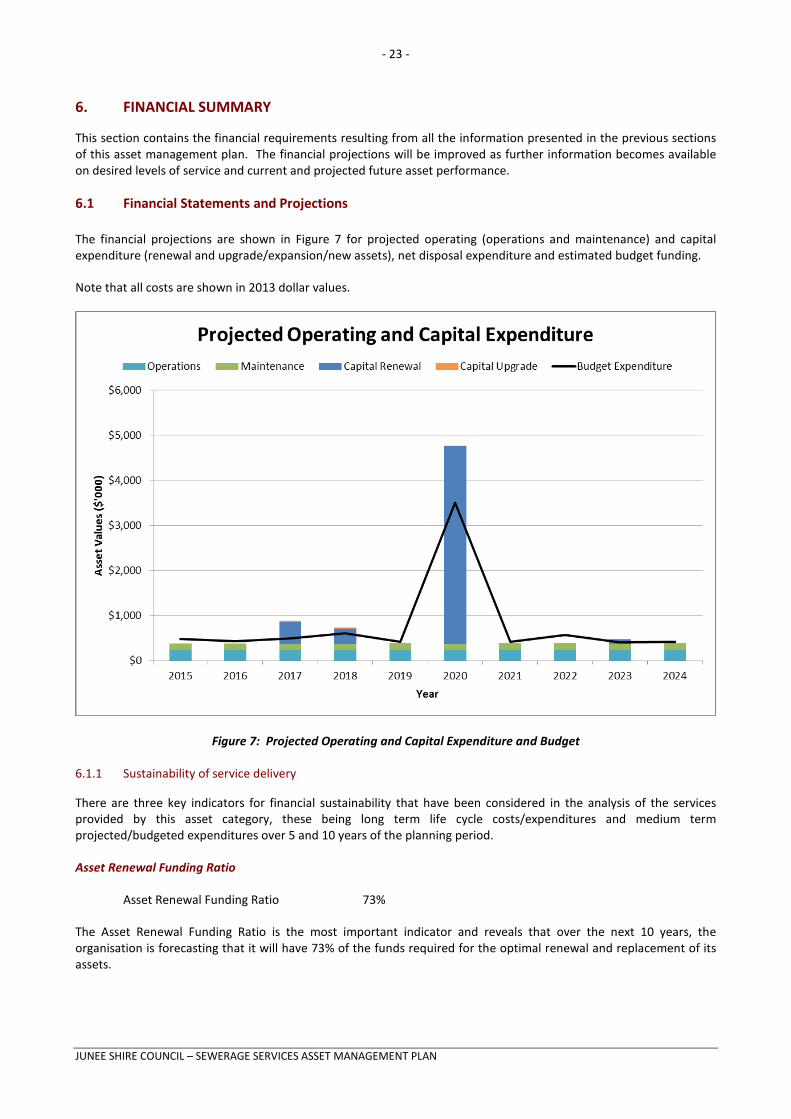
The financial projections are shown in Figure 7 for projected operating (operations and maintenance) and capital expenditure (renewal and upgrade/expansion/new assets), net disposal expenditure and estimated budget funding.
Note that all costs are shown in 2013 dollar values.
Figure 7: Projected Operating and Capital Expenditure and Budget
6.1.1 Sustainability of service delivery
There are three key indicators for financial sustainability that have been considered in the analysis of the services provided by this asset category, these being long term life cycle costs/expenditures and medium term projected/budgeted expenditures over 5 and 10 years of the planning period.
Asset Renewal Funding Ratio
Asset Renewal Funding Ratio 73%
The Asset Renewal Funding Ratio is the most important indicator and reveals that over the next 10 years, the organisation is forecasting that it will have 73% of the funds required for the optimal renewal and replacement of its assets.
JUNEE SHIRE COUNCIL – SEWERAGE SERVICES ASSET MANAGEMENT PLAN
- 24 -
However, in considering this indicator, it should be noted that it is heavily skewed by the forecast renewal of the wastewater treatment facility in 2020. At the present time, low-cost renewal options are being investigated and until these are better explored, the use of this indicator in assessing the overall sustainability of the service should be guarded.
Long term - Life Cycle Cost
Life cycle costs (or whole of life costs) are the average costs that are required to sustain the service levels over the asset life cycle. Life cycle costs include maintenance expenditure and asset consumption (depreciation expense). The life cycle cost for the services covered in this asset management plan is $590,000 per year (average maintenance expenditure plus depreciation expense projected over 10 years).
Life cycle costs can be compared to life cycle expenditure to give an initial indicator of affordability of projected service levels when considered with age profiles. Life cycle expenditure includes maintenance and capital renewal expenditure. Life cycle expenditure will vary depending on the timing of asset renewals. The life cycle expenditure over the 10 year planning period is $761,000 per year (average maintenance plus capital renewal budgeted expenditure in LTFP over 10 years).
The life cycle gap for services covered by this asset management plan is +$171,000 per year (-ve = gap, +ve = surplus).
Life cycle expenditure is 129% of life cycle costs.
The life cycle costs and life cycle expenditure comparison highlights any difference between present outlays and the average cost of providing the service over the long term. If the life cycle expenditure is less than that life cycle cost, it is most likely that outlays will need to be increased or cuts in services made in the future.
Knowing the extent and timing of any required increase in outlays and the service consequences if funding is not available will assist organisations in providing services to their communities in a financially sustainable manner. This is the purpose of the asset management plans and long term financial plan.
Medium term – 10 year financial planning period
This asset management plan identifies the projected operations, maintenance and capital renewal expenditures required to provide an agreed level of service to the community over a 10 year period. This provides input into 10 year financial and funding plans aimed at providing the required services in a sustainable manner.
These projected expenditures may be compared to budgeted expenditures in the 10 year period to identify any funding shortfall. In a core asset management plan, a gap is generally due to increasing asset renewals for ageing assets.
The projected operations, maintenance and capital renewal expenditure required over the 10 year planning period is $903,000 per year.
Estimated (budget) operations, maintenance and capital renewal funding is $763,000 per year giving a 10 year funding shortfall of $142,000 per year and a 10 year sustainability indicator of 0.84. This indicates that Council has 84% of the projected expenditures needed to provide the services documented in the asset management plan.
Medium Term – 5 year financial planning period
The projected operations, maintenance and capital renewal expenditure required over the first 5 years of the planning period is $538,000 per year.
Estimated (budget) operations, maintenance and capital renewal funding is $471,000 per year giving a 5 year funding shortfall of $66,000. This is 88% of projected expenditures giving a 5 year sustainability indicator of 0.88.
Financial Sustainability Indicators
Figure 7A shows the financial sustainability indicators over the 10 year planning period and for the long term life cycle.
JUNEE SHIRE COUNCIL – SEWERAGE SERVICES ASSET MANAGEMENT PLAN
- 25 -
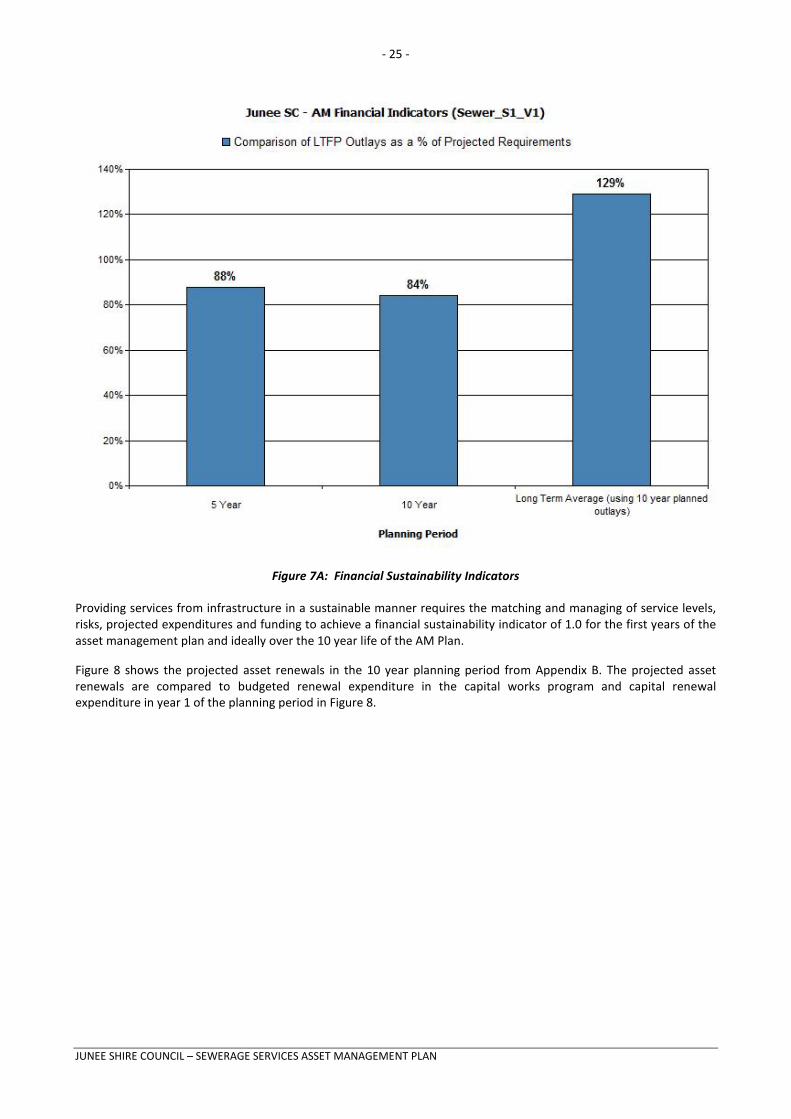
Figure 7A: Financial Sustainability Indicators
Providing services from infrastructure in a sustainable manner requires the matching and managing of service levels, risks, projected expenditures and funding to achieve a financial sustainability indicator of 1.0 for the first years of the asset management plan and ideally over the 10 year life of the AM Plan.
Figure 8 shows the projected asset renewals in the 10 year planning period from Appendix B. The projected asset renewals are compared to budgeted renewal expenditure in the capital works program and capital renewal expenditure in year 1 of the planning period in Figure 8.
JUNEE SHIRE COUNCIL – SEWERAGE SERVICES ASSET MANAGEMENT PLAN
- 26 -
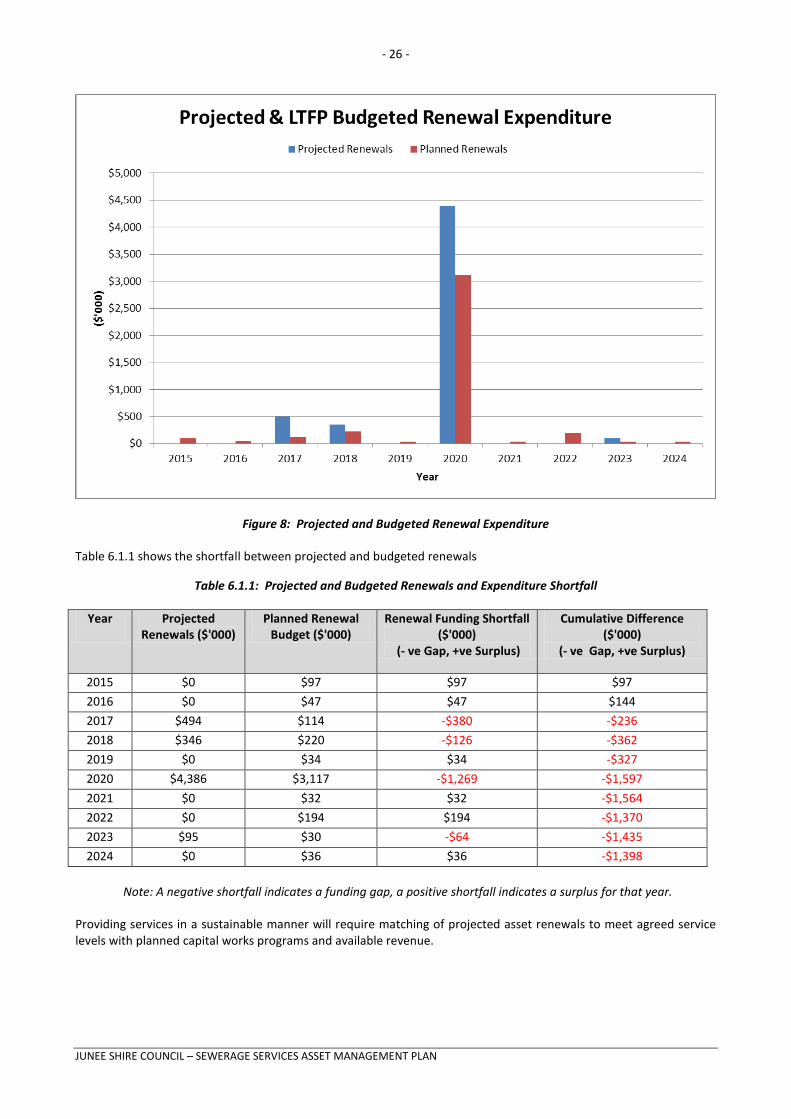
Figure 8: Projected and Budgeted Renewal Expenditure
Table 6.1.1 shows the shortfall between projected and budgeted renewals
Table 6.1.1: Projected and Budgeted Renewals and Expenditure Shortfall
Year
Projected Renewals ($'000)
Planned Renewal Budget ($'000)
Renewal Funding Shortfall ($'000)
(- ve Gap, +ve Surplus)
Cumulative Difference ($'000)
(- ve Gap, +ve Surplus)
2015 $0 $97 $97 $97 2016 $0 $47 $47 $144 2017 $494 $114 -$380 -$236 2018 $346 $220 -$126 -$362 2019 $0 $34 $34 -$327 2020 $4,386 $3,117 -$1,269 -$1,597 2021 $0 $32 $32 -$1,564 2022 $0 $194 $194 -$1,370 2023 $95 $30 -$64 -$1,435 2024 $0 $36 $36 -$1,398
Note: A negative shortfall indicates a funding gap, a positive shortfall indicates a surplus for that year.
Providing services in a sustainable manner will require matching of projected asset renewals to meet agreed service levels with planned capital works programs and available revenue.
JUNEE SHIRE COUNCIL – SEWERAGE SERVICES ASSET MANAGEMENT PLAN
- 27 -
A gap between projected asset renewals, planned asset renewals and funding indicates that further work is required to manage required service levels and funding to eliminate any funding gap. As it stands there is a gap due to the projected renewal of the wastewater treatment facility. This gap shall be addressed in future revisions of this asset management plan as low – cost renewal and different funding options are explored.
6.1.2 Expenditure projections for long term financial plan
Table 6.1.2 shows the projected expenditures for the 10 year long term financial plan.
Expenditure projections are in current (non-inflated) values. Disposals are shown as net expenditures (revenues are negative).
Table 6.1.2: Expenditure Projections for Long Term Financial Plan ($000)
Year Operations ($'000)
Maintenance ($'000)
Projected Capital Renewal ($'000)
Capital Upgrade/ New ($'000)
Net Disposals ($'000)
2015 $243.00 $125.90 $0.00 $20.00 $0.00
2016 $243.24 $126.07 $0.00 $20.00 $0.00 2017 $243.49 $126.24 $493.65 $20.00 $0.00 2018 $243.73 $126.41 $345.94 $20.00 $0.00 2019 $243.97 $126.58 $0.00 $20.00 $0.00 2020 $244.21 $126.75 $4,385.98 $20.00 $0.00 2021 $244.45 $126.92 $0.00 $20.00 $0.00 2022 $244.70 $127.09 $0.00 $20.00 $0.00 2023 $244.94 $127.27 $94.61 $20.00 $0.00 2024 $245.18 $127.44 $0.00 $20.00 $0.00
Note: All projected expenditures are in 2013 values
6.2 Funding Strategy
Projected expenditure identified in Section 6.1 is to be funded from future operating and capital budgets. It is Council’s intention to match expenditure in the Long Term Financial Plan to the funding identified in the Asset Management Plan. After reviewing service levels or increasing funding, as appropriate to ensure ongoing financial sustainability projected expenditures identified in Section 6.1.2 will be accommodated in the organisation’s 10 year long term financial plan.
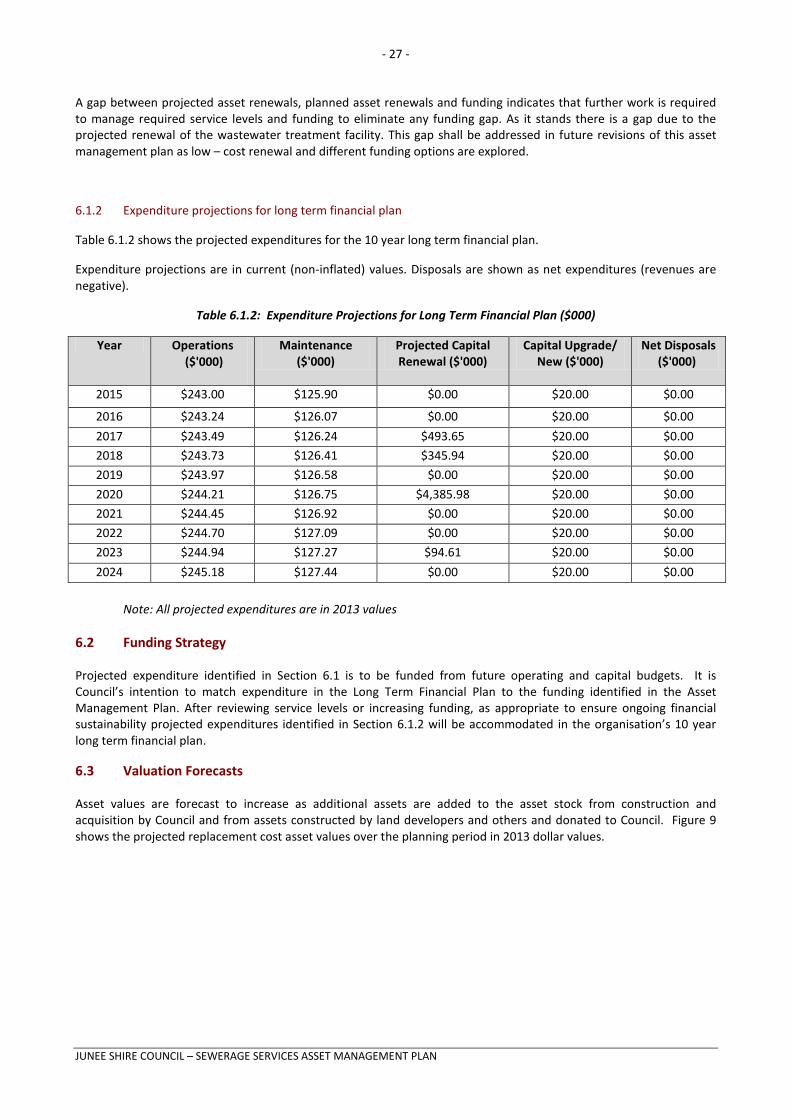
6.3 Valuation Forecasts
Asset values are forecast to increase as additional assets are added to the asset stock from construction and acquisition by Council and from assets constructed by land developers and others and donated to Council. Figure 9 shows the projected replacement cost asset values over the planning period in 2013 dollar values.
JUNEE SHIRE COUNCIL – SEWERAGE SERVICES ASSET MANAGEMENT PLAN
- 28 -
Figure 9: Projected Asset Values
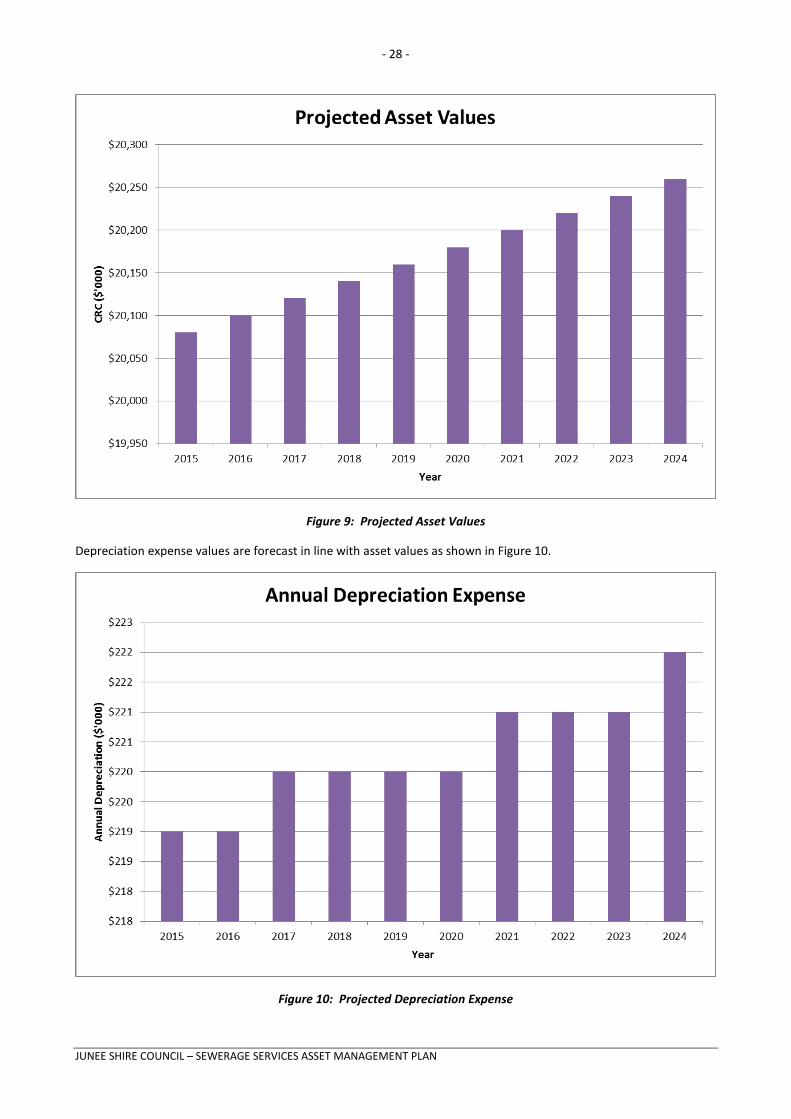
Depreciation expense values are forecast in line with asset values as shown in Figure 10.
Figure 10: Projected Depreciation Expense
JUNEE SHIRE COUNCIL – SEWERAGE SERVICES ASSET MANAGEMENT PLAN
- 29 -
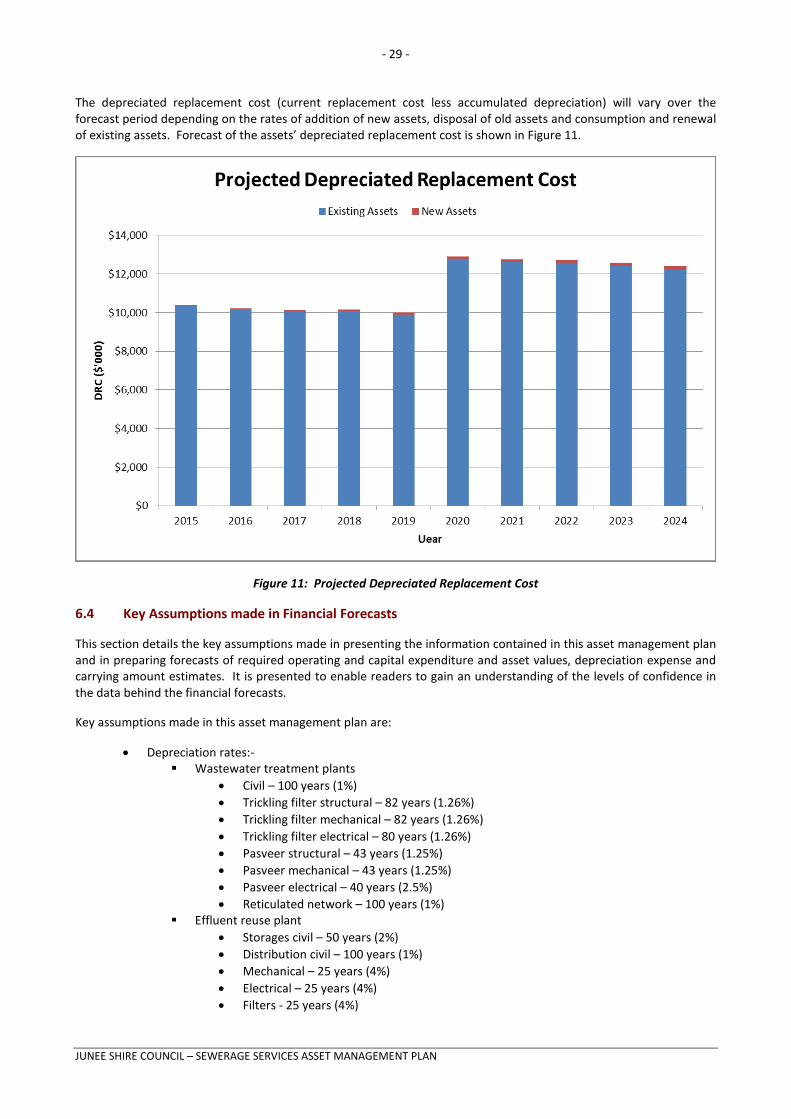
The depreciated replacement cost (current replacement cost less accumulated depreciation) will vary over the forecast period depending on the rates of addition of new assets, disposal of old assets and consumption and renewal of existing assets. Forecast of the assets’ depreciated replacement cost is shown in Figure 11.
Figure 11: Projected Depreciated Replacement Cost
6.4 Key Assumptions made in Financial Forecasts
This section details the key assumptions made in presenting the information contained in this asset management plan and in preparing forecasts of required operating and capital expenditure and asset values, depreciation expense and carrying amount estimates. It is presented to enable readers to gain an understanding of the levels of confidence in the data behind the financial forecasts.
Key assumptions made in this asset management plan are:
• Depreciation rates:- Wastewater treatment plants
• Civil – 100 years (1%) • Trickling filter structural – 82 years (1.26%) • Trickling filter mechanical – 82 years (1.26%) • Trickling filter electrical – 80 years (1.26%) • Pasveer structural – 43 years (1.25%) • Pasveer mechanical – 43 years (1.25%) • Pasveer electrical – 40 years (2.5%) • Reticulated network – 100 years (1%)
Effluent reuse plant • Storages civil – 50 years (2%) • Distribution civil – 100 years (1%) • Mechanical – 25 years (4%) • Electrical – 25 years (4%) • Filters - 25 years (4%)
JUNEE SHIRE COUNCIL – SEWERAGE SERVICES ASSET MANAGEMENT PLAN
- 30 -
• Chlorination system – 70 years (2%) • Reticulation – 100 years (1.43%)
It has been necessary to discount budgeted expenditure figures so that the asset management plan can be presented in current dollars. In doing this, figures from the LTFP have been discounted at a rate of 3.2%. 6.5 Forecast Reliability and Confidence
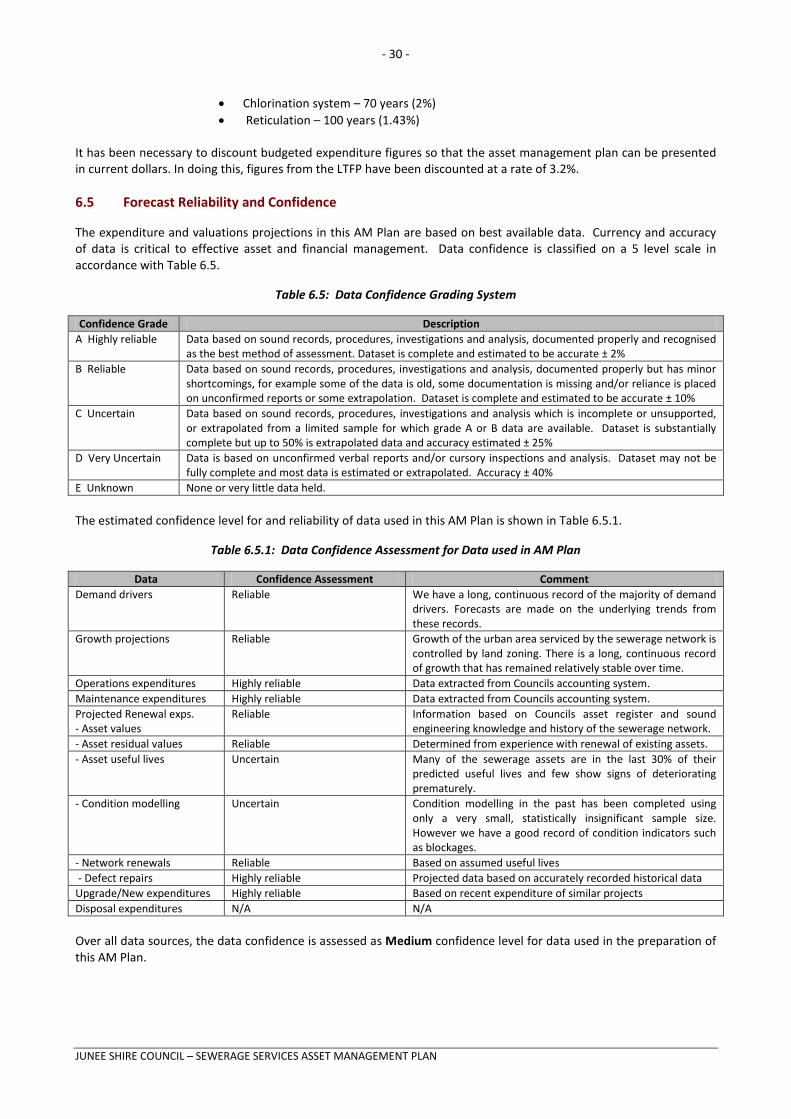
The expenditure and valuations projections in this AM Plan are based on best available data. Currency and accuracy of data is critical to effective asset and financial management. Data confidence is classified on a 5 level scale in accordance with Table 6.5.
Table 6.5: Data Confidence Grading System
Confidence Grade Description A Highly reliable Data based on sound records, procedures, investigations and analysis, documented properly and recognised
as the best method of assessment. Dataset is complete and estimated to be accurate ± 2% B Reliable Data based on sound records, procedures, investigations and analysis, documented properly but has minor
shortcomings, for example some of the data is old, some documentation is missing and/or reliance is placed on unconfirmed reports or some extrapolation. Dataset is complete and estimated to be accurate ± 10%
C Uncertain Data based on sound records, procedures, investigations and analysis which is incomplete or unsupported, or extrapolated from a limited sample for which grade A or B data are available. Dataset is substantially complete but up to 50% is extrapolated data and accuracy estimated ± 25%
D Very Uncertain Data is based on unconfirmed verbal reports and/or cursory inspections and analysis. Dataset may not be fully complete and most data is estimated or extrapolated. Accuracy ± 40%
E Unknown None or very little data held. The estimated confidence level for and reliability of data used in this AM Plan is shown in Table 6.5.1.
Table 6.5.1: Data Confidence Assessment for Data used in AM Plan
Data Confidence Assessment Comment Demand drivers Reliable We have a long, continuous record of the majority of demand
drivers. Forecasts are made on the underlying trends from these records.
Growth projections Reliable Growth of the urban area serviced by the sewerage network is controlled by land zoning. There is a long, continuous record of growth that has remained relatively stable over time.
Operations expenditures Highly reliable Data extracted from Councils accounting system. Maintenance expenditures Highly reliable Data extracted from Councils accounting system. Projected Renewal exps. - Asset values
Reliable Information based on Councils asset register and sound engineering knowledge and history of the sewerage network.
- Asset residual values Reliable Determined from experience with renewal of existing assets. - Asset useful lives Uncertain Many of the sewerage assets are in the last 30% of their
predicted useful lives and few show signs of deteriorating prematurely.
- Condition modelling Uncertain Condition modelling in the past has been completed using only a very small, statistically insignificant sample size. However we have a good record of condition indicators such as blockages.
- Network renewals Reliable Based on assumed useful lives - Defect repairs Highly reliable Projected data based on accurately recorded historical data Upgrade/New expenditures Highly reliable Based on recent expenditure of similar projects Disposal expenditures N/A N/A Over all data sources, the data confidence is assessed as Medium confidence level for data used in the preparation of this AM Plan.
JUNEE SHIRE COUNCIL – SEWERAGE SERVICES ASSET MANAGEMENT PLAN
- 31 -
7. PLAN IMPROVEMENT AND MONITORING
7.1 Status of Asset Management Practices
7.1.1 Accounting and financial systems
Junee Shire Council utilises Civica’s Authority software package for accounting and reporting services. This software package has the option of an Asset Management module, however Council at present only uses the General Ledger Module.
7.1.2 Accountabilities for financial systems
Financial Services operates within the Corporate Services Department of Council. The Financial Services section is responsible for overseeing Council’s finances and ensuring compliance with the relevant statutory requirements.
7.1.3 Accounting standards and regulations
Council’s financial reporting must comply with Australian equivalents to International Financial Reporting Standards, other authoritative pronouncements of the Australian Accounting Standards Board, Urgent Issues Group Interpretations, the Local Government Act (1993) and Regulations and the Local Government Code of Accounting Practice and Financial Reporting.
7.1.4 Capital/maintenance threshold
Council has not formally adopted a policy to dictate matters relating to capital/maintenance thresholds. The decision to capitalise works/assets is made by the relevant Director on a merits based approach. Assets of a lasting nature (greater than one year) and with a purchase cost of greater than $1000 are generally capitalised.
7.1.5 Required changes to accounting financial systems arising from this AM Plan
No changes have been identified as a result of completing this AM Plan.
7.2 Asset Management Systems
7.2.1 Asset management system
Junee Shire Council utilises Microsoft’s Excel software program for the recording and reporting of its assets. This is supported by, though not directly linked to, Intramaps – Council’s GIS software package.
7.2.2 Asset registers
Asset registers are maintained in Excel. A single sheet serves as the register and the financial record for each asset category. This is updated annually by Financial Services.
7.2.3 Linkage from asset management to financial system
Presently there is no formal link between Council’s financial system and the asset management system. The formalisation of such a link is required.
7.2.4 Accountabilities for asset management system and data
At present Financial Services is responsible for maintaining the asset management system with input from Engineering and Spatial staff.
7.2.5 Required changes to asset management system arising from this AM Plan
At present the management of the asset register is informal. The process for managing the system needs to be formalised with accountabilities, responsibilities and procedures formalised.
JUNEE SHIRE COUNCIL – SEWERAGE SERVICES ASSET MANAGEMENT PLAN
- 32 -
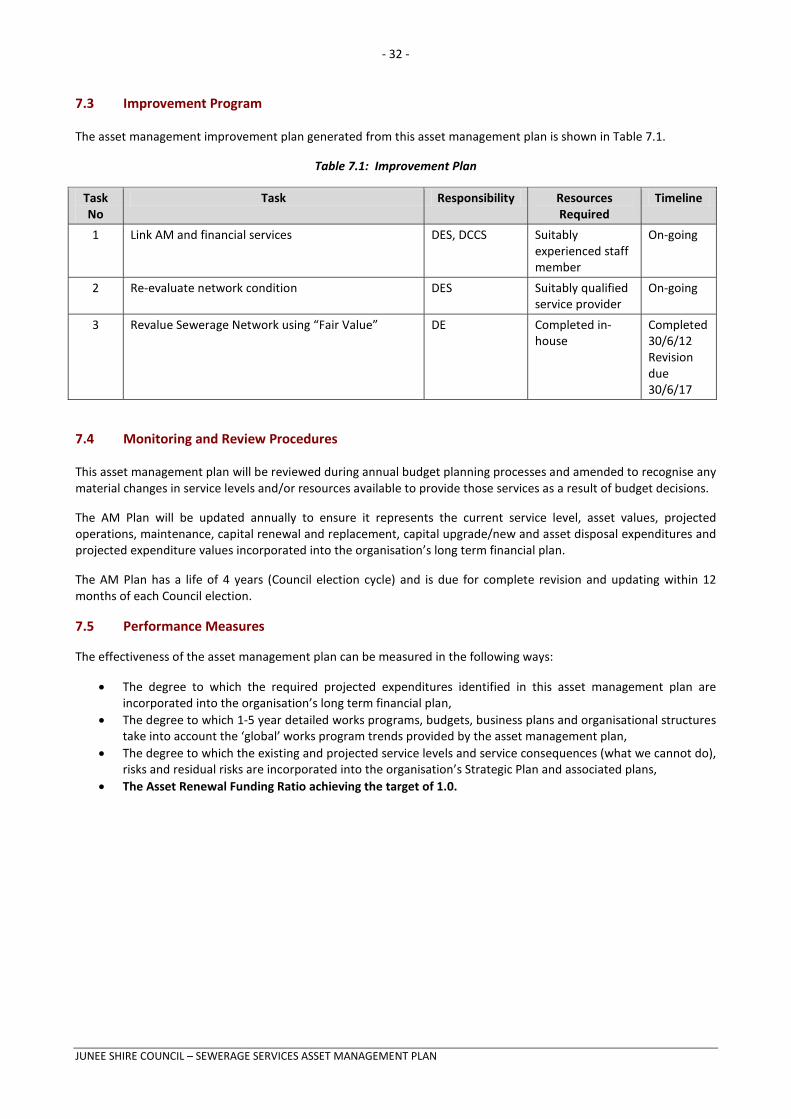
7.3 Improvement Program
The asset management improvement plan generated from this asset management plan is shown in Table 7.1.
Table 7.1: Improvement Plan
Task No
Task Responsibility Resources Required
Timeline
1 Link AM and financial services DES, DCCS Suitably experienced staff member
On-going
2 Re-evaluate network condition DES Suitably qualified service provider
On-going
3 Revalue Sewerage Network using “Fair Value” DE Completed in-house
Completed 30/6/12 Revision due 30/6/17
7.4 Monitoring and Review Procedures
This asset management plan will be reviewed during annual budget planning processes and amended to recognise any material changes in service levels and/or resources available to provide those services as a result of budget decisions.
The AM Plan will be updated annually to ensure it represents the current service level, asset values, projected operations, maintenance, capital renewal and replacement, capital upgrade/new and asset disposal expenditures and projected expenditure values incorporated into the organisation’s long term financial plan.
The AM Plan has a life of 4 years (Council election cycle) and is due for complete revision and updating within 12 months of each Council election.
7.5 Performance Measures
The effectiveness of the asset management plan can be measured in the following ways:
• The degree to which the required projected expenditures identified in this asset management plan are incorporated into the organisation’s long term financial plan,
• The degree to which 1-5 year detailed works programs, budgets, business plans and organisational structures take into account the ‘global’ works program trends provided by the asset management plan,
• The degree to which the existing and projected service levels and service consequences (what we cannot do), risks and residual risks are incorporated into the organisation’s Strategic Plan and associated plans,
• The Asset Renewal Funding Ratio achieving the target of 1.0.
JUNEE SHIRE COUNCIL – SEWERAGE SERVICES ASSET MANAGEMENT PLAN
- 33 -
REFERENCES
Junee Shire Council, Strategic Business Plan Sewerage – DRAFT, 2012-2031, Junee Shire Council
Junee Shire Council, Management Plan 2011-2015, Junee Shire Council
DVC, 2006, Asset Investment Guidelines, Glossary, Department for Victorian Communities, Local Government Victoria, Melbourne, http://www.dpcd.vic.gov.au/localgovernment/publications-and-research/asset-management-and-financial.
IPWEA, 2006, International Infrastructure Management Manual, Institute of Public Works Engineering Australia, Sydney, www.ipwea.org.au.
IPWEA, 2008, NAMS.PLUS Asset Management Institute of Public Works Engineering Australia, Sydney, www.ipwea.org.au/namsplus
IPWEA, 2009, Australian Infrastructure Financial Management Guidelines, Institute of Public Works Engineering Australia, Sydney, www.ipwea.org.au/AIFMG.
IPWEA, 2011, Asset Management for Small, Rural or Remote Communities Practice Note, Institute of Public Works Engineering Australia, Sydney, www.ipwea.org.au/AM4SRRC.
JUNEE SHIRE COUNCIL – SEWERAGE SERVICES ASSET MANAGEMENT PLAN
- 34 -
APPENDICES
Appendix A Maintenance Response Levels of Service
Appendix B Projected 10 year Capital Renewal Works Program
Appendix C Planned Upgrade/Exp/New 10 year Capital Works Program
Appendix D Abbreviations
Appendix E Glossary
JUNEE SHIRE COUNCIL – SEWERAGE SERVICES ASSET MANAGEMENT PLAN
- 35 -
Appendix A Maintenance Response Levels of Service
To be developed.
JUNEE SHIRE COUNCIL – SEWERAGE SERVICES ASSET MANAGEMENT PLAN
- 36 -
Appendix B Projected 10 year Capital Renewal Works Program
Junee SC - Report 6 - Appendix B 10 year Renewal & Replacement Program (Sewer_S1_V1)
Asset ID
Sub Asset Name
Rem Planned Renewal Useful Category Life Renewal Cost Life
(Years) Year ($) (Years) 8 Sewage
Treatment Works
Sewage Treatment Works 2000EP Pasveer Electrical
2 2017 $252,150 40
16 Sewage Treatment
Works
Sewage Treatment Works Siteworks All
2 2017 $241,500 40
Subtotal $493,650
9 Sewage Treatment
Works
Sewage Treatment Works 2500EP Trickling Filter Electrical
3 2018 $345,938 80
Subtotal $345,938
10 Sewage Treatment
Works
Sewage Treatment Works 2000EP Pasveer Mechanical
5 2020 $1,050,625 43
12 Sewage Treatment
Works
Sewage Treatment Works 2000EP Pasveer Structural
5 2020 $798,475 43
11 Sewage Treatment
Works
Sewage Treatment Works 2500EP Trickling Filter
Mechanical
5 2020 $1,326,094 82
13 Sewage Treatment
Works
Sewage Treatment Works 2500EP Trickling Filter Structural
5 2020 $1,210,781 82
Subtotal $4,385,975
3 Effluent Reuse Effluent Reuse Pumping Station - Mech/Elec Mechanical/Electrical
8 2023 $94,608 25
Subtotal $94,608
Program Total $5,320,171
JUNEE SHIRE COUNCIL – SEWERAGE SERVICES ASSET MANAGEMENT PLAN
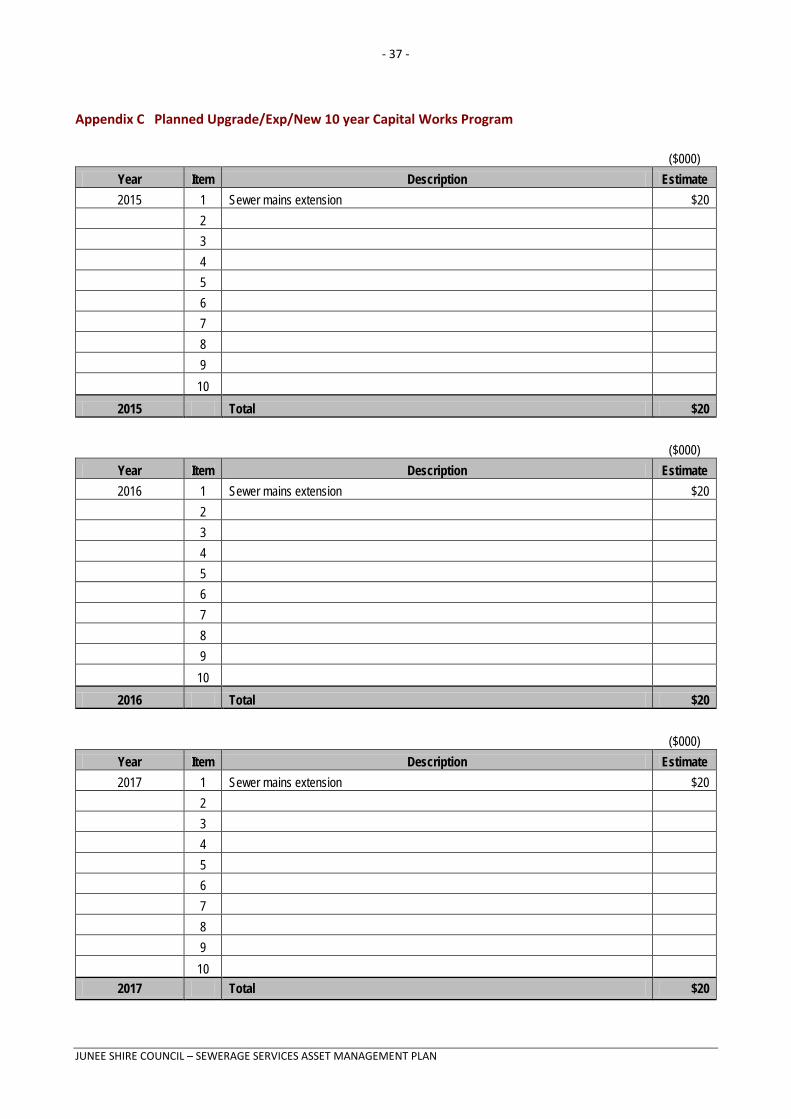
- 37 -
Appendix C Planned Upgrade/Exp/New 10 year Capital Works Program
($000)
Year Item Description Estimate 2015 1 Sewer mains extension $20
2 3 4 5 6 7 8 9 10
2015 Total $20
($000) Year Item Description Estimate 2016 1 Sewer mains extension $20
2 3 4 5 6 7 8 9 10
2016 Total $20
($000) Year Item Description Estimate 2017 1 Sewer mains extension $20
2 3 4 5 6 7 8 9 10
2017 Total $20
JUNEE SHIRE COUNCIL – SEWERAGE SERVICES ASSET MANAGEMENT PLAN
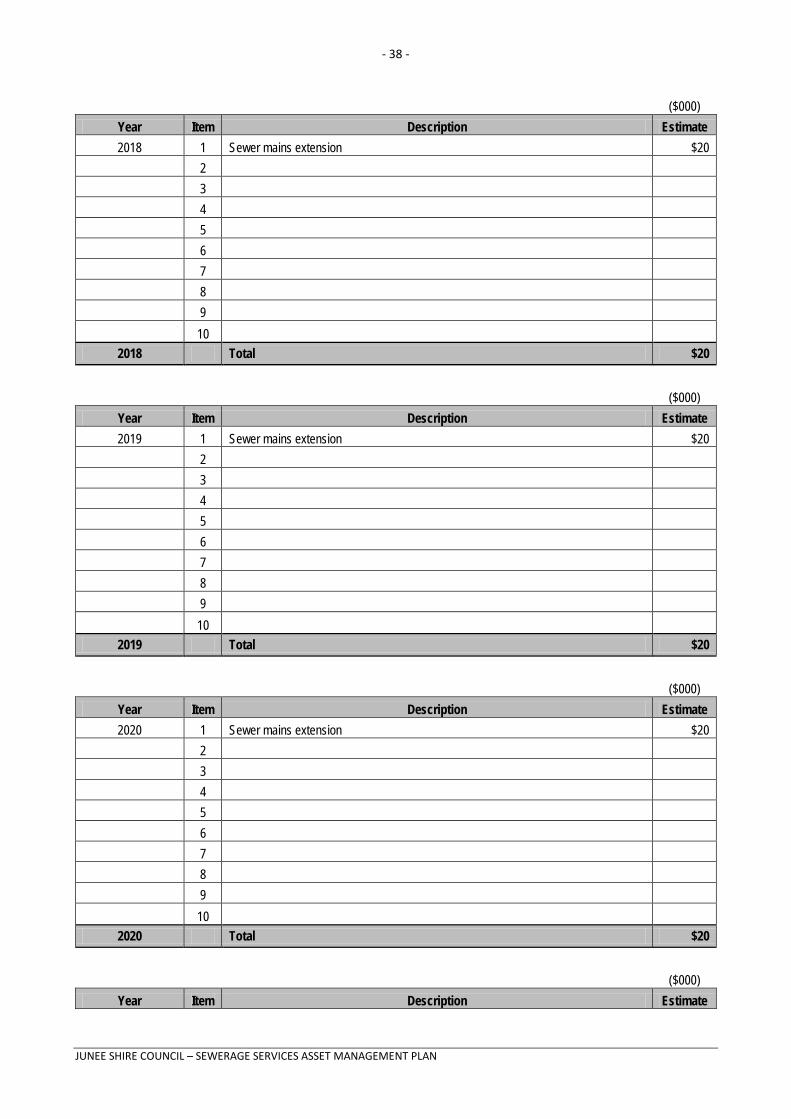
- 38 -
($000)
Year Item Description Estimate 2018 1 Sewer mains extension $20
2 3 4 5 6 7 8 9 10
2018 Total $20
($000) Year Item Description Estimate 2019 1 Sewer mains extension $20
2 3 4 5 6 7 8 9 10
2019 Total $20
($000) Year Item Description Estimate 2020 1 Sewer mains extension $20
2 3 4 5 6 7 8 9 10
2020 Total $20
($000) Year Item Description Estimate
JUNEE SHIRE COUNCIL – SEWERAGE SERVICES ASSET MANAGEMENT PLAN
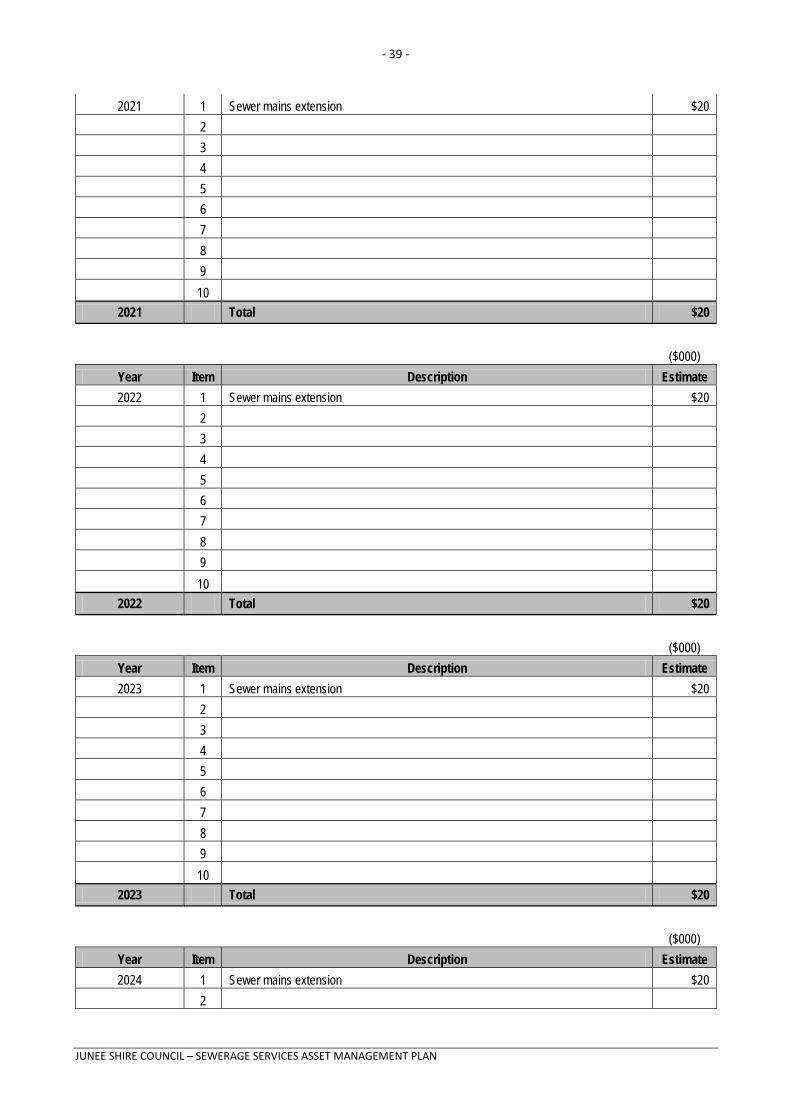
- 39 -
2021 1 Sewer mains extension $20 2 3 4 5 6 7 8 9 10
2021 Total $20
($000)
Year Item Description Estimate 2022 1 Sewer mains extension $20
2 3 4 5 6 7 8 9 10
2022 Total $20
($000) Year Item Description Estimate 2023 1 Sewer mains extension $20
2 3 4 5 6 7 8 9 10
2023 Total $20
($000)
Year Item Description Estimate 2024 1 Sewer mains extension $20
2
JUNEE SHIRE COUNCIL – SEWERAGE SERVICES ASSET MANAGEMENT PLAN
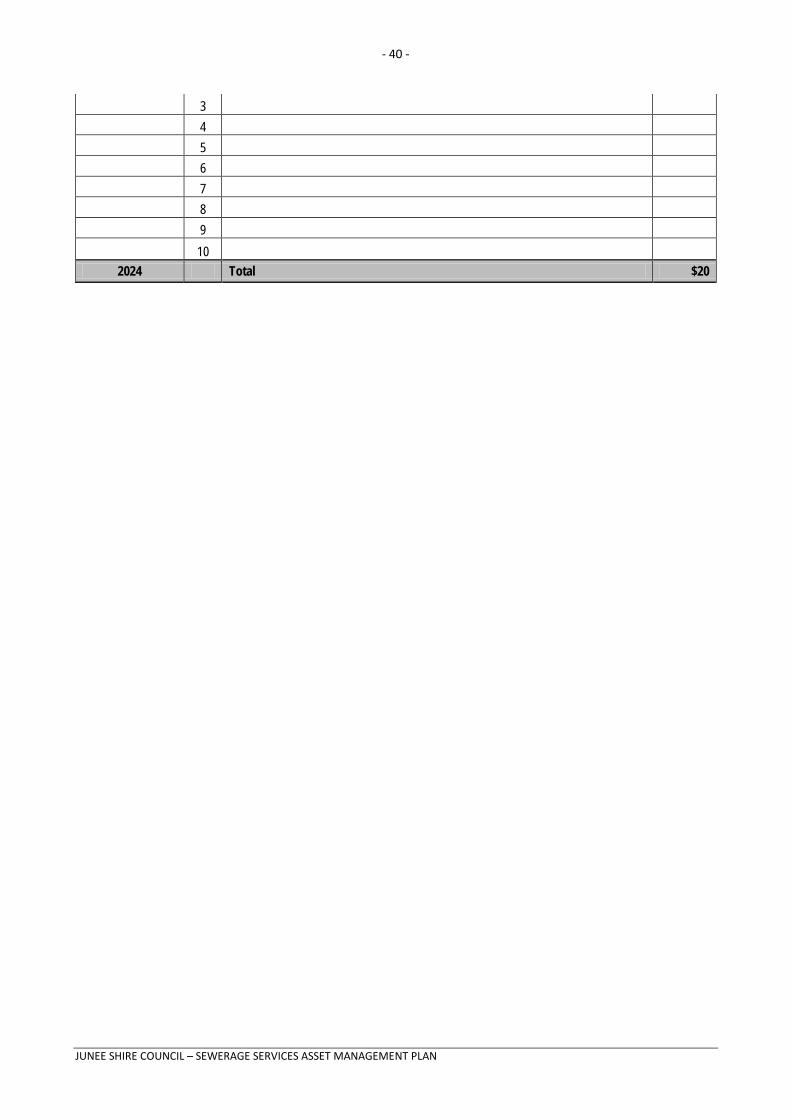
- 40 -
3 4 5 6 7 8 9 10
2024 Total $20
JUNEE SHIRE COUNCIL – SEWERAGE SERVICES ASSET MANAGEMENT PLAN
- 41 -
Appendix D Abbreviations
AAAC Average annual asset consumption
AM Asset management
AM Plan
Asset management plan
ARI Average recurrence interval
ASC Annual service cost
BOD Biochemical (biological) oxygen demand
CRC Current replacement cost
CWMS Community wastewater management systems
DA Depreciable amount
DRC Depreciated replacement cost
EF Earthworks/formation
IRMP Infrastructure risk management plan
LCC Life Cycle cost
LCE Life cycle expenditure
LTFP Long term financial plan
MMS Maintenance management system
PCI Pavement condition index
RV Residual value
SoA State of the Assets
SS Suspended solids
SRV Special Rate Variation
vph Vehicles per hour
WDCRD Written down current replacement cost
DES Director Engineering Services
DCCS Director Corporate and Community Services
DE Deputy Engineer
JUNEE SHIRE COUNCIL – SEWERAGE SERVICES ASSET MANAGEMENT PLAN
- 42 -
Appendix E Glossary Annual service cost (ASC) 1) Reporting actual cost The annual (accrual) cost of providing a service
including operations, maintenance, depreciation, finance/opportunity and disposal costs less revenue.
2) For investment analysis and budgeting An estimate of the cost that would be tendered,
per annum, if tenders were called for the supply of a service to a performance specification for a fixed term. The Annual Service Cost includes operations, maintenance, depreciation, finance/ opportunity and disposal costs, less revenue.
Asset A resource controlled by an entity as a result of past events and from which future economic benefits are expected to flow to the entity. Infrastructure assets are a sub-class of property, plant and equipment which are non-current assets with a life greater than 12 months and enable services to be provided.
Asset category Sub-group of assets within a class hierarchy for financial reporting and management purposes.
Asset class A group of assets having a similar nature or function in the operations of an entity, and which, for purposes of disclosure, is shown as a single item without supplementary disclosure.
Asset condition assessment The process of continuous or periodic inspection, assessment, measurement and interpretation of the resultant data to indicate the condition of a specific asset so as to determine the need for some preventative or remedial action.
Asset hierarchy A framework for segmenting an asset base into appropriate classifications. The asset hierarchy can be based on asset function or asset type or a combination of the two.
Asset management (AM) The combination of management, financial, economic, engineering and other practices applied to physical assets with the objective of providing the required level of service in the most cost effective manner.
Asset renewal funding ratio The ratio of the net present value of asset renewal funding accommodated over a 10 year period in a long term financial plan relative to the net present value of projected capital renewal expenditures identified in an asset management plan for the same period [AIFMG Financial Sustainability Indicator No 8].
Average annual asset consumption (AAAC)* The amount of an organisation’s asset base consumed during a reporting period (generally a year). This may be calculated by dividing the depreciable amount by the useful life (or total future economic benefits/service potential) and totalled for each and every asset OR by dividing the carrying amount (depreciated replacement cost) by the remaining useful life (or remaining future economic benefits/service potential) and totalled for each and every asset in an asset category or class.
Borrowings A borrowing or loan is a contractual obligation of the borrowing entity to deliver cash or another financial asset to the lending entity over a specified period of time or at a specified point in time, to cover both the initial capital provided and the cost of the interest incurred for providing this capital. A borrowing or loan provides the means for the borrowing entity to finance outlays (typically physical assets) when it has insufficient funds of its own to do so, and for the lending entity to make a financial return, normally in the form of interest revenue, on the funding provided.
Capital expenditure Relatively large (material) expenditure, which has benefits, expected to last for more than 12 months. Capital expenditure includes renewal, expansion and upgrade. Where capital projects involve a combination of renewal, expansion and/or upgrade expenditures, the total project cost needs to be allocated accordingly.
Capital expenditure - expansion Expenditure that extends the capacity of an existing asset to provide benefits, at the same standard as is currently enjoyed by existing beneficiaries, to a new group of users. It is discretionary expenditure, which increases future operations and maintenance costs, because it increases the organisation’s asset base, but may be associated with additional revenue from the new user group, eg. extending a drainage or road network, the provision of an oval or park in a new suburb for new residents.
JUNEE SHIRE COUNCIL – SEWERAGE SERVICES ASSET MANAGEMENT PLAN
- 43 -
Capital expenditure - new Expenditure which creates a new asset providing a new service/output that did not exist beforehand. As it increases service potential it may impact revenue and will increase future operations and maintenance expenditure.
Capital expenditure - renewal Expenditure on an existing asset or on replacing an existing asset, which returns the service capability of the asset up to that which it had originally. It is periodically required expenditure, relatively large (material) in value compared with the value of the components or sub-components of the asset being renewed. As it reinstates existing service potential, it generally has no impact on revenue, but may reduce future operations and maintenance expenditure if completed at the optimum time, eg. resurfacing or resheeting a material part of a road network, replacing a material section of a drainage network with pipes of the same capacity, resurfacing an oval.
Capital expenditure - upgrade Expenditure, which enhances an existing asset to provide a higher level of service or expenditure that will increase the life of the asset beyond that which it had originally. Upgrade expenditure is discretionary and often does not result in additional revenue unless direct user charges apply. It will increase operations and maintenance expenditure in the future because of the increase in the organisation’s asset base, eg. widening the sealed area of an existing road, replacing drainage pipes with pipes of a greater capacity, enlarging a grandstand at a sporting facility.
Capital funding Funding to pay for capital expenditure.
Capital grants Monies received generally tied to the specific projects for which they are granted, which are often upgrade and/or expansion or new investment proposals.
Capital investment expenditure See capital expenditure definition.
Capitalisation threshold The value of expenditure on non-current assets above which the expenditure is recognised as capital expenditure and below which the expenditure is charged as an expense in the year of acquisition.
Carrying amount The amount at which an asset is recognised after deducting any accumulated depreciation / amortisation and accumulated impairment losses thereon.
Class of assets See asset class definition
Component Specific parts of an asset having independent physical or functional identity and having specific attributes such as different life expectancy, maintenance regimes, risk or criticality.
Core asset management Asset management which relies primarily on the use of an asset register, maintenance management systems, job resource management, inventory control, condition assessment, simple risk assessment and defined levels of service, in order to establish alternative treatment options and long-term cashflow predictions. Priorities are usually established on the basis of financial return gained by carrying out the work (rather than detailed risk analysis and optimised decision- making).
Cost of an asset The amount of cash or cash equivalents paid or the fair value of the consideration given to acquire an asset at the time of its acquisition or construction, including any costs necessary to place the asset into service. This includes one-off design and project management costs.
Critical assets Assets for which the financial, business or service level consequences of failure are sufficiently severe to justify proactive inspection and rehabilitation. Critical assets have a lower threshold for action than non-critical assets.
Current replacement cost (CRC) The cost the entity would incur to acquire the asset on the reporting date. The cost is measured by reference to the lowest cost at which the gross future economic benefits could be obtained in the normal course of business or the minimum it would cost, to replace the existing asset with a technologically modern equivalent new asset (not a second hand one) with the same economic benefits (gross service potential) allowing for any differences in the quantity and quality of output and in operating costs.
Deferred maintenance The shortfall in rehabilitation work undertaken relative to that required to maintain the service potential of an asset.
Depreciable amount The cost of an asset, or other amount substituted for its cost, less its residual value.
JUNEE SHIRE COUNCIL – SEWERAGE SERVICES ASSET MANAGEMENT PLAN

- 44 -
Depreciated replacement cost (DRC) The current replacement cost (CRC) of an asset less, where applicable, accumulated depreciation calculated on the basis of such cost to reflect the already consumed or expired future economic benefits of the asset.
Depreciation / amortisation The systematic allocation of the depreciable amount (service potential) of an asset over its useful life.
Economic life See useful life definition.
Expenditure The spending of money on goods and services. Expenditure includes recurrent and capital outlays.
Expenses Decreases in economic benefits during the accounting period in the form of outflows or depletions of assets or increases in liabilities that result in decreases in equity, other than those relating to distributions to equity participants.
Fair value The amount for which an asset could be exchanged, or a liability settled, between knowledgeable, willing parties, in an arm’s length transaction.
Financing gap A financing gap exists whenever an entity has insufficient capacity to finance asset renewal and other expenditure necessary to be able to appropriately maintain the range and level of services its existing asset stock was originally designed and intended to deliver. The service capability of the existing asset stock should be determined assuming no additional operating revenue, productivity improvements, or net financial liabilities above levels currently planned or projected. A current financing gap means service levels have already or are currently falling. A projected financing gap if not addressed will result in a future diminution of existing service levels.
Heritage asset An asset with historic, artistic, scientific, technological, geographical or environmental qualities that is held and maintained principally for its contribution to knowledge and culture and this purpose is central to the objectives of the entity holding it.
Impairment Loss The amount by which the carrying amount of an asset exceeds its recoverable amount.
Infrastructure assets Physical assets that contribute to meeting the needs of organisations or the need for access to major economic and social facilities and services, eg. roads, drainage, footpaths and cycleways. These are typically large, interconnected networks or portfolios of composite assets. The components of these assets may be separately maintained, renewed or replaced individually so that the required level and standard of service from the network of assets is continuously sustained. Generally the components and hence the assets have long lives. They are fixed in place and are often have no separate market value.
Investment property Property held to earn rentals or for capital appreciation or both, rather than for: (a) use in the production or supply of goods or services
or for administrative purposes; or (b) sale in the ordinary course of business.
Key performance indicator A qualitative or quantitative measure of a service or activity used to compare actual performance against a standard or other target. Performance indicators commonly relate to statutory limits, safety, responsiveness, cost, comfort, asset performance, reliability, efficiency, environmental protection and customer satisfaction.
Level of service The defined service quality for a particular service/activity against which service performance may be measured. Service levels usually relate to quality, quantity, reliability, responsiveness, environmental impact, acceptability and cost.
Life Cycle Cost * 1. Total LCC The total cost of an asset throughout its
life including planning, design, construction, acquisition, operation, maintenance, rehabilitation and disposal costs.
2. Average LCC The life cycle cost (LCC) is average cost to provide the service over the longest asset life cycle. It comprises average operations, maintenance expenditure plus asset consumption expense, represented by depreciation expense projected over 10 years. The Life Cycle Cost does not indicate the funds required to provide the service in a particular year.
JUNEE SHIRE COUNCIL – SEWERAGE SERVICES ASSET MANAGEMENT PLAN
- 45 -
Life Cycle Expenditure The Life Cycle Expenditure (LCE) is the average operations, maintenance and capital renewal expenditure accommodated in the long term financial plan over 10 years. Life Cycle Expenditure may be compared to average Life Cycle Cost to give an initial indicator of affordability of projected service levels when considered with asset age profiles.
Loans / borrowings See borrowings.
Maintenance All actions necessary for retaining an asset as near as practicable to an appropriate service condition, including regular ongoing day-to-day work necessary to keep assets operating, eg road patching but excluding rehabilitation or renewal. It is operating expenditure required to ensure that the asset reaches its expected useful life. • Planned maintenance
Repair work that is identified and managed through a maintenance management system (MMS). MMS activities include inspection, assessing the condition against failure/breakdown criteria/experience, prioritising scheduling, actioning the work and reporting what was done to develop a maintenance history and improve maintenance and service delivery performance.
• Reactive maintenance Unplanned repair work that is carried out in response to service requests and management/ supervisory directions.
• Specific maintenance Maintenance work to repair components or replace sub-components that needs to be identified as a specific maintenance item in the maintenance budget.
• Unplanned maintenance Corrective work required in the short-term to restore an asset to working condition so it can continue to deliver the required service or to maintain its level of security and integrity.
Maintenance expenditure * Recurrent expenditure, which is periodically or regularly required as part of the anticipated schedule of works required to ensure that the asset achieves its useful life and provides the required level of service. It is expenditure, which was anticipated in determining the asset’s useful life.
Materiality The notion of materiality guides the margin of error acceptable, the degree of precision required and the extent of the disclosure required when preparing general purpose financial reports. Information is material if its omission, misstatement or non-disclosure has the potential, individually or collectively, to influence the economic decisions of users taken on the basis of the financial report or affect the discharge of accountability by the management or governing body of the entity.
Modern equivalent asset Assets that replicate what is in existence with the most cost-effective asset performing the same level of service. It is the most cost efficient, currently available asset which will provide the same stream of services as the existing asset is capable of producing. It allows for technology changes and, improvements and efficiencies in production and installation techniques
Net present value (NPV) The value to the organisation of the cash flows associated with an asset, liability, activity or event calculated using a discount rate to reflect the time value of money. It is the net amount of discounted total cash inflows after deducting the value of the discounted total cash outflows arising from eg the continued use and subsequent disposal of the asset after deducting the value of the discounted total cash outflows.
Non-revenue generating investments Investments for the provision of goods and services to sustain or improve services to the community that are not expected to generate any savings or revenue to the organisation, eg. parks and playgrounds, footpaths, roads and bridges, libraries, etc.
Operations Regular activities to provide services such as public health, safety and amenity, eg street sweeping, grass mowing and street lighting.
Operating expenditure Recurrent expenditure, which is continuously required to provide a service. In common use the term typically includes, eg power, fuel, staff, plant equipment, on-costs and overheads but excludes maintenance and depreciation. Maintenance and depreciation is on the other hand included in operating expenses.
JUNEE SHIRE COUNCIL – SEWERAGE SERVICES ASSET MANAGEMENT PLAN
- 46 -
Operating expense The gross outflow of economic benefits, being cash and non-cash items, during the period arising in the course of ordinary activities of an entity when those outflows result in decreases in equity, other than decreases relating to distributions to equity participants.
Operating expenses Recurrent expenses continuously required to provide a service, including power, fuel, staff, plant equipment, maintenance, depreciation, on-costs and overheads.
Operations, maintenance and renewal financing ratio Ratio of estimated budget to projected expenditure for operations, maintenance and renewal of assets over a defined time (eg 5, 10 and 15 years).
Operations, maintenance and renewal gap Difference between budgeted expenditures in a long term financial plan (or estimated future budgets in absence of a long term financial plan) and projected expenditures for operations, maintenance and renewal of assets to achieve/maintain specified service levels, totalled over a defined time (e.g. 5, 10 and 15 years).
Pavement management system (PMS) A systematic process for measuring and predicting the condition of road pavements and wearing surfaces over time and recommending corrective actions.
PMS Score A measure of condition of a road segment determined from a Pavement Management System.
Rate of annual asset consumption * The ratio of annual asset consumption relative to the depreciable amount of the assets. It measures the amount of the consumable parts of assets that are consumed in a period (depreciation) expressed as a percentage of the depreciable amount.
Rate of annual asset renewal * The ratio of asset renewal and replacement expenditure relative to depreciable amount for a period. It measures whether assets are being replaced at the rate they are wearing out with capital renewal expenditure expressed as a percentage of depreciable amount (capital renewal expenditure/DA).
Rate of annual asset upgrade/new * A measure of the rate at which assets are being upgraded and expanded per annum with capital upgrade/new expenditure expressed as a percentage of depreciable amount (capital upgrade/expansion expenditure/DA).
Recoverable amount The higher of an asset's fair value, less costs to sell and its value in use.
Recurrent expenditure Relatively small (immaterial) expenditure or that which has benefits expected to last less than 12 months. Recurrent expenditure includes operations and maintenance expenditure.
Recurrent funding Funding to pay for recurrent expenditure.
Rehabilitation See capital renewal expenditure definition above.
Remaining useful life The time remaining until an asset ceases to provide the required service level or economic usefulness. Age plus remaining useful life is useful life.
Renewal See capital renewal expenditure definition above.
Residual value The estimated amount that an entity would currently obtain from disposal of the asset, after deducting the estimated costs of disposal, if the asset were already of the age and in the condition expected at the end of its useful life.
Revenue generating investments Investments for the provision of goods and services to sustain or improve services to the community that are expected to generate some savings or revenue to offset operating costs, eg public halls and theatres, childcare centres, sporting and recreation facilities, tourist information centres, etc.
Risk management The application of a formal process to the range of possible values relating to key factors associated with a risk in order to determine the resultant ranges of outcomes and their probability of occurrence.
Section or segment A self-contained part or piece of an infrastructure asset.
Service potential The total future service capacity of an asset. It is normally determined by reference to the operating capacity and economic life of an asset. A measure of service potential is used in the not-for-profit sector/public sector to value assets, particularly those not producing a cash flow.
JUNEE SHIRE COUNCIL – SEWERAGE SERVICES ASSET MANAGEMENT PLAN
- 47 -
Service potential remaining A measure of the future economic benefits remaining in assets. It may be expressed in dollar values (Fair Value) or as a percentage of total anticipated future economic benefits. It is also a measure of the percentage of the asset’s potential to provide services that is still available for use in providing services (Depreciated Replacement Cost/Depreciable Amount).
Specific Maintenance Replacement of higher value components/sub-components of assets that is undertaken on a regular cycle including repainting, replacement of air conditioning equipment, etc. This work generally falls below the capital/ maintenance threshold and needs to be identified in a specific maintenance budget allocation.
Strategic Longer-Term Plan A plan covering the term of office of councillors (4 years minimum) reflecting the needs of the community for the foreseeable future. It brings together the detailed requirements in the Council’s longer-term plans such as the asset management plan and the long-term financial plan. The plan is prepared in consultation with the community and details where the Council is at that point in time, where it wants to go, how it is going to get there, mechanisms for monitoring the achievement of the outcomes and how the plan will be resourced.
Sub-component Smaller individual parts that make up a component part.
Useful life Either: (a) the period over which an asset is expected to be
available for use by an entity, or (b) the number of production or similar units expected
to be obtained from the asset by the entity. It is estimated or expected time between placing the asset into service and removing it from service, or the estimated period of time over which the future economic benefits embodied in a depreciable asset, are expected to be consumed by the organisation.
Value in Use The present value of future cash flows expected to be derived from an asset or cash generating unit. It is deemed to be depreciated replacement cost (DRC) for those assets whose future economic benefits are not primarily dependent on the asset's ability to generate net cash inflows, where the entity would, if deprived of the asset, replace its remaining future economic benefits.
Source: IPWEA, 2009, AIFMG Glossary
Additional and modified glossary items shown *
JUNEE SHIRE COUNCIL – SEWERAGE SERVICES ASSET MANAGEMENT PLAN