
Asset Management Asset Management Asset Management
55
PIBC CONFERENCE LOURETTE SWANEPOEL 31 MAY 2018
Transcript of Asset Management Asset Management Asset Management
PIBC CONFERENCELOURETTE SWANEPOEL
31 MAY 2018
Acknowledgements
This initiative is offered through the
Municipal Asset Management
Program, which is delivered by the
Federation of Canadian
Municipalities and funded by the
Government of Canada.
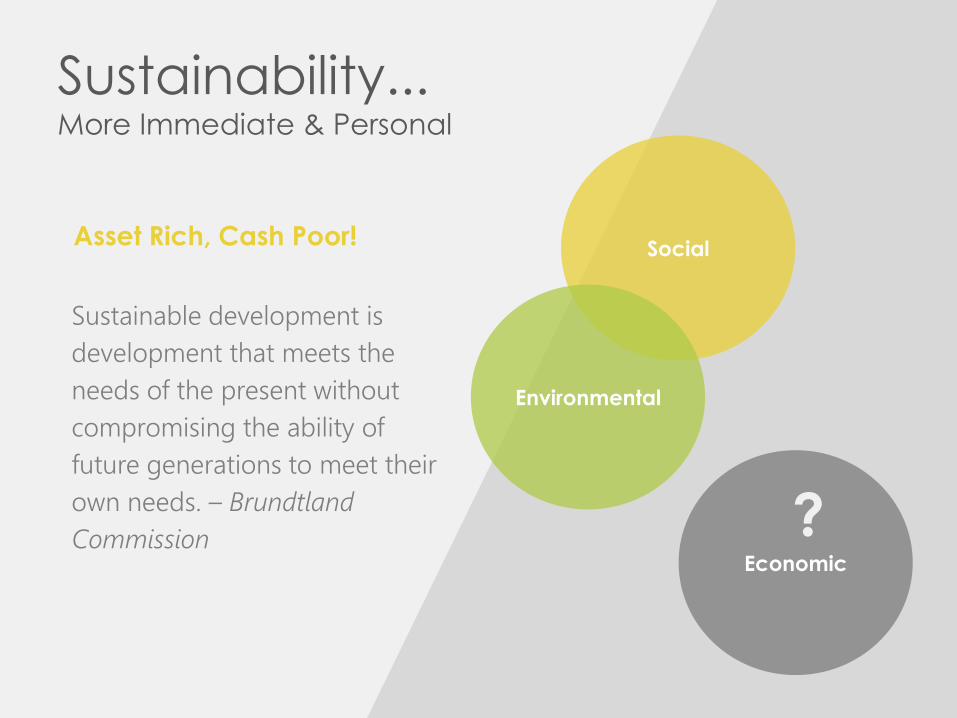
Sustainability...More Immediate & Personal
Sustainable development is
development that meets the
needs of the present without
compromising the ability of
future generations to meet their
own needs. – Brundtland
CommissionEconomic
Social
Environmental
?
Asset Rich, Cash Poor!
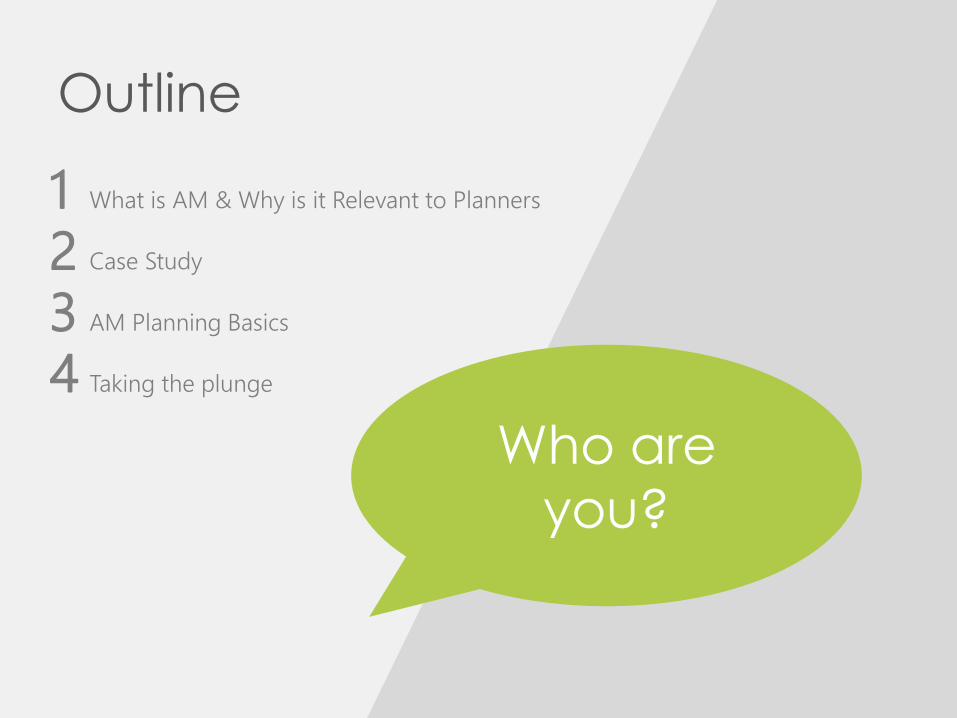
Outline
What is AM & Why is it Relevant to Planners
Case Study
AM Planning Basics
Taking the plunge
1234
Who are
you?
WHAT IS AM & WHY IS IT
RELEVANT TO PLANNERS
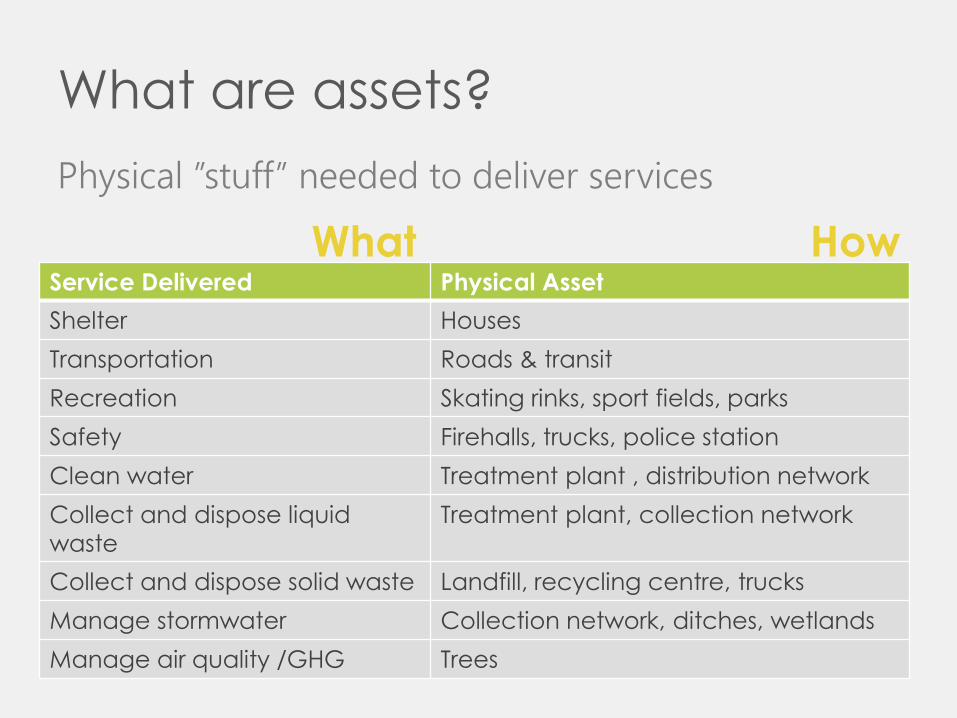
What are assets?
Physical ”stuff” needed to deliver services
Service Delivered Physical Asset
Shelter Houses
Transportation Roads & transit
Recreation Skating rinks, sport fields, parks
Safety Firehalls, trucks, police station
Clean water Treatment plant , distribution network
Collect and dispose liquid
waste
Treatment plant, collection network
Collect and dispose solid waste Landfill, recycling centre, trucks
Manage stormwater Collection network, ditches, wetlands
Manage air quality /GHG Trees
HowWhat
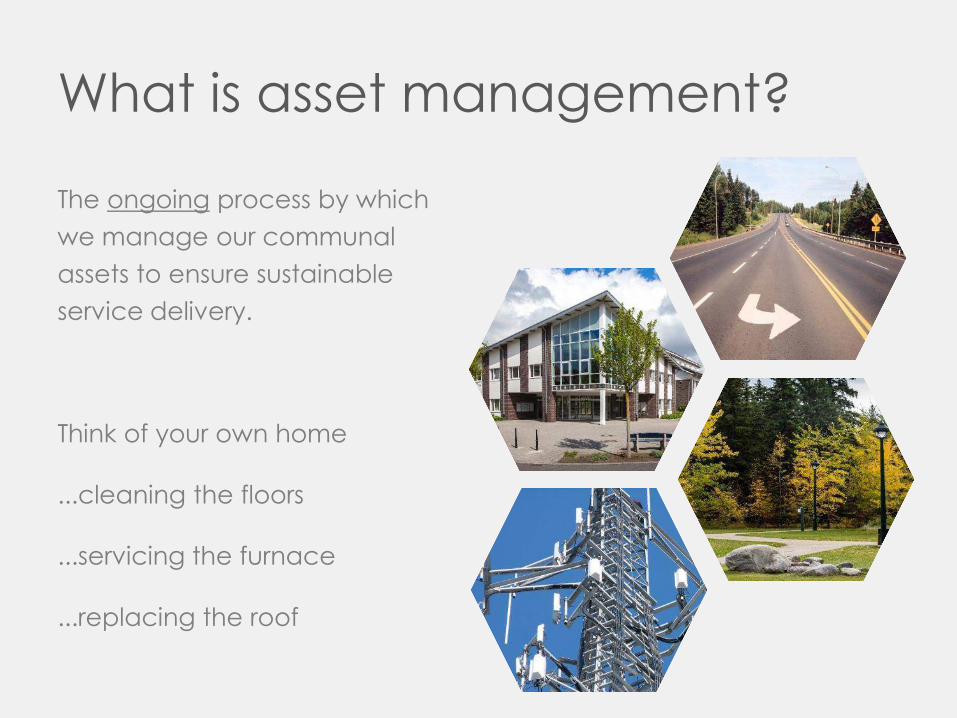
What is asset management?
The ongoing process by which
we manage our communal
assets to ensure sustainable
service delivery.
Think of your own home
...cleaning the floors
...servicing the furnace
...replacing the roof
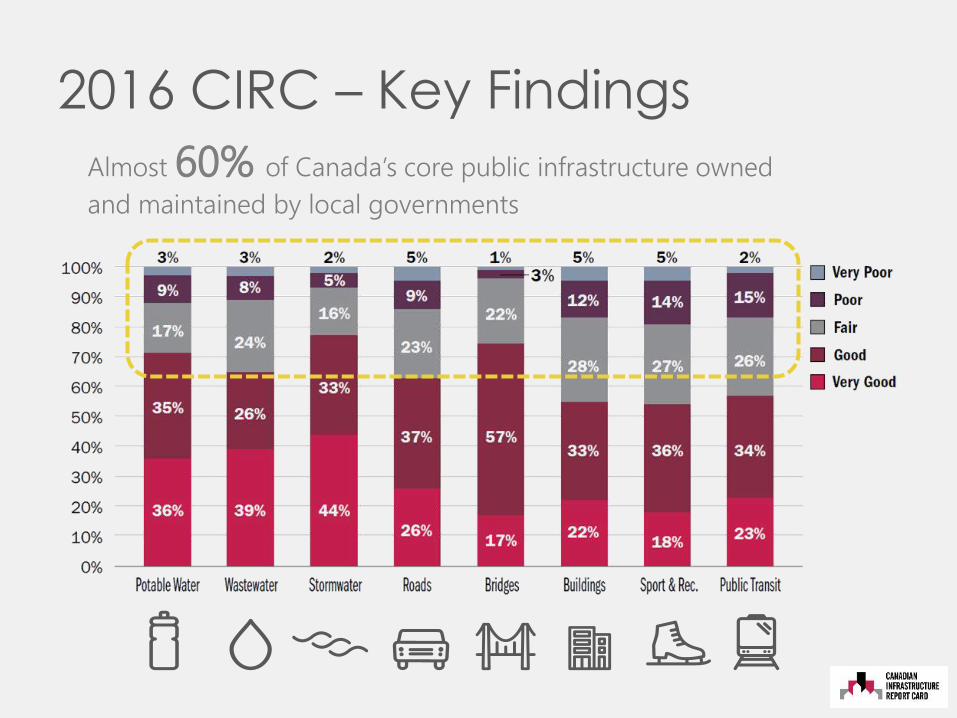
2016 CIRC – Key Findings
Almost 60% of Canada’s core public infrastructure owned
and maintained by local governments
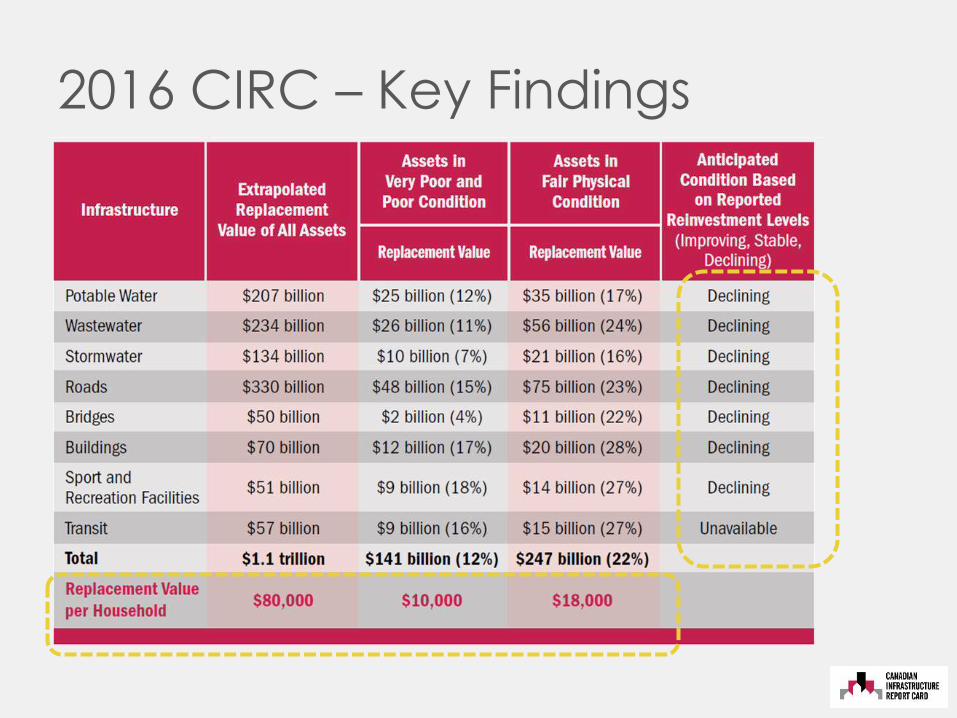
2016 CIRC – Key Findings
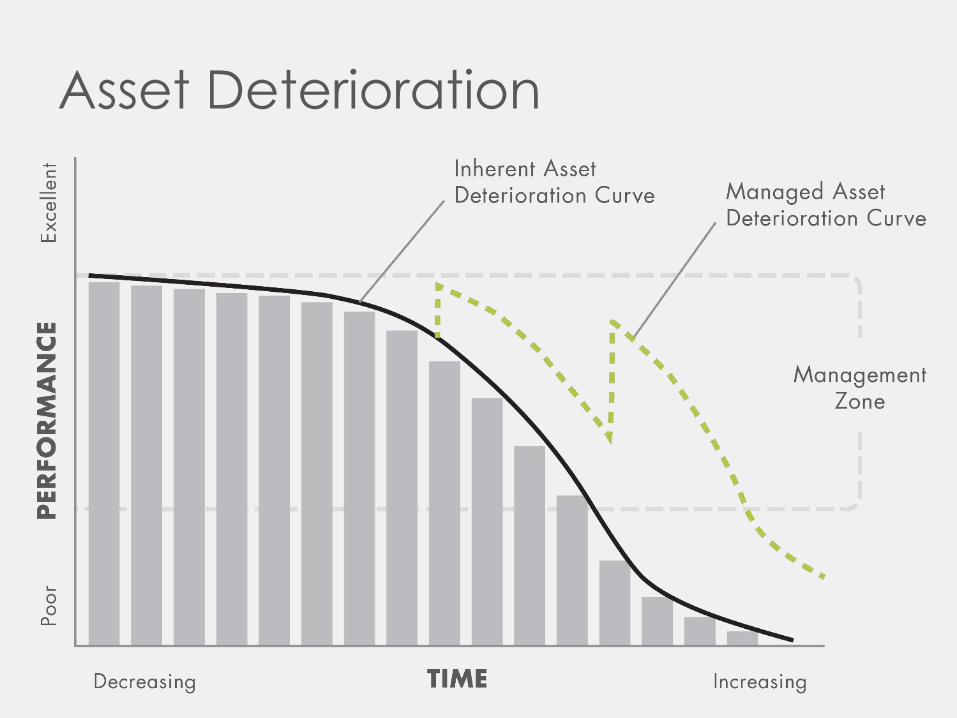
Asset Deterioration
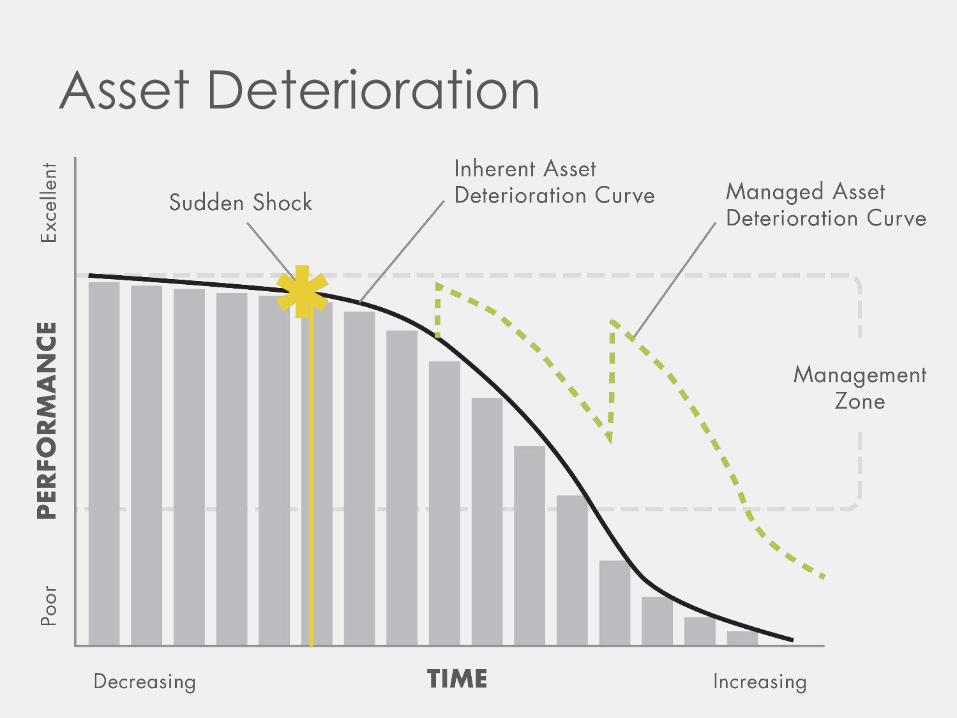
Asset Deterioration
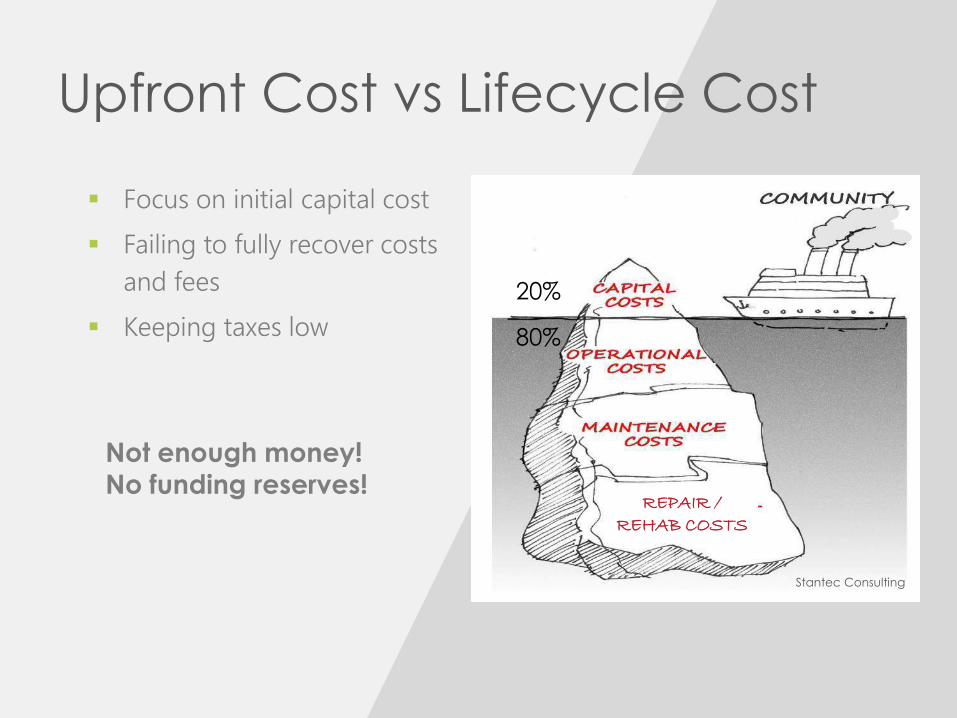
Upfront Cost vs Lifecycle Cost
Focus on initial capital cost
Failing to fully recover costs
and fees
Keeping taxes low
Not enough money!
No funding reserves!
Stantec Consulting
REPAIR / REHAB COSTS
20%
80%
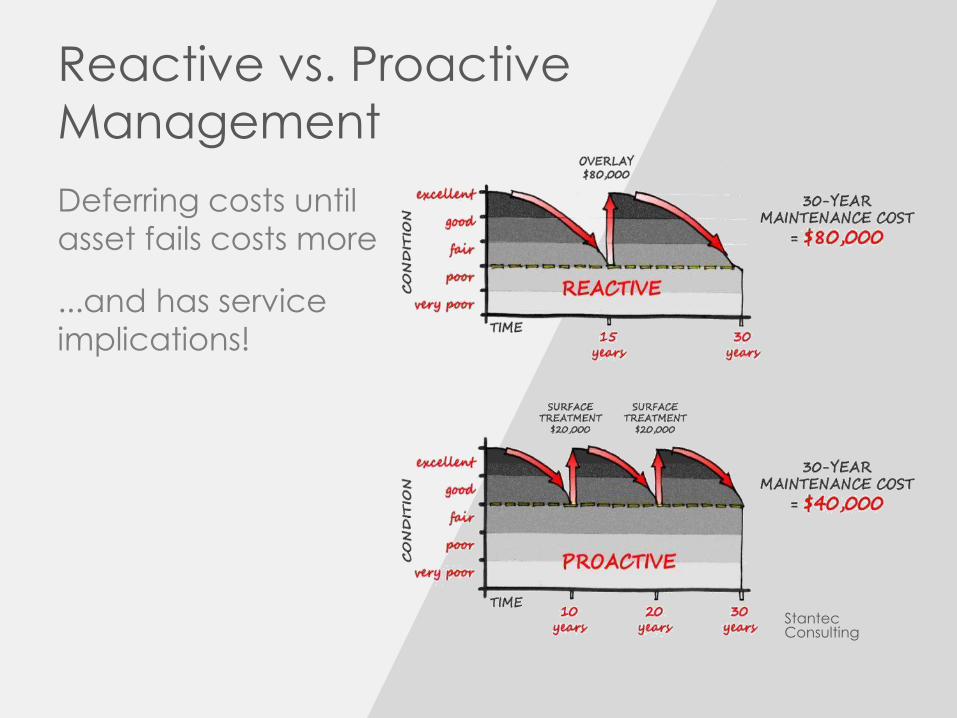
Reactive vs. Proactive
Management
Deferring costs until
asset fails costs more
...and has service
implications!
StantecConsulting
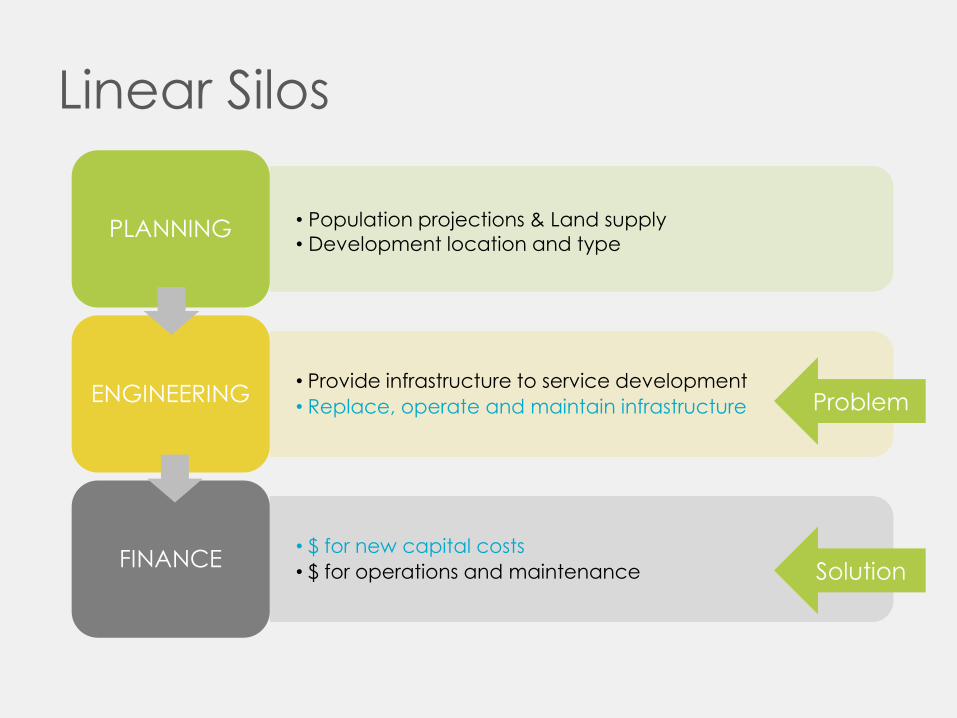
Linear Silos
• Population projections & Land supply
• Development location and typePLANNING
• Provide infrastructure to service development
• Replace, operate and maintain infrastructureENGINEERING
• $ for new capital costs
• $ for operations and maintenanceFINANCE
Problem
Solution
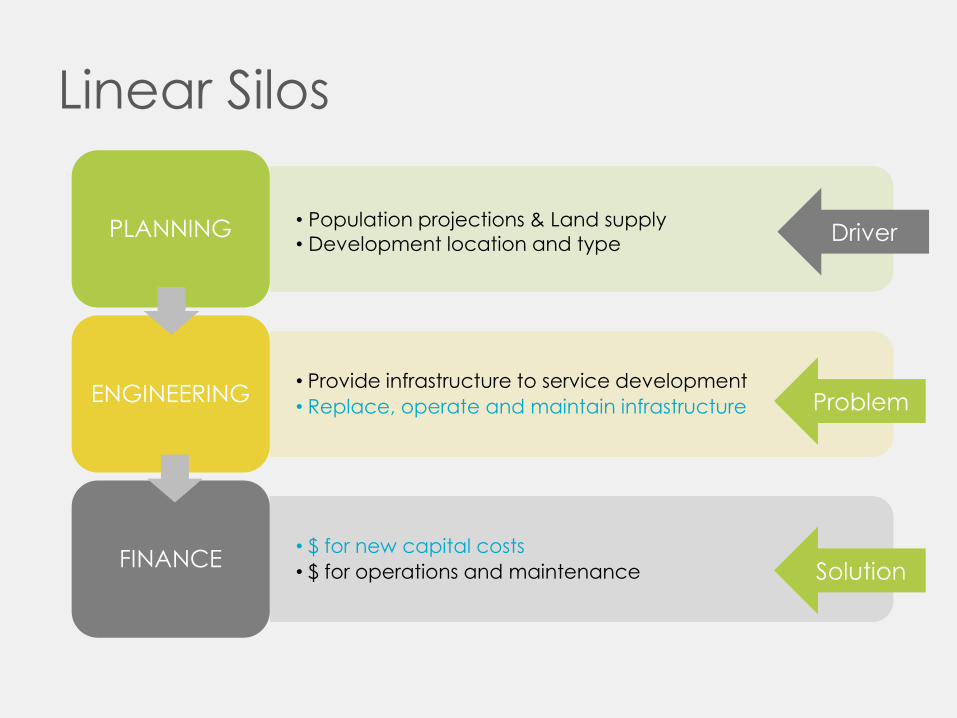
Linear Silos
• Population projections & Land supply
• Development location and typePLANNING
• Provide infrastructure to service development
• Replace, operate and maintain infrastructureENGINEERING
• $ for new capital costs
• $ for operations and maintenanceFINANCE
Problem
Solution
Driver
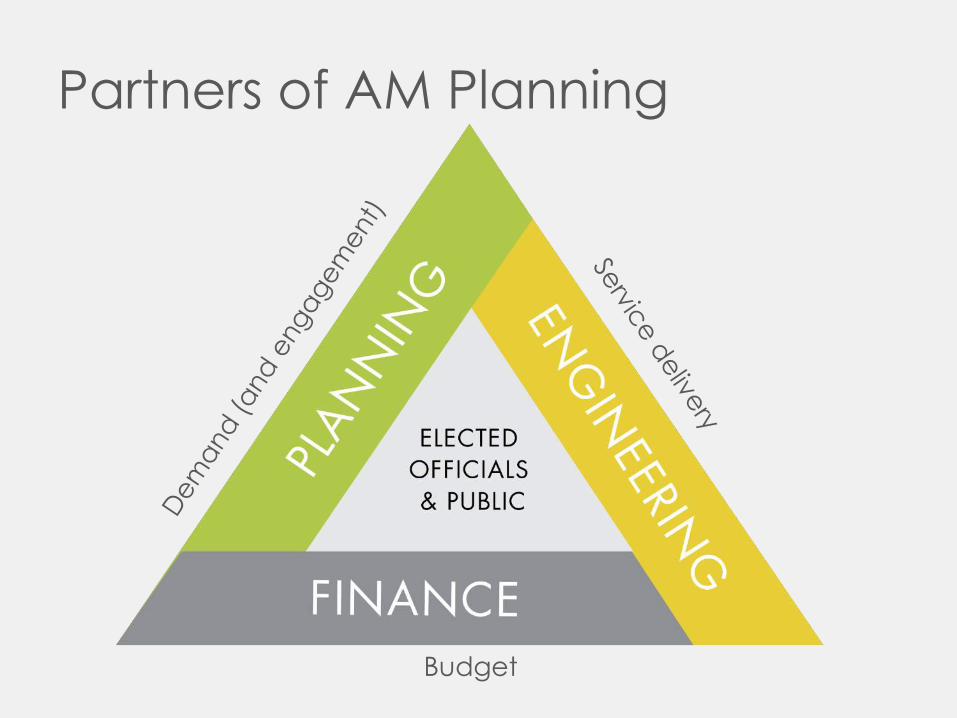
Partners of AM Planning
Budget
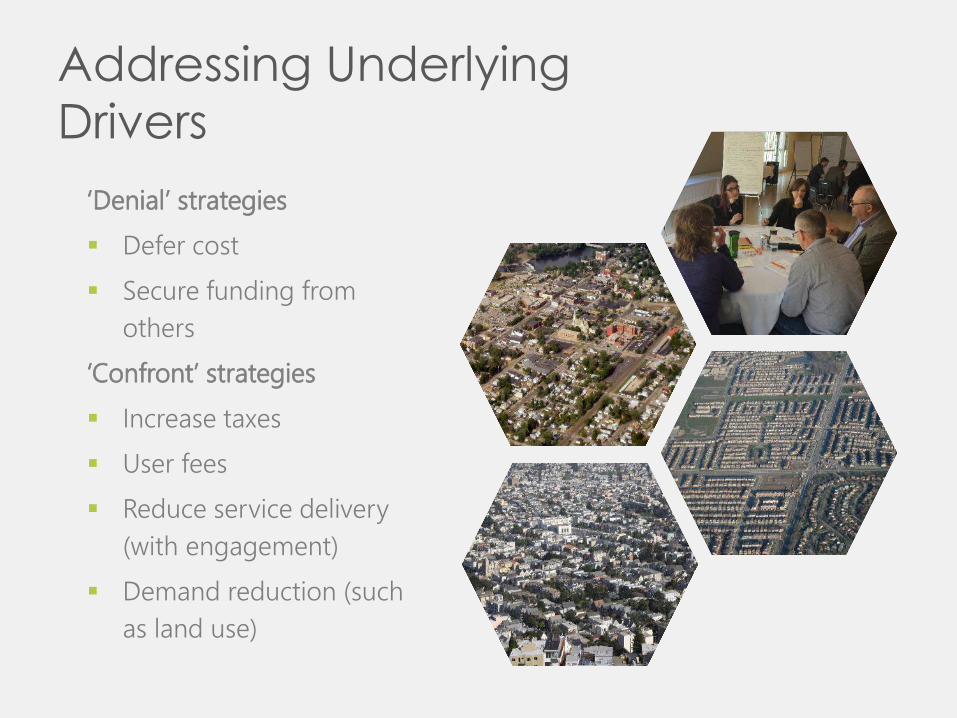
Addressing Underlying
Drivers
‘Denial’ strategies
Defer cost
Secure funding from
others
‘Confront’ strategies
Increase taxes
User fees
Reduce service delivery
(with engagement)
Demand reduction (such
as land use)
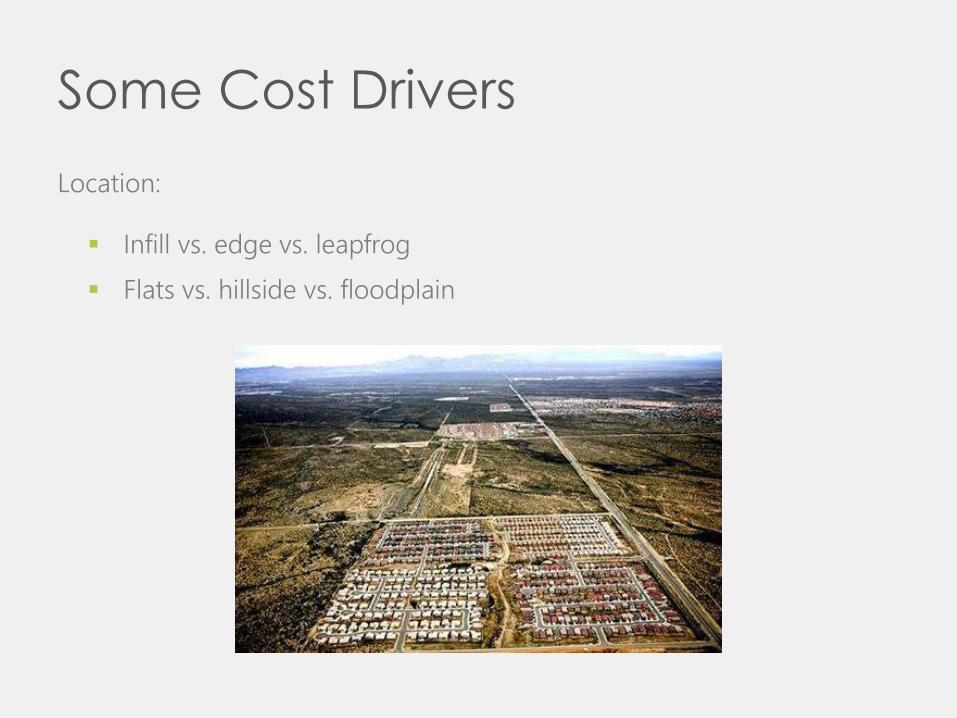
Some Cost Drivers
Location:
Infill vs. edge vs. leapfrog
Flats vs. hillside vs. floodplain
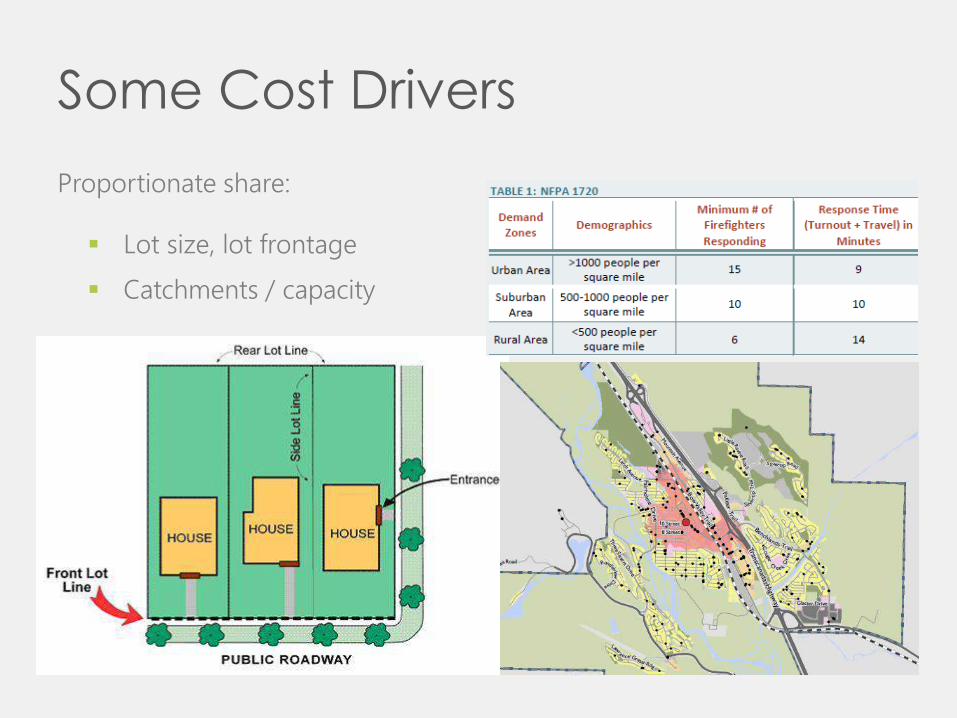
Some Cost Drivers
Proportionate share:
Lot size, lot frontage
Catchments / capacity
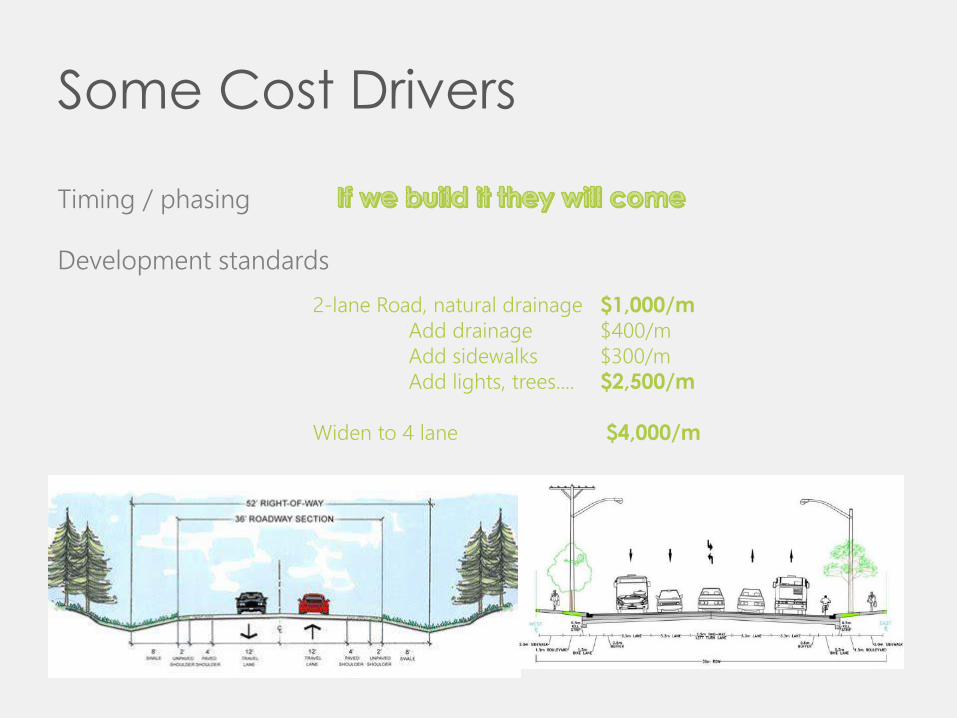
Some Cost Drivers
Timing / phasing
Development standards
2-lane Road, natural drainage $1,000/m
Add drainage $400/m
Add sidewalks $300/m
Add lights, trees.... $2,500/m
Widen to 4 lane $4,000/m
CASE STUDY

Undeveloped Lands Under
Consideration – Development
Industry Pressures
Council Objectives
Mandate to Council’s Infrastructure and Buildings Committee
Evaluate financial impacts:
Capital cost - includes buildings, major equipment, land
acquisition, etc.
O&M cost - includes labour, materials, contracts, etc.
other associated costs
Will current practices make the development financially sustainable?
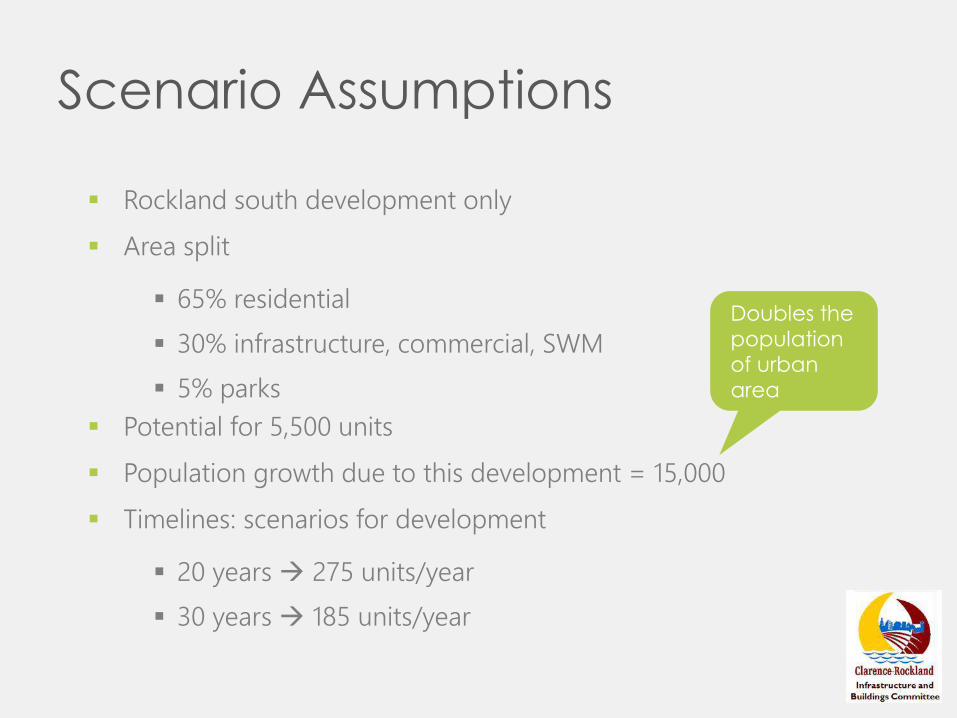
Scenario Assumptions
Rockland south development only
Area split
65% residential
30% infrastructure, commercial, SWM
5% parks
Potential for 5,500 units
Population growth due to this development = 15,000
Timelines: scenarios for development
20 years 275 units/year
30 years 185 units/year
Doubles the
population
of urban
area
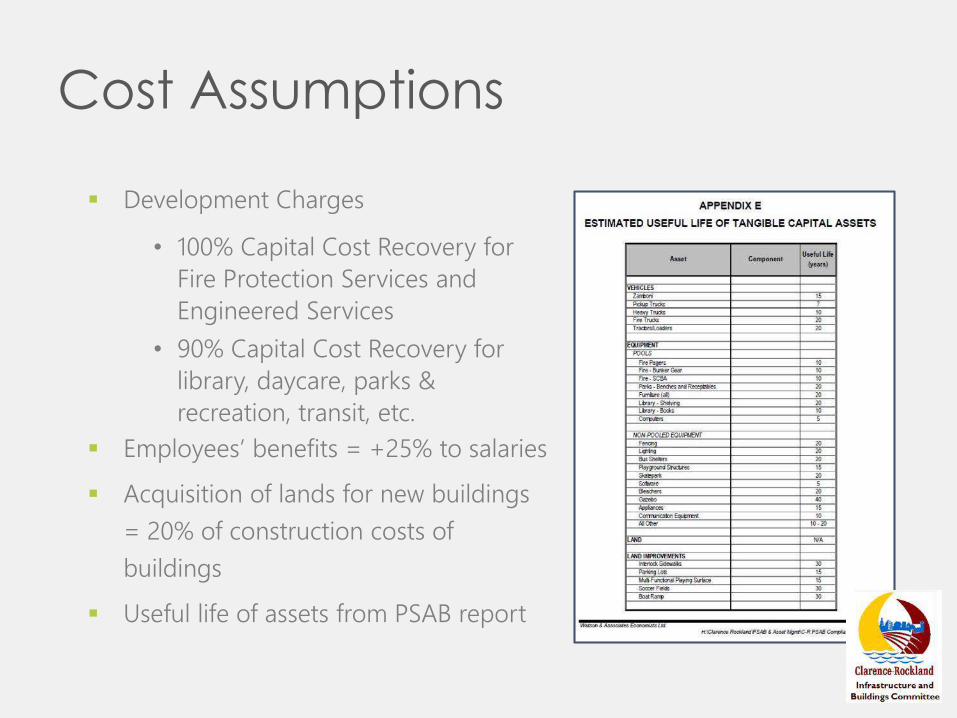
Cost Assumptions
Development Charges
• 100% Capital Cost Recovery for
Fire Protection Services and
Engineered Services
• 90% Capital Cost Recovery for
library, daycare, parks &
recreation, transit, etc.
Employees’ benefits = +25% to salaries
Acquisition of lands for new buildings
= 20% of construction costs of
buildings
Useful life of assets from PSAB report
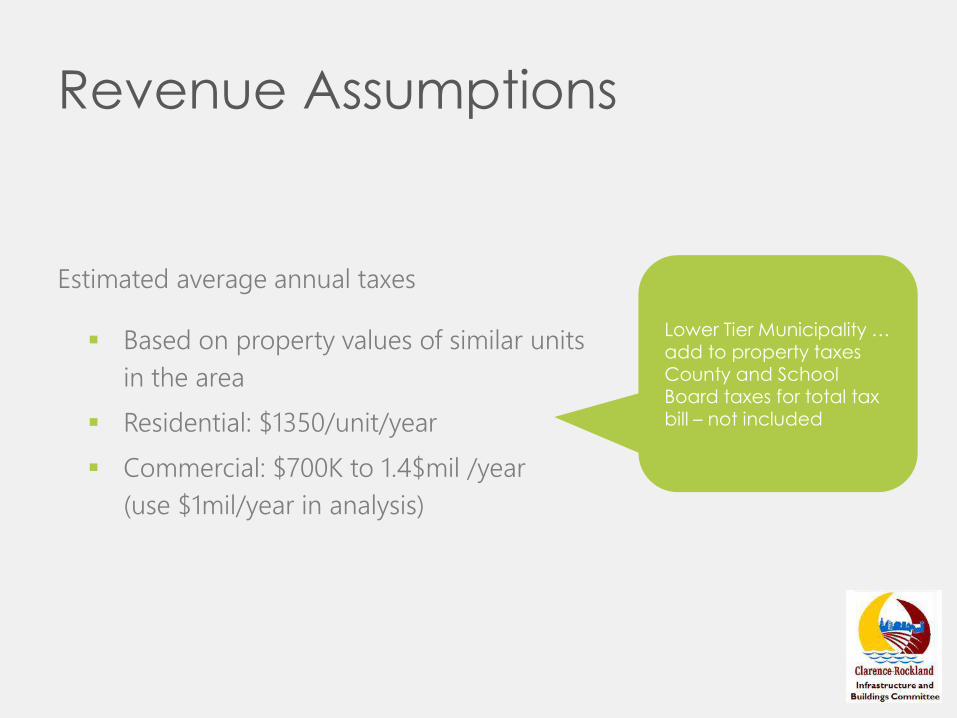
Revenue Assumptions
Estimated average annual taxes
Based on property values of similar units
in the area
Residential: $1350/unit/year
Commercial: $700K to 1.4$mil /year
(use $1mil/year in analysis)
Lower Tier Municipality … add to property taxes County and School Board taxes for total tax bill – not included
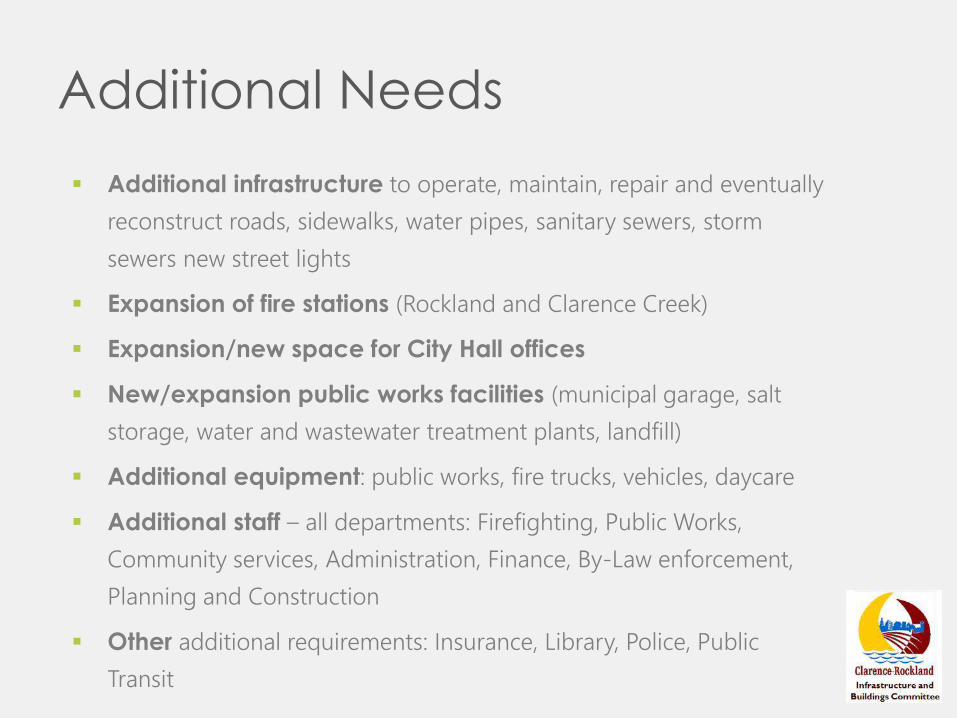
Additional Needs
Additional infrastructure to operate, maintain, repair and eventually
reconstruct roads, sidewalks, water pipes, sanitary sewers, storm
sewers new street lights
Expansion of fire stations (Rockland and Clarence Creek)
Expansion/new space for City Hall offices
New/expansion public works facilities (municipal garage, salt
storage, water and wastewater treatment plants, landfill)
Additional equipment: public works, fire trucks, vehicles, daycare
Additional staff – all departments: Firefighting, Public Works,
Community services, Administration, Finance, By-Law enforcement,
Planning and Construction
Other additional requirements: Insurance, Library, Police, Public
Transit
Is there something missing from
the list of needs you might add?
How would you cost out your
needs?
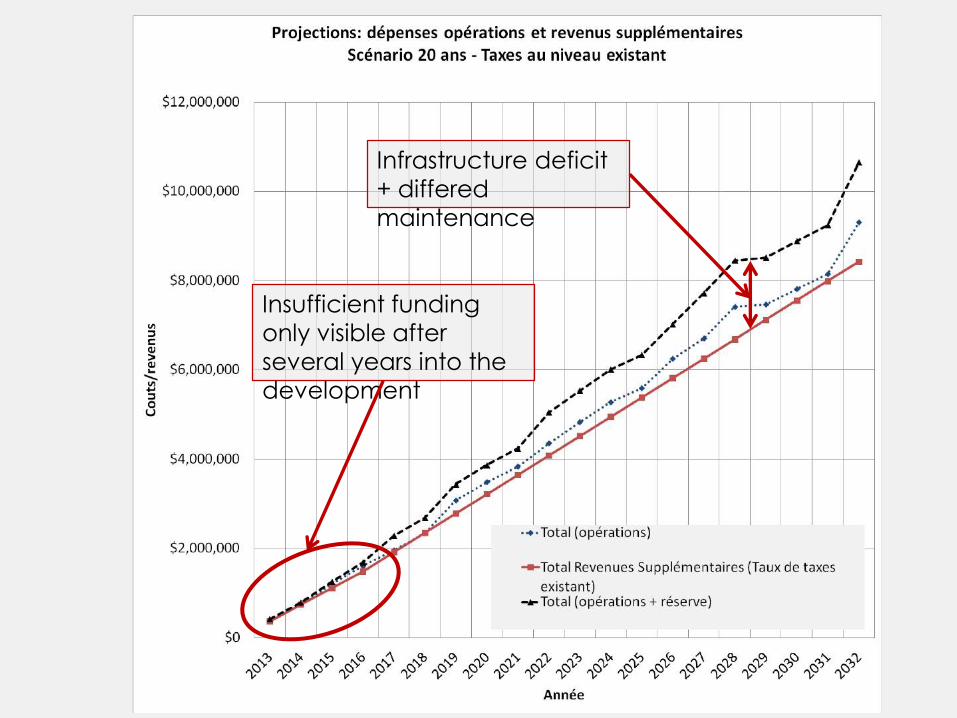
Infrastructure deficit
+ differed
maintenance
Insufficient funding
only visible after
several years into the
development
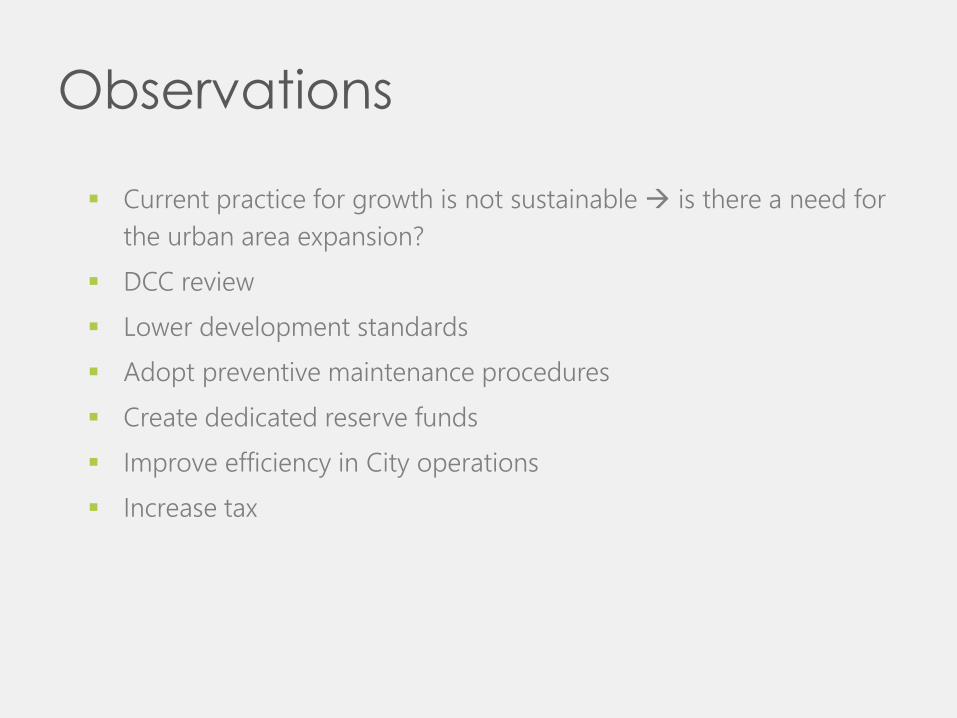
Observations
Current practice for growth is not sustainable is there a need for
the urban area expansion?
DCC review
Lower development standards
Adopt preventive maintenance procedures
Create dedicated reserve funds
Improve efficiency in City operations
Increase tax
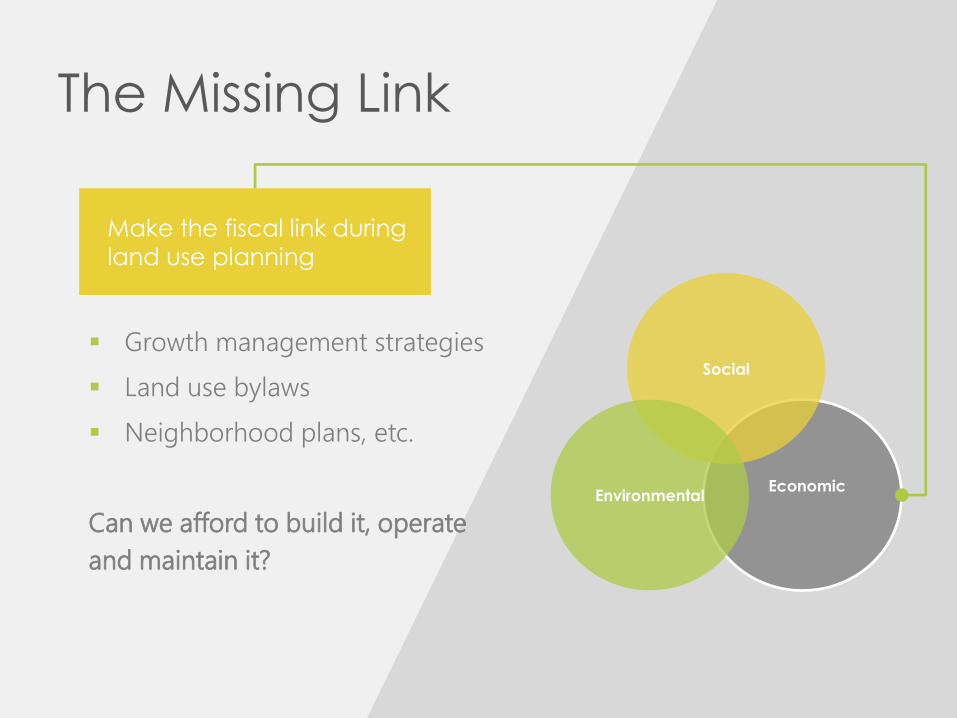
The Missing Link
Make the fiscal link during
land use planning
Growth management strategies
Land use bylaws
Neighborhood plans, etc.
Can we afford to build it, operate
and maintain it?
Economic
Social
Environmental
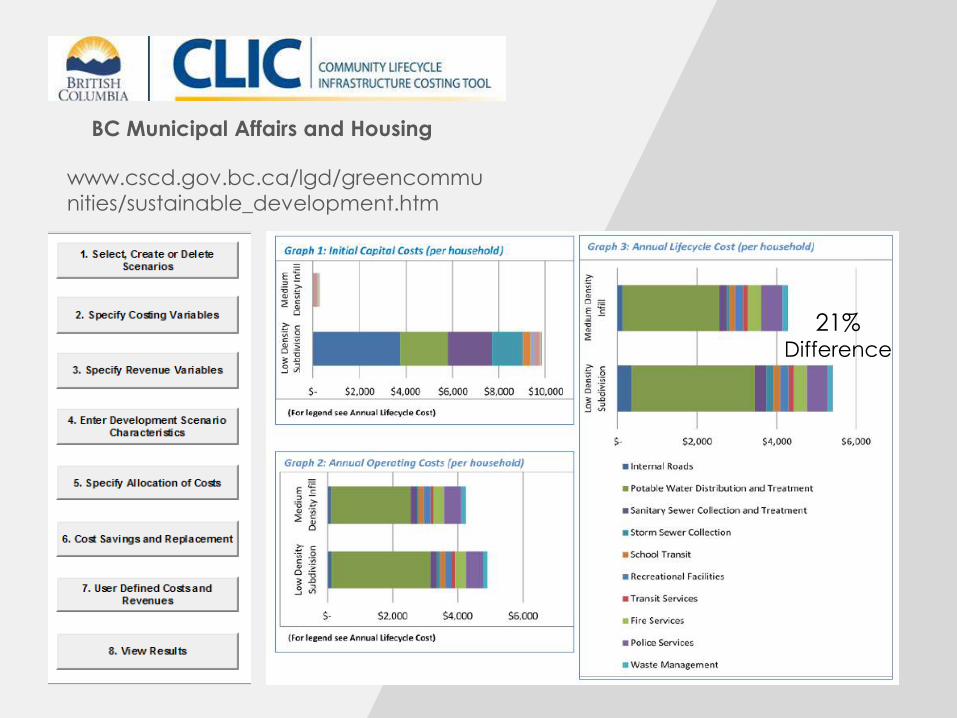
BC Municipal Affairs and Housing
www.cscd.gov.bc.ca/lgd/greencommu
nities/sustainable_development.htm
21% Difference
AM PLANNING BASICS
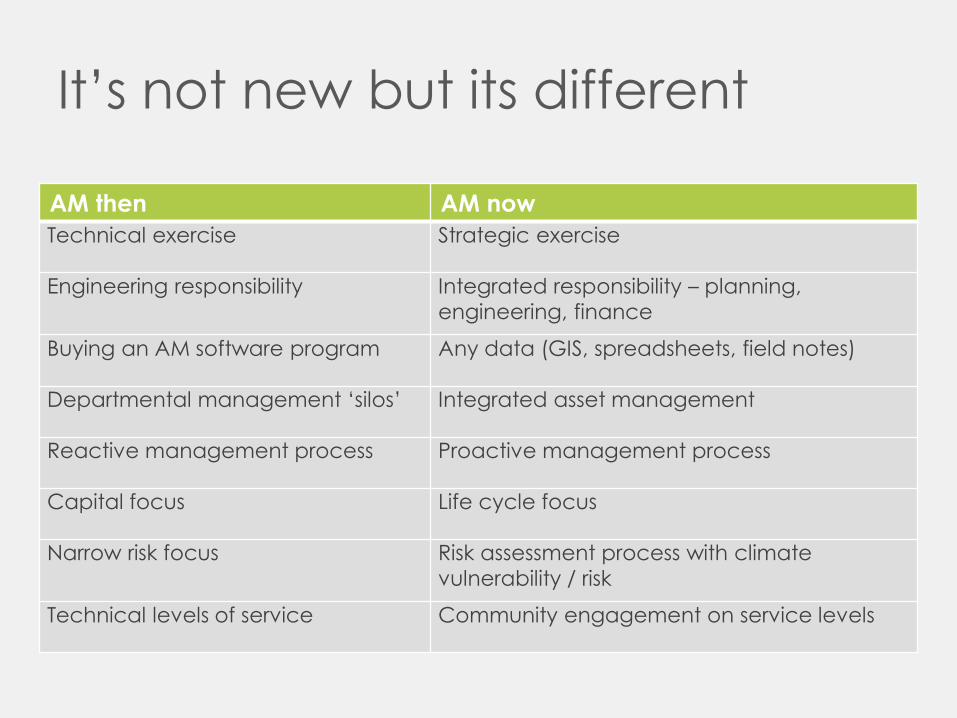
It’s not new but its different
AM then AM now
Technical exercise Strategic exercise
Engineering responsibility Integrated responsibility – planning,
engineering, finance
Buying an AM software program Any data (GIS, spreadsheets, field notes)
Departmental management ‘silos’ Integrated asset management
Reactive management process Proactive management process
Capital focus Life cycle focus
Narrow risk focus Risk assessment process with climate
vulnerability / risk
Technical levels of service Community engagement on service levels
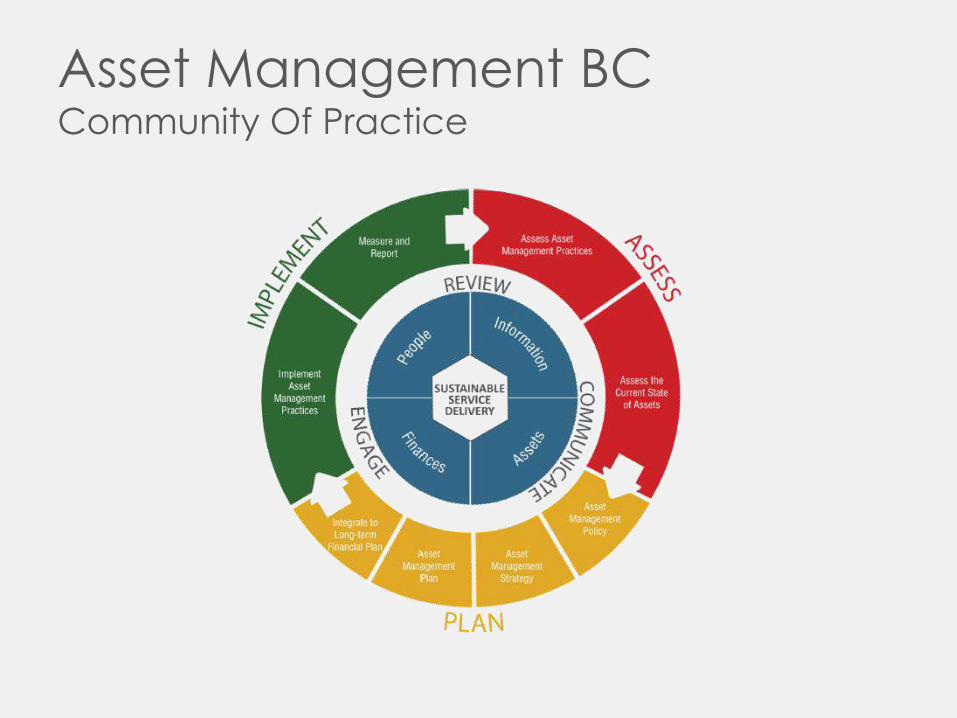
Asset Management BCCommunity Of Practice
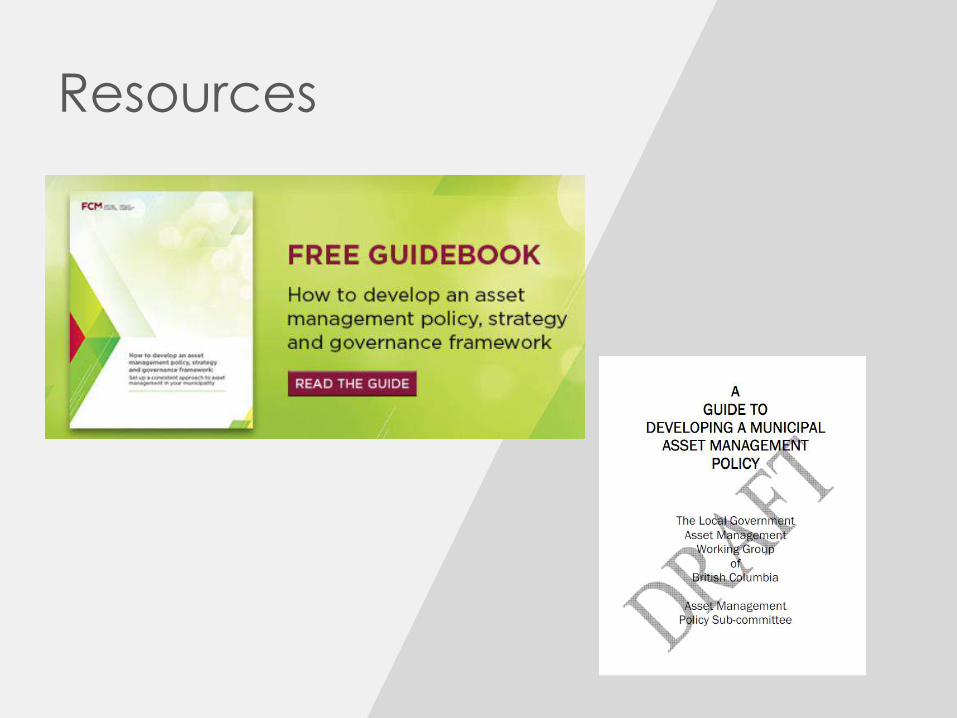
Resources
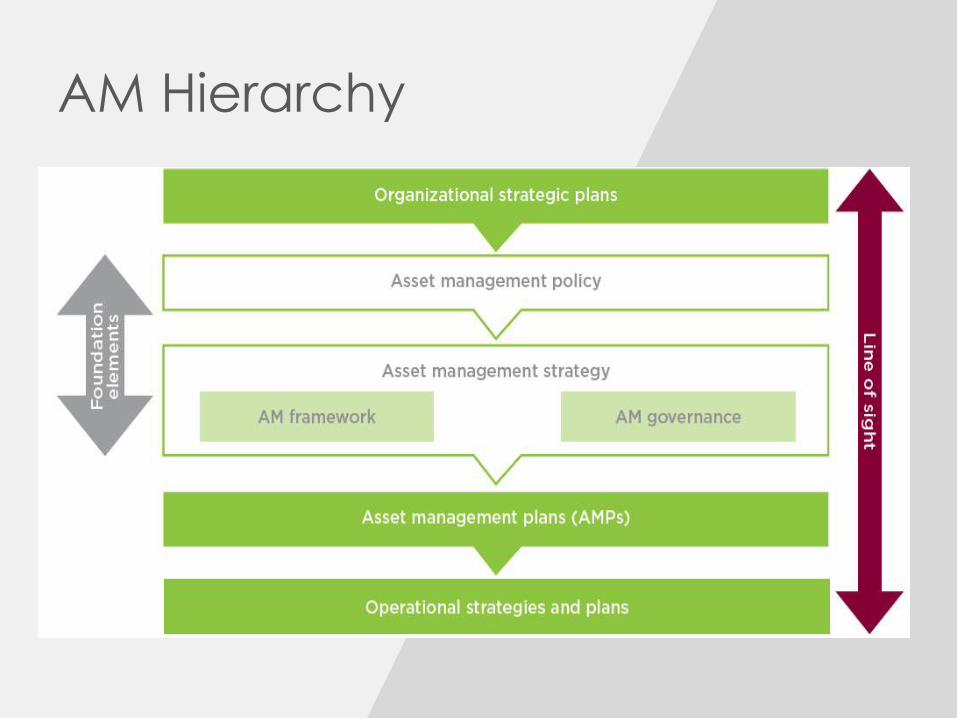
AM Hierarchy
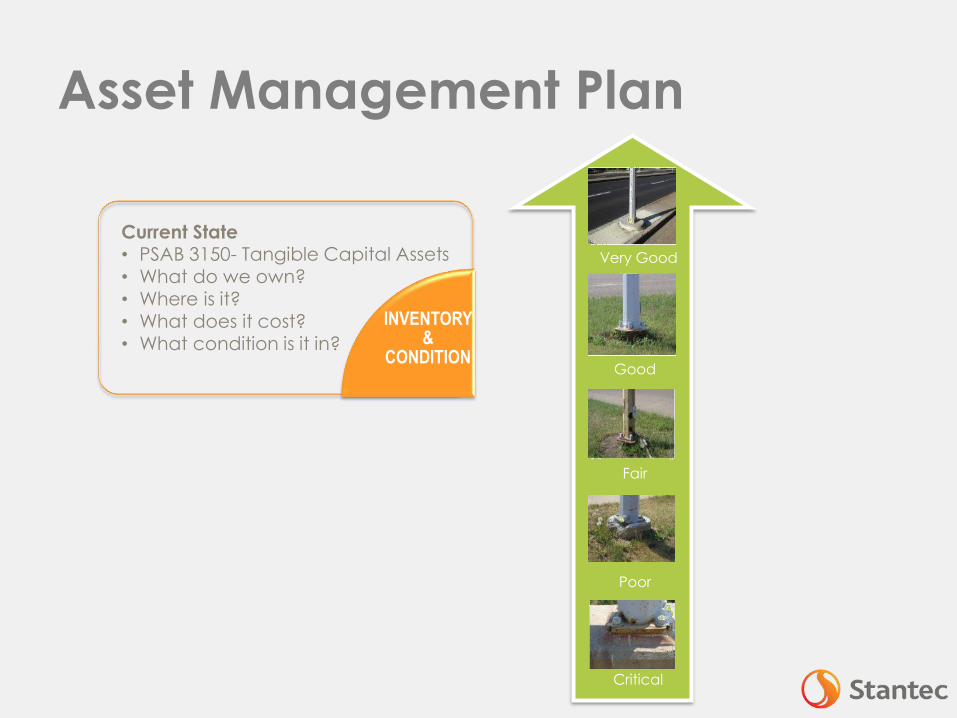
Asset Management Plan
INVENTORY &
CONDITION
Current State• PSAB 3150- Tangible Capital Assets • What do we own?• Where is it? • What does it cost? • What condition is it in?
Very Good
Good
Fair
Poor
Critical
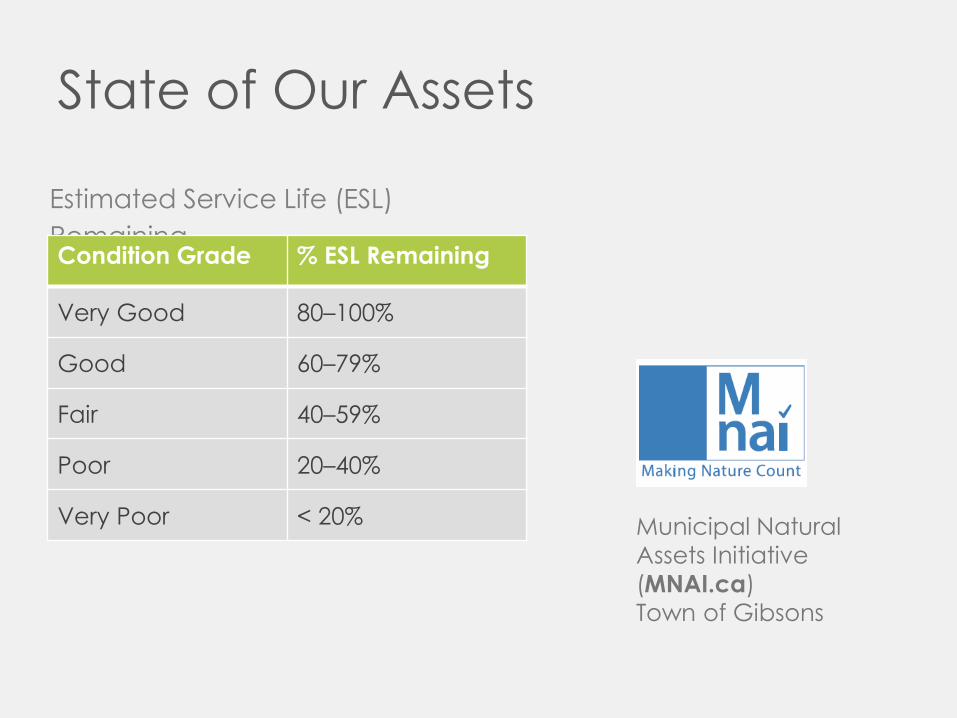
State of Our Assets
Estimated Service Life (ESL)
RemainingCondition Grade % ESL Remaining
Very Good 80–100%
Good 60–79%
Fair 40–59%
Poor 20–40%
Very Poor < 20% Municipal Natural
Assets Initiative
(MNAI.ca)
Town of Gibsons
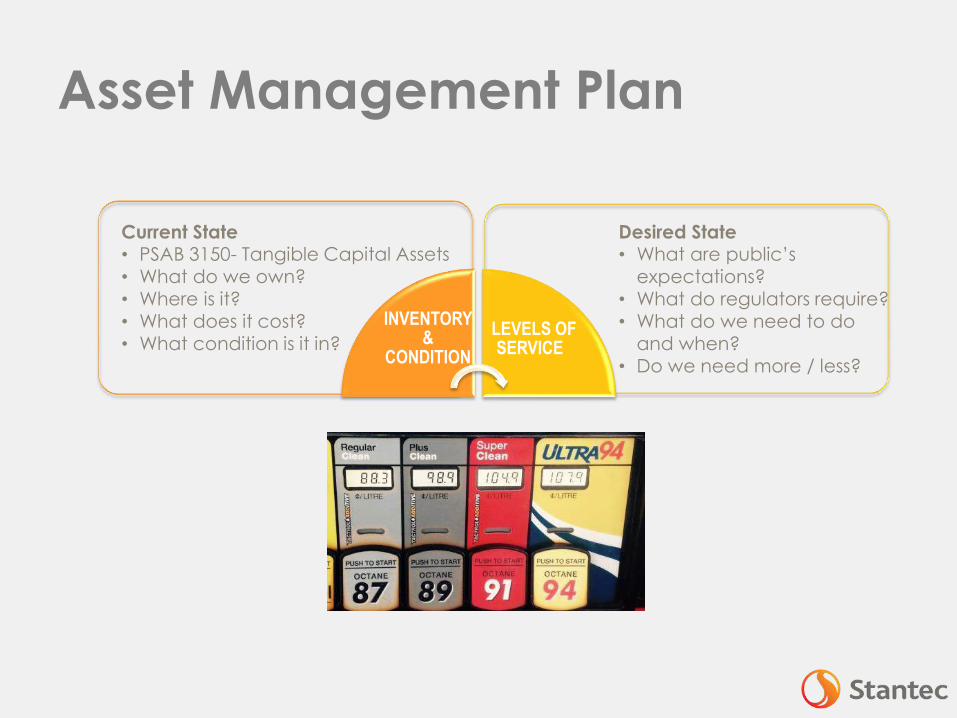
Asset Management Plan
INVENTORY &
CONDITION
LEVELS OF SERVICE
Desired State• What are public’s
expectations?• What do regulators require?• What do we need to do
and when?• Do we need more / less?
Current State• PSAB 3150- Tangible Capital Assets • What do we own?• Where is it? • What does it cost? • What condition is it in?
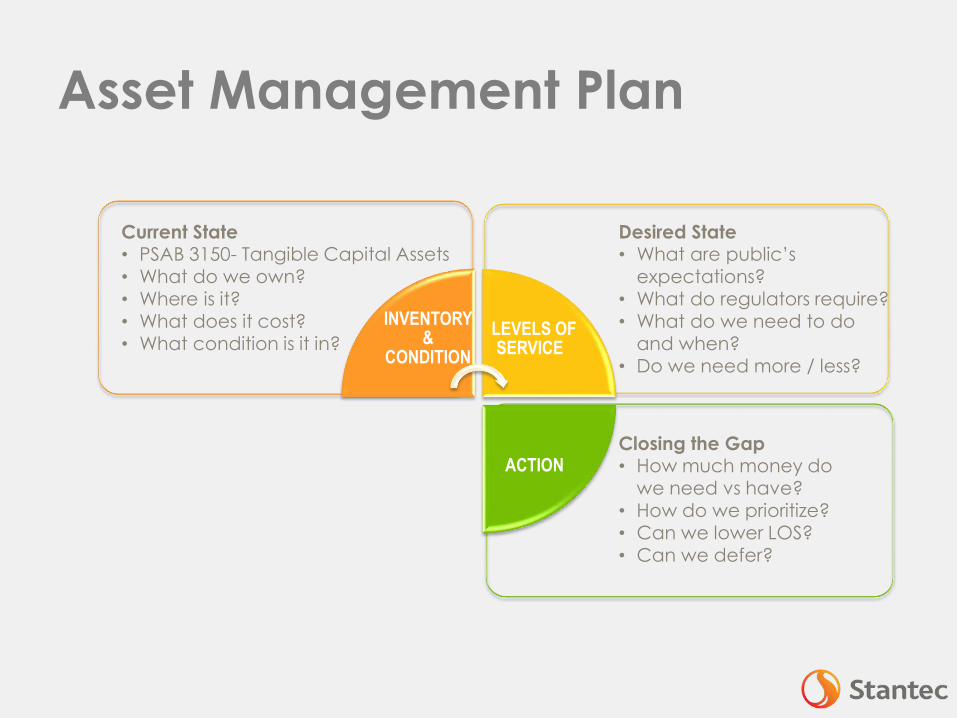
Asset Management Plan
INVENTORY &
CONDITION
LEVELS OF SERVICE
ACTIONClosing the Gap• How much money do
we need vs have?• How do we prioritize?• Can we lower LOS?• Can we defer?
Desired State• What are public’s
expectations?• What do regulators require?• What do we need to do
and when?• Do we need more / less?
Current State• PSAB 3150- Tangible Capital Assets • What do we own?• Where is it? • What does it cost? • What condition is it in?
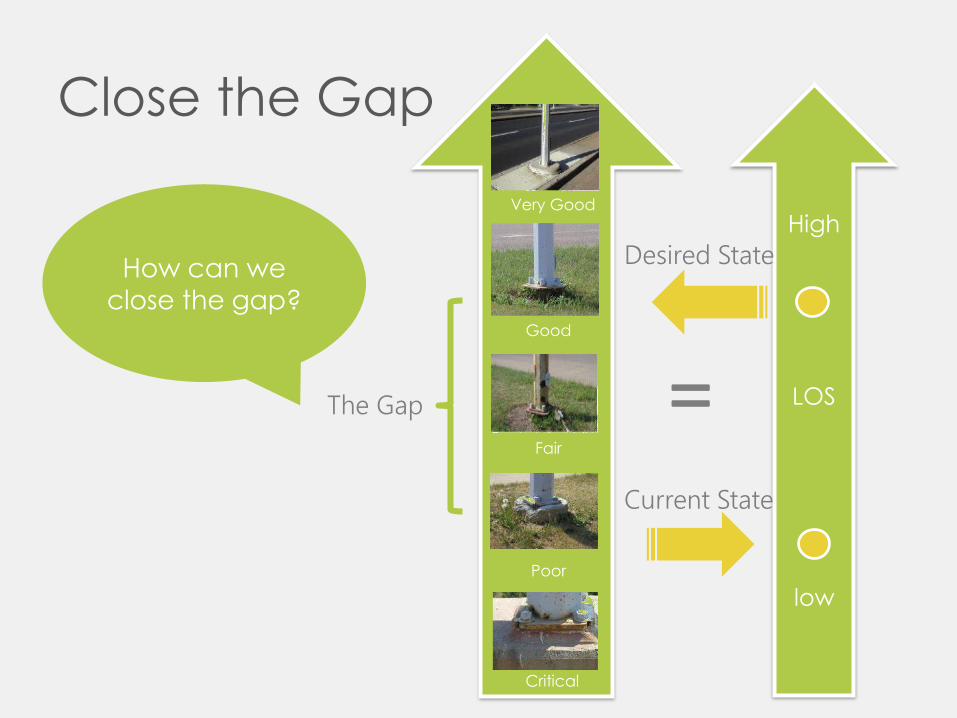
Close the Gap
Very Good
Good
Fair
Poor
Critical
High
LOS
low
=Current State
Desired State
The Gap
How can we
close the gap?
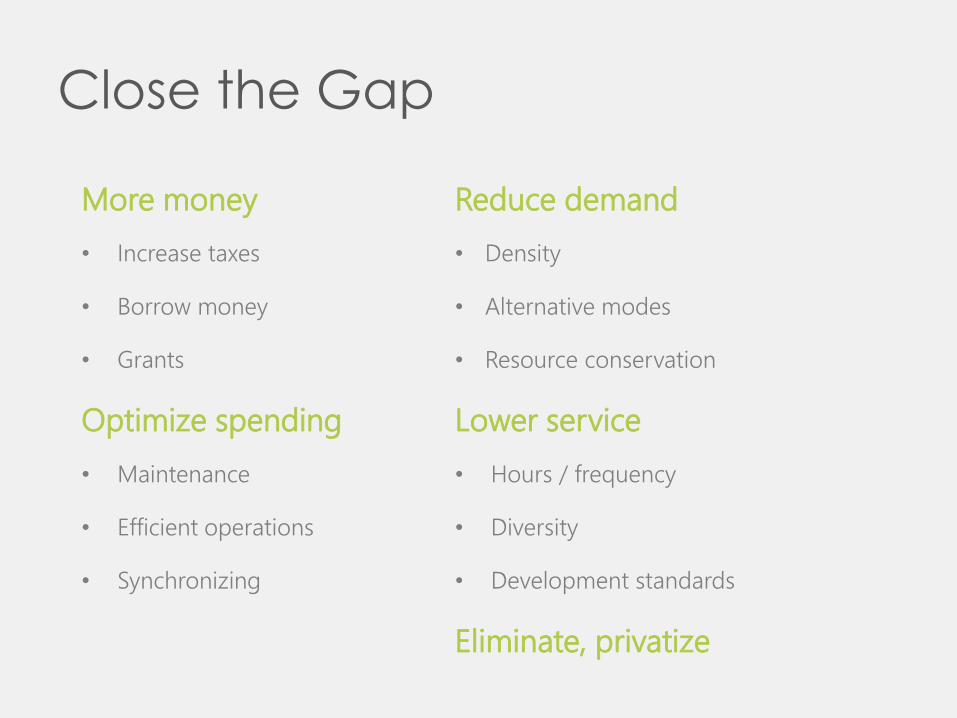
Close the Gap
More money
• Increase taxes
• Borrow money
• Grants
Optimize spending
• Maintenance
• Efficient operations
• Synchronizing
Reduce demand
• Density
• Alternative modes
• Resource conservation
Lower service
• Hours / frequency
• Diversity
• Development standards
Eliminate, privatize
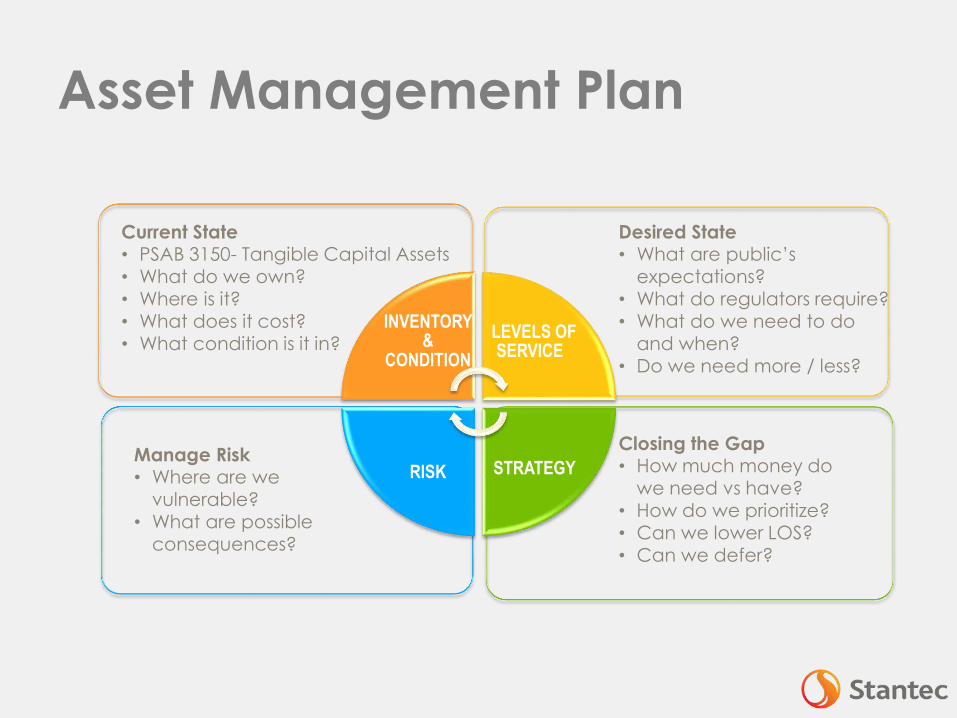
Asset Management Plan
INVENTORY &
CONDITION
LEVELS OF SERVICE
STRATEGYRISK
Closing the Gap• How much money do
we need vs have?• How do we prioritize?• Can we lower LOS?• Can we defer?
Desired State• What are public’s
expectations?• What do regulators require?• What do we need to do
and when?• Do we need more / less?
Current State• PSAB 3150- Tangible Capital Assets • What do we own?• Where is it? • What does it cost? • What condition is it in?
Manage Risk• Where are we
vulnerable?• What are possible
consequences?
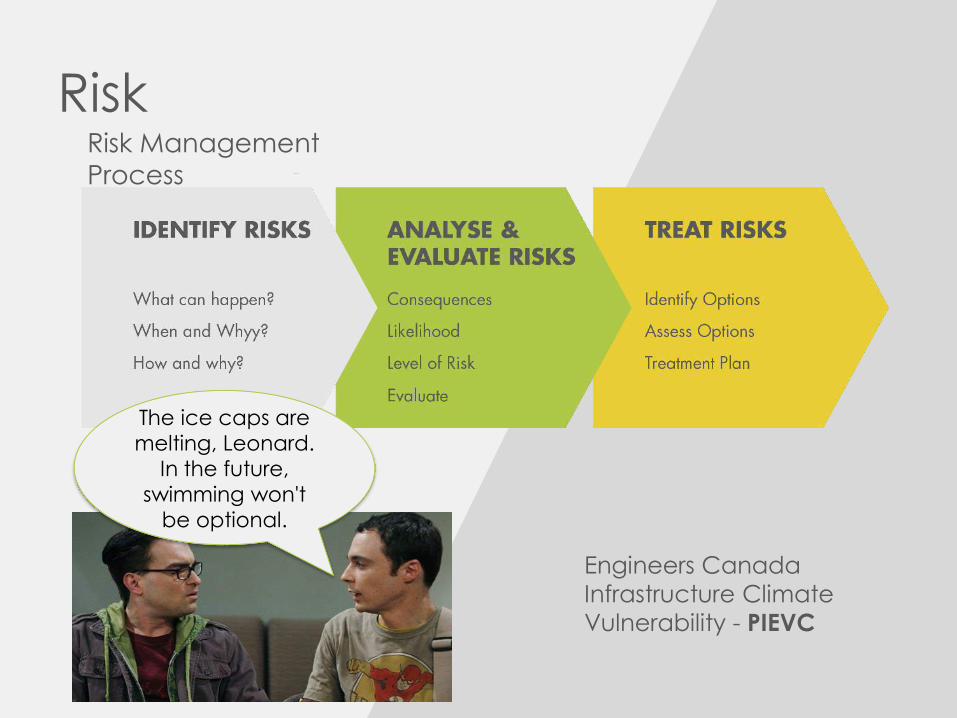
RiskRisk Management
Process
The ice caps are
melting, Leonard.
In the future,
swimming won't
be optional.
Engineers Canada
Infrastructure Climate
Vulnerability - PIEVC
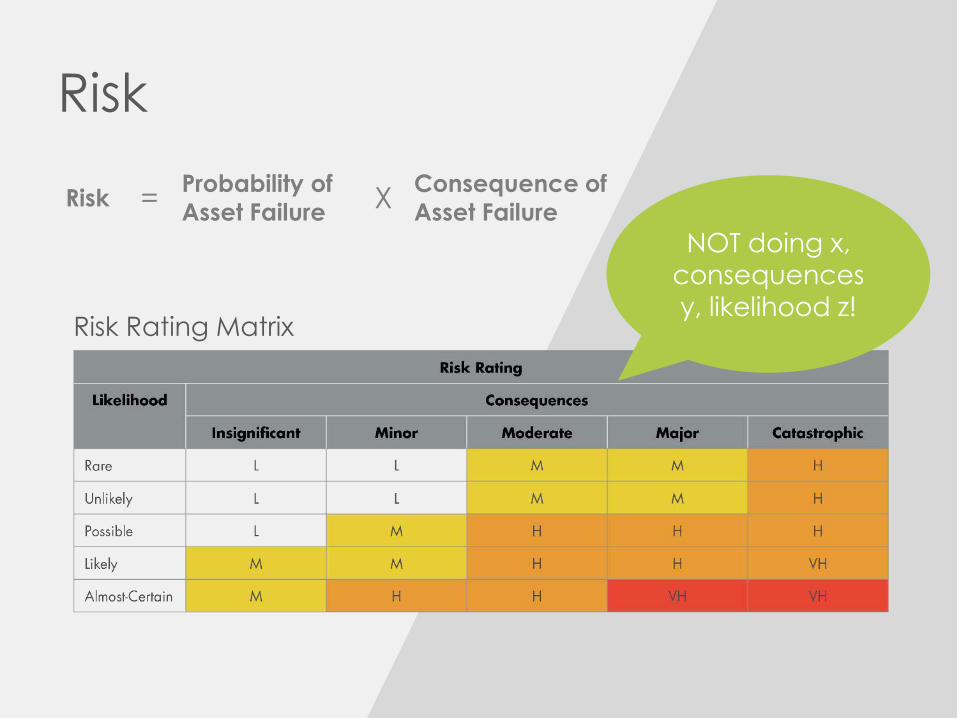
Risk
RiskProbability of
Asset Failure
Consequence of
Asset FailureX=
Risk Rating Matrix
NOT doing x,
consequences y, likelihood z!

TAKING THE PLUNGE
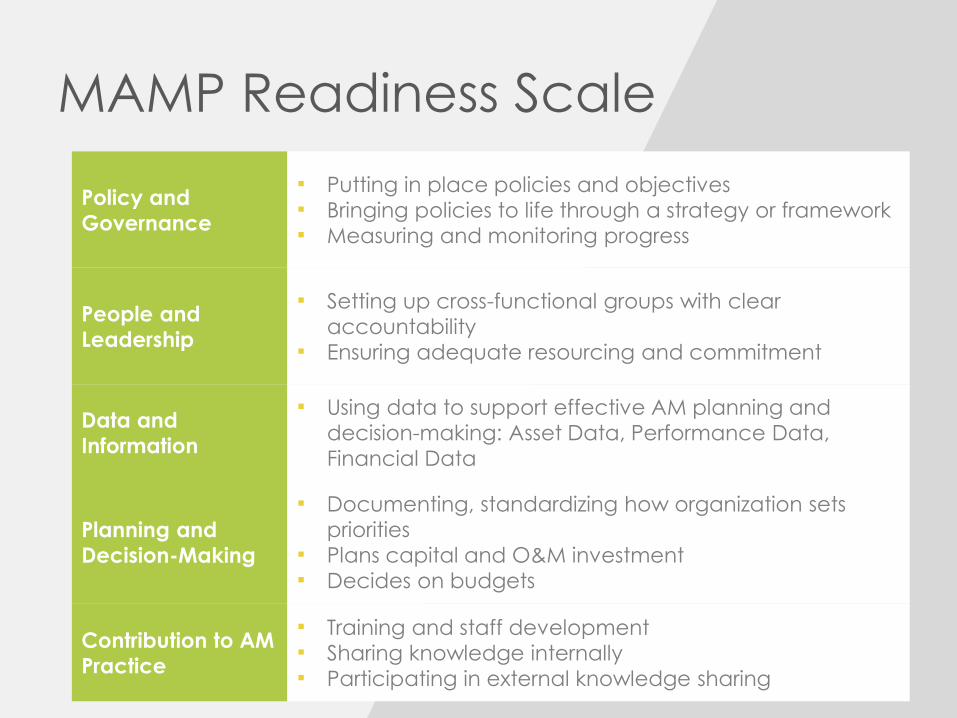
MAMP Readiness Scale
Policy and
Governance
Putting in place policies and objectives Bringing policies to life through a strategy or framework Measuring and monitoring progress
People and
Leadership
Setting up cross-functional groups with clear
accountability Ensuring adequate resourcing and commitment
Data and
Information
Using data to support effective AM planning and
decision-making: Asset Data, Performance Data,
Financial Data
Planning and
Decision-Making
Documenting, standardizing how organization sets
priorities Plans capital and O&M investment Decides on budgets
Contribution to AM
Practice
Training and staff development Sharing knowledge internally Participating in external knowledge sharing
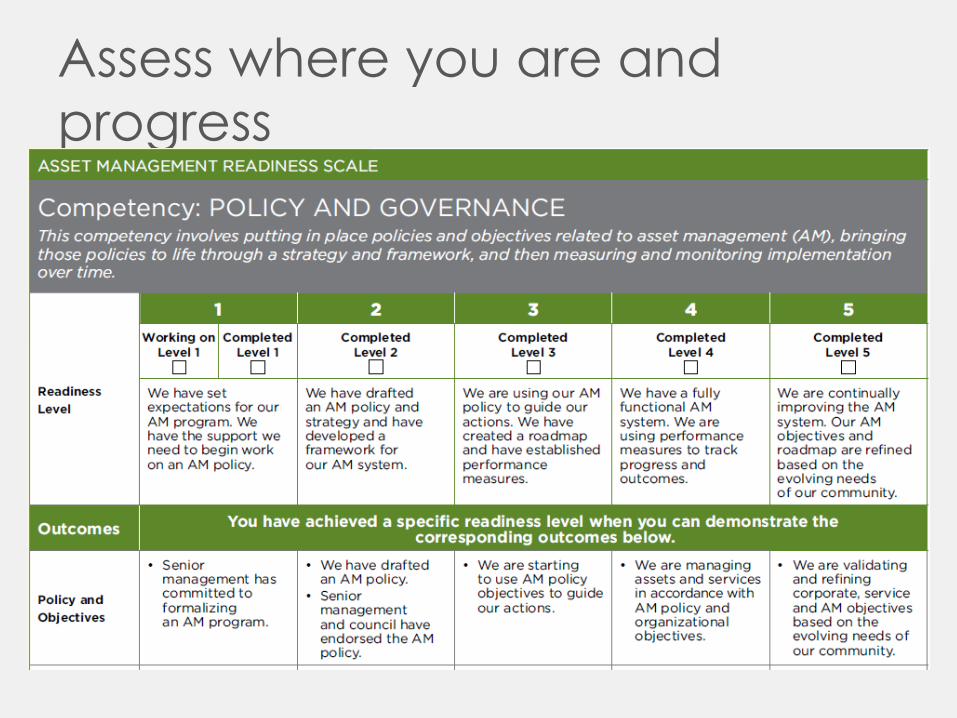
Assess where you are and
progress
Complete Self Assessment
Share & identify 3
personal action items...
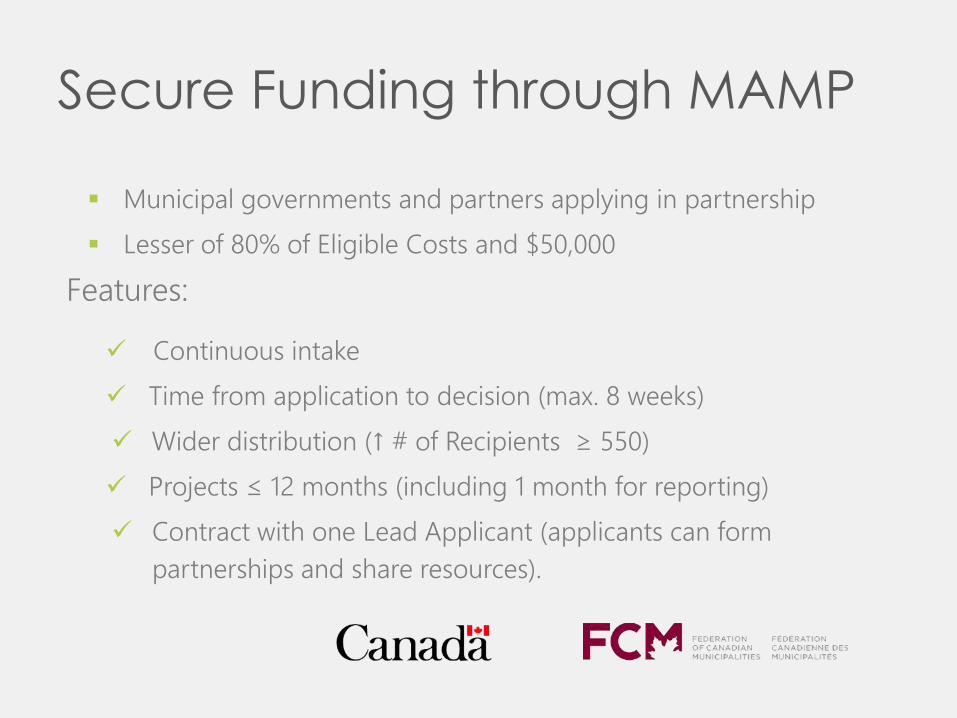
Secure Funding through MAMP
Municipal governments and partners applying in partnership
Lesser of 80% of Eligible Costs and $50,000
Features:
Continuous intake
Time from application to decision (max. 8 weeks)
Wider distribution (↑ # of Recipients ≥ 550)
Projects ≤ 12 months (including 1 month for reporting)
Contract with one Lead Applicant (applicants can form
partnerships and share resources).
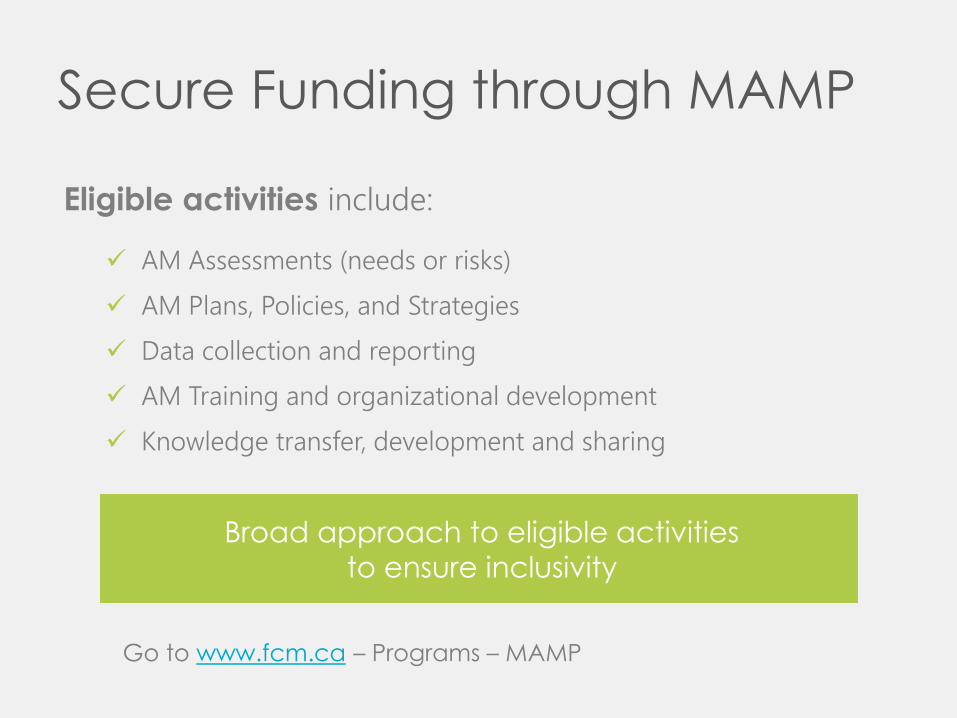
Secure Funding through MAMP
Eligible activities include:
AM Assessments (needs or risks)
AM Plans, Policies, and Strategies
Data collection and reporting
AM Training and organizational development
Knowledge transfer, development and sharing
Broad approach to eligible activities
to ensure inclusivity
Go to www.fcm.ca – Programs – MAMP
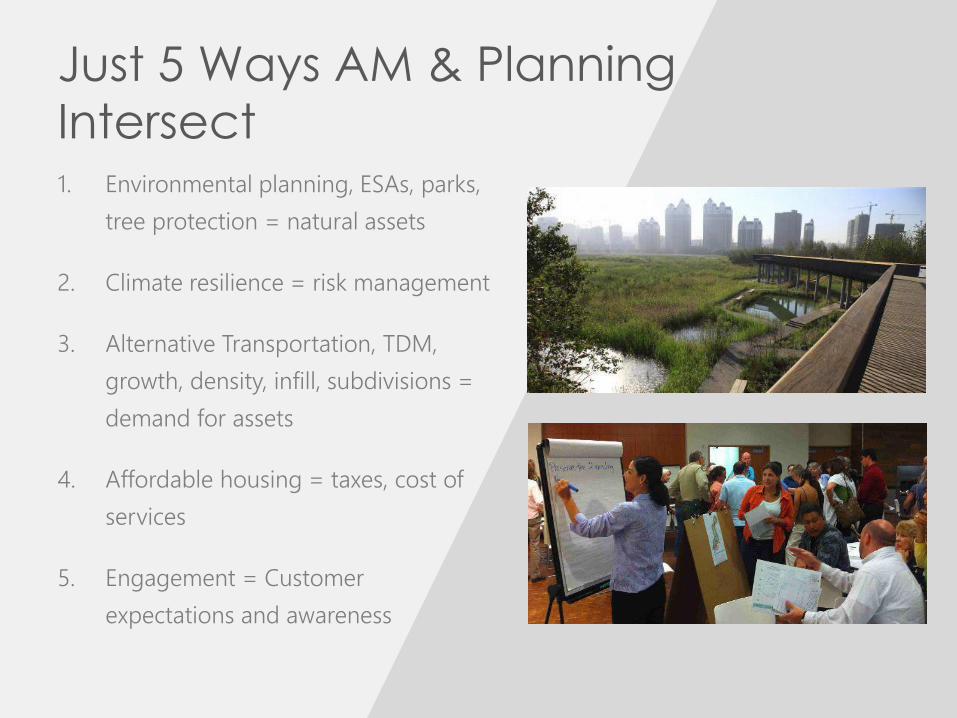
Just 5 Ways AM & Planning
Intersect1. Environmental planning, ESAs, parks,
tree protection = natural assets
2. Climate resilience = risk management
3. Alternative Transportation, TDM,
growth, density, infill, subdivisions =
demand for assets
4. Affordable housing = taxes, cost of
services
5. Engagement = Customer
expectations and awareness