
Assessing Pupils' Progresswsassets.s3.amazonaws.com/ws/nso/pdf/b54f7d43fb279fe...tracks? Justify...
21
The Coalition Government took office on 11 May 2010. This publication was published prior to that date and may not reflect current government policy. You may choose to use these materials, however you should also consult the Department for Education website www.education.gov.uk for updated policy and resources. Assessing Pupils' Progress Focused assessment materials: Level 7
Transcript of Assessing Pupils' Progresswsassets.s3.amazonaws.com/ws/nso/pdf/b54f7d43fb279fe...tracks? Justify...

The Coalition Government took office on 11 May 2010. This publication was published prior to that date and may not reflect current government policy. You may choose to use these materials, however you should also consult the Department for Education website www.education.gov.uk for updated policy and resources.
Assessing Pupils' Progress Focused assessment materials: Level 7

Assessing Pupils' ProgressFocused assessment materials: Level 7


Assessing Pupils' Progress
Focused assessment materials: Level 7
First published in 2009
Ref: 00356-2009BKT-EN

Disclaimer
The Department for Children, Schools and Families wishes to make it clear that the Department and its agents accept no responsibility for the actual content of any materials suggested as information sources in this publication, whether these are in the form of printed publications or on a website.
In these materials icons, logos, software products and websites are used for contextual and practical reasons. Their use should not be interpreted as an endorsement of particular companies or their products.
The websites referred to in these materials existed at the time of going to print.
Please check all website references carefully to see if they have changed and substitute other references where appropriate.
DSI
CO
LOU
RWO
RKS
03-2
009

1The National Strategies | Secondary Focused assessment materials: Level 7
© Crown copyright 2009 00356-2009BKT-EN
ContentsNumbers and the number system 3
Calculating 4
Algebra 7
Shape, space and measures 9
Handling data 12

2 The National Strategies | Secondary Focused assessment materials: Level 7
00356-2009BKT-EN © Crown copyright 2009
AcknowledgementThe National Strategies are grateful for the many contributions from teachers, consultants and students that helped to make these materials possible. Particular thanks are due to colleagues from Gloucestershire Local Authority for their contributions.

3The National Strategies | Secondary Focused assessment materials: Level 7
© Crown copyright 2009 00356-2009BKT-EN
These materials are based on the APP assessment criteria and organised in the National Curriculum levels. There is a set for each of levels 4 to 8.
The focused assessment materials include for each assessment criterion:
Examples of what pupils should know and be able to do• so teachers have a feel for how difficult the mathematics is intended to be. These are not activities or examples that will enable an accurate assessment of work at this level. To do this, you need a broad range of evidence drawn from day-to-day teaching over a period of time; this is exemplified in the Standards files, which are provided as part of the overall APP resources.
Some • probing questions for teacher to use with pupils in lessons to initiate dialogue to help secure their assessment judgement.
Numbers and the number system
Examples of what pupils should know and be able to do Probing questions
Understand and use proportionality
Sets A, B and C are in direct proportion.
Set A Set B Set C
5 11
5
3 2.4
7
1.1
17.6
10.5
Is there sufficient information to find all the missing entries?•What is the maximum number of items which could be entered •and the task remain impossible?
What is the minimum number of entries needed and what is •important about their location?
For any one empty cell – what is the best starting point? How •many different starting points are there?
Is a 50% increase followed by a 50% increase the same as doubling? Explain your answer.
Which is better? A 70% discount or a 50% discount and a further 20% special offer discount?
A shop is offering a 10% discount. Is it better to have this before or after VAT is added at 15%?
Which is the better deal? Buy one get one half-price or three for the price of two?
How do you go about finding the missing numbers in this table?
Miles Kilometres
5 8
? 20
36 ?
Can you do it in a different way? What do you look for in deciding the most efficient way to find the missing numbers?
How do you go about checking whether given sets of numbers are in direct proportion?
What hints would you give someone to help them solve word problems involving proportionality?
Talk me through the reasoning that took you to this answer. How did you think this through?

4 The National Strategies | Secondary Focused assessment materials: Level 7
00356-2009BKT-EN © Crown copyright 2009
Calculating
Examples of what pupils should know and be able to do
Probing questions
Calculate the result of any proportional change using multiplicative methods
The new model of an MP3 player holds 1⁄6 more music than the previous model. The previous model holds 5000 tracks. How many tracks does the new model hold?
The previous model cost £119.99 and the new model costs £144.99. Is this less than or greater than the proportional change to the number of tracks? Justify your answer.
After one year a scooter has depreciated by 1⁄7 and is valued at £996. What was its value at the beginning of the year?
Weekend restaurant waiting staff get a 4% increase. The new hourly rate is £6.50. What was it before the increase?
My friend has savings of £957.65 after 7% interest has been added. What was the original amount of her savings before the interest was added?
Use a multiplicative method such as:
Original Result Multiplier
100% 107% × 100⁄107
? £957.65 × 100⁄107
How do you go about finding a multiplier to increase by a given fraction (percentage)? What if it was a fractional (percentage) decrease?
Why is it important to identify ‘the whole’ when working with problems involving proportional change?
How do you go about finding a multiplier to calculate an original value after a proportional increase/decrease?
Given a multiplier how can you tell whether this would result in an increase or a decrease?

5The National Strategies | Secondary Focused assessment materials: Level 7
© Crown copyright 2009 00356-2009BKT-EN
Understand the effects of multiplying and dividing by numbers between 0 and 1
Give an approximate answer to:
357 ÷ 0.3
1099 ÷ 0.22
1476 x 0.99
57.7 ÷ 0.65
Know and understand that division by zero has no meaning. For example, explore dividing by successively smaller positive decimals approaching zero, then by negative decimals approaching zero.
Recognise and use reciprocals.
‘Multiplying makes numbers bigger.’ When is this statement true and when is it false?
‘Division makes things smaller.’ When is this statement true and when is it false?
How would you justify the idea that dividing by 1⁄2 is the same as multiplying by 2? What about dividing by 1⁄3 and multiplying by 3? What about dividing by 2⁄3 and multiplying by 3⁄2 ? How does this link to division of fractions?
0.8 ÷ 0.11.
16 × 0.52.
1.6 ÷ 0.53.
1.6 ÷ 0.2 4.
Talk me through the reasoning that took you to the answer to each of these calculations.
Add, subtract, multiply and divide fractions
Find the area and perimeter of a rectangle measuring 4 3
4
25
383
78
14 inches by 6
34
25
383
78
14
inches.
Using 22⁄7 as an approximation for π, estimate the area of a circle with diameter 28mm.
Pupils should be able to understand and use efficient methods to add, subtract, multiply and divide fractions, including mixed numbers and questions that involve more than one operation.
How do you go about adding and subtracting more complex fractions, e.g. 2
34
25
383
78
14
– 1
34
25
383
78
14
?
Give me two fractions which multiply together to give a bigger answer than either of the fractions you are multiplying. How did you do it?
Give pupils some examples of +, –, × and ÷ with common mistakes in them (including mixed numbers). Ask them to talk you through the mistakes and how they would correct them.
How would you justify that dividing by 1⁄2 is the same as multiplying by 2? What about dividing by 1⁄3 and multiplying by 3? What about dividing by 2⁄3 and multiplying by 3⁄2 ? How does this link to what you know about dividing by a number between 0 and 1?

6 The National Strategies | Secondary Focused assessment materials: Level 7
00356-2009BKT-EN © Crown copyright 2009
Make and justify estimates and approximations of calculations; estimate calculations by rounding numbers to one significant figure and multiplying and dividing mentally
Estimate answers to:
5.16 × 3.14
0.0721 × 0.036
(186.3 × 88.6) / (27.2 × 22.8)
Talk me through the steps you would take to find an estimate for the answer to this calculation.
Would you expect your estimated answer to be greater or less than the exact answer? How can you tell? Can you make up an example for which it would be difficult to decide?
Show me examples of multiplication and division calculations using decimals, with answers that are approximate to 60.
Why is 6 ÷ 2 a better approximation for 6.59 ÷ 2.47 than 7 ÷ 2?
Why is it useful to be able to estimate the answer to complex calculations?
Use a calculator efficiently and appropriately to perform complex calculations with numbers of any size, knowing not to round during intermediate steps of a calculation
Use a calculator to evaluate more complex calculations such as those with nested brackets or where the memory function could be used.
For example:
Use a calculator to work out:•45.65 × 76.8
1.05 × (6.4 – 3.8)
5 x (4.5 + 6 )3
22
1.
4.6 + (5.7 – (11.6 × 9.1)) 2.
{(4.5)3. 2 + (7.5 – 0.46)}2
4.
45.65 × 76.81.05 × (6.4 – 3.8)
5 x (4.5 + 6 )3
22
How do you decide on the order of operations for a complex calculation when using a calculator?
Which calculator keys and functions are important when doing complex calculations? (Explore brackets, memories, +/– key, reciprocal key.)
Give pupils some calculations with answers (some correct but some with common mistakes) and ask them to decide which are correct. Ask them to analyse the mistakes in the ones that are incorrect and explain the correct method using a calculator.
Why shouldn’t you round during the intermediate steps of calculations?

7The National Strategies | Secondary Focused assessment materials: Level 7
© Crown copyright 2009 00356-2009BKT-EN
Algebra
Examples of what pupils should know and be able to do
Probing questions
Square a linear expression, and expand and simplify the product of two linear expressions of the form (x ± n) and simplify the corresponding quadratic expression
Multiply out these brackets and simplify the result:
(x + 4)(x – 3)
(a + b)2
(p – q)2
(3x + 2)2
(a + b)(a – b)
What is special about the two linear expressions that, when expanded, have:
a positive • x coefficient?
a negative • x coefficient?
no • x coefficient?
How did you multiply out the brackets?
Show me an expression in the form (x + a)(x + b) which when expanded has:
(i) the x coefficient equal to the constant term
(ii) the x coefficient greater than the constant term.
What does the sign of the constant term tell you about the original expression?
Use algebraic and graphical methods to solve simultaneous linear equations in two variables
Given that x and y satisfy the equation 5x + y = 49 and y= 2x, find the value of x and y using an algebraic method.
Solve these simultaneous equations using an algebraic method: 3a + 2b = 16, 5a – b = 18
Solve graphically the simultaneous equations:
x + 3y = 11 and 5x – 2y = 4
What methods do you use when solving a pair of simultaneous linear equations? What helps you to decide which method to use? Why might you use more than one method? Talk me through a couple of examples with your reasons for your chosen method.
Is it possible for a pair of simultaneous equations to have two different pairs of solutions or to have no solution? How do you know?
How does a graphical representation help you to know more about the number of solutions?
Solve inequalities in one variable and represent the solution set on a number line
An integer n satisfies –8 < 2n ≤ 10. List all possible values of n.
Solve these inequalities marking the solution set on a number line.
3• n + 4 < 17 and n > 2
2(• x – 5) ≤ 0 and x > –2
How do you go about finding the solution set for an inequality?
What are the important conventions when representing the solution set on a number line?
Why does the inequality sign change when you multiply or divide the inequality by a negative number?
8 The National Strategies | Secondary Focused assessment materials: Level 7
00356-2009BKT-EN © Crown copyright 2009
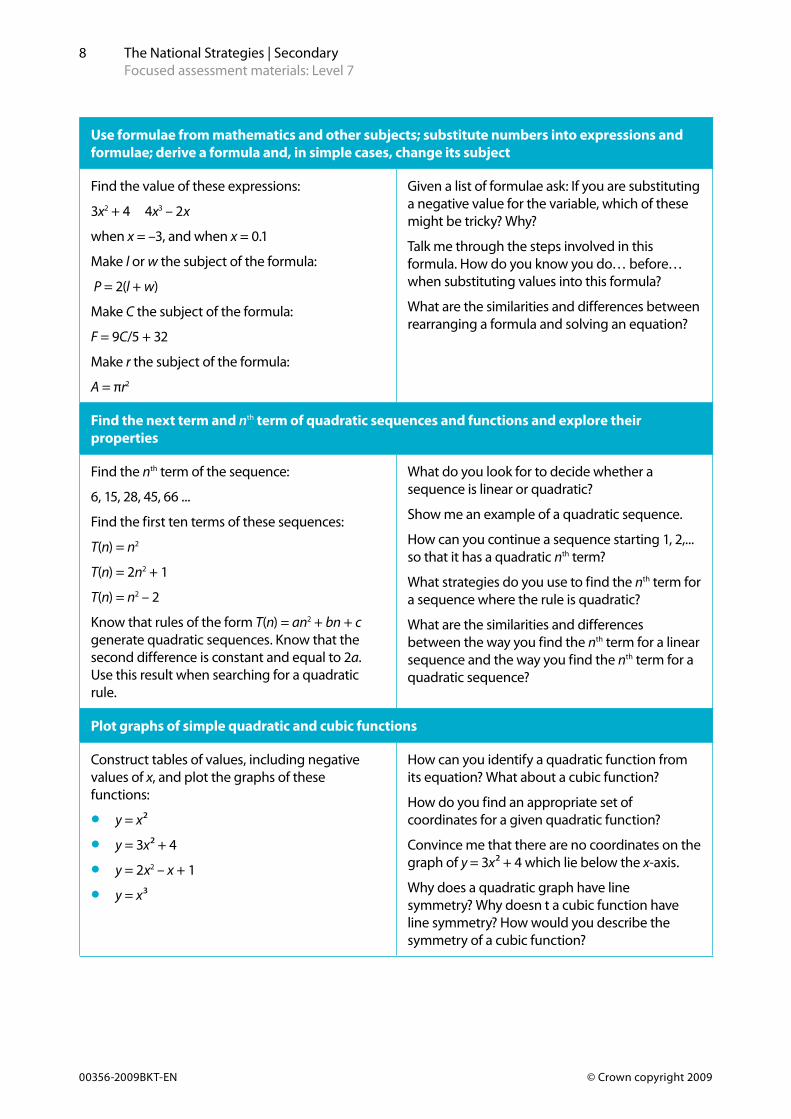
Use formulae from mathematics and other subjects; substitute numbers into expressions and formulae; derive a formula and, in simple cases, change its subject
Find the value of these expressions:
3x2 + 4 4x3 – 2x
when x = –3, and when x = 0.1
Make l or w the subject of the formula:
P = 2(l + w)
Make C the subject of the formula:
F = 9C/5 + 32
Make r the subject of the formula:
A = πr2
Given a list of formulae ask: If you are substituting a negative value for the variable, which of these might be tricky? Why?
Talk me through the steps involved in this formula. How do you know you do… before… when substituting values into this formula?
What are the similarities and differences between rearranging a formula and solving an equation?
Find the next term and nth term of quadratic sequences and functions and explore their properties
Find the nth term of the sequence:
6, 15, 28, 45, 66 ...
Find the first ten terms of these sequences:
T(n) = n2
T(n) = 2n2 + 1
T(n) = n2 – 2
Know that rules of the form T(n) = an2 + bn + c generate quadratic sequences. Know that the second difference is constant and equal to 2a. Use this result when searching for a quadratic rule.
What do you look for to decide whether a sequence is linear or quadratic?
Show me an example of a quadratic sequence.
How can you continue a sequence starting 1, 2,... so that it has a quadratic nth term?
What strategies do you use to find the nth term for a sequence where the rule is quadratic?
What are the similarities and differences between the way you find the nth term for a linear sequence and the way you find the nth term for a quadratic sequence?
Plot graphs of simple quadratic and cubic functions
Construct tables of values, including negative values of x, and plot the graphs of these functions:
y• = x²
y• = 3x² + 4
y• = 2x2 – x + 1
y• = x³
How can you identify a quadratic function from its equation? What about a cubic function?
How do you find an appropriate set of coordinates for a given quadratic function?
Convince me that there are no coordinates on the graph of y = 3x² + 4 which lie below the x-axis.
Why does a quadratic graph have line symmetry? Why doesn’t a cubic function have line symmetry? How would you describe the symmetry of a cubic function?

9The National Strategies | Secondary Focused assessment materials: Level 7
© Crown copyright 2009 00356-2009BKT-EN
Shape, space and measures
Examples of what pupils should know and be able to do
Probing questions
Understand and apply Pythagoras’ theorem when solving problems in 2-D
Know that Pythagoras’ theorem only holds for triangles that are right-angled.
Identify a right-angled triangle in a problem.
Find a missing side in a right-angled triangle, e.g. use Pythagoras’ theorem to solve simple problems in two dimensions, such as:
A 5m ladder leans against a wall with its foot •1.5m away from the wall. How far up the wall does the ladder reach?
You walk due north for 5 miles, then due east •for 3 miles. What is the shortest distance you are from your starting point?
Identify triangles that must be right-angled from their side lengths.
How do you identify the hypotenuse when solving a problem using Pythagoras’ theorem?
What do you look for in a problem to decide whether it can be solved using Pythagoras’ theorem?
Talk me through how you went about drawing and labelling this triangle for this problem.
How can you use Pythagoras’ theorem to tell whether an angle in a triangle is equal to, greater than or less than 90 degrees?
What is the same/different about a right-angled triangle with sides 5cm, 12cm and an unknown hypotenuse, and a right-angled triangle with sides 5cm, 12cm and an unknown shorter side?
Calculate lengths, areas and volumes in plane shapes and right prisms
The cross section of a skirting board is the shape of a rectangle, with a quadrant (quarter circle) on the top. The skirting board is 1.5cm thick and 6.5cm high. Lengths totalling 120m are ordered. What volume of wood is contained in the order?
Talk me through the steps you took when finding the surface area of this right prism.
If you know the height and volume of a right prism, what else do you know? What don’t you know?
How many different square-based right prisms have a height of 10cm and a volume of 160cm3? Why?
What do you need to know to be able to find both the volume and surface area of a cylinder?

10 The National Strategies | Secondary Focused assessment materials: Level 7
00356-2009BKT-EN © Crown copyright 2009
Enlarge 2-D shapes, given a centre of enlargement and a fractional scale factor, on paper and using ICT; recognise the similarity of the resulting shapes
Enlarge a simple shape on squared paper by a fractional scale factor, such as 1⁄2 or 1⁄3 , and recognise that the ratio of any two corresponding sides is equal to the scale factor.
Use dynamic geometry software to explore enlargements, e.g. changing the scale factor or the centre of enlargement.
Investigate the standard paper sizes A1, A2, A3, exploring the ratio of the sides of any A-sized paper and the scale factors between different A-sized papers.
Given an object and its enlargement what can you say about the scale factor? How would you recognise that the scale factor is a fraction between 0 and 1?
How would you go about finding the centre of enlargement and the scale factor for two similar shapes?
How does the position of the centre of enlargement (e.g. inside, on a vertex, on a side, or outside the original shape) affect the image? How is this different if the scale factor is between 0 and 1?
Find the locus of a point that moves according to a given rule, both by reasoning and using ICT
Visualise the result of spinning 2-D shapes in 3-D around a line that is along a line of symmetry of the shape.
Trace the path of a vertex of a square as it is rolled along a straight line.
Visualise simple paths such as that generated by walking so that you are equidistant from two trees.
Find the locus of:
points equidistant from two points •points equidistant from a line •points equidistant from a point•the centre of circles which have two given •lines as tangents.
How can you tell for a given locus whether it is the path of points equidistant from another point or a line?
What is the same/different about the path traced out by the centre of a circle being rolled along a straight line and the centre of a square being rolled along a straight line?

11The National Strategies | Secondary Focused assessment materials: Level 7
© Crown copyright 2009 00356-2009BKT-EN
Recognise that measurements given to the nearest whole unit may be inaccurate by up to one half of the unit in either direction
Suggest a range for measurements such as:
123mm; 1860mm; 3.54kg; 6800m.
Find maximum and minimum values for a measurement that has been rounded to a given degree of accuracy.
Solve problems such as:
The dimensions of a rectangular floor, •measured to the nearest metre, are given as 28m by 16m. What range must the area of the floor lie within? Suggest a sensible answer for the area, given the degree of accuracy of the data.
Explain the difference in meaning between 0.6m and 0.600m. When is it necessary to include the zeros in measurements?
What range of measured lengths might be represented by the measurement 320cm?
What accuracy is needed to be sure a measurement is accurate to the nearest centimetre?
Why might you pick a runner whose time for running 100m is recorded as 13.3 seconds rather than 13.30 seconds? Why might you not?
Explain how six people each weighing 110kg might exceed a weight limit of 660kg for a lift.
Understand and use measures of speed (and other compound measures such as density or pressure) to solve problems
Use examples of compound measures in science, geography and PE.
Understand that:
Rate is a way of comparing how one quantity •changes with another, e.g. a car’s fuel consumption measured in miles per gallon.
The two quantities are usually measured in •different units, and ‘per’, the abbreviation ‘p’ or an oblique ‘/’ can be used to mean ‘for every’ or ‘in every’.
Solve problems such as:
The distance from London to Leeds is 190 •miles. An intercity train takes about 23
4
25
383
78
14 hours
to travel from London to Leeds. What is its average speed?
Make up some easy questions that involve calculating speed, distance or time (density, mass and volume). Make up some difficult questions. What makes them difficult?
Talk me through the reasoning of why travelling a distance of 30 miles in 45 minutes is an average of 40mph.
How do the units of speed (density, pressure) help you to solve problems?
How does the information in a question help you to decide on the units for speed (density, pressure)?

12 The National Strategies | Secondary Focused assessment materials: Level 7
00356-2009BKT-EN © Crown copyright 2009
Handling data
Examples of what pupils should know and be able to do
Probing questions
Suggest a problem to explore using statistical methods, frame questions and raise conjectures; identify possible sources of bias and plan how to minimise it
Decide on questions to explore in a given context and raise conjectures, e.g. in PSHE questions posed might be:
How available are fair trade goods in local •shops?
Who buys fair trade goods?•A conjecture might be:
People with experience or links with a Less •Economically Developed Country (LEDC) are more likely to be aware of and to buy fair trade goods.
Be aware of bias and have strategies to reduce bias, e.g. due to selection, non-response or timing.
What convinced you that this question could usefully be explored using statistical methods?
Convince me that it is valid to explore this situation/hypothesis.
How can you tell if data is biased? Can you give any examples of where data may be biased?
How would you go about reducing bias? Are there any general guidelines for checking for bias?
'Data is biased.' Is this statement always, never or sometimes true?
Select, construct and modify, on paper and using ICT, suitable graphical representation to progress an enquiry, including frequency polygons and lines of best fit on scatter graphs
Use superimposed frequency polygons to compare results.
When plotting a line of best fit, find the mean point and make predictions using a line of best fit.
Recognise that a prediction based on a line of best fit may be subject to error.
Recognise the potential problems of extending the line of best fit beyond the range of known values.
How does your graph help with your statistical analysis? What does it show? What are the benefits and any disadvantages of your chosen graph? Did you try any graphs that were not helpful? If so, why were they not helpful?
Convince me that this is the most appropriate graph to use in this case.
How do you go about labelling the horizontal axis when constructing a frequency polygon?
How can you tell if it is sensible to draw a line of best fit on a scatter graph?

13The National Strategies | Secondary Focused assessment materials: Level 7
© Crown copyright 2009 00356-2009BKT-EN
Estimate the mean, median and range of a set of grouped data and determine the modal class, selecting the statistic most appropriate to the line of enquiry
Estimate the median and range from a grouped frequency table.
Calculate an estimate of the mean from a large set of grouped data.
Appreciate a distinction between ‘estimating the mean of...’ and ‘calculating an estimate of the mean of...’.
Produce sets of grouped data with:
an estimated range of 351.
an estimated median of 22.52.
an estimated median of 22.5 and an 3. estimated range of 35
an estimated mean of 7.4 (to one decimal 4. place).
Why is it only possible to estimate the mean (median, range) from grouped data?
Why is the mid-point of the class interval used to calculate an estimated mean? Why not the end of the class interval?
Talk me through the steps you take to estimate the median from grouped data.
Why is it important to use the lowest class value for the first class and the highest class value for the last class to estimate range? Why not the mid-point?
Can you construct a spreadsheet of grouped data to calculate an estimated mean?
When is the estimated mean not the most appropriate average, i.e. when is it not a representative value?
Compare two or more distributions and make inferences, using the shape of the distributions and measures of average and range
Use frequency diagrams to compare two distributions. Calculate the mean, median and mode for the same data. Use the shape of the distribution and measures of mean and range to, e.g.:
compare athletic performances such as long •jump in Year 7 and Year 9 pupils
compare the ages of the populations of the •UK and Brazil.
Make some statements from the shape of this distribution.
What are the key similarities and differences between these two distributions?
How would you decide whether to, e.g., buy ‘brand A’ instead of ‘brand B’?
Understand relative frequency as an estimate of probability and use this to compare outcomes of an experiment
Recognise that increasing the number of trials results in experimental probability tending to a limit, and that this limit may be the only way to estimate probability. Describe situations where the use of experimental data to estimate a probability would be necessary.
What might be different about using theoretical probability to find the probability of obtaining a 6 when you roll a dice, and using experimental probability for the same purpose?
Which of the following statements are true/false?
Experimental probability is more reliable •than theoretical probability.
Experimental probability gets closer to the •true probability as more trials are carried out.
Relative frequency finds the true probability.•

14 The National Strategies | Secondary Focused assessment materials: Level 7
00356-2009BKT-EN © Crown copyright 2009
Examine critically the results of a statistical enquiry, and justify the choice of statistical representation in written presentation
Examine data for cause and effect.
Analyse data and try to explain anomalies. For example: in a study of engine size and acceleration times, observe that in general a larger engine size leads to greater acceleration. However, particular cars do not fit the overall pattern.
Reasons may include because these cars are heavier than average or are built for rough terrain rather than normal roads.
Recognise that establishing a correlation or connection in statistical situations does not necessarily imply that one variable causes change to another (i.e. ‘correlation does not imply causality’) and that there may be external factors affecting both.
Can you think of an example where there is positive correlation, but it is unlikely that there is causation?
Which of the following statements is more precise: ‘My hypothesis is true’ or ‘There is strong evidence to support my hypothesis.’ Why?
Convince me that there is evidence to support your hypothesis.
Why might it not be the case that:
your hypothesis is true if you have found •some evidence to support it
you have failed if your hypothesis appears to •be flawed.
Convince me that you have chosen the most appropriate statistical measure to use in this case. What else did you consider and not use?


This publication is printedon 80% recycled paper
When you have finished withthis publication please recycle it
80%
Audience: Secondary mathematics subject leaders Date of issue: 03-2009 Ref: 00356-2009BKT-EN
Copies of this publication may be available from: www.teachernet.gov.uk/publications
You can download this publication and obtain further information at: www.standards.dcsf.gov.uk
Copies of this publication may be available from: DCSF Publications PO Box 5050 Sherwood Park Annesley Nottingham NG15 ODJ Tel 0845 60 222 60 Fax 0845 60 333 60 Textphone 0845 60 555 60 email: [email protected]
© Crown copyright 2009 Published by the Department for Children, Schools and Families
Extracts from this document may be reproduced for non-commercial research, education or training purposes on the condition that the source is acknowledged as Crown copyright, the publication title is specified, it is reproduced accurately and not used in a misleading context.
The permission to reproduce Crown copyright protected material does not extend to any material in this publication which is identified as being the copyright of a third party.
For any other use please contact [email protected] www.opsi.gov.uk/click-use/index.htm


![NsO Arts] the.kendo.reader.noma.Hisashi tk](https://static.fdocuments.in/doc/165x107/577d35a91a28ab3a6b910d7a/nso-arts-thekendoreadernomahisashi-tk.jpg)