Arc Flash Hazard Analysis - Home - Walter Scott, Jr...
20
Arc Flash Hazard Analysis h Dave Smith d h i f i Industry Sponsor: DohnSimms of Praxis Corp. Faculty Advisor: Dr. George Collins
Transcript of Arc Flash Hazard Analysis - Home - Walter Scott, Jr...

Arc Flash Hazard AnalysishDave Smith
d h i f iIndustry Sponsor: Dohn Simms of Praxis Corp.Faculty Advisor: Dr. George Collins

• Why focus on arc flash hazards?Why focus on arc flash hazards?• Project goals and deliverables
fl h i C• Arc flash in AC systems• Wind farm analysis• Arc flash in DC systems• Challenges specific to Photovoltaic ArraysChallenges specific to Photovoltaic Arrays• Next steps
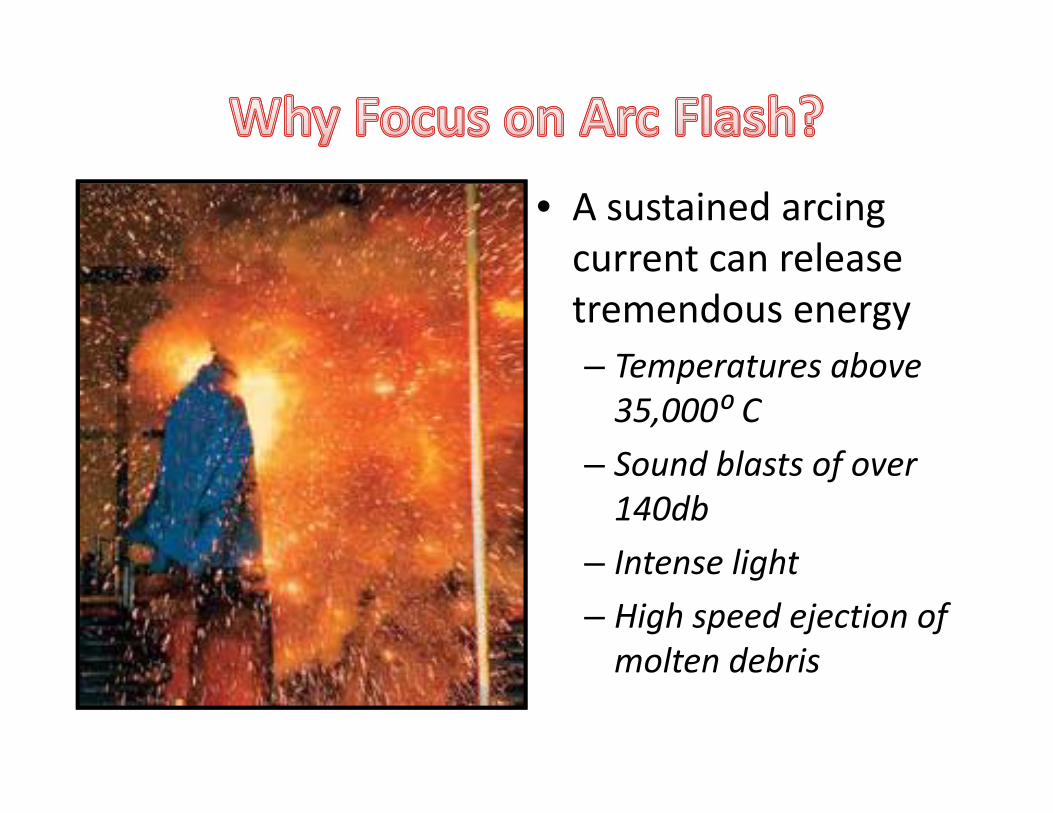
• A sustained arcing current can releasecurrent can release tremendous energy
T b– Temperatures above 35,000⁰ CSo nd blasts of o er– Sound blasts of over 140dbIntense light– Intense light
– High speed ejection of molten debrismolten debris

• Many arcs are started by electricians and lineman a y a cs a e sta ted by e ect c a s a d e aworking on energized systems
• As an electrician, I’m all too familiar with the enormous pressure to do work “live”
• Arc Flash burns make up a significant portion of the 320 deaths and 4000 major injuries due to electrical accidents each year[1]El t i l id t di ti t l f t l• Electrical accidents are disproportionately fatal and costly compared to other occupational injuriesinjuries

• Perform a comparative analysis of existingPerform a comparative analysis of existing methods for predicting arc flash hazards in AC and DC systemsand DC systems
• Investigate the likelihood and severity of Arc Flash hazards on utility scale photovoltaicFlash hazards on utility‐scale photovoltaic arrays
Th fi l d t f th j t i A Fl h– The final product of the project is an Arc Flash Hazard Analysis of Iberdrola Renewables 30MW San Luis facility in Alamosa ColoradoSan Luis facility in Alamosa, Colorado

• Started investigating AC systems Two consensusStarted investigating AC systems. Two consensus standards exist:– Lee’s Method: In his 1982 paper, “The Other ElectricalLee s Method: In his 1982 paper, The Other Electrical Hazard: Arc Blast Burns,” Ralph Lee used the maximum power theorem to predict arc energy[2]
– IEEE 1584 Standard: In 2002, the 1584 working group bli h d th “IEEE G id f P f i A Fl hpublished the “IEEE Guide for Performing Arc‐Flash
Hazard Calculations,” a set of empirically derived equations based on extensive laboratory test data[3]equations based on extensive laboratory test data[3]

• Lee’s Method:Lee reasoned that the sources ofLee reasoned that the sources of short circuit current would be primarily inductive and the arc impedance would be primarily resistive
Hence, maximum possible power transferred to arc would be whentransferred to arc would be when Es2=Ea1, giving :
20max **21
ss IEP
Then, he treated the arc as a spherical radiant heat source:
2 Emax is incident energy in Joules/cm2
Es0 is system voltage (KV)t is arcing time in seconds
20max **142.2
DtIEE bfs
t is arcing time in secondsD is distance from the arc in mmIbf is available bolted fault current

• IEEE 1584:• Tested at system voltages of 208, 400, 450, 480, 600, 2300, 4160
and 13800• Varied electrode gap, bolted fault current, enclosure size, and
distance from arcdistance from arc• Findings:
– Incident energy increases linearly with arc time and inversely with the square of the distance from the arcsquare of the distance from the arc
– Arcing current depends primarily on available bolted fault current, but arcing current as a percentage of bolted fault current increases with system voltage
• At 2300, 4160 and 13800 Volts, empirically derived equation for arcing current is entirely a function of bolted fault current

For 1584 Curves: Arc Gap = 153mm, Arc Time = 0.1 sec, Calc Factor=1, Dist. Exp. = 0.973, Working Dist. = 38”For Lee’s Curves: Arc Time = 0.1 sec, Working Dist. = 38”

• Well, at least we’re not under‐protecting workers, right?right?
• In my wind farm study, IE predictions were onsistentl sometimes dramati all lo er sinconsistently—sometimes dramatically—lower using max power method– Arc current assumed to be 70.7% of bolted fault current
dl f lregardless of system voltage– Over‐current devices had inverse time‐current characteristics
• Over‐estimating arc current by 15% led to under‐estimating fault clearing time by 17 cycles
16.1 cal/cm2 (1584) vs. 1.5 cal/cm2 (Lee)

• No consensus standard yet existso co se sus sta da d yet e sts• 2012 version of NFPA 70E references two papers that explore ways to predict DC arc energy:p y p gy– Maximum Power Method (Doan)[4]
• Very similar to Lee’s methodH bl NFPA 70E f l ti i l l l t• Has same problem: NFPA 70E formulation simply calculates arcing current as one half the bolted fault current
– Semi‐empirical Method (Ammerman et al.)[5][ ]• Did not perform any new testing• Provides equations based on exhaustive survey of extant research going back 100 yearsg g y

• Dr Ammerman and his colleagues found good agreement between data
Varcfound good agreement between data sets that could be compared
– The arc VI curve is non‐linear and h bexhibits negative resistance up to
a “transition” point
– After this point, current increases f p ,almost independently of voltage
– Arc voltage is primarily a function of arc lengthof arc length
• Provides equations for arc VI characteristic. Requires iterative l tisolution IarcArc VI characteristic from Ammerman, [#5]

• Complicating factors:Complicating factors:– Resistance of a PV cell is non‐linear
• Need accurate value for equivalent resistance lookingNeed accurate value for equivalent resistance looking into array to use Dr. Ammerman’s equations
– Over‐current protection in PV arrays is p yfundamentally different
• Short Circuit Current ≈ Max Power Current• String fuses in combiner boxes may not clear faults• Accurately determining clearing times could be difficult

• Revisit San Luis Farm to finish collectingRevisit San Luis Farm to finish collecting system data– Protection scheme: identify clearing devices and fy gtimes
– Typical bus gaps at worker‐accessible nodes• Understand behavior of equivalent resistance looking into PV array under fault conditions
• Build complete system model and produce final study based on both methods

• Still a need a comprehensive series of tests toStill a need a comprehensive series of tests to develop empirical equations based on:– Likely electrode composition gap and orientation– Likely electrode composition, gap and orientation– Typical range of common bus voltagesTypical range of available bolted fault currents– Typical range of available bolted fault currents
• One goal will be to recommend test setups b d it ditibased on site conditions

• [1] Chicago Electrical Trauma Research Institute website [Online]. Available at: http://www.cetri.org/statistics.html
• [2] The other Electrical Hazard: Electric Arc Blast Burns, Ralph H. Lee, 1982• [3] Guide for Performing Arc‐Flash Hazard Calculations, IEEE 1584‐2002, [ ] f f g , ,
2002.• [4] Arc Flash Calculations for Exposures to DC Systems, Daniel R. Doan,
2007• [5] DC Arc Models and Incident Energy Calculations, Ammerman,
Gammon, Sen, Nelson, 2009• [6] Standard for Electrical Safety in the Workplace NFPA 70E 2012[6] Standard for Electrical Safety in the Workplace, NFPA 70E, 2012

In my wind farm study, IE predictions were consistently lower using Lee
Over‐current devices had inverse time‐current characteristicscharacteristics
Estimating arc current at 70.7% of bolted fault current leads to faster clearing times
Critical to be able to predict arcing current

For 1584 Curves: Arc Gap = 32mm, Arc Time = 0.1 sec, Calc Factor=1.5, Dist. Exp.=1.473, Working Dist. = 18”For Lee’s Curves: Arc Time = 0.1 sec, Working Dist. = 18”

Expected CostsExpected Costs
• Travel– 2 trips to Alamosa for data collection. 255 miles each way
• At $0 555/mi (gsa gov)At $0.555/mi (gsa.gov)• 255*4*$0.555=$566.10
• Research paper costs– $10 each from IEEE explore
• Estimate 6 total for $60• E‐days posterE days poster
– $20• Total estimated expenses: $646.10

Characteristic Resistance of PV CellCharacteristic Resistance of PV Cell


![On [a,b], ARC = On [1, 16], find ARC for. On [a,b], ARC = On [1, 16], find ARC for ARC = =](https://static.fdocuments.in/doc/165x107/5697c0281a28abf838cd6d3a/on-ab-arc-on-1-16-find-arc-for-on-ab-arc-on-1-16-find.jpg)