Design and Implementation of Electronic ID System for...
38
Design and Implementation of Electronic ID System for Inventory Management First Semester Report Fall Semester 2012 – Full Report – Rev. 2 by C. Melissa Vetterling Luke Engelbert-Fenton Prepared to partially fulfill the requirements for ECE401 Department of Electrical and Computer Engineering Colorado State University Fort Collins, CO 80526 Project adviser: Dr. Ali Pezeshki Approved by: Dr. Ali Pezeshki i
Transcript of Design and Implementation of Electronic ID System for...

Design and Implementation of Electronic ID
System for Inventory ManagementFirst Semester Report
Fall Semester 2012
– Full Report –Rev. 2
byC. Melissa Vetterling
Luke Engelbert-Fenton
Prepared to partially fulfill the requirements for ECE401
Department of Electrical and Computer EngineeringColorado State University
Fort Collins, CO 80526
Project adviser: Dr. Ali Pezeshki
Approved by: Dr. Ali Pezeshki
i

ABSTRACT
This report presents the interim results of a remote sensing solution to managing the status of liveanimals in laboratory setting. Lab Animal Resources (LAR) is a facility on the Colorado StateUniversity Campus, which houses and cares for animals that are to be part of scientific studies. LARfaces a challenge in periodically reviewing the count and location of occupied cages, tracking the careand location history in each of those cages, and maintaining all the collected information and history ina database format. Manual data collection is labor intensive and time consuming, as well as introducinga greater risk of human error. LAR desires a remote sensing solution in order to reduce the labor andcost as well as reducing the risk of human transcription errors.
Commercially available wireless solutions exist, but these are all a magnitude of order more expensivethan the budget LAR has for this application. In addition the commercial solutions do not supportimplementation in incremental quantities. Our team analyzed various concepts for wirelesscommunication in order to design a solution that balances the coupled dynamics of budget constraintsand physical, functional, and environmental requirements. The best system configuration wasdetermined to be passive RFID tags on the cages, with a mobile hand-held RFID reader with wirelessinternet capabilities, control software and database structure both written in C++ language, with cablesavailable for hard-wire transfer of information. This system concept must be validated prior toimplementation, with emphasis on the attenuation due to operational environment, and softwarereliability. Testing and validation will begin December 2012, and is expected to last through March2013. Delivery of Proof of Concept will occur May 1, 2013.
ii

Table of Contents
1. INTRODUCTION.................................................................................................................................11.1 Lab Function:..................................................................................................................................11.2 Facility Construction and Layout....................................................................................................11.3 Granite Database.............................................................................................................................11.4 Census and Billing:.........................................................................................................................11.5 Investigation Life Cycle..................................................................................................................21.6 Needs for LAR................................................................................................................................3
2. REQUIREMENTS.................................................................................................................................42.1 List of Requirements.......................................................................................................................42.2 Ethics...............................................................................................................................................8
3. ANALYSIS OF PREDECESSOR SYSTEMS.....................................................................................104. SYSTEM DESIGN..............................................................................................................................10
4.1 Applications of Systems Engineering............................................................................................104.2 Candidate Concepts.......................................................................................................................12
5. SYSTEM DEVELOPMENT...............................................................................................................145.1 System Map...................................................................................................................................155.2 Elements of the System.................................................................................................................17
6. Plans for Testing...................................................................................................................................226.1. Geometric Parameters for Testing Hardware ..............................................................................22 6.2. Environmental Parameters for Testing Hardware.......................................................................236.3. Criteria For Successful Hardware Tests.......................................................................................246.4. Software Planned Testing Strategy...............................................................................................24
7. Future Work..........................................................................................................................................258. Conclusion...........................................................................................................................................259. References............................................................................................................................................2610. Appendix A: Abbreviations................................................................................................................2711. Appendix B: Budget...........................................................................................................................28
10.1 Funding........................................................................................................................................2810.2 Cost - Proof of Concept:..............................................................................................................2810.3 Cost - Initial System Wide Deployment:.....................................................................................28
12. APPENDIX C (i): Project Schedule, Rev 1.......................................................................................29 APPENDIX C (ii): Project Schedule, Rev 2......................................................................................32
Illustration Index
Illustration 1: Rack of Cages......................................................................................................................1Illustration 2: FY 13 CSU Faculty Animal Care Per Diem Rates..............................................................2Illustration 3: Sample Cage Card in Holder...............................................................................................3Illustration 4: Hearing Ranges, Heffner & Heffner, 2007..........................................................................9Illustration 5: EID System Map...............................................................................................................15Illustration 6: Graphical Representation of Max Lateral Offset..............................................................22Illustration 7: Graphical Representation of Max Read Distance.............................................................22Illustration 8: Graphical Representation of Max Angular Deflection......................................................23
iii

Index of Tables
Table 1: List of Requirements....................................................................................................................4Table 2: Cost – Proof of Concept.............................................................................................................28Table 3: Cost – Initial System-Wide Deployment....................................................................................28Table 4: Cost – Additional Monthly Cost................................................................................................28
iv

1. INTRODUCTION
1.1 Lab Function:
Laboratory Animal Resources (LAR) strives “to use our expertise to provide the highest standard of
care for laboratory animals in support of the Colorado State University research community.” They
maintain over 3500 cages, housing animals such as calves, pigs, cats, dogs, rodents, etc. These cages
are spread across two facilities – one at Colorado State University (CSU) main campus, and one at the
CSU Foothills Campus. LAR maintains these animals as clients, referred to as private investigators,
perform research studies.
1.2 Facility Construction and Layout
As stated previously, LAR consists of two facilities which
jointly comprise about 20,000 sq ft. These two facilities
house all the cages in rooms that are approximately 16’ x 25’
along corridors with several rooms in each facility. The
majority of rooms contain metal racks which hold the cages
as shown in Illustration 1.
1.3 Granite Database
Granite is a database management system currently used by
Laboratory Animal Resources to track all of their cage
information and billing procedures. This includes contact
information for the investigators, billing rates, animals
associated to each investigator, protocol information, and
cage information.
Support for the version of Granite currently being used by
LAR will expire within the next 5 years. Upgrading to a
newer version of Granite is expensive, so LAR is looking to
alternate solutions.
1.4 Census and Billing:
Census
Currently LAR performs a monthly census. This entails a staff member printing out the cage numbers
that should be in each room based on the database information. They take these printouts and go into
each room and manually read each cage card number and make sure it belongs in the room. After going
1
Illustration 1: Rack of Cages

through each room, the data then needs to be compiled by hand to identify the discrepancies found.
Staff then has to go and remedy each of the problems that arose. Over the course of a month, many
private investigators will move cages, start using new cages, and remove some cages. This means that
the information LAR has in their database can differ drastically from what is actually in each room
within a month. This then leads to significant loss in revenue for LAR.
Billing
Laboratory Animal Resources
bills their customers on a per day
basis. Rates differ based on the
type of animal and other factors.
Figure X is some example of
these rates.
In order to bill a client accurately,
LAR needs to have information
on exactly how many days a
client has used a cage. This is
where the information is not exact
and LAR has seen loss in
revenue. Because LAR only does
a monthly census and private
investigators have the ability to
add cages when they need, LAR
does not have a good idea of when a cage was added. Currently they start billing from the date of the
census, which means they don’t bill for the amount of days the cage was used before the census was
taken. This is where the primary need for a new system process arose.
1.5 Investigation Life Cycle
This sequence offers insight into the current process employed at Lab Animal Resources.
New Protocol – Entry in the system
1. The first step is a private investigator generates a new protocol (request).
2. A staff member from LAR then takes that information and creates a new Animal Order within
the Granite database. The Animal Order details all the needs of the investigator such as the
animal desired, for what purpose, special restrictions, etc. as well as details LAR uses such as
facility location, room location, etc.
2
Illustration 2: FY 13 CSU Faculty Animal Care Per Diem Rates

3. After the account information has been approved, LAR contacts
certain animal vendors to purchase the animals necessary for the
private investigator.
4. Cage cards are then generated to put on all the cages the private
investigator will be using.
5. The animals arrive and are then put in the appropriate cages and put
in the rooms that were assigned.
Upkeep – Census Capture
6. Staff member prints out room reports from Granite database.
7. Staff member goes into a room and checks off all cages that are seen
on the report, while recording all cages in the room that are not on the
report as well as noting the cages that are missing from the room
when they are listed on the report.
8. Staff repeats step 7 for every room.
9. Staff compiles data from reports and addresses all irregularities: moving cages where they need
to go, adding new cages to database (beginning billing cycle), removing cages from database
(see step 10)
Cage Termination – Removal from the system
10. Once a private investigator has finished using a cage, they put the cage card in a box designated
for cages that need termination.
11. An LAR staff member collects cage cards from termination box and manually stops the billing
cycle for that cage.
1.6 Needs for LAR
This project arose from two different issues. One being that Granite will soon not be supported, and the
other that LAR is losing money based on the inability of their current system process to facilitate
weekly billing. This prompted the desire for a full system overhaul. Such an effort would include
replacing the current database with a new updated database and incorporate a new census gathering
system and new billing process.
The main needs of LAR is to create a new database with the same functionality (with a few
modifications) as Granite currently has, and also to implement a new tracking system to quickly and
3
Illustration 3: Sample
Cage Card in Holder

reliably take a census of each room and compare the results with the database information. This new
tracking system is meant to significantly reduce the census time so it can be done on a weekly basis,
thereby cutting down on profit losses.
Specific needs identifies included:
� LAR has a need to have a complete and correct census,
� LAR, as part of the census, needs to have traceable cage locations,
� LAR has a need to generate periodic billing statements, supported by the census.
� LAR desires to generate billing summaries on a weekly basis,
� LAR seeks a system to facilitate maintaining adequate training of staff,
� LAR requires a secure system facility,
� LAR requires a solution to be maintainable,
� LAR requires continuous database function with minimal interruption,
� LAR requires a solution that can function within the constraints placed on them as an operating
animal laboratory.
2. REQUIREMENTS
This project entails 17 functional requirements and five physical requirements that derive from the
project needs, the intended operational environment, and the intended use. These requirements have
evolved over the course of the semester, and therefore now include information specific to the use of
RFID for identifying cages.
2.1 List of Requirements
1 FUNCTIONAL
1.1 Link RFID to Cage Card Number in Database.
Need: Derives from the fundamental need of the system to track cages.
Notes: Database is currently Granite, but will be replaced.
1.2 Maintain a Database with Same Field Information Currently Stored byGranite.
4

Need: Derives from the need to facilitate the functions of LaboratoryAnimal Resources.
1.3 Cross-Check to Identify any Cage Card Records that are Not Linked toRFID.
Need: Derives from the need to have a complete and correct census.
Notes: This relates specifically to the use of census data for billing.
1.4 Administrator and User Login Functionality.
Need: Derives from the need to maintain a secure facility system.
Notes: It will be necessary that only authorized users make certainchanges.
1.5 Ability to remove RFID / Cage Card From the System Both Manually & ViaScan.
Need: Derives from the need to have a complete and correct census.
Notes: Serves to remove duplicate entries & cages no longer occupied.
1.6 Ability to Track Errors Due to RFIDs Without Cage Card Assignments andGenerate Error Report.
Need: Derives from the need to have a complete & correct census.
Derives from the need to maintain a secure facility system.
Notes: Serves to ensure new cage assignments are only generated byauthorized users.
1.7 Ability to Track History of RFID and Cage Card System
Need: Derives from the need to maintain adequate training of staff.
Notes: Serves as a means to identify staff potentially in need of additionaltraining, once errors - such as improper cage transfers - are found.
1.8 Ability to Prevent Double-Reads
Need: Derives from the need to have a complete & correct census.
Notes: Serves to ensure only unique RFID tags are reported on census,removing the need for compilation by a staff member.
1.9 Ability to Generate a Census Report Listing the Location & Cage CardInformation.
Need: Derives from the need to have a complete & correct census.
Derives from the need to have traceable locations of cages.
Notes: Due to constraints on animal care, and changing environmentconditions between rooms, Laboratory Animal Resources intendsto track room location of specific RFIDs, in addition to tracking thetotal count of RFIDs.
1.10 Generate an Alert if Mismatch Occurs Between Number of Cages Allocated
5

to a Location & Number of RFIDs Reported on Census of that Location.
Need: Derives from the need to have a complete & correct census.
Derives from the need to have traceable locations of cages.
1.11 Database Information Editable by User
Need: Derives from the need to have a complete & correct census.
Derives from the need to have maintainability.
Notes: User, as referred to here, is not necessarily the same “User”
referred to in Requirement 1.4
1.12 Generate Warnings if Census Dates are Set for “Future”
Need: Derives from the need to have a complete & correct census.
Notes: Serves to reduce incorrect census due to human error.Example: “This will end census in 11 months, do you wish toproceed?”
1.13 Ability to Start & Stop Census
Need: Derives from the need to have a complete & correct census.
Notes: Allows staff to make adjustments to billing procedures, amounts,etc., based on arrangements with investigators.“Start Census” and “Stop Census” indicate a beginning and end toa billable period for a given investigator. Relates to Requirement 1.11.
1.14 Calculate the Total Number of Care-Days for Each Investigator & theCorresponding Charges Following a Census
Need: Derives from the need to generate periodic billing statements.
Notes: The necessary information for generation of a billing summary willbe drawn from the census results, and information stored in thedatabase.
1.15 Ability to Feed Billing Information to Database.
Need: Derives from the need to generate periodic billing statements.
Notes: Database is currently Granite, but will be replaced.There is an inherent unstated need that billing statements becorrect.
1.16 System Must be Amenable to Modular Implementation.
Need: Derives from the need to maintain continuous database functionwith minimal interruption.
Notes: As a 24-hour facility, it is necessary that Laboratory AnimalResources be able to continue business operations at all times
6

throughout the period of system development and deployment.
1.17 Minimum Read Distance Must be at Least 12 Inches.
Need: Derives from the need to conduct a full census on a weekly basis.
Notes: It is estimated that census scan time per room be 5 min at theoutside to facilitate this need.It is estimated that a read distance shorter than 12” will not resultin a measurable net benefit to Laboratory Animal Resources overthe current system.
2 PHYSICAL
2.1 Units Must be Hand-Held and Mobile
Need: Derives from the need to conduct a full census on a weekly basis.
Notes: This requirements is additionally related to the constraints of theoperational environment. Cages are located among several rooms,and metal shelves within the room lower expectations for scans at adistance greater than 3 feet.
2.2 Units Must Perform Wireless Scan of Cage IDs
Need: Derives from Requirement 2.1
2.3 Units Must be Capable of Performing Wireless Updates From & To theDatabase
Need: Derives from the need to conduct a full census on a weekly basis.
Notes: This is an additional requirement to reduce the time required toconduct a full census.This requirement has the lowest priority of all requirements under1 and 2.
2.4 Any Parts that are Not Disposable Must Be Autoclavable
Need: Derives from external requirements placed on Laboratory AnimalResources, based on standards of care in animal laboratories.
Notes: Laboratory Animal Resources would prefer disposable RFID tagsdue to internal customary procedures.
2.5 All Elements Used for Physically Identifying Cages and Reading RFIDsMust be Safe for Use in the Proximity of Laboratory Animals.
Need: Derives from “Guide for the Care and Use of Laboratory Animals”,8th ed., Office of Laboratory Animal Welfare, National Institute ofHealth
Derives from IEEE Policies Section 7.8, Code of Ethics
Notes: For further detail, see following section on ethics.
– End of Requirements –
7

2.2 Ethics
We are instructed on ethics by two sources:
IEEE Code of Ethics
We... [hereby agree]...
to accept responsibility in making decisions consistent with the safety,health, and welfare of the public, and to disclose promptly factors thatmight endanger the public or the environment.
IEEE Policies, Section 7.8-1
While this does not instruct us directly on the safety, health, or welfare of animals, we find two
compelling implications of this policy on our system.
1. We cannot find it logical that Section 7.8 can by satisfied by engineering designs that do not
take into account the safety, health, and welfare of the laboratory animals, when Laboratory
Animal Resources themselves are required to do so by the regulating bodies.
2. The results of animal studies are often used to determine safety for use in humans. It follows
that any system that endangers the safety, health or welfare of the laboratory animals may
impact, in unknown ways, the outcomes of studies, and thereby indirectly impact the safety,
health, and welfare of the public.
Our maximum factor of safety is achieved, therefore, when we take into consideration the
safety, health, and welfare of the laboratory animals, in so far as they would be affected by
our system.
Office of Laboratory Animal Welfare
The Office of Laboratory Animal Welfare (OLAW), a division of NIH, through “Guide for the Care
and Use of Laboratory Animals”, 8th ed, offers instructions regarding hazards, and environmental
conditions appropriate in animal laboratories.
Radiation
OLAW instructs that hazards should be identified, and risk assessment conducted. Radiation is
specifically cited as one such potential hazard. Since any wireless device operates on principles of
radiation, we are obligated to consider minimization of incidental radiation in our design, and to make
the customer aware of such radiation so that they may conduct the appropriate risk assessment.
8

Noise
OLAW, through “Guide for the Care and Use of Laboratory Animals”, also offers instruction on
ambient noise:
The potential effects of equipment (such as video display terminals; Sales
1991; Sales et al. 1999) and materials that produce noise in the hearing
range of nearby animals can thus become an uncontrolled variable for
research experiments and should therefore be carefully considered (Turner
et al. 2007; Willott 2007). To the greatest extent possible, activities that
generate noise should be conducted in rooms or areas separate from those
used for animal housing.
Analysis
It is important to note that the hearing range of
animals extends well beyond that of humans. As
noted in Illustration 1, the hearing range of mice
can extend up to approximately 128 kHz. When
compared to the frequency of LF RFID, which is
30 kHz to 300 kHz, it is apparent that many
bandwidths in this region would potentially
expose the laboratory animals to unnecessary
noise. Such noise, in addition to being counter-
indicted by OLAW, has the potential to interfere
with animal communications.
Additionally, the use of active RFID tags would
expose the animals to ambient radiation.
Whether an RFID reader is present or not, active
tags periodically broadcast their ID. As
mentioned, we do not know the effect of RF
radiation on laboratory animals, but in the interest
of maintaining a high factor of safety, have
elected to minimize the exposure of the animals
to unnecessary radiation.
9
Illustration 4: Hearing Ranges, Heffner &
Heffner, 2007

3. ANALYSIS OF PREDECESSOR SYSTEMS
Commercially available alternatives currently exist on the market. The most common implementation
of these alternatives are systems of RFID Readers, which have a wireless link to the RFID database.
Options are available that work in LF, HF, and UHF frequency ranges. Additionally, the purchaser of a
commercial system has the option of selecting active or passive RFID tags. Most systems, however, do
not implement disposable RFID tags.
Much of the technical specifications of the commercial systems were not available without serious
intent of purchase, therefore it is unknown what the read range of such systems would be. However,
the demonstration videos and brochures seem to indicate a read range consistent with Requirement
1.17.
Two coupled factors underlie Laboratory Animal Resources' decision to pursue a solution in lieu of a
commercially available alternative, though both are financial. The first is the fact that commercial
solutions have a start-up cost well in excess of $100,000, and – while the specific numbers vary
between companies – the magnitude continuing support cost are in the $10,000 x range. Additionally,
commercially available solutions are not typically amendable for phased implementation due to the
magnitude of the fixed cost of the system as compared to the incremental cost of additional units.
A solution was sought that allows Laboratory Animal Resources to obtain an inventory system at a
smaller cost than commercially available alternatives, and whose cost is driven primarily by the
incremental cost of units.
4. SYSTEM DESIGN
4.1 Applications of Systems Engineering
As the requirements of the system were developed, it became clear that this project would involve
design in line with systems engineering, more so than components engineering. The initial
understanding of the client needs was that an RFID reader would be the primary result. However, the
need to replace the current database system, as well as the need to feed into the billing procedures,
warranted a more extensive solution.
The architecture of the solution was, therefore, designed to eventually include a wireless system for
tracking inventory, a replacement database system, and software to control the read session of the RFID
census, implement error correction, and interface with the database on both the front and back ends of
the census scan. While this neither involves the level of diversity or complexity of, for instance, a
space-craft, it has presented an undergraduate-level exposure to the principles of systems engineering.
10

Design of a System versus Design of a Component
Engineering of a system “bridges the traditional engineering disciplines.” (Kossiakoff, 2003) Design
of a system differs from design of a component primarily in the number and complexity of the
interfaces, as well as the diversity of the subsystems.
When one is designing a component, there may be many interfaces between like sub-components (for
instance, MOSFET transistor), but these are usually known and available to the circuit designer as they
develop. Additionally, the external interfaces are usually limited (i.e. Power, Ground, Signal In, Signal
Out). Furthermore, the external interfaces often join like components (for instance, adjacent circuit
boards).
Without trivializing the complexity of component design, there are clearly different dynamics an
engineer encounters when designing a system. As with component design, the interfaces may be the
site of significant difficulties that require troubleshooting. However, the interfaces a systems engineer
develops often do not exist until the system is assembled. Therefore a systems engineer may place
higher priority on better interfaces that increase the likelihood of system success, rather than the
optimization of individual components.
Similar to the above, the optimization criteria a components engineer may address are different from
those a systems engineer may address. The components engineer is often focused primarily on their
component. They are likely to be concerned with criteria such as power consumption, gain, component
performance, etc. Conversely, a systems engineer is ultimately concerned that the system works, and is
often willing to accept sub-optimal components to do so.
This is analogous to a 120-hour drivers' education course, in which each student wants as much
instructor time as possible – ultimately 120 hours. However, as with any resource, instructor time is a
limited resource, and the best drivers' education system is best achieved when each student receives
some instruction, even though this leaves no student with 'optimized instructor time.'
Modular Implementation
A systems engineer will often focus on modular implementation. This entails the separation of large
functions into modular groups, which can be interchanged, and connected, without significantly
affecting the system performance. This ties back to the system's engineering focus on interfaces –
which must be reliable and somewhat standardized – in order to facilitate the performance of a modular
system.
As part of the emphasis on modular design, a systems engineer will often seek to use validated
Commercial Off-the-Shelf components rather than using new technology, which has not been
thoroughly tested and validated.
The benefit of this emphasis is the ability to replace parts that go bad with new parts, without the need
11

to redesign the system. For our application, this seemed a necessary approach, given the desire of LAR
to implement this system in incremental steps, along with the need to maintain database functionality
throughout. (See Needs, Requirement 1.16)
Criteria for Success
The criteria for success, as a systems engineer is concerned, are addressed at the system level. For
instance, if each component comes in on-budget, but the interfacing of the components is so expensive
that the system is abandoned, the systems engineer is not satisfied. With that paradigm in mind, the
criteria for success include cost of the system, system reliability, and the system's satisfaction of the
requirements.
Our system must present a solution whose cost is lower than that of the commercially available
alternative. Similarly, it must be reliable; this is especially the case since the design team has finite
duration and we will not be available for product support during the operations phase. Lastly, in
satisfying the requirements, our system must be able to handle the quantity of data anticipated. This
includes several fields (such as census start data, billing rate, and PI) pertaining to thousands of cages.
4.2 Candidate Concepts
Our team considered several candidate concepts as potential solutions prior to commencing system
design. The most costly part of any conceptual system is the RFID reader. Therefore, that was the
main determining consideration among various candidate concepts. The RFID reader is the entire unit
that scans an RFID. It includes transmit and receive antennas, an RF module (to generate the RF
signals and process the incoming response), microcomputer and I/O ports. We selected the concept that
had the best indications for success based on the aforementioned criteria (cost, reliability, satisfaction
of requirements). The primary candidate concepts are discussed below.
Bar-code Scanner
Bar-code scanners are simple technology, which promised to have a low system cost if implemented.
In such a design, bar codes would be affixed to the cage cards. Using a bar-code scanner, an LAR staff
member could conduct a census of the room by scanning the bar-codes. This information would
interface with a database system via USB connections.
Concerns that led to the decision not to pursue this concept include:
� Often PI's will place information, such as small notes, in the cage card holder, in front of the
cage card. This would obscure a bar-code, which is estimated to increase the scan time beyond
the 5 minute target.
12
� Bar-codes are cheap technology when they are printed on paper. However, the ink and paper
could be subject to damage (such as from a spilled water container), which could obscure the
bar-code.
� Wire-free bar-code arrangements did not appear to be readily available, and therefore this
concept did not appear promising in light of requirements 2.1, 2.2.
Internal Design of RFID Reader
Our team considered the possibility of designing an RFID reader for use with the system. However,
several considerations led to the decision not to pursue this concept:
� Consultation with Stephen Hicks, an Electrical Engineer with experience in RF design informed
us that the design of the RFID Reader Module involves concepts that were beyond the
experience of our team, such as the design of inductors from micro-strip line, and which were
likely to entail significant learning time, and likely many non-functioning prototypes. This
underpinned our second consideration, and concerns about time.
� As the requirements were developed, it became clear that the software elements – particularly
the database, were at least as important to the client than the ability to conduct wireless census
scans.
Given limited resources in the way of time and man-power, our team determined these resources would
not be efficiently spent if used to develop an RFID Reader, which would necessarily prevent us from
significant software development.
Segmented RF System
While in-house design of the RFID Reader appeared ill-suited to this system, it is possible to acquire
COTS versions of all the elements – transmit and receive antennas, RF module, etc. Our team
considered systems that implemented RFID technology, but through an assembly of COTS
components. Like bar-code scanners, this approach has some financial benefit. The technology
components of an RFID reader can be purchased for approximately $1000 altogether, which is well
below the cost of COTS RFID readers. However, several considerations led to our dismissal of this
concept as well.
� While the elements of technology cost less than a COTS reader, they do not come connected,
nor do they have any housing. Therefore there is an additional cost of manufacturing a housing
for the reader.
� COTS RFID readers have been validated for tough environmental situations – for instance,
drops from 4' onto a concrete floor. This team is not able to provide the same level of
mechanical engineering, and would not be able to promise the same of an in-house design.
13

� Being designed in-house, such a system would not include any warranty or support usable by
the customer once our team is no longer available.
COTS RFID System
COTS RFID readers would allow our system to make use of the benefits of RF technology, provide the
customer with some level of ongoing support, and the ability to expand the system on their own, or
replace parts as needed. Several considerations led to our decision to select this candidate concept for
system development, including:
� Through the vendor, LAR would have access to some amount of ongoing customer support.
While this is not substantial support, and only applies to the reader, it is more support than our
team is able to provide through the other candidate concepts.
� As a purchase from a vendor, the RFID read, which is the most expensive of the system
components, would have be under warranty for 1 year.
� COTS readers are reliable – they have been tested for extreme conditions including
temperature variations, voltage surges, and drops onto concrete.
� COTS readers are replaceable. As a pseudo-standardized product, if LAR wishes to replace or
purchase additional readers, they can do so through the vendor, without need of an additional
design team.
The ability to provide our client with a reliable, maintainable product, and one that would allow us to
dedicate resources toward meeting their software needs as well, was of high value to the team.
Ultimately we selected the COTS RFID System as the candidate system for development.
5. SYSTEM DEVELOPMENT
Our team elected to use RFID technology, with a COTS RFID reader with WiFi capabilities (802.11
b/g), Generation 2 passive tags, and software written in C++, to implement this solution. RFID
technology has several advantages for this application. The RFID tag does not have line-of-sight
requirements such as a bar-code reader would, and they tend to be more resistant to damage, such as
from spilled water. Additionally, because they operate on proximity to the reader (within a given
beamwidth), it is not necessary for the staff member conducting a census scan to perform incremental
scans of each unit. Rather, it is only necessary that the reader pass within the required proximity of
each RFID tag.
14

5.1 System Map
Below we have provided a system map to illustrate some of the operational functions of the system.
Primary operational functions are indicated in blue circles. For the purpose of this section, user refers
uniformly to LAR staff. Reader Module is the RF Module located on the RFID reader.
Software
The system software performs several of the fundamental operations. These have been grouped in the
pale yellow box in the System Map, which indicates the software-intensive subsystem.
Create Card
As indicated in section 1, this process occurs when new protocols have been generated by investigators.
The user inputs account information into the software, and scans an RFID tag that will be placed on the
cage card. A cage card is then generated, the RFID tag affixed, and the card placed in the appropriate
cage card holder.
15
Illustration 5: EID System Map

Run Census
On a weekly basis the user will run a census. This entails inputting a census request (for instance, the
room number of each room as it is scanned), and performing the scan with the RFID reader, which
transmits the census data to the software program, which in turn generates a census report.
Delete Card
When a card is no longer needed, whether because of some error, or because the investigation is
complete and the cage is no longer needed, the user will remove the cage card from the system. This
entails performing a check-out procedure, to indicate to the software that a check-out is requested, and
using the RFID reader to scan the card for which the RFID is to be removed. The software then marks
the census end date in the account history, and removes the RFID from those allocated as occupied
cages. The RFID tag is discarded with the spent card.
Hardware
The process of scanning the RFID tags, and handling some of the errors that occur with RFID
technology are primarily performed with hardware. COTS RFID readers typically contain micro-
controllers and memory, and some of this function is technically embedded software. However, for the
purpose of understanding the system, they can be thought of as part of the hardware elements, since
they are fully contained on the reader.
Get Tag ID
When an ID or set of IDs needs to be scanned, the reader module sends out an interrogator signal. This
is an RF signal from the transmitting antenna, which excites an antenna in the RFID tag, causing it to
emit a signal in response to the excitation. This excitation response contains the RFID for that tag, and
is picked up by the receiving antenna in the RF module.
With RF technology, when an excitation signal is sent out, any RFID tag that received that signal, at
sufficient power, will send an excitation response. Therefore, the RFID reader may receive hundreds of
responses at the same time, though it can only process one response at a time. Therefore, error
handling is an important part of the reader.
Error Handling
As mentioned, an RFID reader must have mechanisms for handling errors that occur during a read. Of
particular significance to LAR, is the comparison of what is found in the room to what should be in the
room, per the database. Therefore it is necessary for the RFID reader to retrieve the tag assignments
from the Database, and compare that against the tags that were found by the RF Module.
16

5.2 Elements of the System
This section will go into further detail on the elements of the system solution and the characteristics
that present challenges or provide an advantage in our application.
RFID Reader
The ability of an RFID reader to excite, and receive the response from, an RFID tag depends on several
characteristics of both the reader and the tags. The relevant criteria of the reader are the polarization,
the read distance, the write distance, the memory, and the RF frequency. These are someone
interrelated variables, but collectively they determine the performance of an RFID reader.
We are currently recommending the Motorola MC9090-Z. It has linear polarization, which we
anticipate being sufficient for a 12” read distance, given the 70-degree cone. It supports the 802.11
a/b/g wireless standards, operates at nominally 915 MHz, and has expandable memory through an
SD/MMC card slot. Additionally, it has a nominal write distance of 1-2' and a read distance of 20'. We
anticipate adjusting the power on the transmit antenna to bring the read distance down to the half-width
of the laboratory rooms.
Additional benefits of the MC9090-Z are a 126 degree range in operating temperature, it withstands
multiple drops to concrete from 6' and 2000 1-m tumbles. It is powered by a rechargeable lithium
battery pack, and the base module operates on Windows Mobile, with is amenable to C++
development. The one year warranty is from the date of shipment, so no orders will be completed until
initial testing and validation of the concept have been completed. The cost of these readers is
approximately $3500 per unit, depending on the selected vendor.
Polarization
The two options for polarization are linear polarization and circular polarization. The effect of these is
best understand by analogy to a game of Marco Polo. Linear polarization requires that the RFID tag be
located facing, and along a line perpendicular to the RFID reader, within a given tolerance
('beamwidth', 'angular tolerance'). This would be analogous to playing Marco Polo with someone who
cannot hear, and can only read lips. Circular polarization is the RFID equivalent to a fully-audible
game of Marco Polo – the tag need only be within a specific radius of the reader ('read distance').
Read Distance
Read distance is a measure of how far the RFID tag can be from the reader, for the reader to still be
able to identify the tag. It is primarily a function of the polarization, antenna power, and antenna type.
On most COTS readers, this range is between 1 and 10cm. In order to achieve a minimum read
distance of 12”, we will need well-powered readers.
17
Write Distance
Some RFID tags contain a stored state that can be set by the reader (typically 7 available states, total).
When the RFID reader sends out an excitation signal, it also causes the RFID tag to switch to an
indicated state (for instance, 'logged'). The maximum distance a reader can be from the tag and still
write a state to RFID tags is the write distance.
Memory
COTS RFID readers come with varying amounts of memory available on the reader itself. This
memory can be used for custom programming, or for storage. In our application, it will be necessary to
store the RFID tags and room allocations, so that mis-located cages can be identified and alerted to as
the census is in progress. There must also be sufficient memory for the error-handling software to be
installed on the reader.
Frequency
COTS RFID readers can operate in a range of frequencies. In large terms, these are referred to as low
frequency (LF), 30 – 300 kHz, high frequency (HF), 3-30 MHz, and UHF, 30 MHz – 3 GHz. There are
implications of frequency selection in terms of both noise floor and ethics.
Low frequencies will not be used for this project because of the possible risk to the animals (see
Section 2.2). However, the public WiFi band is 2.4 GHz. The concern with using frequencies in that
range is the increased noise floor due to cell phones, internet modems and routers, and other devices in
the public spectrum.
Frequency also has an effect on how quickly data can be transmitted. To complete a census scan, an
LAR staff member will indicate the current room, start the read session, and then pass the RFID reader
in front of each cage, though there is no need to make a discrete read of each cage, nor to make any
contact. In order to ensure that all IDs through this process, we are selecting a high frequency, which
increases the rate of data transmission, and increases the likelihood of a successful read of all cages.
In particular, we are selecting a reader that occupies the 900 MHz – 1 GHz band, nominally located
around 915 MHz. This is above the range that would expose laboratory animals to unnecessary noise,
and below the range that would encounter excessive interference from the public WiFi band.
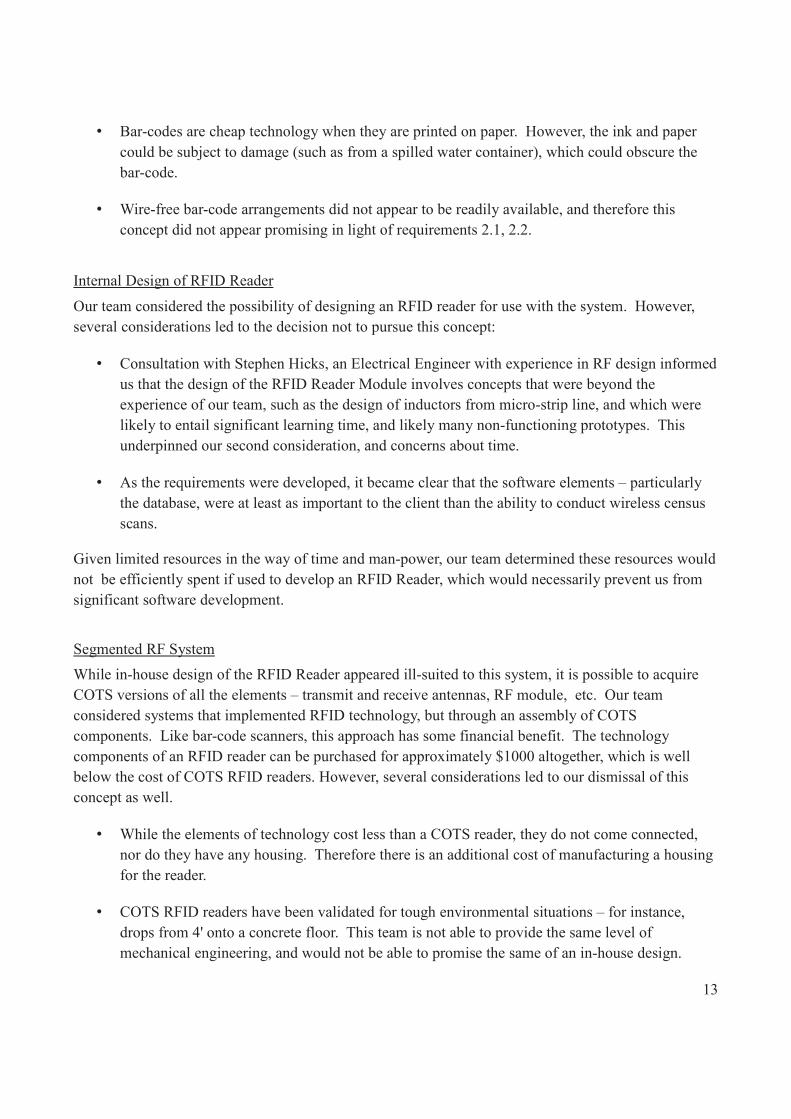
RFID Tags
RFID tags come in three possible generations, and can be either passive or active, and either disposable
or permanent. We are selecting to use passive, disposable, Generation 2 tags. While slightly more
expensive, these tags are more amenable to error correction, do not emit period radiation which might
otherwise pose a hazard to the laboratory animals, and the cost of permanent tags does not outweigh the
benefit, since ultimately all cage cards are terminated.
18

Generation 0
Generation 0 tags are write-once tags, which are written when they are made. They can be read, but
cannot be changed. These are very simple technology, in the larger realm of RFID technology.
Generation 1
Generation 1 tags are write-once at the time of 'printing'. This gives the consumer some choice over
the information that is written on each RFID, but they cannot in any way be altered after writing.
These tags represent mid to low-level sophistication of RFID technology.
Generation 2
Generation 2 (Gen 2) tags have features that are not available on either of the aforementioned tag
generations. One frequent problem in multiple-read RFID sessions is that the reader may register
'ghost IDs' - RFID numbers that have no physical tag, but are merely an occurrence of interference
from so many tags responding. While this can be addressed in part by reducing the read time, Gen 2
tags have secure communications with the reader that reduce the occurrence of ghost reads.
Gen 2 tags first transmit a 'preamble' – therefore the software on the reader can dismiss any tag ID that
was not preceded by a preamble. Additionally, Gen 2 tags have 7 states that can be set. This allows
readers to selectively address only RFID tags with the selected state. Lastly, Gen 2 tags can be assured
to never be re-used after termination, due to the 'Killed' state. This would prevent the possibility of
previously used RFID tags ending up back in the database but attributable to multiple investigators.
Passive Tags
Passive tags are RFID tags that do not emit any identification signal until they are excited by the signal
from an RFID reader. In some cases they may respond to signals from other devices that are the right
frequency. However, choosing a frequency below the public WiFi band, and making use of Gen 2 tag
technology will help to prevent this occurrence. The primary motivation for choosing passive tags is
that they will not expose the laboratory animals to periodic radiation, except during the census scans.
Active Tags
Active tags are RFID tags that periodically transmit their identification, whether or not a reader is
present, and whether or not they have been excited by a signal. Active tags increase the read range,
nonetheless there are many compelling reasons against using active technology.
Radiation is listed as a hazard to laboratory animals, therefore we do not want to unnecessarily increase
their exposure. In comparison to a weekly scan, RFID transmission every few seconds is more
radiation that the animals are exposed to, by several orders of magnitude.
19

Additionally, active tags rely on internal batteries to operate. This poses two problems. The first is that
a cage card may be deemed to be missing, when in fact the battery is just low, and the second is the
ramifications of discarding thousands of batteries every year, one for each spent cage card.
Control Software for Reader
One of the software packages that will be part of the final system is the control software for the reader.
This software is installed on the reader itself, rather than on a PC, and is responsible for several tasks.
This package will be developed in C++, for implementation on a Windows Mobile platform. Because
this platform, and some of the necessary tasks – such as handling preambles – depend on reader and tag
selection, software development has lagged hardware development.
Read Session
The read session is the period during which the transmit and receive antennas in the RFID reader are
active, and RFID tags are responding, and being recorded. When the read session is not active, even if
a tag were somehow excited, the response would not be recorded.
The read session will be controlled by the software on the RFID reader. This controls the duration of a
read session (whether it is timed, or waits for the user to indicate completion), the power that is
delivered to the transmitting antenna, processing of the preamble information, and storing of the RFID
information.
Comparison & Alert Generation
Because of the requirement to know which cages are in a given room, and identify those that are mis-
located, there will be a software package to handle database comparison and alert generation. The
relevant database information (room, RFID number, total count expected) will be saved to memory on
the reader. Software will compile a list of unique RFID tags responding, and will compare it against
these data. The same package will then generate alerts for:
� Missing cages,
� Cages that responded to the census scan but should not be in the current room,
� Mis-count.
This serves as a secondary measure, to ensure no mis-located cages go undiscovered.
Additionally, the software will need to accept user input in response to these alerts, and handle the data
accordingly (i.e. 'Ignore', 'Add to Room'), and at the end of the census, transmit the necessary changes
to the database software. Finally, because the RFID readers may also be used to remove cage cards
from the system, this software will also control whether specific cards, only, should be recorded, and
whether they will be removed from the database, or just recorded as present in the room.
20

Error Handling
Additional software will be necessary on the reader to implement error-handling. This software will
handle the receipt of preambles, and filter accordingly, eliminate RFID tags that did not respond with
the correct state, and process the received RFID information to ensure a correct census.
Database Software
The database software, which will be developed and implemented beginning in 2013, will need to serve
several purposes. These tasks, generically, are:
� Output RFID data for comparison during census,
� Track Account Information
� This includes census start and stop dates, PI contact information, etc.
� Track Account History
� This is the history of animal care / cage operations. For instance, transferring of animals
from one cage to another.
� Facilitate Two Levels of Access
� For when an administrator is logged in,
� For when a user is logged in.
� Allow RFID / Cage Cards to be Removed
� By manual access,
� By scan with RFID reader.
Software Interface to Link Control Package and Database Package
This software package will be implemented to provide a bridge between the software package located
on the reader ('control package') and the database software package. Some of the features of this
software will be providing a means to actually transmit the comparison data, prior to census, to the
reader for memory storage, and ensuring the delivering of transmissions from the reader. While this
feature could be integrated into the two software packages. However, designing a separate interfacing
software element will allow for modular implementation, since Granite will remain in use for the
interim, and will allow the potential use of alternate database programs in the future, without need of a
system redesign.
21

Remaining Stages of System Development
Over the course of the next 6 months, the team will conduct
testing and validation of the hardware, and will demonstrate
the use of the hardware in proof-of-concept form. Software
development will begin in 2013, with some elements to be
delivered with proof of concept, and the remaining portions to
be developed Jan 2013-May 2014.
6. Plans for Testing
Due to the high cost of the recommended hardware
configuration, and the fact that the warranty counts from the time of delivery, several smaller
development packages will be tested for conformance with advertized specifications as well as against
the physical requirements for the final system. By characterizing several development packages, we
hope to achieve a probabilistic estimate of the expected relative performance of the chosen commercial
reader, the Motorola MC9090-Z.
The physical parameters that require testing include geometric criteria, such as distance and alignment,
as well as environmental criteria, particularly those modeling metal objects in the environment which
could interfere with signal transmission and reception. These parameters are described in greater detail
below.
6.1. Geometric Parameters for Testing Hardware
Read Distance
A key criteria for the system is the maximum distance the
reader can activate and receive the signal from the RFID tag.
To perform this test the reader will be placed initially at a
distance of 12 inches from the tag, aligned on an axis
extending from the geometric center of the tag, perpendicular
to the tag face. The distance will be increased in increments of
6 inches. At each interval three readings will be taken and
recorded. The test will end when the reader fails to record the
tag for all three readings, or when a distance of 10 feet is
reached, whichever is sooner.
22
Illustration 7: Graphical
Representation of Max Read Distance
Illustration 6: Graphical
Representation of Max Lateral Offset

Lateral Offset
The second geometric criteria relates to how close to the central axis of the tag the reader must be to
generate a correct read. To perform this test the reader will be place at the middle distance of the
acceptable read distances from the test above, aligned on an axis centered and perpendicular to the tag.
With the reader still aligned along the same axis, it will be shifted parallel to the axis in 3 cm
increments. At each interval three readings will be taken and recorded. The test will end when the
reader fails to record the tag for all three readings.
Angular Deflection
The third geometric criteria relates to how much the reader can be
deflected from the central axis of the tag. To perform this test the
reader will again be place at the middle distance of the acceptable
read distances from the test above, aligned on an axis centered
and perpendicular to the tag. With the reader still sitting the same
axis, it will be rotated off of the axis in 2 degree increments. At
each interval three readings will be taken and recorded. The test
will end when the reader fails to record the tag for all three
readings.
6.2. Environmental Parameters for Testing Hardware
The Lab Animal Resources facility presents a challenging environment for wireless data transmission.
Much of the laboratory equipment, such as the cages, and the tag holders, are constructed out of metal.
This presents challenges for any form a radio transmission since the metal will absorb and conduct
radio waves, attenuating the signal strength that reaches the tags. The three tests of geometric criteria
described above will be performed for each of the environmental conditions described below. These
will be done to characterize the effects of these environmental conditions before the final system is
deployed. Each of the different factors will be addressed, then in the collective one at a time in order to
quantify the individual effects as well as the cumulative effects of the environmental factors.
Neutral Test to Compare to Specs
The first test is to establish a baseline for comparison with the other tests, and to assess the
performance relative to the advertised specs. This will consist of operating the RFID tag and reader
under controlled conditions, in the absence of any metal object that could present interference or
attenuation. The three geometric parameters will be tested as described above. Units will be compared
to their advertized specifications as well as establishing a baseline for comparison.
23
Illustration 8: Graphical
Representation of Max Angular
Deflection

Attenuation Due to Tag Placed on Metal Shelf
Once a baseline has been established, the tag will be attached to a non-conducting material, such as an
index card, and placed on a metal shelf similar to the shelves in the LAR facility. The geometric
parameters will be tested and compared to the baseline.
Attenuation Due to Tag Placed on Wire Cage
The next comparison test will consist of placing the RFID tag on one of the wire animal cages and
measuring the geometric parameters. Because of the grate structure of cages, we expected the
individual attenuation due to the cages to differ from that due to the shelves.
Attenuation Due to Tag Placed on Cage Card in Holder
In the facility, the RFID tags will be placed on cards in a metal card holder. This, therefore, is also
expected to attenuate the performance of the RFID system. This test will measure the effect of placing
the tags in the card holders, attached to the cage.
Attenuation of Tag on Cage Card in Holder, Separated by Foam Tape
One possible mitigation for attenuation would be to insulate the card holders from the cage by attaching
them with foam tape. This test will be identical to the test immediately preceding this, except that the
RFID will be separated from the card by a layer of foam tape, providing it some offset from the cage
card holder.
6.3. Criteria For Successful Hardware Tests
For each testing increment, three reads will be attempted. A successful test would consist of two or
more successful read attempts. Less than two successful reads would be deemed a failure. However, for
completeness, each testing protocol will be continued until there are zero successful read attempts. A
successful testing strategy will result in characterization results, with high confidence interval, and
performance within the requirements.
6.4. Software Planned Testing Strategy
Since the software must be customized for the selected set of hardware, a software testing plan cannot
be fully developed at this time. Once the hardware has been successfully tested and selected, a software
testing plan will be developed with assistance from Justin Fritzler, and input from the LAR staff.
24

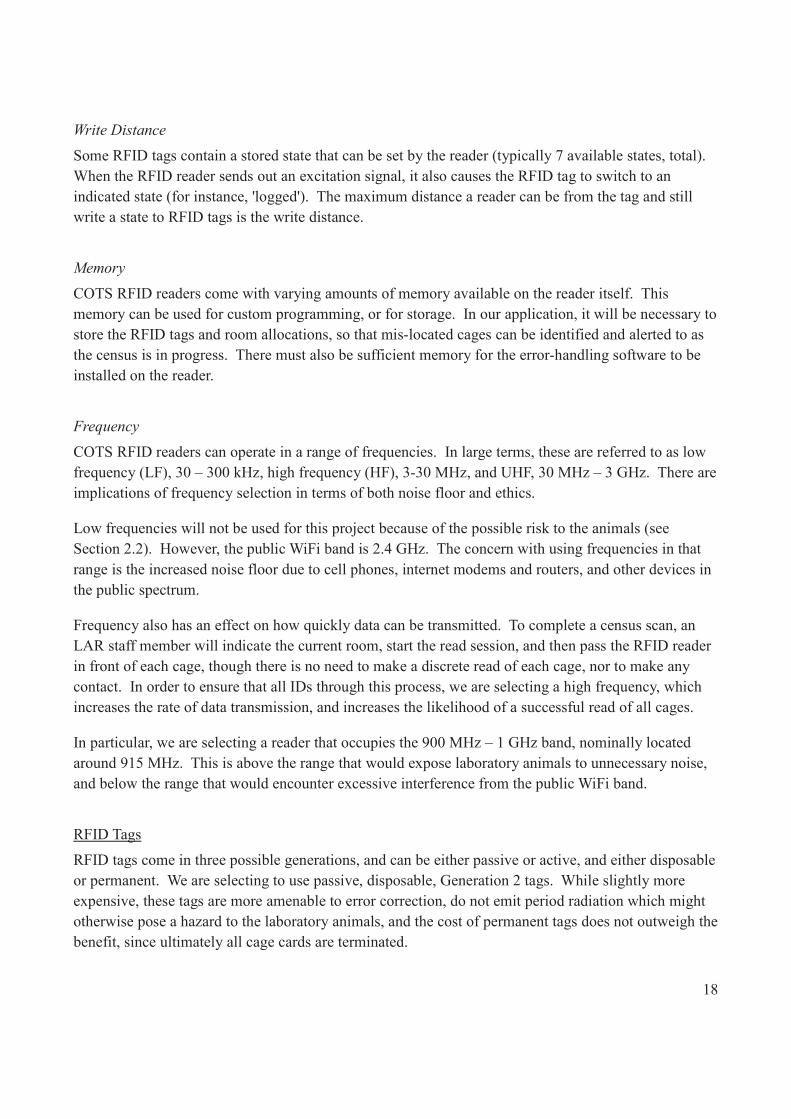
7. Future Work
Our scheduled plan for integration and testing of phase 1 is as follows:
Dec 10, 2012 to Jan 3, 2013
Test: Cage Card Scan Function
Develop preliminary I/O software
Jan 3, 2013 to Feb 1, 2013
Test: Comparison to Database, Multiple Cards
Develop Software Package (will be ongoing)
Demo: census capture [01/31/2013]
Mar 1, 2013 to May 1, 2013
Integration
Proof of Concept Delivery [05/01/2013]
Subsequent phases will continue beyond May 2013, but have not yet been scheduled due to expected
fluctuations in the team membership, and dependencies on the testing and validation results.
8. Conclusion
This is a complex project, but the research so far indicates a promising outcome. The requirements are
moderate enough, with respect to the current state of the art, that they are likely to be achievable. It
will be challenging to design a mechanism for overcoming attenuation, as the effect of all the metal
equipment is expected to be quite extreme, but a rigorous testing schedule and thorough
characterization will contribute to the success of such an effort.
In continuing next semester, this project is likely to deliver proof of concept, demonstrating a design
that meets requirements, addresses the needs of the client, and reduces the cost of implementing such a
system by 60%.
25

9. References
1. A. Kossiakoff and W. N. Sweet, “Systems Engineering and the World of Modem Systems,” in
Systems Engineering Principles and Practice, Hoboken, New Jersey: Wiley, 2003, ch.1
2. Guide for the Care and Use of Laboratory Animals, 8th ed., National Research Council of The
National Academies, Washington, D.C., 2011
3. H. E. Heffner and R. S. Heffner, “Hearing Ranges of Laboratory Animals,” JAALAS, Memphis, TN,
2007
4. Lab Animal Resources, Colorado State University [Online]. Available:
http://web.research.colostate.edu/LAR/
5. UHF Gen-2 System Overview, Texas Instruments, September 2005.
6. Understanding Gen 2: What It Is, How You Will Benefit And Criteria For Vendor Assessment,
Symbol Technologies, Motorola, May 2007.
26

10. Appendix A: Abbreviations
COTS – Commercial off-the-Shelf
CSU – Colorado State University
EPC – Electronic Product Code
Gen2 – Generation 2 (type of passive RFID tag)
HF – High Frequency
HW – Hardware
ID – Identification
IEEE – Institute of Electrical and Electronics Engineers
I/O – Input/output
IP – Internet Protocol
ISO - International Organization for Standardization
LF – Low Frequency
LAR – Laboratory Animal Resources
NIH – National Institutes of Health
PI – Private Investigator (Client performing research on lab animals)
RF – Radio Frequency
RFID – Radio Frequency Identification
SW – Software
UHF – Ultra High Frequency
WIFI – Wireless Fidelity (Commonly known as Wireless Internet)
27

11. Appendix B: Budget
10.1 Funding
All funding will be provided by Laboratory Animal Resources. We have $200 from the CSU ECE
department to use for miscellaneous items as well. To be delivered in May 2013 is Proof of Concept.
For this we have agreed on a budget of $5000.
10.2 Cost - Proof of Concept:
Item Item Cost Quantity Total Estimated Cost
RFID Reader $4,000 1 $4,000
RFID Tags $0.50 400 $200
Database Development $300 1 $300
Check-Out Station $500 1 $500
Final Cost $5,000
For continuing years, a full system-wide deployment is required with an anticipated cost of around
$53,000.
10.3 Cost - Initial System Wide Deployment:
Item Item Cost Quantity Total Estimated Cost
Proof of Concept $5,000 1 $5,000
RFID Reader $4,000 10 $40,000
RFID Tags $0.50 5000 $2,500
Database Development $300 2 $600
Check-Out Station $500 2 $1,000
Final Cost $49,100
There will also be a monthly maintenance cost for new RFID tags. We estimate this cost to be:
Item Item Cost Quantity Total Estimated Cost
Proof of Concept $0.50 1000 $500
Total Maintenance Cost per Month $500
**These costs are not inclusive of internal costs to LAR, such as the labor cost for affixed new RFID tags. **
28

������������������
��
�������������������
��
�������� �����
����������
��
��� ��������
��
���� ��������������� ������
������
!�
���� ��"#��$������%��%
���
&�
������ ������� ���
'�
�(�)� �$$���
����������
*�
�����(������
������
�+
��(������� ��������
��
�����������������
��
�����������������
�'
�,�$�����%�)����"��(��
����������
�*
�������-����%���-��$���������)��
����������
�+
���(���%���.�������(�/��������
����������
��
� ����0�1���2����-�.���-�������.�������(�
����������
��
���������������
��
��#���1�����%���������������
����������
��
��3 "��34�.,�"4
��
��5�������� �$$����6��������
����������
�!
��������
�&
�(�)�� �$$�������������%��������2� �
����������
�'
��5�������� �$$����6��������
����������
�*
���������(������
����������
�+
����$
�����%��$$��%����%��%
/���)������
��
1�4.���3,3���4.,�"4
��
�,����%�0������$������
��
����������������
��
������������������
��
����� �� ��������!��������������
�!
�7%���81/�9����� ��������� ��(��#$��
�&
�/ ���������%�)�7�����%��,
���
�'
�/ ��������� ����)����� ���/�##���
������
�*
����$
����-����%����������� �
/���)������
�+
�� ���1��)����%��$���������� �
/���)������
4�$
����� �4�$�.�%
/#
" �
:����;��+��
4�(
�
<��
:����;��+��
12
���
.#�
:����;��+��
��-
<��
������
���
��
����
����
������
���
����
���� ������
���
����
������
���
������
���
������
���
�����
������
���
������
���
������
���
������
���
��� �
����
�����
����
����
����
�����������
�����������
3 3�+���6��#�%�

��
�(��#������� �
,7�
��
��#�����$��-�/���)���1��) ����
/���)������
��
����(����$��-�/���)���1��) ����
/���)������
��
�������-�/�2�������
����������
��
��(�)�/�2�������
/���)������
�!
�(��#�/�2�������1��) �����
����������
�&
����(��/�2�������1��) �����
�'
�.���%������� ������/�2�������0������/��� �����(��#$��
���
�*
/�2��������(��#$��
����������
�+
�"������ ���� ������������������/��� ���
/���)������
��
��(��#������������
/���)������
��
��(��#���
=���)������
��
"��������
���������
��
��#����������� ���1��)����%��$
����������
��
����(���������� ���1��)����%��$
�!
���$
����5�������������
=���)������
�&
�"������������
=���)������
�'
��#�������,������%������
=���)������
�*
,���=�9/��������
!+
#�������$�������%��������
!�
�������-����6��� �������3�$���
����������
!�
���%��/��������
����������
!�
�� ��#������(������
!�
��#���1�������(��2��
!�
������1�������(��2��
!!
��#�����%�����#���
!&
���%�����#���
!'
�� �� ����� ���1�� �����)>�/���)����(��#$��
!*
���-�������������/-��$
&+
��-��������/-��$�������(������
&�
�36��-��?��@
&�
����(��2������?��@
&�
�1������#�����?��@
&�
�����������$������%�&�����
&�
��(�����7��%��0�/ ����
4�$
����� �4�$�.�%
/#
" �
:����;��+��
4�(
�
<��
:����;��+��
12
���
.#�
:����;��+��
��-
<��
���
�����������
���� ������
���
����� ������
���
�����
����
������
���
����������� �����������
����������
������
���
�����
����������
����
����������
����
������
���
������
���
����
�� �
��
���
�� ���� ���
���
3 3�+���6��#�%�
&!
��(�����7��%��0�/ ����
&&
��(�����7��%��0�/ ����
&'
��(�����7��%��0�/ ����
&*
��(�����7����0�/ ����
'+
��(�����7��%��0�/ ����
'�
��(�����7��%��0�/ ����
'�
'���������$�����
4�$
����� �4�$�.�%
/#
" �
:����;��+��
4�(
�
<��
:����;��+��
12
���
.#�
:����;��+��
��-
<��
3 3�+���6��#�%�

������������������
��
�������������������
��
�������� �����
����������
��
��� ��������
��
���� ��������������� ������
������
!�
���� ��"#��$������%��%
���
&�
������ ������� ���
'�
�(�)� �$$���
����������
*�
�����(������
���
�+
��(������� ��������
��
�����������������
��
��,�����(��#$��
���
��
��,�����
������#
��
��,����%�����(
��
�����������������
�!
��#���-��%�������$
��������������%
.������%
�&
�-��%������%
/�$
�'
�/�$�����%�)����"��(��
/�$
�*
�������0����%���0��$���������)��
/�$
�+
���(���%���1�������(�2��������
/�$
��
� ����3�4���,����0�1���0�������1�������(�
/�$
��
�" ��,������%
/�$
��
��#���4�����%���������������
/�$
��
��5 "��56�1/�"6
/�$
��
��7�������� �$$����8��������
/�$
�!
��������
�&
�(�)�� �$$�������������%��������,� �
/�$
�'
��7�������� �$$����8��������
/�$
�*
���������(������
/�$
�+
����$
�����%��$$��%����%��%
5�%�,��84����
��
4�61���5/5���61/�"6
/�$
��
�/����%�3������$������
/�$
��
����������������
��
������������ ���������������
��
����� �� ��������!��������������
�!
�-%���942�:����� ��������� ��(��#$��
/�$
�&
����$
����0����%����������� �
/�$
6�$
����� �6�$�
12
"6
�;<�����=��+��
4�
1�
;;<�����=��+��
12
"6
�;<�����=��+��
4
���������
��
����
����
���������
����
����
����
��� ����
����������
���
���
����
���
���
���
���
�����
���
���
���
���
��� �
����
�����
�� ���
5 5�+���8��#�%�

�'
�� ���4��)����%��$���������� �
/�$
�*
�(��#������� �
/�$
�+
"������������!
��#����
��
��#����������� ���4��)����%��$
/�$
��
����(���������� ���4��)����%��$
/�$
��
���%����������������
/�$
��
�"������������
/�$
��
�2�$�����������2��%�8 �%����
/�$
�!
�2�$������������� �����8���
/�$
�&
�2�$������������
����#�� �����)������ �����
/�$
�'
�$�������"�������%����������� "�������
��
����(�0�8�����"�
/�$
��
"����$&������!
��������
��
��#�����$��0�2���)���4��) ����
/�$
��
����(����$��0�2���)���4��) ����
/�$
�!
�������0�2�,�������
/�$
�&
��(�)�2�,�������
.������%
�'
�(��#�2�,�������4��) �����
/�$
�*
����(��2�,�������4��) �����
/�$
!+
�1���%������� ������2�,�������3������2��� �����(��#$��
5�%�,��84����
!�
2�,��������(��#$��
/�$
!�
�"������ ���� ������������������2��� ���
5�%�,��84����
!�
��(��#������������
/�$
!�
��(��#���
/�$
!�
�$�������"�������%����������� "����$&�
!*
����(�0�8�����/)�
/�$
&+
"����$"�����������!����������
&�
� ����>����������,��������$
������������$�������
/�$
&�
��(��#�����0����%�������������
/�$
&�
�$�������"�������%����������� "����$"���
&&
����(�0�8�����/)�
/�$
&'
������$&�����#���������#����
&*
2��%�/)���(��#$��
'+
2��%�/)��/���,��������%�3��(�����
'�
��#���4�������(��,��
/�$
'�
������4�������(��,��
/�$
'�
��#�����%�����#���
/�$
6�$
����� �6�$�
12
"6
�;<�����=��+��
4�
1�
;;<�����=��+��
12
"6
�;<�����=��+��
4
��� ���
���
�����
���
�����
���
��� ��� �� �
���
���
���
��� ���
���
�������������� �
���
�������������� �
���
���
���
��� ���
����
���
���
���
5 5�+���8��#�%�

'�
���%�����#���
/�$
'�
�� �� ����� ���4�� �����)?�2���)����(��#$��
/�$
'!
���0�������������20��$
/�$
'&
��0��������20��$�������(������
/�$
''
�58��0��@��A
/�$
'*
����(��,������@��A
/�$
*+
�4������#�����@��A
/�$
*�
�����������"������%�'�����
*�
��(�����-��%��3�2 ����
/�$
*�
��(�����-��%��3�2 ����
/�$
*�
��(�����-��%��3�2 ����
/�$
*�
��(�����-��%��3�2 ����
/�$
*!
��(�����-����3�2 ����
/�$
*&
��(�����-��%��3�2 ����
/�$
*'
��(�����-��%��3�2 ����
/�$
**
(���������"�����
6�$
����� �6�$�
12
"6
�;<�����=��+��
4�
1�
;;<�����=��+��
12
"6
�;<�����=��+��
4
�� �
���
���
!���
����
����
���
��� ��� ��� ���
��� ��� ���
5 5�+���8��#�%�


![BYPASS SERIES GLOBAL STANDARD COOLER AY · 2018-07-13 · AY12 AY16 AY25 AY35 AY45 AY60 P/ETD [kW/K] Ölvolumenstrom [l/min] AY25 40 80 160 320 AY12 AY16 AY25 AY35 AY45 AY60 P/ETD](https://static.fdocuments.in/doc/165x107/5f85c404e43e3a109e1cda7b/bypass-series-global-standard-cooler-ay-2018-07-13-ay12-ay16-ay25-ay35-ay45-ay60.jpg)