
Applications of mass spectrometry in natural product drug ...
137
Applications of mass spectrometry in natural product drug discovery for malaria: Targeting Plasmodium falciparum thioredoxin reductase by Ranjith K. Munigunti A dissertation submitted to the Graduate Faculty of Auburn University in partial fulfillment of the requirements for the Degree of Doctor of Philosophy Auburn, Alabama May 5, 2013 Keywords: Chromatography, mass spectrometry, malaria, Plasmodium falciparum, thioredoxin reductase, thioredoxin Copyright 2013 by Ranjith K. Munigunti Approved by Angela I. Calderón, Chair, Assistant Professor of Pharmacal Sciences C. Randall Clark, Professor of Pharmacal Sciences Jack DeRuiter, Professor of Pharmacal Sciences Forrest Smith, Associate Professor of Pharmacal Sciences Orlando Acevedo, Associate Professor of Chemistry and Biochemistry
Transcript of Applications of mass spectrometry in natural product drug ...

Applications of mass spectrometry in natural product drug discovery for malaria:
Targeting Plasmodium falciparum thioredoxin reductase
by
Ranjith K. Munigunti
A dissertation submitted to the Graduate Faculty of
Auburn University
in partial fulfillment of the
requirements for the Degree of
Doctor of Philosophy
Auburn, Alabama
May 5, 2013
Keywords: Chromatography, mass spectrometry, malaria,
Plasmodium falciparum, thioredoxin reductase, thioredoxin
Copyright 2013 by Ranjith K. Munigunti
Approved by
Angela I. Calderón, Chair, Assistant Professor of Pharmacal Sciences
C. Randall Clark, Professor of Pharmacal Sciences
Jack DeRuiter, Professor of Pharmacal Sciences
Forrest Smith, Associate Professor of Pharmacal Sciences
Orlando Acevedo, Associate Professor of Chemistry and Biochemistry

ii
Abstract
Malaria is considered to be the dominant cause of death in low income countries
especially in Africa. Malaria caused by Plasmodium falciparum is a most lethal form of the
disease because of its rapid spread and the development of drug resistance. The main problem in
the treatment of malaria is the emergence of drug resistant malaria parasites. Over the
years/decades, natural products have been used for the treatment or prevention of number of
diseases. They can serve as compounds of interest both in their natural form and as templates for
synthetic modification. Nature has provided a wide variety of compounds that inspired the
development of potential therapeutics such as quinine, artemisinin and lapachol as antimalarial
agents. As the resistance to known antimalarials is increasing, there is a need to expand the
antimalarial drug discovery efforts for new classes of molecules to combat malaria. This research
work focuses on the applications of ultrafiltration, mass spectrometry and molecular modeling
based approaches to identify inhibitors of Plasmodium falciparum thioredoxin reductase
(PfTrxR), our main target and Plasmodium falciparum glutathione reductase (PfGR) as an
alternative target for malaria drug discovery.
In our first approach, we used an ultrafiltration and liquid chromatography mass
spectrometry based approach to screen one hundred and thirty three structurally diverse natural
compounds to determine their binding affinity towards PfTrxR. Along with the set of natural
products, different plant extracts were also subject to binding experiments to identify ligands of

iii
PfTrxR followed by identification and structure elucidation of identified ligands using mass
spectrometry.
In our second approach, we had developed an LC-MS based functional assay to identify
inhibitors of PfTrxR by quantifying the reduced thioredoxin (Trx–(SH)2), the product formed in
the enzymatic reaction. Thioredoxin is a 11.7 kDa protein. To validate the developed functional
assay we have screened reference compounds 2,4-dinitrophenyl sulfide (2,4-DNPS), 4-
nitrobenzothiadiazole (4-NBT) and 3-(dimethylamino)-propiophenone (3-DAP) for their PfTrxR
inhibitory activity and ten natural compounds (at 10 mM) which were earlier identified as ligands
of PfTrxR by a UF-LC-MS based binding assay.
In the third approach, our goal was to identify natural products which can selectively
target Plasmodium falciparum thioredoxin reductase (PfTrxR), Plasmodium falciparum
glutathione reductase (PfGR) enzymes of the parasite distinct from the host enzymes. In our
study, the binding affinities of natural products towards PfTrxR, PfGR, human TrxR and human
GR were determined using a mass spectrometry based ligand binding assay. The in vitro
antimalarial activity (IC50) and cytotoxicity of these ligands were also determined. In silico
molecular modeling was used to ascertain and further confirm the binding affinities and key
interactions of these ligands towards PfTrxR, PfGR and human isoforms of these enzymes.

iv
Acknowledgements
Firstly I want to praise and extend my thanks to God, Sai Baba for giving me strength,
patience, knowledge, oppurtunities whenever needed and for guiding me through struggles to
accomplish my tasks. I would like to dedicate my work to my parents, my brothers Ashok,
Praveen and to Mr & Mrs. Pendyala Ravinder Reddy. It is because of their unconditional love,
care, motivation and moral support; I have been able to quench my desire for higher studies.
I express my sincere gratitude to my advisor Dr. Angela Calderón, for giving me
opportunity, for guiding and motivating me in accomplishing my research goals successfully. I
am glad to be her first PhD student. I am especially indebted to my thesis committee members
Professor Randall Clark for his support, guidance and lectures on chromatography and mass
spectrometry which are invaluable, Professor Jack DeRuiter for helping me understand drug
designing through his DAD courses and Dr. Forrest Smith for his outstanding lectures in organic
synthesis enabled me to have strong background in synthesis which helps to pursue my career in
medicinal chemistry. Thanks to the committee members for their insightful comments, hard
questions and encouragement.
I want to thank Dr. Katja Becker from the Justus-Liebig University, Germany for supplying
the two enzymes PfTrxR and PfGR and for testing compounds for PfGR inhibitory activity. I am
greatful to all my collaborators Dr. Babu Tekwani from National Natural Products Research
Center from the University of Mississippi, and Dr. Reto Brun from Swiss Tropical Institute of

v
Hygiene, Switzerland for carrying out the antimalarial and cytotoxicity assays of my compounds
and their support to carry out my work and valuable scientific inputs to accomplish my research
successfully. I would like to thank Dr. Orlando Acevedo from the department of Chemistry and
Biochemistry from Auburn University for helping us with the docking studies and for accepting
to serve as an outside reader for my dissertation. My special thanks to Dr. Carol Honey Ball,
Agilent Technologies, for excellent technical assistance for intact protein analysis. I want to
thank Dr. Mahabir P. Gupta for supplying the plant extracts studied in this work. I am thankful to
Dr. G. V. Subbaraju, AptuitLauras, Hyderabad, India for providing us the three hispolone
analogs. Thanks are also due to Symon Gathiaka, a graduate student from Dr. Acevedo’s lab for
carrying out the docking studies and corresponding data analysis. I would like to thank Dr.
Yonnie Wu, director of MS facility at the department of chemistry and biochemistry for his
valuable technical inputs on LC-MS applications.
The work was supported by start-up funding from Harrison School of Pharmacy and a
Research Starter Grant from the American Society of Pharmacognosy to Dr. A. I. Calderón. I
am also greatful to the Department of Pharmacal Sciences for providing me graduate
assistantship which helped me to carry out my studies at Auburn University.
I am greatful also to Dr. Jayachandra Babu, Dr. Daniel Parsons, Dr. Vishnu
Suppiramaniam, Dr. Murali Dhanasekaran and Dr. Rajesh Amin for extending timely help,
support and guidance throughout my stay in the department.
I want to thank my lab members Dr. Vanisree Mulabagal, Johayra Simithy Williams, Cole
Sterling, Nathan Reeve, Neil Tiwari, Mary Smith for their assistance and creating joyful
environment in the laboratory. My time in Department of Pharmacal Sciences was made

vi
enjoyable due to colleagues Dr. Sheriff Hammad, Dr. Karim Hafiz, Gayani, Kariharan, Kasturi,
Manuj Ahuja, Wanshu Ma and faculty and staff.
My sincere thanks to Dr. Vanisree Mulabagal for her support, guidance and insights in
research during my PhD. Her enthusiasm and love for research are admirable. My special thanks
to Mr & Mrs. Ravi Satya, Mr & Mrs Dr. Sateesh Sathigari for their moral support,
encouragement and for memorable and joyful moments we had during my stay in Auburn.
I want to extend my thanks and regards to all my friends Dr. Ramesh Pallapolu, Dr. Susilpa
Bommareddy, Dr. Divya Repala, Nataraju Gokeda, Manuj Ahuja and Kavitha for making my
stay in Auburn memorable, joyful and comfortable.
I would like to thank my dear friends Praveen Alugoju, Dilip Bandi, Shilpa Vootla, Kiran
Kanukuntla, Dr. Preethi Vennam, Dr. Sateesh Sathigari, Ravi Satya for their unconditional love,
support and encouragement.
Last but not the least, I want to thank my dearest wife Srujana, who never stopped believing
in me, for her love, continuous support and patience without which I would not have
accomplished this task.

vii
Table of Contents
Abstract ...................................................................................................................................... iii
Acknowledgements .................................................................................................................... iv
List of Abbreviations ................................................................................................................ xiv
1. Literature review ......................................................................................................................1
1.1 Introduction ....................................................................................................................... 1
1.2 Plasmodium falciparum thioredoxin reductase and glutathione reductase ....................... 4
1.3 Rapid resolution liquid chromatography ........................................................................... 8
1.4 Quadrupole time of flight mass spectrometry ................................................................. 11
1.5 Electrospray ionization .................................................................................................... 14
1.6 Project rationale ............................................................................................................... 18
1.7 Objectives of Research .................................................................................................... 19
1.8 References ....................................................................................................................... 22
2. Screening of natural compounds for ligands to PfTrxR by ultrafiltration and LC-MS based
binding assay ............................................................................................................................. 26
2.1 Abstract ............................................................................................................................ 26
2.2 Introduction ..................................................................................................................... 26
2.2.1 PfTrxR and PfGR enzymes binding assay using ultrafiltration (UF) and liquid
chromatography mass spectrometry ...................................................................................... 27
2.3 Materials and methods ..................................................................................................... 29
2.3.1 Chemicals and enzymes ................................................................................................ 29
2.3.2 UF-LC-MS binding assay ............................................................................................. 30
viii
2.3.3 LC-MS analysis ............................................................................................................ 30
2.3.3.1 LC-MS analysis of ligands 1, 2, 3, 5, 6, 7, 8 and 9 in equimolar mixture of 1 µM .. 31
2.4 Results and Discussion .................................................................................................... 39
2.5 Conclusions ..................................................................................................................... 45
2.6 References ....................................................................................................................... 46
3. LC-MS based identification and structure elucidation of oleamide as a ligand of
Plasmodium falciparum thioredoxin reductase in Guatteria recurvisepala ............................. 49
3.1 Abstract ............................................................................................................................ 49
3.2 Introduction ..................................................................................................................... 50
3.2.1 Mass spectrometry for identification and structure elucidation of natural products .... 51
3.2.2 Dereplication of natural products by mass spectrometry ............................................. 53
3.3 Materials and Methods .................................................................................................... 55
3.3.1 Chemicals and enzymes ................................................................................................ 55
3.3.2 Plant material ................................................................................................................ 56
3.3.3 Extraction and isolation ................................................................................................ 57
3.4 Antiplasmodial assays ..................................................................................................... 57
3.4.1 Antiplasmodial screening of plant extracts .................................................................. 57
3.4.2 Antiplasmodial activity and IC50 value of oleamide .................................................... 58
3.5 PfTrxR enzyme binding assay using ultrafiltration (UF) and LC-MS ............................ 58
3.6 LC-MS and tandem MS analysis .................................................................................... 59
3.7 Results and Discussion .................................................................................................... 60
3.8 Conclusions ..................................................................................................................... 63
3.9 References ....................................................................................................................... 64
4. Development of liquid chromatography/mass spectrometry based screening assay for
PfTrxR inhibitors using relative quantitation of intact thioredoxin. ......................................... 67
4.1 Abstract ............................................................................................................................ 67

ix
4.2 Introduction ..................................................................................................................... 68
4.2.1 Role of mass spectrometry for detection of enzyme inhibition .................................... 69
4.2.2 Identification and quantitation of intact proteins .......................................................... 72
4.3 Experimental .................................................................................................................... 73
4.3.1 Chemicals and reagents ................................................................................................ 73
4.3.2 Functional assay ........................................................................................................... 74
4.3.3 Sample preparation ....................................................................................................... 75
4.3.4 Trx–(SH)2 calibration curve ......................................................................................... 75
4.3.5 LC-MS analysis of intact thioredoxin .......................................................................... 76
4.3.6 Data Analysis ................................................................................................................ 76
4.4 Results and Discussion .................................................................................................... 80
4.5 Conclusions ..................................................................................................................... 84
4.6 References ....................................................................................................................... 85
5. Characterization of PfTrxR inhibitors using mass spectrometry and in silico molecular
modeling .................................................................................................................................... 88
5.1 Abstract ............................................................................................................................ 88
5.2 Introduction ..................................................................................................................... 89
5.2.1 Selective tools for identifying inhibitors of PfTrxR and PfGR .................................... 90
5.2.2 Key differences in active sites between parasite and human enzymes ......................... 91
5.3 Materials and Methods .................................................................................................... 94
5.3.1 Chemicals and enzymes ................................................................................................ 94
5.3.2 Protocols of experiments .............................................................................................. 95
5.3.2.1. PfTrxR enzyme binding assay using ultrafiltration and liquid chromatography-mass
spectrometry .......................................................................................................................... 95
5.3.2.2. LC-MS based PfTrxR functional assay .................................................................... 95

x
5.3.2.3. Antiplasmodial activity and cytotoxicity against L6 cells of tested natural
products ................................................................................................................................. 96
5.3.2.4. Assays for in vitro antimalarial activity and cytotoxicity of known PfTrxR
inhibitors ................................................................................................................................ 97
5.3.2.5 ROS assay .................................................................................................................. 98
5.3.2.6 Computational methods ............................................................................................ 99
5.3.2.7 AutoDockVina details .............................................................................................. 99
5.4. Results and Discussion ................................................................................................. 100
5.4.1. Evaluation of known inhibitors of PfTrxR ................................................................ 100
5.4.2 Evaluation of natural products as inhibitors of PfTrxR and PfGR ............................. 107
5.4.2.1 Curcumin and demethoxycurcumin (DMC) ............................................................ 107
5.4.2.2 Subset of PfTrxR natural product ligands ............................................................... 111
5.5 Conclusions ................................................................................................................... 114
5.7 References ..................................................................................................................... 115

xi
List of Figures
Figure 1.1 Development of leads from natural products. .............................................................. 4
Figure 1.2 A general scheme showing the various biochemical processes of antioxidant defense
in Plasmodium falciparum............................................................................................................................6
Figure 1.3 van Deemter plot, illustrating the evolution of particle sizes over the last three
decades. ......................................................................................................................................... 10
Figure 1.4 Schematic diagram of the tandem QqTOF mass spectrometer. ................................. 14
Figure 1.5 Schematic of the electrospray ionization process and the general MS instrument. ... 16
Figure 1.6 Droplet production in the electrospray interface. ....................................................... 17
Figure 2.1 Structures of active compounds screened for PfTrxR. ............................................... 40
Figure 2.2 UF and LC-MS screening of equimolar mixture of compounds1, 2, 3, 5, 6, 7, 8 and
9 incubated with 1 µM PfTrxR. .................................................................................................... 44
Figure 3.1 Representation of the CID process in tandem mass spectrometry (MS/MS) ............. 53
Figure 3.2 UF-LC-MS based binding experiment of Guatteria recurvisepala plant
extract incubated with 1 µM PfTrxR ............................................................................................ 61
Figure 3.3 MS and MS/MS analysis of oleamide in plant extract and standard
oleamide. ....................................................................................................................................... 62
Figure 4.1 The principles of MS-based screening. ...................................................................... 71
Figure 4.2 Structures of reference compounds 1, 2 and 3 ............................................................ 74
Figure 4.3 Calibration curve of intact Trx (SH)2. ....................................................................... 75
Figure 4.4 LC-MS analysis of thioredoxin. ................................................................................. 77

xii
Figure 4.5 Deconvoluted MS spectra of Trx–(SH)2. ................................................................... 78
Figure 4.6 Dose response curves of compounds 1, 2, 3 and 4 tested at 0.5 µM PfTrxR. ............ 79
Figure 5.1 Superposition of hTrxR with PfTrxR. ........................................................................ 91
Figure 5.2 PfTrxR in comparison with hTrxR. ........................................................................... 92
Figure 5.3 Molecular surfaces of the PfTrxR and hTrxR cavities. .............................................. 92
Figure 5.4 Superposition of hGR with PfGR. .............................................................................. 93
Figure 5.5 The dimer cavity of hGR. ........................................................................................... 93
Figure 5.6 Molecular surfaces of the PfGR and hGR cavities. .................................................... 93
Figure 5.7 hGR inhibitors xanthene and pyocyanin docked and compared to the experimental
crystal structures. ........................................................................................................................ 100
Figure 5.8 Structures of five known inhibitors of PfTrxR. ........................................................ 101
Figure 5.9 Formation of reactive oxygen species (ROS), as indicated by increase in
fluorescence ................................................................................................................................ 102
Figure 5.10 PfTrxR/MD, PfTrxR/4-NBT, and PfTrxR/2, 4-DNPS complexes. ....................... 106
Figure 5.11 The docking pose differences of 2, 4-DNPS and 4-NBT between the Pf- and
h-TrxR. ........................................................................................................................................ 107
Figure 5.12 PfTrxR/DMC and –Curcumin complexes. ............................................................. 109
Figure 5.13 Structures of curcumin and demethoxycurcumin (DMC) ...................................... 110
Figure 5.14 The interactions between DMC and Curcumin with PfTrxR ................................. 110

xiii
List of Tables
Table 2.1 List of one hundred and thirty-three natural products from Analyticon Discovery
library tested for binding to PfTrxR.............................................................................................. 32
Table 2.2 LC-MS conditions for detection of the one hundred and thirty-three natural
products ......................................................................................................................................... 37
Table 2.3 Relative binding affinities for ligands 1-10 tested UF-LC-MS screening against
PfTrxR........................................................................................................................................... 41
Table 3.1 Taxonomic information on the studied plants. ............................................................ 56
Table 4.1 IC50 values of compounds tested in duplicates and injected in triplicates........ 79
Table 4.2 2 time course study in control experiments tested in duplicates and injected
in triplicates. .................................................................................................................................. 83
Table 5.1 Antiplasmodial activity and inhibition of PfTrxR by known inhibitors ................... 104
Table 5.2 Comparison between computed binding affinities (kcal/mol) at the dimer interface in
PfTrxR and experimental IC50 values (µM). .............................................................................. 104
Table 5.3 Comparison between computed binding affinities (kcal/mol) at the dimer interface
and experimental IC50 values (µM) selectivity values in PfTrxR and hTrxR. ........................... 106
Table 5.4 Antiplasmodial activity and inhibition of PfTrxR by curcuminoids ......................... 108
Table 5.5 Comparison between predicted binding affinities and experimental IC50 values
of curcuminoids. ......................................................................................................................... 111
Table 5.6 UF-LC-MS based binding affinities of natural products for PfTrxR and PfGR ....... 113
Table 5.7 PfTrxR and PfGR inhibitory and antiplasmodial activities by selected natural
products ....................................................................................................................................... 114
xiv
List of Abbreviations
μL Micro liter
μM Micromolar
μg Microgram
°C Degree centigrade
DNPS Dinitorphenyl sulfide
DMC Demethoxycurcumin
Da Dalton
DAP Dimethylamino propionic acid
ESI Electrospray ionization
FA Formic acid
GR Glutathione reductase
LC Liquid chromatography
LC-MS Liquid chromatography- mass spectrometry
m Meter
min Minute
mL Milliliter

xv
MD Menadione
MS Mass spectrometry
NQ Naphthaquinone
NBT Nitrobenzothiadiazole
ppm Part per million
Pf Plasmodium falciparum
QTOF Quadrupole time of flight mass spectrometry
RT Room temperature
ROS Reactive oxygen species
RRLC Rapid resolution liquid chromatography
TrxR Thioredoxin reductase
TOF Time of flight
UF Ultrafiltration

xvi

1
1. Literature review
1.1 Introduction
Malaria affected 219 million people worldwide, causing an estimated 6.6 million deaths in
2010. Ninety percent of these deaths occur in sub-Saharan Africa, mostly among children
younger than age five [1]. Malaria is endemic to over 100 nations and territories in Africa, Asia,
Latin America, the Middle East, and the South Pacific. It is caused by a parasite that is
transferred by the bite of an infected Anopheles mosquito. Plasmodium falciparum is by far the
deadliest of the four human malarial species (Plasmodium falciparum, malariae, ovale, and
vivax) [2]. In addition to being the deadliest form of malaria, P. falciparum destroys red blood
cells, which can cause acute anemia. Also adherence to cells in certain tissues may cause
problems within those organs, such as the lungs, kidneys and brain. A major complication of P.
falciparum, cerebral malaria, can lead to coma, transient or permanent neurological effects, and
death [3]. With no immediate prospect of a vaccine against the disease, drugs are the only choice
for therapy. Quinine, an aminoquinoline alkaloid isolated from the bark of Cinchona species
(Rubiaceae) in 1820 by Pelletier and Caventou, is one of the oldest and most important
antimalarial drugs and is still used today. For almost three centuries, this alkaloid was the sole
active principle effective against Plasmodium falciparum, and it has been considered the
prototype, after the Second World War, for the development of synthetic antimalarial drugs

2
belonging to the classes of 4- and 8-aminoquinolines, such as chloroquine (CQ) in 1940 and
primaquine in 1952, among others. Until recently, chloroquine was the only synthetic drug used
for the treatment of malaria [4]. Artemisinin (ART) also known as qinghaosu is an endoperoxide
sesquiterpene lactone. It was isolated from the leaves of Artemisia annua L. (Asteraceae), a plant
species that has been used traditionally in China for treatment of fever for several millennia [5].
The discovery and use of ART has been a valuable addition for the treatment of malaria. Many
derivatives of ART such as artemether, arteether, dihydroartemisinin, artesunate, artemisone and
artelinate were prepared with improved antimalarial properties, killing CQ and Sulfadoxin-
Pyrimethamine-resistant parasites. ART has a disadvantage that it has poor pharmacokinetic
properties including short half-life which necessitated the use of ART for seven days resulting in
poor compliance. Therefore artemisinin-based combination therapies (ACTs) such as artemether-
lumifantrine (Coartem), artesunate-mefloquine, artesunate-amodiaquine and artesunate-
sulfadoxine/pyrimethamine have been developed as the front line treatment for malaria disease
[6]. The main challenge to the effective management of diagnosed malaria cases has been, and
continues to be, the development of resistance by the causative microorganisms to known
antimalarials. Disease condition is alarming due to acquired resistance in the parasite against
antimalarial drugs in the circulation. Resistance can be prevented, or its onset slowed
considerably, by combining antimalarials with different mechanisms of action and ensuring very
high cure rates through full adherence to correct dose regimens [7]. The disadvantages of this
combination are its cost, adverse drug reactions and pharmacokinetic interactions of each drug. It
has been found that the parasite has also developed resistance for ACTs, the current
chemotherapy for malaria. As the resistance to known antimalarials is increasing, there is a need
to expand the antimalarial drug discovery efforts for new classes of molecules to combat malaria.

3
The current demand for new pharmacophores and novel molecular targets to tackle emerging
resistance to antimalarials has stimulated new interest in natural product drug discovery. Natural
products represent a source of potential new pharmacophores that are needed for killing the
parasite.
Medicinal plants represent an extremely rich source of potential antimalarial agents, with
the antimalarial drugs quinine and artemisinin being outstanding examples of therapeutic natural
products. The diversity of chemicals found in nature continues to be an important source of
molecular templates in the search for novel antimalarial drugs [8]. Natural products can be
viewed as an inexhaustible reservoir of molecules that can be optimized to be efficient, well
tolerated, and safe to use as antimalarial drugs. Even though plant-derived natural products are
used as traditional herbal remedies, most of them have not been explored for the discovery of
new targets for malaria parasite [9]. For this reason, more research on new antimalarial
compounds from natural products is needed to develop new therapeutic agents with novel
mechanisms of action against Plasmodium falciparum.
However, it is noteworthy that most antimalarial compounds isolated from natural
sources are usually only moderately active, or possess challenging physicochemical and
biological properties, and as such represent ‘hits’ rather than actual lead drug candidates [Figure
1.1]. Plant extracts contain large numbers of different chemical constituents making it difficult to
ascertain their antimalarial activity before isolation of the bioactive compounds. The
conventional approach to natural product development has been the bioassay-guided
fractionation of extracts derived from such material, and the subsequent isolation and
characterization of pure, active compounds. A suitable tool to speed up natural product drug
discovery is the application of UF-LC-MS based binding assays [10] to screen complex mixtures

4
from plant origins for their binding affinity towards Plasmodium falciparum thioredoxin
reductase (PfTrxR) followed by MS based structure elucidation and confirmation of the identity
of new ligands.
Figure 1.1 Development of leads from natural products [7].
1. 2 Plasmodium falciparum thioredoxin reductase and glutathione reductase
Malaria infection with P. falciparum leads to increased oxidative stress in red blood cells.
This is caused by exogenous reactive oxidant species (ROS) and reactive nitrogen species (RNS)
produced by the immune system of the host, and by endogenous production of ROS generated
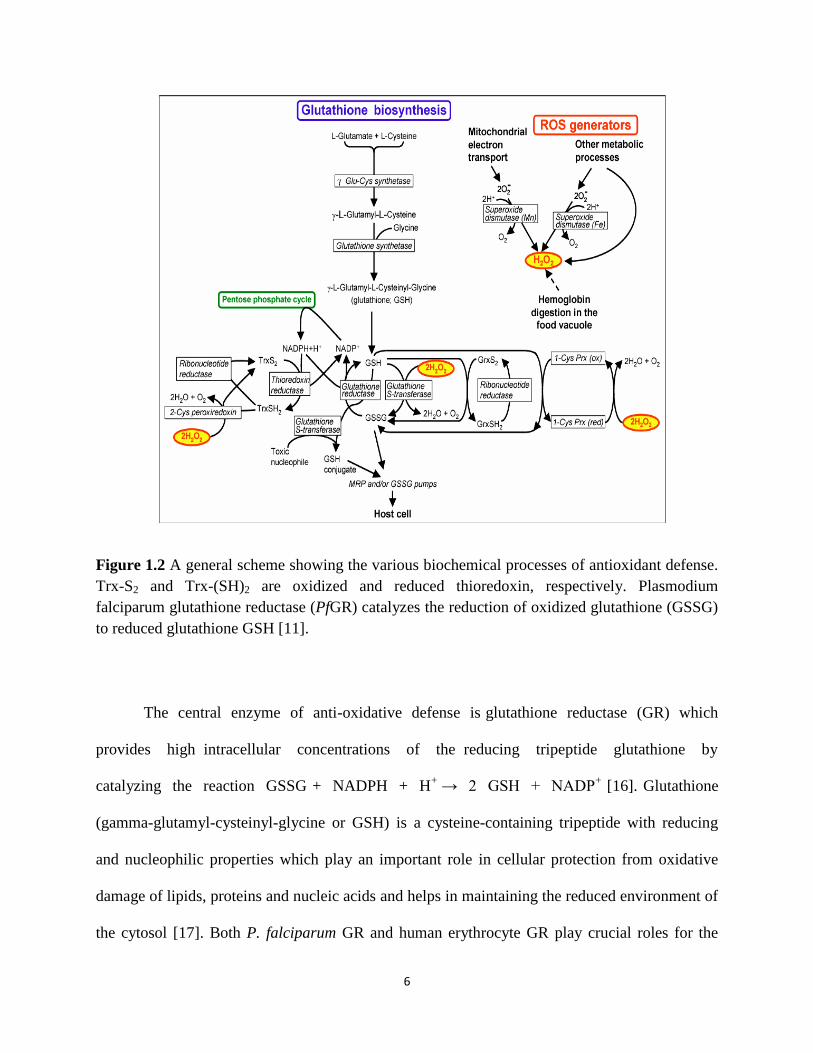
during the digestion of host cell hemoglobin and concomitant biochemical reactions [11].
Therefore the parasite requires efficient antioxidant and redox systems to protect itself from

5
damage caused by reactive oxygen species. In recent years, it has been shown that P. falciparum
(Pf) possesses functional thiol thioredoxin (Trx) and glutathione systems [12]. Thioredoxin
reductase (TrxR) and glutathione reductase (GR) are important enzymes of these redox systems
that help parasites to maintain adequate intracellular redox environment. The biochemistry and
molecular biology of antioxidant defense-related enzymes and intermediates are shown
schematically in Figure 1.2. TrxR from Plasmodium falciparum (PfTrxR) is a homodimer with a
subunit Mr of 59,000. Each monomer contains one FAD and one redox active disulfide. PfTrxR
is a flavoprotein which belongs to a class of pyridine dinucleotide oxidoreductases, catalyzes the
NADPH dependent reduction of Plasmodium falciparum thioredoxin (PfTrx) protein [13]. PfTrx
contains two redox-active half-cystine residues in an exposed active center, having the CysGly-
Pro-Cys sequence. Trx exists either in reduced form (Trx–(SH)2) with a dithiol, or in oxidized
form (Trx–S2). The S–S bond of Trx–S2 is reduced to Trx–(SH)2 by NADPH and PfTrxR
enzyme. Trx–(SH)2 regulates the activity of P. falciparum by reducing the cellular environment
[14]. Trx–(SH)2 acts as a hydrogen donor to ribonucleotide reductase and methionine sulfoxide
reductase, involved in DNA synthesis and protein repair. Trx–(SH)2 can directly reduce
hydrogen peroxide and can function as both single oxygen quencher and hydroxyl radical
scavenger. These functions of Trx–(SH)2 are in response to oxidative stress of the parasite
(Figure 1.2). Despite the high degree of similarity between PfTrxR and the human TrxR, their
primary structures present a striking difference in the C-terminus. PfTrxR has two cysteine
residues near the C-terminal Gly, while the human TrxR contains a Cys-SeCys dipeptide
penultimate to the C-terminal Gly [15].
6
Figure 1.2 A general scheme showing the various biochemical processes of antioxidant defense.
Trx-S2 and Trx-(SH)2 are oxidized and reduced thioredoxin, respectively. Plasmodium
falciparum glutathione reductase (PfGR) catalyzes the reduction of oxidized glutathione (GSSG)
to reduced glutathione GSH [11].
The central enzyme of anti-oxidative defense is glutathione reductase (GR) which
provides high intracellular concentrations of the reducing tripeptide glutathione by
catalyzing the reaction GSSG + NADPH + H+
→ 2 GSH + NADP+ [16]. Glutathione
(gamma-glutamyl-cysteinyl-glycine or GSH) is a cysteine-containing tripeptide with reducing
and nucleophilic properties which play an important role in cellular protection from oxidative
damage of lipids, proteins and nucleic acids and helps in maintaining the reduced environment of
the cytosol [17]. Both P. falciparum GR and human erythrocyte GR play crucial roles for the
7
intraerythrocytic growth of the parasite. Glutathione reductase (GR) is an ubiquitous
flavoenzyme of disulphide reductase family catalyzing the nicotinamide adenine di-nucleotide
phosphate reduced (NADPH) dependent reduction of oxidized glutathione (GSSG) to reduce
glutathione, which permits glutathione to function as an intracellular reducing agent [18]. The
feature distinguishing high molecular weight TrxR from GR is an additional C-terminal redox
center. In contrast to glutathione reductases that specifically reduce glutathione disulfide, many
high molecular weight TrxR’s have a broad substrate spectrum including low molecular weight
compounds as well as proteins; glutathione disulfide (GSSG) is, however, not accepted as a
substrate [18]. There are three major features distinguishing PfGR from human GR (hGR) that
are thought to be of relevance for selective inhibitor design. The first is an insertion of 34
residues within the central domain (residues 314–347) of PfGR that is known to be highly
antigenic, but has an unknown effect on catalytic function. The second involves the amino acid
residues lining the wall of the cavity at the dimer interface, where only nine out of 21 residues
are conserved in PfGR. The third difference is the pair of helices (H11/H11’) at the core of the
dimer interface. These helices are regarded as a dimerization and folding center of GR and it has
been shown that synthetic peptides can bind to these helices to interfere with the dimerization of
hGR [19].
Due to these facts the glutathione and the thioredoxin system have been considered to
work independently from each other. Antioxidant enzymes (PfTrxR and PfGR) are essential for
the survival of Plasmodium parasites for combating the intraerythrocytic oxidative stress. Recent
genetic manipulations carried out by Krnajski et al. (2002) have revealed that TrxR is essential
for the survival of P. falciparum, making it an attractive target for the development of new drugs
against malaria. The fact that PfTrxR is essential for the survival of erythrocytic stages of

8
parasites was demonstrated in knock-out experiments where no parasite with a disrupted trxR
gene was viable [20]. It has also been reported that P. falciparum-infected erythrocytes contain
higher GR activity compared to normal erythrocytes, which indicates that GR is highly expressed
in parasite infected cells and is essential for its defence mechanism [21]. Disruption of these
enzymes is a feasible way to interfere with the erythrocytic development of malaria parasites.
1. 3 Rapid resolution liquid chromatography
Chromatography is the most powerful technique available to analytical chemists in which
components to be separated are selectively distributed between stationary phase and mobile
phase. Liquid chromatography is particularly suitable for separation of compounds having high
polarity, high molecular weight, thermal unstability and those which can be ionized in solution.
The stationary phase used to separate the components is generally a reversed phase column
composed of non-polar aliphatic hydrocarbon chains bonded to the silica. Mobile phase which
flow through the stationary phase is a polar aqueous solvent or aqueous solvent mixtures such as
methanol/water and acetonitrile/water mixtures. Most commonly used bonded phases in reverse
phase liquid chromatography are C4, C8 and C18 with respective aliphatic chains attached to
silica. The C18 phases are mainly used to separate relatively low molecular weight components
whereas the C4 phases are used for separation of biomolecules [22]. These columns are used
repeatedly; the sample is injected directly by a syringe or a valve onto the column. The separated
solutes are detected as they emerge from the column by a detector and the signal is recorded to
give a chromatographic separation.

9
Rapid resolution liquid chromatography (RRLC) has been introduced as both very
efficient and a fast tool for complex sample analysis. RRLC is a new separation technique which
uses small particles (sub-2 micron) packed into a short column with increased speed, sensitivity
and resolution. Higher flow rates can be used in RRLC. Recently, RRLC has become a routine
analysis method in the pharmaceutical industry.
Short rapid resolution HT (RRHT) columns can be used for two main reasons: (1) to
dramatically reduce analysis time by increasing the flow rate without losing separation
performance, and (2) to achieve higher efficiency and therefore higher resolution, which is
required for the separation of complex samples [22]. The performance of a column can be
measured in terms of the height equivalent to the theoretical plates (HETP or H) which is
calculated from the column length (L) and the column efficiency, or number of theoretical plates
(N). N is calculated from an analyte’s retention time (tR) and the standard deviation of the peak
(σ).
The van Deemter equation (Equation 3) is the empirical formula that describes the relationship
between linear flow velocity (μ) and column efficiency, where A, B, and C are constants related
to the mechanistic components of dispersion.
According to the van Deemter plot (Figure 1.3), column efficiency is inversely proportional to
the particle size (dp) (Equation 4), so by decreasing the particle size there is an increase in

10
efficiency. Since resolution is proportional to the square root of N (Equation 5), decreasing
particle size increases resolution.
Also, by using smaller particles, analysis time can be decreased without sacrificing
resolution, because as particle size decreases, column length can also be reduced proportionally
to keep column efficiency constant. By using the same HPLC mobile phase and flow rate,
RRLC reduces peak width and produced taller peaks which increased the S/N 1.8 to 8 fold,
improving both sensitivity and resolution. Also according to the van Deemter plot, use of
particles smaller than 2 μm produces no loss in column efficiency with increasing flow rates
[24]. However, by increasing flow rates to decrease analysis time, there is a corresponding
increase in system pressure. A binary pump is used to push the solvent or mobile phase through
the stationary phase at high pressure and at a controlled flow rate.
Figure 1.3 van Deemter plot, illustrating the evolution of particle sizes over the last three
decades [24].

11
1. 4 Quadrupole Time of Flight Mass spectrometry
Mass spectrometry has emerged as a popular technique for the analysis of organic
compounds and biologics. Mass spectrometers employ distinct types of mass analyzers such as
quadrupole, ion trap, time-of-flight (TOF), Fourier transform ion cyclotron resonance and
orbitrap each of which provides unique features capable to identify, quantify, and resolve
ambiguities by selecting appropriate ionization and acquisition parameters. These mass analyzers
differ from each other in resolution, mass accuracy and speed at which they produce mass
spectra but possess specific analytical advantage.
Quadrupole mass analyzers are widely used mass spectrometers as they are easy to use and
calibrate. The drawback of these mass analyzers is that they work at unit resolution and lack the
accuracy in discriminating the large amounts of co-extracted compounds in the case of complex
mixture analysis. As a result the quantitative response is affected and confirmation cannot be
assured. Quadrupole MS has low sensitivity in full scan mode therefore its identification
capabilities are very low [25]. However, novel hybrid instruments with different mass analyzers
have rapidly been embraced by the analytical community as powerful and robust instruments due
to their higher sensitivity, mass accuracy and mass resolution. Recently, a hybrid Q-TOF mass
spectrometer was successfully applied for comprehensive analysis of natural products. Contrary
to quadrupole mass spectrometers which only allow the acquisition of a single precursor ion scan
at the time, Q-TOF mass spectrometers can acquire a virtually unlimited number of precursor ion
spectra due to the TOF analyzer. The selectivity of precursor ion scans is very high on Q-TOF

12
instruments because the high resolving power of the reflectron-TOF mass analyzers provides
high accuracy fragment ions without compromising sensitivity [26].
The basic components of the Q-TOF mass spectrometers are (a) quadrupole mass
analyzers, (b) a reflecting TOF analyzer, and (c) a multiple anode detector combined with
multichannel time-to-digital converters which are aligned consecutively (Figure 1.4). The
configuration of the mass analyzers can be regarded as the replacement of the third quadrupole
mass analyzer in a triple quadrupole mass spectrometer by a TOF analyzer. The three quadruples
of the Q-TOF MS perform different functions from each other. The first quadrupole (Q0) serves
to focus and transfer ions originating from the ion source, the second (Q1) is a mass filter
quadrupole that can separate ions, and the third quadrupole (Q2) function as a collision cell
where ions can be fragmented by collision-induced dissociation through collision with neutral
gas molecules (i.e. N2 or Ar). Ions entering from Q2 are detected in the TOF analyzer. The basic
components of the TOF analyzer are an ion accelerator, an ion mirror, and the ion detector. The
ion accelerator serves to accelerate ions, which are then separated in the drift tube based on
difference in velocity. The ion reflector functions to reverse the direction of the ion. This
instrumental feature improves the mass resolution by reducing variation in the kinetic energy
ions pulsed out of the ion accelerator. The Q-TOF mass spectrometer can be operated in three
acquisition modes: (i) TOF mass spectrometry (TOF MS) mode, (ii) tandem mass spectrometry
(MS/MS) mode, and (iii) product ion scan (PIS) mode [27].
In TOF MS mode, the mass filter quadrupole (Q1) is operated as a transmission element,
i.e. all ions having a broad range of m/z are transmitted simultaneously, and the TOF analyzer
records the mass spectrum. This yields a mass spectrum of all ionized molecules present in the
electrosprayed solvent. The TOF MS spectrum provides information regarding molecular mass

13
(m/z) and number of charges of a given analyte ion. Limited information about the molecular
structure of the analyte ion can be derived.
In MS/MS mode, the Q1 is operated in the mass filter mode to transmit only a precursor
ion of interest within a certain mass window (typically of 1-3 Da). Precursor ions are then
accelerated into the collision cell (Q2) where they undergo collision-induced dissociation through
multiple collisions with gas molecules. Resulting product ions (and remaining precursor ions)
then pass into the TOF analyzer for detection. The recorded MS/MS spectrum reflects a set of
structure specific fragment ions that provide structural information about the precursor ion.
Multiple reaction monitoring (MRM) and data-dependent acquisition are two additional
acquisition modes based on MS/MS analysis [27]. By data-dependent acquisition an initial
survey TOF MS spectrum is recorded, which is used to automatically select abundant precursor
ions for subsequent MS/MS analysis. The MS/MS analysis of each selected precursor ion is
performed only once during the sample acquisition, and typically requires 30 seconds for
recording each MS/MS. MRM analysis allows the targeted MS/MS analysis of a defined set of
precursor ions. This acquisition mode is independent of the abundance of the precursor ions
detected by TOFMS, and is performed by the repeated 1 second MS/MS analysis of each of the
targeted precursor ions for several minutes. Quantitative analysis of targeted precursor ions is
readily performed by monitoring the intensities of fragment ions [27].
In product ion scan (PIS) mode, precursor ions that generate one or a set of specific
fragment ions are detected. In this mode, the Q1 scans over a defined mass range in small steps
(0.1 or 0.2 Da). Precursor ions with increasing m/z values are sequentially transmitted and
accelerated into the collision cell where they undergo collision-induced dissociation. The
fragment ions generated at the defined precursor m/z are transmitted into the TOF analyzer for

14
detection. By this technology a Q1 mass spectrum is generated that specifically shows only the
precursor ions producing the monitored fragment ions. Importantly, the TOF analyzer allows a
virtually unlimited number of PIS to be simultaneously recorded and monitored with high mass
accuracy (0.1 Da). In comparison, conventional triple quadrupole mass spectrometers only allow
the monitoring of a single fragment ion with a relatively poor mass accuracy (1 Da).
Figure 1.4 Schematic diagram of the tandem QqTOF mass spectrometer [25].
1. 5 Electrospray ionization
Electrospray Ionization (ESI) is an atmospheric pressure ionization (API) technique. ESI is
the most widely used spray ionization technique. The introduction of electrospray has proven to

15
be a great tool in biochemistry, allowing the mass spectrometric characterization and sequencing
of peptides, proteins and other biopolymers of great importance to human life and medicine. The
ESI system is basically the interface between analyte molecules present in a sample solution and
their presence as ions in the gas phase. Electrospray ionization was first presented by Dole in
1968 [28]. The basic principles of electrospray have been used in many different fields of
application, such as spray painting of cars, drug delivery by inhalation and electrostatic spray
deposition of pesticides on crops [29, 30]
From the 1980’s and onwards, ESI has grown to become extensively used as an ion
source for MS. The successful combination of ESI with MS was initially shown by Fenn and co-
workers [31, 32, 33]. Fenn et al. 1989, showed that non-fragmented multiply charged ions could
be generated with electrospray ionization, thereby allowing mass determination of heavy
biomolecules within the range of a few thousand m/z. The soft ionization without fragmentation
of the analyte molecules is a key feature for the extensive use of electrospray in the analysis of
non-volatile and thermally labile bio-molecules that are not amenable to analysis by other
conventional techniques [34]. Fenn shared a Nobel Prize for his work on ESI in 2002. In
conventional electrospray, a conductive hollow emitter containing a solution of solvents,
electrolyte ions as well as charged analyte molecules is used. The open end of the emitter is
positioned facing a counter electrode containing the inlet hole of the mass spectrometer. By
applying a voltage difference between the emitter and the counter electrode, an electric field is
experienced by the sample solution at the tip of the emitter [35, 36]. The electric field polarizes
the liquid dielectrically at the emitter tip and distribution of anions and cations is obtained. The
essential features of the experimental arrangement are shown in Figure 1.5. For positive ESI
mode, i.e. when the potential at the emitter tip is exceeding that of the counter electrode, positive

16
ions are attracted towards the counter electrode. When the applied voltage exceeds a certain
threshold voltage, repulsions between the accumulated cations at the liquid surface cause the
meniscus of the liquid to establish a “Taylor cone” (Figure. 1.6). At a high enough imposed field,
the cone is drawn to a filament which produces positively charged droplets via a “budding”
process when the surface tension is exceeded by the applied electrostatic force. The diameter of
the droplets formed is influenced by a number of parameters, including the applied potential, the
solution flow rate and solvent properties.
Figure 1.5 Schematic of the electrospray ionization process and the general MS instrument [36].
Evaporation of solvent from the initially formed droplets, as they traverse a pressure gradient
towards the analyzer of the mass spectrometer, leads to a reduction in diameter, with collisional
warming preventing freezing. Fission (“Coulomb explosion”) will occur at the point (the
“Rayleigh limit”) at which the magnitude of the charge is sufficient to overcome the surface
tension holding the droplet together [37].

17
Finally, gas-phase ions are formed from the very small droplets. Two different models
have been proposed for this process: The charged residue model (CRM) presented by Dole and
the ion evaporation model (IEM) by Iribarne and Thomson [38, 39]. In the charge residue model,
the gas-phase ions are suggested to be formed as a result of continuous droplet fission until each
droplet only contains one excess ion (Figure 1.6). The ion evaporation model predicts that gas
phase ion emission occurs directly from small droplets. The exact process of gas-phase ion
formation has been studied extensively and is still under debate, but generally the IEM has been
suggested to be valid for small inorganic ions and the CRM for large ions such as proteins.
Disregarding the exact mechanism, the gas phase ions then traverse through the inlet hole of the
MS to the mass analyzer where the ions are separated by their mass-to-charge ratio (m/z).
Subsequently, the ions are detected and the signal from the detector is then transferred to the data
system for conversion into a mass spectrum, where the signal intensity versus m/z is presented.
Figure 1.6 Droplet production in the electrospray interface [36].

18
1.6 Project rationale
Malaria caused by Plasmodium falciparum is one of the major threats to human health in the
world. This parasite has developed resistance to the majority of the most commonly used
antimalarial drugs such as artemisinin combinational therapy (ACT’s), chloroquine, sulfadoxin-
pyrimethamine etc. Therefore there is an urgent need to identify or discover new targets in the
parasite and new drug molecules with potential antimalarial activity. Although the most relevant
antimalarial drugs come from natural sources, current reality is that there are no other lead
molecules in natural product drug discovery for optimization projects and preclinical
development for malaria. Many natural products have shown potent anti-plasmodial effects but,
for a variety of reasons, including chemical tractability issues, these have not been pushed
forward into hit-to-lead drug discovery projects. Pharmaceutical industries have placed low
emphasis on natural-product-based drug discovery efforts because of an increasing reliance on
newer technologies, such as combinatorial synthesis and high-throughput screening, and their
associated approaches to drug discovery. In an effort to identify new lead molecules, we have
emphasized our research on natural product drug discovery for malaria using mass spectrometry.
An important factor in the success of natural product drug discovery is to minimize the time
required to identify the active component from complex mixtures. Mass spectrometry based
bioassays can solve a wide variety of structural identification issues of unknown active principles
in plant extracts and complex mixtures with high speed and accuracy. Mass spectrometry based
proteomic approaches have the potential to provide insights into the molecular actions of the
ligands. We have selected Plasmodium falciparum thioredoxin reductase (PfTrxR) as our main

19
target and Plasmodium falciparum glutathione reductase (PfGR) as an alternative target and
these are validated drug targets for malaria drug discovery.
1.7 Objectives of Research
The purpose of our research work is to develop mass spectrometry based bioassays to screen
a library of natural products and plant extracts to identify inhibitor compounds to Plasmodium
falciparum thioredoxin reductase (PfTrxR). This was accomplished by:
1. Screening natural compounds for ligands to PfTrxR by ultrafiltration and LC-MS based
binding assay.
2. LC-MS based identification and structure elucidation of oleamide as a ligand of Plasmodium
falciparum thioredoxin reductase in Guatteria recurvisepala
3. Characterization of PfTrxR inhibitors using mass spectrometry and in silico molecular
modeling
We had screened 133 structurally diverse natural compounds from the MEGx®
collection of AnalytiCon Discovery and three synthetic hispolone analogs for binding affinity to
Plasmodium falciparum thioredoxin reductase (PfTrxR) using UF-LC-MS based ligand-binding
assay. Nine compounds (yohimbine (1), catharanthine (2), vobasine (3), gnetifolin E (4),
quinidine N-oxide (5), 11-hydroxycoronaridine (6), hispolone (7), hispolone methyl ether (8),
and hernagine (9)) displayed binding affinity for PfTrxR at 1 μM. The ranking order of
compound's binding affinities for PfTrxR is 7 > 6 > 2 > 4 > 5 > 8 > 1 > 9 > 3. On the other hand,
compounds 6, 7, 2 and 8 demonstrated binding to the active site of PfTrxR, when ligands were

20
tested in an equimolar mixture of 1 μM. Detannified methanol extracts of Guatteria
recurvisepala (Annonaceae), Topobea watsonii (Melastomataceae) and Licania kallunkiae
(Chrysobalanaceae) were also screened for ligands to PfTrxR. As a result, protonated molecule
m/z 282.2792 [M+H]+ with molecular ion formula C18H36NO, and DBE of 2 with an error of
1.13 ppm from Guatteria recurvisepala displayed binding affinity to the enzyme. Tandem MS
analysis of a ligand from Guatteria led to its identification as oleamide.
As a key feature, we have developed an LC-MS based functional assay to identify
inhibitors of PfTrxR in high throughput format by quantifying the intact Trx SH2. Here we
demonstrated the separation and identification of the product formed (Trx SH2) in the enzymatic
reaction using LC-MS. Relative quantitation of intact Trx SH2 was carried out using an Agilent
6520 QTOF MS equipped with positive mode ESI. To validate the functional assay, we screened
reference compounds (2,4-dinitrophenylsulfide, 4-nitrobenzothiadiazole and 3-(dimethylamino)-
propiophenone (3-DAP)) which were earlier identified as inhibitors of PfTrxR. The developed
LC-MS based functional assay for identification of inhibitors of PfTrxR is a sensitive and
reliable method that is amendable for HT. This is the first representation of a relative
quantitation of intact Trx SH2 using LC-MS. These identified ligands are also being tested for
their selectivity towards human glutathione reductase.
Further, our goal was to carry out a joint experimental and computational study to identify
natural products, which can selectively target these two enzymes of the parasite distinct from the
host enzymes. In this work, the binding affinities of natural products towards PfTrxR, PfGR,
human TrxR and human GR were determined using a mass spectrometry based ligand binding
assay. In silico molecular modeling was used to ascertain and further confirm the binding

21
affinities of these ligands towards PfTrxR, PfGR and human isoforms of these enzymes as well
as deduce the key interactions between the ligands and proteins.

22
1.8 References
1. World malaria report. WHO. 2012. Factsheet 2012.
2. J. L. Gallup, J. D. Sachs. The Economic Burden of Malaria. Am. J. Trop. Med. Hyg. 2001,
64, 85–96.
3. D. A. Jerrard, J. S. Broder, J. R. Hanna, J. E. Colletti, K. A. Grundmann, A. J. Geroff, A.
Mattu. Malaria: A rising incidence in the united states. J. Emerg. Med. 2002, 23, 23-33.
4. F. W. Muregi and A. Ishih. Next-generation antimalarial drugs: Hybrid molecules as a new
strategy in drug design. Drug Dev. Res. 2010, 71, 20 – 32.
5. A. Mannan, I. Ahmed, W. Arshad, M. F. Asim, R. A. Qureshi, I. Hussain, B. Mirza. Survey
of artemisinin production by diverse Artemisia species in northern Pakistan. Malaria J. 2010,
310, 1 – 9.
6. G. Padmanaban, V. A. Nagaraj, P. N. Rangarajan. Artemisinin-based combination with
curcuminoids a new dimension to malaria therapy. Curr. Sci. 2012, 102, 704-711.
7. E. Guantai, K. Chibale. How can natural products serve as a viable source of lead compounds
for the development of new/novel anti-malarials? Malaria J. 2011, 10, 1-8.
8. T. N. C.Wells. Natural products as starting points for future antimalarial therapies: going back
to our roots? Malaria J. 2011, 10, 2-12.
9. M. J. Balunas, A. D. Kinghorn. Drug discovery from medicinal plants. Life Sci. 2005, 78,
431-441.
10. V. Mulabagal, A. I. Calderón, Development of binding assays to screen ligands for
Plasmodium falciparum thioredoxin and glutathione reductases by ultrafiltration and liquid
chromatography/mass spectrometry. J. Chromatogr. B. 2010, 878, 987-993.

23
11. Z. Bozdech, H. Ginsburg. Antioxidant defense in Plasmodium falciparum – data mining of
the transcriptome. Malaria J. 2004, 3 (23), 1–10
12. S. Müller. Thioredoxin reductase and glutathione synthesis in Plasmodium falciparum.
Redox. Rep. 2003, 8 (5), 251–5.
13. S. Müller, T.W. Gilberger, Z. Krnajski, K. Luersen, S. Meierjohann, R.D. Walter.
Thioredoxin and glutathione system of malaria parasite Plasmodium falciparum.
Protoplasma. 2001, 217, 43–49.
14. A. Holmgren.Thioredoxin. Ann. Rev. Biochem. 1985, 54, 237.
15. P. F. Wang, L. D. Arscott, T. W. Gilberger, S. Müller, C. H. Williams. Thioredoxin
reductase from Plasmodium falciparum: Evidence for interaction between the c-terminal
cysteine residues and the active site disulfide-dithiol. Biochemistry. 1999, 38, 3187–3196.
16 S. Müller, K. Becker, B. Bergmann, R. H. Schirmer, R. D. Walter. Plasmodium falciparum
glutathione reductase exhibits sequence similarities with the human host enzyme in the
core structure but differs at the ligand-binding sites. Mol. Biochem. Parasit. 1995, 74,
11–18.
17 V. Wiwanitkit. Plasmodium and host glutathione reductase: molecular function and
biological process. Afr. J. Biotechnol. 2006, 5 (21), 2009–2013.
18 M. K. Stefan, R. H. Schirmer, I. Turbachova, R. Iozef, K. Becker. The thioredoxin system
of the malaria parasite Plasmodium falciparum. J. Biol. Chem. 2000, 275, 51, 40180–
40186.
19. G. N. Sarma, S. N. Savvides, K. Becker, M. Schirmer, R. H. Schirmer, P. A. Karplus.
Glutathione reductase of the malarial parasite Plasmodium falciparum: Crystal structure
and inhibitor development. J. Mol. Biol. 2003, 328, 893–907.
20. Z. Krnajski, T. W. Gilberger, R. D. Walter, A. F. Cowman, S. Müller, Thioredoxin reductase
is essential for the survival of Plasmodium falciparum erythrocytic stages. J. Biol. Chem.
2002, 277, 25970-25975.

24
21. K. Buchholz, E. D. Putrianti, S. Rahlfs, R. H. Schirmer, K. Becker, K. Matuschewski.
Molecular genetics evidence for the in vivo roles of the two major NADPH-dependent
disulfide reductases in the malaria parasite. J. Biol. Chem. 2010, 285, 37388–37395.
22. P. W. S. Raymond. Principles and practice of chromatography. Chrom-Ed book series, 2003.
Accessed on 01 November 2012. Chrom Ed Book 2003.
23. M. I. Churchwell, N. C. Twaddle, L. R. Meeker, D. R. Doerge. Improving LC-MS
sensitivity through increases in chromatographic performance: Comparisons of UPLC-
ES/MS/MS to HPLC-ES/MS/MS. J. Chromatogr. B. 2005, 825, 134-143.
24. M. E. Swartz. UPLC: An introduction and review. J. Liq. Chromatogr. Related Technol.
2005, 28, 1253-1263.
25. I. V. Chernushevich. Duty cycle improvement for a quadrupole time-of-flight mass
spectrometer and its use for precursor ion scans. Eur. J. Mass Spectrom. 2000, 6, 471─ 479.
26. S. Lacorte, A. R. Fernandez-Alba. Time of flight mass spectrometry applied to the liquid
chromatographic analysis of pesticides in water and food. Mass Spectrom. Rev. 2006, 25,
866– 880.
27. I. V. Chernushevich, A. V. Loboda, B. A. Thomson. An introduction to quadrupole–time-of-
flight mass spectrometry. J. Mass. Spectrom. 2001, 36, 849–865.
28. M. Dole, L. L. Mack, R. L. Hines, R. C. Mobley, L. D. Ferguson, M. B. Alice. Molecular
beams of macro ions. J. Chem. Phys. 1968, 49 (5), 2240-2249.
29. M. Wilm. Principles of electrospray ionization. Mol. Cell Proteomics. 2011, 10 (7), 1- 8.
30. O. V. Salata. Tools of nanotechnology: Electrospray. Curr. Nanosci. 2005, 1 (1), 25-33.
31. M. Yamashita, J. B. Fenn. Electrospray ion source. Another variation on the free-jet theme.
J. Phys. Chem-US. 1984, 88 (20), 4451-4459.

25
32. J. B. Fenn, M. Mann, C. K. Meng, S. F. Wong, C. M. Whitehouse. Electrospray ionization
for mass-spectrometry of large biomolecules. Science. 1989, 246 (4926), 64-71.
33. M. Yamashita, J. B. Fenn. Negative ion production with the electrospray ion source. J.
Phys. Chem-US. 1984, 88 (20), 4671-4675.
34. C. S. Ho, C. W. K. Lam, M. H. M. Chan, R. C. K. Cheung, L. K. Law, L. C. W. Lit, K. F.
Ng, M. W. M. Suen, H. L. Tai. Electrospray ionisation mass spectrometry: Principles and
clinical applications. Clin. Biochem. Rev. 2003, 24, 3-12.
35. R. J. Pfeifer, C. D. Hendricks. Parametric studies of electro hydrodynamic spraying. AIAA.
J. 1968, 6 (3), 496-502.
36. L. B. Loeb, A. F. Kip, G. G. Hudson, W. H. Bennett. Pulses in negative point-to-plane
corona. Phys. Rev. 1941, 60 (10), 714-722.
37. S. J. Gaskell. Electrospray: Principles and Practice. J. Mass Spectrom. 1997, 32, 677-688.
38. J. V. Iribarne, B. A. Thomson. On the evaporation of small ions from charged droplets. J.
Chem. Phys. 1976, 64 (6), 2287-2294.
39. P. Kebarle, U. H. Verkerk. Electrospray: from ions in solution to ions in the gas phase, what
we know now. Mass Spectrom. Rev. 2009, 28(6), 898-917.

26
2. Screening of natural compounds for ligands to PfTrxR by ultrafiltration and LC-MS
based binding assay
2.1 Abstract
In this study, we have screened 133 structurally diverse natural compounds from the MEGx®
collection of AnalytiCon Discovery and three synthetic hispolone analogs for binding affinity to
Plasmodium falciparum thioredoxin reductase (PfTrxR) using an ultrafiltration (UF) and liquid
chromatography (LC-MS) based ligand-binding assay newly developed in our laboratory. Nine
compounds (yohimbine (1), catharanthine (2), vobasine (3), gnetifolin E (4), quinidine N-oxide
(5), 11-hydroxycoronaridine (6), hispolone (7), hispolone methyl ether (8), and hernagine (9))
displayed binding affinity for PfTrxR at 1µM. The ranking order of compound’s binding
affinities for PfTrxR is 7 > 6 > 2 > 4 > 5 > 8 > 1 > 9 > 3. On the other hand, compounds 6, 7, 2
and 8 displayed binding to PfTrxR, when ligands were tested in an equimolar mixture of 1 µM.
2.2 Introduction
Of malarial parasites, Plasmodium falciparum is the most lethal species due to its increased
drug resistance towards current antimalarial drugs. Therefore, there is an urgent need to know
more about the sites in the parasite which can be potential targets for antiplasmodial activity [1].
It has been found that Plasmodium falciparum is susceptible to oxidative stress [2]. Two
antioxidant systems, thioredoxin reductase and glutathione reductase counteract the oxidative

27
stress in Plasmodium falciparum [2]. Plasmodium falciparum (Pf) thioredoxin reductase (TrxR),
a 59 kDa flavoprotein which belongs to a class of pyridine dinucleotide oxidoreductases,
catalyzes the NADPH dependent reduction of Plasmodium falciparum thioredoxin (PfTrx)
protein [2]. Reduced thioredoxin regulates the activity of the enzyme by reducing the cellular
environment. Reduced PfTrx acts as hydrogen donor to ribonucleotide reductase and methionine
sulfoxide reductase, involved in DNA synthesis and protein repair. They can directly reduce
hydrogen peroxide and can function as both single oxygen quencher and hydroxyl radical
scavenger. These functions of Trx are in response to oxidative stress of the parasite [3].
Because of the involvement of PfTrxR in redox regulation of the parasite, PfTrxR is considered a
novel target in the parasite metabolism for antiplasmodial intervention.
Other different combination therapies available to treat malaria are found to be more
expensive, not readily available to people in developing countries, and accompanied with
adverse effects. As our contribution to address these problems, we are emphasizing the search for
bioactive natural products, since these can be viewed as an inexhaustible reservoir of molecules
that can be optimized to be efficient, well tolerated, and safe to use as antimalarial drugs [4, 5].
Natural products provide leads for the development of novel therapies for the treatment of
malaria. For any compound to intervene with the activity of the enzyme, it has to interact with
the target enzyme.
2.2.1 PfTrxR and PfGR enzymes binding assay using ultrafiltration (UF) and liquid
chromatography mass spectrometry
Natural product drug discovery programs employ many screening methods for hit
identification and lead optimization. Over time there has been a decline in interest of

28
pharmaceutical companies in natural products approach to drug discovery due to many factors
such as incompatibility of crude extracts with high throughput assays (HTS), cost of sample
collection, problems with lack of reproducibility and presence of artifacts in some extracts and
difficulty in isolating active principles [6]. However, it is well established that the new chemical
constituents identified from natural sources is the single most successful strategy for the
discovery of new drugs. Advances in analytical methods and bioassay development have helped
to push forward the research in natural products [7]. Several natural product drug discovery
screening assays such as cell based, cytotoxicity, receptor/enzyme binding, cell membrane
permeability assays and assays based on optical detection have been reported which were found
to be slow, time consuming, resource intensive, suffer from matrix interference and cannot
provide structural information regarding the active compounds that might be present, which is a
disadvantage when plant extracts/mixtures are screened [8, 9]. Determination of an enzyme’s
affinity for small molecules using mass spectrometry is among the more recently developed
method that can be a valuable addition to traditional drug discovery techniques. We have
employed an ultrafiltration LC-MS based enzyme ligand binding assay to screen vast number of
natural products and plant extracts to determine their selective binding affinity towards isolated
PfTrxR and PfGR enzymes. The ultrafiltration step facilitates the separation of ligand-receptor
complexes from unbound compounds, and then LC-MS is used to characterize and identify the
ligands. This method is advantageous over other methods in that the MS measures only the
actual compounds that have affinity for the enzyme and has very high sensitivity and selectivity
that is inherent to mass spectrometric detection [10]. Plant extracts contain a large number of
different chemical constituents, making it difficult to ascertain their antimalarial activity before
isolation of the bioactive compounds. A suitable tool to speed up natural product drug discovery

29
is the application of UF-LC-MS based binding assays which can screen complex mixtures from
plant origins for their binding affinity towards PfTrxR followed by MS-based structure
elucidation and confirmation of the identity of new ligands.
2.3 Materials and methods
2.3.1 Chemicals and enzymes
Solvents used for LC-MS analysis were purchased from Fischer Scientific International
(Atlanta, GA). One hundred and thirty-three compounds from AnalytiCon Discovery GmbH
(Germany) natural products library (MEGx) (Table 2.1) were purchased based on compound
classes that have reported either antimalarial activity or inhibition of TrxR [12, 13]. Out of 133
natural products, 28 have been identified as novel plant-derived compounds by AnalytiCon
Discovery (Table 2.1). Three hispolone analogues were kindly provided by Dr. G. V. Subbaraju,
AptuitLauras, Hyderabad, India. Buffer salts and bis-2, 4-dinitrophenyl sulfide were purchased
from Sigma-Aldrich (Allentown, PA). Deionized water generated by a Milli-Q water system
(Millipore, MA) was used in the experiments. PfTrxR (Mr 59 kDa) enzyme was provided as a
gift by Prof. Katja Becker, Justus-Liebig University, Giessen, Germany. The recombinant
PfTrxR was prepared and purified using silver-stained SDS page according to the procedure
published by Kanzok et al [14]. The specific activity of PfTrxR (1.9 U/mg) was determined by
DTNB [5, 5’-dithiobis (2-nitrobenzoic acid)]. Protein concentration of enzymes was determined
by Bradford method [15].

30
2.3.2 UF-LC-MS binding assay
In this method, 4 µL of test compound (10 µM) and 192 µL of incubation buffer
containing 20.5 mM KH2PO4, 26.5 mM K2HPO4, 200 mM KCl and 1 mM EDTA with pH 6.9,
were placed into a micro centrifuge. To this, 4µL of PfTrxR/PfGR enzyme (1 µM) was added
and incubated at 25◦C for 60 min. The incubation mixture was then filtered through a 30 kDa
molecular weight cut-off ultrafiltration membrane filter made of regenerated cellulose (Microcon
YM-30, Millipore, Billerica, MA) according to the modified method of Liu. et al. [11] and then
centrifuged at 13,000 × g at 4◦C for 20 min. The enzyme–ligand complex trapped in the filter was
washed with assay buffer (200 µL 3×) and centrifuged at 13,000 × g at 4◦C for 20 min each time.
The ultrafiltration membrane was placed into a new microcentrifuge tube and the ligands were
dissociated from PfGR enzyme by treatment with 200 µL of methanol for 20 min. The ligand
ultrafiltrate obtained was centrifuged at 20◦C, 13,000 × g for 20 min. The ultrafiltrate was then
dried under nitrogen using N-VAP 116 Nitrogen Evaporator (Organomation Associates, Inc.,
Berlin, MA) and the released ligands were reconstituted in 100 µL of methanol/water (v/v,
90:10). Assays were carried out in duplicate and the control experiments were performed in a
similar way with denatured enzyme. The released ligands were then analyzed by LC-MS. Assays
were carried out in duplicate and the control experiments were performed in a similar way with
denatured enzyme.
2.3.3 LC-MS analysis
All the test compounds for LC-MS analysis were prepared using MeOH - H2O (90:10, v/v).
Prior to screening, the compounds were divided into batches based on their physicochemical

31
properties that determine ionization efficiency and electrospray ionization mode. Liquid
chromatography analysis was performed using a ZORBAX Eclipse plus C18 column (2.1 mm x
100 mm, 1.8 µm) at a flow rate of 0.2 mL/min. An Agilent (Little Falls, DE) 6520 accurate-mass
quadrupole time of flight (Q-TOF) mass spectrometer equipped with a 1220 rapid resolution
liquid chromatography (RRLC) system was used for separation of batch compounds. Detailed
information on LC conditions for separation of batch compounds is provided in Table 2.2.
2.3.3.1 LC-MS analysis of ligands 1, 2, 3, 5, 6, 7, 8 and 9 in equimolar mixture of 1 µM
Compounds were analyzed at 1 µM (5 µL inj. vol.) using gradient mobile phase (0 min
5% B to 95% B in 20 min) consisting of (A) 0.1% formic acid in H2O (v/v) and (B) 0.1% formic
acid in 50:50 MeOH-ACN (v/v/v) as solvent system for a run time of 20 min with post run 3 min
at a flow rate of 0.2 mL/min. The eight compounds (1, 2, 3, 5, 6, 7, 8 and 9) were detected in
positive ion electrospray. All the test compounds were detected by MS at a capillary voltage of
3200 V for ESI negative mode and 3500 V for ESI positive mode. Nitrogen was supplied as
nebulizing and drying gas at flow rates of 25 and 600 l/h, respectively. The drying gas
temperature was 350 oC. The fragmentor voltage was optimized to 175-180 eV. Data were
acquired and analyzed using Agilent MassHunter Workstation Qualitative Analysis software,
version B.02.00.
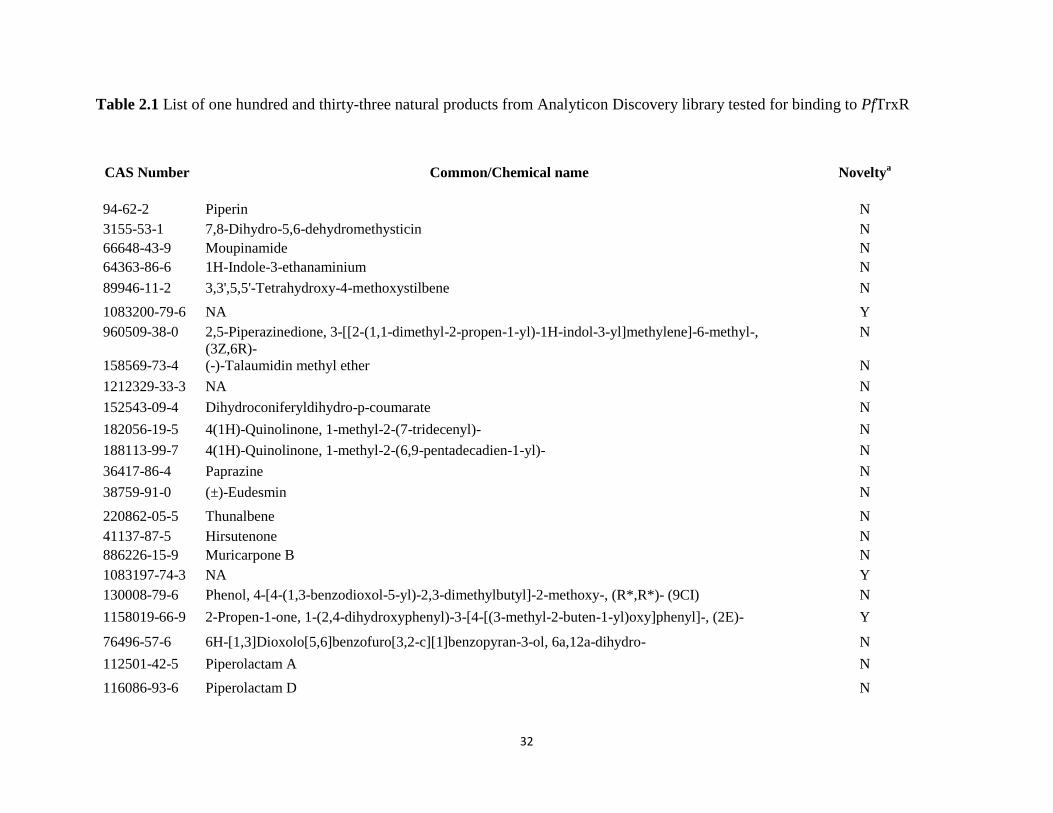
32
Table 2.1 List of one hundred and thirty-three natural products from Analyticon Discovery library tested for binding to PfTrxR
CAS Number Common/Chemical name Noveltya
94-62-2 Piperin N
3155-53-1 7,8-Dihydro-5,6-dehydromethysticin N
66648-43-9 Moupinamide N
64363-86-6 1H-Indole-3-ethanaminium N
89946-11-2 3,3',5,5'-Tetrahydroxy-4-methoxystilbene N
1083200-79-6 NA Y
960509-38-0 2,5-Piperazinedione, 3-[[2-(1,1-dimethyl-2-propen-1-yl)-1H-indol-3-yl]methylene]-6-methyl-,
(3Z,6R)-
N
158569-73-4 (-)-Talaumidin methyl ether N
1212329-33-3 NA N
152543-09-4 Dihydroconiferyldihydro-p-coumarate N
182056-19-5 4(1H)-Quinolinone, 1-methyl-2-(7-tridecenyl)- N
188113-99-7 4(1H)-Quinolinone, 1-methyl-2-(6,9-pentadecadien-1-yl)- N
36417-86-4 Paprazine N
38759-91-0 (±)-Eudesmin N
220862-05-5 Thunalbene N
41137-87-5 Hirsutenone N
886226-15-9 Muricarpone B N
1083197-74-3 NA Y
130008-79-6 Phenol, 4-[4-(1,3-benzodioxol-5-yl)-2,3-dimethylbutyl]-2-methoxy-, (R*,R*)- (9CI) N
1158019-66-9 2-Propen-1-one, 1-(2,4-dihydroxyphenyl)-3-[4-[(3-methyl-2-buten-1-yl)oxy]phenyl]-, (2E)- Y
76496-57-6 6H-[1,3]Dioxolo[5,6]benzofuro[3,2-c][1]benzopyran-3-ol, 6a,12a-dihydro- N
112501-42-5 Piperolactam A N
116086-93-6 Piperolactam D N
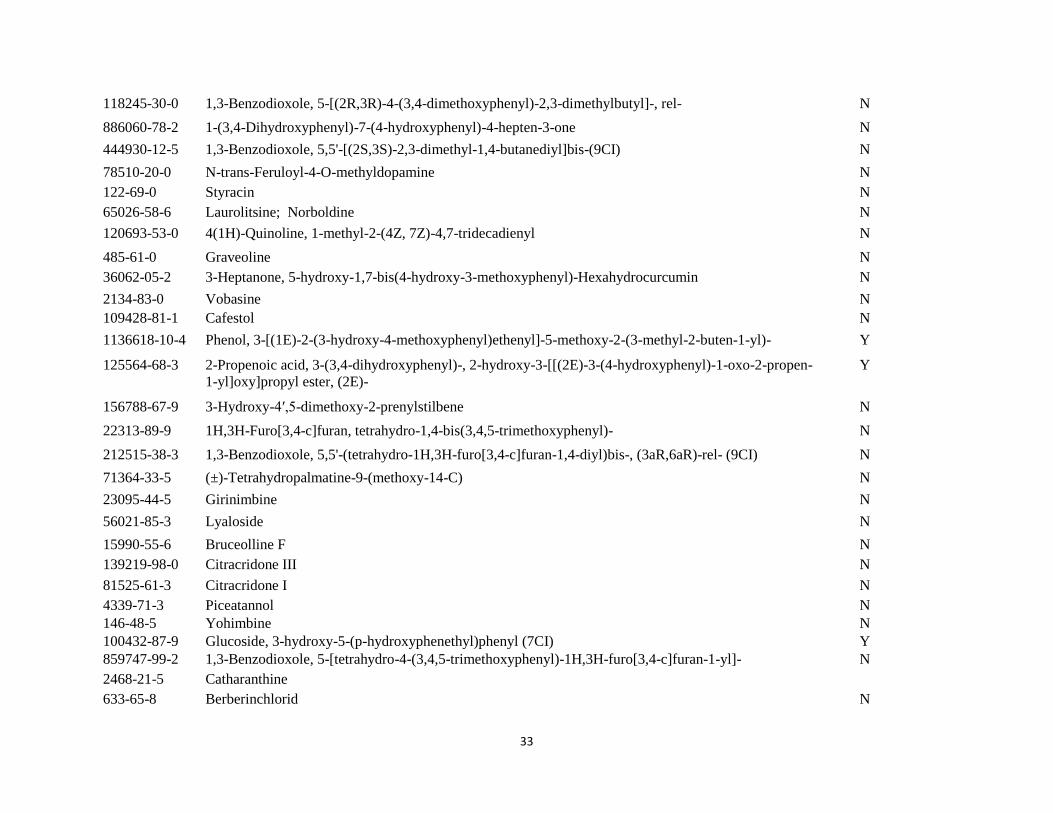
33
118245-30-0 1,3-Benzodioxole, 5-[(2R,3R)-4-(3,4-dimethoxyphenyl)-2,3-dimethylbutyl]-, rel- N
886060-78-2 1-(3,4-Dihydroxyphenyl)-7-(4-hydroxyphenyl)-4-hepten-3-one N
444930-12-5 1,3-Benzodioxole, 5,5'-[(2S,3S)-2,3-dimethyl-1,4-butanediyl]bis-(9CI) N
78510-20-0 N-trans-Feruloyl-4-O-methyldopamine N
122-69-0 Styracin N
65026-58-6 Laurolitsine; Norboldine N
120693-53-0 4(1H)-Quinoline, 1-methyl-2-(4Z, 7Z)-4,7-tridecadienyl N
485-61-0 Graveoline N
36062-05-2 3-Heptanone, 5-hydroxy-1,7-bis(4-hydroxy-3-methoxyphenyl)-Hexahydrocurcumin N
2134-83-0 Vobasine N
109428-81-1 Cafestol N
1136618-10-4 Phenol, 3-[(1E)-2-(3-hydroxy-4-methoxyphenyl)ethenyl]-5-methoxy-2-(3-methyl-2-buten-1-yl)- Y
125564-68-3 2-Propenoic acid, 3-(3,4-dihydroxyphenyl)-, 2-hydroxy-3-[[(2E)-3-(4-hydroxyphenyl)-1-oxo-2-propen-
1-yl]oxy]propyl ester, (2E)-
Y
156788-67-9 3-Hydroxy-4′,5-dimethoxy-2-prenylstilbene N
22313-89-9 1H,3H-Furo[3,4-c]furan, tetrahydro-1,4-bis(3,4,5-trimethoxyphenyl)- N
212515-38-3 1,3-Benzodioxole, 5,5'-(tetrahydro-1H,3H-furo[3,4-c]furan-1,4-diyl)bis-, (3aR,6aR)-rel- (9CI) N
71364-33-5 (±)-Tetrahydropalmatine-9-(methoxy-14-C) N
23095-44-5 Girinimbine N
56021-85-3 Lyaloside N
15990-55-6 Bruceolline F N
139219-98-0 Citracridone III N
81525-61-3 Citracridone I N
4339-71-3 Piceatannol N
146-48-5 Yohimbine N
100432-87-9 Glucoside, 3-hydroxy-5-(p-hydroxyphenethyl)phenyl (7CI) Y
859747-99-2 1,3-Benzodioxole, 5-[tetrahydro-4-(3,4,5-trimethoxyphenyl)-1H,3H-furo[3,4-c]furan-1-yl]- N
2468-21-5 Catharanthine
633-65-8 Berberinchlorid N

34
1217689-07-0 1H,3H-Furo[3,4-c]furan-1-one, 3-(1,3-benzodioxol-5-yl)tetrahydro-6-(4-hydroxy-3-methoxyphenyl)- Y
98681-44-8 4H-Dibenzo[de,g]quinolin-2-ol, 5,6,6a,7-tetrahydro-1-methoxy- N
139101-68-1 β-D-Glucopyranoside, 3-hydroxy-5-[2-(4-hydroxy-3-methoxyphenyl)ethyl]phenyl Y
140671-07-4 Gnetifolin E N
56973-65-0 1,7-Bis(4-hydroxyphenyl)-4-hepten-3-one N
288141-04-8 Platyphyllonol 5-xylpyranoside N
6871-44-9 Echitamine N
456-12-2 Aegeline N
58762-96-2 Pinostilbenoside N
38963-95-0 Resveratroloside N
876659-81-3 Ajmalicine N
79559-61-8 3-Heptanone, 5-hydroxy-7-(4-hydroxy-3-methoxyphenyl)-1-phenyl- N
79559-59-4 1,7-Diphenyl-4-hepten-3-one N
845655-40-5 1(2H)-Isoquinoline, 3,4-dihydro-6-hydroxy-7-methoxy Y
884495-94-7 1,2-Benzenediol, 4-[3,5-dihydroxy-7-(4-hydroxy-3-methoxyphenyl)heptyl]- Y
132216-13-8 Amaniensine Y
25924-78-1 Trichostachine N
34371-47-6 5β-Carboxystrictosidine N
798569-00-3 D-Tyrosine, N-[3-(3,4-dihydroxyphenyl)-1-oxo-2-propen-1-yl]-3-hydroxy- N
104821-27-4 Lyalosidic acid N
91000-14-5 2-Propenamide, N-[4-(acetylamino)butyl]-3-(4-hydroxy-3-methoxyphenyl)-, (E)- (9CI) Y
21451-50-3 Deoxycordifoline Y
479-43-6 Canthin-6-one N
908094-05-3 3-Heptanone, 5-hydroxy-7-(4-hydroxy-3-methoxyphenyl)-1-(4-hydroxyphenyl)- N
1212137-68-2 [1,3]Dioxolo[4,5-h]-1,3-dioxolo[7,8][2]benzopyrano[3,4-a][3]benzazepine, 5b,6,7,8,13b,15-
hexahydro-15-methoxy-6-methyl-
N
79559-60-7 7-(4-Hydroxy-3-methoxyphenyl)-1-phenyl-4-hepten-3-one N
33626-08-3 3,5-Dihydroxy-4′-methoxystilbene N
74133-19-0 Hernagine N

35
32507-66-7 Isorhapontigenin N
NA Centrolobol-3-rutenoside Y
1083195-05-4 Benzenepropanol, 4-hydroxy-α-[4-(4-hydroxyphenyl)-3-buten-1-yl]- Y
79120-40-4 Hannokinol N
29700-22-9 Oxyresveratrol N
103188-48-3 N-trans-caffeoyltyramine N
35387-16-7 Vasicinone N
19902-91-1 Dihydromethysticin N
60263-07-2 Jacaranone N
NA Indol-3-(6-O-b-D-Apiofuranosyl-b-D-glucopyranoside) Y
1212171-97-5 1,3-Benzodioxole-5-butanol, α-(4-hydroxy-3-methoxyphenyl)-β,γ-dimethyl- N
7154-01-0 3-(3,4-Methylenedioxyphenyl)-1,2-propanediol N
1083192-75-9 2-Buten-1-ol, 4-[4-[2-(7-methoxy-1,3-benzodioxol-5-yl)ethyl]phenoxy]-2-methyl- Y
48216-02-0 Homochelidonine, β- (3CI) N
23141-27-7 Vincosamide N
23512-46-1 Piperanine N
537-42-8 Pterostilbene N
517-73-7 Melicopicine N
130233-83-9 Acerogenin G N
1083192-76-0 Benzene, 1,2,3-trimethoxy-5-[2-[4-[(3-methyl-2-buten-1-yl)oxy]phenyl]ethyl]- Y
83-95-4 Skimmianine N
133-03-9 (+)-Episesamin N
93559-25-2 (±)-7-(3'',4''-Dihydroxyphenyl)-5-hydroxy-1-(4'-hydroxyphenyl)-3-heptanone Y
1174388-79-4 NA Y
1212227-01-4 NA N
190271-90-0 β-D-Glucopyranoside, 5-(4-hydroxyphenyl)-1-[2-(4-hydroxyphenyl)ethyl]pentyl N
126722-26-7 Pumiloside N
104420-85-1 (+)-N-Methyllaurotetanine N-oxide N
58-08-2 Coffeine N

36
24192-01-6 Dihydroyashabushiketol N
4829-55-4 Hetisinone N
607-91-0 Myristicin N
105317-66-6 Moskachan D N
76202-23-8 11-Hydroxycoronaridine N
70116-00-6 Quinidine N-oxide Y
115587-58-1 1-Hepten-3-one, 5-hydroxy-1,7-diphenyl-, (1E)- Y
2051-07-2 Dianisalacetone N
75821-37-3 5-Hydroxyarborinine N
149732-51-4 1-(3,4-Dihydroxyphenyl)-7-(4-hydroxy-3-methoxyphenyl)-1,6-heptadiene-3,5-dione N
30278-29-6 1,7-Diphenylheptane-3,5-diol N
83161-95-9 3-Heptanone, 7-(4-hydroxy-3-methoxyphenyl)-5-methoxy-1-phenyl- N
88660-10-0 Pipernonaline N
66280-26-0 Pregomisin N
52617-31-9 Haplamine N
312608-32-5 Furo[2,3-b]quinolin-7-ol, 5,6,7,8-tetrahydro-4,8-dimethoxy-8-(3-methyl-2-buten-1-yl)- N
1174387-98-4 NA Y
1174387-99-5 NA Y
1174389-03-7 NA Y
58436-29-6 3-Hydroxy-4′,5-dimethoxystilbene N
284463-38-3 3,5-Heptanediol, 1-(4-hydroxy-3-methoxyphenyl)-7-phenyl- Y
10091-84-6 Triacanthin N
913692-05-4 NA N
123648-56-6 Germanaism B N
467-77-6 Coronaridine N
aNA: Common/chemical name not assigned in the literature.
bNovelty: Y: novel compound, N: known compound.

37
Table 2.2 LC-MS conditions for detection of the one hundred and thirty-three natural products
Batch
Compound
class
Test conc.
/Inj. vol.
M.P
Mobile
phase A
Mobile
phase B
Proportion A:B
Positive/Negative
Electrospray
Run time
1st, 2
nd,
6th
, 7th
,
10th
, 11th
amides,
alkaloids,
curcuminoids,
coumarins,
lignans,
quinines,
stilbenes
5 µM/5 µl
Gradient
0.1 % formic
acid in H2O
95% ACN, 5%
H2O, 0.1%
formic acid
min
0
2
4
7
8
%
B
20
50
90
90
20
ESI-positive
10 min
3rd
amides
10 µM/2 µl
Isocratic
0.1% formic
acid in H2O
0.1% formic
acid in MeOH
90:10 (A: B)
ESI-negative
8 min
4th
alkaloids,
amides,
coumarins,
lignans
1 µM/1 µl
Isocratic
0.1% formic
acid in H2O
95% ACN, 5%
H2O, 0.1%
formic acid
5: 95 (A: B)
ESI-positive
10 min
5th
alkaloids
5 µM//5 µl
Gradient
0.1% formic
acid in H2O
95% ACN, 5%
H2O, 0.1%
formic acid
min
0
2
4
5
%
B
20
90
90
20
ESI-positive
7 min

38
8th
stilbenes
5 µM/5 µl
Gradient
0.1% formic
acid in H2O
95% ACN, 5%
H2O, 0.1%
formic acid
min
0
2
4
7
8
%
B
20
40
90
90
20
ESI-negative
10 min
9th
curcuminoids
alkaloids,
diterpenes
1 µM/5 µl
Gradient
0.1% formic
acid in H2O
95% ACN, 5%
H2O, 0.1%
formic acid
min
0
2
4
7
8
%
B
20
40
90
90
20
ESI-positive
10 min

39
2.4 Results and Discussion
PfTrxR plays an important role in the pathophysiology of malaria disease, regulating the
oxidative stress in the enzyme. Considering the significance of PfTrxR as a novel target in the
parasite metabolism for therapeutic intervention, UF and LC-MS binding assay [16] were used to
screen one hundred and thirty three various classes of natural compounds (alkaloids, amides,
coumarins, curcuminoids, diterpenes, lignans, stilbenes) and three synthetic compounds which
can be bound by PfTrxR. Out of the one hundred and thirty six compounds screened, nine
compounds showed affinity to the enzyme. These compounds were found to be yohimbine (1),
catharanthine (2), vobasine (3), gnetifolin E (4), quinidine N-oxide (5), 11-hydroxycoronaridine
(6), hispolone (7), hispolone methyl ether (8), and hernagine (9) (Figure 2.1). To screen the
ligands for the enzyme, the binding assay was performed by incubating the test compounds with
1 µM PfTrxR at 25 oC for 1 hr [16] in a total volume of 200 µl of assay buffer. The bound
ligands in the enzyme-ligand complex trapped on the membrane filter were dissociated using
MeOH and the dissociated ligands were dried, reconstituted and then analyzed using both
positive and negative ESI-MS experiments.
All ligands were detected by LC-MS within an error of < 1.5 ppm. The relative binding
affinities of ligands are shown in Table 2.3. The binding affinity was ascertained by calculating
the ratio between the average peak area of compound incubated with active enzyme and the
average peak area of compound incubated with denatured enzyme ± standard deviation.
According to the binding affinity data obtained in the screening of the 136 compounds against
PfTrxR and binding affinity of our reference compound (bis-2,4-dinitrophenyl sulfide) [16],
compounds that specifically bind the enzyme and displayed binding affinity of more than 1.5

40
were considered ligands. The binding affinity was ranked in the following fashion: non-ligand
less than 2, moderate between 2.0 - 3.0 and strong when more than 3.0. The ranking order of
compounds binding affinities for PfTrxR is 7 > 6 > 2 > 4 > 5 > 8 > 1 > 9 > 3. Yohimbine (1) has
moderate binding affinity of 2.0-fold when incubated with 1 µM PfTrxR. Compound 1, an
indole alkaloid, was first isolated from the seeds and bark of a large Venezuelan tree
Aspidosperma excelsum Benth [17]. Catharanthine (2) and gnetifolin E (4) both displayed
moderate binding affinity of 2.5-fold to PfTrxR. Compound 2, an indole alkaloid, was isolated
from the dried leaves of Catharanthus roseus (L.) [18].
Figure 2.1 Structures of active compounds screened for PfTrxR.

41
Table 2.3 Relative binding affinities for ligands 1-10 tested UF-LC-MS screening against PfTrxR
Compound
MS detected parent iona
Binding affinity
of each ligand 1 µM
Binding affinity
of equimolar mixture of
ligands, 1 µM each
Yohimbine ( 1 )
355.2013 [M+H]+
2.0 ± 0.13
2.2 ± 0.78
Catharanthine ( 2 ) 337.1910 [M+H]+ 2.5 ± 0.05 3.6 ± 0.59
Vobasine ( 3 ) 353.1865 [M+H]+ 1.6 ± 0.87 1.9 ± 0.56
Gnetifolin E ( 4 ) 419.1351 [M-H]- 2.45 ± 0.16 ND
Quinidine N-oxide ( 5 ) 341.1856 [M+H]+ 2.6 ± 0.23 2.6 ± 0.64
11-hydroxy-coronaridine ( 6 ) 355.2019 [M+H]+ 3.8 ± 0.38 3.7 ± 0.94
Hispolone ( 7 ) 221.0803 [M+H]+ 7.51± 0.52 3.6 ± 0.17
Hispolone methyl ether ( 8 ) 235.0961 [M+H]+ 2.05 ± 0.24 3.4 ± 0.42
Hernagine (9) 328.1534 [M+H]+ 1.8 ± 0.61 2.9 ± 0.70
Dehydroxyhispolone (10) 205.0855 [M+H]+
0.95 ± 0.43 ND
2,4-Dinitrophenylsulfide
(reference compound) [10]
366.9992 [M-H]+
3.2 ± 0.27 ND
aParent ions detected for ligands (1-10) in the UF-LC-MS screening when incubated with 1 µM of active and denatured PfTrxR.
ND: not determined, Compound 4 and 10 were not tested in the equimolar mixture because 4 should be detected in ESI negative
mode and 10 was not considered a ligand.

42
Compound 4, a stilbene glucoside was first isolated from lianas of Gnetum parvifolium (Warb.)
[19]. Vobasine (3) displayed relatively low binding affinity of 1.6-fold to PfTrxR. Quinidine N-
oxide (5) showed moderate binding affinity of 2.6-fold to PfTrxR. Compound 5 was identified
as novel structure from plant sources by AnalytiCon Discovery. The 11-hydroxycoronaridine (6)
has relatively high binding affinity of 3.8-fold compared to yohimbine (1). Compound 6, an
indole alkaloid, was isolated from seeds and root-bark of Pterotabema inconspicua Stapf [20].
Hernagine showed 1.8-fold binding affinity to PfTrxR. Hernagine (9), an aporphinoid alkaloid,
was first isolated from stem bark of Hernandia nymphaefolia Presl [21] and later isolated from
other Hernandia species like Hernandia cordigera Vieill [22]. The extracts of Hernandia
cordigera displayed antiparasitic activity against other than Plasmodium species such as
Leishmania donovani, Trypanosoma brucei, Trichomonas vaginalis and Caenorhabditis elegans
[23]. Compounds 1, 2 and 6 belong to indole alkaloids and displayed moderate binding affinity
to PfTrxR. Indole alkaloids isolated from natural sources including artemisinin and quinine (and
atovaquone, semi-synthetic) showed high selectivity to Plasmodium species and are reported to
have high antiplasmodial activity both in vitro and in vivo [24].
In addition to the one hundred and thirty three natural products, we also screened 3
synthetic compounds: hispolone (7), hispolone methyl ether (8), and dehydroxyhispolone (10).
These compounds were selected due to their structural resemblance to curcuminoids (bis-
demethoxycurcumin, demethoxycurcumin and curcumin) which are already reported to have
high binding affinity for PfTrxR [16]. Moreover these compounds have significant anti-
inflammatory and anti-proliferative activities when tested on human myeloid leukemia cell line
KBM-5 and other human cell lines [25]. For these reasons these compounds were tested for

43
binding affinity to PfTrxR. Hispolone (7) showed the highest binding affinity of 7.5-fold among
all the compounds screened, whereas hispolone methyl ether (8) showed moderate binding
affinity of 2.5-fold and dehydroxyhispolone (10) displayed no affinity (less than 1-fold) for
PfTrxR. The high binding affinity of hispolone (7) can be attributed to the presence of the
hydroxyl groups on the phenyl ring. When one of the hydroxyl groups was replaced by a
methoxy group in hispolone methyl ether (8), there was a 3-fold reduction in the binding affinity
for PfTrxR. When one of the hydroxyl groups was absent from the ring, as in case of
dehydroxyhispolone (10) (Figure. 2.1), there was no binding to PfTrxR. It can be assumed that
3-hydroxyl group in hispolone might be involved in binding to the active site or at the dimer
interface of the enzyme to result in high binding affinity to PfTrxR. In hispolone methyl ether,
the methoxy group can form an intramolecular hydrogen bond with 4-phenolic hydrogen making
the phenolic hydroxyl group unavailable for interaction at active sites or at dimer interface.
Therefore it can be hypothesized that hydroxyl groups in hispolone may form a hydrogen bond
with the enzyme active site or dimer interface. The role of methoxy group as in the case of
hispolone methyl ether (8) appears optional.
When compounds ionizable by ESI in positive mode were assayed with 1 µM of PfTrxR
in 1 µM equimolar solution, compounds 1, 2, 3, 5, 6, 7, 8, 9 were identified as ligands (Table 2.3
and Figure 2.2). The ranking order of compound’s binding affinities in equimolar mixture for
PfTrxR is 6 > 7 > 2 > 8 > 9 > 5 > 1 > 3. Because the amount of PfTrxR available for binding
was the same as assayed individually, the ligands 6, 7, 2 and 8 competed more effectively for the
binding site than compounds 9, 5, 1 and 3. No previous work related to ligand-binding affinity
to PfTrxR or any other in-vitro antiplasmodial activity was found to be reported on compounds
1-10, except for compound 1, where antiplasmodial activity (> 200 µM) against P. falciparum

44
and antileishmanial activity (23.8 µM) against L. major was reported by Staerk et al. [26].
Figure 2.2 UF and LC-MS screening of equimolar mixture of compounds1, 2, 3, 5, 6, 7, 8 and 9
incubated with 1 µM PfTrxR.

45
2.5 Conclusions
Screening of natural compounds for ligand binding affinity to PfTrxR by UF and LC-MS
based approach can be used to address the challenges in the discovery of innovative and cost
effective broad spectrum antimalarial agents from plants. LC-MS conditions were developed for
all the test compounds prior to the binding assay. Among compounds screened, we found nine
compounds (1, 2, 3, 4, 5, 6, 7, 8 and 9) bound to the enzyme. Hispolone (7) showed highest
binding affinity when tested individually. When the selected eight ligands (1, 2, 3, 5, 6, 7, 8 and
9) were tested in equimolar mixture, compounds 6, 7, 2 and 8 displayed good binding to PfTrxR
in comparison to the rest of the ligands. Compounds with strong binding affinity to the enzyme
will be subjected to further functional assay studies to test their inhibitory activity.
46
2.6 References
1. P. Olliaro. Mode of action and mechanisms of resistance for antimalarial drugs. Pharmacol.
Ther. 2001, 89, 207 – 219.
2. S. Müller, T. W. Gilberger, Z. Krnajski, K. Liiersen, S. Meierjohann, R. D. Walter.
Thioredoxin and glutathione system of malaria parasite Plasmodium falciparum.
Protoplasma. 2001, 217, 43-49.
3. T. Zeller, G. Klug, Thioredoxins in bacteria: functions in oxidative stress response and
regulation of thioredoxin genes. Naturwissenschaften. 2006, 93, 259-266.
4. C. W. Wright. Recent developments in research on terrestrial plants used for the treatment of
malaria, Nat. Prod. Rep. 2010, 27, 961–968.
5. S. Schwikkard, F. R. van Heerden. Antimalarial activity of plant metabolites. Nat. Prod. Rep.
2002, 19 675-692.
6. D. D. Baker, M. Chu, U. Oza, V. Rajgarhia. The value of natural products to future
pharmaceutical discovery. Nat. Prod. Rep. 2007, 24, 1225–1244.
7. J. L. Wolfender, P. J. Eugster, N. Bohni, M. Cuendet. Advanced methods for natural product
drug discovery in the field of nutraceuticals. Chimia (Aarau). 2011, 65 (6), 400-6.
8. Y. Choi, R. B. van Breemen. Development of a screening assay for ligands to the estrogen
receptor based on magnetic microparticles and LC-MS. Comb. Chem. High T. Scr. 2008, 11,
1–6.
9. X. Cheng, R. B. van Breemen. Mass Spectrometry-Based Screening for Inhibitors of β-
Amyloid Protein Aggregation. Anal. Chem. 2005, 77(21), 7012–7015.
10. N. Jonker, J. Kool, H. Irth, W. M. A. Niessen. Recent developments in protein-ligand

47
affinity mass spectrometry. Anal. Bioanal. Chem. 2011, 399, 2669–2681.
11. D. Liu, J. Guo, Y. Luo, D. J. Broderick, M. I. Schimerlik, J. M. Pezzuto, R. B. van Breemen.
Screening for ligands of human retinoid X receptor-α using ultrafiltration mass
spectrometry. Anal. Chem. 2007, 79, 9398 - 9402.
12. Z. Liu, Z. Y. Du, Z. S. Huang, K.S. Lee, L. Q. Gu. Inhibition of thioredoxin reductase by
curcumin analogs. Biosci. Biotechnol. Biochem. 2008, 72, 2214-2218.
13. C. Morin, T. Besset, J. C. Moutet, M. Fayolle, M. Bruckner, D. Limosin, K. Becker, E.
Davioud-Charvet. The aza-analogues of 1, 4-naphthoquinones are potent substrates and
inhibitors of plasmodial thioredoxin and glutathione reductases and of human erythrocyte
glutathione reductase. Org. Biomol. Chem. 2008, 6, 2731-2742.
14. S. M. Kanzok, R. H. Schirmer, I. Turbachova, R. Iozef, K. Becker. The Thioredoxin system
of the malaria parasite Plasmodium falciparum. J. Biol. Chem. 2000, 275, 40180-40186.
15. M. M. Bradford. A rapid and sensitive method for the quantitation of microgram quantities
of proteins utilizing the principle of protein-dye binding. Anal. Biochem. 1976, 72, 248-254.
16. V. Mulabagal, A. I. Calderón. Development of binding assays to screen ligands for
Plasmodium falciparum thioredoxin and glutathione reductases by ultrafiltration and liquid
chromatography/mass spectrometry. J. Chromatogr. B. 2010, 878, 987-993.
17. P. R. Benoin, R. H. Burnell, J. D. Riedin. Alkaloids of Aspidosperma excelsum Benth. Can.
J. Chem. 1967, 45, 725-730.
18. J. H. Renault, J.-M. Nuzillard, G. Le Crouérour, P. Thépenier, M. Zèches-Hanrot, L. Le
Men-Olivier. Isolation of indole alkaloids from Catharanthus roseus by centrifugal partition
chromatography in the pH-zone refining mode. J. Chromatogr. A. 1999, 849, 421- 431.
19. M. Lin, J. B. Li, S. Z. Li, D. Q. Yu, X. T. Liang. A dimeric stilbene from Gnetum

48
parvifolium. Phytochemistry. 1992, 31, 633-638.
20. A. M. Morfaux, T. Mulamba, B. Richard, C. Delaude, G. Massiot, L. Le Men-Olivier.
Alkaloids of Pterotaberna inconspicua. Phytochemistry. 1982, 7, 1767-1769.
21. B. Jean. Alkaloids from Hernandia cordigera: Isolation of (+)-hernagine and synthesis of
(+)-N methylhernagine. C. R. Acad. Sci. 1980, 291, 187-189.
22. K. Yakushijin, S. Sugiyama, Y. Mori, H. Murata, H. Furukawa. Hernagine, a new aporphine
alkaloid, and 3-cyano-4-methoxypyridine from Hernandia nymphaefolia. Phytochemistry.
1980, 19, 161-162.
23. J. Desrivot, J. Waikedre, P. Cabalion, C. Herrenknecht, C. Bories, R. Hocquemiller, A.
Fournet. Antiparasitic activity of some new caledonian medicinal plants, J.
Ethnopharmacol. 2007, 112, 7-12.
24. M. Frederich, M. Tits, L. Angenot. Potential antimalarial activity of indole alkaloids, T. Roy.
Soc. Trop. Med. H. 2008, 102, 11-19.
25. J. Ravindran, G. V. Subbaraju, M. V. Ramani, B. Sung, B. B. Aggarwal.
Bisdemethylcurcumin and structurally related hispolon analogues of curcumin exhibit
enhanced prooxidant, anti-proliferative and anti-inflammatory activities in vitro. Biochem.
Pharmacol. 2010, 79, 1658-1666.
26. D. Staerk, E. Lemmich, J. Christensen, A. Kharazmi, C.E. Olsen, J.W. Jaroszewski.
Leishmanicidal, antiplasmodial and cytotoxic activity of indole alkaloids from Corynanthe
pachyceras. Planta. Med. 2000, 66, 531-536.

49
3. LC-MS based identification and structure elucidation of oleamide as a ligand of
Plasmodium falciparum thioredoxin reductase in Guatteria recurvisepala
3.1 Abstract
In this section we screened plant extracts for new ligands to Plasmodium falciparum
thioredoxin reductase (PfTrxR) followed by their identification and structure elucidation. The
detannified methanol extracts from Guatteria recurvisepala, Licania kallunkiae, Topobea
watsonii were screened for ligands to PfTrxR using ultrafiltration and liquid chromatography-
mass spectrometry based binding experiments. The PfTrxR ligand identified in the extract of
Guatteria recurvisepala displayed binding affinity of 3.5-fold when incubated with 1 µM
PfTrxR. The ligand corresponding to the protonated molecule m/z 282.2792 [M+H]+ was eluted
at a retention time of 17.95 min in a 20 min gradient of 95% B consisting of (A) 0.1% formic
acid in 95% H2O-5% ACN, and (B) 0.1% formic acid in 95% ACN-5% H2O in an LC-QTOF-
MS. Tandem MS of the protonated molecule m/z 282.2792 [M+H]+, C18H36NO (DBE: 2; Error:
1.13 ppm) resulted in two daughter ions m/z 265.2516 [M+H-NH3]+
(DBE: 3; Error: 0.35 ppm)
and m/z 247.2405 [M+H-NH3-H2O] +
, (DBE: 4, Error: 2.26 ppm). This PfTrxR ligand was
identified as oleamide and confirmed by comparison of the retention time, molecular formula,
accurate mass and double bond equivalence with a standard of oleamide. This is the first report
on the identification of oleamide as a PfTrxR ligand from Guatteria recurvisepala R.E. Fr.
(Annonaceae) and the corresponding in vitro activity against P. falciparum strain K1 (IC50 4.29
μg/mL).

50
3.2 Introduction
Drug discovery for treatment of malaria has been challenging because of the emergence of
parasites resistant to the conventional antimalarial drugs. Natural products have historically been
important sources of antimalarial agents such as artemisinin and quinine [1]. Even though plant-
derived natural products are used as traditional herbal remedies; most of them have not been
explored for the discovery of new targets for malaria parasite [2]. For this reason, more research
on new antimalarial compounds from natural products is needed to develop new therapeutic
agents with novel mechanisms of action against Plasmodium falciparum. Plasmodium
falciparum thioredoxin reductase (PfTrxR) plays a significant role in antioxidant defense and
redox regulation of the parasite and has been previously validated by knock-out studies as a
potential drug target for malaria chemotherapy [3].
Plant extracts contain large numbers of different chemical constituents making it difficult
to ascertain their antimalarial activity before isolation of the bioactive compounds. A suitable
tool to speed up natural product drug discovery is the application of UF-LC-MS based binding
assays [4] to screen complex mixtures from plant origins for their binding affinity towards
PfTrxR followed by MS based structure elucidation and confirmation of the identity of new
ligands.
In this study, extracts from three Panamanian plants Guatteria recurvisepala R.E. Fr.
(Annonaceae), Topobea watsonii Cogn. (Melastomataceae) and Licania kallunkiae Prance
(Chrysobalanaceae), previously shown to be active in antimalarial screening program of
Panamanian plants were examined to identify new ligands for PfTrxR using our in house in vitro

51
binding experiments. Guatteria recurvisepala is a tree 25 m high that grows in evergreen forests.
It is characterized taxonomically by young ferrugineous-tomentose branches and various flowers
in the axila of the leaves [5]. Genus Guatteria is the largest genus of Neotropical trees with 265
species wide spread throughout central and tropical America. Guatteria species are known for
their use in traditional medicine to treat dyspepsia, stomach-ache and uterine pain and also as
febrifuges [6].
During the course of our antimalarial screening program using in vitro PfTrxR UF-LC-MS
based binding experiments for natural products, the detannified methanol extract of Guatteria
recurvisepala was found to contain a ligand for PfTrxR. This led us to examine the identity of
the chemical constituent responsible for binding to PfTrxR. In this chapter we report the in vitro
antiplasmodial activity of the tested plant extracts, the identification of ligands to PfTrxR by UF-
LC-MS based assay and structure elucidation confirmation of the PfTrxR ligand by using high
resolution mass spectrometry.
3.2.1 Mass spectrometry for identification and structure elucidation of natural products
A mass spectrometry based approach is an attractive technique for HTS in drug discovery
because they provide the accurate mass of the molecule and specific information on the analyte
which is used to determine the elemental formulae. Hyphenated techniques such as LC-MS have
played a key role in identification of active principles from plant extracts and other complex
mixtures which otherwise is a laborious and slow process involving isolation, purification, and
structural elucidation steps, which are usually expensive and time-consuming [7]. These
techniques combine the separation method with a structural identification technique, usually MS

52
and NMR. Although NMR is the most powerful technique for the structural elucidation of
organic compounds, drawbacks of coupling NMR to LC limits its use as readout compared to
MS which has higher sensitivity. Whereas LC-UV alone does not provide complete data for
structural elucidation, development of the diode array detector (DAD) has increased its detection
power and effectiveness. UV-DAD has been more and more often applied as a first detection
method in identification studies using LC because it is rapid and inexpensive, as compared to the
other techniques [7].
In LC-MS, complex mixtures and plant extracts are separated in an LC column and sent to
the mass spectrometer where they are ionized and further separated in the mass analyzer
according to their mass-to-charge (m/z) ratio. In tandem mass spectrometry (MS/MS), an ion
(called precursor ion) from the first stage of MS is selected and activated, to produce fragment
ions, which are then analyzed in the second stage of MS. The most widely employed ion
activation method is the collision induced dissociation (CID), which consists in promoting the
energy-controlled collision of a chemically inert gas, (e.g. Ar, He, N2, or CO2) with the precursor
ion (Figure 3.1). The collision energy may be chosen, in order to optimize the MS/MS spectrum.
Low collision energy values promote soft fragmentation and produce few fragments, whereas
high collision energy values prompt extensive fragmentation, so the produced fragment ions can
be used to obtain structural information. On the other hand, important structural information can
be obtained and eventual comparison with spectral libraries may be made when moderate
collision energy values are utilized. MS spectrometers that are used in MS/MS experiments can
be of two main types: i) instruments that are able to store the ions, thus allowing for selection of

53
Figure 3.1 Representation of the CID process in tandem mass spectrometry (MS/MS) [8].
the target ions by injection with authentic patterns, followed by fragmentation, hence generating
the mass spectra (e.g. ion cyclotron resonance (ICR), quadrupole ion trap (IT)) and ii)
instruments that use a sequence of mass spectrometers in space consisting of quadrupole mass
analyzers in sequence (e.g, triple quadrupole, QqQ), or a hybrid MS with quadrupole in sequence
e.g., quadrupole-time-of-flight (QTOF) [8].
3.2.2 Dereplication of natural products by mass spectrometry
Plant extracts and microorganisms contain a vast number of chemical constituents that may
be biologically active and need to be prioritized for the discovery of new drug molecules. For
instance, most of the anticancer and antimalarial drugs have been discovered directly from
natural products (NPs) or are semi-synthetic derivatives of these natural products. Discovery of
novel bioactive compounds from plants is a challenging, laborious, expensive process and
requires long time to isolate and characterize an active compound. If the isolated bioactive is
known compound then the time and resources spent on it will be a wasted effort [9]. To

54
overcome these issues, the scientific community has introduced new techniques for the direct
identification of bioactive natural products from extracts, thus avoiding re-isolation of already
known compounds. Recent HTS technologies to assay plant extracts for biological activity has
intensified the need for appropriate dereplication strategies.
Dereplication is the process that allows for the rapid identification of bioactive
metabolites in crude extracts by distinguishing previously identified compounds from novel
ones. This technique avoids repetitive work of isolation of already known NPs. The dereplication
process involves separation of single metabolites by chromatographic methods, identification of
these compounds by spectroscopic methods, bioassays for evaluation of the biological activity,
and searches in databases for verification of the novelty of these compounds. Liquid
chromatography, which enables the analysis of about 60% to 80% of all the existing compounds,
has been the most useful tool for the separation of complex mixtures of small molecules [10].
HPLC allows the analyst to identify known compounds by comparison of their retention time
and UV spectra which requires the compilation of an internal database because these parameters
are not present as searchable fields in most databases. Since UV is not an specific detector,
dereplication of unknowns is difficult. Over the past few years, LC-MS combined with DAD has
become a widely used tool for dereplication of natural products because of the advantage of
using the nominal molecular weight as a search query in nearly all databases along with the UV
data to narrow down the answer set. Liquid chromatography mass spectrometry (LC-MS) is a
highly sensitive and selective method for identification of NPs in complex mixtures. Compounds
separated in the LC column are directed to the mass spectrometer, where they are ionized and
separated in the mass analyzer according to their mass-to-charge (m/z) ratio. Structure
elucidation of the unknown ionized analyte can be achieved by tandem mass spectrometry. In

55
tandem mass spectrometry (MS/MS), an ion (called precursor ion) from the first stage of MS is
selected and activated, to produce fragment ions, which are then analyzed in the second stage of
MS to produce fragment ions that can be used to obtain structural information. Dereplication of
NPs by means of LC-MS and ESI-MS/MS has often been accomplished on the basis of retention
times, UV-DAD spectra, and MS/MS data obtained for each peak of the chromatogram of the
crude plant extract as compared to those of previously analyzed authentic standards [10]. MS/MS
data of the authentic standards are obtained using the same collision energy value, which is also
employed in LC-MS/MS experiments involving the crude extract. The presence of structure
diagnostic fragment ions (DFI) is very important for distinction between structural features or for
characterization of a class of NPs.
3.3 Materials and Methods
3.3.1 Chemicals and enzymes
Solvents used for LC-MS and tandem MS analysis were purchased from Fischer Scientific
International (Atlanta, GA). Buffer salts, chloroquine (purity ≥ 98%) and oleamide (purity 99%)
used as standard compounds were purchased from Sigma-Aldrich (Allentown, PA). Deionized
water generated by a Milli-Q water system (Millipore, MA) was used in the experiments. PfTrxR
(Mr 59 kDa) enzyme was provided as a gift by Prof. Katja Becker, Justus-Liebig University,
Germany. The recombinant PfTrxR was prepared and purified using silver-stained SDS page
according to the procedure published by Kanzok et al [7, 11]. The specific activity of PfTrxR
(1.9 U/mg) was determined by DTNB [5, 5’-dithiobis (2-nitrobenzoic acid)]. Protein
concentration of enzymes was determined by Bradford method [8, 12].

56
3.3.2 Plant material
Plants were collected mainly from tropical forests in Panama. Taxonomical information,
date and place of collection are provided in Table 3.1. Plants were collected by botanists Carlos
Guerra and Alex Espinosa from CIFLORPAN, University of Panama. Taxonomic identification
of the plants was performed by Alex Espinosa. Voucher specimens are deposited at the
Herbarium of the University of Panama (PMA), Panama.
Table 3.1 Taxonomic information on the studied plants.
Scientific name
Family
Voucher no.
Collection place / Date of
collection
Topobea watsonii
Cogn.
Melastomataceae
FLORPAN
6984
El Cope, Cocle. N 08° 36' 52.4" W
080° 09' 09.2". 740 m.a.s.l.
April 12, 2007.
Guatteria
recurvisepala
R.E. Fr.
Annonaceae
FLORPAN
7018
Cerro Azul, Panama. N 09º 11'
47.5" W 79º 23' 53.3". 694 m.a.s.l.
April 20, 2007.
Licania kallunkiae
Prance
Chrysobalanaceae
FLORPAN
7100
Cerro Azul, Panama.
N 09º 11'
59.4" W 079º 23' 39.5".
740 m.a.s.l.June 7, 2007.
m.a.s.l.:meters above sea level.

57
3.3.3 Extraction and isolation
The extracts were prepared according to the published method [9, 13]. Plant material was
extracted with dichloromethane-methanol (1:1 v/v, 600 mL x 2) for 24 h. The extracts were
filtered and concentrated in vacuo at < 40 °C in a rotary evaporator. The dried extract was
redissolved in 100 mL of 90% methanol in water and was partitioned with n-hexane (30 mL, x
3). The aqueous methanol extract portion was collected, concentrated in vacuo and the
concentrate was treated with 200 mL of a mixture of 20% methanol in chloroform-water (1:1).
The resulting extract was washed three times with 50 mL of 1% NaCl. The aqueous phase was
discarded and the organic phase was concentrated in vacuo. The plant extracts were stored at -80
°C until testing.
3.4 Antiplasmodial assays
3.4.1 Antiplasmodial screening of plant extracts
Antiplasmodial activity was determined in a chloroquine resistant P. falciparum strain (W2
Indochina) utilizing a novel microfluorimetric assay to measure the inhibition of parasite growth
based on detection of parasitic DNA by intercalation using Pico Green [8, 14]. The IC50 values
were calculated from relative fluorescence units as compared with untreated controls. The
parasites were maintained at 2% hematocrit in flat bottom flasks (75 mL) in human red blood
cells from O positive blood type donors with RPMI 1640 medium (Gibco BRL) supplemented

58
with 10% O positive human serum. Chloroquine was used as a standard antimalarial drug and
showed an IC50 value of 85.75 µg/mL.
3.4.2 Antiplasmodial activity and IC50 value of oleamide
Antiplasmodial activity was determined using the K1 strain of P. falciparum (resistant to
chloroquine and pyrimethamine). A modification of the [3H]-hypoxanthine incorporation assay
was used [15]. Briefly, infected human red blood cells in RPMI 1640 medium with 5%
Albumax were exposed to serial drug dilutions in microtiter plates. After 48 h at 37 °C in
reduced oxygen atmosphere, 0.5 μCi [3H]-hypoxanthine was added to each well. Cultures were
incubated for a further 24 h before they were harvested onto glass-fiber filters and washed with
distilled water. The radioactivity was counted using a Betaplate TM liquid scintillation counter
(Wallac, Zurich, Switzerland).The results were recorded as counts per minute (CPM) per well at
each drug concentration and expressed as percentage of the untreated controls. From the
sigmoidal inhibition curves, IC50 values were calculated. Assays were run in duplicate and
repeated once. Chloroquine was used as a reference antimalarial drug and showed an IC50 value
of 0.069 µg/mL.
3.5 PfTrxR enzyme binding assay using ultrafiltration (UF) and LC-MS
All the plant extracts were tested for their binding affinity at 100 µg/mL. The binding assay
was performed according to the published method [4]. The ligands were reconstituted in 100 µL
of MeOH_
H2O (80:20, v/v) and were analyzed by LC-MS. Denatured enzyme was used for

59
controlled experiment and assays were carried out in duplicate. Bis-2, 4-dinitrophenyl sulfide
was used as a reference compound.
3.6 LC-MS and tandem MS analysis
Plant extracts for LC-MS analysis were prepared using MeOH - H2O (80:20, v/v). Liquid
chromatography analysis of plant extracts was performed using a ZORBAX Eclipse plus C18
column (2.1 mm x 100 mm, 1.8 µm) at a flow rate of 0.2 mL/min. The plant extracts were
analyzed at 25 µg/mL using gradient mobile phase (5% B → 95% B in 15 min, 95% B from 15 -
18 min and return to 5% B at 20 min) consisting of (A) 0.1% formic acid in 95% H2O-5% ACN
(v/v/v) and (B) 0.1% formic acid in 95% ACN-5% H2O (v/v/v) at a flow rate of 0.2 mL/min for
a run time of 20 min. The LC-MS analysis was carried out in an Agilent (Little Falls, DE) 6520
accurate-mass quadrupole time of flight (Q-TOF) mass spectrometer equipped with a 1220 rapid
resolution liquid chromatography (RRLC) system. The chemical constituents in the plant extract
were detected using positive ESI. The standard compound oleamide was analyzed at 1 µM under
the same conditions mentioned above. All the tested compounds were detected by MS at
capillary voltage of 3200-3500 V for ESI positive mode. Nitrogen was supplied as nebulizing
and drying gas at flow rates of 25 and 600 L/h, respectively. The drying gas temperature was
350 oC. The fragmentor voltage was optimized to 175-180 eV. In tandem LC-MS/MS analysis,
the PfTrxR ligand from Guatteria recurvisepala plant extract and oleamide were subjected to
MS/MS experiments using the following parameters: collision energy 60 v, slope 6 m/z offset 8
v, acquisition rate 1.4 spectra/sec, time 714.3 ms/spectrum to study their fragmentation pattern.
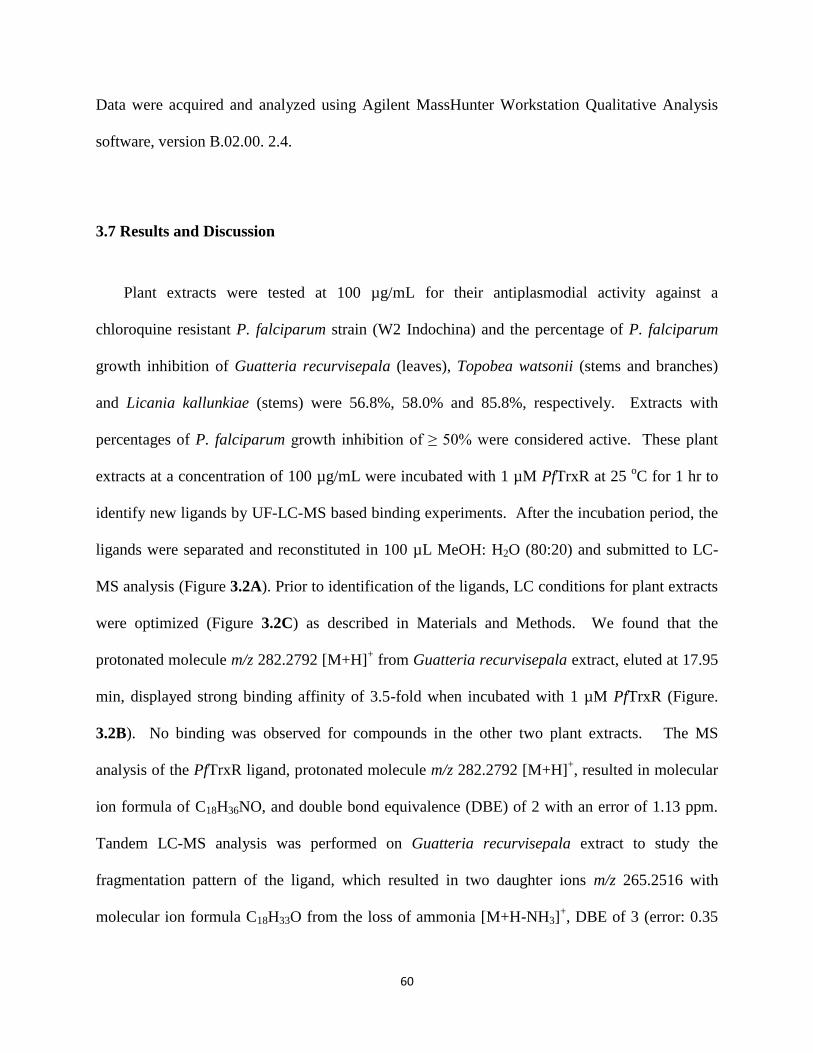
60
Data were acquired and analyzed using Agilent MassHunter Workstation Qualitative Analysis
software, version B.02.00. 2.4.
3.7 Results and Discussion
Plant extracts were tested at 100 µg/mL for their antiplasmodial activity against a
chloroquine resistant P. falciparum strain (W2 Indochina) and the percentage of P. falciparum
growth inhibition of Guatteria recurvisepala (leaves), Topobea watsonii (stems and branches)
and Licania kallunkiae (stems) were 56.8%, 58.0% and 85.8%, respectively. Extracts with
percentages of P. falciparum growth inhibition of ≥ 50% were considered active. These plant
extracts at a concentration of 100 µg/mL were incubated with 1 µM PfTrxR at 25 oC for 1 hr to
identify new ligands by UF-LC-MS based binding experiments. After the incubation period, the
ligands were separated and reconstituted in 100 µL MeOH: H2O (80:20) and submitted to LC-
MS analysis (Figure 3.2A). Prior to identification of the ligands, LC conditions for plant extracts
were optimized (Figure 3.2C) as described in Materials and Methods. We found that the
protonated molecule m/z 282.2792 [M+H]+ from Guatteria recurvisepala extract, eluted at 17.95
min, displayed strong binding affinity of 3.5-fold when incubated with 1 µM PfTrxR (Figure.
3.2B). No binding was observed for compounds in the other two plant extracts. The MS
analysis of the PfTrxR ligand, protonated molecule m/z 282.2792 [M+H]+, resulted in molecular
ion formula of C18H36NO, and double bond equivalence (DBE) of 2 with an error of 1.13 ppm.
Tandem LC-MS analysis was performed on Guatteria recurvisepala extract to study the
fragmentation pattern of the ligand, which resulted in two daughter ions m/z 265.2516 with
molecular ion formula C18H33O from the loss of ammonia [M+H-NH3]+, DBE of 3 (error: 0.35

61
ppm), and m/z 247.2405 with molecular ion formula of C18H31 from the loss of ammonia and
water [M+H-NH3-H2O]+, DBE of 4, (error: 2.26 ppm). Following MS analysis of the ligand,
standard compound oleamide was analyzed under similar LC-MS (Figure 3.2D) and tandem
MS/MS conditions (Figure 3.3). The exact mass, retention time, DBE and fragmented ions of
oleamide [11, 16] were exactly the same as those of the PfTrxR ligand from the plant extract. On
the basis of the above results, we confirm the identity of PfTrxR ligand from Guatteria
recurvisepala extract as oleamide. Oleamide was submitted to in vitro testing against P.
falciparum K1 and displayed an IC50 of 4.29 μg/mL.
Figure 3.2 UF-LC-MS based binding experiment of Guatteria recurvisepala plant extract
incubated with 1 µM PfTrxR. Solid line represents the ligand incubated with active enzyme and

62
the dotted line represents the control experiments using denatured enzyme. (B) Extracted ion
chromatogram (EIC) of ligand from binding experiment of Guatteria recurvisepala extract. (C)
EIC of protonated molecule m/z 282.2792 [M+H]+ from LC-MS analysis of plant extract. (D)
EIC of oleamide from LC-MS analysis of standard compound oleamide with its structure
Figure 3.3 MS analysis of standard compound oleamide with parent ion m/z 282.2792 [M+H]+
(ions at m/z 121.0507 and 922.0086 correspond to reference masses) and MS/MS analysis of
oleamide producing two daughter ions m/z 247.2406 and m/z 265. 2525.
Detannified methanol extracts of Guatteria recurvisepala (Annonaceae), Topobea
watsonii (Melastomataceae) and Licania kallunkiae (Chrysobalanaceae) displayed in vitro
antiplasmodial activity when tested against Plasmodium falciparum W2 Indochina strain. These
plant extracts were tested to identify ligands for PfTrxR by UF-LC-MS based binding

63
experiments. Extracts were initially analyzed in both ESI negative and positive modes with the
same LC conditions. The chemical constituents of the plant extracts displayed higher ionization
efficiency in ESI positive mode; hence binding experiments were carried out in this mode.
Among the three plant extracts, protonated molecule m/z 282.2792 [M+H]+
from Guatteria
recurvisepala displayed binding affinity to the enzyme. Members of the Annonaceae family such
as Guatteria species (bark) are known for their antimalarial activity [12, 17]. MS/MS
experiments on the ligand from Guatteria recurvisepala led to its identification as oleamide.
UF-LC-MS based binding experiments can be considered as an alternative technique to identify
ligands from plant extracts in contrast to other techniques which otherwise are associated with
high cost and time consuming methods to isolate, purify and identify the chemical constituents
from plant extracts. We report here the first time oleamide from Guatteria recurvisepala plant
extract and as a ligand to PfTrxR. Oleamide was earlier identified in the plant extract of
Aquilegia vulgaris L. (Ranunculaceae) [13, 18] and essential oil of fresh mountain celery
(Cryptotaenia japonica Hassk, Apiaceae) [14, 19].
3.8 Conclusions
The LC-MS based PfTrxR-ligand binding approach was validated to screen plant extracts by
the antiplasmodial activity displayed by oleamide when tested as a pure compound. Herein we
suggest that MS based binding experiments with their exceptional selectivity and high sensitivity
have greater potential to identify ligands [15, 20] directly from the plant extracts to provide
specific information that can be used for isolation and characterization of specific chemical
constituents ignoring others.

64
3.9 References
1. M. A. van Agtmael, T. A. Eggelte, C. J. van Boxtel. Artemisinin drugs in the treatment of
malaria: from medicinal herb to registered medication. Trends in Pharmacol. Sci. 1999, 20,
199-205.
2. M. J. Balunas, A. D. Kinghorn. Drug discovery from medicinal plants. Life Sci. 2005, 78,
431-441.
3. A. D. Andricopulo, M. B. Akoachere, R. Krogh, C. Nickel, M. J. McLeish, G. L. Kenyon, L.
D. Arscott, C. H. Williams, E. Davioud-Charveta, K. Beckerc. Specific inhibitors of
Plasmodium falciparum thioredoxin reductase as potential antimalarial agents. Bioorg. Med.
Chem. Lett. 2006, 16, 2283-2292.
4. V. Mulabagal, A. I. Calderón. Development of binding assays to screen ligands for
Plasmodium falciparum thioredoxin and glutathione reductases by ultrafiltration and liquid
chromatography/mass spectrometry. J. Chromatogr. B. 2010, 878, 987-993.
5. W. D. Douglas. Florade Nicaragua Online. Available at
http://mobot.mobot.org/W3T/Search/Nicaragua/projsflnic.html. Accessed on November 11,
2010.
6. G. S. M. Jose, H. A. A. Eloisa, M. M. C. Lea, O. Jorge, S. A. Josiele. Essential oils of the
amazon Guatteria and Guatteriopsis species. Flavour Fragr. J. 2005, 20, 478-480.
7. K. Tobias, F. Oliver. Advances in structure elucidation of small molecules using mass
spectrometry. Bioanal. Rev. 2010, 2, 23–60.

65
8. J. D. Herbert, I. M. Nathalya, E. M. C. Antônio. Electrospray ionization tandem mass
spectrometry as a tool for the structural elucidation and dereplication of natural products:
An overview. Tandem Mass Spectrometry - Applications and Principles. 2012, 595-618.
9. A. C. Geoffrey and G. S. Young. Finding the needle in the haystack. The dereplication of
natural product extracts. Pure Appl. Chem. 1999, 71 (6), 1089-1094.
10. J. L. Wolfender, K. Ndjoko, K. Hostettmann. Liquid chromatography with ultraviolet
absorbance–mass spectrometry detection and with nuclear magnetic resonance: a powerful
combination for the on line structural investigation of plant metabolites. J. Chromatogr. A.
2003, 1000, 437-455.
11. S. M. Kanzok, R. H. Schirmer, I. Turbachova, R. Iozef, K. Becker. The thioredoxin system
of the malaria parasite Plasmodium falciparum. J. Biol. Chem. 2000, 275, 40180-40186.
12. M. M. Bradford. A rapid and sensitive method for the quantitation of microgram quantities
of proteins utilizing the principle of protein-dye binding. Anal. Biochem. 1976, 72, 248-254.
13. M. E. Wall, M. C. Wani, D. M. Brown, F. Fullas, J. B. Olwald, F. F. Josephson, N. M.
Thornton, J. M. Pezzuto, C. W. W. Beecher. Effect of tannins on screening of plant extracts
for enzyme inhibitory activity and techniques for their removal. Phytomedicine. 1996, 3,
281-285.
14. Y. Corbett, L. Herrera, L. Cubilla, T. L. Capson, P. D. Coley, T. A. Kursar, L. I. Romero, E.
A. Ortega-Barría. Novel DNA-based microfluorimetric method to evaluate antimalarial drug
activity. Am. J. Trop. Med. Hyg. 2004, 70, 119-124.
15. H. Matile, J. R. L. Pink. Plasmodium falciparum malaria parasite cultures and their use in
immunology. Immunological Methods. 1990, 231-234.
66
16. F. C. Benjamin, A. L. Richard, L. B. Dale. Structure determination of an endogenous sleep-
inducing lipid, cis-9-octadecenamide (oleamide): A synthetic approach to the chemical
analysis of trace quantities of a natural product. J. Am. Chem. Soc. 1996, 118, 580-590
17. W. Milliken. Malaria and antimalarial plants in Roraima, Brazil. Econ. Bot. 1997, 51, 212-
237.
18. R. Solomonia, N. Kuchiashvili, A. Berulava, V. Pkhakadze, N. Trapaidze, M. Zhvania, I.
Abesadze, H. Kojima, N. Dalakishvili. Purification and identification of components of the
Aquilegia vulgaris extract fraction exhibiting anti-epileptic activity. J. Biol. Phys. Chem.
2004, 4, 185-192.
19. M. C. Cheng, Y. B Ker, T. H. Yu, L. Y. Lin, R. Y. Peng, C. H. Peng. Chemical synthesis of
9(z)-octadecenamide and its hypolipidemic effect: a bioactive agent found in the essential
oil of mountain celery seeds. J. Agric. Food. Chem. 2010, 58, 1502-1508.
20. Z. Christine, H. Georg, T. W. Klaus. Expanding the scope of MS binding assays to low-
affinity markers as exemplified for mGAT1. Anal. Bioanal. Chem. 2008, 391, 309-316.
67
4. Development of liquid chromatography/mass spectrometry based screening assay for
PfTrxR inhibitors using relative quantitation of intact thioredoxin.
4.1 Abstract
We have developed a liquid chromatography/mass spectrometry (LC-MS)-based functional
assay to identify inhibitors of PfTrxR by quantifying the product formed (Trx–(SH)2) in the
enzymatic reaction. Relative quantitation of the reaction product (intact Trx–(SH)2) was carried
out using an Agilent 6520 QTOF mass spectrometer equipped with a positive mode electrospray
ionization (ESI) source. The calibration curve prepared for Trx–(SH)2 at concentrations ranging
from 1.8 to 116.5 mg/mL was linear (R2
> 0.998). The limit of detection (LOD) and limit of
quantification (LOQ) of Trx–(SH)2 were at 0.45 and 1.8 mg/mL respectively. To validate the
developed functional assay we have screened reference compounds 1, 2 and 3 for their PfTrxR
inhibitory activity and ten natural compounds (at 10 mM) which were earlier identified as ligands
of PfTrxR by a UF-LC-MS based binding assay. The developed LC-MS-based functional assay
for identification of inhibitors of PfTrxR is a sensitive and reliable method that is also amendable
for high-throughput format. This is the first representation of a relative quantitation of intact
Trx–(SH)2 using LC-MS.
68
4.2 Introduction
Malaria continues to be a significant health problem of global dimensions. Only a limited
number of chemotherapeutic agents for the treatment of malaria are available, and the growing
problem of drug resistance makes adequate treatment of malaria increasingly difficult [1].
Screening natural products in enzymatic bioassays remains challenging with resource-intensive
steps in the natural product drug discovery process [2]. P. falciparum (Pf) thioredoxin reductase
(TrxR), a 59 kDa flavoprotein catalyzes the NADPH dependent reduction of P. falciparum
thioredoxin (PfTrx), an 11.7 kDa protein. Thioredoxin (Trx) contains two redox-active half-
cystine residues in an exposed active center, having CysGly-Pro-Cys sequence. Trx exists
2 2). The S-S-bond
2 2 by NADPH and Pf 2 regulates the
activity of P. falciparum by reducing the cellular environment. Trx (SH)2 acts as hydrogen
donor to ribonucleotide reductase and methionine sulfoxide reductase, involved in DNA
2 can directly reduce hydrogen peroxide and can function
as both single oxy 2
are in response to oxidative stress of the parasite [4]. Inhibition of PfTrxR enzyme is likely to
affect the parasite at several vulnerable points resulting in enhanced oxidative stress, ineffective
DNA synthesis and cell division, and disturbed redox regulatory processes. Disruption of the
Trx/TrxR balance would have pleiotropic effects on cellular function making it an attractive
target for disease control [5]. Enzymatic assays like NADPH, 5,5'-dithiobis(2-nitrobenzoate)
(DTNB) and insulin reduction assays have been developed for testing a variety of compounds for
their inhibitory activity towards PfTrxR. These assays do not measure product formed (reduced

69
PfTrx) in the reaction; they instead measure inhibitory activity based on UV detection at 340 nm
of decreased NADPH levels, 412 and 405 nm of reduced DTNB levels during the enzymatic
reaction, respectively -MS)
in the 2 from the enzymatic reaction
based not only on significant differences in protein mass but also on variations in levels of
protein formation in the reaction can be a useful tool in the analysis and identification of specific
inhibitors for PfTrxR [9].
4.2.1 Role of mass spectrometry for detection of enzyme inhibition
Enzymes are one of the most important classes of drug targets because of the essential roles
played by enzymes in life processes and pathophysiology. In the drug discovery process a
macromolecule such as an enzyme whose activity is essential for pathogenic species is selected
and a library of pure compounds or mixtures of compounds are screened to identify inhibitors. It
is of utmost importance to develop rapid and sensitive methods for the study of enzymatic
catalysis mechanisms and the characterization of enzymatic activities. Many screening
methodologies like UV, radioactivity and fluorescence detection techniques have been employed
to identify inhibitors and to study kinetic parameters. Many of the biochemical assays for
detection of enzyme inhibition are based on the change of the spectroscopic properties during the
conversion of the substrate or cofactor [10]. The major drawback of these techniques is that most
natural substrates do not possess the fluorescent or chromophoric moieties; therefore it is
necessary to introduce those functionalities synthetically into the molecular structure. These
modifications might alter the enzyme recognition of the substrate compound, thus changing the

70
kinetic behavior significantly. The use of radioisotope substrates in enzymatic reactions is
advantageous but unfortunately, the availability of radioactive-labeled substrate compounds were
often limited.
Therefore, the demand for a label-free, non-radioactive biochemical assays like MS
based enzymatic assays can be a viable alternative to established detection methods. There are
several advantages of using MS for screening over other techniques. MS based screening assays
can be performed in label free mode, can detect a range of compounds such as substrate,
product(s), cofactors and coenzymes, and internal standards (ISs) which can be used to monitor
the relative enzyme activity and enzyme inhibition. Accurate mass and fragmentation of
identified molecule can lead to discovery of selective inhibitors [10]. ESI-MS plays an important
role in a wide range of different applications such as analyte quantification, structure elucidation
of biomolecules as well as protein-protein- and protein-ligand interaction studies. The enzymatic
reaction carried out off-line can be quenched with 0.5% formic acid or methanol after a defined
time. Then the crude reaction mixture can be directly injected into an ESI-MS system and the
amount of product formed can be quantified using a calibration curve. The inhibitory activity of
the library of compounds can be assessed by comparison to the amount of product formed in a
reference assay where there is no inhibitor as in Figure 4.1. ESI-MS-based assay schemes have
the advantage of being directly compatible to the liquid-phase reaction conditions [11].
Therefore, it is possible to monitor enzymatic conversions on-line by coupling the reaction vessel
directly to the ionization interface of the mass spectrometer.
Generally, the application of mass spectrometry for detection in enzymatic bioassays
offers very intriguing possibilities. MS-based assay schemes certainly cannot replace the optical
or radioactivity-based assay schemes in routine analysis, but they are an extremely valuable

71
alternative providing access to areas of enzymology, which could not be studied by the
established methodologies [11]. Furthermore, MS-detection schemes seem to have a great
potential for the application in high-throughput screening procedures in drug development and
biocatalysis research.
Figure 4.1 The principles of MS-based screening. (A) Direct screening of the enzyme-inhibitor
complex; (B) Direct screening of inhibitor after complex dissociation; and, (C) Indirect screening
by reporter molecules [10].

72
4.2.2 Identification and quantitation of intact proteins
Our goal was to develop a functional assay to screen natural products for PfTrxR inhibitors
2 in the enzymatic reaction by LC-MS. There is
substantial sample complexity in an enzymatic reaction mixture, which makes it difficult to
resolve and accurately quantify proteins of interest. This work represents a method which
circumvents the challenge of separating the proteins of interest from the enzymatic reaction
mixture and simultaneously quantifying the proteins [12]. Mass spectrometry of proteins can use
either the "bottom up" or the "top down" approach. The top-down proteomic techniques in which
intact proteins rather than peptides are measured, are advantageous for the detection of post-
translational modifications [13]. Signal intensity based relative quantitation approaches are
promising alternatives to isotope labeling approaches and have been applied to quantify
differentially expressed proteins from complex biological samples [14]. Protein peak intensity
measurement is simple and cost effective and has demonstrated high reproducibility and
linearity. Several studies have demonstrated that extracted ion chromatograms of selected m/z
values from MS spectra of the protein correlated well with protein abundance in complex
biological samples [14]. It is important to recognize that the top-down method characterizes and
measures intact protein without the use of enzymatic digestion and distinguishes between
multiple protein isoforms or distinct proteins that share a common peptide sequence. Intact
proteins are chromatographically separated and introduced directly into the mass spectrometer,
and separated on the basis of their mass-to-charge ratio. Quantitative analysis of intact proteins
is commonly addressed using reversed phase chromatography coupled with mass spectrometric-

73
based approaches [15]. Consequently, the demand for the determination of concentrations of
intact proteins in drug development has significantly increased in recent years. The developed
2 in control with test
samples, a relative peak area ratio is obtained. This ratio can then be used to determine the
inhibitory activity of the ligands on PfTrxR [16]. Mass spectrometry analysis of intact proteins in
the PfTrxR functional assay demonstrates a high degree of sensitivity, specificity and reliability.
4.3 Experimental
4.3.1 Chemicals and reagents
2 (E. coli,
recombinant) were purchased from Sigma─Aldrich (St. Louis, MO). Solvents were purchased
2 was purchased from Wako
Chemicals USA, Inc. Compounds (4 13) were purchased from AnalytiCon Discovery GmbH
(Germany). Compounds 1 3 (bis 2,4-dinitrophenyl sulfide (1), 4-nitrobenzothiadiazole (2) and
3-(dimethylamino)-propiophenone (3)) (Figure 4.2), were purchased from Sigma─Aldrich (St.
Louis, MO). Double deionized water was generated by a Milli-Q water system (Millipore, MA).
Nanosep® 30 kDa MWCO filters were purchased from Pall® Life Sciences, Ann Arbor, MI.
PfTrxR (Mr, 59 kDa) enzyme was a kind gift from Prof. Katja Becker, Justus-Liebig University,
Giessen, Germany. The recombinant PfTrxR was prepared and purified using silver-stained SDS
page according to the procedure published by Kanzok et al. [17]. The specific activity of PfTrxR
(1.9 U/mg) was determined by DTNB [5,5-dithiobis(2-nitrobenzoic acid)]. Protein concentration
of enzymes was determined by Bradford method [18].
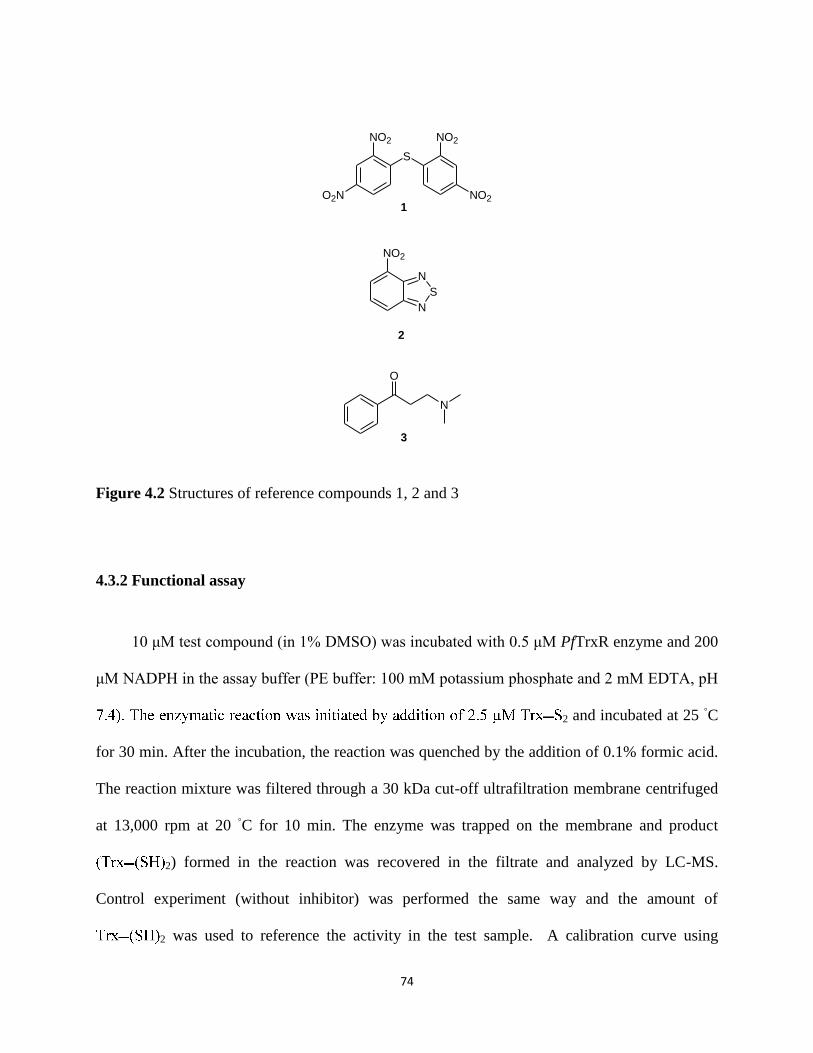
74
S
NO2
O2N
NO2
NO2
N
S
N
NO2
N
O
1
2
3
Figure 4.2 Structures of reference compounds 1, 2 and 3
4.3.2 Functional assay
10 μM test compound (in 1% DMSO) was incubated with 0.5 μM PfTrxR enzyme and 200
μM NADPH in the assay buffer (PE buffer: 100 mM potassium phosphate and 2 mM EDTA, pH
2 and incubated at 25 ◦C
for 30 min. After the incubation, the reaction was quenched by the addition of 0.1% formic acid.
The reaction mixture was filtered through a 30 kDa cut-off ultrafiltration membrane centrifuged
at 13,000 rpm at 20 ◦C for 10 min. The enzyme was trapped on the membrane and product
2) formed in the reaction was recovered in the filtrate and analyzed by LC-MS.
Control experiment (without inhibitor) was performed the same way and the amount of
2 was used to reference the activity in the test sample. A calibration curve using

75
2 2 produced in
the reactions.
4.3.3 Sample preparation
Trx (1 mg/mL) stock solutions were prepared in PE buffer. NADPH 2 mg/mL stock
solution was prepared in 80% PE buffer. Inhibitor stock solutions were prepared in DMSO. The
concentration of DMSO in the assay was kept at 1%.
4.3.4 Trx–(SH)2 calibration curve
Serial dilutions of reduced Pf 2) ranging from 1.8 to 116.5 µg/mL were
prepared in PE buffer. Triplicate data points were collected and plotted using the least squares
regression (Figure 4.3).
Figure 4.3 2.

76
4.3.5 LC-MS analysis of intact thioredoxin
An Agilent 1220 Rapid Resolution Liquid Chromatography (RRLC) system (Agilent
technologies, Santa Clara, CA) coupled to mass spectrometer was used to separate two intact
2 2 intact proteins were loaded
on a 2.1 mm (internal diameter) Poroshell 300 SB C18 (length 75 mm) column (particle size 5
μM) with a flow rate of 0.4 mL/min in solution A water (0.1% formic acid) and solution B
acetonitrile (0.1% formic acid). The gradient was run as follows: 3% B for 0-2 min, 3-35% B for
2 min and 35-65% B for 6 min, total gradient time is 10 min at column temperature of 60 oC.
2 2 were 7.5 min and 6.9 min (Figure. 4.4) with
average measured mass of 11673.5278 Da (ppm: 1.3) and 11675.5434 (ppm: 1.27) respectively.
2 used total ion count from ESI+ spectrum.
The MS settings used nebulizer drying gas at 10 L/min, nebulizer pressure at 30 psig, gas
temperature at 350 oC, capillary voltage at 4000 V, fragmentor at 250 V, skimmer at 60 V.
Acquisition rate was at 1 scan/sec scanning from 300-3200 m/z.
4.3.6 Data Analysis
Protein molecular weight analysis software (MassHunter Bioconfirm, Ver. B.02.00) was
used to deconvolute multiply charged protein ions to the molecular weight (Figure. 4.5c) that
d 2 2 easily due to mass accuracy at 1/100 of a Dalton.
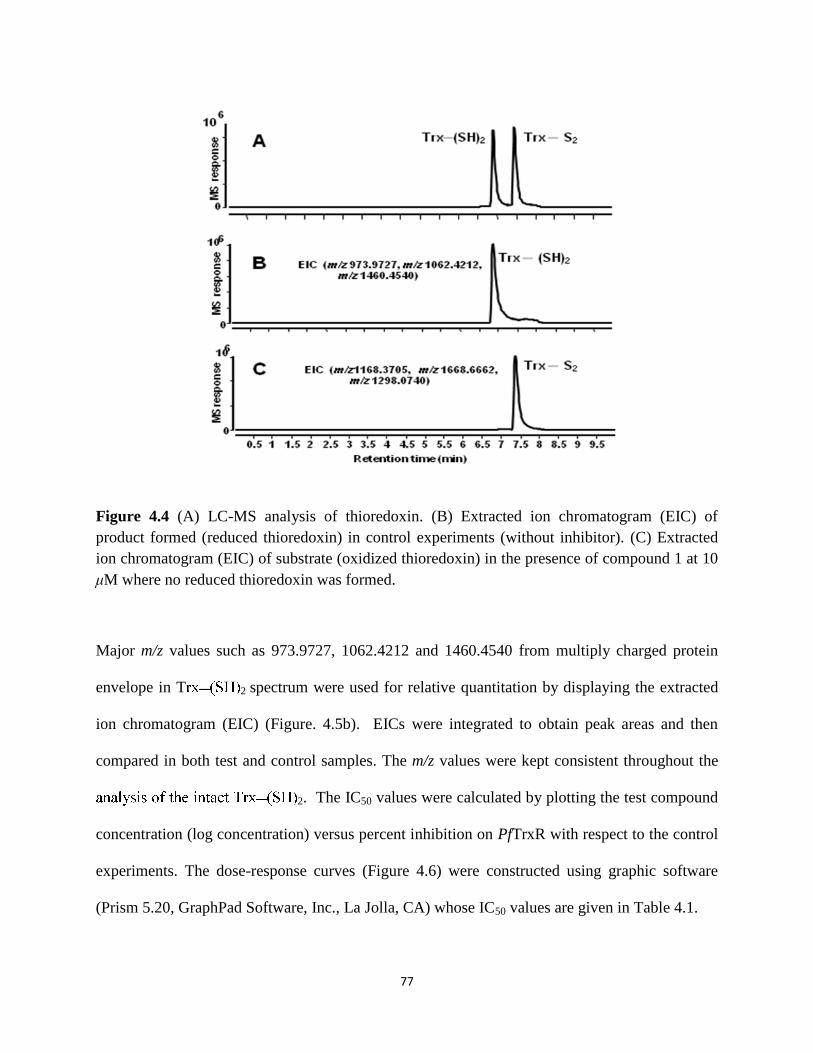
77
Figure 4.4 (A) LC-MS analysis of thioredoxin. (B) Extracted ion chromatogram (EIC) of
product formed (reduced thioredoxin) in control experiments (without inhibitor). (C) Extracted
ion chromatogram (EIC) of substrate (oxidized thioredoxin) in the presence of compound 1 at 10
μM where no reduced thioredoxin was formed.
Major m/z values such as 973.9727, 1062.4212 and 1460.4540 from multiply charged protein
envelope in T 2 spectrum were used for relative quantitation by displaying the extracted
ion chromatogram (EIC) (Figure. 4.5b). EICs were integrated to obtain peak areas and then
compared in both test and control samples. The m/z values were kept consistent throughout the
2. The IC50 values were calculated by plotting the test compound
concentration (log concentration) versus percent inhibition on PfTrxR with respect to the control
experiments. The dose-response curves (Figure 4.6) were constructed using graphic software
(Prism 5.20, GraphPad Software, Inc., La Jolla, CA) whose IC50 values are given in Table 4.1.

78
Figure 4.5 (a) MS spectra of Trx–(SH)2. (b) Extracted ion chromatogram (EIC: m/z 973.9727,
m/z 1062.4212, m/z 1460.4 2. (c) MS spectra deconvoluted to obtain molecular
2.

79
Figure 4.6 Dose response curves of compounds 1, 2, 3 and 4 tested at 0.5 µM PfTrxR.
Table 4.1 IC50 values of compounds 1 4 tested in duplicates and injected in triplicates.
Compound Log IC50 IC50 (µM) R Square
1 -6.29 0.52 0.9963
2 -5.33 4.60 0.9940
3 -4.81 15.21 0.9966
4 -5.69 2.03 0.9856

80
4.4 Results and Discussion
The assay for the identification of inhibitors for PfTrxR consists of the following three key
elements: RRLC reversed phase separation, enzymatic assay, and ESI-MS as readout. The
enzymatic assay is based on detection of reaction product of a substrate-conversion-based redox
reaction. In this study we report the method development of a functional assay for evaluating the
inhibitory activity of PfTrxR ligands. LC– 2 and
2 protein ionization prior to the functional assay (Figure 4.4). The product formed in
the functional assay experiments w 2 in
control and test sample. The response of 2 ion intensity to concentration in the
calibration curve was linear (R2> 0.998). The limit of detection (LOD) and the limit of
quantitation (LOQ) for 2 were found at 0.45 μg/mL (or 4.5 ng with S/N ratio of 9) and
1.8 μg/mL (or 18 ng), respectively. To validate the assay, reference compounds 1 3 (Figure 4.2),
known inhibitors of PfTrxR from the literature were tested for their inhibitory activity towards
the enzyme. Compounds 1 and 2 were reported as uncompetitive inhibitors (where the inhibitors
bind to one of the enzyme-substrate intermediate complexes) of PfTrxR with IC50 values 0.5 μM
and 2 μM respectively according to Andricopulo et al. [6]. Compound 3, a saturated Mannich
base was found to inhibit the enzyme by electrophilic attack on electron rich thiol groups present
on PfTrxR with IC50 15.4 μM according to Davioud-Charvet et al. [19]. The reference
compounds (1-3) and compound 4 were initially tested at 10 μM in the newly developed
functional assay. Complete inhibition of 0.5 μM PfTrxR characterized by no formation of
2 was not observed when compounds 1 and 2 were tested at 10 μM. Compound 3, a

81
saturated mannich base displayed more than 50% inhibition of PfTrxR at 10 μM. A dose-
response curve was developed (% inhibition vs concentration) for these reference compounds
with concentrations ranging from 0.01 μM to 100 μM by incubating with 0.5 μM PfTrxR at 25
oC followed by quantifi 2 by LC-MS. The percent inhibition of the reaction
2 was calculated using the equation 100 (c0 - c)/c0, where c0 was the amount of
2 produced with no inhibitor and c 2 with inhibitor.
When the c value was zero (as in case of DNPS), it meant that there was no product formed in
the reaction mixture in presence of the inhibitor. Hence it was considered as 100% inhibition of
the reaction product. Compounds 1, 2 and 3 displayed IC50 values of 0.52, 4.6 and 15.21 μM,
respectively (Table 4.1). The IC50 values determined for compounds 1 and 3 in the newly
developed functional assay were in good agreement with reported values in the literature using
UV based bioassay [6, 19]. From these results we conclude that our functional assay can be used
to screen competitive and uncompetitive inhibitors of PfTrxR. In addition to the reference
compounds 1 to 3, we also tested the inhibitory activity of 10 compounds such as
demethoxycurcumin (4), yohimbine (5), catharanthine (6), vobasine (7), gnetifolin E (8),
quinidine N-oxide (9), 11-hydroxycoronaridine (10), hispolone (11), hispolone methyl ether (12),
and hernagine (13) at 10 μM. These compounds were identified as ligands with binding affinity
more than 2 fold to PfTrxR at 1 μM by UF-LC-MS based binding assay [4]. Curcumin analogs
were identified as more potent inhibitors of PfTrxR than natural curcumin. Therefore compound
4, a curcumin analog, was tested for the first time for its inhibitory activity in our system.
Among these ligands, compounds which displayed more than 50% inhibition at 10 μM were
selected to subject for IC50 determination. Nine ligands showed less than 50% inhibition
whereas compound 4 presented more than 50% inhibition. To determine the IC50 value for

82
compound 4, concentrations ranging from 0.01 μM to 100 μM were tested at 0.5 μM PfTrxR.
The IC50 value of compound 4 was 2.03 μM (Table 4.1). Control experiments without inhibitor
or Pf 2 in the presence of NADPH. In the
absence of Pf 2 2, which indicates that
the enzyme along with cofactor is essential to yield the product in the enzymatic reaction.
It is well known that PfTrxR is a valid target in drug discovery for malaria since it
differs structurally and mechanistically from human thioredoxin reductase. Mass spectrometry is
a reliable analytical tool for the identification and quantification of intact proteins. In this study,
MS is preferred over optical methods (UV/Vis) for the identification of PfTrxR inhibitors
because of its specificity derived from the accurate mass measurement especially when the
quantification of product formed in the reaction is protein, much bigger than small molecule
ligand, which often contributes to the noise signal in the optical method. An MS based
functional assay can directly measure and quantify the reaction product and is, thus, a good
approach for screening of inhibitors of Pf 2 formed in the
presence of test compound. Our analytical strategy can identify and quantify the intact
2 directly with high specificity and sensitivity. After the enzymatic reaction, separation
of PfTrxR from the reaction mixture by chromatography was found to be challenging, as it had
2. The ions of PfTrxR were found to
2 as they both have the same retention time and hence could
not be separated by their respective mass spectra. Therefore, after unsuccessful LC methods and
column trials to separate Pf 2, the ultrafiltration step was used to separate the
enzyme from the reaction mixture based on the molecular weight difference between Trx (12
kDa) and the enzyme (59 kDa) as described in the experimental procedure. The concentration of

83
2 and NADPH used in the reaction were optimized to 2.5 μM and 200 μM, respectively.
Under both conditions, the formation of 2 was higher when control experiments
(without inhibitor) were run at different concentrations of substrate (1.25, 2.5, 5 and 10 μM) and
cofactor (200, 400, 600 and 800 μM). To optimize incubation time for the functional assay,
control experiments (without inhibitor) were carried out at different time points (0, 30, 60, and
2. The maximum product formation in the
experiments was observed at an incubation time of 30 min. After 30 min incubation, there was
no 2 (Table 4.2).
Table 4.2 2 time course study in control experiments tested in duplicates and injected
in triplicates.
Incubation time
(min)
2
(µg /mL)
0 13.49 ± 0.67
30 34.89 ± 0.45
60 31.73 ± 0.41
90 32.30 ± 0.27
Control experiments were carried out at 0.5 μM and 1 μM to optimize the enzyme concentration
in the reaction. PfTrxR 2 (34.89 μg/mL) when compared to
PfTrxR at 1 μM which resulted in 5.79 μg/mL 2. Therefore, 0.5 μM PfTrxR is
considered as the optimum concentration in the functional assay. The enzymatic reaction was
carried out at 25 oC according to the method of Andricopulo et al. [6]. We further confirmed the
influence of temperature on the product formation. At 37 oC, less product (12.96 µg/mL) was

84
formed whereas experiments at 25 o
2 2
(34.56 µg/mL). Removal of phosphate buffer salts from the reaction mixture was essential as
they interfere with protein detection by competing for ionization thus reducing the sensitivity for
protein; they were easily desalted on a C18 column at the initial time with a high percentage of
water and sent to waste by segmenting the LC flow to the MS from 6.2 min to 8 min.
4.5 Conclusions
In summary, we have demonstrated a convenient and efficient method to separate and
2) formed in the enzymatic reaction using LC-MS. Our
2 can be quantified by comparing the peak areas of
Tr 2 in control and test sample where a relative ratio is obtained to calculate percentage
inhibition of Pf 2 in the
enzymatic reaction with a high degree of specificity, sensitivity and throughput. This assay can
be a valuable tool for high-throughput ligand screening, particularly to find potent inhibitors for
PfTrxR.

85
4.6 References
1. H. L. Ziegler, D. Staerk, J. Christensen, L. Hviid, H. Hagerstrand, J. W. Jaroszewski. In vitro
Plasmodium falciparum drug sensitivity assay: Inhibition of parasite growth by incorporation
of stomatocytogenic amphiphiles into the erythrocyte membrane. Antimicrob. Agents
Chemother. 2002, 46, 1441-1446.
2. A. R. de Boer, T. Letzel, D. A. van Elswijk, H. Lingeman, W. M. A. Niessen, H. Irth. On-line
coupling of high-performance liquid chromatography to a continuous-flow enzyme assay
based on electrospray ionization mass spectrometry. Anal. Chem. 2004, 76, 3155 3161
3. A. Holmgren. Thioredoxin. Ann. Rev. Biochem. 1985, 54
4. R. Munigunti, V. Mulabagal, A. I. Calderón. Screening of natural compounds for ligands to
PfTrxR by ultrafiltration and LC–MS based binding assay. J. Pharm. Biomed. Ana. 2011, 55,
5. H. M. Alger, D. L. Williams. The disulfide redox system of Schistosoma mansoni and the
importance of a multifunctional enzyme, thioredoxin glutathione reductase. Mol. Biochem.
Parasit. 2002, 121
6. A. D. Andricopulo, M. B. Akoachere, R. Krogh, C. Nickel, M. J. McLeish, G. L. Kenyon, L.
D.Arscott, C. H. Williams, E. Davioud-Charvet, K. Becker. Specific inhibitors of Plasmodium
falciparum thioredoxin reductase as potential antimalarial agents. Bioorg. Medicinal Chem.
Lett. 2006, 16
7. E. D. Chavet, K. Becker, V. Landry, S. Gromer, C. Logé, C. Sergheraert. Synthesis of 5, 5’-
Dithiobis (2-nitrobenzamides) as alternative substrates for trypanothione reductase and

86
thioredoxin reductase: A microtiter colorimetric assay for inhibitor screening. Anal. Biochem.
1999, 268, 1-8.
8. Z. Liu, Z. Y. Du, Z. S. Huang, K. S. Lee, L. Q. Gu. Inhibition of thioredoxin reductase by
curcumin analogues. Biosci. Biotechnol. Biochem. 2008, 72, 2214–2218.
9. T. L. Williams, J. H, Callahan, S. R. Monday, P. C. H. Feng, S. M. Musser. Relative
quantitation of intact proteins of bacterial cell extracts using coextracted proteins as internal
standards. Anal. Chem. 2004, 76, 1002 1007.
10. R. B. Arjen, L. Henk, M. A. N. Wilfried, I. Hubertus. Mass spectrometry-based biochemical
assays for enzyme inhibitor screening. Trends Anal. Chem. 2007, 26 (9), 867 – 883.
11. L. Jingjing, C. Xueheng, F. Lei. LC-MS based assay method for DPP-IV inhibitor screening
and substrate discovery. Anal. Methods. 2012, 4, 1797-1805.
12. S. Julka, J. Folkenroth, S. A. Young. Two dimensional liquid chromatography–
ultraviolet/mass spectrometric (2DLC–UV/MS) analyses for quantitation of intact proteins in
complex biological matrices. J. Chromatogr. B. 2011, 879, 2057 2063.
13. Y. Wang, B. M. Balgley, P. A. Rudnick, C. S. Lee. Effects of chromatography conditions on
intact protein separations for top-down proteomics. J. Chromatogr. A. 2005, 1073, 35 41.
14. M. Wang, J. You, K. G. Bemis, T. J. Tegeler, D. P. G. Brown. Label-free mass spectrometry-
based protein quantification technologies in proteomic analysis. Brief. Funct. Genomic.
Proteomic. 2008, 7, 329 339.
15. M. T. Mazur, H. L. Cardasis, D. S. Spellmana, A. Liaw, N. A. Yates, R. C. Hendrikson.
Quantitative analysis of intact apolipoproteins in human HDL by top-down differential mass
spectrometry. Proc. Natl. Acad. Sci. 2010, 107, 7728–7733.

87
16. J. M. Asara, H. R. Christofk, L. M. Freimark, L. C. Cantley. A label-free quantification
method by MS/MS TIC compared to SILAC and spectral counting in a proteomics screen.
Proteomics. 2008, 8, 994–999.
17. S. M. Kanzok, R. H. Schirmer, I. Turbachova, R. Iozef, K. Becker. The thioredoxin system
of the malaria parasite Plasmodium falciparum. J. Biol. Chem. 2000, 275, 40180–40186.
18. M. M. Bradford. A rapid and sensitive method for the quantitation of microgram quantities of
proteins utilizing the principle of protein–dye binding. Anal. Biochem. 1976, 72, 248–254.
19. E. D. Charvet, M. J. McLeish, D. M. Veine, D. Giegel, L. D. Arscott, A. D. Andricopulo, K.
Becker, S. Müller, R. H. Schirmer, C. H. Williams, G. L. Kenyon. Mechanism-based
inactivation of thioredoxin reductase from Plasmodium falciparum by Mannich bases.
implication for cytotoxicity. Biochemistry. 2003, 42, 13319–1333.

88
5. Characterization of PfTrxR inhibitors using mass spectrometry and in silico molecular
modeling
5.1 Abstract
1,4-Napthoquinone (1,4-NQ), bis-2,4-dinitrophenyl sulfide (2,4-DNPS), 4-
nitrobenzothiadiazole (4-NBT), 3-dimethylaminopropiophenone (3-DAP) and menadione (MD)
and natural products were tested for PfTrxR inhibitory activity, antimalarial activity against both
chloroquine (CQ)-sensitive (D6) and chloroquine (CQ)-resistant (W2) strains of Plasmodium
falciparum through an in vitro assay and non-covalent interactions to PfTrxR through docking
studies. The four inhibitors of PfTrxR 1,4-NQ, 2,4-DNPS, 4-NBT and MD displayed
antimalarial activity and toxicity to VERO Cell line at IC50 values of < 20 μM. Docking
experiments revealed that 2,4-DPNS, 4-NBT and MD interact non-covalently with the
intersubunit region of PfTrxR whereas 1,4-NQ and 3-DAP binds covalently to the target.
In this work, the binding affinities of natural products towards PfTrxR, PfGR, human
TrxR and human GR were determined using a new mass spectrometry based ligand binding
assay and in silico molecular modeling. Curcumin and demethoxycurcumin (DMC) are
predicted to bind with close proximity to the dimer interface of PfTrxR at the intersecting helices
between the subunits. The current work is intended to prove the feasibility of our approach in
finding new lead antimalarial compounds from plants by combining mass spectrometry and
computational studies.

89
5.2 Introduction
Malaria, a tropical parasitic disease, continues to be the dominant cause of death in low-
income countries especially in Africa and is considered to be one of the top three killers among
communicable infectious diseases [1]. With a rapidly growing population in regions with high
malaria transmission, it has been estimated that in the absence of effective intervention strategies
the number of malaria cases will double over the next 20 years [2]. Malaria caused by
Plasmodium falciparum is considered to be the most deadly and also the one with highest rate of
drug resistance [3].
P. falciparum requires efficient antioxidant and redox systems to prevent damage caused
by reactive oxygen species. In recent years, it has been shown that P. falciparum (Pf) possesses
functional low molecular weight thiol thioredoxin (Trx) and glutathione systems [4].
Thioredoxin reductase (TrxR) and glutathione reductase (GR) are important enzymes of these
redox systems that help the parasite to maintain an adequate intracellular redox environment.
These antioxidant enzymes (PfTrxR and PfGR) are essential for the survival of Plasmodium
parasites for combating the intraerythrocytic oxidative stress. Disruption of these enzymes is a
feasible way to interfere with the erythrocyte development of malaria parasites [5]. The current
chemotherapy of the malaria as recommended by WHO is based on artemisinin-based
combination therapies (ACTs) as the front line of treatment for malaria. The main drawbacks of
the combination therapies are high cost, adverse drug reactions, and a high degree of
pharmacokinetic mismatch leading to prolonged exposure of parasites to low doses of partner
drug and its active metabolites, which may facilitate development of resistant parasites [6].

90
Development of parasites resistance to the known antimalarials remains a major
challenge for the effective management of malaria. Intensive drug discovery programs have
aimed at developing new antimalarials or modifying current antimalarials to improve their
efficacy and reduce any evidence of resistance. It has been understood that the chemical diversity
of natural products is a better source for successful drugs than synthetic compounds, thus shifting
the emphasis to natural product drug discovery. Unfortunately natural products other than
quinine, artemisinin, hydroxynaphthoquinones, doxycyclin, clindamycin and azithromycin have
not been in preclinical development [7]. Since quinine and artemisinin are outstanding examples
of therapeutic natural products, there is a need to explore nature, a rich source of antimalarials
for new pharmacophores/templates that can guide the design of potentially superior analogs [7].
5.2.1 Selective tools for identifying inhibitors of PfTrxR and PfGR
In silico molecular modeling methods, such as docking, can aid in the drug discovery
process by ascertaining the binding affinities of existing and novel natural products towards
PfTrxR, PfGR, and the human isoforms of these enzymes. Ideally, the simulations can also
elucidate the origin behind the observed inhibition. For example, the most common inhibitor
binding sites in these reductases are at the active site and at the crystallographic 2-fold axis in the
large cavity at the dimer interface. The dimer interface shows non-competitive or uncompetitive
behavior and their interaction with the protein is purely non-covalent [8, 9, 10]. Docking
calculations are well-suited to explore this interface; however, the simulations are unable to
reproduce inhibitors that bind at the active site, as they usually show covalent binding and
competitive behavior with respect to both the redox cofactors and the glutathione/thioredoxin
substrates. A joint experimental and computational effort should help counterbalance the

91
deficiencies present in each technique and provide an enhanced avenue for natural product based
inhibitor development.
5.2.2 Key differences in active sites between parasite and human enzymes
Comparison between the hTrxR and PfTrxR structures shows that they have 46 % sequence
identity and overlays with an RMSD of 0.91 Å between the 374 monomer atom pairs (Figure
5.1).The most important difference that can be exploited for selective noncompetitive inhibitors
between the two enzymes is at the dimer interface. PfTrxR is narrower than in hTrxR due to the
presence of Tyr 101 and His 104 (Figure 5.2) and can therefore host smaller molecules. Their
counterparts in the human isoform are Gln and Leu and this difference can determine the
chemical nature of suitable inhibitors [12].The molecular surfaces of the parasite and the human
enzymes also indicate that the charges on the cavity walls are different, with the hTrxR’s being
more negatively charged compared to the PfTrxR’s (Figure 5.3) [12].
Figure 5.1 Superposition of hTrxR (brown) with PfTrxR (blue).

92
Figure 5.2 PfTrxR (blue) in comparison with hTrxR (green) [12].
Figure 5.3 Molecular surfaces of the PfTrxR and hTrxR cavities [12].
Similar to the thioredoxin reductases, the hGR and PfGR structures were found to have
45% sequence identity with an RMSD overlay of 1.00 Å between 343 monomer atom pairs
(Figure 5.4). For the enzyme/substrate complex structures that have been solved, the structures
indicate that one inhibitor binds per enzyme subunit. The dimer cavity connects to both
glutathione disulfide (GSSG) binding sites through two channels that also serve as mediators
between the bulk solvent and the cavity (Figure 5.5) [8]. Significant differences are found at the
dimer interface where the amino acid residues lining the wall of the cavity have very low
conservation. Only 9 out of 21 residues are conserved in PfGR, which is an important factor for
selective inhibitor design, and implies that the binding mode of any inhibitor cannot be extended
to be similar between the proteins [13].

93
Figure 5.4 Superposition of hGR (brown) with PfGR (blue).
Figure 5.5 The dimer cavity of hGR [13].
The molecular surfaces of the two enzymes also indicate that the charges on the cavity walls are
quite different, with the hGR cavity being highly negatively charged, and the PfGR cavity being
quite neutral (Figure 5.6).
Figure 5.6 Molecular surfaces of the PfGR and hGR cavities [13].

94
The current study aimed to prove the combined approach of LC-MS based PfTrxR and PfGR
binding and functional assays, molecular docking for identification of key interactions of PfTrxR
and PfGR inhibitors to improve selectivity and phenotypic assays for malaria for identification of
activity against parasite blood stages and against drug resistant parasites to assure the
identification of specific PfTrxR and PfGR inhibitors as scaffolds for lead optimization.
5.3 MATERIALS AND METHODS
5.3.1 Chemicals and enzymes
Solvents used for LC/MS analysis were purchased from Fischer Scientific International
(Atlanta, GA). Seven compounds from AnalytiCon Discovery GmbH (Germany) natural
products library (MEGx) were purchased based on compound classes that have reported either
antimalarial activity or inhibition of TrxR [14, 15]. Hispolone was kindly provided by Dr. G. V.
Subbaraju, AptuitLauras, Hyderabad, India. Buffer salts and bis-2, 4-dinitrophenyl sulfides were
purchased from Sigma-Aldrich (Allentown, PA). Deionized water generated by a Milli-Q water
system (Millipore, MA) was used in the experiments. PfTrxR (Mr 59 kDa) enzyme was
provided as a gift by Prof. Katja Becker, Justus-Liebig University, Giessen, Germany. The
recombinant PfTrxR was prepared and purified using silver-stained SDS page according to the
procedure published by Kanzok et al [16]. The specific activity of PfTrxR (1.9 U/mg) was
determined by DTNB [5, 5’-dithiobis (2-nitrobenzoic acid)]. Protein concentration of enzymes
was determined by Bradford method [17].

95
5.3.2 Protocols of experiments
5.3.2.1. PfTrxR enzyme binding assay using ultrafiltration and liquid chromatography-
mass spectrometry
In this method, 4 µL of test compound (10 µM) and 192 µL of incubation buffer
containing 20.5 mM KH2PO4, 26.5 mM K2HPO4, 200 mM KCl and 1 mM EDTA with pH 6.9,
were placed into micro centrifuge. To this, 4µL of PfTrxR/PfGR enzyme (1 µM) was added and
incubated at 25◦C for 60 min. The incubation mixture was then filtered through a 30 kDa
molecular weight cut-off ultrafiltration membrane filter made of regenerated cellulose (Microcon
YM-30, Millipore, Billerica, MA) and then centrifuged at 13,000 × g at 4◦C for 20 min. The
enzyme–ligand complex trapped on the filter was washed with assay buffer (200 µL 3×) and
centrifuged at 13,000 × g at 4◦C for 20 min each time. The ultrafiltration membrane was placed
into a new microcentrifuge tube and the ligands were dissociated from PfTrxR enzyme by
treatment with 200 µL of methanol for 20 min. The dissociated ligand obtained was centrifuged
at 20◦C, 13,000 × g for 20 min. The ultrafiltrate was then dried under nitrogen using N-VAP 116
Nitrogen Evaporator (Organomation Associates, Inc., Berlin, MA) and the released ligands were
reconstituted in 100 µL of methanol/water (v/v, 90:10). Assays were carried out in duplicate and
the control experiments were performed in a similar way with denatured enzyme. The released
ligands were then analyzed by LC-MS. [15].
5.3.2.2. LC-MS based PfTrxR functional assay
The test compound (10 mM in 1% dimethyl sulfoxide [DMSO]) was incubated with 0.5
mM PfTrxR enzyme and 200 mM NADPH in the assay buffer (PE buffer: 100 mM potassium
phosphate and 2 mM EDTA, pH 7.4). The enzymatic reaction was initiated by addition of 2.5

96
mM Trx–S2 and incubated at 25 oC for 30 min. After the incubation, the reaction was quenched
by addition of 0.1% formic acid. The reaction mixture was filtered through a 30 kDa MWCO
ultrafiltration membrane centrifuged at 13 000 rpm at 20 oC for 10 min. The enzyme was trapped
on the membrane and product (Trx–(SH)2) formed in the reaction was recovered in the filtrate
and analyzed by LC/MS. A control experiment (without inhibitor) was performed the same way
and the amount of Trx–(SH)2 was used to reference the activity in the test sample. A calibration
curve using known amounts of Trx–(SH)2 was prepared to quantify the amount of Trx–(SH)2
produced in the reactions [14].
5.3.2.3. Antiplasmodial activity and cytotoxicity against L6 cells of tested natural products
Antiplasmodial activity was determined using the K1 strain of P. falciparum (resistant
to chloroquine and pyrimethamine). A modification of the [3H]-hypoxanthine incorporation
assay was used. Briefly, infected human red blood cells in RPMI 1640 medium with 5%
Albumax were exposed to serial drug dilutions in micro titer plates. After 48 h at 37 °C in a
reduced oxygen atmosphere, 0.5 μCi [3H]-hypoxanthine was added to each well. Cultures were
incubated for a further 24 h before they were harvested onto glass-fiber filters and washed with
distilled water. The radioactivity was counted using a BetaplateTM liquid scintillation counter
(Wallac, Zurich, Switzerland). The results were recorded as counts per minute (CPM) per well at
each drug concentration and expressed as percentage of the untreated controls. From the
sigmoidal inhibition curves, IC50values were calculated. Assays were run in duplicate and
repeated once. Chloroquine was used as a reference anti-malarial drug and showed an IC50 value
of 0.069 µg/mL.

97
Cytotoxicity assays were performed in 96-well microtiter plates, each well containing 100
μL of RPMI 1640 medium supplemented with 1% L-glutamine (200 mM) and 10% fetal bovine
serum, and 4 × 10⁴ L6 cells (a primary cell line derived from rat skeletal myoblasts). Serial drug
dilutions of seven 3-fold dilution steps covering a range from 90 to 0.123 μg/mL were prepared.
After 72 h of incubation, the plates were inspected under an inverted microscope to assure
growth of the controls and sterile conditions. Ten μL of Alamar Blue solution was then added to
each well and the plates incubated for another 2 h. Then the plates were read with a Spectramax
Gemini XS microplate fluorometer using an excitation wavelength of 536 nm and an emission
wavelength of 588 nm. Data were analysed using the microplate reader software Softmax Pro.
Podophyllotoxin was the reference drug used [18].
5.3.2.4. Assays for in vitro antimalarial activity and cytotoxicity of known PfTrxR
inhibitors
Antimalarial assay
Briefly, antimalarial activity of the compounds were determined in vitro on chloroquine
sensitive (D6, Sierra Leone) and resistant (W2, IndoChina) strains of P. falciparum. The 96-well
microplate assay is based on the effect of the compounds on growth of asynchronous cultures of
P. falciparum, as determined by the assay of parasite lactate dehydrogenase (pLDH) activity
[19].
Cytotoxicity assay
Cytotoxicity in terms of cell viability were evaluated using VERO cells by Neutral Red
assay [20]. This assay was conducted on compounds designated as active in the PfTrxR
functional assay and the antimalarial phenotypic screening.
98
5.3.2.5 ROS assay
Accelerated generation and accumulation of reactive oxygen intermediates (superoxide
radical, hydroxyl radical and hydrogen peroxide) are mainly responsible for oxidative stress [21].
The intraerythrocytic formation of ROS was monitored in real-time with 2’7’-
dichlorofluorescein diacetate (DCFDA), a fluorescent ROS probe [22]. Human erythrocytes
collected in citrate phosphate anticoagulant were used. The erythrocytes were washed twice with
0.9 % saline and suspended in PBSG at a hematocrit of 10%. A 60 mM stock of DCFDA was
prepared in DMSO and added to the erythrocytes suspension in PBSG (10% hematocrit) to
obtain the final concentration of 600 µM. Erythrocytes suspension containing 600 µM of
DCFDA was incubated at 37°C for 20 min and centrifuged at 1000 g for 5 min. The pellet of
DCFDA loaded erythrocytes was suspended in PBSG to 50% hematocrit and used for kinetic
ROS formation assay. The assay was directly set up in a clear flat-bottom 96 well microplate.
The reaction mixture contained 40 µL of DCFDA loaded erythrocytes, the test compounds
final volume to 200 µL. The controls without drug were also set up simultaneously. Each assay
was set up at least in duplicate. The plate was immediately placed in a microplate reader
programmed to kinetic measurement of fluorescence (excitation 488 nm and emission 535 nm)
for 2 hours with 5 min time intervals.

99
5.3.2.6 Computational methods
Auto Dock Vina [23] was used to dock inhibitors to the respective targets. Initial
Cartesian coordinates for the protein-ligand structures were derived from reported crystal
structures of hGR (PDB ID: 1XAN) [8], PfGR (PDB ID: 1ONF) [13], hTrxR (PDB ID: 3QFA)
[24] and PfTrxR (PDB ID: 4B1B) [12].The protein targets were prepared for molecular docking
simulation by removing water molecules and bound ligands. AutoDockTools (ADT) [25] was
used to prepare the docking simulations whereas Chimera was used to analyze the docking
poses. All ligands were constructed using PyMol [26] with subsequent geometry optimizations
carried out using the semiempirical method PDDG/PM3 [27, 28, 29]. Polar hydrogens were
added. Conjugate gradient minimizations of the systems were performed using GROMACS [30].
A grid was centered on the catalytic active site region and included all amino acid residues
within a box size set at x = y = z = 20 Å.
5.3.2.7 AutoDockVina details
Standard flexible protocols of AutoDockVina using the Iterated Local Search global
optimizer [23] algorithm were used to evaluate the binding affinities of the molecules and
interactions with the receptors. All ligands and docking site residues, as defined by the box size
used for the receptors, were set to be rotatable. Calculations were carried out with the
exhaustiveness of the global search set to 100, number of generated binding modes set to 20 and
maximum energy difference between the best and the worst binding modes set to 5. Following
completion of the docking search, the final compound pose was located by evaluation of

100
AutoDock Vina’s empirical scoring function where the conformation with the lowest docked
energy value was chosen as the best. The experimental binding poses of hGR control structures
xanthenes (PDB ID: 1XAN) [31] and pyocyanin (PDB ID: 3SQP) [32] were successfully
reproduced using the described docking protocols (Figure 5.7).
Figure 5.7 hGR inhibitors xanthene (left) and pyocyanin (right) docked (in blue) and compared
to the experimental crystal structures (in brown).
5.4. Results and Discussion
5.4.1. Evaluation of known inhibitors of PfTrxR
Based on the newly developed PfTrxR functional assay five known inhibitors of PfTrxR
[33, 34] and PfGR [35], i.e., 1, 4-napthoquinone (1, 4-NQ), bis-2, 4-dinitrophenyl sulfide (2, 4-
DNPS), 4-nitrobenzothiadiazole (4-NBT), 3-dimethylaminopropiophenone (3-DAP) and
menadione (MD), (Figure 5.8) showed more than 50% PfTrxR inhibition at 10 μM and displayed
IC50 values of 0.75, 0.5, 2.0, 15.4 and 1.6 µM, respectively. The in vitro antimalarial activity of
five known inhibitors of PfTrxR (1, 4-napthoquinone, 2, 4-DNPS, 4-NBT, 3-DAP, menadione)
was evaluated against both CQ-sensitive (D6 clone) and CQ resistant (W2 clone) strains of P.
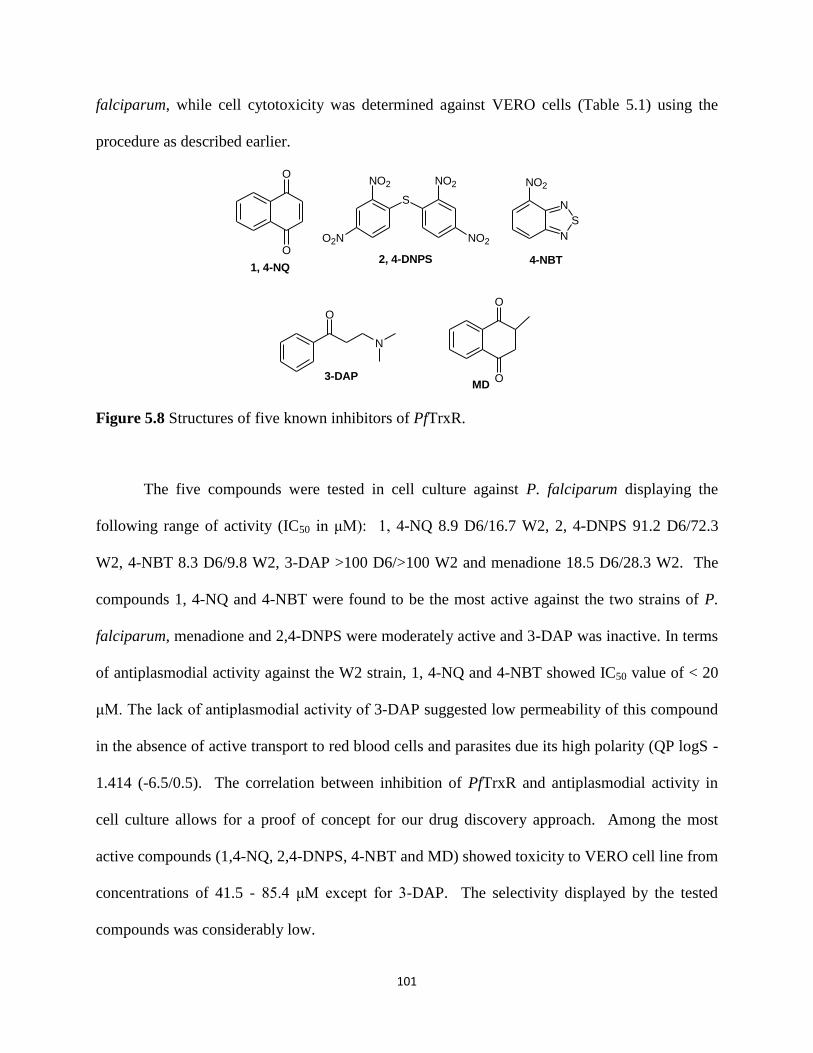
101
falciparum, while cell cytotoxicity was determined against VERO cells (Table 5.1) using the
procedure as described earlier.
S
NO2
O2N
NO2
NO2N
S
N
NO2
N
O
2, 4-DNPS 4-NBT
3-DAP
O
OMD
O
O
1, 4-NQ
Figure 5.8 Structures of five known inhibitors of PfTrxR.
The five compounds were tested in cell culture against P. falciparum displaying the
following range of activity (IC50 in μM): 1, 4-NQ 8.9 D6/16.7 W2, 2, 4-DNPS 91.2 D6/72.3
W2, 4-NBT 8.3 D6/9.8 W2, 3-DAP >100 D6/>100 W2 and menadione 18.5 D6/28.3 W2. The
compounds 1, 4-NQ and 4-NBT were found to be the most active against the two strains of P.
falciparum, menadione and 2,4-DNPS were moderately active and 3-DAP was inactive. In terms
of antiplasmodial activity against the W2 strain, 1, 4-NQ and 4-NBT showed IC50 value of < 20
μM. The lack of antiplasmodial activity of 3-DAP suggested low permeability of this compound
in the absence of active transport to red blood cells and parasites due its high polarity (QP logS -
1.414 (-6.5/0.5). The correlation between inhibition of PfTrxR and antiplasmodial activity in
cell culture allows for a proof of concept for our drug discovery approach. Among the most
active compounds (1,4-NQ, 2,4-DNPS, 4-NBT and MD) showed toxicity to VERO cell line from
concentrations of 41.5 - 85.4 μM except for 3-DAP. The selectivity displayed by the tested
compounds was considerably low.

102
In order to test the five PfTrxR inhibitors for their ability to induce signs of oxidative
stress by accelerated generation and accumulation of reactive oxygen intermediates (superoxide
radical, hydroxyl radical and hydrogen peroxide) [21], the intraerythrocytic formation of ROS
was monitored in real-time for 120 min with 2’7’-dichlorofluorescein diacetate (DCFDA), a
fluorescent ROS probe [22]. Among the PfTrxR inhibitors only 4-NBT, MD and 1,4-NQ
increased oxidative stress by the production of 100, 50 and 45% ROS respectively over a period
of 2 h in the human erythrocytes (Figure 5.9). Whereas 3-DAP and 2,4-DPNS did not increase
the production of ROS. The obtained data on 4-NBT, 1,4-NQ and MD suggested that their
mechanism of action is through inhibition of PfTrxR.
Figure 5.9 Formation of reactive oxygen species (ROS), as indicated by increase in fluorescence
DCFDA loaded human erythrocytes by five PfTrxR inhibitors.

103
The 1, 4-NQ chemical features and the ability to generate OH radical suggest the
proficiency in altering intracellular redox status [36]. The antimalarial naphthoquinones (1, 4-NQ
and MD) are believed to perturb the major redox equilibria of the targeted P. falciparum infected
red blood cells, which might be removed by macrophages. This perturbation results in
development arrest and death of the malaria parasite at the trophozoite stage [37]. The 1, 4-NQ
displayed inhibitory activity against PfGR with IC50 value of 2.2 µM and 2-fold selectivity
toward the parasite isoform whereas menadione showed IC50 value of 42 µM and more
selectivity toward the human counterpart. To gain further insight into the mode of interaction for
these molecules, molecular docking was used to study the interaction of non-covalent reductase
inhibitors. MD [38], 2,4-DNPS [33] and 4-NBT [33] have been proposed to bind at the
intersubunit region in PfTrxR’s and GR’s.
However, 1, 4-NQ and 3-DAP bind to the reductases covalently precluding the use of
docking calculations. For example, 1, 4-NQ is an inhibitor of GR and TrxR that behaves as a
subversive substrate (Morin et al. 2008). 3-DAP inactivates TrxR by alkylating the C-terminal
redox active catalytic Cys-Cys pair. This is achieved by the formation of a reactive α, β-
unsaturated ketone intermediate after it undergoes deamination in solution [34]. As with 3-DAP,
it has an α, β-unsaturated ketone that acts as the alkylator [39]. The calculations correctly
reproduced the activity trend observed in the experimental IC50 values for the non-covalent
inhibitors, 2, 4-DNPS, MD, and 4-NBT in PfTrxR (Table 5.2).

104
Table 5.1 Antiplasmodial activity and inhibition of PfTrxR by known inhibitors
Test
compounds
PfTrxR
IC50
(µM)
Pf (D6) CQ
sensitive
IC50(µM)
SI
D6
Pf (W2) CQ
resistance
IC50(µM)
SI W2
VERO
IC50(µM)
1,4-NQ 0.75 8.9 ± 2.3 4.6 16.7± 3.7 2.4 41.5
2,4-DNPS 0.5 91.2 ± 11.3 0.8 72.3 ± 11.3 1.0 68.7
4-NBT 2 8.3 ± 2.1 10 9.8 ± 1.9 8 85.4
3-DAP 15.4 >100 >1 >100 >1 >100
MD 1.6 18.5 ±1.9 3.8 28.3 ± 5.6 2.5 71.2
CQ 0.055 ± 0.006
0.440 ± 0.045
For antiplasmodial, we are using the following activity criteria - Compounds with IC50
< 20 µM are active. If a compound shows IC50 < 20 µM and selectivity index (IC50 VERO
cells/ IC50 parasite >100 it qualifies for in vivo testing - Compounds with IC50 20 – 100
µM are moderately active. Compounds with IC50 >100 µM are inactive.
For the PfTrxR/MD complex, pi stacking interactions are predicted to form between the
inhibitor’s phenyl ring and Tyr 101 side chain ring. The backbone nitrogen of Met105 is in close
proximity to the carbonyl group of menadione, however, the predicted angle between N-H and O
of 85° impedes hydrogen bonding.
Table 5.2 Comparison between computed binding affinities (kcal/mol) at the dimer interface in
PfTrxR and experimental IC50 values (µM).
Molecule Computed Binding Affinity
(kcal/mol)
Exptl. PfTrxR
IC50 (µM)
2,4-DNPS -8.4 0.5
MD -7.9 1.6
4-NBT -6.0 2

105
The molecule further forms hydrophobic interactions with the phenyl ring of Tyr 116’ and the
sidechains of Ile 108 from both subunits. Similar to MD, 4-NBT’s phenyl ring also has pi-pi
stacking with Tyr 101’s phenyl ring, but forms hydrophobic interactions only with Ile 108 from
subunit B in the large cavity. The nitro group causes the molecule to twist subtly compared to
MD in order to better interact with the electrostatic surface created by the peptide bond between
His 104 and Met 105’s and sulfur on methionine (Figure 5.10). Compared to the size of the
cavity, MD and 4-NBT are small molecules and do not fully interact with most of the residues
lining the wall of the dimer interface. 2, 4-DNPS forms the only electrostatic interaction at a
distance of 3.9 Å with Asn481’. Pi stacking interactions are formed between one of the
inhibitor’s phenyl ring and Tyr101 side chain ring with the other phenyl ring of the molecule
forming a parallel displaced pi stacking interaction with Tyr101’ (subunit B). As with MD and 4-
NBT, the side chains of Ile 108 from both subunits form hydrophobic interactions too with 2, 4-
DNPS. Most of the interactions the 3 molecules are forming with the proteins are with the
intersecting helices between the two subunits of the enzymes (Figure 5.10).
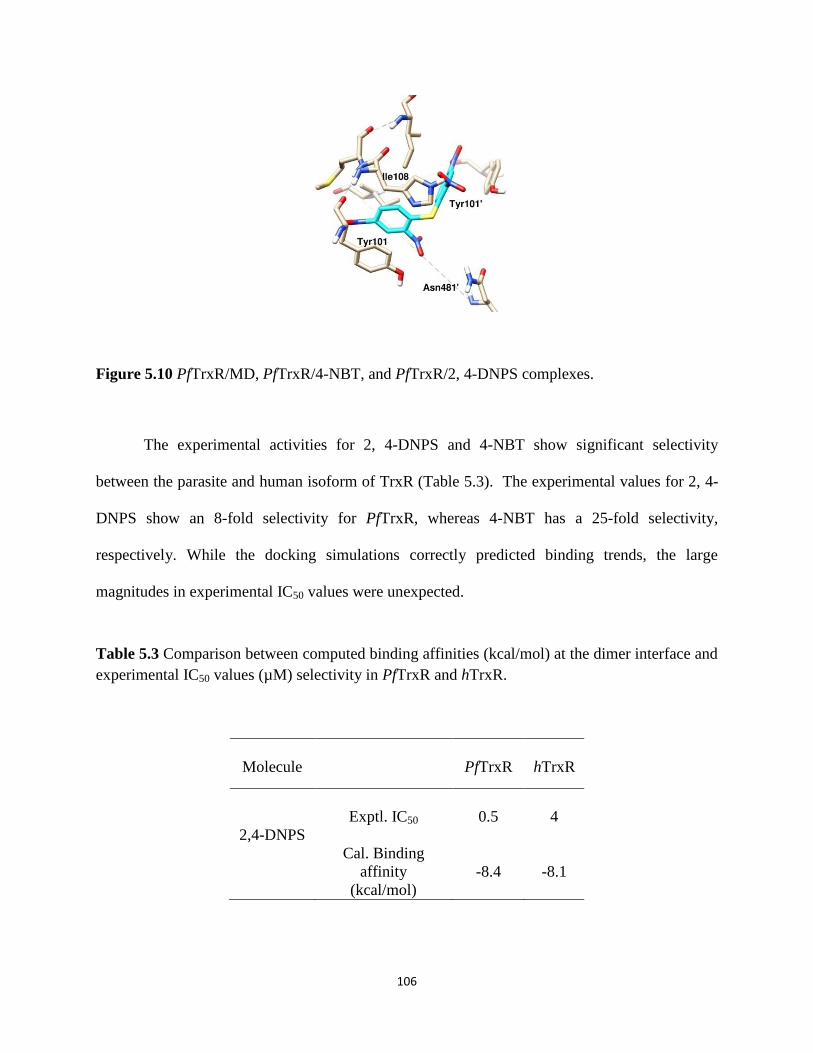
106
Figure 5.10 PfTrxR/MD, PfTrxR/4-NBT, and PfTrxR/2, 4-DNPS complexes.
The experimental activities for 2, 4-DNPS and 4-NBT show significant selectivity
between the parasite and human isoform of TrxR (Table 5.3). The experimental values for 2, 4-
DNPS show an 8-fold selectivity for PfTrxR, whereas 4-NBT has a 25-fold selectivity,
respectively. While the docking simulations correctly predicted binding trends, the large
magnitudes in experimental IC50 values were unexpected.
Table 5.3 Comparison between computed binding affinities (kcal/mol) at the dimer interface and
experimental IC50 values (µM) selectivity in PfTrxR and hTrxR.
Molecule
PfTrxR
hTrxR
2,4-DNPS
Exptl. IC50
Cal. Binding
affinity
(kcal/mol)
0.5
-8.4
4
-8.1

107
4-NBT
Exptl. IC50
Cal. Binding
affinity
(kcal/mol)
2
-6.0
50
-5.7
The docked poses however have considerable differences within the cavity, which could point to
the observed selectivity (Figure 5.11). The presence of Tyr 101 in PfTrxR enables 2, 4-DNPS to
form a favorable pi stacking interaction with the phenyl ring of the molecule whereas its
counterpart in hTrxR is a Gln 72 that orients the molecule to avoid steric clashes. This results in
the second ring of the molecule forming a parallel displaced pi stacking interaction with Tyr 101’
whereas a hydrogen bond between the nitro group and Gln 72’ in the hTrxR is realized. The
effect of this substitution on 4-NBT seems to be the fact that the presence of Gln 72 pushes the
molecule deep into the large cavity precluding the interaction with the residues of the
intersecting helices between the subunits.
Figure 5.11 The docking pose differences of 2, 4-DNPS and 4-NBT between the Pf- (brown)
and h-TrxR (blue).

108
5.4.2 Evaluation of natural products as inhibitors of PfTrxR and PfGR
5.4.2.1 Curcumin and demethoxycurcumin (DMC)
Based on the report of Mulabagal and Calderon in 2010 [15] about curcumin and DMC
as PfTrxR ligands, we tested these compounds for their ability to inhibit PfTrxR. Curcumin and
DMC showed more than 2-fold binding affinity for PfTrxR target enzyme but curcumin
displayed less than 50% inhibition of PfTrxR at 10 μM when tested in the functional assay
compared to DMC which displayed more than 50% PfTrxR inhibition at 10 μM with an IC50
value of 2.0 μM. The fact that curcumin has been shown to inhibit mammalian or rat TrxR by
alkylating the cystein/selenocystein catalytic active site residues, supports our data and
prediction that curcumin selectively inhibits mammalian TrxR but not the PfTrxR. The in vitro
antimalarial activity of curcumin and demethoxycurcumin (DMC) was evaluated against both
CQ-sensitive (D6 clone) and CQ resistant (W2 clone) strains of P. falciparum, while cell
cytotoxicity was determined against VERO cells (Table 5.4) using the procedure as described
earlier.
Table 5.4 Antiplasmodial activity and inhibition of PfTrxR by curcuminoids
Test
compounds
PfTrxR
IC50 (µM)
Pf (D6) CQ
sensitive
IC50 (µM)
SI D6
Pf (W2) CQ
resistance
IC50 (µM)
SI W2
VERO
IC50 (µM)
Curcumin NA 15.9 ± 2.1 4.0 41.2 ± 6.2 1.6 64.6
DMC 2.03 17.7 ± 3.1 5.0 82.7 ±10.3 1.1 89.7
CQ 0.055 ± 0.006
0.440 ± 0.045
NA: Not active i.e, PfTrxR inhibition was < 50% at 10 µM.
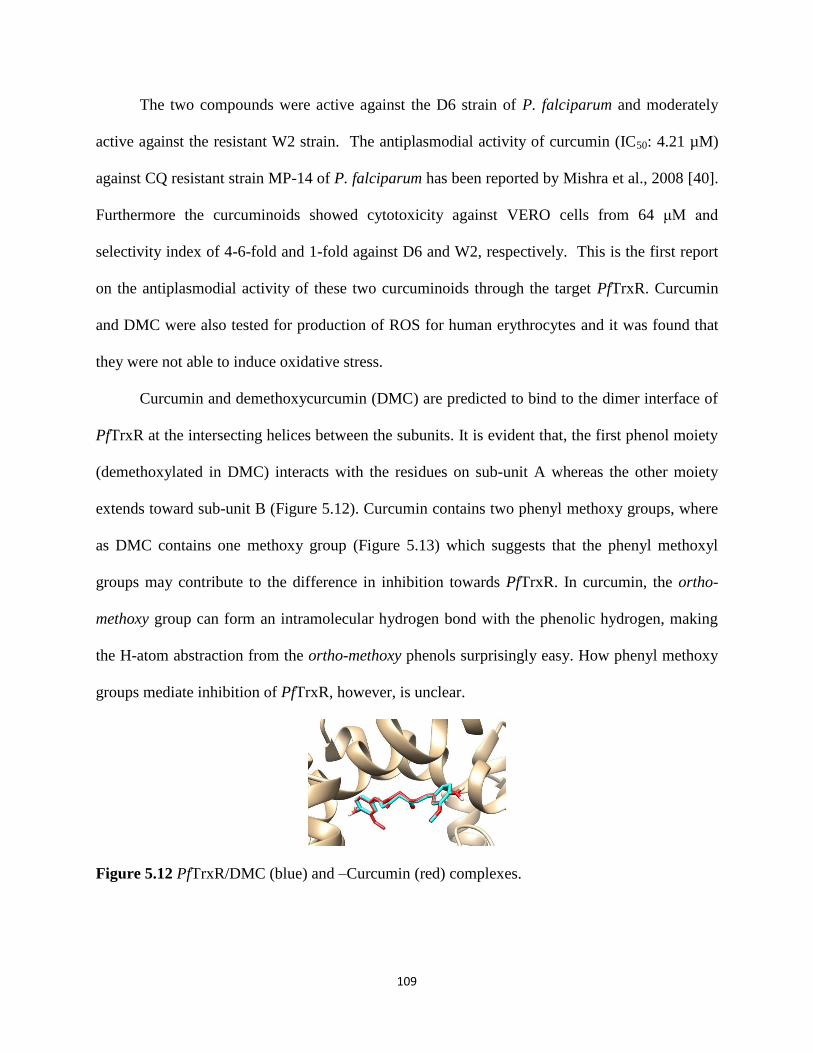
109
The two compounds were active against the D6 strain of P. falciparum and moderately
active against the resistant W2 strain. The antiplasmodial activity of curcumin (IC50: 4.21 µM)
against CQ resistant strain MP-14 of P. falciparum has been reported by Mishra et al., 2008 [40].
Furthermore the curcuminoids showed cytotoxicity against VERO cells from 64 μM and
selectivity index of 4-6-fold and 1-fold against D6 and W2, respectively. This is the first report
on the antiplasmodial activity of these two curcuminoids through the target PfTrxR. Curcumin
and DMC were also tested for production of ROS for human erythrocytes and it was found that
they were not able to induce oxidative stress.
Curcumin and demethoxycurcumin (DMC) are predicted to bind to the dimer interface of
PfTrxR at the intersecting helices between the subunits. It is evident that, the first phenol moiety
(demethoxylated in DMC) interacts with the residues on sub-unit A whereas the other moiety
extends toward sub-unit B (Figure 5.12). Curcumin contains two phenyl methoxy groups, where
as DMC contains one methoxy group (Figure 5.13) which suggests that the phenyl methoxyl
groups may contribute to the difference in inhibition towards PfTrxR. In curcumin, the ortho-
methoxy group can form an intramolecular hydrogen bond with the phenolic hydrogen, making
the H-atom abstraction from the ortho-methoxy phenols surprisingly easy. How phenyl methoxy
groups mediate inhibition of PfTrxR, however, is unclear.
Figure 5.12 PfTrxR/DMC (blue) and –Curcumin (red) complexes.

110
O O
HO OH
OCH3 OCH3Curcumin
O O
HO OH
OCH3 DMC
Figure 5.13 Structures of curcumin and demethoxycurcumin (DMC)
Earlier theoretical studies showed that hydrogen bonding between ortho-methoxy oxygen and
phenolic hydrogen in curcumin influences the planarity, conformation and ability to undergo
oxidation [41]. In both molecules, the phenyl moiety forms a pi-stacking interaction with
Tyr101 of the respective sub-unit with the hydroxyl group in DMC donating a hydrogen bond of
2.5 Å to the oxygen of Tyr 116 in sub-unit A. Curcumin’s OH group is bent in the opposite
direction because of the conformational change and thus the H-bond is not realized. For sub-unit
B, the opposite case happens. Curcumin form a 2.4 Å H-bond with the Tyr 101’ and DMC’s OH
group bends avoiding the interaction (Figure 5.14).
Figure 5.14 The interactions between DMC (blue) and Curcumin (red) with PfTrxR
The hydrophobic α, β-unsaturated chain interacts with the side chain of Ile 108 from sub-unit A.
The experimental data shows a marked difference between the two compounds with respect to
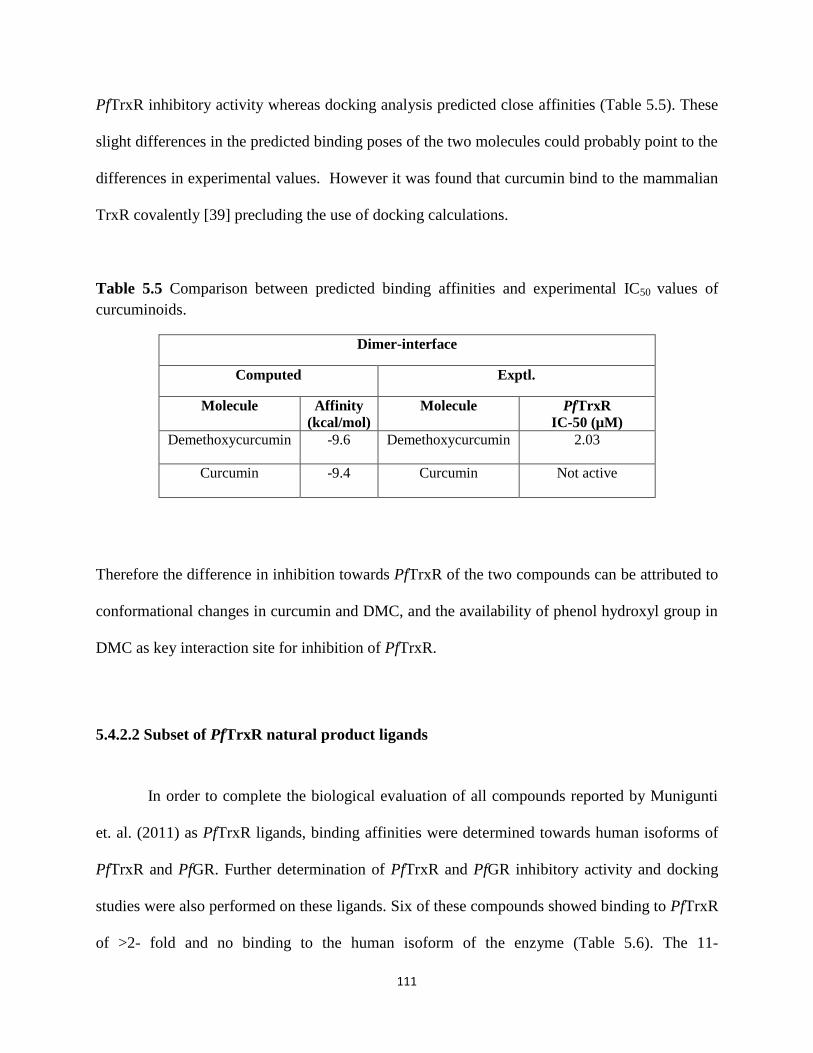
111
PfTrxR inhibitory activity whereas docking analysis predicted close affinities (Table 5.5). These
slight differences in the predicted binding poses of the two molecules could probably point to the
differences in experimental values. However it was found that curcumin bind to the mammalian
TrxR covalently [39] precluding the use of docking calculations.
Table 5.5 Comparison between predicted binding affinities and experimental IC50 values of
curcuminoids.
Dimer-interface
Computed Exptl.
Molecule Affinity
(kcal/mol)
Molecule PfTrxR
IC-50 (µM)
Demethoxycurcumin -9.6 Demethoxycurcumin 2.03
Curcumin -9.4 Curcumin Not active
Therefore the difference in inhibition towards PfTrxR of the two compounds can be attributed to
conformational changes in curcumin and DMC, and the availability of phenol hydroxyl group in
DMC as key interaction site for inhibition of PfTrxR.
5.4.2.2 Subset of PfTrxR natural product ligands
In order to complete the biological evaluation of all compounds reported by Munigunti
et. al. (2011) as PfTrxR ligands, binding affinities were determined towards human isoforms of
PfTrxR and PfGR. Further determination of PfTrxR and PfGR inhibitory activity and docking
studies were also performed on these ligands. Six of these compounds showed binding to PfTrxR
of >2- fold and no binding to the human isoform of the enzyme (Table 5.6). The 11-
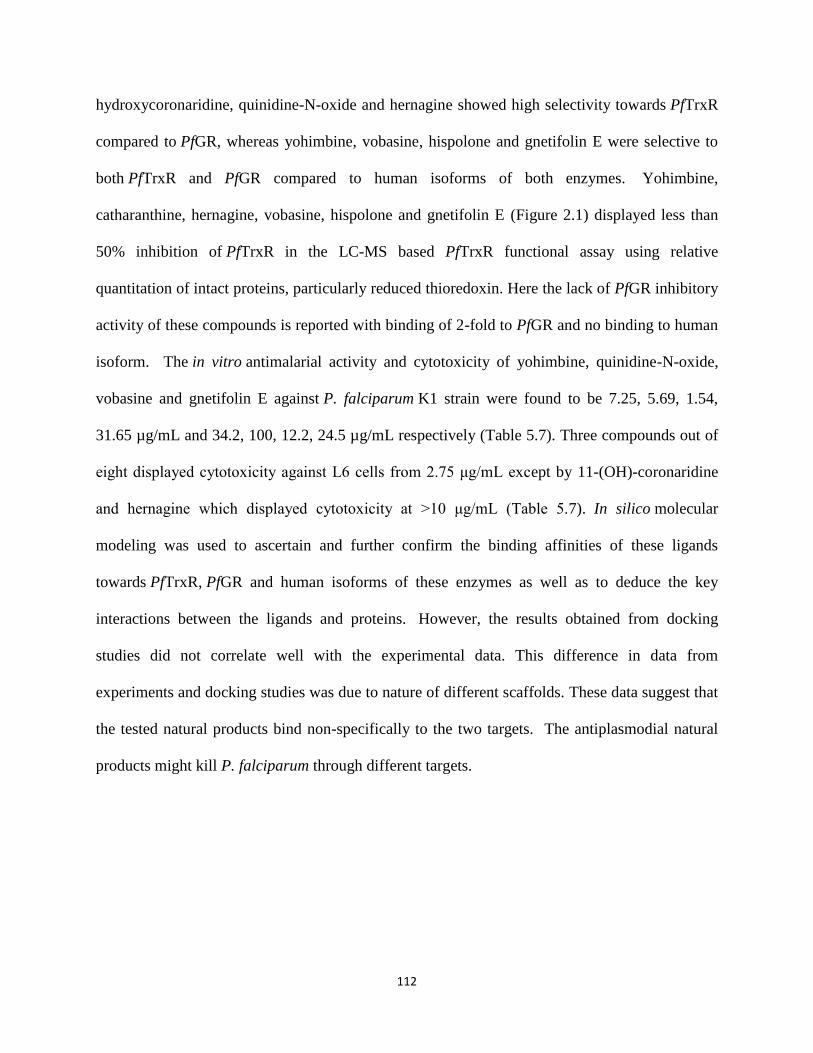
112
hydroxycoronaridine, quinidine-N-oxide and hernagine showed high selectivity towards PfTrxR
compared to PfGR, whereas yohimbine, vobasine, hispolone and gnetifolin E were selective to
both PfTrxR and PfGR compared to human isoforms of both enzymes. Yohimbine,
catharanthine, hernagine, vobasine, hispolone and gnetifolin E (Figure 2.1) displayed less than
50% inhibition of PfTrxR in the LC-MS based PfTrxR functional assay using relative
quantitation of intact proteins, particularly reduced thioredoxin. Here the lack of PfGR inhibitory
activity of these compounds is reported with binding of 2-fold to PfGR and no binding to human
isoform. The in vitro antimalarial activity and cytotoxicity of yohimbine, quinidine-N-oxide,
vobasine and gnetifolin E against P. falciparum K1 strain were found to be 7.25, 5.69, 1.54,
31.65 µg/mL and 34.2, 100, 12.2, 24.5 µg/mL respectively (Table 5.7). Three compounds out of
eight displayed cytotoxicity against L6 cells from 2.75 μg/mL except by 11-(OH)-coronaridine
and hernagine which displayed cytotoxicity at >10 μg/mL (Table 5.7). In silico molecular
modeling was used to ascertain and further confirm the binding affinities of these ligands
towards PfTrxR, PfGR and human isoforms of these enzymes as well as to deduce the key
interactions between the ligands and proteins. However, the results obtained from docking
studies did not correlate well with the experimental data. This difference in data from
experiments and docking studies was due to nature of different scaffolds. These data suggest that
the tested natural products bind non-specifically to the two targets. The antiplasmodial natural
products might kill P. falciparum through different targets.
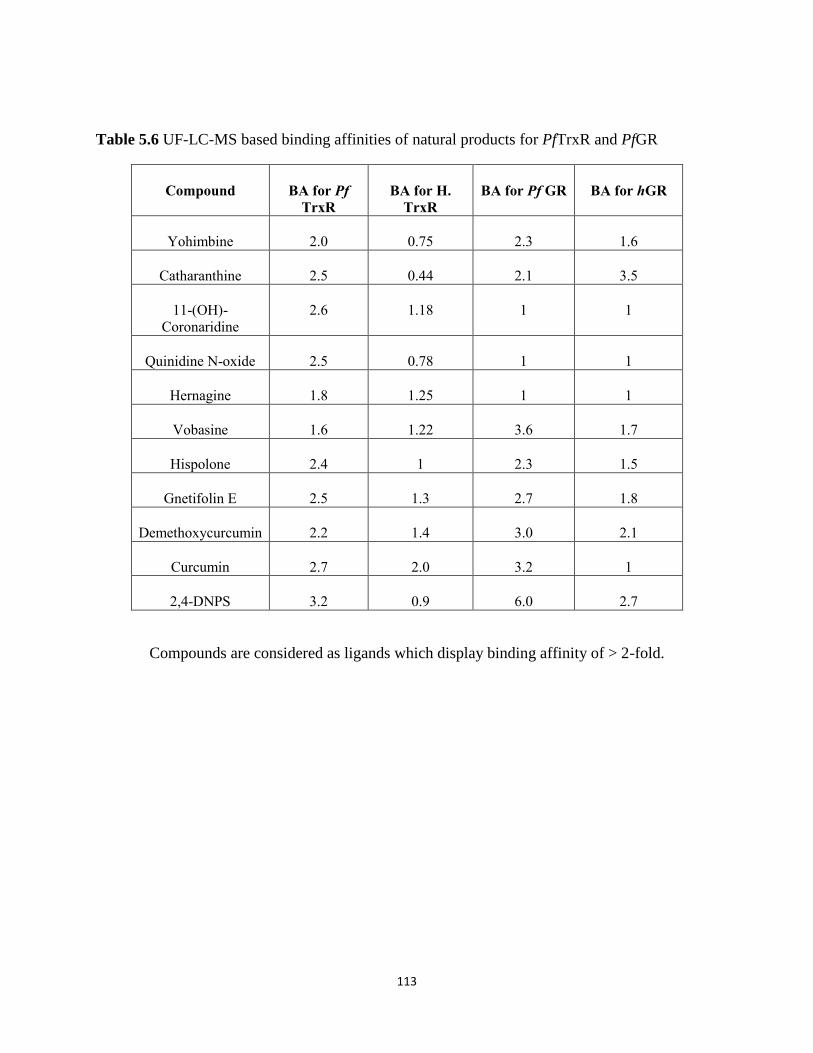
113
Table 5.6 UF-LC-MS based binding affinities of natural products for PfTrxR and PfGR
Compound
BA for Pf
TrxR
BA for H.
TrxR
BA for Pf GR
BA for hGR
Yohimbine
2.0
0.75
2.3
1.6
Catharanthine
2.5
0.44
2.1
3.5
11-(OH)-
Coronaridine
2.6
1.18
1
1
Quinidine N-oxide
2.5
0.78
1
1
Hernagine
1.8
1.25
1
1
Vobasine
1.6
1.22
3.6
1.7
Hispolone
2.4
1
2.3
1.5
Gnetifolin E
2.5
1.3
2.7
1.8
Demethoxycurcumin
2.2
1.4
3.0
2.1
Curcumin
2.7
2.0
3.2
1
2,4-DNPS
3.2
0.9
6.0
2.7
Compounds are considered as ligands which display binding affinity of > 2-fold.

114
Table 5.7 PfTrxR and PfGR inhibitory and antiplasmodial activities by selected natural products
Compound
%
Inhib
PfTrxR
10 µM
PfTrxR
IC-50
µM
PfGR
IC-50
µM
H. GR
IC-50
µM
Pf K1
IC-50
µg/mL
Cytotoxicity L6
IC-50
µg/mL
Yohimbine
40
> 169.3
> 169.3
> 169.3
7.25
34.2
Catharanthine
47
> 178.3
> 178.3
> 178.3
0.996
3.35
11-(OH)-
Coronaridine
0
> 169.3
> 169.3
> 169.3
2.98
> 10
Quinidine N-oxide
0
> 176.3
> 176.3
> 176.3
5.69
> 100
Hernagine
46
95.4
91.6
98.6
3.63
> 10
Vobasine
28.7
90.7
85.1
89.7
1.54
12.2
Hispolone
30
> 272.7
59.1
59.1
2.78
2.75
Gnetifolin E
27
> 142.7
40.04
52.3
31.65
24.5
Chloroquine
0.089
Podophyllotoxin
0.009
For antiplasmodial, we are using the following activity criteria: - Compounds with IC50< 0.5
ug/ml are active. If a compound shows IC50< 0.2 ug/ml and selectivity index (IC50 L6 cells/ IC50
parasite) >100 it qualifies for in vivo testing. Compounds with IC50 0.5 – 5 ug/ml are moderate
active. Compounds with IC50 > 5 ug/ml are inactive.
5.5 Conclusions
In this study, tools for the identification of PfTrxR using mass spectrometry, phenotyphic
screening and docking studies has been developed and validated for their potential use for

115
antimalarial drug discovery project. The in vitro antiplasmodial activity of five known inhibitors
and curcuminoids was reported for the first time in this work. From our experiments it was also
evident that curcumin selectively inhibits mammalian TrxR and not PfTrxR owing to the
differences in active sites of these two enzymes. Even though the eight natural products
displayed binding affinity towards PfTrxR, they failed to inhibit PfTrxR when tested in the LC-
MS based PfTrxR functional assay. However, five natural products (catharanthine, 11-(OH)-
coronaridine, hernagine, vobasine and hispolone) displayed moderate antimalarial activity when
tested in vitro against P. falciparum.

116
5.7 References
1. K. Becker, Y. Hu, N. Biller-Andorno. Infectious diseases - a global challenge. Int. J. Med.
Microbiol. 2008, 296, 179-185.
2. J. Sachs, P. Malaney. The economic and social burden of malaria. Nature. 2002, 415, 680-
685.
3. World malaria report. WHO. 2012. Factsheet 2012.
4. S. Müller. Thioredoxin reductase and glutathione synthesis in Plasmodium falciparum. Redox
Rep. 2003, 8(5), 251–5.
5. S. Müller, T. W. Gilberger, Z. Krnajski, K. Lüersen, S. Meierjohann, R. D. Walter.
Thioredoxin and glutathione system of malaria parasite Plasmodium falciparum.
Protoplasma. 2001, 217, 43–49.
6. F. Nosten, N. J. White. Artemisinin-based combination treatment of falciparum malaria. Am.
J. Trop. Med. Hyg. 2007, 77 (6), 181–192.
7. E. Guantai, K. Chibale. How can natural products serve as a viable source of lead compounds
for the development of new/novel anti-malarials? Malaria J. 2011, 10, S2-S8.
8. S. N. Savvides, P. A. Karplus. Kinetics and crystallographic analysis of human glutathione
reductase in complex with a xanthene inhibitor. J. Biol. Chem. 1996, 271, 8101-8107.
9. P. A. Karplus, E. F. Pai, G. E. Schulz. Crystallographic study of the glutathione binding site
of glutathione reductase at 0.3-nm resolution. Eur. J. Biochem. 1989, 178, 693–703.
10. A. Schönleben-Janas, P. Kirsch, P. R. Mittl, R. H. Schirmer, R. L. Krauth-Siegel. Inhibition
of human glutathione reductase by 10-arylisoalloxazines: crystalline, kinetic, and
electrochemical studies. J. Med. Chem. 1996, 39, 1549–1554.

117
11. K. Becker, R. I. Christopherson, W. B. Cowden, N. H. Hunt, R. H. Schirmer. Flavin analogs
with antimalarial activity as glutathione reductase inhibitors. Biochem. Pharmacol. 1990,
39, 59–65.
12. G. Boumis, G. Giardina, F. Angelucci, A. Bellelli, M. Brunori, D. Dimastrogiovanni, F.
Saccoccia, A. E. Miele. Crystal structure of Plasmodium falciparum thioredoxin reductase, a
validated drug target. Biochem. Biophys. Res. Commun. 2012, 425, 806-811.
13. G. N. Sarma, S. N. Savvides, K. Becker, M. Schirmer, R. H. Schirmer, P. A. Karplus.
Glutathione reductase of the malarial parasite Plasmodium falciparum: crystal structure and
inhibitor development. J. Mol. Biol. 2003, 328, 893-907.
14. R. Munigunti, A. I. Calderón. Development of liquid chromatography/mass spectrometry
based screening assay for PfTrxR inhibitors using relative quantitation of intact thioredoxin.
Rapid Commun. Mass Spectrom. 2012, 26, 1-6.
15. V. Mulabagal, A. I. Calderón. Development of binding assays to screen ligands for
Plasmodium falciparum thioredoxin and glutathione reductases by ultrafiltration and liquid
chromatography/mass spectrometry. J. Chromatogr. B. 2010, 878, 987-993.
16. S. M. Kanzok, R. H. Schirmer, I. Turbachova, R. Iozef, K. Becker. The Thioredoxin system
of the malaria parasite Plasmodium falciparum. J. Biol. Chem. 2000, 275, 40180-40186.
17. M. M. Bradford. A rapid and sensitive method for the quantitation of microgram quantities
of proteins utilizing the principle of protein-dye binding. Anal. Biochem. 1976, 72, 248-254.
18. I. Orhan, B. Şener, M. Kaiser, R. Brun, D. Tasdemir. Inhibitory activity of marine sponge-
derived natural products against parasitic protozoa. Mar. Drugs. 2010, 8, 47-58.
118
19. M. T. Makler, D. J. Hinrichs. Measurement of the lactate dehydrogenase activity of
Plasmodium falciparum as an assessment of parasitemia. Am. J. Trop. Med. Hyg. 1993, 48,
205-210.
20. H. Babich, E. Borenfreund. Cytotoxicity of T-2 toxin and its metabolites determined with
the neutral red cell viability assay. Appl. Environ. Microbiol. 1991, 57(7), 2101-2103.
21. M. L. Sivilotti. Oxidant stress and haemolysis of the human erythrocyte. Toxicol. Rev. 2004,
23, 169-188.
22. S. Ganesan, N. D. Chaurasiya, R. Sahu, L. A. Walker, B. L. Tekwani. Understanding the
mechanisms for metabolism-linked hemolytic toxicity of primaquine against glucose 6-
phosphate dehydrogenase deficient human erythrocytes: evaluation of eryptotic pathway.
Toxicology. 2012, 294(1), 54-60.
23. O. Trott, A. J. Olson. AutoDockVina: improving the speed and accuracy of docking with a
new scoring function, efficient optimization and multithreading. J. Comput. Chem. 2010, 31,
455-461.
24. K. Fritz-Wolf, S. Kehr, M. Stumpf, S. Rahlfs, K. Becker. Crystal structure of the human
thioredoxin reductase-thioredoxin complex. Nat. Commun. 2011, 2, 383-383.
25. G. M. Morris, R. Huey, W. Lindstrom, M. F. Sanner, R. K. Belew, D. S. Goodsell, A. J.
Olson. AutoDock4 and AutoDockTools4: Automated docking with selective receptor
flexibility. J. Comput. Chem. 2009, 30, 2785-2791.
26. The PyMOL molecular graphics system, Version 1.5.0.4, Schrödinger, LLC.
27. M. P. Repasky, J. Chandrasekhar, W. L. Jorgensen. PDDG/PM3 and PDDG/MNDO:
Improved semiempirical methods. J. Comput. Chem. 2002, 23, 1601-1622.

119
28. I. Tubert-Brohman, C. R. W. Guimarães, M. P. Repasky, W. L. Jorgensen. Extensition of
the PDDG/PM3 and PDDG/MNDO semiempirical molecular orbitial methods to the
halogens. J. Comput. Chem.2003, 25, 138-150.
29. I. Tubert-Brohman, C. R. W. Guimarães, W. L. Jorgensen. Extension of the PDDG/PM3
Semiempirical molecular orbital method to sulfur, silicon, and phosphorus. J. Chem.
Theory Comput. 2005, 1, 817-823.
30. B. Hess, C. Kutzner, D.v. d. Spoel, E. Lindahl. GROMACS 4: Algorithms for highly
efficient, load-balanced, and scalable molecular simulation, J. Chem. Theory Comput.
2008, 4, 435–447.
31. S. N. Savvides, P. A. Karplus. Kinetics and Crystallographic Analysis of Human
Glutathione Reductase in Complex with a Xanthene Inhibitor. J. Biol. Chem. 1996, 271,
8101–8107.
32. D. M. Kasozi, S. Gromer, H. Adler, K. Zocher, S. Rahlfs, S. Wittlin, K. Fritz-Wolf, R. H.
Schirmer, K. Becker. The bacterial redox signaller pyocyanin as an antiplasmodial agent:
comparisons with its thioanalog methylene blue. Redox Rep. 2011, 16(4), 154-65.
33. D. Andricopulo, M. B. Akoachere, R. Krogh, C. Nickel, M. J. McLeish, G. L. Kenyon, L. D.
Arscott, C. H. Williams, E. Davioud-Charvet, K. Becker. Specific inhibitors of Plasmodium
falciparum thioredoxin reductase as potential antimalarial agents. Bioorg. Medicinal Chem.
Lett. 2006
34. E. D. Charvet, M. J. McLeish, D. M. Veine, D. Giegel, L. D. Arscott, A. D. Andricopulo, K.
Becker, S. Müller, R. H. Schirmer, C. H. Williams, G. L. Kenyon. Mechanism-based
inactivation of thioredoxin reductase from Plasmodium falciparum by Mannich bases.
Implication for cytotoxicity. Biochemistry. 2003, 42, 13319–1333.

120
35. T. Morin, J. C. Besset, M. Moutet, M. Fayolle, D. Bruckner, K. Limosin, E. Becker, E.
Davioud-Charvet. The aza-analogues of 1, 4-naphthoquinones are potent substrates and
inhibitors of Plasmodial thioredoxin and glutathione reductases and of human erythrocyte
glutathione reductase. Org. Biomol. Chem. 2008, 6, 2731-2742.
36. Y. Shang, C. Chen, Y. Li, J. Zhao, T. Zhu. Hydroxyl radical generation mechanism during
the redox cycling process of 1,4-naphthoquinone. Environ. Sci. Technol. 2012, 46 (5),
2935–2942.
37. T. Müller, L. Johann, B. Jannack, M. Brückner, D. A. Lanfranchi, H. Bauer, C. Sanchez, V.
Yardley, C. Deregnaucourt, J. Schrével, M. Lanzer, R. H. Schirmer, E. Davioud-Charvet.
Glutathione reductase-catalyzed cascade of redox reactions to bioactivate potent antimalarial
1,4-naphthoquinones - A newstrategy to combat malarial parasites. J. Am. Chem. Soc. 2011,
133, 11557–11571.
38. P. A. Karplus, G. E. Schulz. Substrate binding catalysis by Glutathione reductase as derived
from derived enzyme: Substrate crystal structures at 2 Å resolution. J. Mol. Biol. 1989, 210,
163-180.
39. J. Fang, J. Lu, A. Holmgren. Thioredoxin reductase is irreversibly modified by Curcumin. J.
Biol. Chem. 2005, 280, 25284-25290.
40. S. Mishra, K. Karmoiya, N. Surolia. Synthesis and expolartion of novel curcumin analogues
as antimalarial agents. Bioorg. Med. Chem. 2008, 16(6), 2894-2902
41. S. K. Sandur, M. K. Pandey, B. Sung, K. S. Ahn, A. Murakami, G. Sethi, P. Limtrakul, V.
Badmaev, B. B. Aggarwal. Curcumin, demethoxycurcumin, bisdemethoxycurcumin,
tetrahydrocurcumin and turmerones differentially regulate anti-inflammatory and anti-

121
proliferative responses through a ROS-independent mechanism. Carcinogenesis. 2007, 28,
1765–1773.