Mass Spectrometry: A Flexible Tool for Drug DiscoveryTool for
46
0DVV 6SHFWURPHWU\ $ )OH[LEOH 7RRO IRU 'UXJ 'LVFRYHU\ 7RRO IRU 'UXJ 'LVFRYHU\ -RQ ' :LOOLDPV -RQ ' :LOOLDPV
Transcript of Mass Spectrometry: A Flexible Tool for Drug DiscoveryTool for

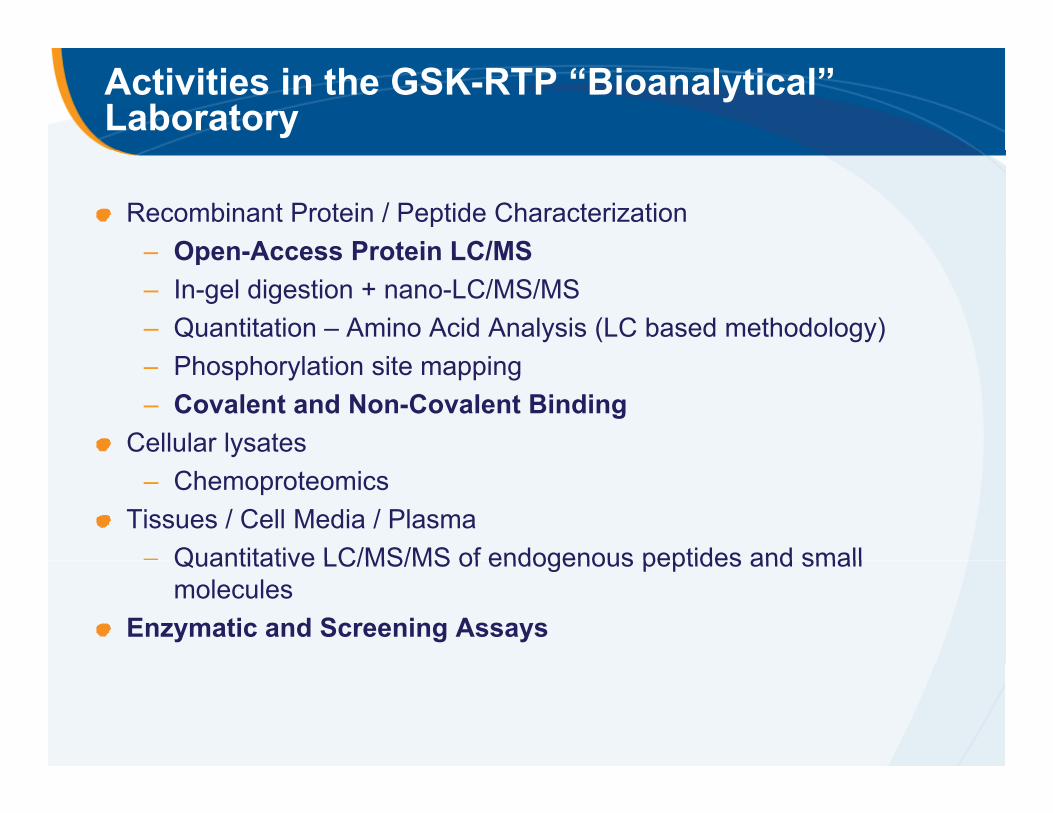
Recombinant Protein / Peptide Characterization––– In-gel digestion + nano-LC/MS/MS– Quantitation – Amino Acid Analysis (LC based methodology)– Phosphorylation site mapping–
Cellular lysates– Chemoproteomics
Tissues / Cell Media / Plasma– Quantitative LC/MS/MS of endogenous peptides and smallQuantitative LC/MS/MS of endogenous peptides and small
molecules

Protein LC/MS Open-Access
Non-covalent MS
Access

1D SDS Page Gel
– Multiplexed technique every– Multiplexed technique, every biochemists knows how, slow (1 hr per run), mass accuracy ~1%
MALDI-TOF100
041404_001 6 (1.074) Sm (SG, 2x10.00); Cm (6) TOF LD+ 39332598.441
32947.305MALDI-TOF
Fast (minutes), unlimited mass range, easy to use, requires some sample preparation mass accuracy 0 1
%
32250.41233285.121
preparation, mass accuracy 0.1 –0.01%, mass resolution ~500
ESI-MS (ESI-TOF) 100
5332 67 (3.619) M1 [Ev-77914,It10] (Gs,0.750,450:2200,0.75,L33,R33); Cm (63:72) 1: TOF MS ES+ 1.16e332601.0000
32940.0000
30000 30500 31000 31500 32000 32500 33000 33500 34000 34500 35000 35500m/z0
32005.70730173.545
33538.016
33976.930
34414.379 35569.594
– Excellent mass accuracy and mass resolution (<0.01% and > 1500), requires desalting, limited mass
/% 32260.5000
33278.2500
range, m/z spectra need to be deconvoluted
30000 30500 31000 31500 32000 32500 33000 33500 34000 34500 35000 35500mass0
31437.000030926.2500
33618.7500
35288.250034576.5000

Enable sample submitters access to instrumentation with minimal user training and analyst involvementUser friendly system Robust LC/MS analysis method Instrument start-up and shutdown between analysesp yWeb-based sample submissionSample registration completed at appropriate instrument Automated processing using a dedicated serverAutomated processing using a dedicated serverIntelligent data processing and results reviewResults automatically posted to website Works with multiple vendors
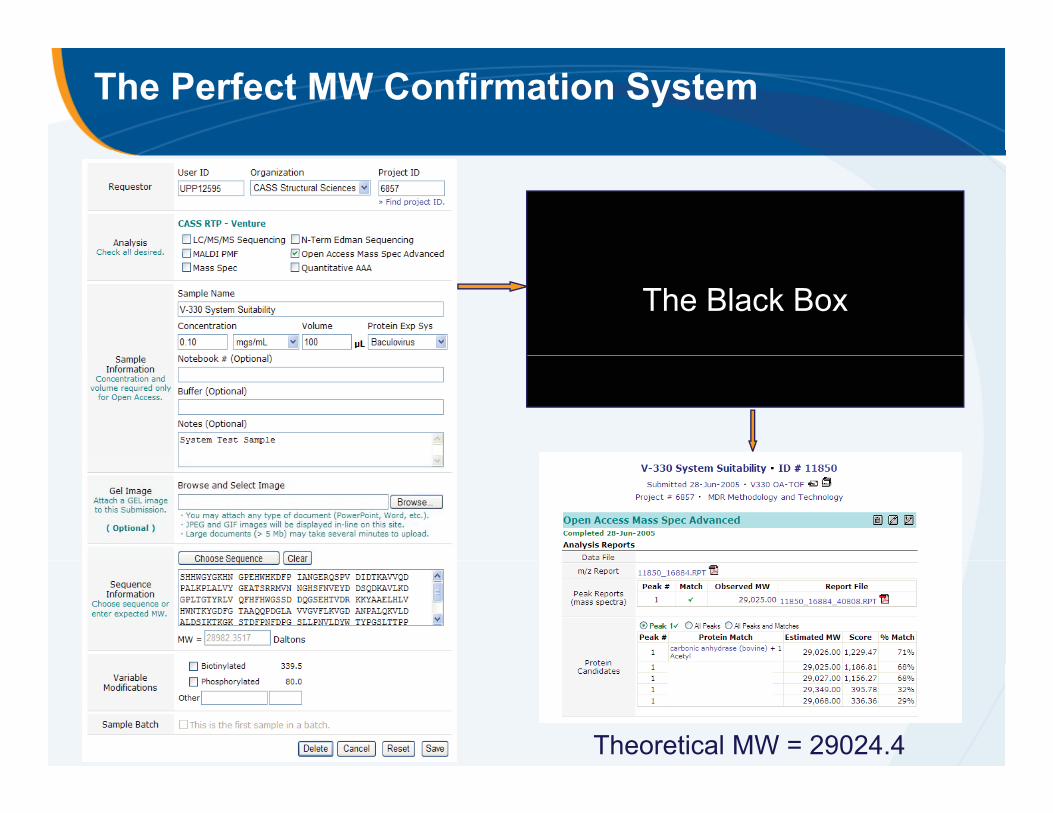
The Black Box
Auto-Interpreted Report back to the biologistAuto-Interpreted Report back to the biologist
Theoretical MW = 29024.4
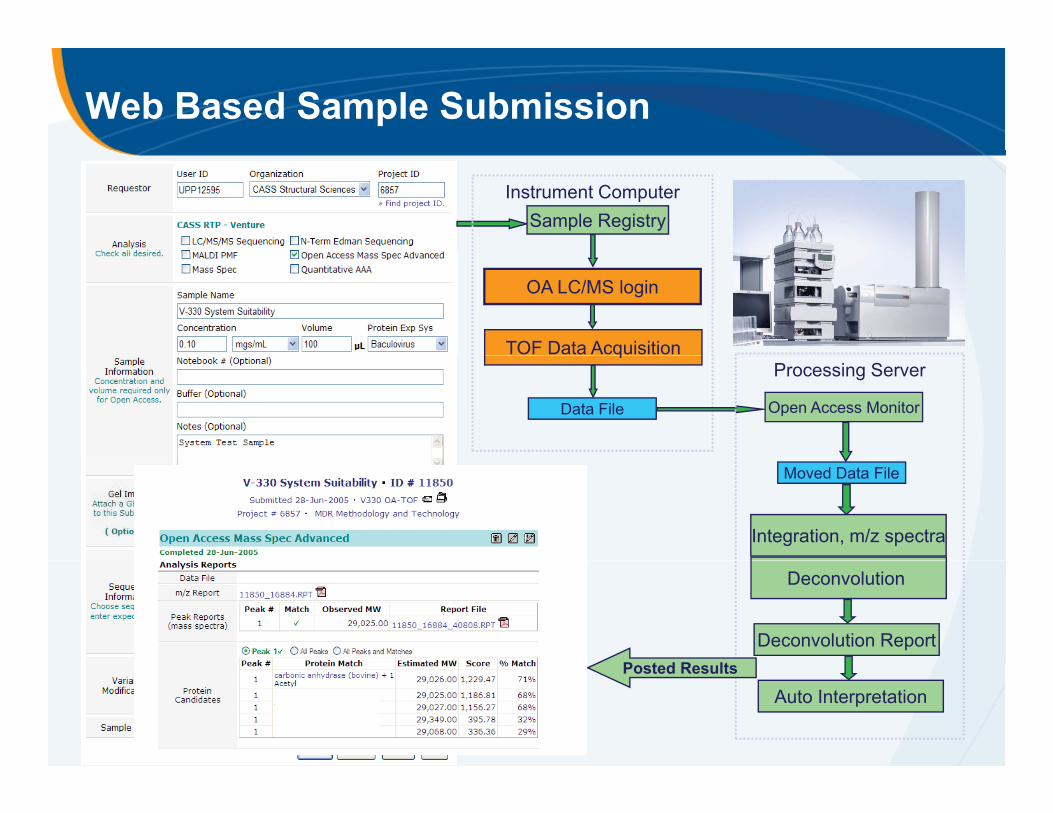
Sample RegistryInstrument Computer
TOF Data Acquisition
OA LC/MS login
q
Data File
Processing Server
Open Access Monitor
Integration, m/z spectra
Moved Data File
Deconvolution Report
Deconvolution
Auto Interpretation

QC of fractions and purified recombinant proteins– Determine if N-term is modified or lost based on differences– Determine if N-term is modified or lost based on differences
between expected and experimental MW– Look at extent of expression modification
Incorporation of covalent modifications (kinetics or end point)Incorporation of covalent modifications (kinetics or end-point)– Phosphate– Biotin – Ligands
Analysis of Products from limited proteolysis– Typically can deduce fragment sequence based on mass and yp y g q
enzyme specificity

Theoretical MW = 274,631.3(difference due to an unspecified phosphorylation site)phosphorylation site)

R. Klein, UNC Ph.D. Thesis
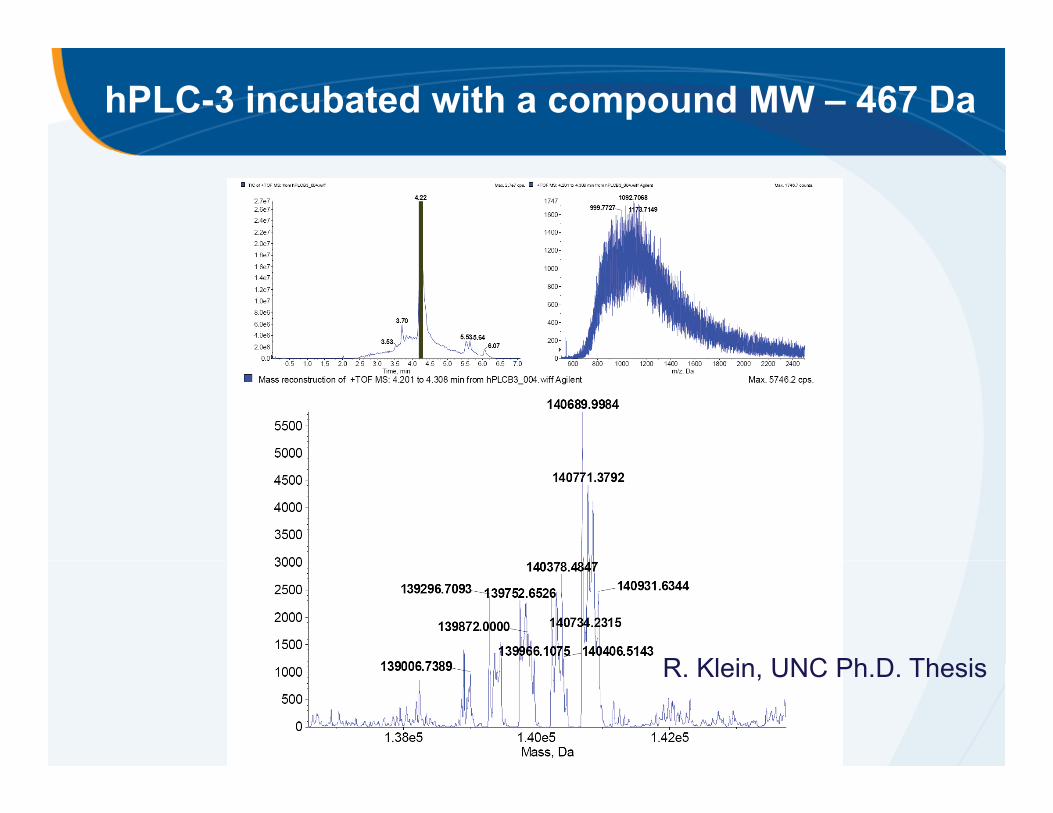
R Klein UNC Ph D ThesisR. Klein, UNC Ph.D. Thesis

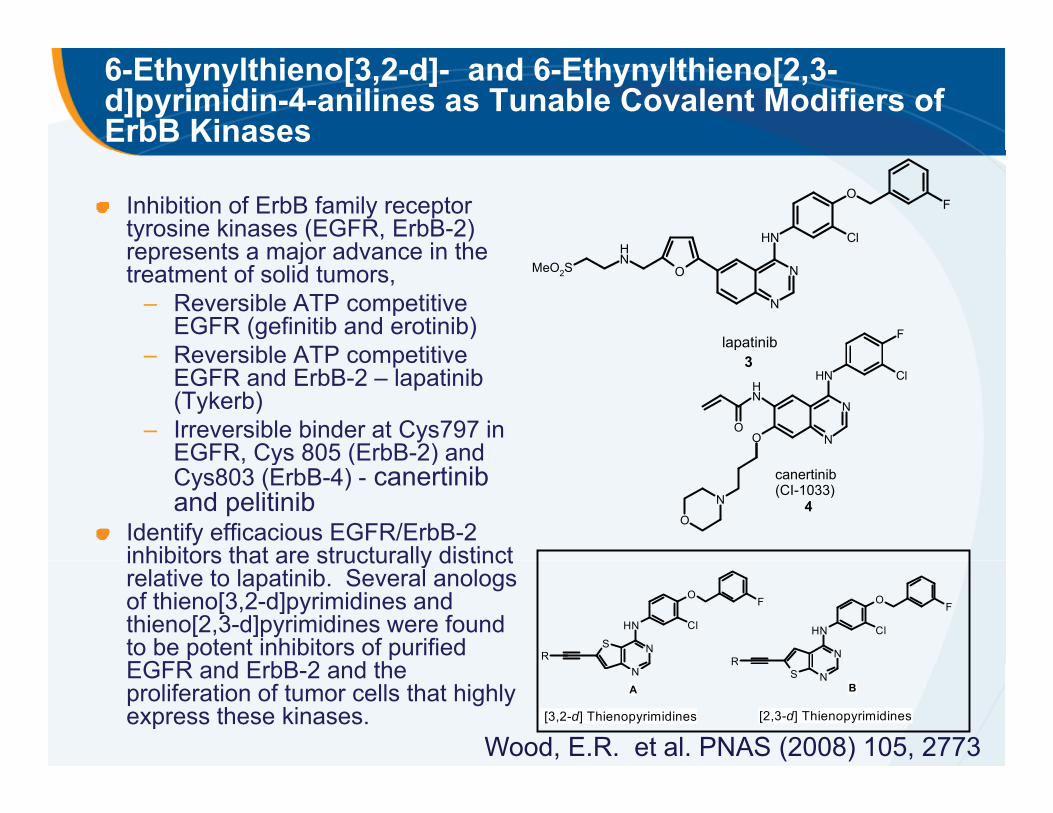
Inhibition of ErbB family receptor tyrosine kinases (EGFR, ErbB-2) represents a major advance in the
NH Cl
OF
Hrepresents a major advance in the treatment of solid tumors,
– Reversible ATP competitive EGFR (gefinitib and erotinib)Reversible ATP competitive
O N
N
NH
MeO2S
lapatinib F
– Reversible ATP competitive EGFR and ErbB-2 – lapatinib (Tykerb)
– Irreversible binder at Cys797 in EGFR Cys 805 (ErbB-2) and
N
NH
NNH
OO
Cl
EGFR, Cys 805 (ErbB 2) and Cys803 (ErbB-4) - canertinib and pelitinib
Identify efficacious EGFR/ErbB-2 inhibitors that are structurally distinct
N
O
canertinib(CI-1033)
inhibitors that are structurally distinct relative to lapatinib. Several anologs of thieno[3,2-d]pyrimidines and thieno[2,3-d]pyrimidines were found to be potent inhibitors of purified EGFR d E bB 2 d th
RNS
NH
O
Cl
F
N
NH
O
Cl
F
REGFR and ErbB-2 and the proliferation of tumor cells that highly express these kinases.
Wood, E.R. et al. PNAS (2008) 105, 2773
N NSR
[3,2-d] Thienopyrimidines [2,3-d] Thienopyrimidines

Wood, E.R. et al. PNAS (2008) 105, 2773

100
120
40573 (EGFR (678-1020)
SO O
NH
O
N
N
NH Cl
OF
GFR
Mod
ified
(% T
otal
)
20
40
60
80
41058
N
N
NH
ON
O
Canertinib MW = 486 Da
Time (minutes)
0 50 100 150 200 250 300 350
E
0
20
C d S i R % Alk l i fNH
Cl
O
F
41050
Shift = 485 Da Cmpd Series R % Alkylation ofEGFR
3 h 20 h6 A H 9 67
7 A 0 15
N
NS
NH
O
Cl
F
NH
Thienopyrimdine MW = 478 DaShift = 477 Da
NH
NH2
N
NN
H
H
7 A 0 15
8 A 83 100
9 A 0 0
40000 40400 40800 41200 41600mass
Wood E R et al
NH2
NH
NH
11a B 0 19
12 B 4 24
13 B 0 0O OWood, E.R. et al.
PNAS (2008) 105, 2773
NN
H
4 - - 100 100RN
NS
NH
O
Cl
F
N
N
S
NH
O
Cl
F
R
[3,2-d] Thienopyrimidines [2,3-d] Thienopyrimidines

NN
S
N N
N
S
NHAr
H
HHS
NS
NHAr
N
H
HH+
N
N
SH
H
S NHAr
NH
Wood, E.R. et al. PNAS (2008) 105, 2773
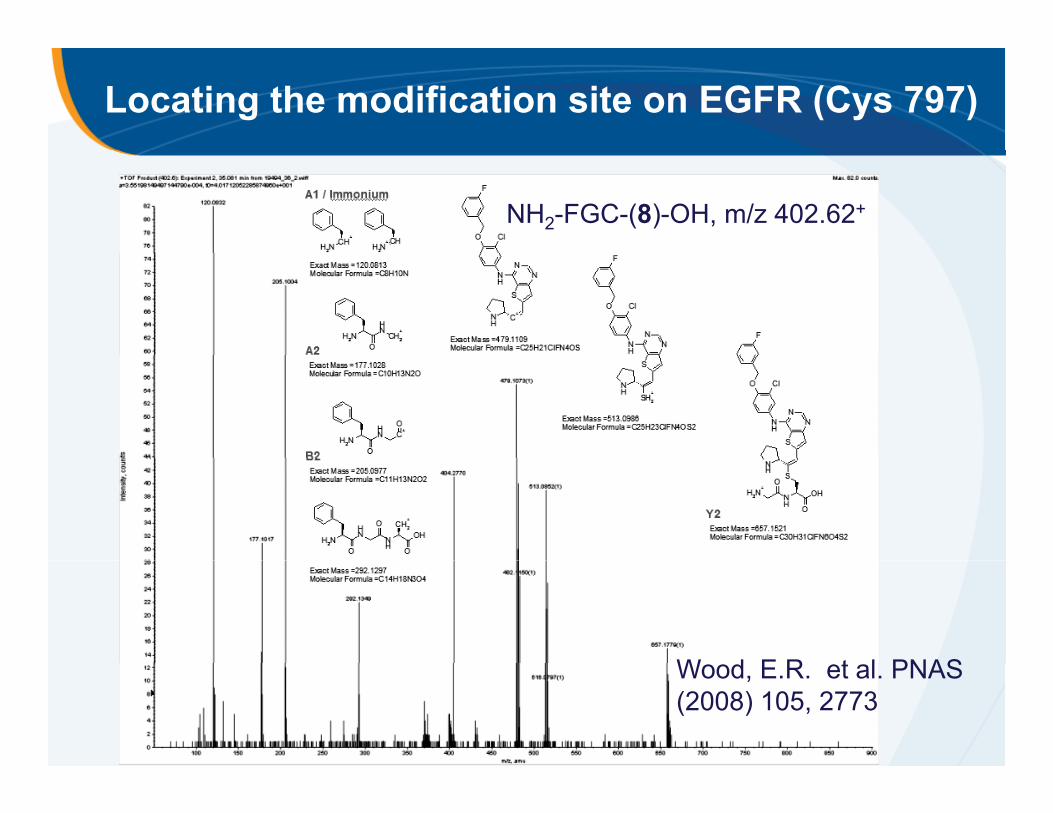
NH2-FGC-( )-OH, m/z 402.62+
W d E R t l PNASWood, E.R. et al. PNAS (2008) 105, 2773

Screened over 800 compounds at two time points (3 and 20h)
The [3,2-d] thienopyrimidines had higher reactivity than the [2,3-d] series
Enabled program to select lead compounds for additional testing
Binding experiments were conducted before and after installation of OA software
–
–
Confirmed site of covalent bond attachment to EGFR
Other program teams have utilized Open-Access MS and LC/MS/MS sequencing to determine the presence and location of covalently boundsequencing to determine the presence and location of covalently bound compounds – prior to doing structural studies

Protein Ligand+ Protein expressed with ligand or native ligand
Ligand+
ligand or native ligand
Incubation time
Vary incubationincubation time &/or solvent
conditions

Veramyst/Advair/Flonase
Avandia


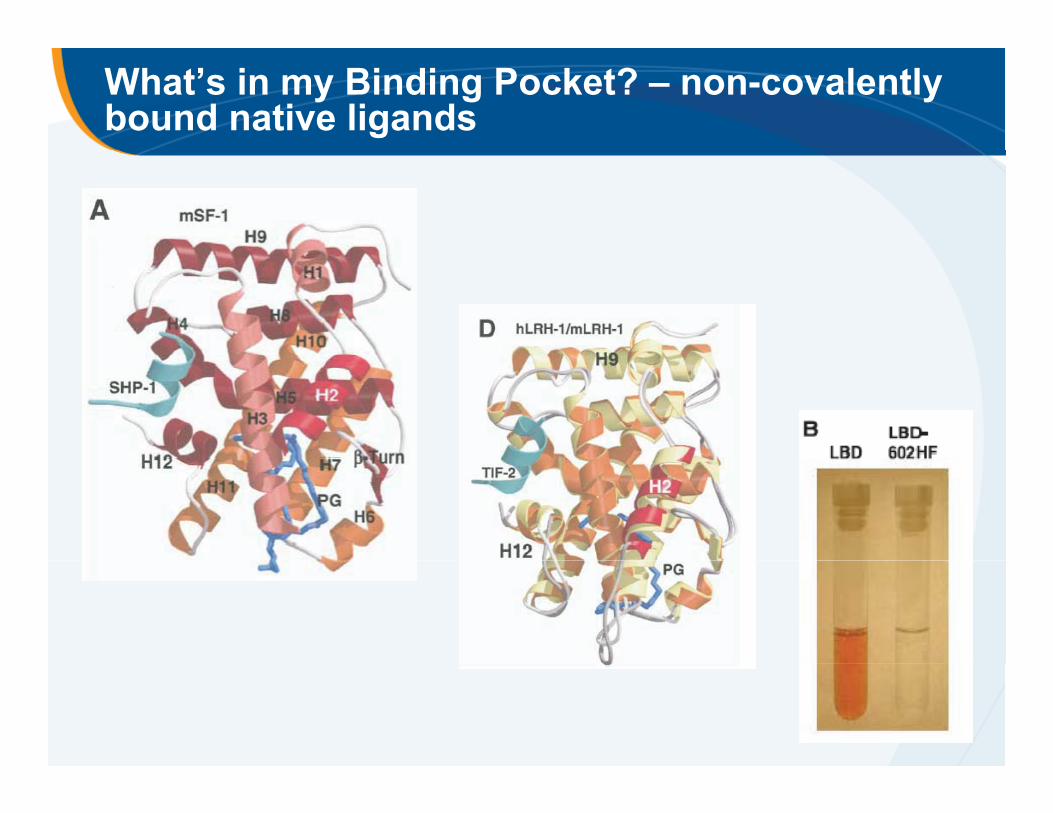
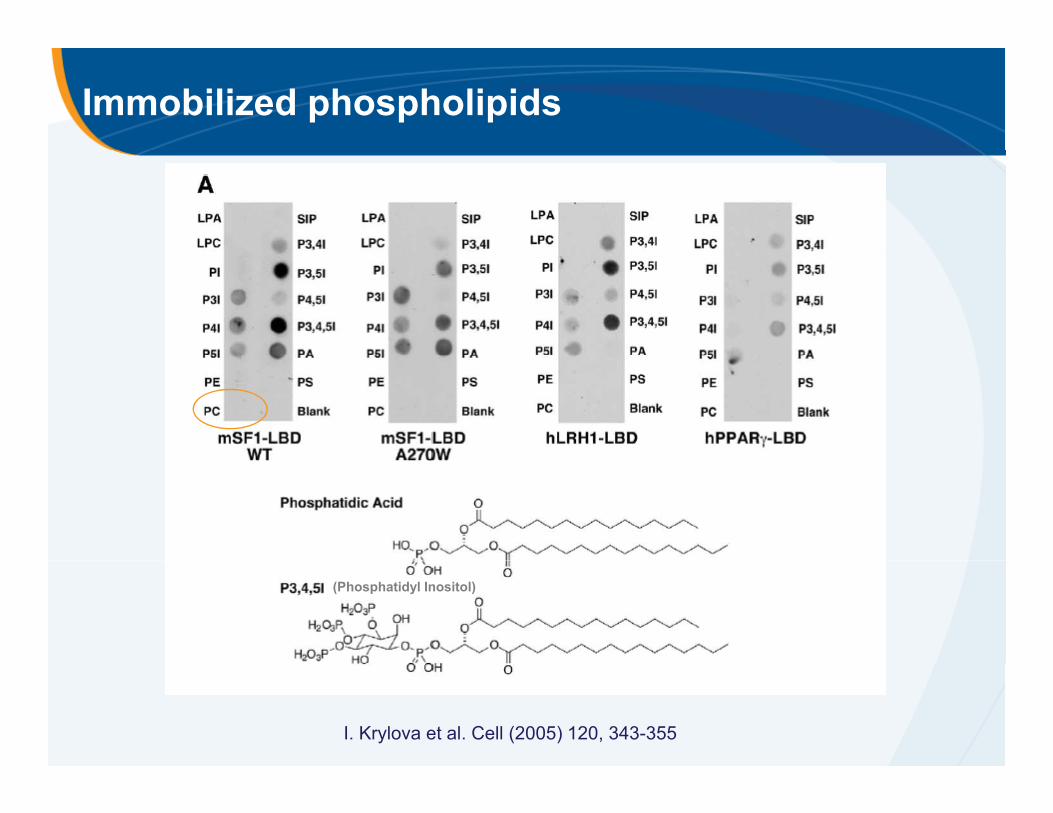
SF-1 and LRH-1 native ligand studies
SF-1 and LRH-1 are in NR sub family 5AActive in many cell typesActive in many cell typesNot regulated by steroid, retinoid, other non-polar ligands“Obvious ligand candidates have not been forthcoming”
I. Krylova et al. Cell (2005) 120, 343-355

What is the identity and quantity of the native ligands found in bacterially expressed systems of mouse and human SF-1 and LRH-1?
Can the native ligand be removed and exchanged with a potential native ligand found in eukaryotic cells?

Separate free from bound ligands using gel filtration “spin columns” and analyze bound fractions using reversed-phase LC/MSand analyze bound fractions using reversed phase LC/MS
– Detect ligand only – Small molecules of interest may not ionize
Directly monitor intact protein-ligand complex using electrospray mass spectrometry
f– Membrane filtration– Size-exclusion
Spin columnsIn-line gel columns (Cavanagh et al. Anal. Chem 2003)
– Automated and optimized using standard LC equipment (G.M. Waitt, et al. JASMS (2008) 19, 239)

Protein
Protein
Protein
Protein
SaltSalt
Salt
SaltSalt
Salt
ProteinProtein
BioRad P6DG Sephedex G25 BioRad P6DG0.75mm ID
p1.6mm ID 1.6mm ID
G.M. Waitt, et al. JASMS (2008) 19, 239

Cap LCChannels A & BWaste W t
V
P6 G l C l
Channels A & B
AutosamplerNanoLC
Waste Waste
P6 Gel ColumnLC
ESI
Mass Spectrometer
ESI
Mobile Phase 20 mM NH4OAcCh l A+B Fl R t 10 L/ i Mass SpectrometerChannels A+B Flow Rate 10 L/min. Nano LC Flow Rate 4 L/min.Valve Switch ~ 8 min. Run-time 20 min.
G.M. Waitt, et al. JASMS (2008) 19, 239

4 .0 E + 0 5
3 .0 E + 0 5
3 .5 E + 0 5
2 .0 E + 0 5
2 .5 E + 0 5
1 .0 E + 0 5
1 .5 E + 0 5
5 .0 E + 0 40 5 0 1 0 0 1 5 0 2 0 0
10 mM ammonium acetate ( ), 10 mM Tris HCl ( ), and 20 mM Tris, 200 mM NaCl at pH 8 ( )
G.M. Waitt, et al. JASMS (2008) 19, 239

2796328711
100
[A][B] 2872
2797
[B]10+
[A]10+
9
3191
3108
[B]9+
[A]9+
%
28684
25432611
3108
28963217
[A]11+[B]11+
% 2611 2947 3217
m/z
27980 28725
27600 28000 28400 28800 29200 296000mass
I. Krylova et al. Cell (2005) 120, 343-355

745.5007745.5007
719 4851714.5060 719 4851714.5060 719.4851714.5060
688 4898
%
719.4851714.5060
688 4898
%
773.5309759.5165
733.5007
688.4898
773.5309759.5165
733.5007
688.4898
690 700 710 720 730 740 750 760 770 7800
702.5049
690 700 710 720 730 740 750 760 770 7800
702.5049
690 700 710 720 730 740 750 760 770 780m/z
690 700 710 720 730 740 750 760 770 780m/z
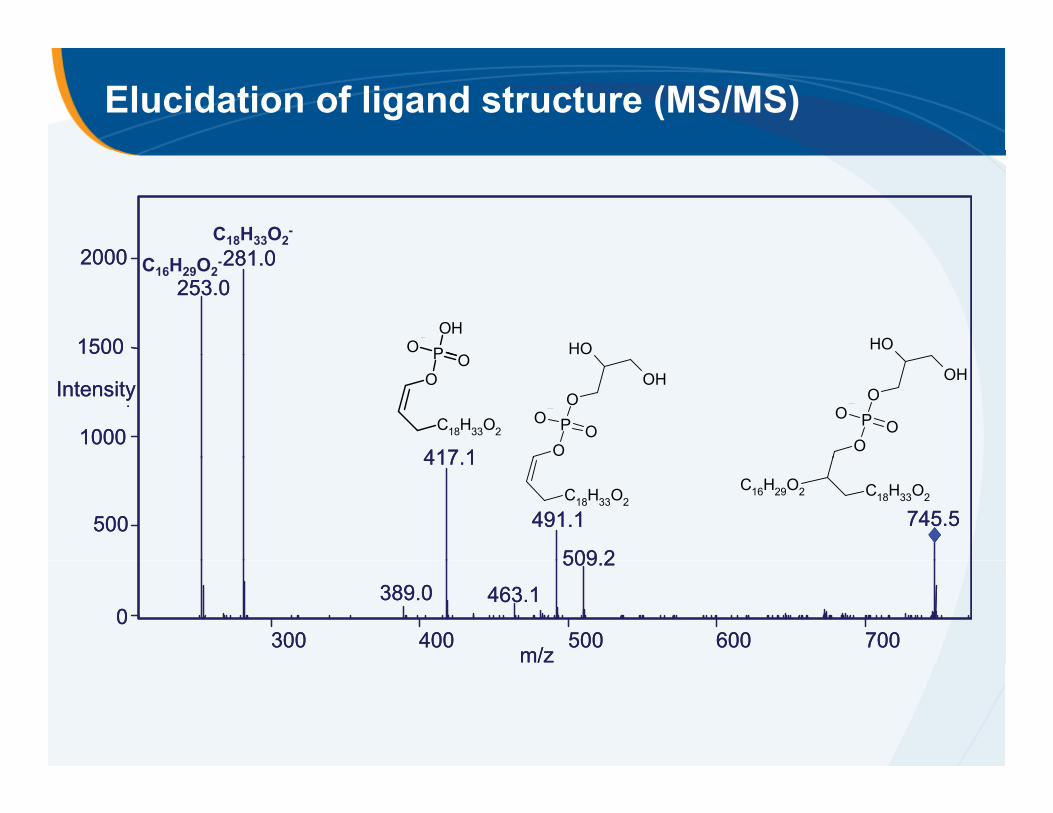
281 02000 281 02000253.0
281.0
1500
2000253.0
281.0
1500
2000
OHPO
OOH OH
417 11000
Intensity.
417 11000
Intensity.
PO
O
C18H33O2
OP
O
OO
OHO
PO
OO
OH
417.1
491.1
509 2
745.5500
417.1
491.1
509 2
745.5500C18H33O2
C18H33O2C16H29O2
389.0 463.1
509.2
0300 400 500 600 700
m/z
389.0 463.1
509.2
0300 400 500 600 700
m/z

745.5007 745.5025 C40H74O10P- C16:1, C18:1 PG719.4868 719.4851 C38H72O10P- C14:0, C18:1
C16:0, C16:1PG
714 5060 714 5074 CH NO P- C16:1 C18:1 PE714.5060 714.5074 CH73NO8P C16:1, C18:1 PE691.4562 691.4550 C36H68O10P- C12:0, C18:1
C14:0, C16:1C14:1, C16:0
PG
,773.5309 773.5333 C42H78O10P- C18:1, C18:1 PG759.5165 759.5176 C41H76O10P- C18:1, C17:1
C16:1, C19:1PG
747 5136 747 5181 C H O P- ND3 PG747.5136 747.5181 C40H76O10P ND3 PG688.4898 688.4852 C37H71NO8P- ND PE733.5007 733.5025 C39H74O10P- ND PG702.5049 702.5009 C38H73NO8P- ND PE0 50 9 0 5009 C38 73 O8742.5359 742.5392 C41H77NO8P- ND PE

System Protein Ligand H6-H7Conc. (μM) Conc. (μM) SequenceConc. (μM) Conc. (μM) Sequence
mSF-1 30 34 VQAGSLLHShSF-1 50 23 TQAGSLLHSmLRH-1 30 4 SHTEVAFNNhLRH-1 30 28 SQAGATLNNmSF-1 A270W* 30 0.3 VQAGSLLHS
*M i l d i H3*Mutation located in H3
I. Krylova et al. Cell (2005) 120, 343-355

100
9703_002 31 (5.276) M1 [Ev-27332,It8] (Gs,0.750,2469:3286,0.75,L33,R33); Cm (30:35) TOF MS ES+ 1.31e330562.7500
30739.7500
%
31220.500031044.250031252.7500 PG ligands absent
30600 30800 31000 31200 31400 31600mass0
No binding
I. Krylova et al. Cell (2005) 120, 343-355

I. Krylova et al. Cell (2005) 120, 343-355

I. Krylova et al. Cell (2005) 120, 343-355

Utilized various mass spectrometric techniques to identify, quantitate, and monitor the exchange of native ligands from SF-1 and LRH-1and monitor the exchange of native ligands from SF 1 and LRH 1
With these and other biochemical data, binding activity for mLRH-1 was uniquely diminished and alteredwas uniquely diminished and altered.
Proposed that phospholipids regulate gene expression by directly binding to NR5A nuclear receptorsbinding to NR5A nuclear receptors.

L. Yin, et al., Science (2007) 318, 1786-1789

Mass reconstruction of +TOF MS: 0.101 to 0.801 min from 20509_001.wiff Max. 129.7 cps.
39473.8086
+TOF MS: 2.519 to 2.607 min from 20509_001.wiff Agilent Max. 1.2e5 counts.
8.4e4
39473.8
616.17
5.5e4
6.0e4
6.5e4
7.0e4
7.5e4
8.0e4616.17
615 1 Da39486.1289
39497.128938858 6914
3.0e4
3.5e4
4.0e4
4.5e4
5.0e4
5.5e4
38858.7
615.1 Da
38858.6914
614 5 615 0 615 5 616 0 616 5 617 0 617 5 618 0 618 5 619 0 619 5 620 00.0
5000.0
1.0e4
1.5e4
2.0e4
2.5e4
614.5 615.0 615.5 616.0 616.5 617.0 617.5 618.0 618.5 619.0 619.5 620.0m/z, amu

Mass reconstruction of +TOF MS: 0.301 to 0.751 min from Sample 2 (20512) of 20512_001.wiff Max. 33.6 cps.
39482.2813
+TOF MS: 2.533 to 2.568 min from 20512_001.wiff Agilent Max. 6.8e4 counts.
1.6e4
1.7e4
1.8e4
1.9e4
2.0e4 616.1739428.3
8000.0
9000.0
1.0e4
1.1e4
1.2e4
1.3e4
1.4e4
1.5e4
617.6 Da
39509.1211
37801 9219 612.0 613.0 614.0 615.0 616.0 617.0 618.0 619.0 620.0 621.0 622.0 623.0 624.00.0
1000.0
2000.0
3000.0
4000.0
5000.0
6000.0
7000.0
37801.937801.9219
39550.8086 m/z, amu
+TOF MS: 2.851 to 2.886 min from 20512_001.wiff Agilent Max. 1.8e5 counts.
1 3e5
1.4e5
1.5e5
1.6e5
1.7e5
1.8e5 620.21
6.0e4
7.0e4
8.0e4
9.0e4
1.0e5
1.1e5
1.2e5
1.3e5
618.0 619.0 620.0 621.0 622.0 623.0 624.0 625.0m/z, amu
0.0
1.0e4
2.0e4
3.0e4
4.0e4
5.0e4
6.0e4

+TOF MS: 2.556 to 2.592 min from 20510_001.wiff Agilent Max. 7.3e4 counts.
Mass reconstruction of +TOF MS: 0.251 to 1.051 min from 20510_001.wiff Max. 36.7 cps.
39788.4102
1.4e4
1.5e4
1.6e4
1.7e4
1.8e4
1.9e4
2.0e4
39788.4
616.17
39835.9297
39879.2695
39706.2383
39919.7500 6000 0
7000.0
8000.0
9000.0
1.0e4
1.1e4
1.2e4
1.3e4
632 8 Da?
39962.761739665.8711
613.0 614.0 615.0 616.0 617.0 618.0 619.0 620.0 621.0 622.0m/z, amu
0.0
1000.0
2000.0
3000.0
4000.0
5000.0
6000.0
+TOF MS: 1.459 to 1.566 min from 20510_001.wiff Agilent Max. 3.8e4 counts.
632.8 Da?
40003.2383
37155.5586
37219.9102
_ g
8000.00
8500.00
9000.00
9500.00
1.00e4
1.05e4
1.10e4
1.15e4
37155.6 629.17
3500 00
4000.00
4500.00
5000.00
5500.00
6000.00
6500.00
7000.00
7500.00
Inte
nsity
, cou
nts
625.0 626.0 627.0 628.0 629.0 630.0 631.0 632.0 633.0 634.0 635.0 636.0 637.0 638.0m/z, amu
0.00
500.00
1000.00
1500.00
2000.00
2500.00
3000.00
3500.00

siRNA and other experiments demonstrated that Rev-Erbappears to play a role in basal suppression of gluconeogenic genes
Even for WT Rev-Erb , hemin was i d f it t f NC Rrequired for recruitment of NCoR
and HDAC3
L. Yin, et al., Science (2007) 318, 1786-1789

Gluconeogenic genes and glucose production in liver cells are affected by the presence of heminby the presence of hemin
RevErb appears to function as a receptor for hemeThis study suggests that it may play a central role in coordinating
t b limetabolic processesOther work suggests RevErb plays a role in circadian rhythms– Clock proteins NPAS2 and PER2 have Heme as a prosthetic
group as wellgroup as wellMay make an interesting drug target for metabolic diseases
L. Yin, et al., Science (2007) 318, 1786-1789

Exploring high throughput mass spectrometry technologies to support assay development and MOA studiesassay development and MOA studies
– BioTrove RapidFire– ABI FlashQuant
Prosolia DESI (Desorption ElectroSpray Ionization)– Prosolia DESI (Desorption ElectroSpray Ionization)ETD (Electron Transfer Dissociation)
– Peptide sequencing – Phosphomapping– Intact protein sequencing
Interesting “one-off” analyses g y
Erin ChaneyJohn Hall
UCSF– Holly Ingrham
Mary MoyerGreg WaittCraig WagnerW d Whit
– Irina Krylova
Penn Mit h LWendy White
Scott DickersonKevin Madauss
– Mitch Lazar– Lei Yin
Kevin MadaussLisa ShewchukShawn WilliamsRobert Xu
Ken PearceBruce WiselyEddi W dEddie Wood
David Uehling
For Research Use Only. Not for use in diagnostic procedures.