6.Applications of Accelerator Mass Spectrometry (AMS… 06zdl .pdf · Applications of Accelerator...
54
Donglu Zhang Applications of Accelerator Mass Spectrometry (AMS) in Clinical Studies Donglu Zhang Drug Metabolism and Pharmacokinetics Genentech, One DNA Way South San Francisco, CA 94080 At 2015 Nanjing International DMPK Symposium At 2015 Nanjing International DMPK Symposium June 26, 2015 June 26, 2015
Transcript of 6.Applications of Accelerator Mass Spectrometry (AMS… 06zdl .pdf · Applications of Accelerator...

Donglu Zhang
Applications of Accelerator Mass
Spectrometry (AMS) in Clinical Studies
Donglu ZhangDrug Metabolism and PharmacokineticsGenentech, One DNA WaySouth San Francisco, CA 94080
At 2015 Nanjing International DMPK SymposiumAt 2015 Nanjing International DMPK SymposiumJune 26, 2015June 26, 2015
Outline
Introduction to AMS Basic AMS Concepts, AMS validation
Drivers for AMS
Microtracer, microdosing vs normal dosing
AMS study logistics
Potential DMPK-related AMS Applications- Case Potential DMPK-related AMS Applications- Case
Studies Phase 0 and 1 studies and animal studies for MIST and
Early human PK
Absorption/Bioavailability: Saxagliptin
Mass Balance/Bioavailability: Vismodegib
Metabolic profiles/Mass Balance: Ixabepilone
Limitations and future perspectives

Contributors
Sophia Xu
Nilgun Comezoglu
Van Ly
Lisa Christopher
Griff Humphreys
Cyrus Khojasteh
Harvey Wong
Shuguang Ma
Qin Yue
Cornelis E.C.A. Hop
BMS Genentech
Griff Humphreys
Mark Arnold
Vitalea
Accium
Xceleron

Accelerator Mass Spectrometry (AMS)
Accelerator mass spectrometry (AMS) is a technique for measuringlong-lived radionuclide that occur naturally in environment(-decay half life of 14C is 5730 year, 2.3x10⁻¹⁰ DPM/14C).
AMS uses a particle accelerator in conjunction with ion sources, largemagnets, and detectors to separate out interferences and countsingle rare isotope atoms in the presence of a large number of stableatoms (14C:12C ratio = 10-12).
AMS technique is used for a wide variety of radiocarbon dating and AMS technique is used for a wide variety of radiocarbon dating andtracing applications in the geological and planetary sciences,archaeology, and biomedicine.
AMS differs from other forms of mass spectrometry in that itaccelerates ions to very high kinetic energies before mass analysis.AMS can accurately analyze elemental and isotopic compositionswith high sensitivity.

AMS Applications in Medical Research
AMS as an analytical tool
Very sensitive and accurate technique for measuring 14C, 13C and12C etc.
Traditionally used for radiocarbon dating, introduced toPharmaceticals in the last decade.
Quantification based on measurement of 14C/ C (defined as fMC,fraction modern carbon) ratio in a sample.
It is an atom counter detector and typically linear over 4 orders ofmagnitude.
5
It is an atom counter detector and typically linear over 4 orders ofmagnitude.
LC-AMS can typically achieve LLOQ of 10 amol of 14C (dependingon specific activity, sample loaded onto HPLC column, molecularweight, etc.).
Clinical studies that can utilize AMS
Phase 0 and phase I studies
Absolute bioavailability
Metabolic profiling
Mass balance
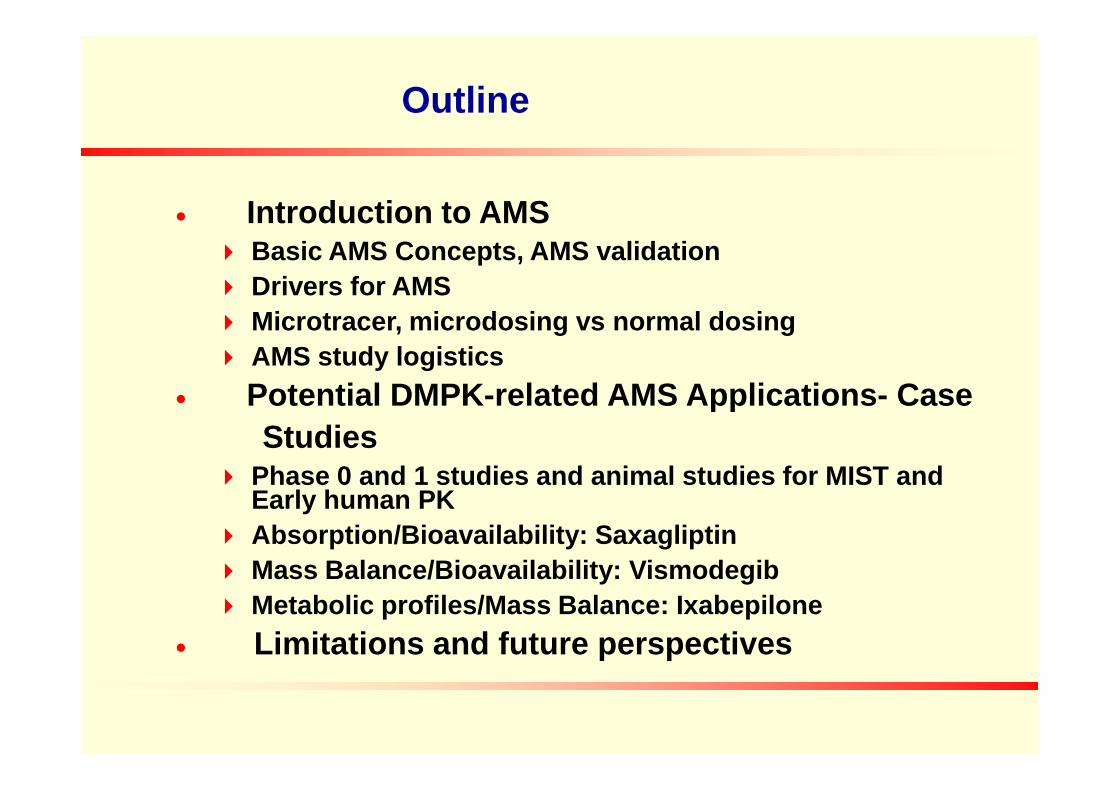
AMS-Scheme
3. Filtermolecule destruction
3. Filtermolecule destruction
2. Filtermass analysis
(low-energy end)
2. Filtermass analysis
(low-energy end)
massspectrometer
charge exchange
4. Filtermass analysis
(high-energy end)
4. Filtermass analysis
(high-energy end)
massspectrometer
(Stripping process)
3. Filtermolecule destruction
3. Filtermolecule destruction
2. Filtermass analysis
(low-energy end)
2. Filtermass analysis
(low-energy end)
massspectrometer
charge exchange
4. Filtermass analysis
(high-energy end)
4. Filtermass analysis
(high-energy end)
massspectrometer
(Stripping process)
veca
rbo
nio
nb
ea
m
-ve ions converted to +ve ions
Pre-accelerated and passedthrough a spherical
electrostatic analyzer
Again accelerated usingelectrostatic quadrapole
triplet and analyzing magnet
12C4+ and 13C4+ weremeasured in faradays cup
5. Filterparticle identification
5. Filterparticle identification
electrostaticdeflector
1.Filternegative ion formation
1.Filternegative ion formation
13C / 12C14C / 12C
13CH
-
12CH2-
14C-
argonstrippergasnegativeions positiveions
14C +
13C +
12C +
H+
10-9
1
1
:
:
7Li2-
12C
13C
5. Filterparticle identification
5. Filterparticle identification
electrostaticdeflector
1.Filternegative ion formation
1.Filternegative ion formation
13C / 12C14C / 12C
13CH
-
12CH2-
14C-
argonstrippergasnegativeions positiveions
14C +
13C +
12C +
H+
10-9
1
1
:
:
7Li2-
12C
13C
-ve
carb
on
ion
be
am
Ion source: Multi CathodeSource of –ve ions with
Cs sputtering
measured in faradays cup
14C4+ measured usingelectrostatic deflector
Courtesy of Vitalea Sciences
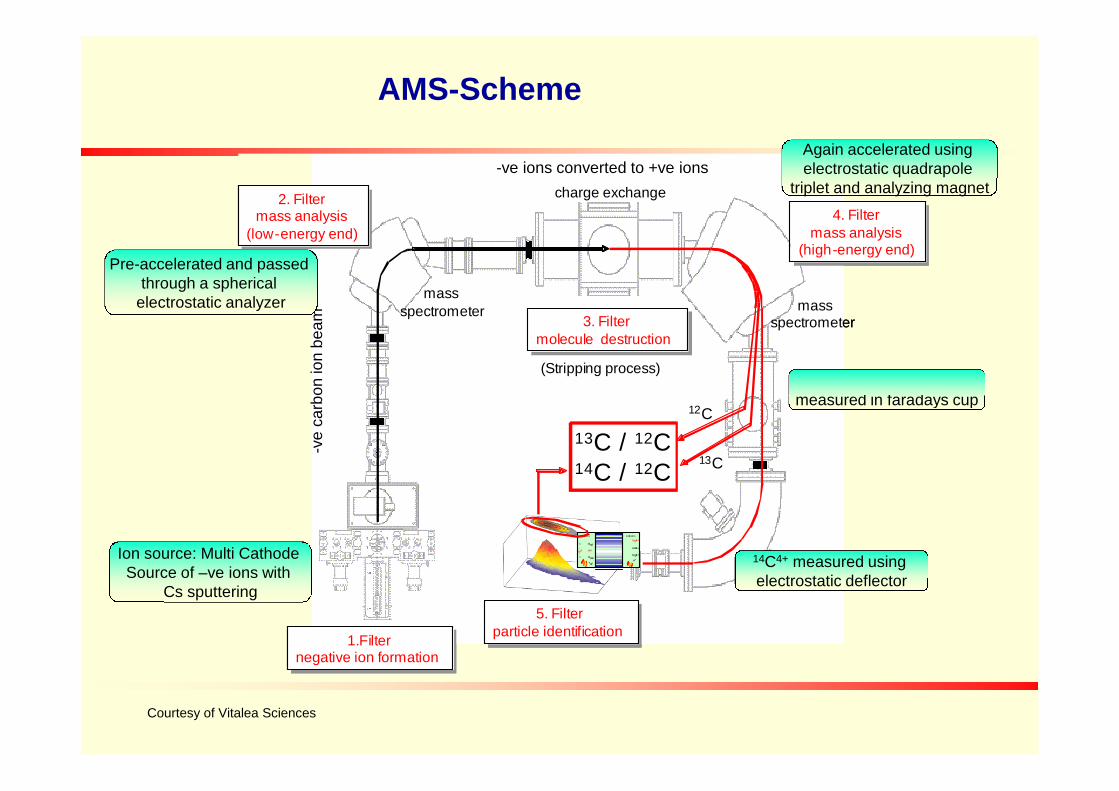
Accelerator mass spectrometer at Lawrence Livermore National Laboratory
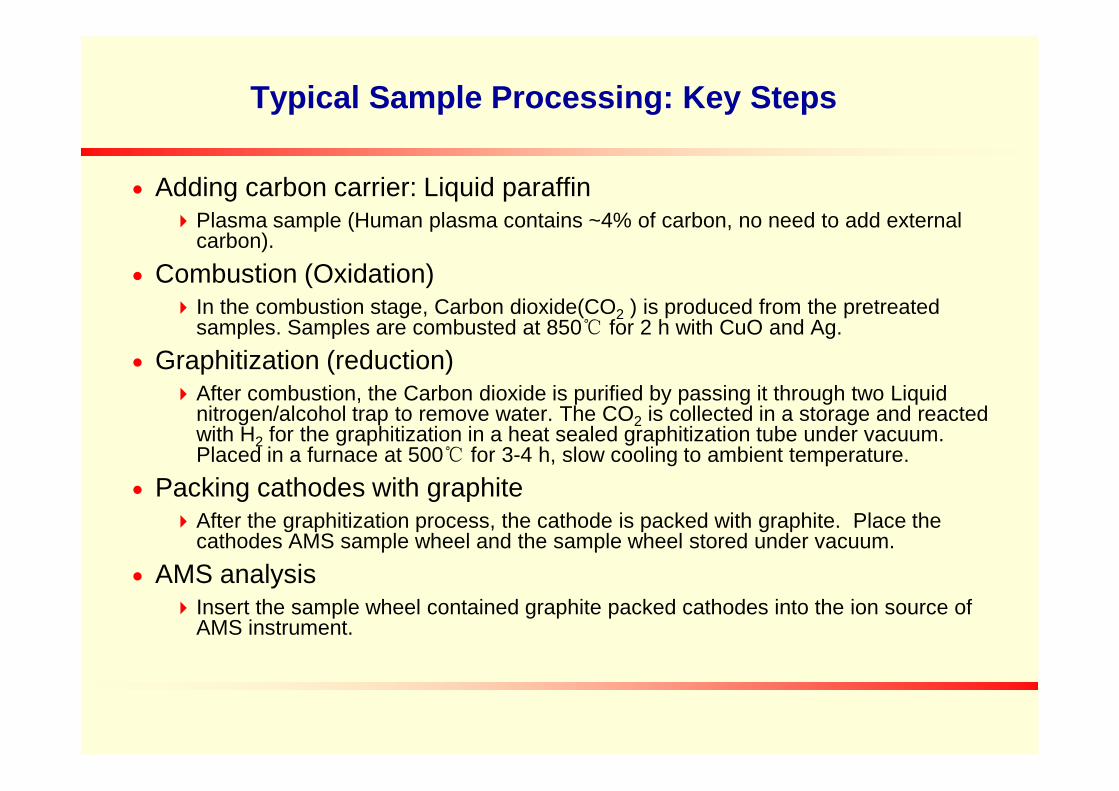
Typical Sample Processing: Key Steps
Adding carbon carrier: Liquid paraffinPlasma sample (Human plasma contains ~4% of carbon, no need to add external
carbon).
Combustion (Oxidation) In the combustion stage, Carbon dioxide(CO2 ) is produced from the pretreated
samples. Samples are combusted at 850℃ for 2 h with CuO and Ag.
Graphitization (reduction)After combustion, the Carbon dioxide is purified by passing it through two LiquidAfter combustion, the Carbon dioxide is purified by passing it through two Liquid
nitrogen/alcohol trap to remove water. The CO2 is collected in a storage and reactedwith H2 for the graphitization in a heat sealed graphitization tube under vacuum.Placed in a furnace at 500℃ for 3-4 h, slow cooling to ambient temperature.
Packing cathodes with graphiteAfter the graphitization process, the cathode is packed with graphite. Place the
cathodes AMS sample wheel and the sample wheel stored under vacuum.
AMS analysis Insert the sample wheel contained graphite packed cathodes into the ion source of
AMS instrument.

-decay of 14C atom Detected by LSC as photonsof light in photomultiplier tube
LSC
0.012% of 14C decays per annum; 1 billion 14C atoms ≡ 1 dpm
AMS vs LSC Detection
AMS
Atoms separated by differences 12C,13C and 14C atomsindividually countedin mass, charge and energy
Sample containing 12C 13C and 14C atoms
1000 14C atoms required for valid measurement
Source: GNE
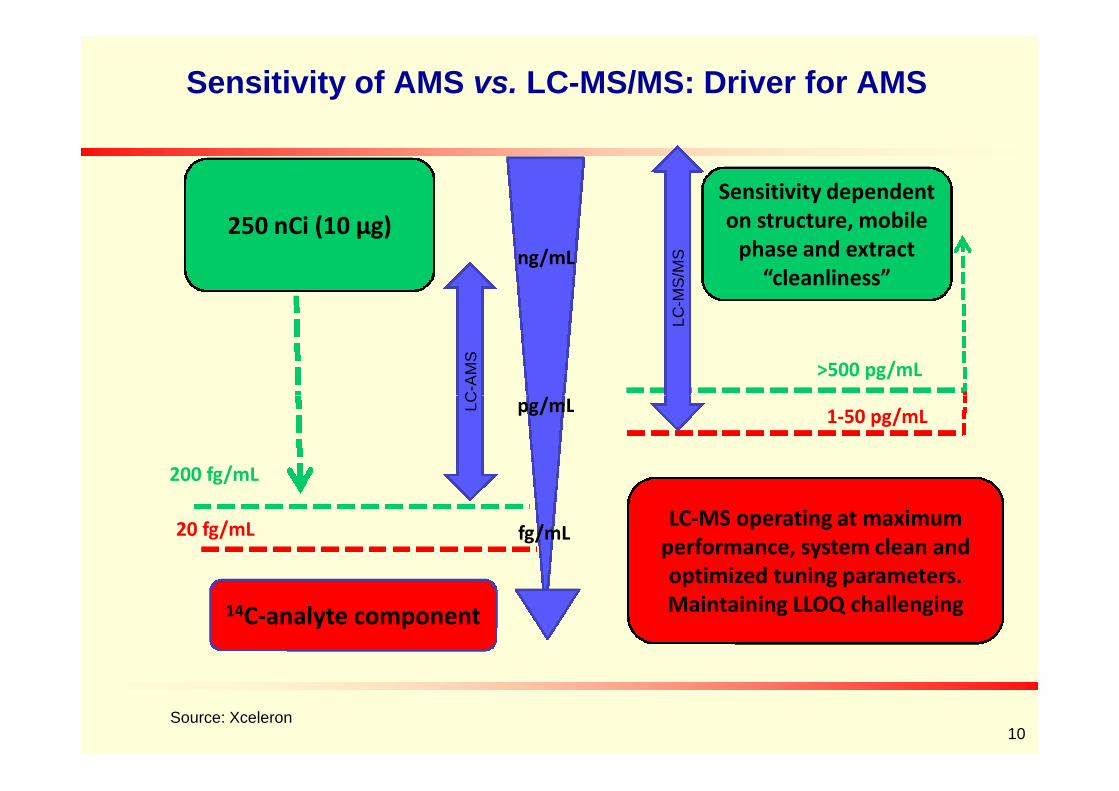
Sensitivity of AMS vs. LC-MS/MS: Driver for AMS
250 nCi (10 µg)
LC
-AM
S
Sensitivity dependenton structure, mobile
phase and extract“cleanliness”
pg/mL
ng/mL
>500 pg/mL
LC
-MS
/MS
10Source: Xceleron
14C-analyte component
20 fg/mL
200 fg/mLL
C
fg/mL
pg/mL1-50 pg/mL
LC-MS operating at maximumperformance, system clean andoptimized tuning parameters.Maintaining LLOQ challenging
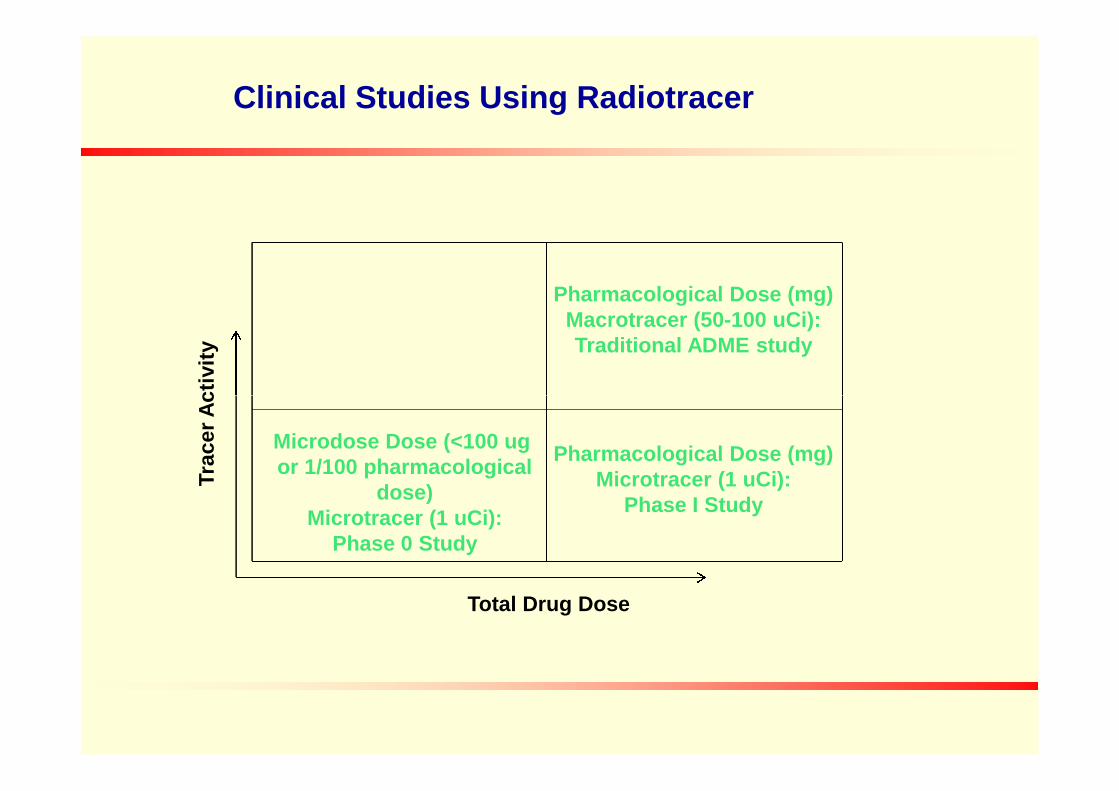
Pharmacological Dose (mg)Macrotracer (50-100 uCi):Traditional ADME study
Tra
ce
rA
cti
vit
y
Clinical Studies Using Radiotracer
Pharmacological Dose (mg)Microtracer (1 uCi):
Phase I Study
Microdose Dose (<100 ugor 1/100 pharmacological
dose)Microtracer (1 uCi):
Phase 0 Study
Total Drug Dose
Tra
ce
rA
cti
vit
y

No Toxicity Concern of IV Microdose

Single dose 1000 x human microdose in rats with 8 days observation
IV or intended human route of administration (n=10)
biochemistry on days 2 and 8
animals sacrificed on day 8
gross necropsy, limited histopathology
Abbreviatd genotoxicity (optional)
Comparative in vitro metabolism; microsomes or hepatocytes
Minimal Tox Package for Phase 0 Microdose
Comparative in vitro metabolism; microsomes or hepatocytes
in vitro hERG assay
Food and Drug Administration, US Department of Health and Human Services, Guidance forIndustry Investigators and Reviewers. Exploratory IND Studies. January 2006.
EMEA, Position Paper on Non-clinical Safety Studies to Support Clinical Trials with a SingleMicrodose. Position paper CPMP/SWP/2599, 23 June 2004.
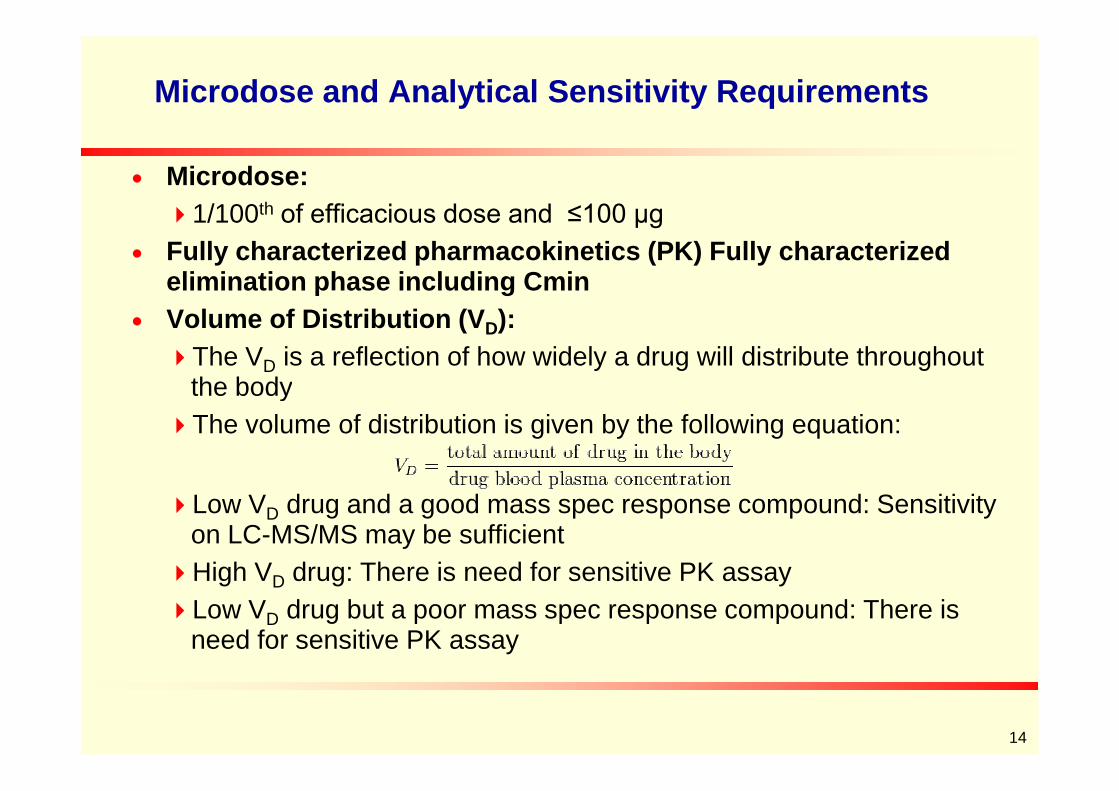
Microdose and Analytical Sensitivity Requirements
Microdose:
1/100th of efficacious dose and ≤100 µg
Fully characterized pharmacokinetics (PK) Fully characterizedelimination phase including Cmin
Volume of Distribution (VD):
The VD is a reflection of how widely a drug will distribute throughoutthe body
14
the body
The volume of distribution is given by the following equation:
Low VD drug and a good mass spec response compound: Sensitivityon LC-MS/MS may be sufficient
High VD drug: There is need for sensitive PK assay
Low VD drug but a poor mass spec response compound: There isneed for sensitive PK assay
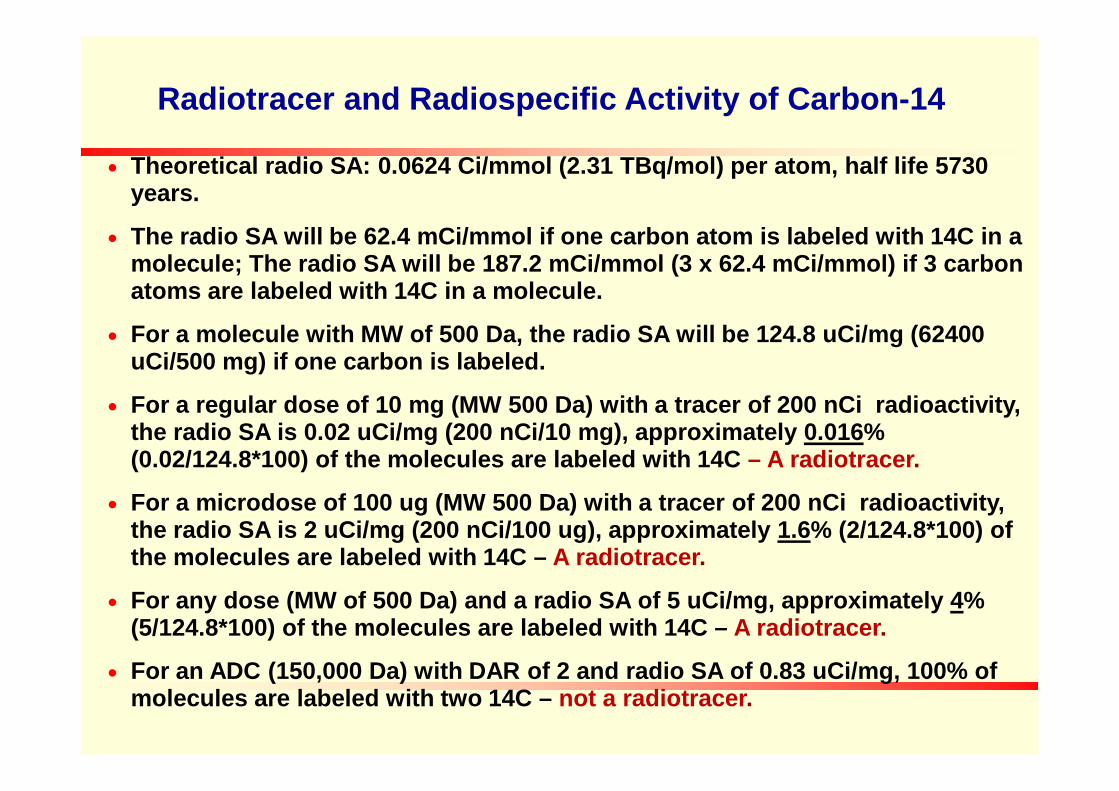
Radiotracer and Radiospecific Activity of Carbon-14
Theoretical radio SA: 0.0624 Ci/mmol (2.31 TBq/mol) per atom, half life 5730years.
The radio SA will be 62.4 mCi/mmol if one carbon atom is labeled with 14C in amolecule; The radio SA will be 187.2 mCi/mmol (3 x 62.4 mCi/mmol) if 3 carbonatoms are labeled with 14C in a molecule.
For a molecule with MW of 500 Da, the radio SA will be 124.8 uCi/mg (62400uCi/500 mg) if one carbon is labeled.
For a regular dose of 10 mg (MW 500 Da) with a tracer of 200 nCi radioactivity, For a regular dose of 10 mg (MW 500 Da) with a tracer of 200 nCi radioactivity,the radio SA is 0.02 uCi/mg (200 nCi/10 mg), approximately 0.016%(0.02/124.8*100) of the molecules are labeled with 14C – A radiotracer.
For a microdose of 100 ug (MW 500 Da) with a tracer of 200 nCi radioactivity,the radio SA is 2 uCi/mg (200 nCi/100 ug), approximately 1.6% (2/124.8*100) ofthe molecules are labeled with 14C – A radiotracer.
For any dose (MW of 500 Da) and a radio SA of 5 uCi/mg, approximately 4%(5/124.8*100) of the molecules are labeled with 14C – A radiotracer.
For an ADC (150,000 Da) with DAR of 2 and radio SA of 0.83 uCi/mg, 100% ofmolecules are labeled with two 14C – not a radiotracer.
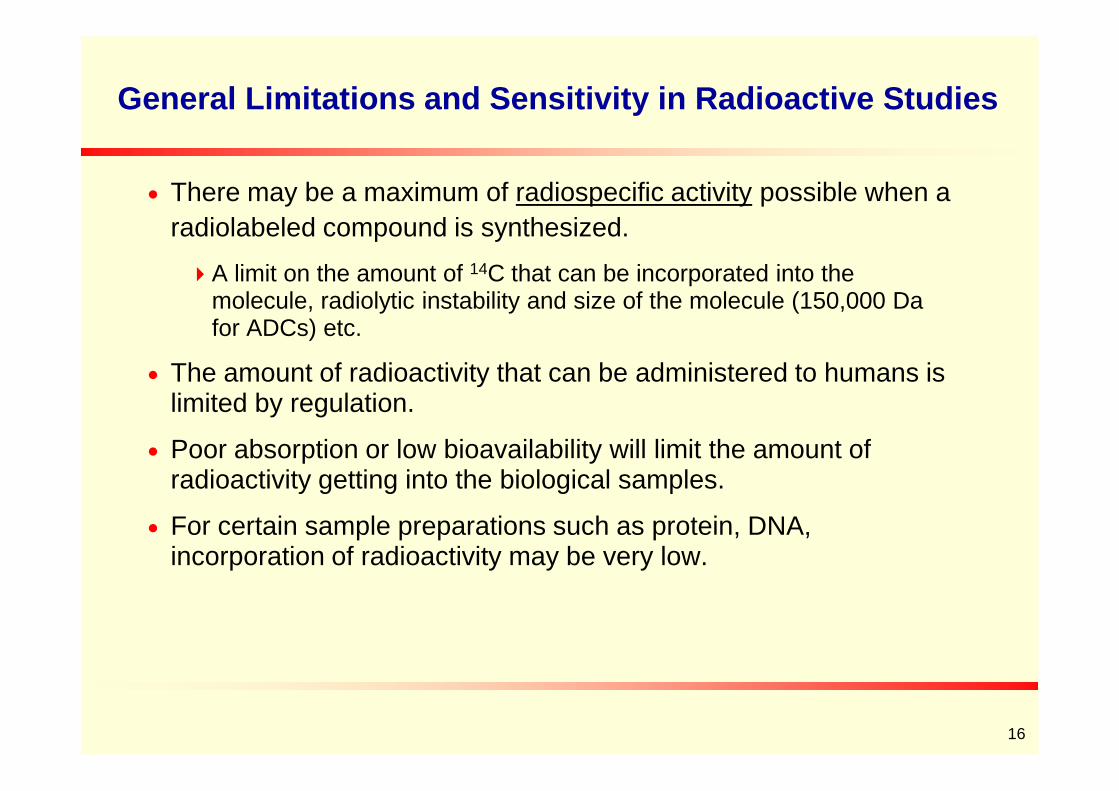
General Limitations and Sensitivity in Radioactive Studies
There may be a maximum of radiospecific activity possible when a
radiolabeled compound is synthesized.
A limit on the amount of 14C that can be incorporated into themolecule, radiolytic instability and size of the molecule (150,000 Dafor ADCs) etc.
The amount of radioactivity that can be administered to humans islimited by regulation.
16
limited by regulation.
Poor absorption or low bioavailability will limit the amount ofradioactivity getting into the biological samples.
For certain sample preparations such as protein, DNA,incorporation of radioactivity may be very low.
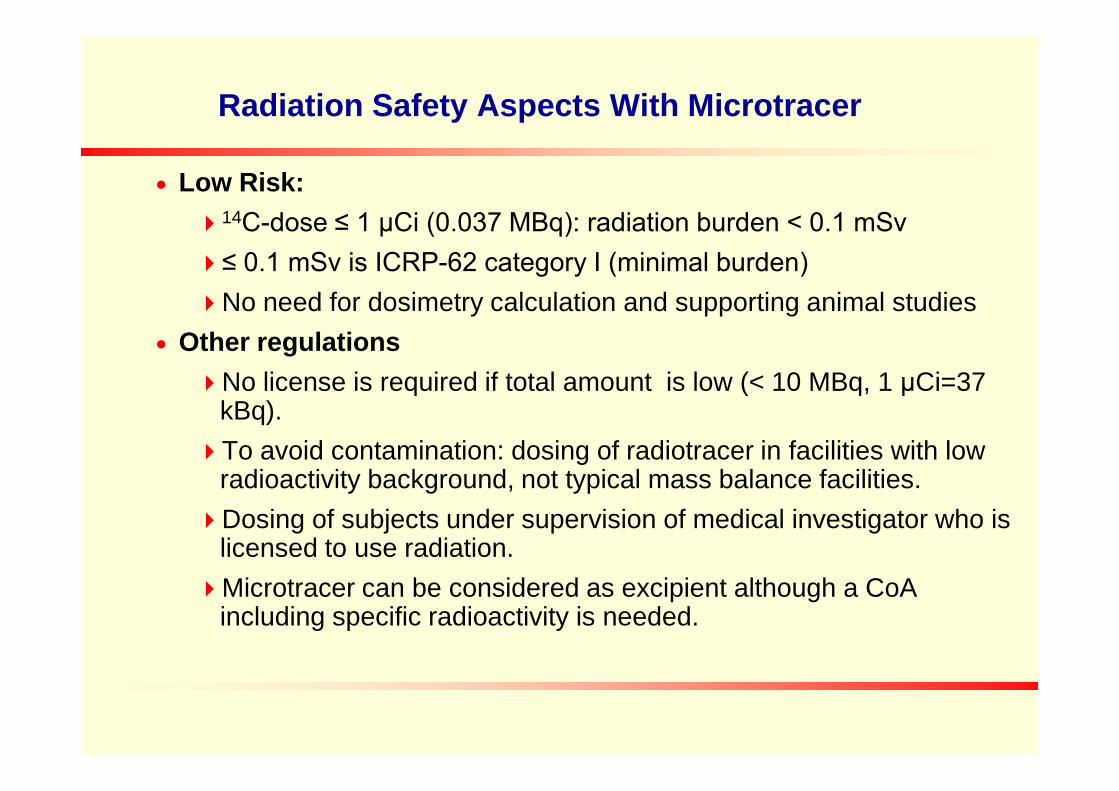
Low Risk:
14C-dose ≤ 1 μCi (0.037 MBq): radiation burden < 0.1 mSv
≤ 0.1 mSv is ICRP-62 category I (minimal burden)
No need for dosimetry calculation and supporting animal studies
Other regulations
No license is required if total amount is low (< 10 MBq, 1 μCi=37
Radiation Safety Aspects With Microtracer
No license is required if total amount is low (< 10 MBq, 1 μCi=37kBq).
To avoid contamination: dosing of radiotracer in facilities with lowradioactivity background, not typical mass balance facilities.
Dosing of subjects under supervision of medical investigator who islicensed to use radiation.
Microtracer can be considered as excipient although a CoAincluding specific radioactivity is needed.

Combined Microdose with Radiotracer to Shorten the Timeline
Source: PRA
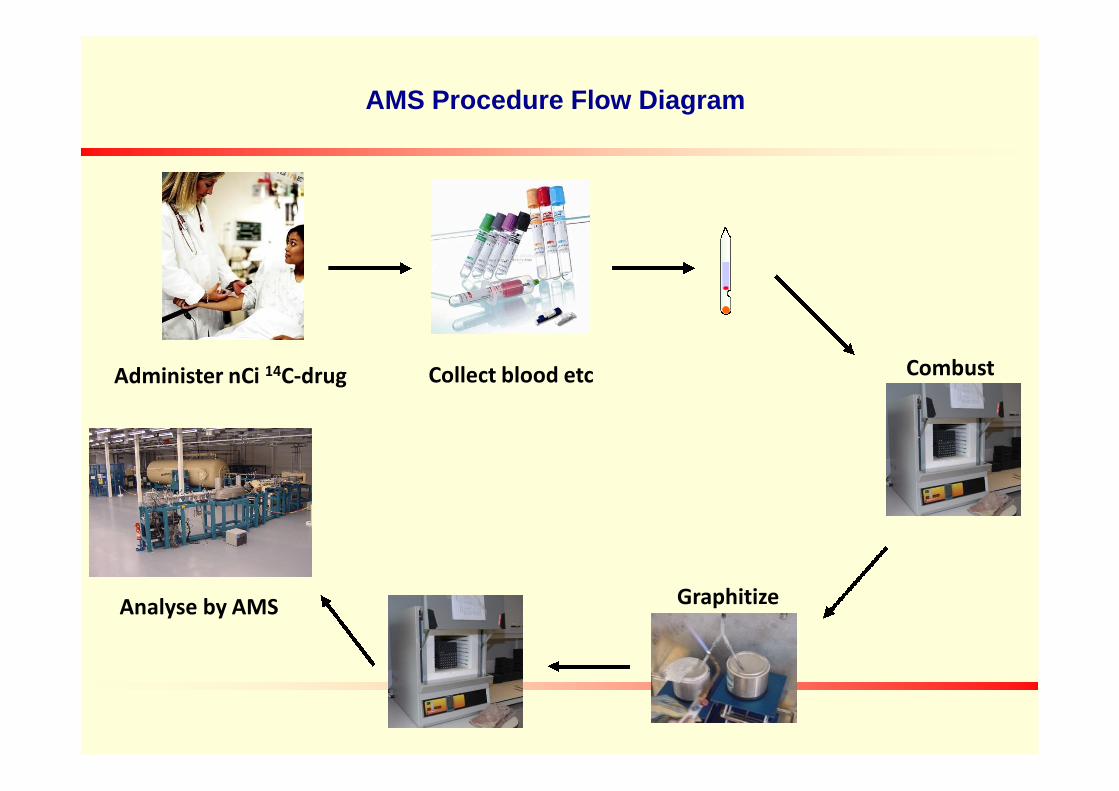
AMS Procedure Flow Diagram
Administer nCi 14C-drug Collect blood etc Combust
Analyse by AMS Graphitize
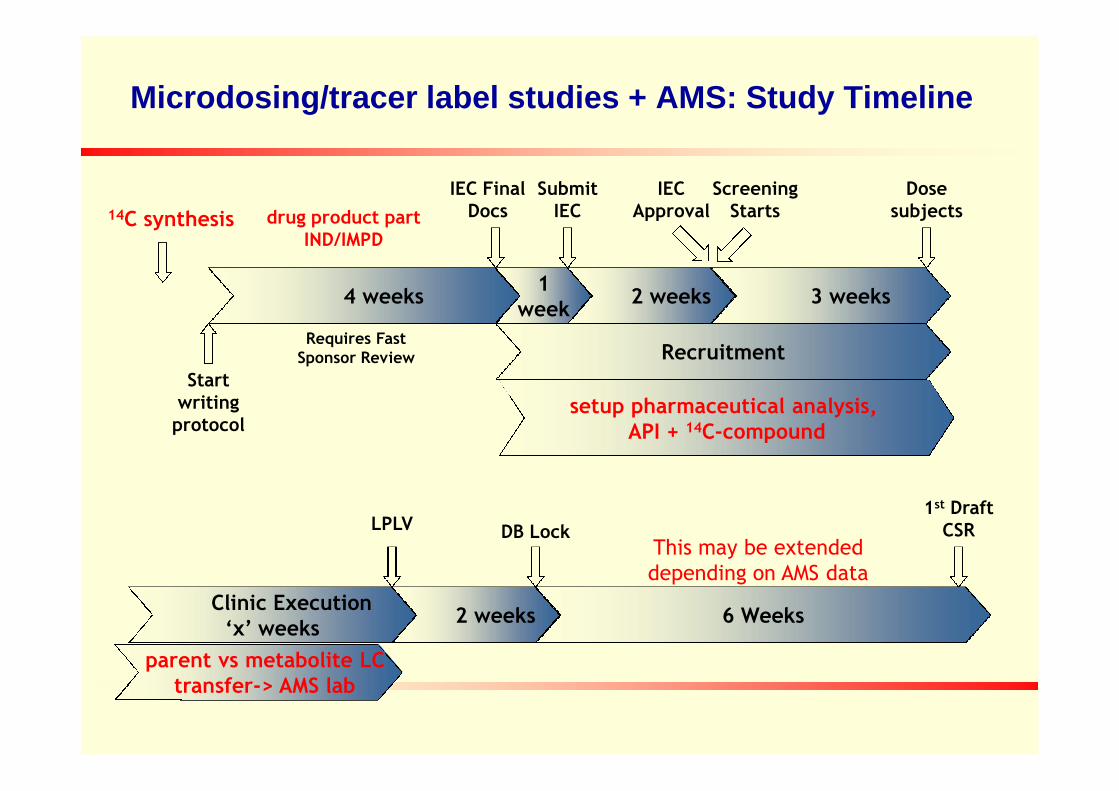
Microdosing/tracer label studies + AMS: Study Timeline
1week
Dosesubjects
IEC FinalDocs
SubmitIEC
IECApproval
ScreeningStarts
3 weeks2 weeks
Recruitment
4 weeks
Startwriting
Requires FastSponsor Review
drug product partIND/IMPD
setup pharmaceutical analysis,
14C synthesis
Clinic Execution‘x’ weeks
2 weeks
LPLV DB Lock
1st DraftCSR
6 Weeks
writingprotocol
This may be extendeddepending on AMS data
setup pharmaceutical analysis,API + 14C-compound
parent vs metabolite LCtransfer-> AMS lab

Microdosing and AMS: Some Caveats
Samples converted to graphite before AMS
AMS only gives total 14C content, will not distinguish co-eluting metabolites bymass.
No metabolite structural information.
Off-line HPLC separation of parent compound and metabolites: critical.
Excess of cold parent drug spiked in samples as internal standard forextraction recovery (based on UV-peak).extraction recovery (based on UV-peak).
HPLC separation by fractionation
Need certainty on full separation of parent from metabolites
Which may affect number of assays and timelines of AMS work
Requires communication between AMS provider and DMPK/bioanalysis group.
Not all AMS labs have a MS detector to identify drug-related componentsalthough HPLC methods can be derived from nonclinical metabolism studies.

Drug Discovery and DevelopmentMicrodose/tracer and Developing MIST Strategy
In Vitro and In VivoMetabolism Studies
In vitro metabolite profiles-species comparison
PrePre--DevelopmentDevelopment Phase 0Phase 0 Phase 1Phase 1
Short-term Tox Studies
IND-Enabling Studies
Plasma samples frommultiple dosed animals
FIH Studies (SAD/MAD)
Plasma samples from singleand multiple dosed subjects
Microtracer in SAD or MAD
Major human in vitro metabolites
(microsomes/hepatocytes)
Idea (qualitative) of in vivocoverage of major human in vitrometabolites from preclinicalstudies
multiple dosed animals
Metabolite profiles aftermultiple doses - forcomparison with single dosestudy, other species, and invitro met profile
Animal ADME
Microdose/microtracer inhumans
Microtracer in SAD or MADsubjects
Compound SelectedFor Development
IND Filing
Examples of Microdose
Data from two trials: EUMAPP and CREAM and other literature data.
21 out of 26 drugs displayed linear pharmacokinetics (within 2x exposureextrapolated from microdose to pharmacological doses) includingfenofenadine, a P-gp and OATP substrate.
Where there is no-linearity with PO, IV scaled well.
Examples of not scalable: Propafenone, dose-dependent 1st pass metabolismby CYP2D6; warfarin, target-mediated disposition at low dose.by CYP2D6; warfarin, target-mediated disposition at low dose.
DDI at microdoses: caffeine (CYP1A2), tolbutamide (CYP2C9), fenofenadine(p-gp), midazolam (CYP3A4) by pharmacological doses of fluvoxamine andketoconazole.
Not widely used the industry because 1) cost effective only if poor PK at amicrodose, 2) the saved time will delay development for a compound withgood microdose PK
Lippin G (2010) Bioanalysis, 2, 509Liu et al (2011) Drug Metab Dispos 39, 1840.
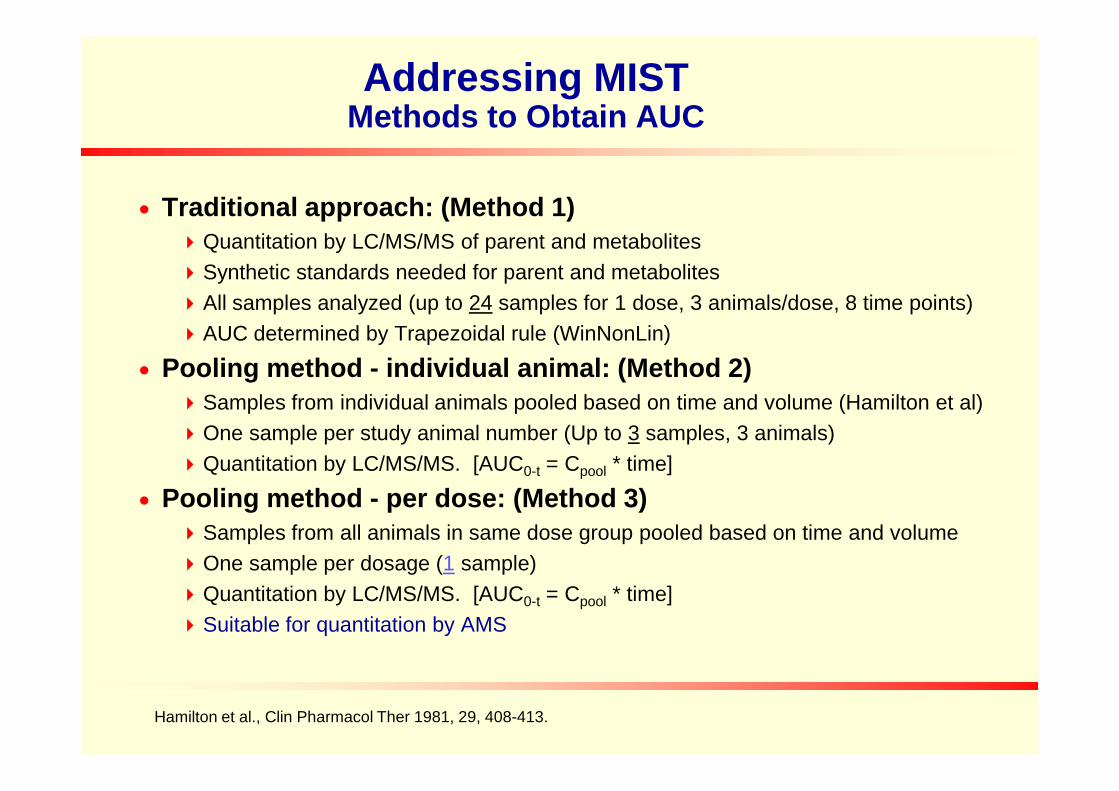
Addressing MISTMethods to Obtain AUC
Traditional approach: (Method 1)Quantitation by LC/MS/MS of parent and metabolites
Synthetic standards needed for parent and metabolites
All samples analyzed (up to 24 samples for 1 dose, 3 animals/dose, 8 time points)
AUC determined by Trapezoidal rule (WinNonLin)
Pooling method - individual animal: (Method 2)Samples from individual animals pooled based on time and volume (Hamilton et al)Samples from individual animals pooled based on time and volume (Hamilton et al)
One sample per study animal number (Up to 3 samples, 3 animals)
Quantitation by LC/MS/MS. [AUC0-t = Cpool * time]
Pooling method - per dose: (Method 3)Samples from all animals in same dose group pooled based on time and volume
One sample per dosage (1 sample)
Quantitation by LC/MS/MS. [AUC0-t = Cpool * time]
Suitable for quantitation by AMS
Hamilton et al., Clin Pharmacol Ther 1981, 29, 408-413.
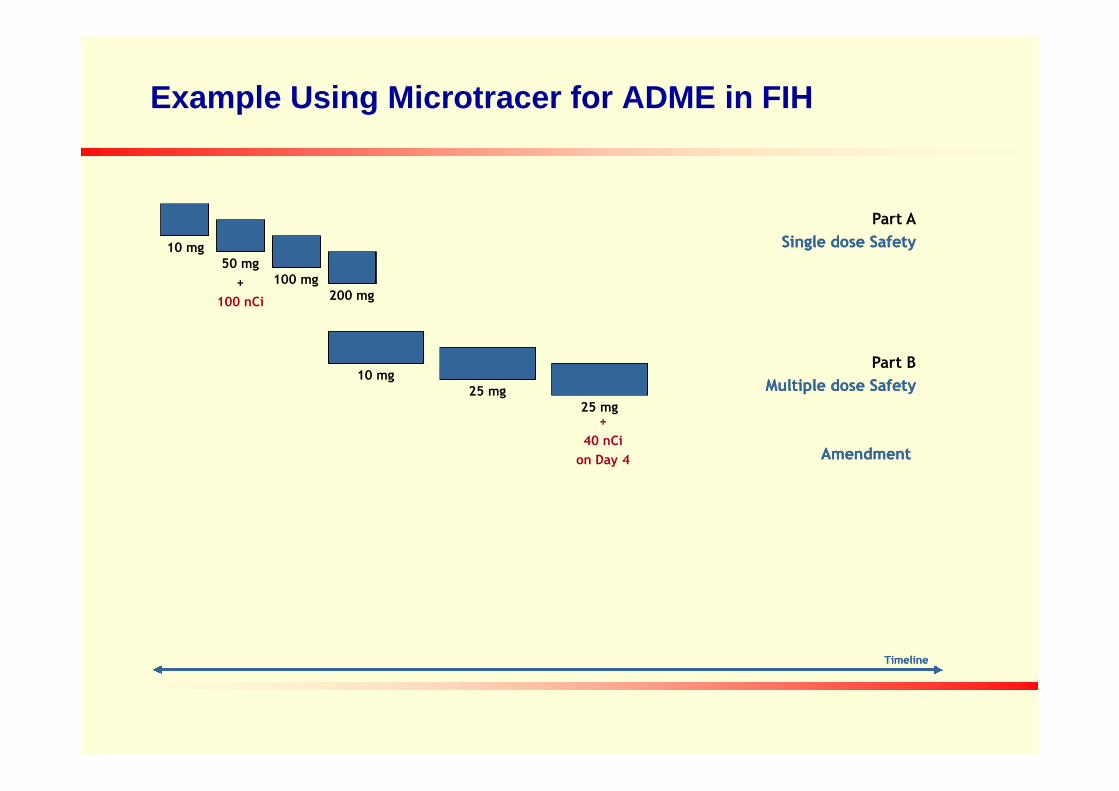
Example Using Microtracer for ADME in FIH
10 mg50 mg
+
100 nCi
100 mg200 mg
10 mg25 mg
Part B
Multiple dose SafetyMultiple dose Safety
Part A
Single dose SafetySingle dose Safety
25 mg25 mg
TimelineTimeline
AmendmentAmendment
+
40 nCi
on Day 4

Introduction to Absolute Bioavailability Study of Saxagliptin
Onglyza™ (saxagliptin, BMS-477118) is an oral DPP4 inhibitor, approved for
the treatment for Type 2 diabetes. A clinical absolute BA study was required to
support regulatory submissions.
Prior experience with LC-MS/MS method development indicated the potential
for poor extraction recovery at concentrations below 0.5 ng/mL. Based on
human ADME data after oral administration, several metabolites were alsohuman ADME data after oral administration, several metabolites were also
identified in plasma.
A pilot microtracer study of [14C]saxagliptin in dogs was initiated prior to the
human study to provide samples for method development and to assess AMS
methodology. The method was successfully validated and was applied to the
quantification of [14C]saxagliptin in human plasma from an absolute BA study.
Arnold ME, LaCreta F, Bioanalysis 2012, 4:1831-1834.
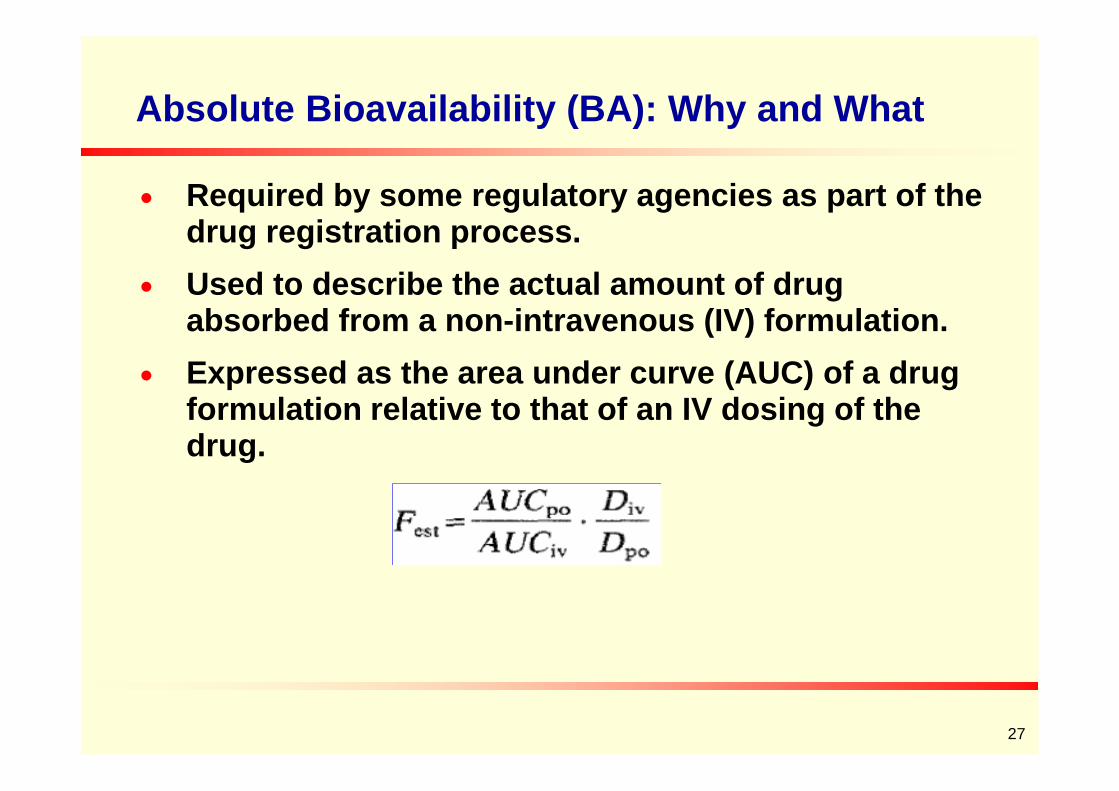
Absolute Bioavailability (BA): Why and What
Required by some regulatory agencies as part of thedrug registration process.
Used to describe the actual amount of drugabsorbed from a non-intravenous (IV) formulation.
Expressed as the area under curve (AUC) of a drugformulation relative to that of an IV dosing of theformulation relative to that of an IV dosing of thedrug.
27
Traditional Approach of Absolute BA Studies
Two-way cross-over study design with a washout period
Need to develop intravenous (IV) formulation which mayhave potential drug solubility issue
Mandatory pre-clinical toxicity testing to ensure adequatesafety
Day-to-day variability in pharmacokinetics (PK) due toseparate administrations
Costly and time-consuming
Usually employs traditional bioanalytical techniques (LC-MS/MS)
28

Advantages of Using Microdose for Absolute BA Studies
The most expedient path to generate human BA data is toco-administer the oral therapeutic dose and an IV [14C]-microdose of drugOral: LC-MS/MS
IV: Accelerator Mass Spectrometer (AMS)
Single period, IV microdose (< 100 µg) at Tmax of oral doseSingle period, IV microdose (< 100 µg) at Tmax of oral dose
No need for cross-over dosing
No day-to-day variation
Reduced effort in IV formulation
No need for toxicology studies
Saves costs and resources of largerclinical study
29
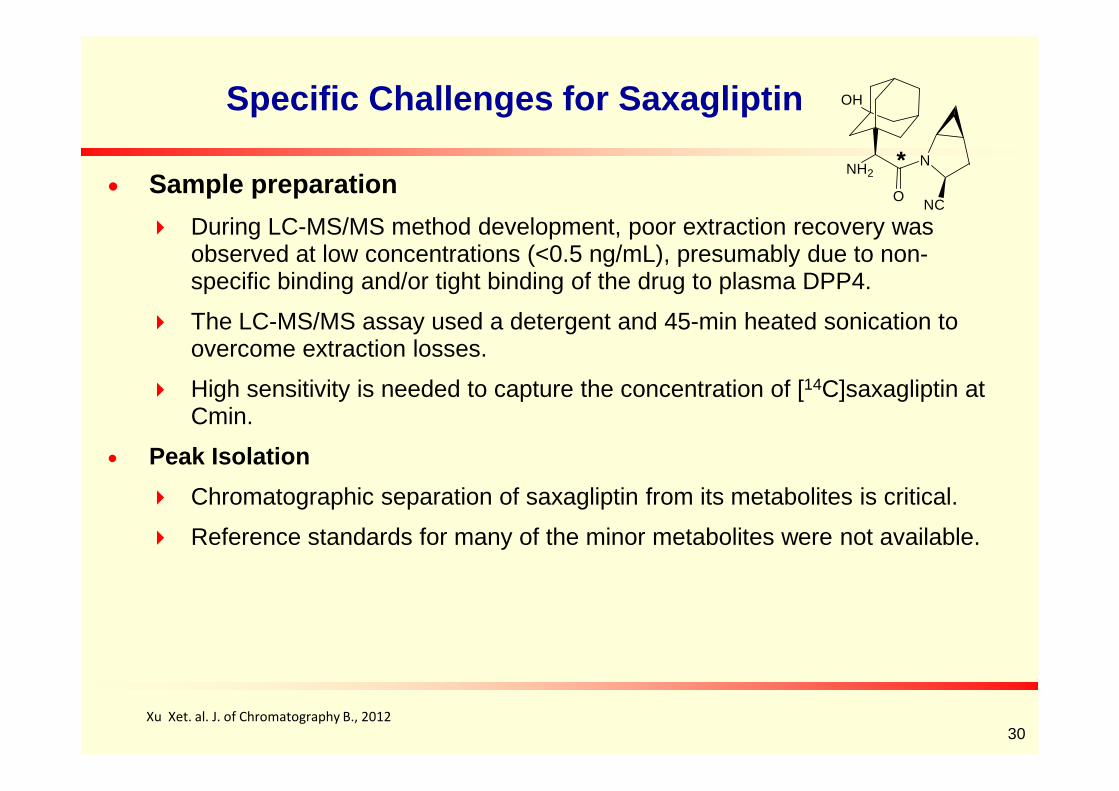
Specific Challenges for Saxagliptin
Sample preparation
During LC-MS/MS method development, poor extraction recovery wasobserved at low concentrations (<0.5 ng/mL), presumably due to non-specific binding and/or tight binding of the drug to plasma DPP4.
The LC-MS/MS assay used a detergent and 45-min heated sonication toovercome extraction losses.
High sensitivity is needed to capture the concentration of [14C]saxagliptin at
NH2N
O
OH
NC
*
High sensitivity is needed to capture the concentration of [ C]saxagliptin atCmin.
Peak Isolation
Chromatographic separation of saxagliptin from its metabolites is critical.
Reference standards for many of the minor metabolites were not available.
Xu Xet. al. J. of Chromatography B., 201230
[14C]Saxagliptin Oral Microtracer in Dogs-Study Design
3 male beagle dogs, oral administration of [14C]saxagliptin
Share all human metabolites
Dose selection - 0.071 mg/kg (3.4 nCi/kg)
14C dose selected to mimic IV dose (~200 nCi) in humans
The mass dose chosen to mimic the 5 mg human oral dose
Sample Collection
31
Sample Collection
Collect samples from 3 dogs over 24 h post-dose and pool by time points
Split and submit portions to 2 AMS laboratories and an LC-MS/MS lab
Study Objectives
Determine the LLOQ (sensitivity) of the 14C AMS assay
Compare values obtained between labs and techniques (AMS vs. LC-MS/MS)
Xu X, et al., Bianalysis 2012, 6, 497-504.
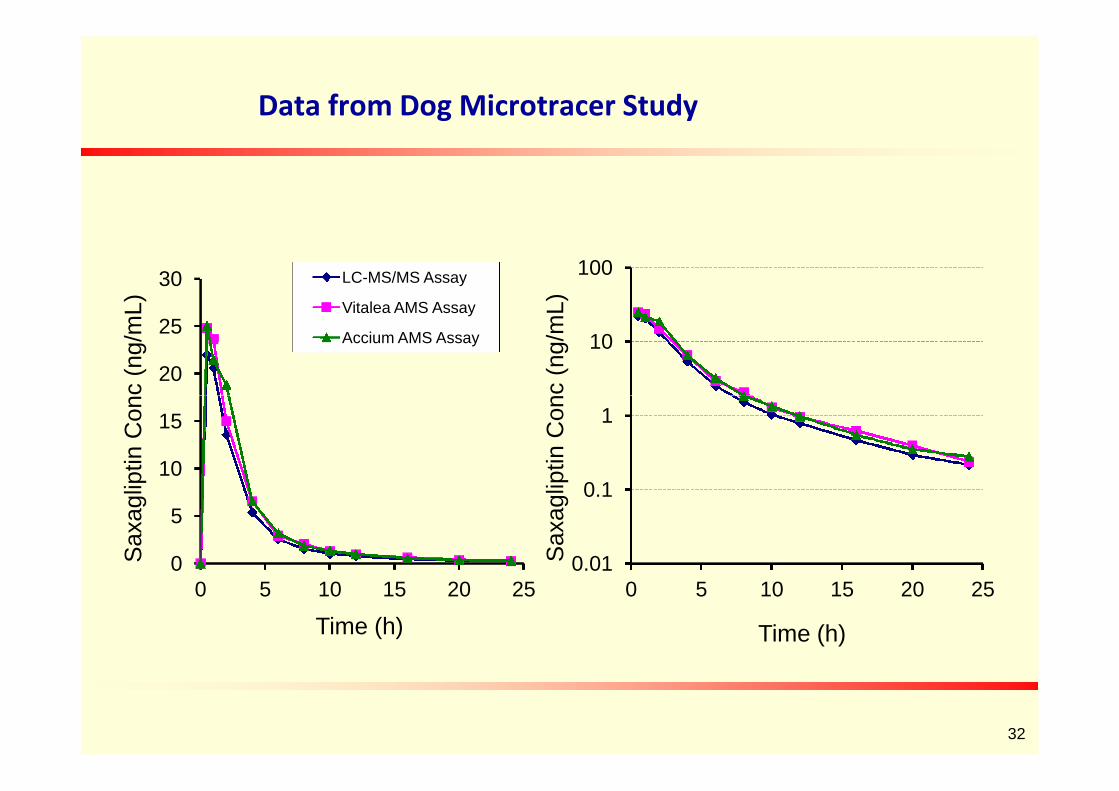
Data from Dog Microtracer Study
10
100
Saxa
glip
tinC
onc
(ng/m
L)
20
25
30
Saxa
glip
tinC
onc
(ng/m
L)
LC-MS/MS Assay
Vitalea AMS Assay
Accium AMS Assay
0.01
0.1
1
0 5 10 15 20 25
Saxa
glip
tinC
onc
(ng/m
L)
Time (h)
0
5
10
15
0 5 10 15 20 25
Saxa
glip
tinC
onc
(ng/m
L)
Time (h)
32
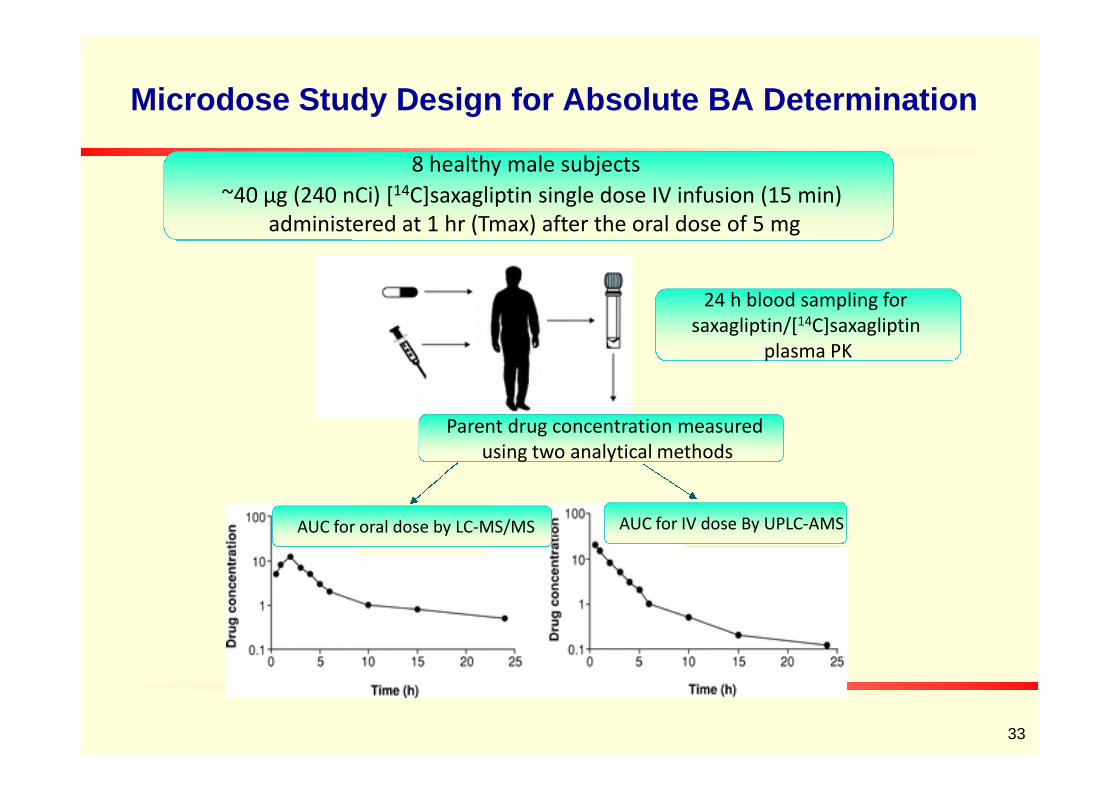
Microdose Study Design for Absolute BA Determination
24 h blood sampling forsaxagliptin/[14C]saxagliptin
plasma PK
8 healthy male subjects
~40 µg (240 nCi) [14C]saxagliptin single dose IV infusion (15 min)administered at 1 hr (Tmax) after the oral dose of 5 mg
Parent drug concentration measuredusing two analytical methods
AUC for oral dose by LC-MS/MS AUC for IV dose By UPLC-AMS
33
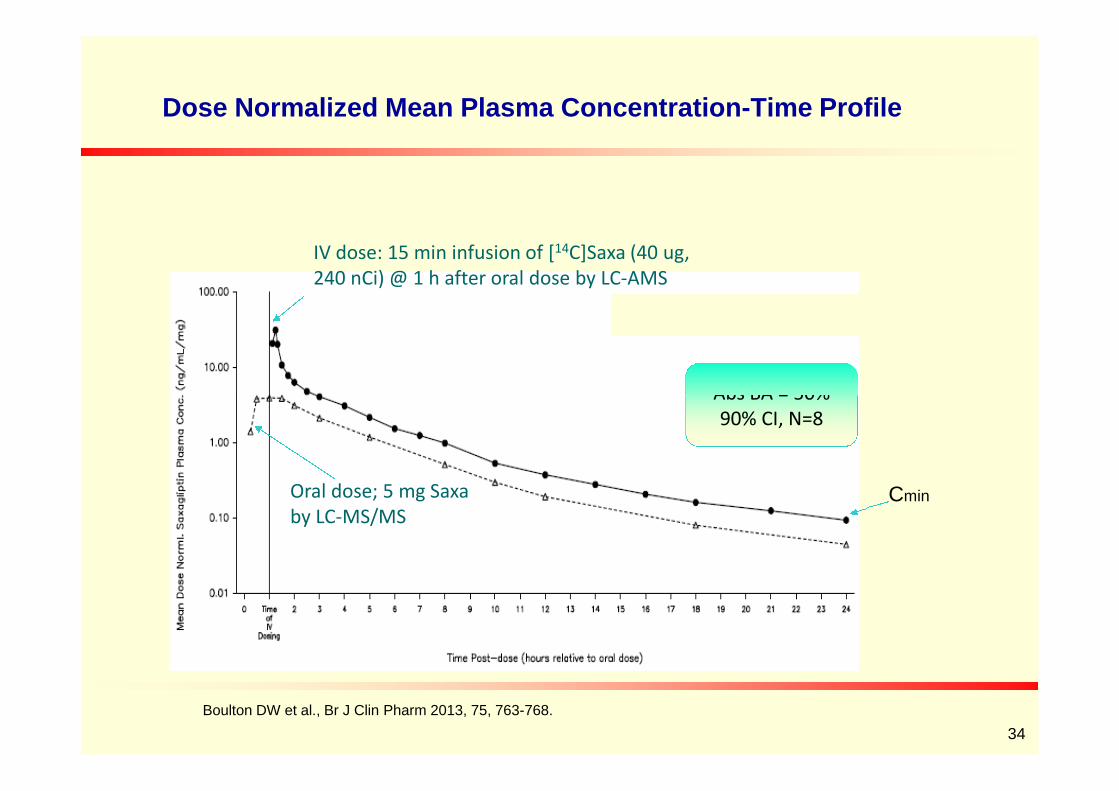
Dose Normalized Mean Plasma Concentration-Time Profile
IV dose: 15 min infusion of [14C]Saxa (40 ug,240 nCi) @ 1 h after oral dose by LC-AMS
Abs BA = 50%
Oral dose; 5 mg Saxaby LC-MS/MS
Abs BA = 50%90% CI, N=8
34
Cmin
Boulton DW et al., Br J Clin Pharm 2013, 75, 763-768.
Summary and Conclusions
Microdose approach for human absolute BA studies is efficient. AMS is
the technology of choice to meet the needed assay sensitivity.
Sample preparation and chromatographic separation are the major
challenges in an LC-AMS measurement.
Drug concentrations in plasma measured by 2 AMS labs were
comparable and were similar to values obtained by LC-MS/MS. Acomparable and were similar to values obtained by LC-MS/MS. A
technical validation is sufficient for an LC-AMS quantification.
Data from the human absolute BA study generated under AMS were
included in regulatory filings and resulted in the drug approval.
35
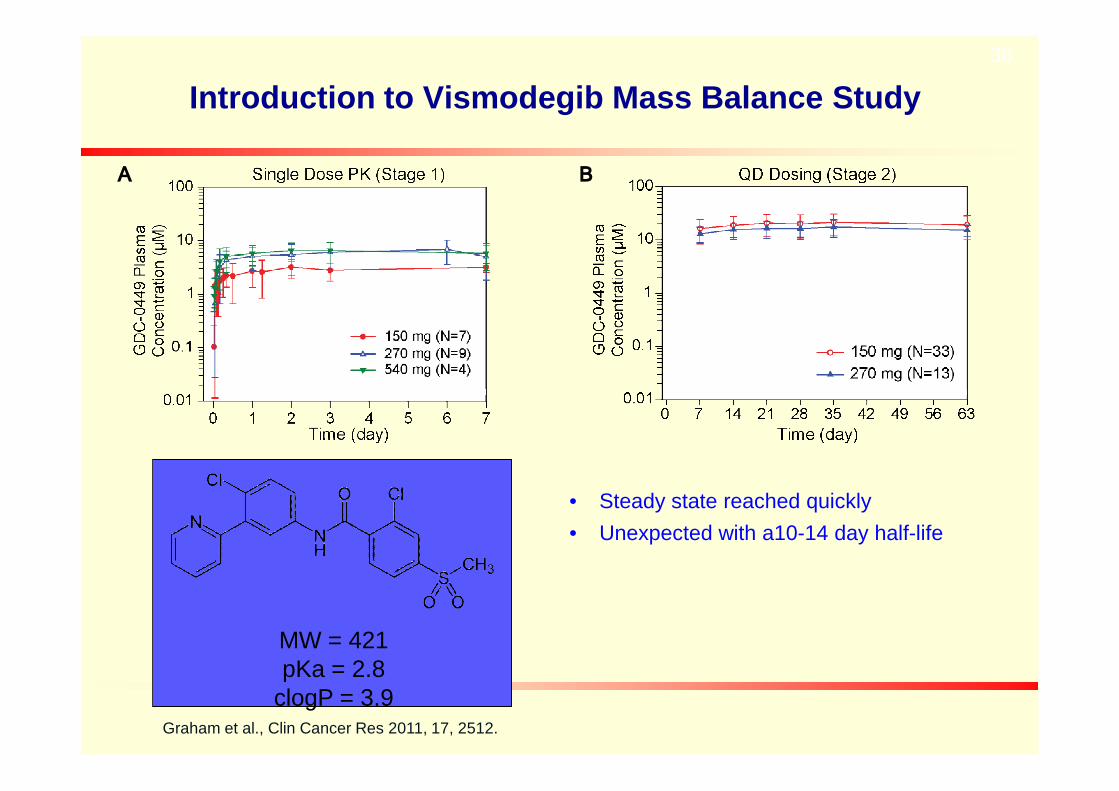
Introduction to Vismodegib Mass Balance Study
A B
36
• Steady state reached quickly
• Unexpected with a10-14 day half-life
Graham et al., Clin Cancer Res 2011, 17, 2512.
MW = 421pKa = 2.8
clogP = 3.9
Combined Mass balance Study withAbsolute BA Determination of Vismodegib
• Mass Balance Study
• Understanding of major routes of vismodegib elimination
• Quantification of parent and metabolites in plasma, urine and feces
• Absolute Bioavailability Study• Absolute Bioavailability Study
• Understanding vismodegib absorption and distribution after asingle dose and at steady state
• Fulfills regulatory requirement for product registration

Specific Challenges for vismodegib and Opportunity
• If traditional mass balance study:
• How ethical is it to have healthy volunteers exposed to 50 – 100uCi for several months?
• The amount excreted each day is likely very small and may not bedetectable with liquid scintillation counting
• Study is likely to fail• Study is likely to fail
• 14C tracer study with accelerator mass spectrometry
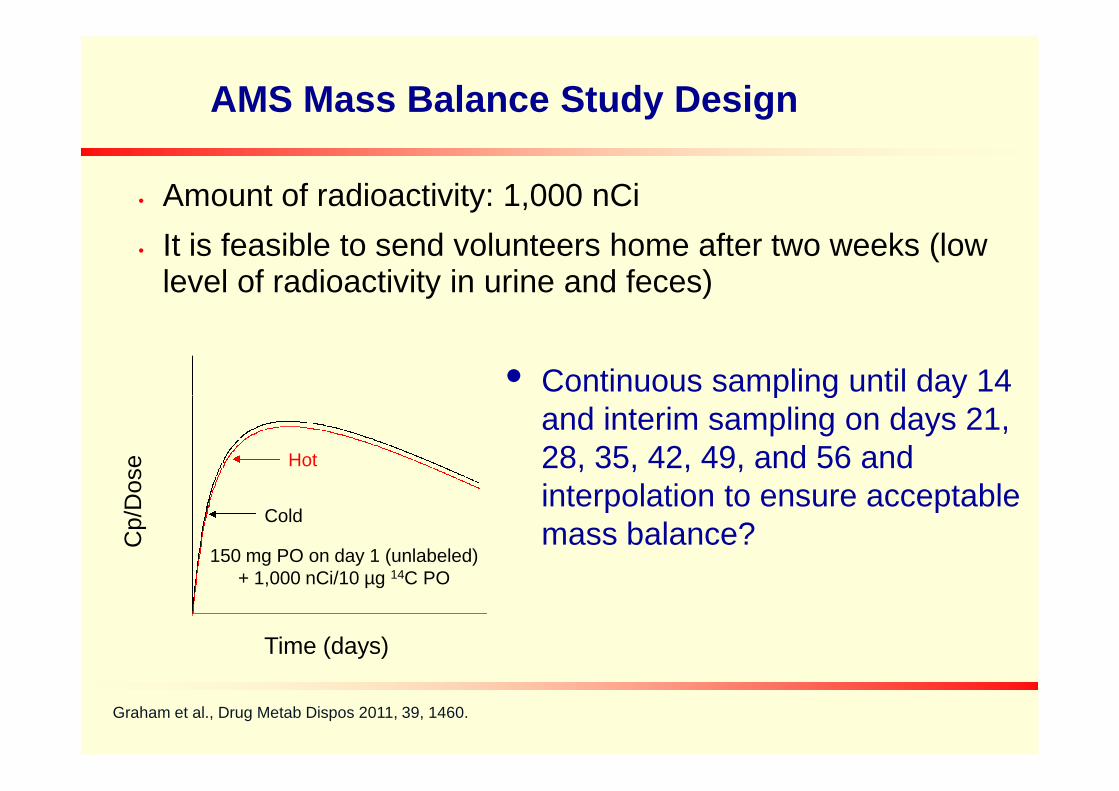
AMS Mass Balance Study Design
• Amount of radioactivity: 1,000 nCi
• It is feasible to send volunteers home after two weeks (lowlevel of radioactivity in urine and feces)
• Continuous sampling until day 14
Time (days)
Cp/D
ose
150 mg PO on day 1 (unlabeled)+ 1,000 nCi/10 µg 14C PO
Cold
Hot
• Continuous sampling until day 14and interim sampling on days 21,28, 35, 42, 49, and 56 andinterpolation to ensure acceptablemass balance?
Graham et al., Drug Metab Dispos 2011, 39, 1460.

0.1
1L
og
pe
rce
nt
of
tota
le
xc
rete
dp
er
24
hp
eri
od
Up to 168 h allexcreta collected
AUC0- = 90.5 % recovery
Interpolation to Ensure Adequate Radioactivity Recoveryfor a Long Half-Life Drug
0.01
0 500 1000 1500 2000 2500
Time (h)
Lo
gp
erc
en
to
fto
tal
ex
cre
ted
pe
r2
4h
pe
rio
d
After 168 h, collections overselected 24 h periods
Subjects were administered 3 mg/1 μCi of drug®

Vismodegib Mass Balance Results
Total Recovery = 86.6%Confined D1-D14
Feces Recovery
= 82.2%
Urine Recovery = 4.4%
Graham et al., Drug Metab Dispos 2011, 39, 1460.

Summary of Vismodegib Mass Balance
• 14C Tracer study with accelerator mass spectrometry wassuccessfully used to determine mass balance andabsolute bioavailability of Vismodegib in one study.
• Interim sampling for long period of sample collections anddata interpolation was demonstrated as a good strategyto determine mass balance for a drug with long terminalto determine mass balance for a drug with long terminalelimination half-life.
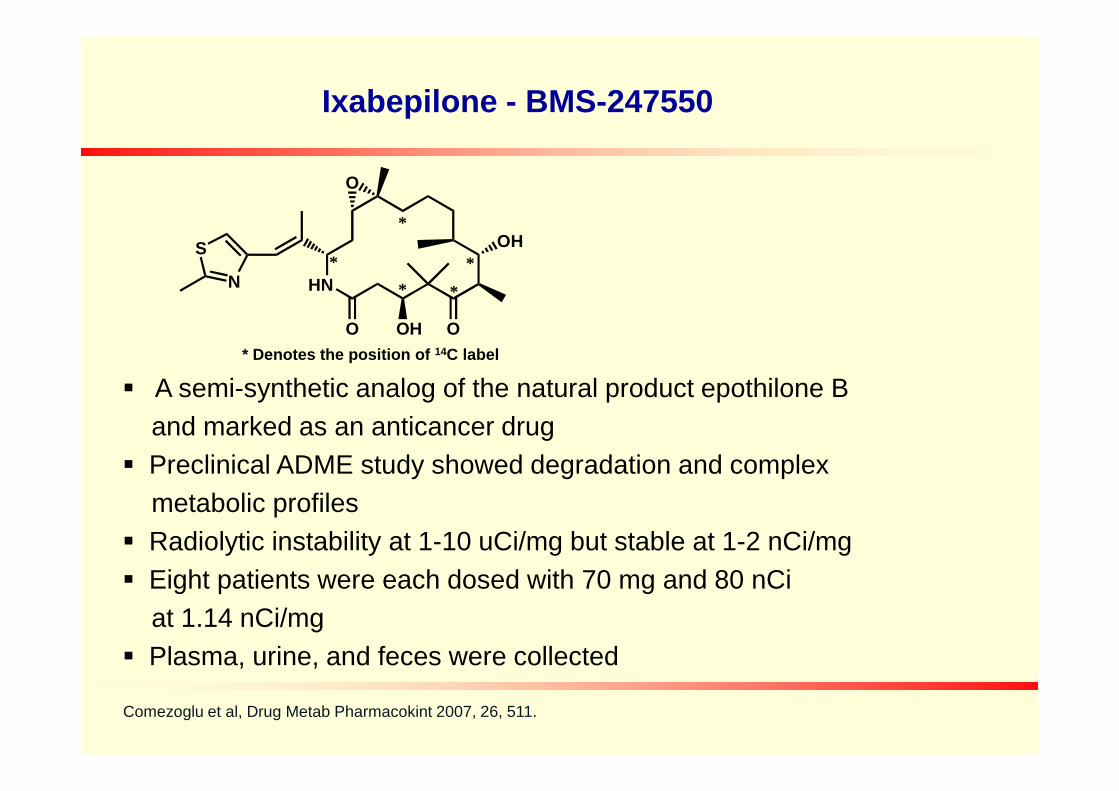
Ixabepilone - BMS-247550
A semi-synthetic analog of the natural product epothilone B
S
N HN
O
O O
OH
OH
*
*
*
**
* Denotes the position of 14C label
A semi-synthetic analog of the natural product epothilone B
and marked as an anticancer drug
Preclinical ADME study showed degradation and complex
metabolic profiles
Radiolytic instability at 1-10 uCi/mg but stable at 1-2 nCi/mg
Eight patients were each dosed with 70 mg and 80 nCi
at 1.14 nCi/mg
Plasma, urine, and feces were collected
Comezoglu et al, Drug Metab Pharmacokint 2007, 26, 511.

Metabolic Pathways of Ixabepilone
S
N
HO
O
OH
OH
O
N
BMS-249798(known degradant)
S
N
OHO
N
HOH
O
S
N HN
HO
O O
OH
OH
HO
BMS-326412(known degradant)
S
N
O
OH
-2H
S
N
HO
O
OH
OH
O
N
BMS-249798(known degradant)
S
N
OHO
N
HOH
O
S
N HN
HO
O O
OH
OH
HO
BMS-326412(known degradant)
S
N
O
OH
-2H
OOHBMS-567637(known degradant)
S
N HN
O O
OH
OH
Ixabepilone (BMS-247550)
S
N HN
O
O O
OH
OH
OH
M8
S
N HN
O
O O
OH
OH
OH
M41
N HN
O OOH
-2H
M19
S
N HN
O
O O
OH
OH
OH-2H
M16
OOHBMS-567637(known degradant)
S
N HN
O O
OH
OH
Ixabepilone (BMS-247550)
S
N HN
O
O O
OH
OH
OH
M8
S
N HN
O
O O
OH
OH
OH
M41
N HN
O OOH
-2H
M19
S
N HN
O
O O
OH
OH
OH-2H
M16

0 . 0 0 0 0
0 . 0 0 5 0
0 . 0 1 0 0
0 . 0 1 5 0
0 . 0 2 0 0
0 . 0 2 5 0
0 . 0 3 0 0
0 . 0 3 5 0
0 . 0 5 . 0 1 0 . 0 1 5 . 0 2 0 . 0 2 5 . 0 3 0 . 0 3 5 . 0 4 0 . 0 4 5 . 0 5 0 . 0
T i m e ( m i n )
dp
mp
er
fracti
on
B M S - 2 4 9 7 9 8
B M S - 3 2 6 4 1 2
B M S - 2 4 7 5 5 0
8 - 9
1 1
1 7
1 9
2 4
2 7
2 8
3 1
3 2
3 3
3 4
1 5
2 0 - 2 1
2 3
2 9
3 6
3 7
2 6
0 . 0 1 0 0
0 . 0 1 2 0
3 10 . 0 1 0 0
0 . 0 1 2 0
3 1
APlasma 4 hr
B
0 . 0 0 0 0
0 . 0 0 5 0
0 . 0 1 0 0
0 . 0 1 5 0
0 . 0 2 0 0
0 . 0 2 5 0
0 . 0 3 0 0
0 . 0 3 5 0
0 . 0 5 . 0 1 0 . 0 1 5 . 0 2 0 . 0 2 5 . 0 3 0 . 0 3 5 . 0 4 0 . 0 4 5 . 0 5 0 . 0
T i m e ( m i n )
dp
mp
er
fracti
on
B M S - 2 4 9 7 9 8
B M S - 3 2 6 4 1 2
B M S - 2 4 7 5 5 0
8 - 9
1 1
1 7
1 9
2 4
2 7
2 8
3 1
3 2
3 3
3 4
1 5
2 0 - 2 1
2 3
2 9
3 6
3 7
2 6
0 . 0 1 0 0
0 . 0 1 2 0
3 10 . 0 1 0 0
0 . 0 1 2 0
3 1
APlasma 4 hr
B
Radioactivity Profiles of Ixabepilone in Human Plasma
0 . 0 0 0 0
0 . 0 0 2 0
0 . 0 0 4 0
0 . 0 0 6 0
0 . 0 0 8 0
0 . 0 1 0 0
0 . 0 5 . 0 1 0 . 0 1 5 . 0 2 0 . 0 2 5 . 0 3 0 . 0 3 5 . 0 4 0 . 0 4 5 . 0 5 0 . 0
T i m e ( m i n )
dp
mp
er
fracti
on
B M S - 2 4 9 7 9 8
B M S - 3 2 6 4 1 2
B M S - 2 4 7 5 5 0
5
7 - 8
1 0
1 3
1 5
2 2
2 5
2 7
2 9 - 3 0
3 1
3 2
3 4
3 5
2 43 3
3 6
3 7
Plasma, 8 hr
0
0 . 0 0 1
0 . 0 0 2
0 . 0 0 3
0 . 0 0 4
0 . 0 0 5
0 . 0 0 6
0 . 0 0 7
0 5 1 0 1 5 2 0 2 5 3 0 3 5 4 0 4 5 5 0
T i m e [ m i n ]
dp
mp
er
fracti
on
CPlasma, 8 hrRepeat Analysis
0 . 0 0 0 0
0 . 0 0 2 0
0 . 0 0 4 0
0 . 0 0 6 0
0 . 0 0 8 0
0 . 0 1 0 0
0 . 0 5 . 0 1 0 . 0 1 5 . 0 2 0 . 0 2 5 . 0 3 0 . 0 3 5 . 0 4 0 . 0 4 5 . 0 5 0 . 0
T i m e ( m i n )
dp
mp
er
fracti
on
B M S - 2 4 9 7 9 8
B M S - 3 2 6 4 1 2
B M S - 2 4 7 5 5 0
5
7 - 8
1 0
1 3
1 5
2 2
2 5
2 7
2 9 - 3 0
3 1
3 2
3 4
3 5
2 43 3
3 6
3 7
Plasma, 8 hr
0
0 . 0 0 1
0 . 0 0 2
0 . 0 0 3
0 . 0 0 4
0 . 0 0 5
0 . 0 0 6
0 . 0 0 7
0 5 1 0 1 5 2 0 2 5 3 0 3 5 4 0 4 5 5 0
T i m e [ m i n ]
dp
mp
er
fracti
on
CPlasma, 8 hrRepeat Analysis

0
0.05
0.1
0.15
0.2
0.25
0.0 5.0 10.0 15.0 20.0 25.0 30.0 35.0 40.0 45.0 50.0
Time (min)
dp
mp
er
fracti
on
3 5
8-9
1012
13 BMS-249798
17
18-19
23
26
27
BMS-247550
31
32
7 11
20-21
24
29-30
35
0
0.05
0.1
0.15
0.2
0.25
0.0 5.0 10.0 15.0 20.0 25.0 30.0 35.0 40.0 45.0 50.0
Time (min)
dp
mp
er
fracti
on
3 5
8-9
1012
13 BMS-249798
17
18-19
23
26
27
BMS-247550
31
32
7 11
20-21
24
29-30
35
AUrine
0
0.05
0.1
0.15
0.2
0.25
0.0 5.0 10.0 15.0 20.0 25.0 30.0 35.0 40.0 45.0 50.0
Time (min)
dp
mp
er
fracti
on
3 5
8-9
1012
13 BMS-249798
17
18-19
23
26
27
BMS-247550
31
32
7 11
20-21
24
29-30
35
0
0.05
0.1
0.15
0.2
0.25
0.0 5.0 10.0 15.0 20.0 25.0 30.0 35.0 40.0 45.0 50.0
Time (min)
dp
mp
er
fracti
on
3 5
8-9
1012
13 BMS-249798
17
18-19
23
26
27
BMS-247550
31
32
7 11
20-21
24
29-30
35
AUrine
Mass Balance:
Radioactivity Profiles of Ixabepilone in Human Urine/Feces
Time (min)Time (min)
0.0000
0.0050
0.0100
0.0150
0.0200
0.0250
0.0300
0.0350
0.0400
0.0450
0.0 5.0 10.0 15.0 20.0 25.0 30.0 35.0 40.0 45.0 50.0
Time (min)
dp
mp
er
fra
cti
on
BMS-326412
BMS-247550
4
6
8
10
12
13-15
16
17-19
20
22
24-25
2628-30
32
33
35
7
9
11
23
31
36
0.0000
0.0050
0.0100
0.0150
0.0200
0.0250
0.0300
0.0350
0.0400
0.0450
0.0 5.0 10.0 15.0 20.0 25.0 30.0 35.0 40.0 45.0 50.0
Time (min)
dp
mp
er
fra
cti
on
BMS-326412
BMS-247550
4
6
8
10
12
13-15
16
17-19
20
22
24-25
2628-30
32
33
35
7
9
11
23
31
36
4
6
8
10
12
13-15
16
17-19
20
22
24-25
2628-30
32
33
35
7
9
11
23
31
36
BFeces
Mass Balance:25.1% of dose in urine52.7% of dose in fecesDuring 0-168 h collections
Summary of Ixabepilone Human ADME
• 14C Ixabepilone undergoes radiolysis degradation.
• 14C microtracer in a pharmacological dose with AMS wassuccessfully used to determine mass balance andmetabolite profiles of ixabepilone in human ADME study.
• Although chemical degradation was prominent forixabepilone, AMS analysis of plasma shows that theixabepilone, AMS analysis of plasma shows that theparent was the major circulating component in humancirculation.
• Fraction collection, AMS analysis, and comparison withanimal and in vitro metabolites showed that manyoxidative metabolites and degradation products in humanurine and feces.

Technical Limitations for AMS Studies in ADME
No Structural Information
Efficient Extraction Requirement
In the absence of an internal standard, reliable and high extractionrecovery of the low level of [14C] material is critical to achieve theneeded sensitivity and reliability in derived concentrations from theAMS analysis.
Peak Isolation Peak Isolation
AMS cannot distinguish co-eluting metabolites by mass, thuschromatographic separation of parent from its metabolites is critical.
The AMS labs do not have easy access to a benchtop MS detectorfor identification of drug-related components
Reference standards for many of the minor metabolites are often notavailable

Factors Impacting Sensitivity in AMS
In theory, only 1,000 atoms are need to achieve statistical limits ofdetection which translates to a zeptomole detection limit (10-21) forAMS
In practice, the limit of detection for AMS depends on the s/n ratio,which is further dependent upon: The amount of 14C in the isotopically enriched drug
Endogenous background from extraction
49
Quality of the signal/noise above background
Ways of to reduce endogenous carbon in samples Removal of endogenous proteins via selective extraction
Remove co-eluted metabolites/interferences
Contamination must be controlled at the site of sample collectionand sample analysis as background level of radioactivity willsignificantly impact sensitivity (small sample size can easily causecontamination, usually 0.1% of conventional sample size) Elevated 14C baseline can have a significant impact on accuracy/ sensitivity
of LOQ measurement

LC-MS/MS
Integrated separation/detectiondoesn’t require offline fractioncollection
Can simultaneously detect parentand metabolites
High throughput
AMS
Accelerates ions to extraordinarilyhigh kinetic energies before massanalysis
Derives extraordinary sensitivityfrom direct counting of the amount ofionized atoms (e.g., 14C) in sample
AMS vs. LC-MS/MS
High throughput
Can reaching sub pg/mL level, butrequires extraordinary sample cleanup efforts
Cost and time savings
Improving sensitivity
Wide linear range (>104)
No need for IS
Low throughput and long dataturnaround
Costly and limited vendors (Vitalea,Accium, etc.)
50

Path to Successful Microdose/Microtracer Studies
• Understand project needs and timelines: PK/massbalance/metabolite profiles
• Important elements to consider: analytical sensitivityrequirement, AMS vs LC-MS/MS, separation frommetabolite and parent, no Structural Information fromAMS, complementary to regular LC-MS/MS, need
51
AMS, complementary to regular LC-MS/MS, needefficient extract recovery
• Plan early: Model pharmacokinetics of IV dose: VD
and Cmin, Cmax ratio of tracer to cold in circulation
• Team collaboration: clinical Pharmacology,metabolism, radiosynthesis and bioanalytical
AMS Limitations and Future Perspectives
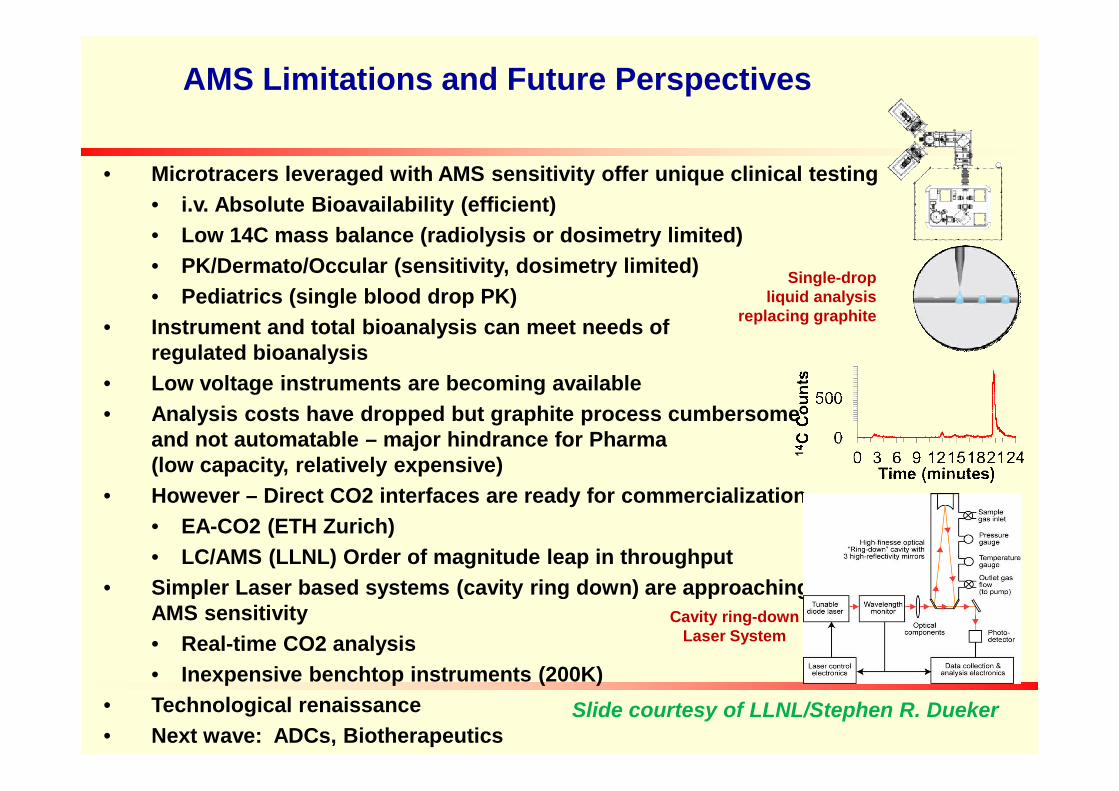
• Microtracers leveraged with AMS sensitivity offer unique clinical testing
• i.v. Absolute Bioavailability (efficient)
• Low 14C mass balance (radiolysis or dosimetry limited)
• PK/Dermato/Occular (sensitivity, dosimetry limited)
• Pediatrics (single blood drop PK)
• Instrument and total bioanalysis can meet needs ofregulated bioanalysis
• Low voltage instruments are becoming available
Single-dropliquid analysis
replacing graphite
• Analysis costs have dropped but graphite process cumbersomeand not automatable – major hindrance for Pharma(low capacity, relatively expensive)
• However – Direct CO2 interfaces are ready for commercialization
• EA-CO2 (ETH Zurich)
• LC/AMS (LLNL) Order of magnitude leap in throughput
• Simpler Laser based systems (cavity ring down) are approachingAMS sensitivity
• Real-time CO2 analysis
• Inexpensive benchtop instruments (200K)
• Technological renaissance
• Next wave: ADCs, Biotherapeutics
Cavity ring-downLaser System
Slide courtesy of LLNL/Stephen R. Dueker

Backup Slides
Readings
Vogel JS and Love AH, Quantitating isotopic molecular labels with accelerator mass spectrometry P402-422. InBiological Mass Spectrometry in Methods in Enzymology vol 402.
Garner RC et al., A validation study comparing accelerator MS and liquid scintillation counting for analysis of 14C-labeled drug in plasma, urine, and faecal extracts. J Pharmaceut Biomed Anal 24: 197-2009.
Comezglu SN et al (2007) Biotransformation profiling of 14C ixabepilone in human plasma, urine and fecessamples using accelerator mass spectrometry (AMS) Drug Metab Pharmacokinetics 26:511-522.
Graham RA et al (2011) A single dose mass balance study of the Hedgehog pathway inhibitor vismodegib (GDC-0449) in humans using accelerator mass spectrometry. Drug Metab Dispos 39: 1460-7.
Graham RA et al (2012) single and multiple dose intravenous and oral PK of the Hedgehog pathway inhibitorvisodegib in healthy femle subjects. Br J Clin Pharm 74: 788-796.visodegib in healthy femle subjects. Br J Clin Pharm 74: 788-796.
Boulton DW et al (2013) simultaneous oral therapeutic and intravenous 14C-microdose to determine the absoluteoral bioavailability of saxagliptin and dapagliflozin. Br J Clin Pharm 75:763-768.
Lappin G (2012) Microdosing: current and the future 2, 509-517.
Dingley KH et al. (1998) Attomole detection of 3H in biological samples using accelerator mass spectrometry:Application in low‐dose, dual‐isotope tracer studies in conjunction with C‐14 accelerator mass spectrometry.Chem Res Toxicol 11, 1217–1222.
Dueker SR et al. (2000) Long‐term kinetic study of beta‐carotene, using accelerator mass spectrometry in anadult volunteer. J Lipid Res 41, 1790–1800.

![Accelerator mass spectrometry - ITNprojects.itn.pt/ActAMS_HLuis/[1].pdfAccelerator mass spectrometry (AMS) evolved at nuclear physics laboratories where tandem accelerators were originally](https://static.fdocuments.in/doc/165x107/5e2d3d211e6ecd005f187953/accelerator-mass-spectrometry-1pdf-accelerator-mass-spectrometry-ams-evolved.jpg)