PAPER SPRAY MASS SPECTROMETRY FOR RAPID DRUG …
210
PAPER SPRAY MASS SPECTROMETRY FOR RAPID DRUG SCREENING by Rachel Jett A Thesis Submitted to the Faculty of Purdue University In Partial Fulfillment of the Requirements for the degree of Master of Science Department of Chemistry Indianapolis, Indiana August 2017
Transcript of PAPER SPRAY MASS SPECTROMETRY FOR RAPID DRUG …
PAPER SPRAY MASS SPECTROMETRY FOR RAPID DRUG
SCREENING
by
Rachel Jett
A Thesis
Submitted to the Faculty of Purdue University
In Partial Fulfillment of the Requirements for the degree of
Master of Science
Department of Chemistry
Indianapolis, Indiana
August 2017

ii
THE PURDUE UNIVERSITY GRADUATE SCHOOL
STATEMENT OF COMMITTEE APPROVAL
Dr. Nick Manicke, Chair
Department of Chemistry and Chemical Biology
Dr. John Goodpaster
Department of Chemistry and Chemical Biology
Dr. Michael McLeish
Department of Chemistry and Chemical Biology
Approved by:
Dr. Eric C. Long
Head of the Graduate Program

iii
To the Creator-
Who places the mysteries of the world before us
and the curiosities of the mind within us

iv
ACKNOWLEDGMENTS
This project would not have been possible without the input, support, and feedback of the
Manicke and Goodpaster Groups: Nick, Chengsen, Brandon, Greta, Josiah, Grace, John,
Dana, Will, Jordan, Clinton
Thank you.
v
TABLE OF CONTENTS
LIST OF TABLES ........................................................................................................... viii
LIST OF FIGURES ............................................................................................................ x
LIST OF ABBREVIATIONS .......................................................................................... xiv
ABSTRACT ................................................................................................................. xv
CHAPTER 1: BACKGROUND ......................................................................................... 1
Toxicology ...................................................................................................................... 1
Forensic Toxicology ....................................................................................................... 2
Human Performance Toxicology ................................................................................ 3
Doping Control ............................................................................................................ 3
Workplace Drug Testing ............................................................................................. 3
Postmortem Investigations .......................................................................................... 4
Analytical Strategy ......................................................................................................... 4
Targeted Analysis ........................................................................................................ 4
General Unknown Screening ....................................................................................... 5
Practical Toxicology .................................................................................................... 6
The Need for Something New ........................................................................................ 7
CHAPTER 2: INTRODUCTION ....................................................................................... 9
Project Overview ............................................................................................................ 9
Paper Spray-Mass Spectrometry .................................................................................. 10
Selectivity ..................................................................................................................... 14
Mass Spectrometer Selection .................................................................................... 14
Fragmentation ............................................................................................................ 15
Selectivity in Paper Spray ......................................................................................... 16
Special Considerations ................................................................................................. 18
Postmortem blood ...................................................................................................... 19
Matrix Effects ............................................................................................................ 20
CHAPTER 3: MATERIALS AND METHODS .............................................................. 23
Chemicals and Reagents ............................................................................................... 23
vi
APPENDIX F: EXOGENOUS INTERFERENCES ...................................................... 185
Paper Shape and Sample Loading ................................................................................ 29
Placement of Sample................................................................................................ 30
Loading Capacity and Blood Dilution ..................................................................... 30
Tuning .......................................................................................................................... 36
Acquisition Parameter .................................................................................................. 38
Screening Identification Criteria .................................................................................. 39
Mass Spectrometer and Materials ................................................................................ 23
Method .......................................................................................................................... 23
Manual Method ......................................................................................................... 24
Automated Method .................................................................................................... 26
CHAPTER 5: RESULTS .................................................................................................. 45
Results Summarized ..................................................................................................... 46
CHAPTER 6: INTERFERENCE STUDY ....................................................................... 67
Exogenous interferences ............................................................................................... 68
Intra-target interferences .............................................................................................. 68
Conclusions and Future Work ................................................................................. 76
CHAPTER 7: CONCLUSIONS ....................................................................................... 78
Summary of Conclusions ............................................................................................. 78
Discussion .................................................................................................................... 79
Future work .................................................................................................................. 80
BIBLIOGRAPHY ............................................................................................................. 82
APPENDIX A: PURPOSED ANALYTICAL TARGETS WITH CUTOFF
VALUES FROM AFT .............................................................................................. 89
APPENDIX B: DETAILED RESULTS FROM LOADING CAPACITY AND
BLOOD DILUTION STUDY ................................................................................. 108
APPENDIX C: MASS SPEC PARAMETERS .............................................................. 113
APPENDIX D: SPIKING SOLUTION COCKTAILS .................................................. 122
APPENDIX E: DETAILED DATA BY COCKTAIL ................................................... 126
CHAPTER 4: METHOD DEVELOPMENT.................................................................... 27
Solvent Selection .......................................................................................................... 27

vii
LIST OF TABLES
Table 1: Screening cutoff values for the target anlaytes in the project ranged from
less than 5 ng/mL to over 1000 ng/mL. ...........................................................11
Table 2: MS-MS based identification criteria for various applications .........................18
Table 3: 47 different solvent systems were tested for use with PS-MS in an effort to
identify a solvent that would produce a steady Taylor cone, prevent
electrical discharge, and effectively extract target analytes. ............................28
Table 4: Relative AUC of fragment ions at different positions on the long paper
strip. The lowest AUC was normalized to 1.00 for comparative purposes
and the position on the paper strip with the largest AUC is denoted in
green. ................................................................................................................31
Table 5: Four dilutions schemes used to test the effect of diluting blood on the
signal to blank ratio of five analytical targets. .................................................32
Table 6: Results from thirteen analytes show that using long paper with diluted
blood generally gives lower blank signals and higher analyte response than
using whole blood and 3mm punches. The first seven analytes (in blue)
were run in one set of samples and the last 6 (in red) were run in a second
set of samples. ..................................................................................................35
Table 7: A list of targets run at concentrations other than those proposed by AFT
compared to normal, toxic, and fatal levels2 Normal levels are defined as
the effective dose where no or minimal side effects occur. Toxic levels are
those at which side effects or negative symptoms arise, and fatal levels are
the concentrations which result in either coma or death. ................................ 48
Table 8: Summary of results for all 154 proposed analytical targets ............................ 49
Table 9: Cocktail A-Manual experiments had 26 scans per target and experiments
run on the automated ionization source on the laser-cut paper had 16 scans
per target. Red shading indicates failure to meet detection criteria. .............. 52

viii
Table 10: Cocktail B-Manual experiments had 35 scans per target and experiments
run on the automated ionization source on the laser-cut paper had 16 scans
per target. Red shading indicates failure to meet detection criteria. ............... 53
Table 11: Cocktail C-Manual experiments had 32 scans per target and experiments
run on the automated ionization source on the laser-cut paper had 16 scans
per target. Red shading indicates failure to meet detection criteria. ............... 54
Table 12: Cocktail D- Manual experiments had 20 scans per target and experiments
Run on the automated ionization source had 15 scans per target. Red
shading indicates failure to meet detection criteria......................................... 55
Table 13: Cocktail E- Manual experiments had 20 scans per target and experiments
run on the automated ionization source had 15 scans per target. Red
shading indicates failure to meet detection criteria......................................... 57
Table 14: Cocktail F-Manual experiments had 27 scans per target and experiments
run on the automated ionization source had 20 scans per target. Red
shading indicates failure to meet detection criteria......................................... 59
Table 15: Cocktail G-Manual experiments had 24 scans per target and experiments
Run on the automated ionization source had 20 scans per target. Red
shading indicates failure to meet detection criteria......................................... 60
Table 16: Cocktail H Manual experiments had 28 scans per target and experiments
run on the automated ionization source had 21 scans per target. .................... 61
Table 17: Cocktail I-Manual experiments had 28 scans per target and experiments
run on the automated ionization source had 21 scans per target. Red
shading indicates failure to meet detection criteria......................................... 62
Table 18: Cocktail J-Manual experiments had 19 scans per target and experiments
run on the automated ionization source had 18 scans per target. Red
shading indicates failure to meet detection criteria......................................... 63
Table 19: Cocktail K-Manual experiments had 30 scans per target and experiments
run on the automated ionization source had 18 scans per target. Red
shading indicates failure to meet detection criteria......................................... 64
ix
Table 20: Cocktail L-Manual experiments had 14 scans per target and experiments
run on the automated ionization source had 19 scans per target. Red
shading indicates failure to meet detection criteria......................................... 65
Table 21: Cocktail M- Manual experiments had 13 scans per target and experiments
run on the automated ionization source had 18 scans per target. Red
shading indicates failure to meet detection criteria......................................... 66
Table 22: Targets that share the same parent ion and could potentially interfere
with one another. ............................................................................................. 69
Table 23: Using an ESI spray source, targets were analyzed at 1000 ng/mL for the
transitions used in the analysis of other targets which share the same
parent ion. S:B less than 3:1 indicated that the target would not interfere
with the channels scanned for the other target, while a greater signal
routed targets through additional interference testing. The following 25
targets were found to have S:B greater than 3:1 for the transitions
recorded below ................................................................................................ 71
Table 24: Targets with the same parent ion were each added at 100 ng/mL to the spray
solvent and sprayed over blank paper. The fragmentation ion for each
target was monitored and those that differed from their established ratio
by greater than the permissible deviation of ±30% were flagged, as shown
in red. The remaining targets were concluded to not interfere with one
another............................................................................................................. 75
x
LIST OF FIGURES
Figure 1: Drug classes represented in this project. The size of each block is
proportional to the number of targets in that class ...........................................10
Figure 2: Schematic of paper spray .................................................................................12
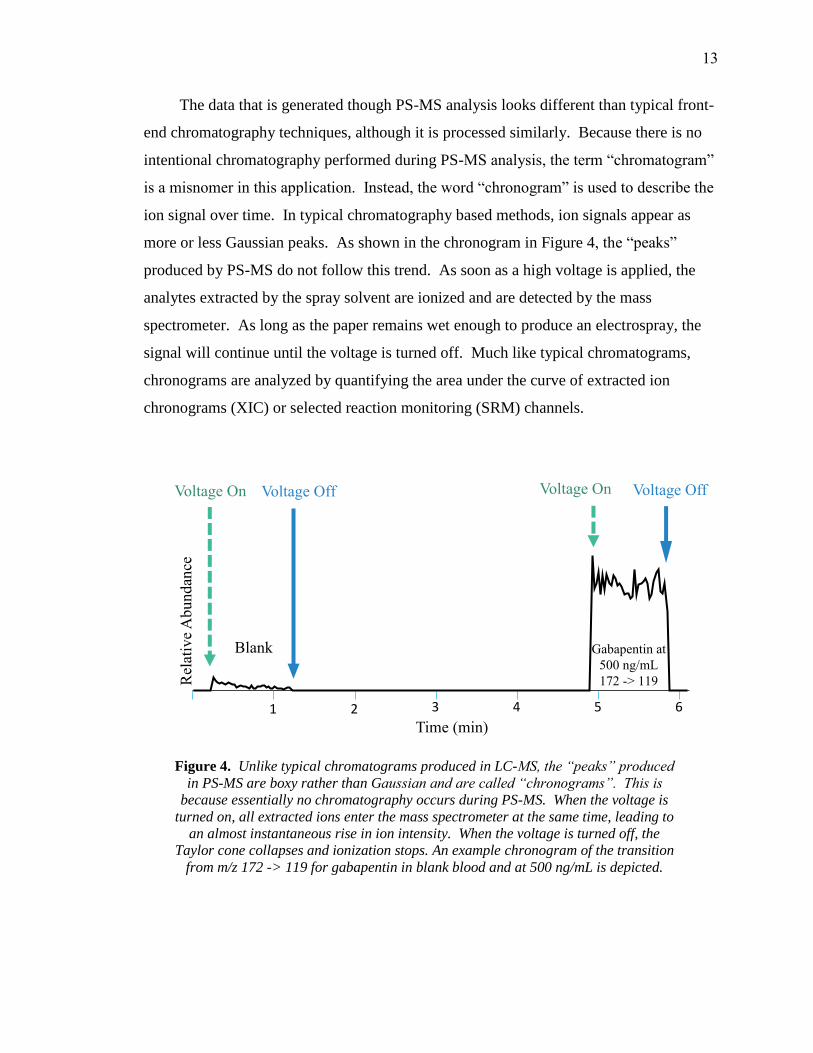
Figure 3: (A) During paper spray, a piece of paper cut into a sharp tip is positioned
5 mm away from the inlet of a mass spectrometer. (B) Solvent is added
and allowed to saturate the paper while the voltage remains off. (C) When
high voltage is applied, a Taylor cone forms at the paper’s tip, emitting a
plume of charged droplets that quickly evaporate, leaving behind gaseous
ions that enter the inlet of the mass spectrometer. ...........................................12
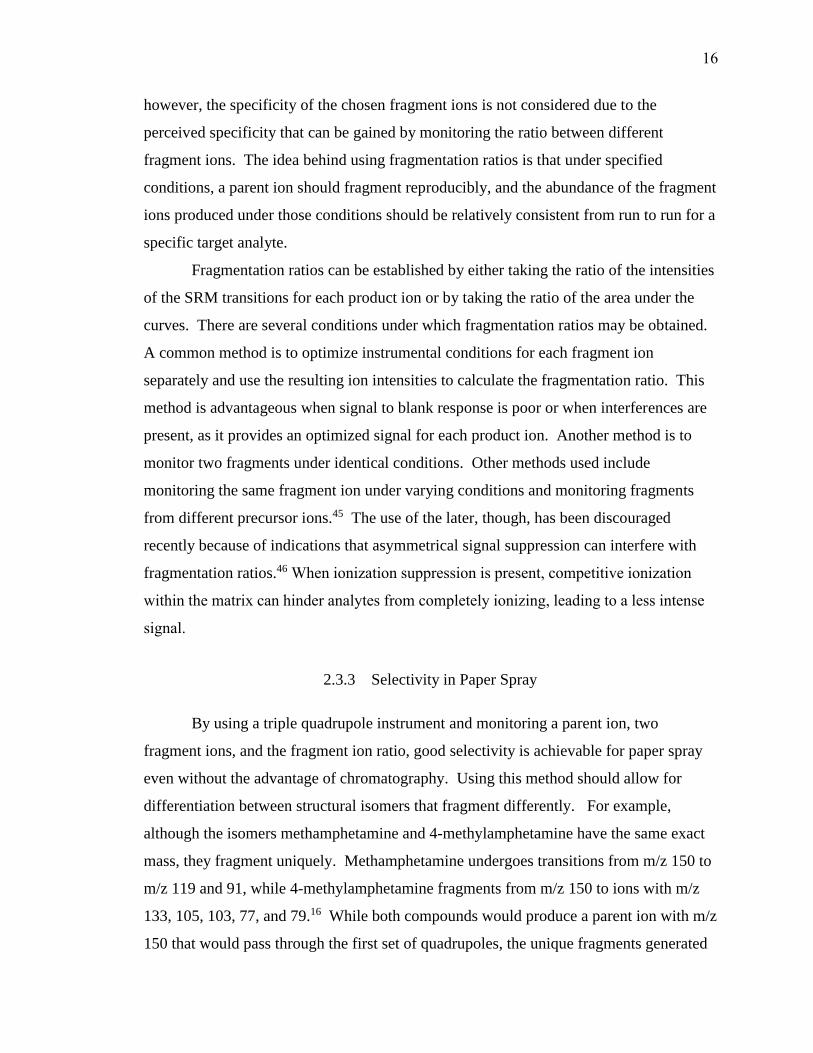
Figure 4: Unlike typical chromatograms produced in LC-MS, the “peaks” produced
in PS-MS are boxy rather than Gaussian and are called “chronograms”.
This is because essentially no chromatography occurs during PS-MS.
When the voltage is turned on, all extracted ions enter the mass
spectrometer at the same time, leading to an almost instantaneous rise in
ion intensity. When the voltage is turned off, the Taylor cone collapses and
ionization stops. An example chronogram of the transition from
m/z 172 -> 119 for gabapentin in blank blood and at 500 ng/mL is
depicted. ...........................................................................................................13
Figure 5: (A) An in-house designed reusable cartridge was used for manual
experiments. Using this set up 3µL blood spots were dried onto
pentagon-shaped papers hand-cut from Whatman 31ET
chromatography paper and inserted into a slot at the front of the cartridge.
In this design, solvent is applied through a well directly over blood spot.
(B) Commercial Velox cartridges from Prosolia were used for automated
experiments. In this set up, 12µL blood spots are dried onto precut paper
stored inside individual disposable cartridges. Solvent is applied into
well behind blood spot and wicks through the paper and blood spot. .............24
xi
Figure 10: An example of some of the data outputted from the tuning software.
In the curves produced for Flunitrazepam above, the 4 most intense
fragment ions are plotted against collision energy. Some fragments,
like m/z 268 are more sensitive to changes in collision energy, as is
evident in the narrow peak in the curve, while other fragments with
broad peaks, like m/z 183, are less effected by changes in collision
energy. ...............................................................................................................36
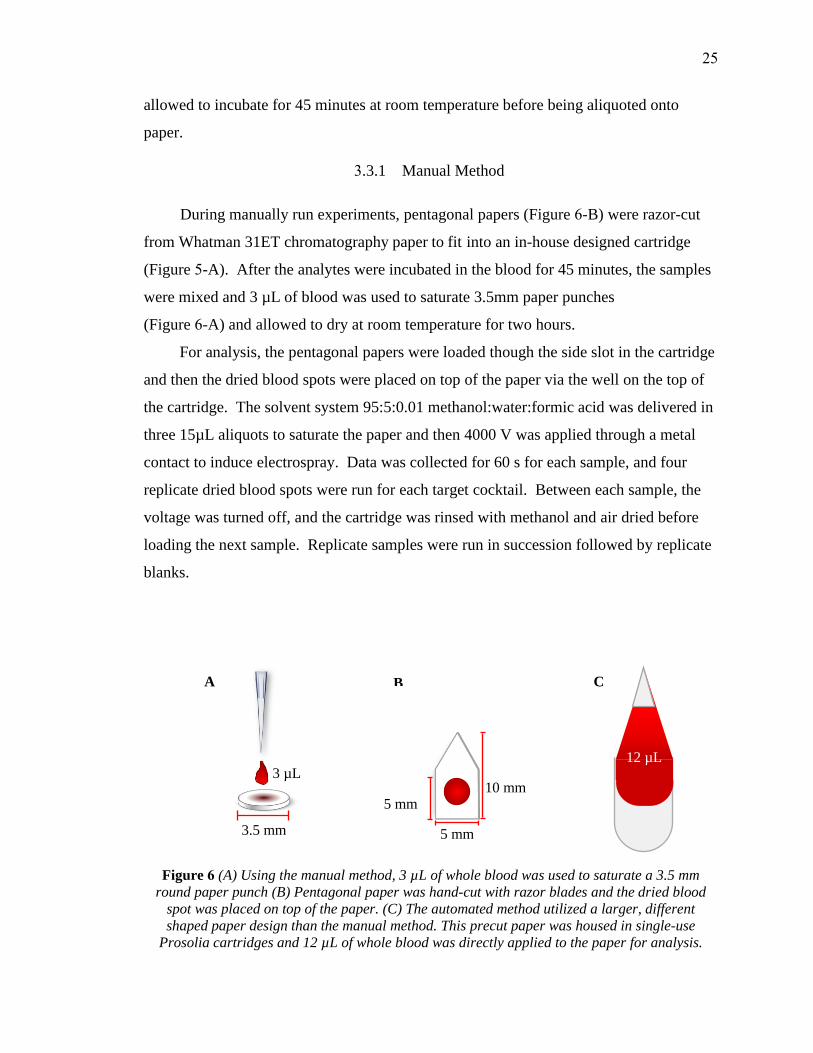
Figure 6: (A) Using the manual method, 3µL of whole blood was used to saturate a
3.5mm round paper punch (B) Pentagonal paper was hand-cut with razor
blades and the dried blood spot was placed on top of the paper. (C) The
automated method utilized a larger, different shaped paper design than
the manual method. This precut paper was housed in single-use Prosolia
cartridges and 12µL of whole blood was directly applied to the paper for
analysis. ............................................................................................................25
Figure 7: Paper shape and sample loading capacity were tested on two different
paper designs. (A) Traditional pentagonal-shaped papers provided a
base-line reference while (B) 30mm long pointed paper strips were used
to test the effects of higher loading capacities .................................................29
Figure 8: Plots of signal to blank ratio using blood diluted 1:1 on 30mm long paper
for (A) Zolpidem (B) Morphine (C) Clonazepam (D) Fentanyl (E) Buprenorphine indicate an optimal loading capacity of 20 µL for diluted
blood .................................................................................................................33
Figure 9: Plots of signal to blank ratio using whole blood on long paper for
(A) Zolpidem (B) Morphine (C) Clonazepam (D) Fentanyl(E) Buprenorphine. Although analytes do not follow the same trend, they generally show an optimal loading capacity of ~20 uL of wholeblood.................................................................................................................34
xii
Figure 15 Number of analytical targets detected using three different methods. Out
of the 133 targets analyzed using the manual method, 86% met detection
criteria; for the 131 targets analyzed using the automatic method with
laser-cut paper, 76% met detection criteria. Of the 68 targets analyzed
using the automatic method with die-cut paper, 87% met detection
criteria ............................................................................................................. 47
Figure 16. Stacked column graphs representing the reason that targets failed to meet
detection criteria for each of the three methods. When the manual method
was used, 53% of failed detections were due to ratio deviations outside of
the permitted ±30% window. For the automatic method using laser-cut
paper 53% of failures were due to ratio deviations, and for die-cut
experiments, the failure due to ratio deviations reached 75%. ....................... 51
Figure 13: Running average plot of fragmentation ratios for targets with ratios
< 50 show ratios generally stabilize after 15 scans on each fragment ion
channel .............................................................................................................41
Figure 14: Deviation between solvent-established fragmentation ratios and
fragmentations ratios in whole blood at cutoff concentrations for target
analytes where both fragments were detected with a S:B ≥3 ..........................43
Figure 12: Running average plot of fragmentation ratios for targets with ratios
> 50 show ratios generally stabilize after 15 scans on each fragment ion
channel .............................................................................................................40
Figure 11: When selecting appropriate fragment ions to monitor, fragmentation ratio
stability over a range of concentrations was considered. For example,
while m/z 83 was found to be the most abundant fragment for
norbuprenorphine during tuning, ratios that use fragment m/z 83 do not
behave proportionally, especially near the target detection level (1ppb).
In cases like this, a lesser abundant fragment is used to provide
fragmentation ratios that are more consistent over a range of
concentrations ..................................................................................................38
xiii
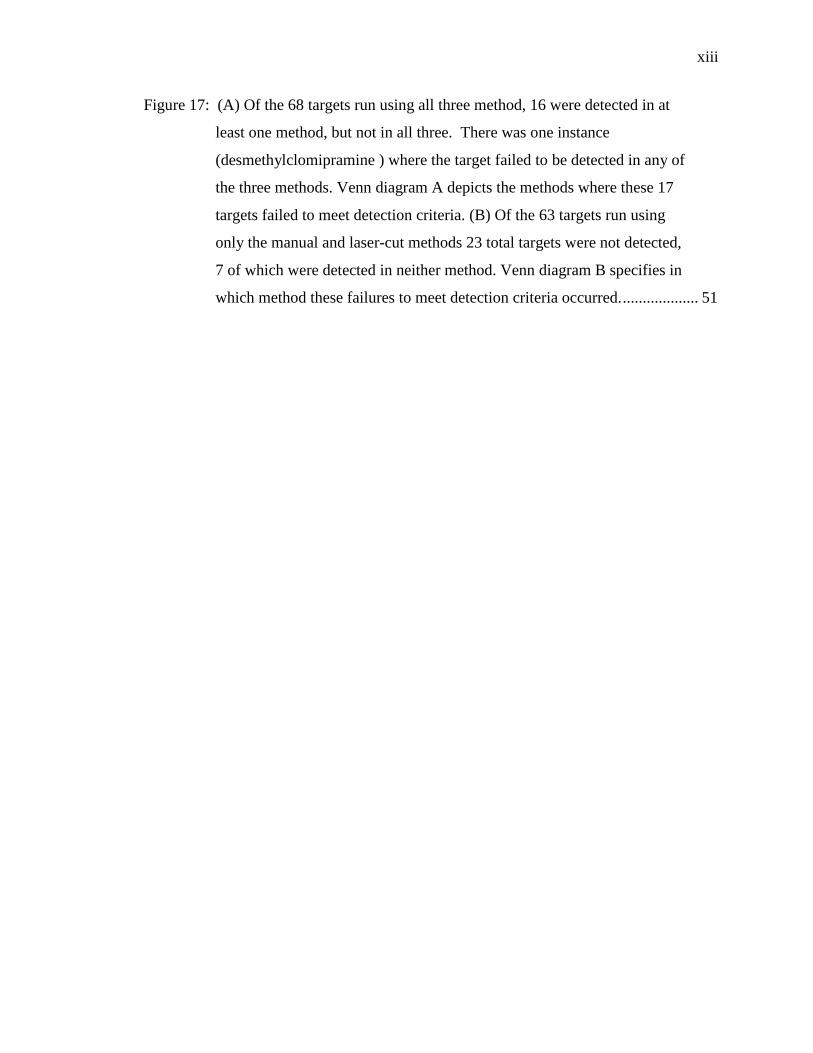
Figure 17: (A) Of the 68 targets run using all three method, 16 were detected in at
least one method, but not in all three. There was one instance
(desmethylclomipramine ) where the target failed to be detected in any of
the three methods. Venn diagram A depicts the methods where these 17
targets failed to meet detection criteria. (B) Of the 63 targets run using
only the manual and laser-cut methods 23 total targets were not detected,
7 of which were detected in neither method. Venn diagram B specifies in
which method these failures to meet detection criteria occurred. ................... 51

xiv
LIST OF ABBREVIATIONS
AFT
CE
CID
ELISA
EMIT
ESI
FPIA
GC-MS
GUS
Axis Forensic Toxicology
Collision Energies
Collision Induced Dissociation
Enzyme-linked Immunosorbent Assays
Enzyme-multiplied Immunoassay
Technique Electro Spray Ionization
Fluorescence Polarization Immunoassays
Gas Chromatography-Mass Spectrometry
General Unknown Screening
HPLC-MS
HR-MS
IS
KIMS
LC-UV
LLE
LLOQ
LOD
MTS
PMR
PS
PS-MS
QqQ
RIA
S:B
SRM
STA
WADA
XIC
High Performance Liquid Chromatography Mass Spectrometry
High Resolution Mass Spectrometry
Internal Standards
Kinetic Interaction of Microparticles in Solution
Liquid chromatography with Ultra Violet Detection
Liquid-Liquid Extraction
Lower Limit of Quantitation
Limit of Detection
Multi-Target Screening
Post-mortem Redistribution
Paper Spray
Paper Spray Mass Spectrometry
Triple Quadrupole Mass Spectrometers
Radioimmunoassays
Signal to Blank Ratio
Selected Reaction Monitoring
Systematic Toxicological Analysis
World Anti-Doping Agency
Extracted Ion Chronograms
xv
ABSTRACT
Author: Jett, Rachel MS
Institution: Purdue University
Degree Received: August 2017
Title: Paper Spray Mass Spectrometry for Rapid Drug Screening
Major Professor: Nick Manicke
Paper spray mass spectrometry is an alternative technique for toxicological screening that
is able to quickly and adequately screen for compounds encountered in postmortem
investigations with little sample handling and no sample preparation. For analysis of
dried blood spots using a triple quadrupole mass spectrometer, detection criteria were
defined to align with relevant regulatory guidelines while considering how fragment ion
selection, method sensitivity, and fragment ion ratio tolerances are best utilized in paper
spray mass spectrometry. For analysis, drugs and drug metabolites relevant to
postmortem investigations were spiked into drug-free blood, and by monitoring two
fragment ion channels in selected reaction monitoring mode, as well as the ratio between
the two fragment ions, a method was developed capable of detecting over 120 drug and
drug metabolites at concentrations relevant to postmortem drug screening. Total analysis
time for the developed method is less than 8 minutes, and less than 50µL of sample and
5mL of solvent are consumed during analysis.
1 BACKGROUND
The following project was undertaken with the goal of developing a multi-target
toxicological screening process that would be applicable for use in forensic postmortem
investigation cases. While the same method may be applied in different areas of
forensics or even in different fields within toxicology, it was postmortem investigation
that provided the context that shaped this project. As such, a brief overview of how
postmortem toxicology relates to other disciplines and how analysis is typically carried
out within this context will provide a basis for understanding how this project advances
the field of forensic toxicology and why certain decisions were made along the way.
1.1 Toxicology
The word, “toxicology” is derived from the Greek root toxicos, meaning
“poisonous.” At its core, toxicology is simply the study of poisons. Hundreds of years
ago, however, one of the fathers of toxicology, Paracelsus, famously stated that any
physical or chemical agent can be defined as a poison, and that, “Solely the dose
determines that a thing is not a poison.”4 Toxicology then, is actually a very broad field
that draws from organic and analytical chemistry, genetics, biochemistry, ecology,
pharmacology, pathology, physiology, and other areas of study in order to identify what
physical agents and chemical substances cause toxic effects in living organisms, at what
dose those effects arise, the mechanisms through which those effects take place, and how
to limit or treat exposure to these poisons. The diverse background necessary to
understand the complexities of toxicology also allow for its application into a wide
variety of situations. From determining how many aspirin we take for headache relief to
what chemicals OSHA allows us to handle at work, the impact of toxicology is woven
throughout our daily lives.
Although there are a wide range of applications for toxicology, a few sub-
disciplines represent much of the prominent work in the field. Clinical and medicinal
toxicology are concerned with the development and safe use of medicines and
pharmaceuticals that are used to treat, manage, or prevent disease. Environmental
1
toxicology looks at how industrial waste and byproducts can adversely affect humans and
other living creatures in the environment. Food toxicology promotes food safety by
monitoring and setting limitations on what pesticides and/or veterinary medicines are
safe for human consumption. Forensic toxicology is used when toxicological effects may
have legal ramifications, and can include anything from determining a person’s cause of
death to detecting the use of illegal performance-enhancing drugs in racehorses.
1.2 Forensic Toxicology
While other branches of toxicology are concerned with why a compound is toxic
or the mechanisms by which it affects an organism, forensic toxicology is used mostly in
situations where the presence or absence of a substance has legal implications. While
forensic toxicologists must still understand the hows and whys of toxicology, their
primary focus is on the detection, identification, and quantification of toxic agents in the
body. There are four essential disciplines within forensic toxicology: human
performance investigation, doping control, workplace drug testing, and postmortem
investigations.9
1.2.1 Human Performance Toxicology
Human performance toxicology is concerned with identifying the presence and
concentration of drugs and chemicals which are known to affect the way a person reasons
and behaves. Identifying the presence of these chemicals can aid in different types of
investigations ranging from collision investigations where a driver is suspected to have
been impaired, to drug facilitated crimes such sexual assault cases, and even to child
welfare cases. The primary analytical targets of these investigations tend to be alcohol
and drugs of abuse.
1.2.2 Doping Control
In competitive sports, using certain performance enhancing substances is illegal
and is regulated and monitored by organizations like the World Anti-Doping Agency
2
(WADA). While most of these drugs have legitimate medical application, banning their
use provides a level playing field for athletes and protects their health. These substances,
which include steroids, diuretics, and stimulants, are generally not illegal for the general
public, but because of the rules and regulations of the professional sports associations,
detecting them in athletes can have legal consequences.9
1.2.3 Workplace Drug Testing
In 1988, Congress passed the Drug-Free Workplace Act that mandates that federal
employees or employees of a company operating on federal money are prohibited from
using recreational drugs. Many other companies and organizations, especially those
where workers preform potentially dangerous tasks, have chosen to comply with these
standards in order to promote workplace safety. Before being hired and during random
screenings, employees will give a urine sample which is typically screened for five major
classes of abused drugs.9 If a toxicologist identifies the presence of one of these drugs,
there can be occupational and legal consequences for the parties involved.
1.2.4 Postmortem Investigations
The toxicity of a chemical can produce adverse effects ranging anywhere from a
headache or a rash to loss of fine motor skills or blindness. In the most severe cases,
however, the toxicity of a substance or the dose administered is so extreme that it results
in coma or death. In death investigation cases, also known as postmortem investigations,
toxicologists work with medical examiners and coroners to help determine cause and
manner of death. Unlike in other areas of toxicology, toxicologists investigating
postmortem cases must consider a wide range of compounds instead of a small, targeted
list. In these cases, toxicologists are presented with a sample that is truly unknown and is
presented with the difficult job of detecting, identifying, and quantifying any and all
possible toxicants present within any given sample.
3

1.3 Analytical Strategy
The analytical strategies employed by a forensic toxicologist are often dictated by
practicality rather than ideology. Legal goals, limitations within the laboratory, and the
circumstances surrounding a case all shape how each sample is processed. Individual
labs determine an analytical strategy that is fit for the purpose of each case and is an
effective use of the time, money, and resources available to it. In theory, there are two
basic analytical strategies: targeted analysis and general unknown screening. In practice,
however, many laboratories operate on a hybrid of these methods and use a two-fold
method of screening and confirmatory testing.
1.3.1 Targeted Analysis
In cases where there are a finite number of compounds of interest, such as in doping
control or workplace drug testing, a targeted, or directed analytical approach may be
used. The result of this type of analysis is a list of compounds whose presence in a
sample is either confirmed or excluded at certain concentrations. The list of targets
analyzed can range from a handful of compounds to several hundred compounds.
Targeted analysis is widely employed in forensic laboratories for a number of
reasons. First, forensic toxicology is not an isolated science; it occurs in context. There
is often non-analytical information that can serve as a jumping off point for the
toxicological examination. If a known drug abuser’s body is found surrounded by
paraphernalia, a lot of time and money can be saved by first testing for the abused drugs
suggested by the investigation. Another reason that targeted analysis is widely used is
that a very small number of compounds are typically responsible for death in the majority
of postmortem cases. One laboratory reported that 70% of fatal drug poisoning cases in
their lab were the result of the less than 30 individual drugs.10
Even though only a few dozen compounds are commonly encountered in typical
forensic toxicology cases, the list of potential toxic substances is practically limitless.
Additionally, new designer drugs are continually developing, and toxicology laboratories
are responsible for detecting them, even if it is a new drug that has never been seen
before. Because of this, toxicology laboratories cannot solely rely on targeted analytical
4

techniques, and must incorporate methods to detect a broad range of compounds that are
either new or not commonly encountered in typical case work.
1.3.2 General Unknown Screening
The alternative analytical approach to targeted analysis is untargeted analysis, also
known as general unknown screening (GUS). The daunting task of untargeted analysis is
to identify any and all potentially harmful substances, even when their identity is
unknown and their presence is uncertain11. In order to provide a framework for
untargeted analysis, toxicologists utilize what is known as systematic toxicological
analysis (STA), as a guide through the analytical process.
The International Association of Forensic Toxicologists’ Committee of Systematic
Toxicological Analysis defines systematic toxicological analysis as, “the application of
an adequate analytical strategy for the detection and identification of as many as possible
potentially toxic compounds and their metabolites in biological samples.”12 The goal of
STA is to use a panel of analytical techniques to detect, identify, and if necessary,
quantify a very broad range of targets. A few decades ago, this approach meant throwing
a sample through every test the lab was capable of because techniques were not as
selective or sensitive as they are today.13
Modern advances in instrumentation and computational software are opening doors
to make general unknown screening a much more viable option. In mass spectrometry,
data-dependent, or information-dependent acquisition modes allow for adaptive data
acquisition. Developments in high-resolution mass spectrometry are also advancing the
field by opening the door for a posteriori data analysis to detect compounds that were not
originally targeted. The downside of GUS is that it is often labor intensive and requires
extensive sample preparation. In its truest form, STA means running a prescribed panel
of tests independently. In practice, toxicologists can save time and money by allowing
the results of each test to help direct further testing instead of running everything
independently.
5

1.3.3 Practical Toxicology
In an effort to use their resources efficiently, most forensic toxicology laboratories
use a two-step process to detect toxicants in biological samples. The first step is
screening, and is analogous to STA in that a variety of analytical procedures are
employed to detect a broad range of targets. The best screening tests require little sample
manipulation, are fast, inexpensive, sensitive, selective, and cover a broad range of
targets. Historically, analysis using immunoassays, liquid chromatography coupled to
ultra-violet detection, and gas chromatography mass spectrometry have been used for
screening purposes, but liquid chromatography mass spectrometry has become a more
common screening technique in recent years.14 Screening tests may be based on multi-
target screening (MTS) or may screen for a certain classification of drugs or toxins, and
are generally qualitative in nature.
After qualitative identification is achieved in the screening process, the second
step a toxicology laboratory will take is confirmatory analysis. This step is analogous to
targeted screening because only those compounds detected in the initial screen are
intentionally analyzed. While screening tests are used to detect toxins, confirmatory
analysis focuses on identifying and quantifying them. According to the guidelines
published by the Society of Forensic Toxicologists in conjunction with the American
Academy of Forensic Science, a confirmatory test should be more specific than the
screening test and based upon a different chemical principal.15
1.4 The Need for Something New
Traditionally, toxicology laboratories performing postmortem analyses use
immunoassays, gas chromatography either alone or coupled with mass spectrometry, or
liquid chromatography with ultra-violet detection to perform their screening tests. Each
of these techniques suffer from various limitations including lack of specificity, difficulty
of incorporating new targets, and labor intensive sample preparation and instrument
maintenance.
Immunoassays are commonly used for presumptive screening in forensic
toxicology because they are inexpensive, simple, fast, and automatable. Several types of
6

immunoassays are utilized in casework, including: fluorescence polarization
immunoassays (FPIA), radioimmunoassays (RIA), enzymemultiplied immunoassay
technique (EMIT), kinetic interaction of microparticles in solution (KIMS), and
enzymelinked immunosorbent assays (ELISA).16 Immunoassays are good at detecting a
class of compounds, but have poor specificity due to the cross reactivity of the binding
sites of the antibodies, which prohibits immunoassays from being used to identify
specific compounds. In order for immunoassays to provide a broad range of coverage,
several analyses have to be run, and it is difficult to add new targets into these analyses.
Even in multiplex systems, the coverage provided by immunoassays is far from
comprehensive and they have a problematic false positive rate which can waste a
laboratory’s time and resources by unnecessarily routing truly negative samples to
confirmatory testing.
Gas chromatography, typically coupled with mass spectrometry (GC-MS) has
typically been considered the so-called “gold standard” for toxicological analysis. Gas
chromatography is able to separate compounds well, and when it is coupled with mass
spectrometry, the technique gains a high level of specificity. GC-MS also benefits from
being able to compare laboratory generated results to externally generated libraries and
databases due to the reproducible ion fragmentation that is produced when using a hard
ionization technique like electron impact. While GC-MS is an excellent analytical
process for confirmatory testing, its use as a screening test is less than ideal because of
the labor and time involved in sample preparation. Because only volatile, thermally-
stable compounds can be analyzed via GC-MS, sample clean up, extraction, and
derivatization is often necessary. Sample preparation in GC-MS will vary depending on
the analytes of interest, making it necessary to use several different derivatizations to
provide adequate coverage, making GC-MS a labor and time intensive option for
postmortem toxicological screening.14
Liquid chromatography with ultra violet detection (LC-UV) has historically been
used as a screening technique, but has recently been fading in popularity due to its
limitations. LC-UV can require long run times for peak resolution and does not have
good specificity. Instead of LC-UV, more toxicology laboratories are currently opting to
run high performance liquid chromatography coupled with mass spectrometry (HPLC-
7
MS). HPLC-MS has good sensitivity and specificity, especially when high resolution or
tandem mass spectrometry is used. It is also able to screen for a broad spectrum of
analytes, and is not limited to volatile or thermally stable compounds like GC-MS.
Because of this, HPLC-MS is rapidly gaining prominence in toxicology laboratories for
confirmatory testing.14 Its use as a screening technique, however, is less ideal for several
reasons. First, HPLCs are comparatively expensive, which limits their use in public
laboratories where funding is tight. This problem is compounded by the fact that HPLCs
require much more oversite than most instruments in order to keep them functioning
properly. When using an HPLC system, a lot of time and expertise is spent
troubleshooting leaks and fluctuating backpressure, monitoring retention shifts, and
preventing carryover and column degradation. The oversight and money necessary to
implement HPLC-MS into routine screening testing is often beyond the capabilities of
small laboratories, and even when using HPLC-MS is a viable option, the time spent in
sample preparation makes HPLC-MS much better suited for confirmatory analysis rather
than for initial screening.
The use of immunoassays, GC-MS, LC-UV, and HPLC-MS in conjunction with
one another is an effective way for toxicology laboratories to detect a broad range of
compounds commonly encountered in postmortem cases, however, they represent a
significant investment of both time and money in a system that is notoriously strained by
tight budgets and substantial backlogs. It would be advantageous then, if new techniques
could be developed that provided a simpler, faster, and cheaper screening method that
would allow toxicology laboratories to operate more efficiently.
8
2 INTRODUCTION
Paper spray mass spectrometry (PS-MS) is an ambient ionization technique that
drastically simplifies traditional sample preparation, allowing for the rapid analysis of
samples. This technique was first published in 2010 as a new method for detecting drugs
and other small molecules in biofluids.17 Originally, paper spray research was directed
towards dried blood spot analysis,18 but it has since been utilized in areas including:
pharmacokinetic studies,19 food safety,20-23 tissue analysis,24 and the profiling of algae
and bacteria.25,26 The ability of PS-MS to detect drugs and pharmaceuticals has been
widely investigated,27-34 routinely allowing for low to sub-ng/mL limits of
quantitation.16,18,35-38 While the focus of paper spray’s application has historically been
the quantitative analysis of a small panel of targets,16 it may be well suited as an
alternative for toxicological drug screening procedures as well.
2.1 Project Overview
The goal of this project was to develop a PS-MS based method to use as a screening
procedure in postmortem toxicology. In order to narrow down the nearly infinite list of
possible toxic substances that forensic toxicologists may encounter, the original scope for
this project was defined based on consultations with the Axis Forensic Toxicology
(AFT). AFT is a national toxicology lab that processes over 100 postmortem samples a
day, and is accredited by the American Board of Forensic Toxicologists. AFT provided
the project with a list of targets that represent their mid-grade, extended screening panel,
which covers 99.5% of targets they encounter in postmortem investigations.39 They also
provided screening cutoff values for the project that generally fall at the low-end of what
a therapeutic dose of the drug would be. These detection levels have since been raised at
AFT, but will serve as a guide for this project. The compiled list consisted of 154 target
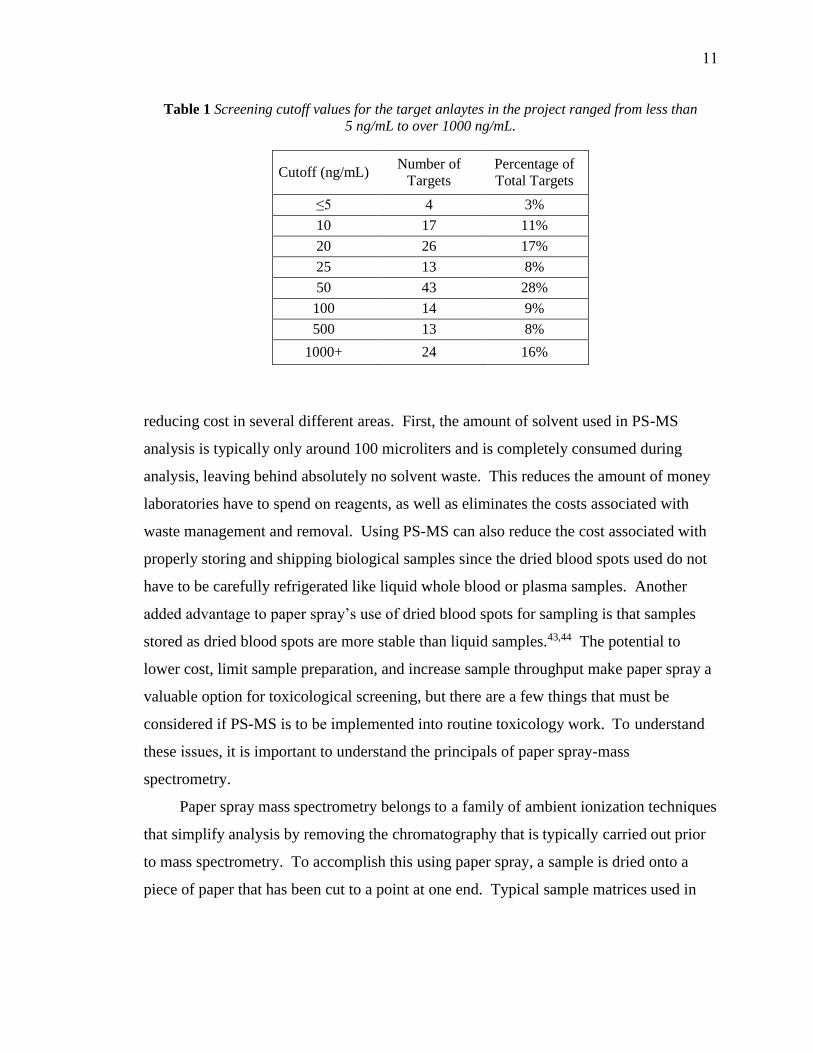
9

compounds (Appendix A) that represent a variety of drugs,
pharmaceuticals, and metabolites. The staked column graph in
Figure 1 describes the relative representation of different
classes of compounds within the list of analytical targets.
Classes of targets represented in the “other” category include:
amphetamines, cannabinoids, cocaine, fentanyl,
gastrointestinal, methadone, neurologicals, stimulants, and
urologicals. The screening cutoff levels for these targets set by
AFT range from 1 to 30,000 ng/mL and are summarized in
Table 1.
2.2 Paper Spray-Mass Spectrometry
Using paper spray (PS) as a new approach to drug
screening may allow toxicology laboratories to operate more
efficiently for several reasons. First, paper spray would allow
for faster data turnaround by eliminating the time spent in
sample cleanup and pretreatment, and by shortening analytical
run times. Being a direct analysis technique, there is no sample
preparation for PS analysis, and run times are typically less
than two minutes. Comparatively, the currently employed
methods of GC-MS, IA’s, or LC-MS have analytical run times
of 10 minutes to upwards of an hour,40-42 without considering
the time spent in sample clean up and derivatization. The
disposable paper substrate used in PS-MS analysis would also
allow laboratories to recover the time that is currently spent
troubleshooting by eliminating problems caused by carryover,
clogs, and leaks.
Another reason that developing a PS-MS method for
toxicological screening would be advantageous is that it
provides a cheaper alternative to current techniques by
Other
Antidepressants
Analgesics
Benzodiazepines
Anticonvulsants
Cardiovascular
Antipsychotics
Barbiturates
Sedatives
Opiates
Anesthetics
Narcotics
Antihistamines
Barbiturates
Figure 1 Drug classes
represented in this
project. The size of
each block is
proportional to the
number of targets in
that class
10
reducing cost in several different areas. First, the amount of solvent used in PS-MS
analysis is typically only around 100 microliters and is completely consumed during
analysis, leaving behind absolutely no solvent waste. This reduces the amount of money
laboratories have to spend on reagents, as well as eliminates the costs associated with
waste management and removal. Using PS-MS can also reduce the cost associated with
properly storing and shipping biological samples since the dried blood spots used do not
have to be carefully refrigerated like liquid whole blood or plasma samples. Another
added advantage to paper spray’s use of dried blood spots for sampling is that samples
stored as dried blood spots are more stable than liquid samples.43,44 The potential to
lower cost, limit sample preparation, and increase sample throughput make paper spray a
valuable option for toxicological screening, but there are a few things that must be
considered if PS-MS is to be implemented into routine toxicology work. To understand
these issues, it is important to understand the principals of paper spray-mass
spectrometry.
Paper spray mass spectrometry belongs to a family of ambient ionization techniques
that simplify analysis by removing the chromatography that is typically carried out prior
to mass spectrometry. To accomplish this using paper spray, a sample is dried onto a
piece of paper that has been cut to a point at one end. Typical sample matrices used in
Table 1 Screening cutoff values for the target anlaytes in the project ranged from less than
5 ng/mL to over 1000 ng/mL.
Cutoff (ng/mL) Number of
Targets
Percentage of
Total Targets
≤5 4 3%
10 17 11%
20 26 17%
25 13 8%
50 43 28%
100 14 9%
500 13 8%
1000+ 24 16%
11
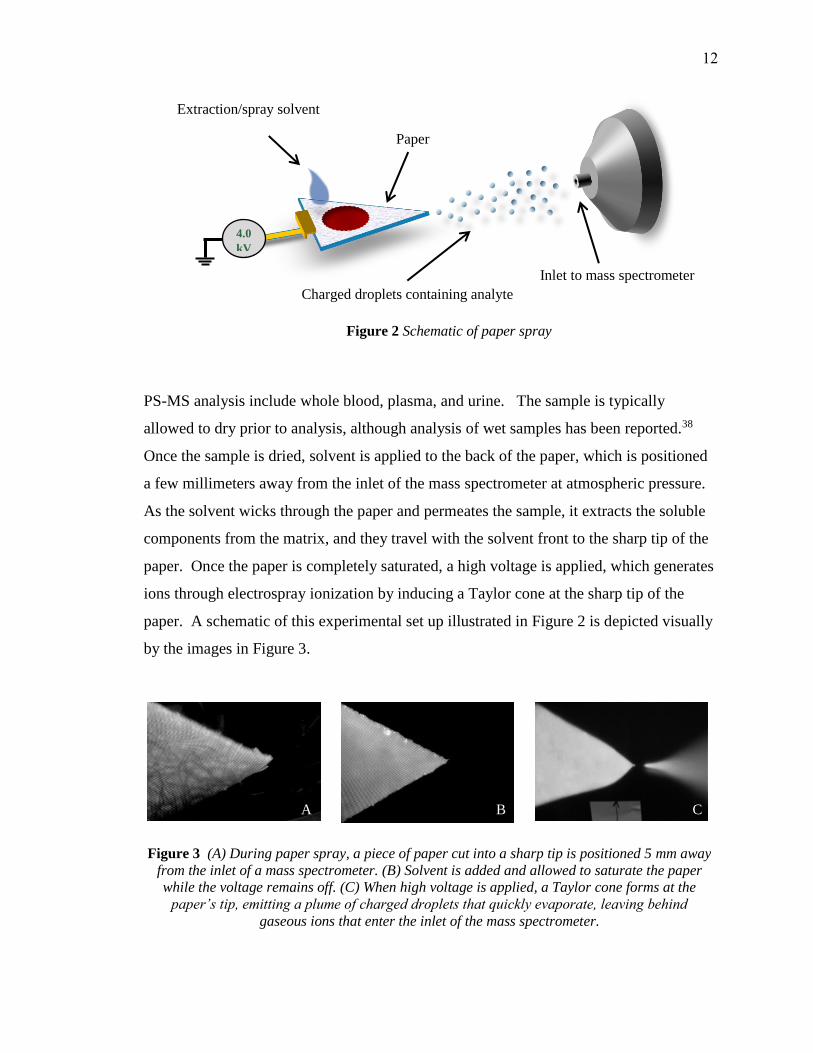
PS-MS analysis include whole blood, plasma, and urine. The sample is typically
allowed to dry prior to analysis, although analysis of wet samples has been reported.38
Once the sample is dried, solvent is applied to the back of the paper, which is positioned
a few millimeters away from the inlet of the mass spectrometer at atmospheric pressure.
As the solvent wicks through the paper and permeates the sample, it extracts the soluble
components from the matrix, and they travel with the solvent front to the sharp tip of the
paper. Once the paper is completely saturated, a high voltage is applied, which generates
ions through electrospray ionization by inducing a Taylor cone at the sharp tip of the
paper. A schematic of this experimental set up illustrated in Figure 2 is depicted visually
by the images in Figure 3.
Inlet to mass spectrometer
Charged droplets containing analyte
Paper
4.0
kV
Extraction/spray solvent
Figure 2 Schematic of paper spray
Figure 3 (A) During paper spray, a piece of paper cut into a sharp tip is positioned 5 mm away
from the inlet of a mass spectrometer. (B) Solvent is added and allowed to saturate the paper
while the voltage remains off. (C) When high voltage is applied, a Taylor cone forms at the
paper’s tip, emitting a plume of charged droplets that quickly evaporate, leaving behind
gaseous ions that enter the inlet of the mass spectrometer.
B C A
12
The data that is generated though PS-MS analysis looks different than typical front-
end chromatography techniques, although it is processed similarly. Because there is no
intentional chromatography performed during PS-MS analysis, the term “chromatogram”
is a misnomer in this application. Instead, the word “chronogram” is used to describe the
ion signal over time. In typical chromatography based methods, ion signals appear as
more or less Gaussian peaks. As shown in the chronogram in Figure 4, the “peaks”
produced by PS-MS do not follow this trend. As soon as a high voltage is applied, the
analytes extracted by the spray solvent are ionized and are detected by the mass
spectrometer. As long as the paper remains wet enough to produce an electrospray, the
signal will continue until the voltage is turned off. Much like typical chromatograms,
chronograms are analyzed by quantifying the area under the curve of extracted ion
chronograms (XIC) or selected reaction monitoring (SRM) channels.
1 2 3 4 5 6
Rel
ativ
e A
bundan
ce
Time (min)
Voltage On Voltage Off
Figure 4. Unlike typical chromatograms produced in LC-MS, the “peaks” produced
in PS-MS are boxy rather than Gaussian and are called “chronograms”. This is
because essentially no chromatography occurs during PS-MS. When the voltage is
turned on, all extracted ions enter the mass spectrometer at the same time, leading to
an almost instantaneous rise in ion intensity. When the voltage is turned off, the
Taylor cone collapses and ionization stops. An example chronogram of the transition
from m/z 172 -> 119 for gabapentin in blank blood and at 500 ng/mL is depicted.
Voltage On Voltage Off
Blank Gabapentin at 500 ng/mL172 -> 119
13

2.3 Selectivity
Because no chromatography is performed in paper spray, there is a burden of
specificity that is placed on the mass spectrometer. During PS-MS, all compounds that
are extracted by the solvent co-elute, therefore the mass spectrometer must be able to
differentiate compounds with the same nominal mass in order to discriminate between a
target analyte and any of similar mass/charge that could interfere with the signal
produced by the analyte of interest. In PS-MS, this is accomplished by high resolution
mass spectrometry (HR-MS) and/or tandem mass spectrometry. Typical mass
spectrometers that have been used for PS-MS analysis include: ion trap, orbitrap, time-of-
flight, and triple quadrupole mass spectrometers.16
2.3.1 Mass Spectrometer Selection
While a variety of types of mass spectrometers have been used to perform PS-MS
experiments, they are not all suitable for use in forensic toxicology laboratories. Ion trap
mass spectrometers are able to achieve adequate specificity for PS-MS by using their
MSn feature. Because they are tandem in time, however, they are too slow to be used for
screening procedures because of the need to quickly acquire data for a large list of
targets. High resolution mass spectrometry is able to distinguish between co-eluting
compounds based on exact mass measurements. Their high mass resolution reduces the
possibility of interference from non-isomeric compounds, and they also have the unique
feature of being able to retrospectively interrogate data for targets that were not originally
specified. The detection limits on a HRMS are generally higher than on other mass
spectrometers, however, and they are much more expensive to purchase and require daily
calibration. Triple quadrupole (QqQ) mass spectrometers achieve specificity much like
ion traps, in that they are able to discriminate targets by monitoring characteristic
fragment ions. Triple quadrupoles are low resolution instruments and can only measure
mass to about +/- 0.5 m/z units. However, because QqQ’s are tandem in space rather
than time, they are able to quickly scan a large list of targets by using selected reaction
monitoring mode. QqQ’s can also attain adequately low detection limits for toxicological
14

purposes and are more accessible to forensic laboratories due to their lower price.
Because of these reasons, a triple quadrupole mass spectrometer was chosen as the mass
spectrometer to be used during method development in this project.
2.3.2 Fragmentation
When used in selected reaction monitoring (SRM) mode, triple quadrupole
instruments are able to enhance selectivity by using two sets of quadrupoles as mass
filters. The first set of quadrupoles is set to only allow ions within a certain window of
mass-to-charge ratio (m/z) to pass through. This window, normally 0.7 m/z units wide,
filters out all other ions that have been generated by the ionization source. The ions
produced by electrospray ionization and typically selected to pass through the first
quadrupole are the protonated or deprotonated molecular ions ([M + H]+ or [M - H]-) or
small adduct ions, such as potassium, sodium, or ammonium. The ions with the selected
m/z, known as either parent or precursor ions, enter the second set of quadrupoles where
they are bombarded with argon gas. When the ions collide with the gas molecules, they
fragment via Collision Induced Dissociation (CID). The ions produced by this
fragmentation process are known as daughter or product ions. The product ions then
enter the third set of quadrupoles which is used to as a mass filter. In SRM mode, a
characteristic fragment at a specific m/z is specified, and only that fragment is allowed to
pass through the third quadrupole and reach the detector.
A decade ago, the detection of one unique fragment ion was generally seen as
sufficient grounds for quantitative analysis.45 It is more common nowadays, however, to
enhance selectivity even further by monitoring more than one fragment ion per parent
ion. If full specificity is required, the third quadrupole can be operated in full scan mode,
in which case all of the fragments produced in the second quadrupole would be detected.
For most HPLC-MS/MS applications, adequate specificity is generally achieved by
monitoring two fragments for each parent ion. The most abundant of these fragment ions
is referred to as the quantifier ion, while the lesser abundant is termed the qualifier ion.
Typically the two most abundant ions are monitored, however, due to interfering
compounds or matrix effects, other fragments can be monitored instead. Oftentimes,
15
however, the specificity of the chosen fragment ions is not considered due to the
perceived specificity that can be gained by monitoring the ratio between different
fragment ions. The idea behind using fragmentation ratios is that under specified
conditions, a parent ion should fragment reproducibly, and the abundance of the fragment
ions produced under those conditions should be relatively consistent from run to run for a
specific target analyte.
Fragmentation ratios can be established by either taking the ratio of the intensities
of the SRM transitions for each product ion or by taking the ratio of the area under the
curves. There are several conditions under which fragmentation ratios may be obtained.
A common method is to optimize instrumental conditions for each fragment ion
separately and use the resulting ion intensities to calculate the fragmentation ratio. This
method is advantageous when signal to blank response is poor or when interferences are
present, as it provides an optimized signal for each product ion. Another method is to
monitor two fragments under identical conditions. Other methods used include
monitoring the same fragment ion under varying conditions and monitoring fragments
from different precursor ions.45 The use of the later, though, has been discouraged
recently because of indications that asymmetrical signal suppression can interfere with
fragmentation ratios.46 When ionization suppression is present, competitive ionization
within the matrix can hinder analytes from completely ionizing, leading to a less intense
signal.
2.3.3 Selectivity in Paper Spray
By using a triple quadrupole instrument and monitoring a parent ion, two
fragment ions, and the fragment ion ratio, good selectivity is achievable for paper spray
even without the advantage of chromatography. Using this method should allow for
differentiation between structural isomers that fragment differently. For example,
although the isomers methamphetamine and 4-methylamphetamine have the same exact
mass, they fragment uniquely. Methamphetamine undergoes transitions from m/z 150 to
m/z 119 and 91, while 4-methylamphetamine fragments from m/z 150 to ions with m/z
133, 105, 103, 77, and 79.16 While both compounds would produce a parent ion with m/z
150 that would pass through the first set of quadrupoles, the unique fragments generated
16

in the collision cell would allow one compound to be detected without interference from
the other. Even in cases where no unique fragments exist, fragmentation ratios have been
able to distinguish between two isomers.45 Because of this, fragmentation ratios not only
add a level of confidence to compound identification, but can also help differentiate
between otherwise interfering compounds. However, in the case where isomers with
the same nominal mass share the same fragment ions, unique fragments should be used if
possible.
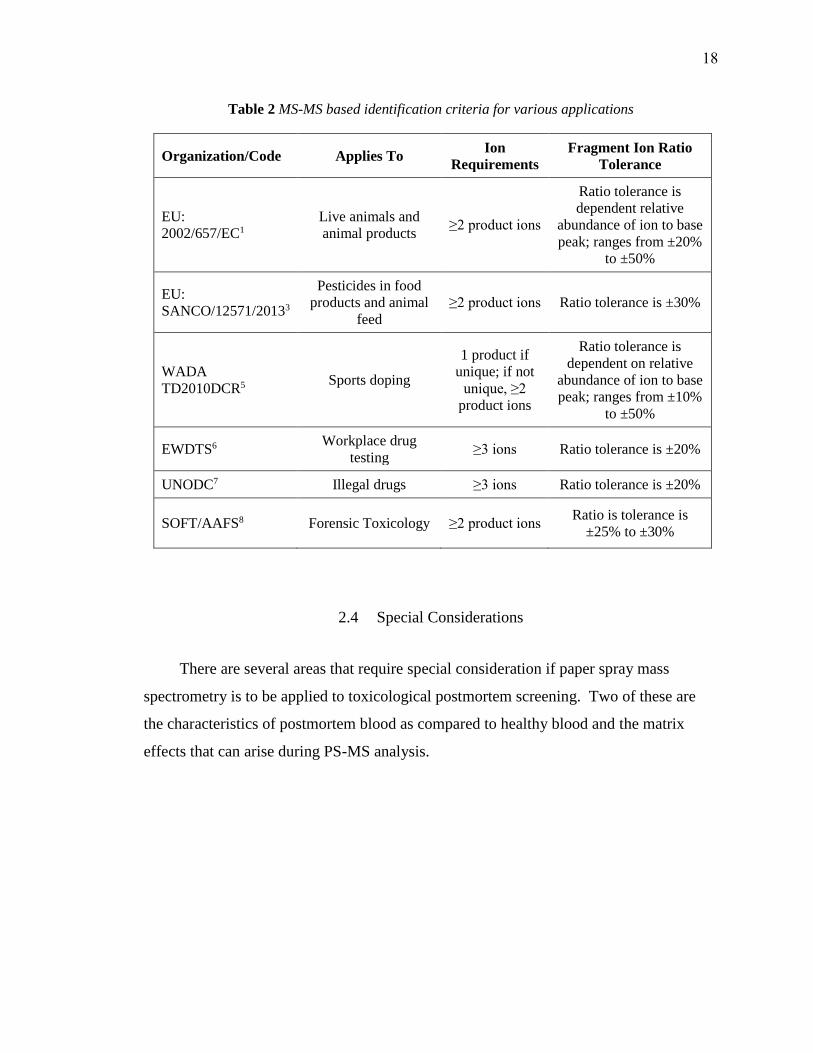
There are several established organizations that use fragments and fragmentation
ratios as the basis for identification. The requirements these organizations have set for
analytical identification using these ratios vary depending on application and have
evolved over time. Some relevant identification criteria for LC-MS based assays are
summarized in Table 2. One thing to consider when looking at these requirements is that
all of these are based on the assumption that chromatography is being performed. With
this, there is the assumption that co-eluting compounds will be somewhat limited, but this
is not the case in paper spray. Some of these organizations acknowledge and sometimes
discourage the use of commonly produced fragment ions, but none of them ban them from
being used for identification purposes. Another variable to note is the tendency to base
the acceptable deviation of the fragment ion ratio on the relative abundance of the two
ions. The precedence for this decision is based on the European Union decision that was
made by a panel of experts in the 90’s.49 Since that time, however, instrumentation has
evolved and fragmentations ratios have been found to be analyte and instrument specific
and vary widely based on concentration and matrix.15,47,50,51 The variability of fragment
ion ratios in some instances has caused some to suggest recently that it is better to simply
rely on the presence or absence of fragment ions for compound identification.52 Many
other authors have suggested a “fitness of purpose” approach that tailors criteria to fit the
analytical specificity needs of each particular project. Using fragmentation ratios in PS-
MS analysis has historically been done to add a level of specificity lost by not preforming
chromatography. During the method development phase of this project, setting the
acceptable tolerances for these ratios will be an area of interest.
17
2.4 Special Considerations
There are several areas that require special consideration if paper spray mass
spectrometry is to be applied to toxicological postmortem screening. Two of these are
the characteristics of postmortem blood as compared to healthy blood and the matrix
effects that can arise during PS-MS analysis.
Table 2 MS-MS based identification criteria for various applications
Organization/Code Applies To Ion
Requirements
Fragment Ion Ratio
Tolerance
EU:
2002/657/EC1
Live animals and
animal products ≥2 product ions
Ratio tolerance is
dependent relative
abundance of ion to base
peak; ranges from ±20%
to ±50%
EU:
SANCO/12571/20133
Pesticides in food
products and animal
feed
≥2 product ions Ratio tolerance is ±30%
WADA
TD2010DCR5 Sports doping
1 product if
unique; if not
unique, ≥2
product ions
Ratio tolerance is
dependent on relative
abundance of ion to base
peak; ranges from ±10%
to ±50%
EWDTS6 Workplace drug
testing ≥3 ions Ratio tolerance is ±20%
UNODC7 Illegal drugs ≥3 ions Ratio tolerance is ±20%
SOFT/AAFS8 Forensic Toxicology ≥2 product ions Ratio is tolerance is
±25% to ±30%
18

2.4.1 Postmortem blood
While this project used single-donor drug free blood, there are several unique
aspects of postmortem blood that will affect this project as it undergoes method
validation. One important, well-recognized phenomenon that continues to be the subject
of current research is the process by which drug concentrations change after death,
known as post-mortem redistribution (PMR). During PMR tissue-bound drugs diffuse
into adjacent blood vessels, increasing the drug concentrations in blood, especially for
basic and lipophilic drugs. The extent of PMR varies with each drug, with some drugs
showing highly time-dependent concentration, while other drug concentrations remain
more or less stable over time.53 Understanding the effects of PMR is one of the most
important considerations for medical examiners in selecting blood sampling sites that are
the truest representation of drug concentrations in the blood at the time of death. If any,
the most likely effect that PRM will have on this project is an increase in basic drug
concentration levels. While exact concentrations are not important for screening
methods, increased concentrations could improve performance for drugs near the limit of
detection when real postmortem blood is used.
Another aspect for consideration is the difference in matrix effects between ante-
mortem and post-mortem blood caused by the decomposition process. Saar et al. studied
the differences in matrix effects and liquid-liquid extraction (LLE) efficiency for
antipsychotic drugs in ante-mortem and post-mortem blood. They found considerable
differences in both extraction efficiency and matrix effects between the different types of
blood and suggested that post-mortem methods be validated using drug-free postmortem
blood as opposed to pooled blood bank ante-mortem blood.54 They also found that while
the matrix effects for decomposed post-mortem blood were similar to ante-mortem blood,
they were much more variable. Similarly, Rosano et al found that both the variability of
matrix effects and the ion suppression in post-mortem blood was higher than in bank
blood.55 Because of these differences, Peters et al. echoed Saar’s proposition to use post-
mortem blood in method validation and additionally suggested that non-decomposed
post-mortem blood and decomposed blood be separately evaluated.56
19

In this project, higher variability in drug recovery in post-mortem blood could lead
to a “hit-or-miss” scenario that could require multiple samples to be run in certain cases
where the concentrations are near the limit of identification. Higher ion suppression
could also be problematic for targets that either do not ionize well or exist at low
concentrations. Both of these could potentially be somewhat counteracted by pre-
concentration techniques, such as integrating SPE, as described by Zhang et al.57
2.4.2 Matrix Effects
Matrix effects are a common phenomenon which cause instrumental response to be
altered due to components within the matrix in which the analyte is contained. Both the
ionization technique and the analytical separation technique can affect which matrix
effects are observed. For example, electrospray ionization is more affected by matrix
effects than atmospheric-pressure chemical ionization.56 In chromatography-based
techniques like GC and LC, matrix effects commonly arise from co-eluting compounds
and can cause either ion suppression or ion enhancement. This issue is compounded
even further for non-chromatography based techniques like paper spray due to the fact
that all compounds elute simultaneously.
There are two principal forms of matrix effects that affect the performance of paper
spray mass spectrometry: recovery and ion suppression. Recovery refers to the
percentage of the analyte that is extracted from the matrix. Ion suppression occurs when
ionization efficiency for an analyte is lowered due to competitive ionization between the
analyte and other co-extracted matrix components. Factors that influence competitive
ionization include: access to a droplet’s surface during electrospray, surface tension of
the solvent, sample pH, and compound polarity.58 Both of these affect the amount of ions
that reach the mass spectrometer and are therefore available for detection. As such, they
have a direct effect on the limits of detection.
Ion suppression and recovery depend on both the specific analyte of interest and the
matrix from which the analyte is extracted. The spray solvent used will also play a role
in ion suppression and recovery based on how soluble the analyte and potentially co-
extracted matrix components are in the solvent system. Out of the typical biofluids
20
analyzed in PS-MS (urine, plasma, and whole blood), blood has been reported to
typically have the lowest recovery. This is offset, however, by the fact that ion
suppression is generally lowest in blood.18,59 One study investigated the donor-
dependency of ion suppression and recovery in blood using PS-MS and found that neither
were significantly different in the 33 patient samples that were tested.60 This suggests
that within whole blood samples, the variability of matrix effects will be due mostly to
compound-specific qualities.
Compounds that are known to ionize well in paper spray are hydrophobic
molecules with basic aliphatic amine groups.18 These compounds do not suffer from ion
suppression nearly as much as poor ionizers.59 Poor ionizers are hydrophilic (logP >~2)
and lack basic aliphatic amine groups. Out of the 154 targets in this project, 48 do not
have aliphatic amines and 97 have logP values that are greater than two. That means that
64% of the targets have the potential to ionize poorly. However, only 15% of the targets
are both hydrophobic and lack a basic aliphatic amine.
The challenge to drug recovery in this project will be in maintaining the simplicity
of the process. Recovery may be improved by optimizing the solvent system, but using
multiple solvent systems would add time to the analytical process. However, even if
multiple solvents must be run for full target coverage, the time required for PS-MS would
still be competitive with current screening techniques. One of the challenges for the
project, then, is to find a solvent system that efficiently extracts as many targets as
possible at relevant concentrations while minimizing the possibility of extracting
interfering compounds from the matrix. Ion suppression is also a potential problem,
especially for poor ionizers with low target cutoff concentrations. Incorporating a pre-
concentration technique with PS-MS has been shown to improve signal in some of these
cases and is an option to help improve detection in future method development.57
21
While recovery and ion suppression are the primary matrix effects of concern in
paper spray, other minor effects could play a role in this project, one of which is the
formation of protomers. Protomers are ions that differ only by the site at which they are
protonated. Where the proton is attached to the molecule is determined by the chemical
environment, and solvent composition has been suggested as a contributing factor.61
Solvent characteristics that have been found to influence the formation of protomers
include: pH, aqueous-organic ratio, and ionic strength.62
22
3 MATERIALS AND METHODS
3.1 Chemicals and Reagents
Analytical grade methanol, acetic acid, and water were purchased from Fisher
Scientific (Hampton, NH, USA). All targets (Appendix A) were purchased as standards
from Cerilliant (Reston, VA, USA) with the exception of: acetaminophen, metaxalone,
salicylic acid, etomidate, carbamazepine, valproic acid, fluvoxamine, hydroxyzine,
aripiprazole, secobarbital, amlodipine, papaverine, metoclopramide, benztropine,
donepezil, ropinirole, methocarbamol, bupivacaine, levetiracetam, and labetalol, which
were purchased from Sigma–Aldrich (St. Louis, MO, USA). Drug-free human blood was
collected in K2EDTA blood collection tubes from a single donor. Both analytes and
blood were stored at -20°C.
3.2 Mass Spectrometer and Materials
Experiments for this project were carried out on a triple quadrupole, TSQ Vantage
mass spectrometer (Thermo Scientific, San Jose, CA, USA) operated in MS/MS mode.
Manually run experiments were performed using an in-house designed cartridge (Figure
5-A) and Whatman grade 31ET chromatography paper purchased from Whatman
(Piscataway, NJ, USA). A TM-200 miniature CCD camera was purchased from JAI
PULNiX (San Jose, CA, USA) and used to visually monitor paper and electrospray
quality during manual experiments. Automated experiments were run using a Velox 360
sample handling and ionization source and Velox sample cartridges (Figure 5-B) from
Prosolia, Inc. (Indianapolis, IN, USA).
3.3 Method
Two sets of methods were used during this project. Method development and initial
testing were done using the manual method outlined below. After a functional method
was developed using the manual method, the parameters were used to inform a method
that used an automated ionization source and disposable cartridges.
23

For both the manual and automated experiments, analytical targets were combined
together from their original stocks into 13 different cocktail solutions according to
Appendix D. Each cocktail contained anywhere from 8 to 14 target analytes at 20x each
analyte’s target detection concentration. While the analytes were grouped according to
their target detection concentrations, care was taken to ensure isomers were separated
into different cocktails to avoid introducing interferences. The diluent used to bring each
cocktail to the appropriate concentration was 95:5:0.01 methanol:water:formic acid, and
the cocktails were stored at -20° C.
For both the manual and automated methods, 300 µL of drug-free blood was
aliquoted into plastic microcentrifuge tubes and put through two freeze-thaw cycles to try
to mimic the matrix decomposition that may occur in postmortem blood samples. 15 µL
of one of the cocktail solutions was then added to the thawed blood so that the total
organic content was less than or equal to 5%. This helped prevent the blood from
congealing and limited protein precipitation which caused the blood to become
heterogeneous and difficult to pipette. For blanks, 15 µL of 95:5:0.01
methanol:water:acetic acid was added to blank blood to keep organic content consistent
between blank and spiked samples. The samples were then inverted 30 times, and
Figure 5: (A) An in-house designed reusable cartridge was used for manual experiments. Using
this set up 3 µL blood spots were dried onto pentagon-shaped papers hand-cut from Whatman
31ET chromatography paper and inserted into a slot at the front of the cartridge. In this design,
solvent is applied through a well directly over blood spot. (B) Commercial Velox cartridges from
Prosolia were used for automated experiments. In this set up, 12 µL blood spots are dried onto
precut paper stored inside individual disposable cartridges. Solvent is applied into well behind
blood spot and wicks through the paper and blood spot.
A B
24
allowed to incubate for 45 minutes at room temperature before being aliquoted onto
paper.
3.3.1 Manual Method
During manually run experiments, pentagonal papers (Figure 6-B) were razor-cut
from Whatman 31ET chromatography paper to fit into an in-house designed cartridge
(Figure 5-A). After the analytes were incubated in the blood for 45 minutes, the samples
were mixed and 3 µL of blood was used to saturate 3.5mm paper punches
(Figure 6-A) and allowed to dry at room temperature for two hours.
For analysis, the pentagonal papers were loaded though the side slot in the cartridge
and then the dried blood spots were placed on top of the paper via the well on the top of
the cartridge. The solvent system 95:5:0.01 methanol:water:formic acid was delivered in
three 15µL aliquots to saturate the paper and then 4000 V was applied through a metal
contact to induce electrospray. Data was collected for 60 s for each sample, and four
replicate dried blood spots were run for each target cocktail. Between each sample, the
voltage was turned off, and the cartridge was rinsed with methanol and air dried before
loading the next sample. Replicate samples were run in succession followed by replicate
blanks.
10 mm
5 mm
5 mm
B
3.5 mm
3 µL
A
12 µL
C
Figure 6 (A) Using the manual method, 3 µL of whole blood was used to saturate a 3.5 mm
round paper punch (B) Pentagonal paper was hand-cut with razor blades and the dried blood
spot was placed on top of the paper. (C) The automated method utilized a larger, different
shaped paper design than the manual method. This precut paper was housed in single-use
Prosolia cartridges and 12 µL of whole blood was directly applied to the paper for analysis.
25
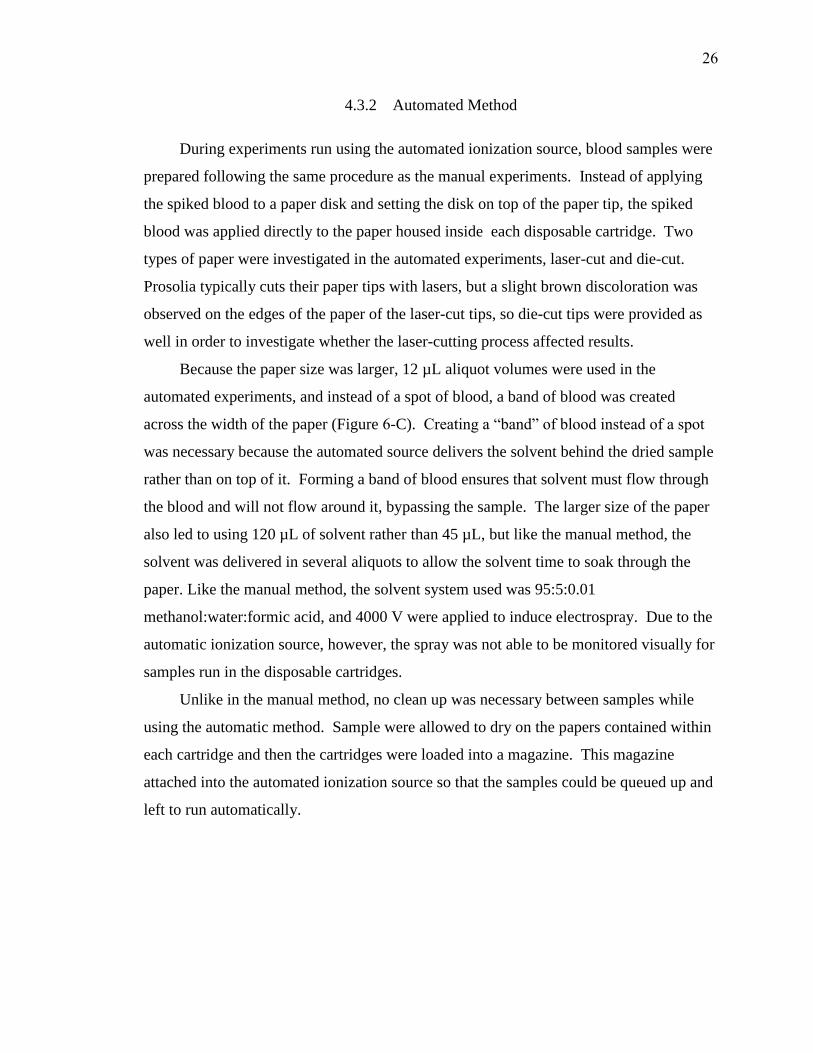
4.3.2 Automated Method
During experiments run using the automated ionization source, blood samples were
prepared following the same procedure as the manual experiments. Instead of applying
the spiked blood to a paper disk and setting the disk on top of the paper tip, the spiked
blood was applied directly to the paper housed inside each disposable cartridge. Two
types of paper were investigated in the automated experiments, laser-cut and die-cut.
Prosolia typically cuts their paper tips with lasers, but a slight brown discoloration was
observed on the edges of the paper of the laser-cut tips, so die-cut tips were provided as
well in order to investigate whether the laser-cutting process affected results.
Because the paper size was larger, 12 µL aliquot volumes were used in the
automated experiments, and instead of a spot of blood, a band of blood was created
across the width of the paper (Figure 6-C). Creating a “band” of blood instead of a spot
was necessary because the automated source delivers the solvent behind the dried sample
rather than on top of it. Forming a band of blood ensures that solvent must flow through
the blood and will not flow around it, bypassing the sample. The larger size of the paper
also led to using 120 µL of solvent rather than 45 µL, but like the manual method, the
solvent was delivered in several aliquots to allow the solvent time to soak through the
paper. Like the manual method, the solvent system used was 95:5:0.01
methanol:water:formic acid, and 4000 V were applied to induce electrospray. Due to the
automatic ionization source, however, the spray was not able to be monitored visually for
samples run in the disposable cartridges.
Unlike in the manual method, no clean up was necessary between samples while
using the automatic method. Sample were allowed to dry on the papers contained within
each cartridge and then the cartridges were loaded into a magazine. This magazine
attached into the automated ionization source so that the samples could be queued up and
left to run automatically.
26
4 METHOD DEVELOPMENT
Several preliminary sets of experiments were run for method development.
These included a series of experiments to optimize the solvent system, paper layout, and
sample loading. Experiments were also run to select appropriate SRM channels for each
target analyte, establish the amount of data needed to reliably represent results, and to
establish acceptable fragment ion ratio tolerances.
4.1 Solvent Selection
Solvent selection is the primary means though which both selectivity and sensitivity
are manipulated during paper spray experiments. One of the challenges in this project
was to find one solvent mixture that could effectively extract and spray the entire panel of
analytical targets. Typically, paper spray solvents are mostly organic in composition,
which allows hydrophobic small molecules like drugs to be extracted while the
hydrophilic matrix components remain trapped on the paper. Examples of commonly
used extraction/spray solvents include 90:10 methanol:water and 90:10
acetonitrile:water.18 Oftentimes, acetic acid or formic acid is added as a solvent modifier
at approximately 0.01% to help encourage the formation positively charged ions and to
increase spray stability. In negative mode, ammonium hydroxide can be used to
encourage the formation of deprotonated ions.
In order to choose a spray solvent for this project, a subset of 16 targets was chosen
to represent a range of target cutoff levels, hydrophobicities, and ionizabilities. A set of
two-solvent systems made by combining either methanol, acetonitrile, ethanol,
isopropanol, water, dichloromethane, or tetrahydrofuran were made in proportions of
35:65, 40:60, 50:50, 65:35, and 95:5 and included 100 ppm acetic acid as a solvent
modifier to encourage positive ion formation. This yielded 47 different solvent
combinations that were tested on the subset of 16 targets that were spiked at their cutoff
concentrations into blood. Observations for some of these solvent systems can be found
in Table 3.
27
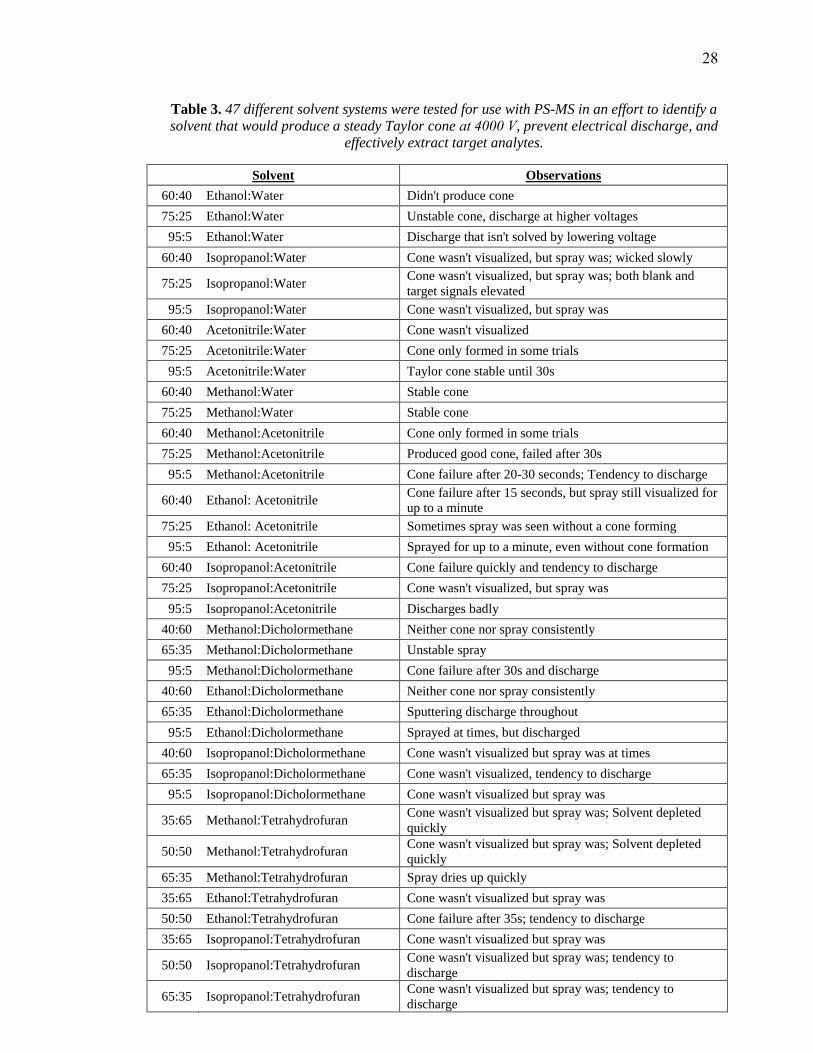
Table 3. 47 different solvent systems were tested for use with PS-MS in an effort to identify a
solvent that would produce a steady Taylor cone at 4000 V, prevent electrical discharge, and
effectively extract target analytes.
Solvent Observations
60:40 Ethanol:Water Didn't produce cone
75:25 Ethanol:Water Unstable cone, discharge at higher voltages
95:5 Ethanol:Water Discharge that isn't solved by lowering voltage
60:40 Isopropanol:Water Cone wasn't visualized, but spray was; wicked slowly
75:25 Isopropanol:Water Cone wasn't visualized, but spray was; both blank and
target signals elevated
95:5 Isopropanol:Water Cone wasn't visualized, but spray was
60:40 Acetonitrile:Water Cone wasn't visualized
75:25 Acetonitrile:Water Cone only formed in some trials
95:5 Acetonitrile:Water Taylor cone stable until 30s
60:40 Methanol:Water Stable cone
75:25 Methanol:Water Stable cone
60:40 Methanol:Acetonitrile Cone only formed in some trials
75:25 Methanol:Acetonitrile Produced good cone, failed after 30s
95:5 Methanol:Acetonitrile Cone failure after 20-30 seconds; Tendency to discharge
60:40 Ethanol: Acetonitrile Cone failure after 15 seconds, but spray still visualized for
up to a minute
75:25 Ethanol: Acetonitrile Sometimes spray was seen without a cone forming
95:5 Ethanol: Acetonitrile Sprayed for up to a minute, even without cone formation
60:40 Isopropanol:Acetonitrile Cone failure quickly and tendency to discharge
75:25 Isopropanol:Acetonitrile Cone wasn't visualized, but spray was
95:5 Isopropanol:Acetonitrile Discharges badly
40:60 Methanol:Dicholormethane Neither cone nor spray consistently
65:35 Methanol:Dicholormethane Unstable spray
95:5 Methanol:Dicholormethane Cone failure after 30s and discharge
40:60 Ethanol:Dicholormethane Neither cone nor spray consistently
65:35 Ethanol:Dicholormethane Sputtering discharge throughout
95:5 Ethanol:Dicholormethane Sprayed at times, but discharged
40:60 Isopropanol:Dicholormethane Cone wasn't visualized but spray was at times
65:35 Isopropanol:Dicholormethane Cone wasn't visualized, tendency to discharge
95:5 Isopropanol:Dicholormethane Cone wasn't visualized but spray was
35:65 Methanol:Tetrahydrofuran Cone wasn't visualized but spray was; Solvent depleted
quickly
50:50 Methanol:Tetrahydrofuran Cone wasn't visualized but spray was; Solvent depleted
quickly
65:35 Methanol:Tetrahydrofuran Spray dries up quickly
35:65 Ethanol:Tetrahydrofuran Cone wasn't visualized but spray was
50:50 Ethanol:Tetrahydrofuran Cone failure after 35s; tendency to discharge
35:65 Isopropanol:Tetrahydrofuran Cone wasn't visualized but spray was
50:50 Isopropanol:Tetrahydrofuran Cone wasn't visualized but spray was; tendency to
discharge
65:35 Isopropanol:Tetrahydrofuran Cone wasn't visualized but spray was; tendency to
discharge
28
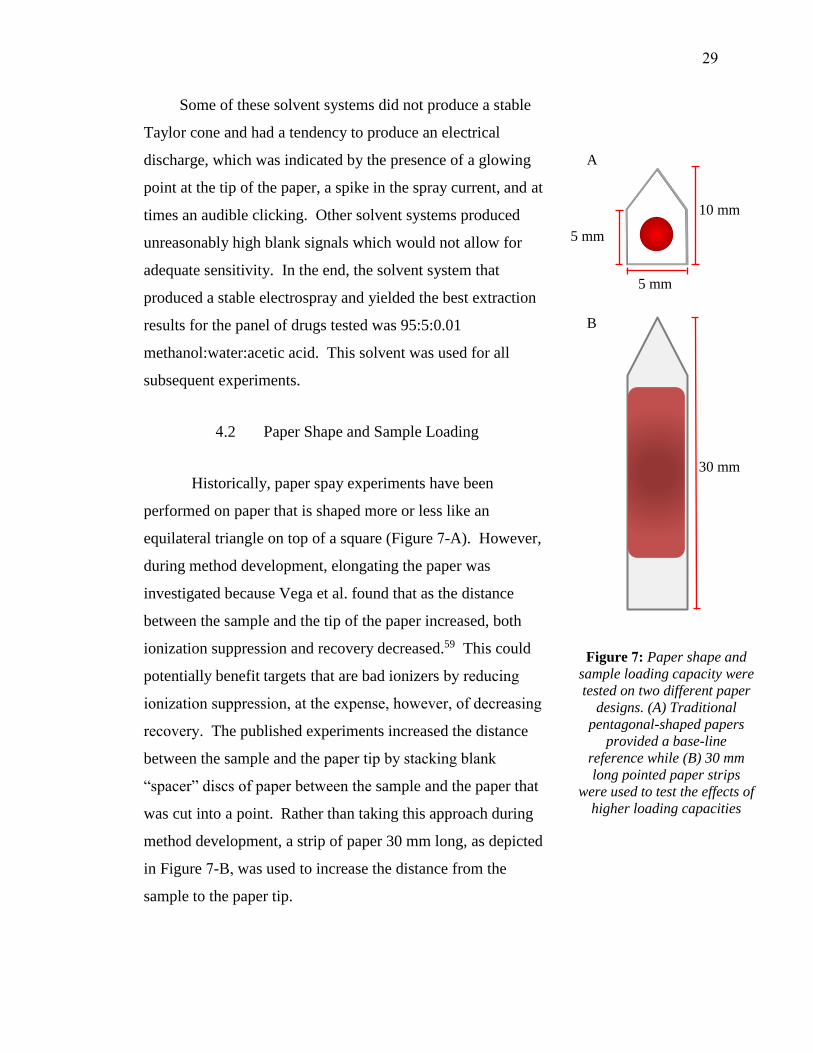
Some of these solvent systems did not produce a stable
Taylor cone and had a tendency to produce an electrical
discharge, which was indicated by the presence of a glowing
point at the tip of the paper, a spike in the spray current, and at
times an audible clicking. Other solvent systems produced
unreasonably high blank signals which would not allow for
adequate sensitivity. In the end, the solvent system that
produced a stable electrospray and yielded the best extraction
results for the panel of drugs tested was 95:5:0.01
methanol:water:acetic acid. This solvent was used for all
subsequent experiments.
4.2 Paper Shape and Sample Loading
Historically, paper spay experiments have been
performed on paper that is shaped more or less like an
equilateral triangle on top of a square (Figure 7-A). However,
during method development, elongating the paper was
investigated because Vega et al. found that as the distance
between the sample and the tip of the paper increased, both
ionization suppression and recovery decreased.59 This could
potentially benefit targets that are bad ionizers by reducing
ionization suppression, at the expense, however, of decreasing
recovery. The published experiments increased the distance
between the sample and the paper tip by stacking blank
“spacer” discs of paper between the sample and the paper that
was cut into a point. Rather than taking this approach during
method development, a strip of paper 30 mm long, as depicted
in Figure 7-B, was used to increase the distance from the
sample to the paper tip.
Figure 7: Paper shape and
sample loading capacity were
tested on two different paper
designs. (A) Traditional
pentagonal-shaped papers
provided a base-line
reference while (B) 30 mm
long pointed paper strips
were used to test the effects of
higher loading capacities
5 mm
10 mm
5 mm
30 mm
A
B
29

4.2.1 Placement of Sample
The first set of experiments run using the long paper studied the effect of the
position of the blood on the paper. To do this, 20 µL of whole blood was loaded at 13,
17, and 22 mm from the tip of the paper. All of the blood was loaded onto the paper at a
single point, resulting in a sample front that was rounded due to the way that the blood
wicked though the paper, but always resulting in bands of blood 11 mm wide. Five
targets (morphine, zolpidem, clonazepam, fentanyl, and buprenorphine) were monitored
during these experiments. The area under the curve for several fragment ions from these
targets was recorded and normalized using the lowest area in order to easily compare
which position produced the strongest signal. The results presented in Table 4 show that
for most of the fragments, the central position at 17 mm produced the highest signal by a
factor of approximately 1.5-2. During these experiments, it was observed that the
cartridge design allowed some of the solvent to wick around the sides of the paper rather
than through the sample, so a new cartridge was designed for future experiments. The
new cartridge supported the length of the paper on small pegs rather than on channeled
grooves on the sides, so that the solvent would be forced though the sample.
4.2.2 Loading Capacity and Blood Dilution
Using the small paper punches, a set of experiments were run to find the effect of
diluting blood, which could improve ion suppression and/or analyte recovery. To this
end, triplicate samples were run at blood:water ratios of 1:0.5, 1:1, 1:5, and 1:10. The
results of the five drugs investigated (morphine, zolpidem, clonazepam, fentanyl, and
buprenorphine) shown in Table 5 indicate that a dilution factor of 1:1 could increase
signal to blank.
Another set of experiments were run using both diluted blood and whole blood on
30mm long paper. The longer paper allows for a larger volume of blood to be loaded
onto the paper, which increases the absolute amount of drug available to be recovered
during paper spray. Therefore, while using the elongated paper, the amount of sample
loaded onto the paper was also investigated. The larger volumes used in these
experiments meant that it was not feasible to position the samples at 17mm from the tip
30

Table 4 Relative AUC of fragment ions at different positions on the long paper strip. The
lowest AUC was normalized to 1.00 for comparative purposes and the position on the paper
strip with the largest AUC is denoted in green.
Position Relative Area Under the Curve
m/z of fragments 152 165 201
Morphine at 40
ng/mL
13 mm 1.00 1.00 1.09
17 mm 1.58 1.48 1.00
21 mm 1.40 1.33 1.02
m/z of fragments 235 92
Zolpidem at 10
ng/mL
13 mm 1.07 1.00
17 mm 1.00 1.12
21 mm 1.37 1.27
m/z of fragments 270 214 241 151 205 206 207 190
Clonazepam 20
ng/mL
13 mm 1.00 1.00 1.00 1.00 1.00 1.00 1.00 1.00
17 mm 1.84 2.19 1.68 1.71 1.92 2.94 2.19 2.64
21 mm 1.29 1.74 1.28 1.07 1.38 1.56 1.53 1.68
m/z of fragments 188 105 79
Fentanyl at 10
ng/mL
13 mm 1.00 1.00 1.00
17 mm 1.07 1.53 1.79
21 mm 1.23 1.30 1.15
m/z of fragments 396 414 101 187 55 211 225
Buprenorphine at
ng/mL
13 mm 1.00 1.00 1.00 1.00 1.00 1.00 1.00
17 mm 2.08 1.92 2.47 1.65 1.81 1.59 2.17
21 mm 1.79 1.55 1.49 1.22 1.23 1.44 1.88
as in previous experiments, since this would cause the sample to wick all the way to the
tip of the paper and inhibit the solvent from spraying. Instead, the front edge of the blood
spot was positioned so that it was always 6mm from the tip of the paper.
When 5µL of whole blood was used, the band of blood produced on the strip of
paper was 6mm long. The same sized blood band was produced when diluted blood was
used as well. The amount of blood used was increased incrementally up to 40µL, which
was found to be the maximum volume of blood that the long paper strips could
accommodate and maintain a good spray. The length of the blood band formed on the
paper increased as the loading volume increased, with the final volume of 40µL
producing a blood band 20mm long. The results of these experiments are presented in
Appendix B and summarized in Figure 8 and Figure 9. The results indicate that the
31
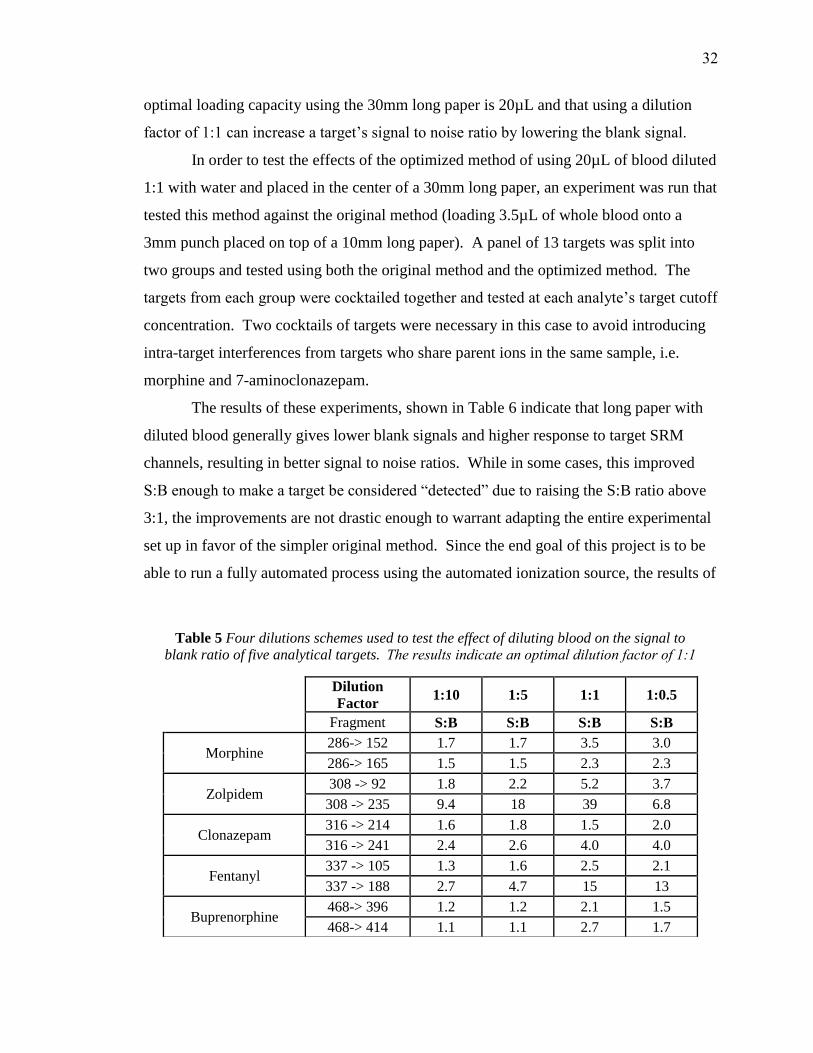
optimal loading capacity using the 30mm long paper is 20µL and that using a dilution
factor of 1:1 can increase a target’s signal to noise ratio by lowering the blank signal.
In order to test the effects of the optimized method of using 20µL of blood diluted
1:1 with water and placed in the center of a 30mm long paper, an experiment was run that
tested this method against the original method (loading 3.5µL of whole blood onto a
3mm punch placed on top of a 10mm long paper). A panel of 13 targets was split into
two groups and tested using both the original method and the optimized method. The
targets from each group were cocktailed together and tested at each analyte’s target cutoff
concentration. Two cocktails of targets were necessary in this case to avoid introducing
intra-target interferences from targets who share parent ions in the same sample, i.e.
morphine and 7-aminoclonazepam.
The results of these experiments, shown in Table 6 indicate that long paper with
diluted blood generally gives lower blank signals and higher response to target SRM
channels, resulting in better signal to noise ratios. While in some cases, this improved
S:B enough to make a target be considered “detected” due to raising the S:B ratio above
3:1, the improvements are not drastic enough to warrant adapting the entire experimental
set up in favor of the simpler original method. Since the end goal of this project is to be
able to run a fully automated process using the automated ionization source, the results of
Table 5 Four dilutions schemes used to test the effect of diluting blood on the signal to
blank ratio of five analytical targets. The results indicate an optimal dilution factor of 1:1
Dilution
Factor 1:10 1:5 1:1 1:0.5
Fragment S:B S:B S:B S:B
Morphine 286-> 152 1.7 1.7 3.5 3.0
286-> 165 1.5 1.5 2.3 2.3
Zolpidem 308 -> 92 1.8 2.2 5.2 3.7
308 -> 235 9.4 18 39 6.8
Clonazepam 316 -> 214 1.6 1.8 1.5 2.0
316 -> 241 2.4 2.6 4.0 4.0
Fentanyl 337 -> 105 1.3 1.6 2.5 2.1
337 -> 188 2.7 4.7 15 13
Buprenorphine 468-> 396 1.2 1.2 2.1 1.5
468-> 414 1.1 1.1 2.7 1.7
32
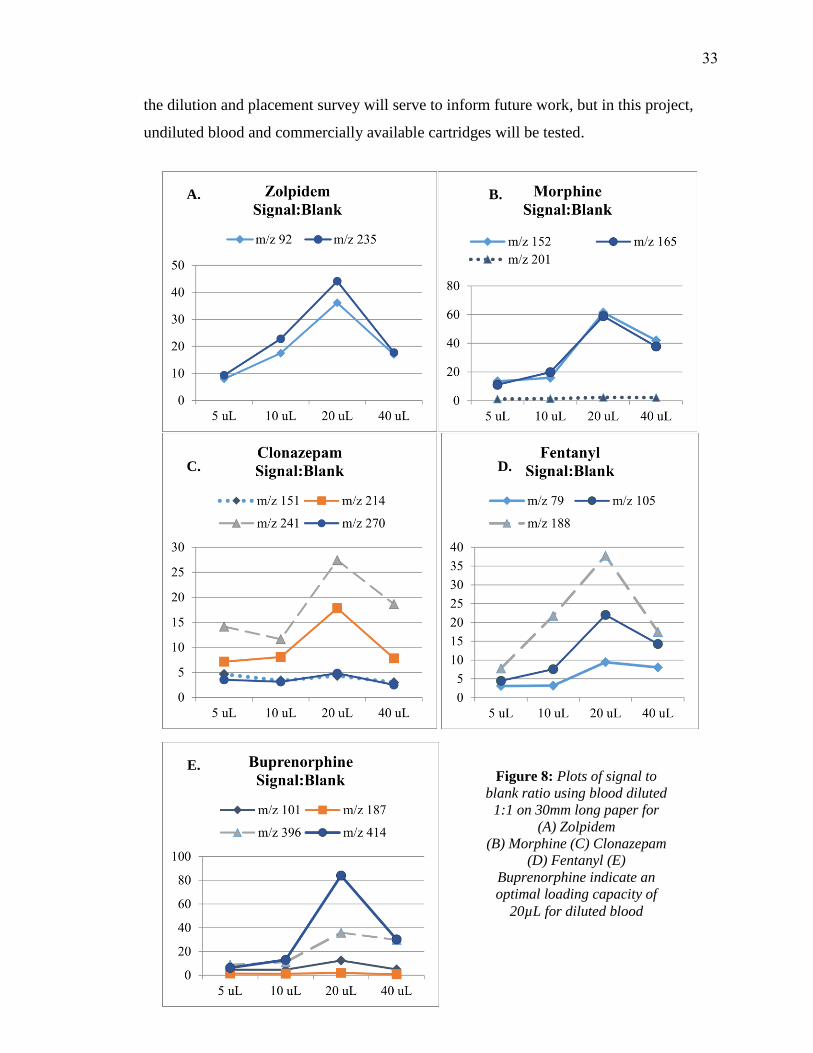
Figure 8: Plots of signal to
blank ratio using blood diluted
1:1 on 30mm long paper for
(A) Zolpidem
(B) Morphine (C) Clonazepam
(D) Fentanyl (E)
Buprenorphine indicate an
optimal loading capacity of
20µL for diluted blood
A. B.
C. D.
E.
the dilution and placement survey will serve to inform future work, but in this project,
undiluted blood and commercially available cartridges will be tested.
33

Figure 9: Plots of signal to blank ratio
using whole blood on long paper for (A)
Zolpidem (B) Morphine
(C) Clonazepam (D) Fentanyl
(E) Buprenorphine. Although the
analytes do not follow the same trend,
they generally show an optimal loading
capacity of ~20µL of whole blood
E.
D. C.
B. A.
34
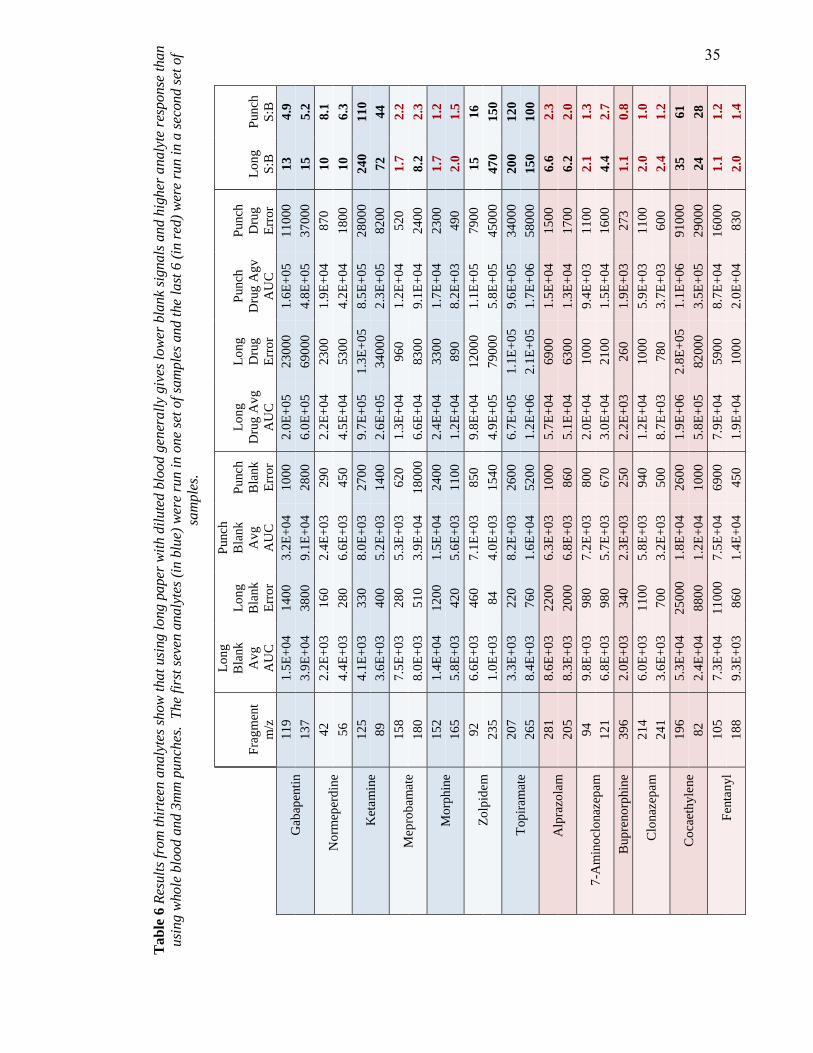
Tab
le 6
Res
ult
s fr
om
thir
teen
an
aly
tes
sho
w t
hat
usi
ng l
ong p
aper
wit
h d
ilute
d b
lood g
ener
all
y giv
es l
ow
er b
lan
k si
gn
als
an
d h
igh
er a
naly
te r
esp
onse
th
an
usi
ng w
hole
blo
od
an
d 3
mm
pu
nch
es. T
he
firs
t se
ven a
naly
tes
(in b
lue)
wer
e ru
n i
n o
ne
set
of
sam
ple
s an
d t
he l
ast
6 (
in r
ed)
wer
e ru
n i
n a
sec
on
d s
et o
f
sam
ple
s.
Fra
gm
ent
m/z
Lo
ng
Bla
nk
Av
g
AU
C
Lo
ng
Bla
nk
Err
or
Punch
Bla
nk
Av
g
AU
C
Punch
Bla
nk
Err
or
Lo
ng
Dru
g A
vg
AU
C
Lo
ng
Dru
g
Err
or
Punch
Dru
g A
gv
AU
C
Punch
Dru
g
Err
or
Lo
ng
S:B
Punch
S:B
Gab
apen
tin
1
19
1.5
E+
04
14
00
3.2
E+
04
10
00
2.0
E+
05
23
000
1.6
E+
05
11
000
13
4.9
13
7
3.9
E+
04
38
00
9.1
E+
04
28
00
6.0
E+
05
69
000
4.8
E+
05
37
000
15
5.2
No
rmep
erd
ine
42
2.2
E+
03
16
0
2.4
E+
03
29
0
2.2
E+
04
23
00
1.9
E+
04
87
0
10
8.1
56
4.4
E+
03
28
0
6.6
E+
03
45
0
4.5
E+
04
53
00
4.2
E+
04
18
00
10
6.3
Ket
am
ine
12
5
4.1
E+
03
33
0
8.0
E+
03
27
00
9.7
E+
05
1.3
E+
05
8.5
E+
05
28
000
24
0
11
0
89
3.6
E+
03
40
0
5.2
E+
03
14
00
2.6
E+
05
34
000
2.3
E+
05
82
00
72
44
Mep
rob
amat
e 1
58
7.5
E+
03
28
0
5.3
E+
03
62
0
1.3
E+
04
96
0
1.2
E+
04
52
0
1.7
2
.2
18
0
8.0
E+
03
51
0
3.9
E+
04
18
000
6.6
E+
04
83
00
9.1
E+
04
24
00
8.2
2
.3
Mo
rphin
e
15
2
1.4
E+
04
12
00
1.5
E+
04
24
00
2.4
E+
04
33
00
1.7
E+
04
23
00
1.7
1
.2
16
5
5.8
E+
03
42
0
5.6
E+
03
11
00
1.2
E+
04
89
0
8.2
E+
03
49
0
2.0
1
.5
Zo
lpid
em
9
2
6.6
E+
03
46
0
7.1
E+
03
85
0
9.8
E+
04
12
000
1.1
E+
05
79
00
15
16
23
5
1.0
E+
03
84
4.0
E+
03
15
40
4.9
E+
05
79
000
5.8
E+
05
45
000
47
0
15
0
Top
iram
ate
20
7
3.3
E+
03
22
0
8.2
E+
03
26
00
6.7
E+
05
1.1
E+
05
9.6
E+
05
34
000
20
0
12
0
26
5
8.4
E+
03
76
0
1.6
E+
04
52
00
1.2
E+
06
2.1
E+
05
1.7
E+
06
58
000
15
0
10
0
Alp
razo
lam
2
81
8.6
E+
03
22
00
6.3
E+
03
10
00
5.7
E+
04
69
00
1.5
E+
04
15
00
6.6
2
.3
20
5
8.3
E+
03
20
00
6.8
E+
03
86
0
5.1
E+
04
63
00
1.3
E+
04
17
00
6.2
2
.0
7-A
min
ocl
onaz
epam
94
9.8
E+
03
98
0
7.2
E+
03
80
0
2.0
E+
04
10
00
9.4
E+
03
11
00
2.1
1
.3
12
1
6.8
E+
03
98
0
5.7
E+
03
67
0
3.0
E+
04
21
00
1.5
E+
04
16
00
4.4
2
.7
Bup
reno
rphin
e
39
6
2.0
E+
03
34
0
2.3
E+
03
25
0
2.2
E+
03
26
0
1.9
E+
03
27
3
1.1
0
.8
Clo
naz
epam
2
14
6.0
E+
03
11
00
5.8
E+
03
94
0
1.2
E+
04
10
00
5.9
E+
03
11
00
2.0
1
.0
24
1
3.6
E+
03
70
0
3.2
E+
03
50
0
8.7
E+
03
78
0
3.7
E+
03
60
0
2.4
1
.2
Co
caet
hyle
ne
19
6
5.3
E+
04
25
000
1.8
E+
04
26
00
1.9
E+
06
2.8
E+
05
1.1
E+
06
91
000
35
61
82
2.4
E+
04
88
00
1.2
E+
04
10
00
5.8
E+
05
82
000
3.5
E+
05
29
000
24
28
Fen
tan
yl
10
5
7.3
E+
04
11
000
7.5
E+
04
69
00
7.9
E+
04
59
00
8.7
E+
04
16
000
1.1
1
.2
18
8
9.3
E+
03
86
0
1.4
E+
04
45
0
1.9
E+
04
10
00
2.0
E+
04
83
0
2.0
1
.4
35

4.3 Tuning
Thermo TSQ Tune Master was used to automatically identify the prominent
fragment ions produced for each analytical target and to optimize instrumental
parameters for those fragments. During tuning, the voltage was set to 4000 V, the
collision gas pressure was held at 1.5 mTorr, and the software was set to exclude
fragments resulting from loss of water and ammonium. From there, the software
optimized instrumental conditions for the parent ion, identified the 4 most intense
fragment ions, and found optimal collision energies (CE) for each fragment ion (Figure
10). For each analyte, it also optimized the S-lens, which focuses the initial gas plume
that enters the inlet of the mass spectrometer into a concentrated beam of ions that enter
the high-vacuum region of the mass
spec.
Initial tuning was
performed using targets
cocktailed in 95:5:0.01
methanol:water:acetic acid at
1ppm and an H-ESI source.
The results generated were the
basis of selecting appropriate
fragment ions and establishing
fragmentation ratios and
instrument parameters for each
analyte. After several
experiments were done, each
analyte was re-tuned by
spraying it in a neat solvent
over blank paper at each
analyte’s respective target
cutoff concentration. This was
Figure 10: An example of some of the data generated from the tuning software. In the curves produced for
Flunitrazepam above, the 4 most intense fragment ions are
plotted against collision energy. Some fragments, like m/z
268 are more sensitive to changes in collision energy, as
is evident in the narrow peak in the curve, while other
fragments with broad peaks, like m/z 183, are less effected
by changes in collision energy.
36
done in part because using a 1ppm solution in some cases saturated the detector, but also
because of experiments performed after the initial tuning where fragmentation ratios were
found to be somewhat concentration dependent. This resulted in a few minor adjustments
of the fragment ions selected and the established fragment ion ratios.
In most cases, the protonated molecular ion was selected as the precursor ion,
although for some targets, like topiramate, a sodiated precursor ion was used. An effort
was made to encourage all targets to ionize positively due to complications that arise
when paper spray is used in negative ionization mode, however, the following targets
were only found at suitable intensities as deprotonated ions: all barbiturates (amobarbital,
butabarbital, butalbital, pentobarbital, phentobarbital, and secobarbital), as well as
furosemide, hydrochlorothiazide, warfarin, ibuprofen, salicylic acid, valproic acid, and
tadalafil.
Although not typically required because of chromatography, in this project the
specificity of the product ions used for identification was considered. In general, the two
most abundant fragments from the automated tuning were selected, as they provide
greatest sensitivity near the limit of detection. However, to enhance selectivity, larger,
more complex fragments were chosen over smaller fragments when possible. Commonly
produced fragments were avoided for compounds with amino side chains including m/z
58, 86, and 100.47 Similarly, the isopropyl side chains present in many cardiovascular
drugs produce common fragments at m/z 43, 60, 116, 98, 74, and 56, which were avoided
if possible.48
In some cases, the most abundant fragment found during tuning was not used
because it caused unacceptably low signal to blank ratios. This is expected in instances
where the most abundant fragment is a commonly produced fragment like those outlined
in Section 2.3.3. In a few instances, the most abundant fragment was not used because it
caused the fragmentation ratios to behave disproportionately over a range of
concentrations. While this was not observed in most cases, an example of this behavior
was seen in the fragmentation of norbuprenorphine and depicted in Figure 10.
Circumstances such as this have lead some to suggest that ratios should be established
near the intended analytical concentration.46 A list of the final parent/fragment ions
chosen, instrumental conditions, and the fragmentation ratios used for each target analyte
in this project can be found in Appendix C.
37
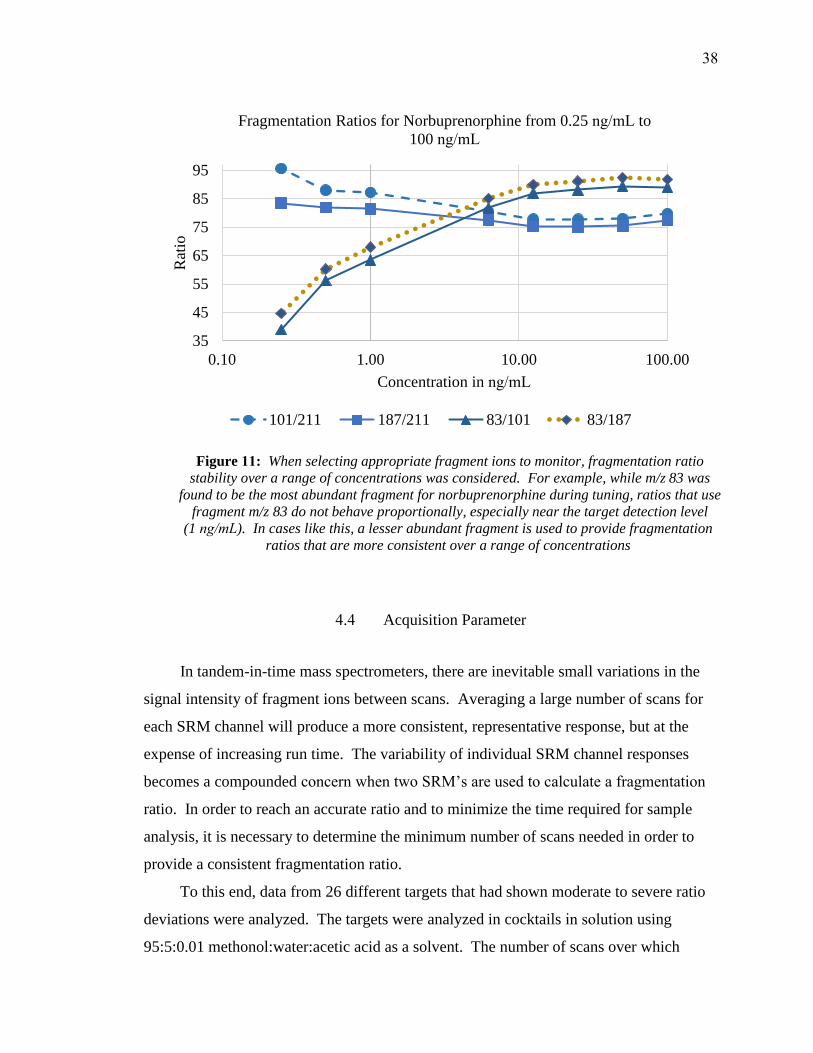
4.4 Acquisition Parameter
In tandem-in-time mass spectrometers, there are inevitable small variations in the
signal intensity of fragment ions between scans. Averaging a large number of scans for
each SRM channel will produce a more consistent, representative response, but at the
expense of increasing run time. The variability of individual SRM channel responses
becomes a compounded concern when two SRM’s are used to calculate a fragmentation
ratio. In order to reach an accurate ratio and to minimize the time required for sample
analysis, it is necessary to determine the minimum number of scans needed in order to
provide a consistent fragmentation ratio.
To this end, data from 26 different targets that had shown moderate to severe ratio
deviations were analyzed. The targets were analyzed in cocktails in solution using
95:5:0.01 methonol:water:acetic acid as a solvent. The number of scans over which
Figure 11: When selecting appropriate fragment ions to monitor, fragmentation ratio
stability over a range of concentrations was considered. For example, while m/z 83 was
found to be the most abundant fragment for norbuprenorphine during tuning, ratios that use
fragment m/z 83 do not behave proportionally, especially near the target detection level
(1 ng/mL). In cases like this, a lesser abundant fragment is used to provide fragmentation ratios that are more consistent over a range of concentrations
35
45
55
65
75
85
95
0.10 1.00 10.00 100.00
Rat
io
Concentration in ng/mL
Fragmentation Ratios for Norbuprenorphine from 0.25 ng/mL to
100 ng/mL
101/211 187/211 83/101 83/187
38

data was recorded ranged from 32 to 60, and each scan lasted 0.1 seconds. The data was
analyzed by monitoring the running average of the ratio of the intensities of two fragment
ions per target analyte. The ratio produced after all scans were collected was considered
the “true” ratio, and this ratio was compared to the ratio obtained for each target after 10,
15, 20, 25, and 30 scans. The running averages are shown for the first 50 scans in Figure
12 and Figure 13. 62% of targets showed no significant difference between their “true”
fragmentation ratio and the ratio acquired after 15 scans (1.5 seconds/channel). 92% of
targets showed less than ±5% variation between their true ratio and the ratio obtained
after 15 scans. Doubling the number of scans to 30 only increases that percentage to 96%.
As such, 15 was chosen as the minimum number of 0.1 second scans needed to provide a
reproducible fragmentation ratio.
Defining the minimum number of scans needed per SRM channel has direct
implications on the analysis time for paper spray. If there are 154 target analytes that
each have two fragment ion channels and if each of these channels needs to be scanned
for 1.5 seconds, total analysis time to screen the entire panel of targets is set at a
minimum of 7.7 minutes. If run times are capped at two minutes to eliminate the need to
replenish solvent mid-run, at least four samples will need to be run to provide full
coverage for the purposed targets.
4.5 Screening Identification Criteria
One of the final tasks during method development for this project was to establish
screening identification criteria by which the targets would be classified as “detected” or
“not detected”. These criteria need to be stringent enough that they support specificity
and low false positive rates, but liberal enough that they allow for the detection of targets
with possible interferes from co-eluting matrix components or similarly structured
targets. Because paper spray cannot rely on chromatographic retention times, specificity
when using a triple quadrupole instrument is obtained from identifying the presence of
two known fragment ions for each target, as well as the fragmentation ratio between these
ions. Confirmative results are obtained when both fragments are present in a sample and
39
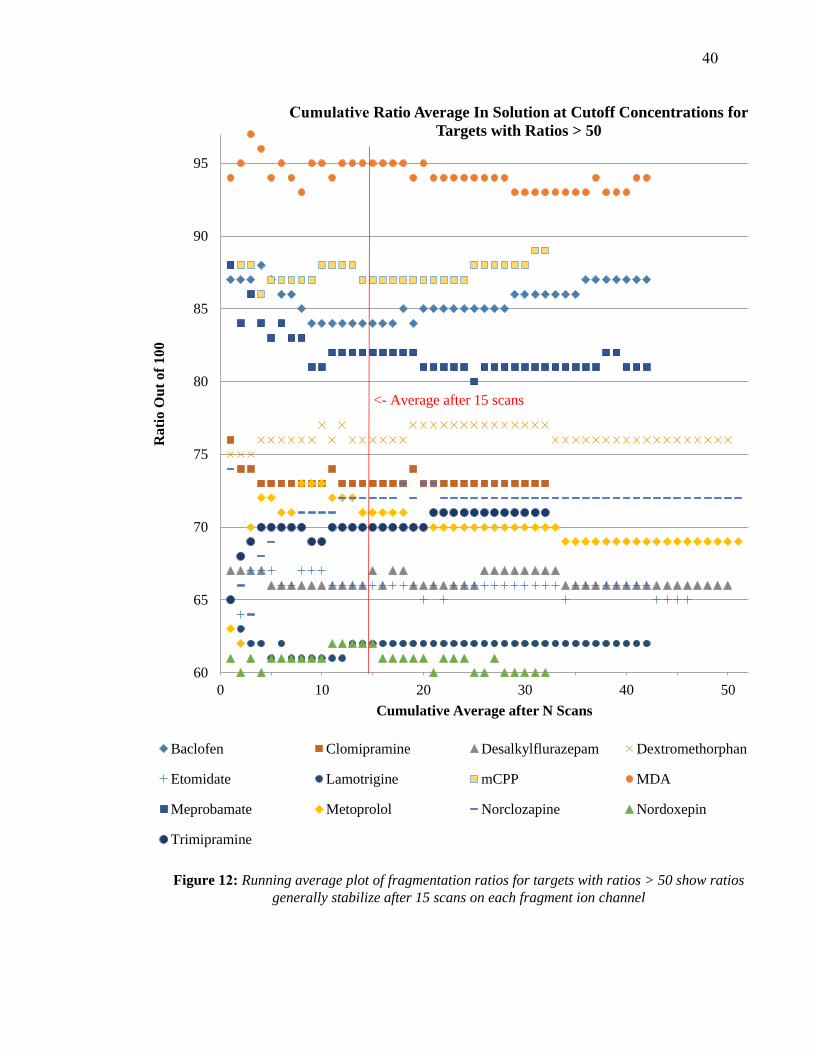
Figure 12: Running average plot of fragmentation ratios for targets with ratios > 50 show ratios
generally stabilize after 15 scans on each fragment ion channel
60
65
70
75
80
85
90
95
0 10 20 30 40 50
Rati
o O
ut
of
10
0
Cumulative Average after N Scans
Cumulative Ratio Average In Solution at Cutoff Concentrations for
Targets with Ratios > 50
Baclofen Clomipramine Desalkylflurazepam Dextromethorphan
Etomidate Lamotrigine mCPP MDA
Meprobamate Metoprolol Norclozapine Nordoxepin
Trimipramine
<- Average after 15 scans
40

Figure 13: Running average plot of fragmentation ratios for targets with ratios < 50 show
ratios generally stabilize after 15 scans on each fragment ion channel
10
15
20
25
30
35
40
45
0 10 20 30 40 50 60
Rati
o O
ut
of
100
Cumulative Average after N Scans
Cumulative Ratio Average In Solution at Cutoff Concentrations for
Targets with Ratios < 50
Benztropine Benzylpiperazine Cyclobenzaprine
Desipramine Desmethylclomipramine Gabapentin
Metaxalone Methylclomipramine Methylphenidate
Norvenlafaxine Olanzapine Ropinirole
TFMPP Ziprasidone Zolpidem
<- Average after 15 scans
41
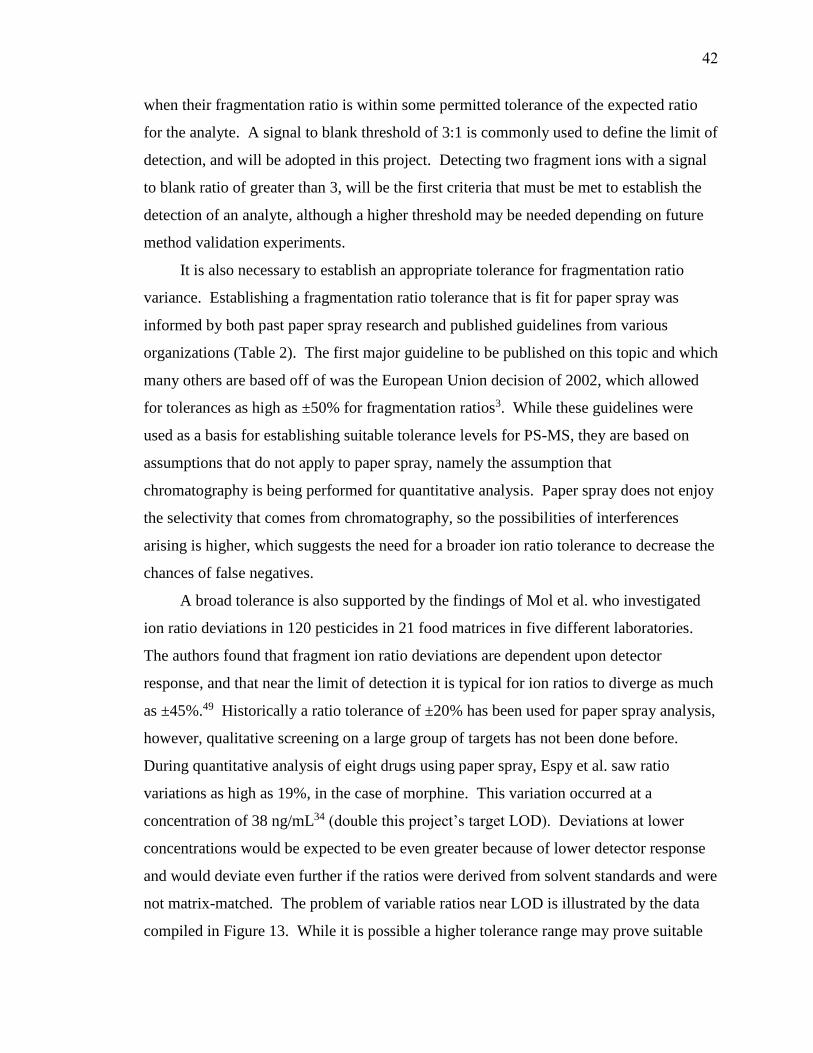
when their fragmentation ratio is within some permitted tolerance of the expected ratio
for the analyte. A signal to blank threshold of 3:1 is commonly used to define the limit of
detection, and will be adopted in this project. Detecting two fragment ions with a signal
to blank ratio of greater than 3, will be the first criteria that must be met to establish the
detection of an analyte, although a higher threshold may be needed depending on future
method validation experiments.
It is also necessary to establish an appropriate tolerance for fragmentation ratio
variance. Establishing a fragmentation ratio tolerance that is fit for paper spray was
informed by both past paper spray research and published guidelines from various
organizations (Table 2). The first major guideline to be published on this topic and which
many others are based off of was the European Union decision of 2002, which allowed
for tolerances as high as ±50% for fragmentation ratios3. While these guidelines were
used as a basis for establishing suitable tolerance levels for PS-MS, they are based on
assumptions that do not apply to paper spray, namely the assumption that
chromatography is being performed for quantitative analysis. Paper spray does not enjoy
the selectivity that comes from chromatography, so the possibilities of interferences
arising is higher, which suggests the need for a broader ion ratio tolerance to decrease the
chances of false negatives.
A broad tolerance is also supported by the findings of Mol et al. who investigated
ion ratio deviations in 120 pesticides in 21 food matrices in five different laboratories.
The authors found that fragment ion ratio deviations are dependent upon detector
response, and that near the limit of detection it is typical for ion ratios to diverge as much
as ±45%.49 Historically a ratio tolerance of ±20% has been used for paper spray analysis,
however, qualitative screening on a large group of targets has not been done before.
During quantitative analysis of eight drugs using paper spray, Espy et al. saw ratio
variations as high as 19%, in the case of morphine. This variation occurred at a
concentration of 38 ng/mL34 (double this project’s target LOD). Deviations at lower
concentrations would be expected to be even greater because of lower detector response
and would deviate even further if the ratios were derived from solvent standards and were
not matrix-matched. The problem of variable ratios near LOD is illustrated by the data
compiled in Figure 13. While it is possible a higher tolerance range may prove suitable
42
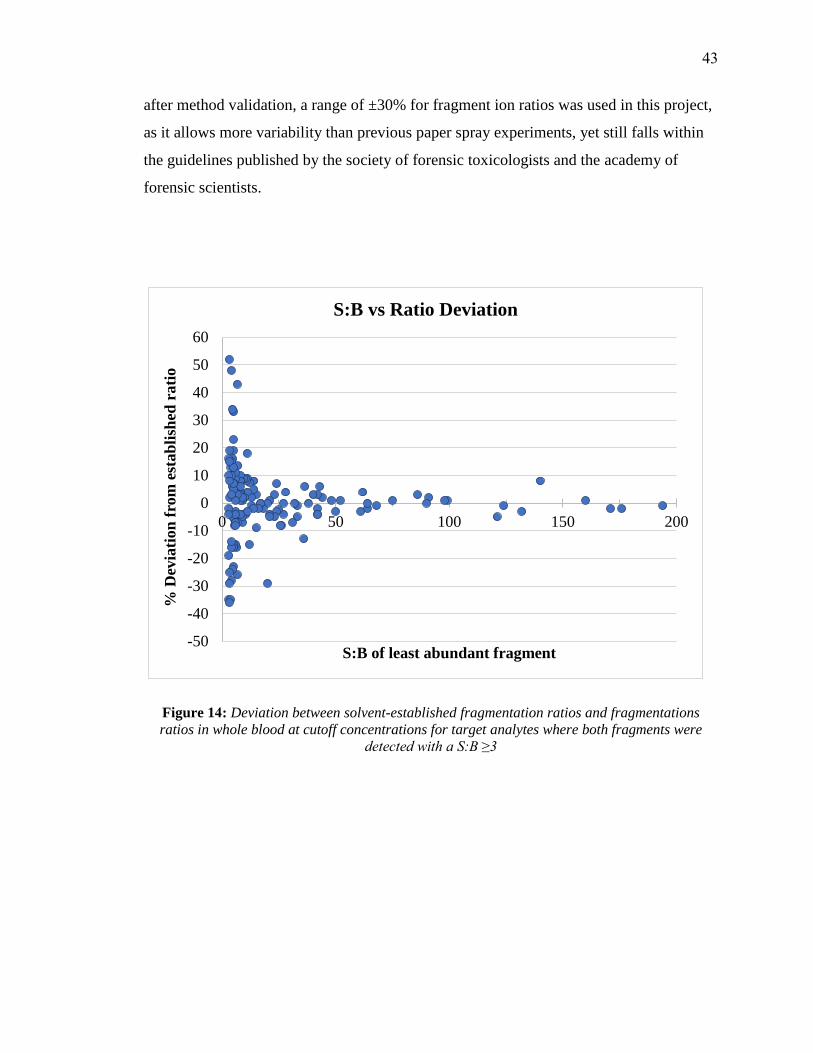
after method validation, a range of ±30% for fragment ion ratios was used in this project,
as it allows more variability than previous paper spray experiments, yet still falls within
the guidelines published by the society of forensic toxicologists and the academy of
forensic scientists.
Figure 14: Deviation between solvent-established fragmentation ratios and fragmentations
ratios in whole blood at cutoff concentrations for target analytes where both fragments were
detected with a S:B ≥3
-50
-40
-30
-20
-10
0
10
20
30
40
50
60
0 50 100 150 200
% D
evia
tion
fro
m e
stab
lish
ed r
ati
o
S:B of least abundant fragment
S:B vs Ratio Deviation
43
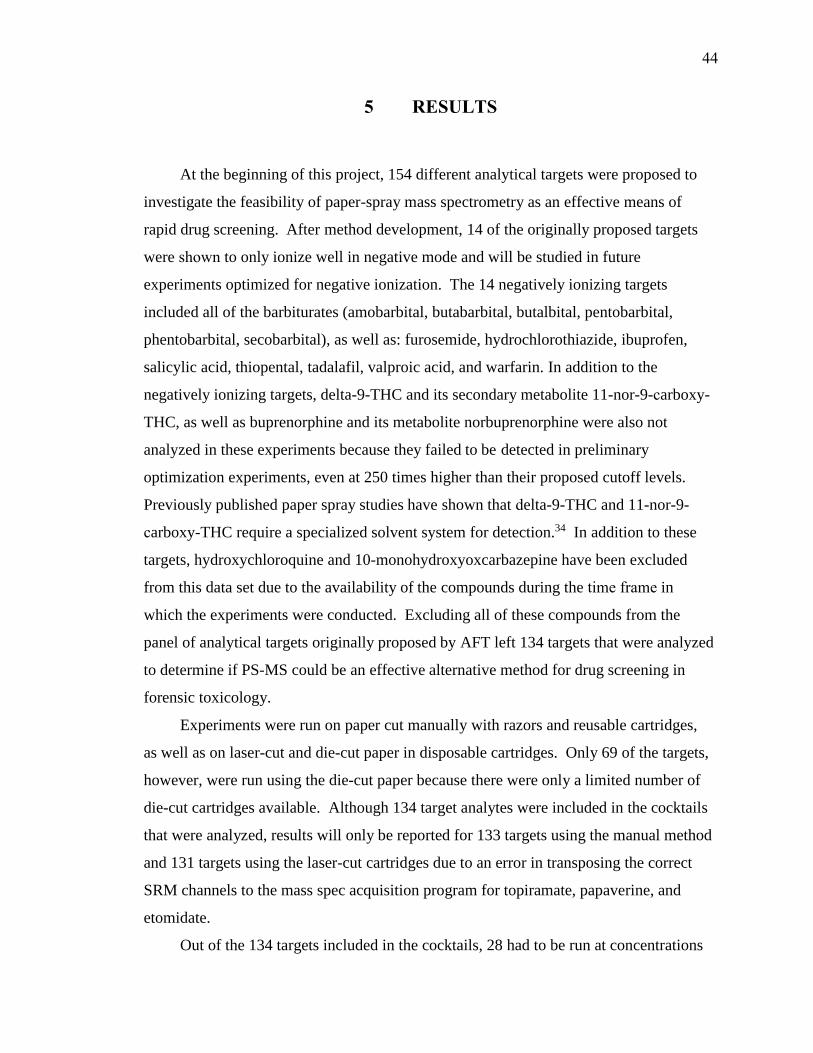
5 RESULTS
At the beginning of this project, 154 different analytical targets were proposed to
investigate the feasibility of paper-spray mass spectrometry as an effective means of
rapid drug screening. After method development, 14 of the originally proposed targets
were shown to only ionize well in negative mode and will be studied in future
experiments optimized for negative ionization. The 14 negatively ionizing targets
included all of the barbiturates (amobarbital, butabarbital, butalbital, pentobarbital,
phentobarbital, secobarbital), as well as: furosemide, hydrochlorothiazide, ibuprofen,
salicylic acid, thiopental, tadalafil, valproic acid, and warfarin. In addition to the
negatively ionizing targets, delta-9-THC and its secondary metabolite 11-nor-9-carboxy-
THC, as well as buprenorphine and its metabolite norbuprenorphine were also not
analyzed in these experiments because they failed to be detected in preliminary
optimization experiments, even at 250 times higher than their proposed cutoff levels.
Previously published paper spray studies have shown that delta-9-THC and 11-nor-9-
carboxy-THC require a specialized solvent system for detection.34 In addition to these
targets, hydroxychloroquine and 10-monohydroxyoxcarbazepine have been excluded
from this data set due to the availability of the compounds during the time frame in
which the experiments were conducted. Excluding all of these compounds from the
panel of analytical targets originally proposed by AFT left 134 targets that were analyzed
to determine if PS-MS could be an effective alternative method for drug screening in
forensic toxicology.
Experiments were run on paper cut manually with razors and reusable cartridges,
as well as on laser-cut and die-cut paper in disposable cartridges. Only 69 of the targets,
however, were run using the die-cut paper because there were only a limited number of
die-cut cartridges available. Although 134 target analytes were included in the cocktails
that were analyzed, results will only be reported for 133 targets using the manual method
and 131 targets using the laser-cut cartridges due to an error in transposing the correct
SRM channels to the mass spec acquisition program for topiramate, papaverine, and
etomidate.
Out of the 134 targets included in the cocktails, 28 had to be run at concentrations
44

other than the cutoffs specified by AFT during project development. Six out of these 28
targets (acetaminophen, benzylpiperazine, naproxen, phenytoin, topiramate, and
zonisamide) were run at concentrations lower than those originally proposed by AFT in
order to avoid swamping the detector at the upper end of the calibration curve. The other
22 targets were found to have limits of detection higher than the proposed cutoff
concentrations from AFT. These differences in the experimental LOD and proposed
cutoffs from AFT are outlined in Table 7. Only four targets of the 23 targets whose
limits of detection were found to be higher than AFT’s, however, were run at
concentrations outside of the expected normal therapeutic concentration range as defined
by data compiled by Schultz et al. (See Table 7). The four targets were: amphetamine,
buspirone, tramadol, and demoxepam.
5.1 Results
A summary of the results for all 154 proposed targets is found in Table 8 and more
detailed results sorted by cocktail are found in Table 9 – Table 21. For full results, see
Appendix E.
Out of the 133 targets run using the manual method, 114 met the detection
requirements when spiked into drug free whole blood at the targeted cut-off
concentration; the detection criteria were having a signal to blank ratio of greater than
three and deviated less than 30% in their established fragmentation ratio. Nineteen of the
targets failed to meet these criteria, half of the time because of low signal to blank and
half of the time due to ratio variability. When the same targets (minus papaverine and
etomidate whose SRM channels were wrongly transcribed) were run using the automated
source and the laser-cut paper, 99 satisfied the detection criteria. In the 32 cases where
the target was not detected at the cutoff or the experimental limit of detection, 15 were
attributed to low signal to blank ratios and 17 to ratio variability outside of the permitted
tolerance. When comparing the two methods, there were 22 instances where targets were
detected manually but not when using the automated source and the laser-cut paper, and
there were 7 instances where targets were detected with the automated source but not
manually (See Figure 17).
45
Of the 68 targets (etomidate excluded due to incorrect SRM channels being
monitored) that were analyzed, using the die-cut paper, 87% were detected at cutoff or
LOD. Of the 8 targets that did not meet detection criteria using the die-cut paper, only
two were due to low signal, while the rest were excluded due to ratio variability outside
of the permitted ±30% window. There were seven instances where targets were detected
using die-cut paper that were not previously detected using the automated method on
laser-cut paper.
Figure 15 Number of analytical targets detected using three different methods. Out of the
133 targets analyzed using the manual method, 86% met detection criteria; for the 131 targets
analyzed using the automatic method with laser-cut paper, 76% met detection criteria. Of the
68 targets analyzed using the automatic method with die-cut paper, 87% met detection
criteria
n=133 n=131 n=68
99
46
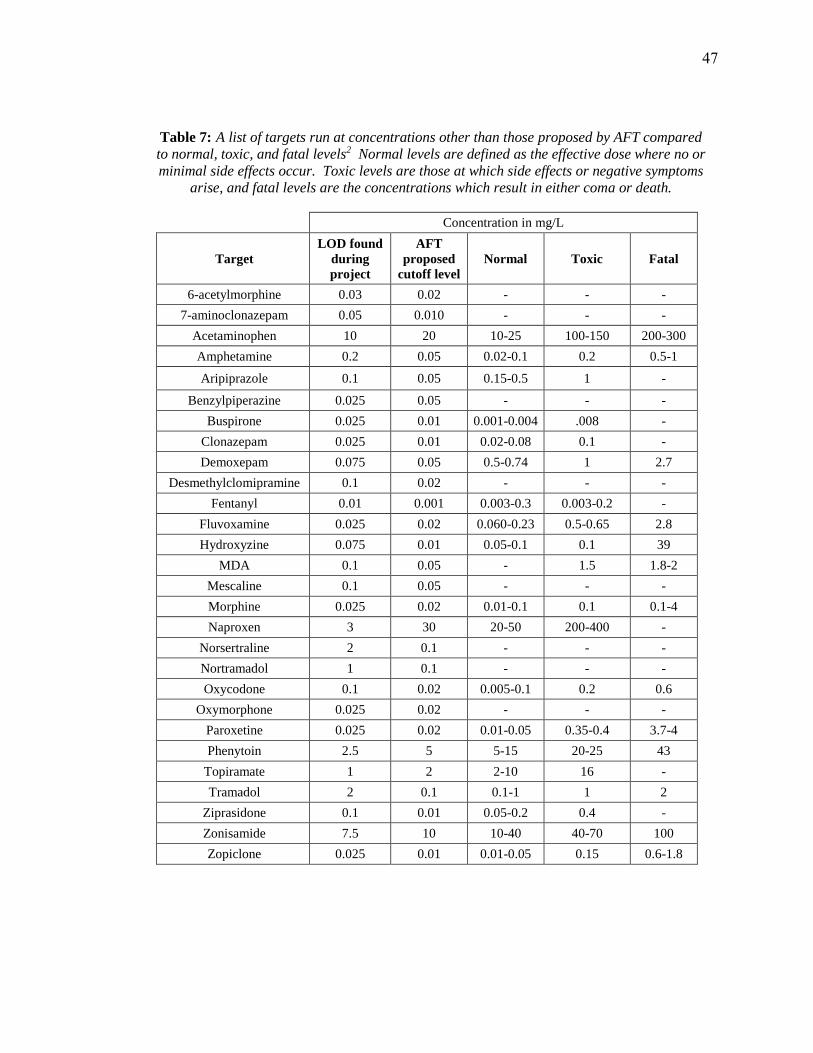
Table 7: A list of targets run at concentrations other than those proposed by AFT compared
to normal, toxic, and fatal levels2 Normal levels are defined as the effective dose where no or
minimal side effects occur. Toxic levels are those at which side effects or negative symptoms
arise, and fatal levels are the concentrations which result in either coma or death.
Concentration in mg/L
Target
LOD found
during
project
AFT
proposed
cutoff level
Normal Toxic Fatal
6-acetylmorphine 0.03 0.02 - - -
7-aminoclonazepam 0.05 0.010 - - -
Acetaminophen 10 20 10-25 100-150 200-300
Amphetamine 0.2 0.05 0.02-0.1 0.2 0.5-1
Aripiprazole 0.1 0.05 0.15-0.5 1 -
Benzylpiperazine 0.025 0.05 - - -
Buspirone 0.025 0.01 0.001-0.004 .008 -
Clonazepam 0.025 0.01 0.02-0.08 0.1 -
Demoxepam 0.075 0.05 0.5-0.74 1 2.7
Desmethylclomipramine 0.1 0.02 - - -
Fentanyl 0.01 0.001 0.003-0.3 0.003-0.2 -
Fluvoxamine 0.025 0.02 0.060-0.23 0.5-0.65 2.8
Hydroxyzine 0.075 0.01 0.05-0.1 0.1 39
MDA 0.1 0.05 - 1.5 1.8-2
Mescaline 0.1 0.05 - - -
Morphine 0.025 0.02 0.01-0.1 0.1 0.1-4
Naproxen 3 30 20-50 200-400 -
Norsertraline 2 0.1 - - -
Nortramadol 1 0.1 - - -
Oxycodone 0.1 0.02 0.005-0.1 0.2 0.6
Oxymorphone 0.025 0.02 - - -
Paroxetine 0.025 0.02 0.01-0.05 0.35-0.4 3.7-4
Phenytoin 2.5 5 5-15 20-25 43
Topiramate 1 2 2-10 16 -
Tramadol 2 0.1 0.1-1 1 2
Ziprasidone 0.1 0.01 0.05-0.2 0.4 -
Zonisamide 7.5 10 10-40 40-70 100
Zopiclone 0.025 0.01 0.01-0.05 0.15 0.6-1.8
47

Table 8: Summary of results for all 154 proposed analytical targets; "-" indicates not analyzed
Target
Det
ecte
d
Man
ual
ly?
Det
ecte
d
Las
er-c
ut?
Det
ecte
d
Die
-Cu
t?
Co
ckta
il
Ru
n I
n
10-monohydroxyoxcarbazepine Not run -
11-nor-9-Carboxy-THC Not run -
6-acetylmorphine No Yes Yes G
7-aminoclonazepam Yes No Yes G
7-aminoflunitrazepam Yes Yes - J
9-hydroxyrisperidone No Yes - K
Acetaminophen Yes Yes - A
Alfentanil Yes Yes Yes G
Alpha-PVP Yes Yes Yes G
Alprazolam No Yes - K
Amitriptyline Yes Yes - L
Amlodipine No No - J
Amobarbital Negative ionizer -
Amphetamine Yes Yes - C
Aripiprazole Yes Yes Yes D
Atenolol Yes Yes - L
Baclofen Yes Yes - B
Benzoylecgonine Yes No - L
Benztropine Yes No - J
Benzylpiperazine No Yes - C
Brompheniramine Yes Yes Yes H
Bupivacaine Yes Yes - C
Buprenorphine Not run -
Bupropion Yes Yes Yes G
Buspirone Yes Yes Yes I
Butabarbital Negative ionizer -
Butalbital Negative ionizer -
Carbamazepine Yes Yes - B
Carbamazepine-10,11-epoxide Yes Yes - B
Carisoprodol Yes Yes - A
Chlordiazepoxide Yes Yes Yes G
Chlorpheniramine Yes Yes Yes I
Chlorpromazine Yes No No G
Citalopram No No - M
Clomipramine No Yes - J
Clonazepam Yes No No I
Clozapine Yes Yes Yes G
Cocaethylene Yes Yes Yes G
Cocaine Yes Yes - M
Codeine Yes Yes - M
Cyclobenzaprine Yes Yes - K
delta9-THC Not run -
Demoxepam No No Yes E
Desalkylflurazepam Yes No No G
Desipramine No No - J
Desmethylclomipramine No No No D
Dextromethorphan Yes Yes - K
Target
Det
ecte
d
Man
ual
ly?
Det
ecte
d
Las
er-c
ut?
Det
ecte
d
Die
-Cu
t?
Co
ckta
il
Ru
n I
n
Diazepam Yes Yes - L
Diltiazem Yes Yes Yes G
Diphenhydramine Yes Yes Yes H
Donepezil Yes Yes Yes F
Doxepin Yes Yes - M
Doxylamine Yes Yes Yes H
Duloxetine No Yes - J
EDDP Yes Yes Yes H
Ephedrine/
Pseudoephedrine Yes Yes Yes E
Etomidate No - - D
Felbamate Yes Yes - A
Fentanyl Yes Yes - K
Flecainide Yes Yes - C
Flunitrazepam Yes No - J
Fluoxetine No No - J
Flurazepam Yes Yes Yes H
Fluvoxamine Yes Yes Yes I
Furosemide Negative ionizer -
Gabapentin Yes No - C
Haloperidol Yes Yes - K
Hydrochlorothiazide Negative ionizer -
Hydrocodone Yes No - L
Hydromorphone Yes No - M
Hydroxychloroquine Not Run -
Hydroxyzine Yes Yes Yes E
Ibuprofen Negative ionizer -
Ketamine Yes Yes Yes D
Labetalol Yes Yes Yes F
Lamotrigine Yes Yes - B
Levetiracetam Yes Yes - A
Lidocaine Yes Yes - C
Lorazepam Yes Yes Yes H
mCPP Yes Yes - J
MDA Yes Yes Yes D
MDMA Yes Yes Yes F
MDPV Yes Yes Yes F
Meperidine Yes Yes Yes H
Mephedrone Yes Yes Yes F
Meprobamate Yes Yes - B
Mescaline Yes No Yes D
Metaxalone Yes Yes - B
Methadone Yes Yes Yes I
Methamphetamine Yes Yes Yes F
Methocarbamol Yes Yes - B
Methylone Yes Yes Yes F
Methylphenidate Yes Yes - J
Metoclopramide Yes Yes Yes D
48
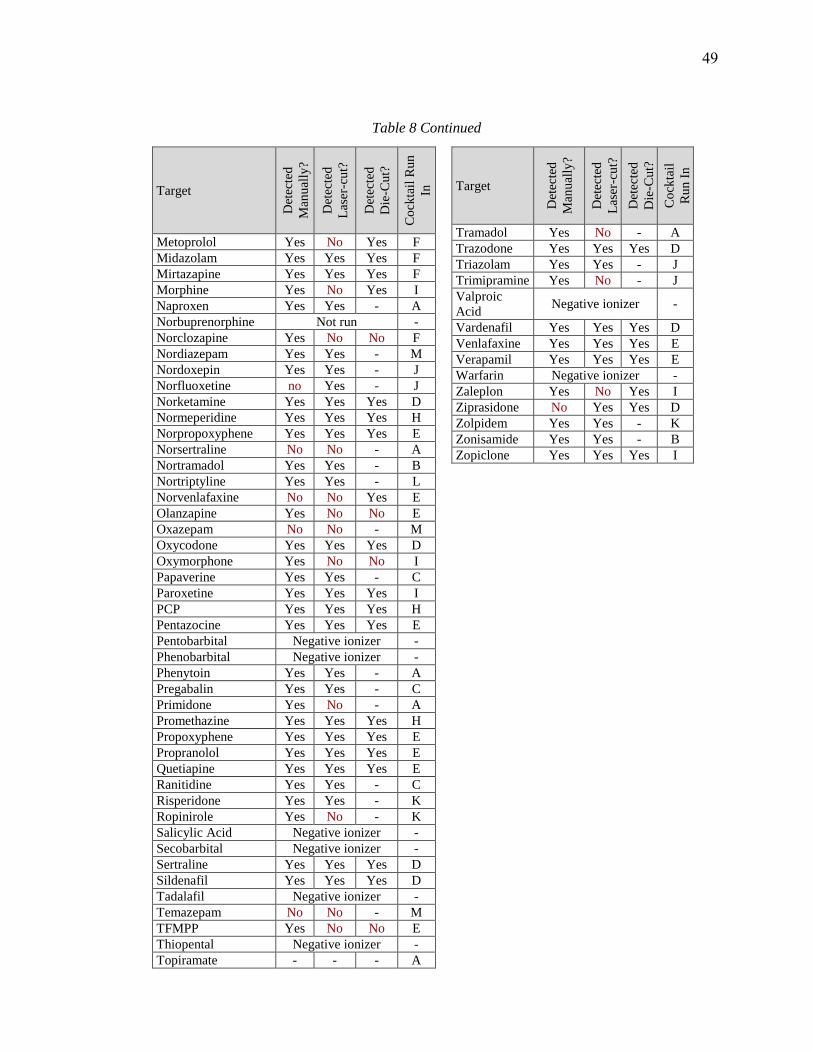
Table 8 Continued
Target
Det
ecte
d
Man
ual
ly?
Det
ecte
d
Las
er-c
ut?
Det
ecte
d
Die
-Cu
t?
Co
ckta
il R
un
In
Metoprolol Yes No Yes F
Midazolam Yes Yes Yes F
Mirtazapine Yes Yes Yes F
Morphine Yes No Yes I
Naproxen Yes Yes - A
Norbuprenorphine Not run -
Norclozapine Yes No No F
Nordiazepam Yes Yes - M
Nordoxepin Yes Yes - J
Norfluoxetine no Yes - J
Norketamine Yes Yes Yes D
Normeperidine Yes Yes Yes H
Norpropoxyphene Yes Yes Yes E
Norsertraline No No - A
Nortramadol Yes Yes - B
Nortriptyline Yes Yes - L
Norvenlafaxine No No Yes E
Olanzapine Yes No No E
Oxazepam No No - M
Oxycodone Yes Yes Yes D
Oxymorphone Yes No No I
Papaverine Yes Yes - C
Paroxetine Yes Yes Yes I
PCP Yes Yes Yes H
Pentazocine Yes Yes Yes E
Pentobarbital Negative ionizer -
Phenobarbital Negative ionizer -
Phenytoin Yes Yes - A
Pregabalin Yes Yes - C
Primidone Yes No - A
Promethazine Yes Yes Yes H
Propoxyphene Yes Yes Yes E
Propranolol Yes Yes Yes E
Quetiapine Yes Yes Yes E
Ranitidine Yes Yes - C
Risperidone Yes Yes - K
Ropinirole Yes No - K
Salicylic Acid Negative ionizer -
Secobarbital Negative ionizer -
Sertraline Yes Yes Yes D
Sildenafil Yes Yes Yes D
Tadalafil Negative ionizer -
Temazepam No No - M
TFMPP Yes No No E
Thiopental Negative ionizer -
Topiramate - - - A
Target
Det
ecte
d
Man
ual
ly?
Det
ecte
d
Las
er-c
ut?
Det
ecte
d
Die
-Cu
t?
Co
ckta
il
Ru
n I
n
Tramadol Yes No - A
Trazodone Yes Yes Yes D
Triazolam Yes Yes - J
Trimipramine Yes No - J
Valproic
Acid Negative ionizer -
Vardenafil Yes Yes Yes D
Venlafaxine Yes Yes Yes E
Verapamil Yes Yes Yes E
Warfarin Negative ionizer -
Zaleplon Yes No Yes I
Ziprasidone No Yes Yes D
Zolpidem Yes Yes - K
Zonisamide Yes Yes - B
Zopiclone Yes Yes Yes I
49
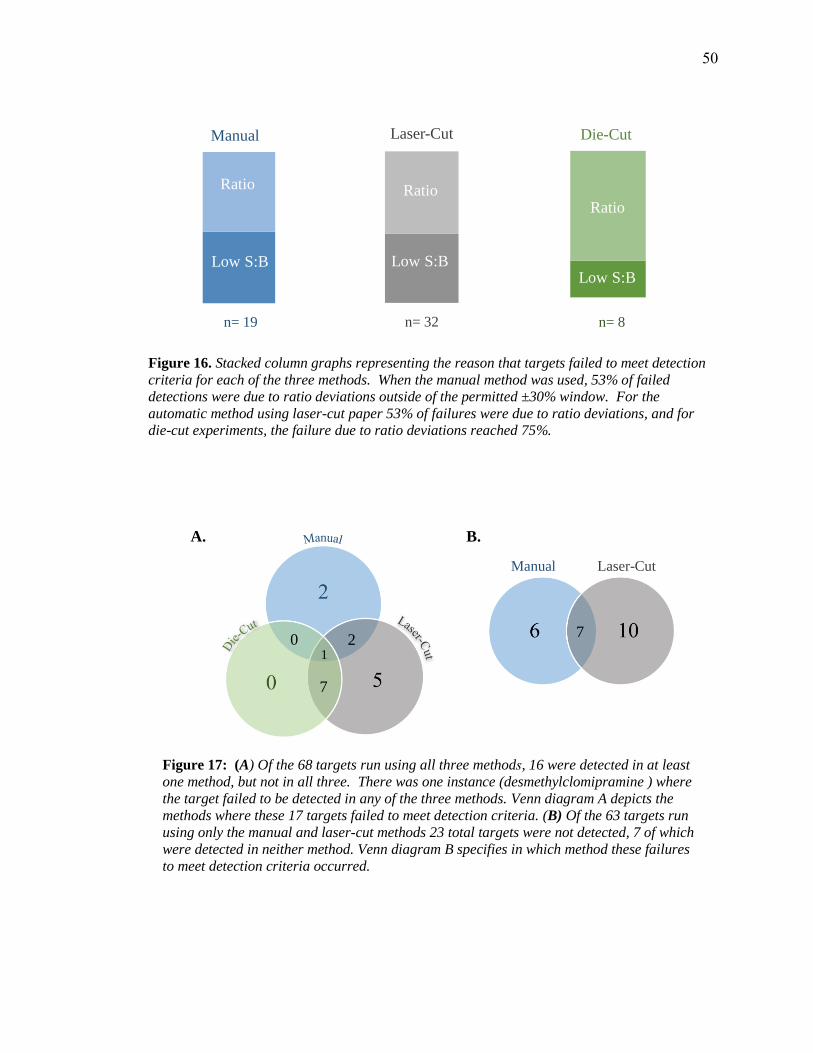
Figure 17: (A) Of the 68 targets run using all three methods, 16 were detected in at least
one method, but not in all three. There was one instance (desmethylclomipramine ) where
the target failed to be detected in any of the three methods. Venn diagram A depicts the
methods where these 17 targets failed to meet detection criteria. (B) Of the 63 targets run
using only the manual and laser-cut methods 23 total targets were not detected, 7 of which
were detected in neither method. Venn diagram B specifies in which method these failures
to meet detection criteria occurred.
0
7
21
Manual Laser-Cut
7
B. A.
Figure 16. Stacked column graphs representing the reason that targets failed to meet detection
criteria for each of the three methods. When the manual method was used, 53% of failed
detections were due to ratio deviations outside of the permitted ±30% window. For the
automatic method using laser-cut paper 53% of failures were due to ratio deviations, and for
die-cut experiments, the failure due to ratio deviations reached 75%.
Manual
Ratio
Low S:B
n= 19
Laser-Cut
Ratio
Low S:B
n= 32
Die-CutR
at
i
o
L
o
w
S
:
B
Ratio
Low S:B
n= 8
50
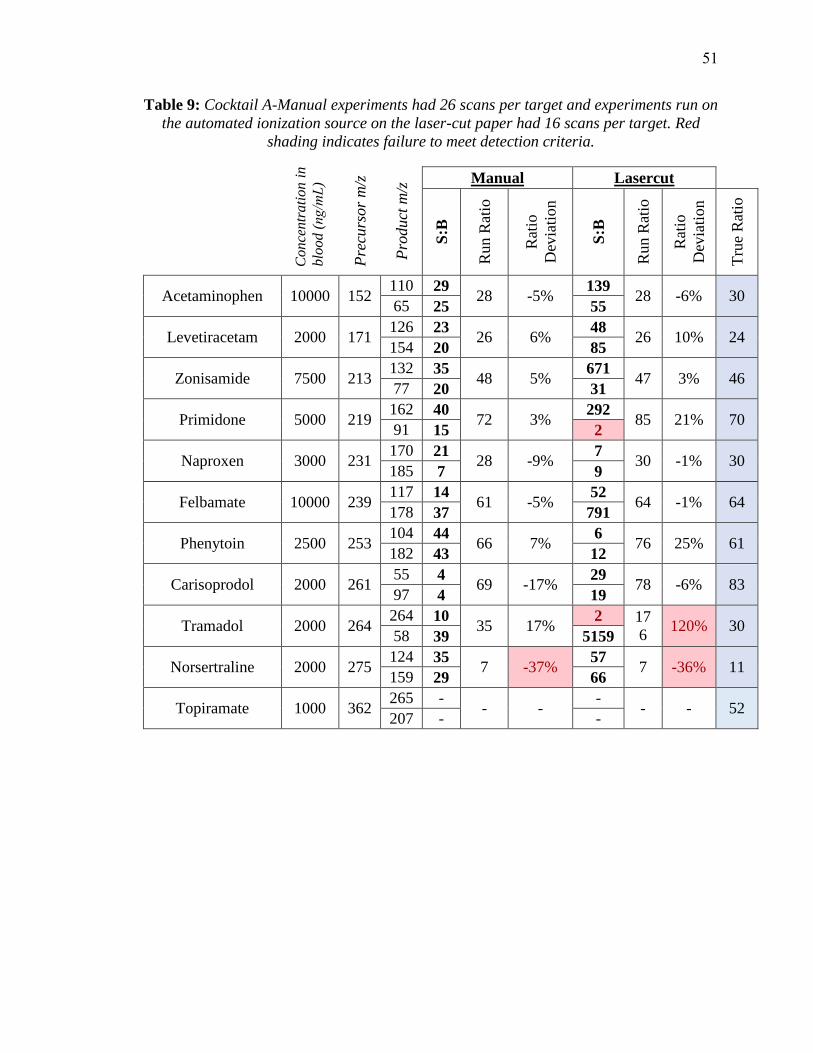
Table 9: Cocktail A-Manual experiments had 26 scans per target and experiments run on
the automated ionization source on the laser-cut paper had 16 scans per target. Red
shading indicates failure to meet detection criteria.
Conce
ntr
ati
on i
n
blo
od (ng/mL)
Pre
curs
or
m/z
Pro
duct
m/z
Manual Lasercut
S:B
Run R
atio
Rat
io
Dev
iati
on
S:B
Run R
atio
Rat
io
Dev
iati
on
Tru
e R
atio
Acetaminophen 10000 152 110 29
28 -5%139
28 -6% 30 65 25 55
Levetiracetam 2000 171 126 23
26 6% 48
26 10% 24 154 20 85
Zonisamide 7500 213 132 35
48 5% 671
47 3% 46 77 20 31
Primidone 5000 219 162 40
72 3% 292
85 21% 70 91 15 2
Naproxen 3000 231 170 21
28 -9%7
30 -1% 30 185 7 9
Felbamate 10000 239 117 14
61 -5%52
64 -1% 64 178 37 791
Phenytoin 2500 253 104 44
66 7% 6
76 25% 61 182 43 12
Carisoprodol 2000 261 55 4
69 -17%29
78 -6% 83 97 4 19
Tramadol 2000 264 264 10
35 17% 2 17
6 120% 30
58 39 5159
Norsertraline 2000 275 124 35
7 -37%57
7 -36% 11 159 29 66
Topiramate 1000 362 265 -
- - -
- - 52 207 - -
51
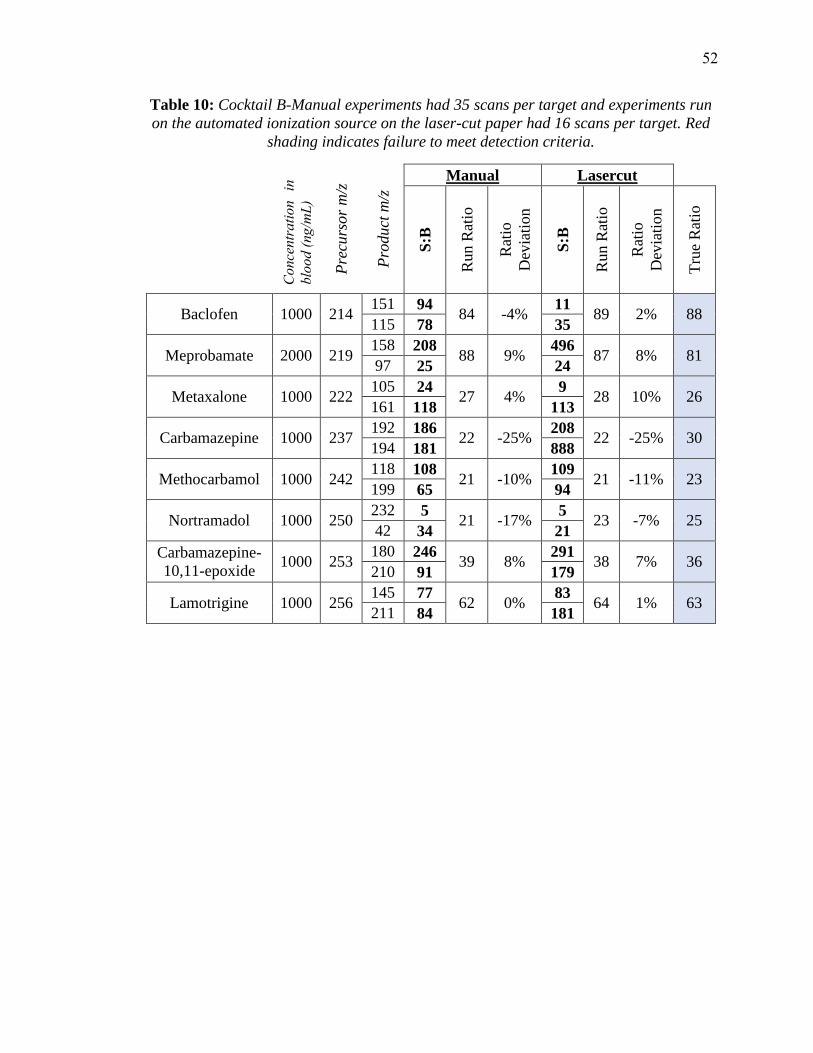
Table 10: Cocktail B-Manual experiments had 35 scans per target and experiments run
on the automated ionization source on the laser-cut paper had 16 scans per target. Red
shading indicates failure to meet detection criteria.
Pre
curs
or
m/z
Pro
duct
m/z
Manual Lasercut
Con
cent
ratio
n in
bl
ood
(ng/
mL)
S:B
Run R
atio
Rat
io
Dev
iati
on
S:B
Run R
atio
Rat
io
Dev
iati
on
Tru
e R
atio
Baclofen 1000 214 151 94
84 -4%11
89 2% 88 115 78 35
Meprobamate 2000 219 158 208
88 9% 496
87 8% 81 97 25 24
Metaxalone 1000 222 105 24
27 4% 9
28 10% 26 161 118 113
Carbamazepine 1000 237 192 186
22 -25%208
22 -25% 30 194 181 888
Methocarbamol 1000 242 118 108
21 -10%109
21 -11% 23 199 65 94
Nortramadol 1000 250 232 5
21 -17%5
23 -7% 25 42 34 21
Carbamazepine-
10,11-epoxide 1000 253
180 246 39 8%
291 38 7% 36
210 91 179
Lamotrigine 1000 256 145 77
62 0% 83
64 1% 63 211 84 181
52

Table 11: Cocktail C-Manual experiments had 32 scans per target and experiments run
on the automated ionization source on the laser-cut paper had 16 scans per target. Red
shading indicates failure to meet detection criteria.
Con
cent
ratio
n in
bl
ood
(ng/
mL)
Pre
curs
or
m/z
Pro
duct
m/z
Manual Lasercut
S:B
Run R
atio
Rat
io
Dev
iati
on
S:B
Run R
atio
Rat
io
Dev
iati
on
Tru
e R
atio
Amphetamine 200 136 91 9
23 -6%6
21 -15% 25 119 22 47
Pregabalin 500 160 124 68
467 0% 12
22 6% 21 97 28 7
Gabapentin 500 172 119 103
32 0% 34
814 2444% 32 137 116 147
Benzylpiperazine 25 177 85 3
21 70% 41
12 -1% 12 91 16 34
Lidocaine 500 235 58 311
10 -16%59
10 -16% 12 86 410 7086
Bupivacaine 500 289 140 335
17 -2%13927
17 -2% 17 98 284 2130
Ranitidine 500 315 102 447
51 4% 10319
51 4% 49 176 225 713
Papaverine 500 340 324 347
105 4% -
- - 101 202 342 -
Flecainide 500 415 301 310
40 6% 2025
40 5% 38 98 335 5159
53

Tab
le 1
2:
Cock
tail
D-
Manual
exper
imen
ts h
ad 2
0 s
cans
per
targ
et a
nd e
xper
imen
ts r
un o
n t
he
auto
mate
d i
oniz
ati
on s
ourc
e had
15 s
cans
per
targ
et. R
ed s
hadin
g i
ndic
ate
s fa
ilure
to m
eet
det
ecti
on c
rite
ria.
Concentration in blood (ng/mL)
Precursor m/z
Product m/z
Man
ual
Die
cut
Lase
rcu
t
S:B
Run Ratio
Ratio
Deviation
S:B
Run Ratio
Ratio
Deviation
S:B
Run Ratio
Ratio
Deviation
True Ratio
MD
A
10
0
180
133
17
93
3%
23
100
10%
12
100
10%
91
135
25
23
12
Mes
cali
ne
10
0
212
165
48
64
-20%
55
62
-23
%7
30
-63
%81
180
6
4
2
Ari
pip
razo
le
10
0
448
176
35
29
1%
45
28
2%
56
28
1%
28
285
74
391
215
Des
met
hylc
lom
ipra
min
e 10
0
301
227
11
24
39%
30
26
51%
13
23
37%
17
72
108
1720
1232
Eto
mid
ate
10
0
245
141
20
105
41%
-
- -
- -
- 66
95
5
29
33
Ket
amin
e
10
0
238
125
141
25
1%
1544
25
3%
157
26
6%
24
89
91
209
31
Met
ocl
opra
mid
e 10
0
300
184
89
37
-4%
1451
39
1%
249
38
-3%
39
227
110
6443
1591
Nork
etam
ine
10
0
224
125
108
45
2%
543
45
2%
118
46
5%
44
179
67
159
32
Ox
yco
done
10
0
316
212
19
65
4%
25
68
7%
10
69
10%
63
241
29
61
33
Ser
tral
ine
10
0
306
159
31
81
-4%
72
84
-1%
47
82
-3%
85
275
81
351
349
54
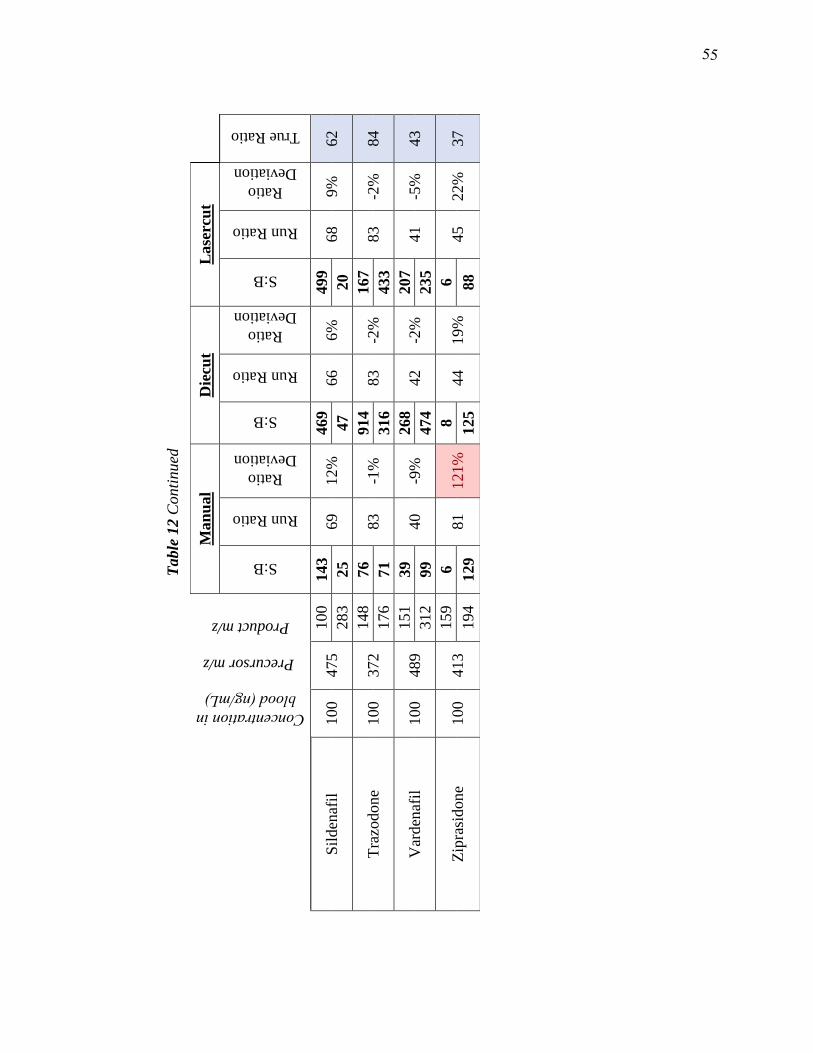
Table
12 C
onti
nued
Concentration in blood (ng/mL)
Precursor m/z
Product m/z
Man
ual
Die
cut
Lase
rcu
t
S:B
Run Ratio
Ratio
Deviation
S:B
Run Ratio
Ratio
Deviation
S:B
Run Ratio
Ratio
Deviation
True Ratio
Sil
den
afil
100
475
100
143
69
12
%
469
66
6%
499
68
9%
62
283
25
47
20
Tra
zodone
100
372
148
76
83
-1%
914
83
-2%
167
83
-2%
84
176
71
316
433
Var
den
afil
100
489
151
39
40
-9%
268
42
-2%
207
41
-5%
43
312
99
474
235
Zip
rasi
don
e
100
413
159
6
81
121
%
8
44
19%
6
45
22%
37
194
129
125
88
55
55
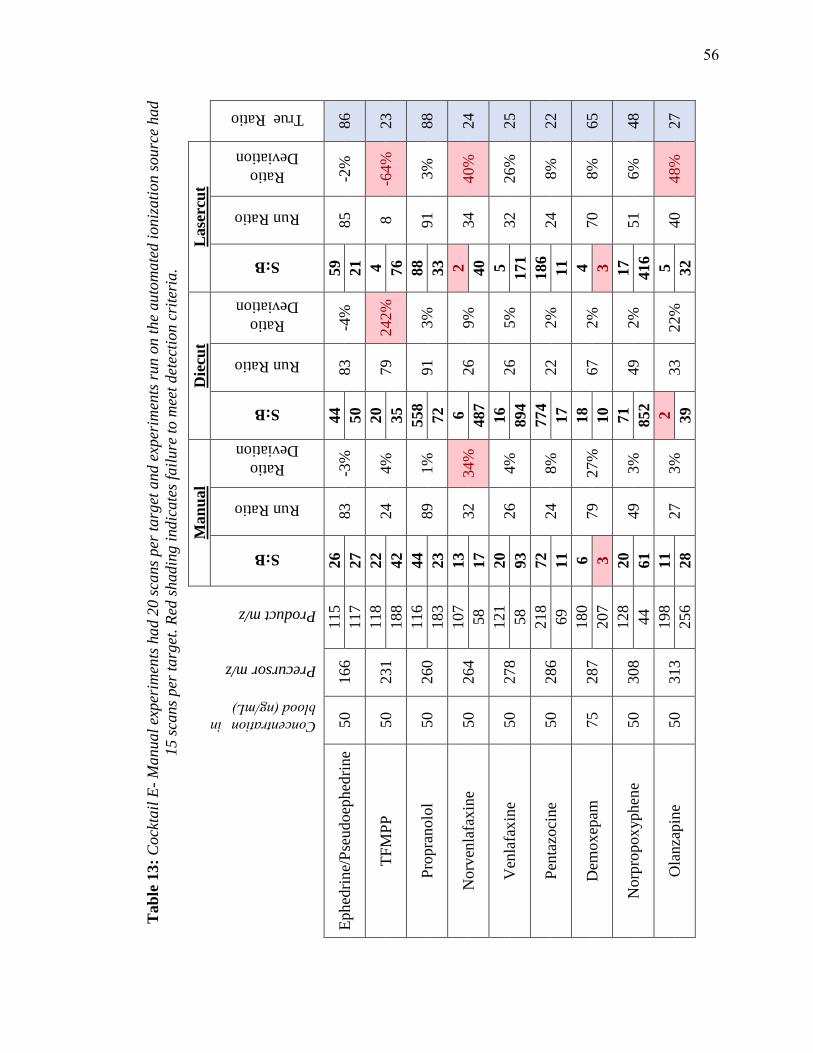
Tab
le 1
3:
Cock
tail
E-
Manual
exper
imen
ts h
ad 2
0 s
cans
per
targ
et a
nd e
xper
imen
ts r
un o
n t
he
auto
mate
d i
oniz
ati
on s
ourc
e had
15 s
cans
per
targ
et.
Red
shadin
g i
ndic
ate
s fa
ilure
to m
eet
det
ecti
on c
rite
ria.
Man
ual
Die
cut
Lase
rcu
t
Concentration in blood (ng/mL)
Precursor m/z
Product m/z
S:B
Run Ratio
Ratio
Deviation
S:B
Run Ratio
Ratio
Deviation
S:B
Run Ratio
Ratio
Deviation
True Ratio
Ephed
rine/
Pse
udoep
hed
rine
50
166
115
26
83
-3%
44
83
-4%
59
85
-2%
86
117
27
50
21
TF
MP
P
50
231
118
22
24
4%
20
79
242%
4
8
-64%
23
188
42
35
76
Pro
pra
nolo
l 50
260
116
44
89
1%
558
91
3%
88
91
3%
88
183
23
72
33
Norv
enla
fax
ine
50
264
107
13
32
34%
6
26
9%
2
34
40%
24
58
17
487
40
Ven
lafa
xin
e 50
278
121
20
26
4%
16
26
5%
5
32
26%
25
58
93
894
171
Pen
tazo
cine
50
286
218
72
24
8%
774
22
2%
186
24
8%
22
69
11
17
11
Dem
ox
epam
75
287
180
6
79
27%
18
67
2%
4
70
8%
65
207
3
10
3
No
rpro
pox
yphen
e 50
308
128
20
49
3%
71
49
2%
17
51
6%
48
44
61
852
416
Ola
nza
pin
e 50
313
198
11
27
3%
2
33
22%
5
40
48%
27
256
28
39
32
56

Table
13 c
onti
nued
Man
ual
Die
cut
Lase
rcu
t
Concentration in blood (ng/mL)
Precursor m/z
Product m/z
S:B
Run Ratio
Ratio
Deviation
S:B
Run Ratio
Ratio
Deviation
S:B
Run Ratio
Ratio
Deviation
True Ratio
Pro
pox
yphen
e 50
340
128
10
21
3%
22
20
-1%
10
21
6%
20
266
31
425
227
Hyd
rox
yzi
ne
75
375
165
56
83
-3%
1903
84
-2%
702
84
-2%
86
201
28
124
135
Quet
iap
ine
50
384
221
81
64
0%
812
65
1%
284
65
1%
64
253
66
1080
648
Ver
apam
il
50
455
150
80
37
2%
1463
37
3%
241
37
3%
36
165
34
647
335
57
57
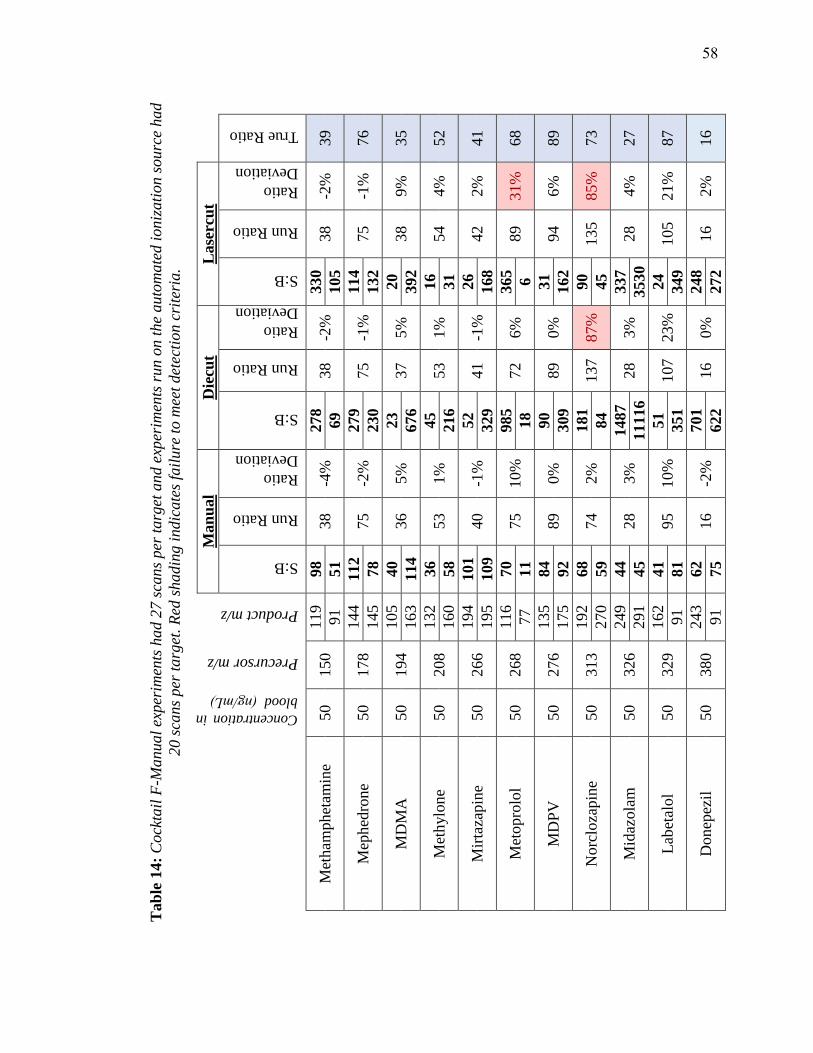
Err
or!
No
t a v
ali
d l
ink
.
Tab
le 1
4:
Cock
tail
F-M
anual
exper
imen
ts h
ad 2
7 s
cans
per
targ
et a
nd e
xper
imen
ts r
un o
n t
he
auto
mate
d i
oniz
ati
on s
ourc
e had
20 s
cans
per
targ
et. R
ed s
hadin
g i
ndic
ate
s fa
ilure
to m
eet
det
ecti
on c
rite
ria.
Concentration in
blood (ng/mL)
Precursor m/z
Product m/z
Man
ual
Die
cut
Lase
rcu
t
S:B
Run Ratio
Ratio
Deviation
S:B
Run Ratio
Ratio
Deviation
S:B
Run Ratio
Ratio
Deviation
True Ratio
Met
ham
phet
amin
e 50
150
119
98
38
-4%
278
38
-2%
330
38
-2%
39
91
51
69
105
Mep
hed
rone
50
178
144
112
75
-2%
279
75
-1%
114
75
-1%
76
145
78
230
132
MD
MA
50
194
105
40
36
5%
23
37
5%
20
38
9%
35
163
114
676
392
Met
hylo
ne
50
208
132
36
53
1%
45
53
1%
16
54
4%
52
160
58
216
31
Mir
taza
pin
e 50
266
194
101
40
-1%
52
41
-1%
26
42
2%
41
195
109
329
168
Met
opro
lol
50
268
116
70
75
10%
985
72
6%
365
89
31%
68
77
11
18
6
MD
PV
50
276
135
84
89
0%
90
89
0%
31
94
6%
89
175
92
309
162
Norc
loza
pin
e 50
313
192
68
74
2%
181
137
87%
90
135
85%
73
270
59
84
45
Mid
azola
m
50
326
249
44
28
3%
1487
28
3%
337
28
4%
27
291
45
11116
3530
Lab
etal
ol
50
329
162
41
95
10%
51
107
23%
24
105
21%
87
91
81
351
349
Donep
ezil
50
380
243
62
16
-2%
701
16
0%
248
16
2%
16
91
75
622
272
58
58
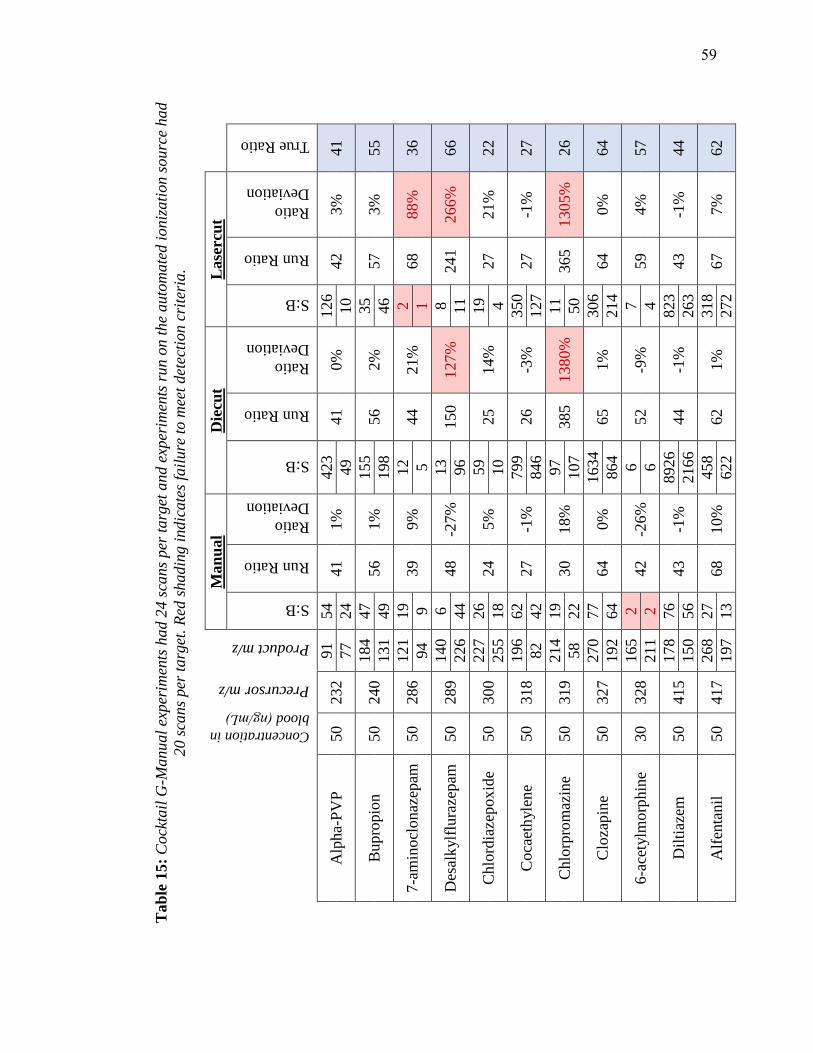
Tab
le 1
5:
Cock
tail
G-M
anual
exper
imen
ts h
ad 2
4 s
cans
per
targ
et a
nd e
xper
imen
ts r
un o
n t
he
auto
mate
d i
oniz
ati
on s
ourc
e had
20 s
cans
per
targ
et.
Red
shadin
g i
ndic
ate
s fa
ilure
to m
eet
det
ecti
on c
rite
ria.
Concentration in
blood (ng/mL)
Precursor m/z
Product m/z
Man
ual
Die
cut
Lase
rcu
t
S:B
Run Ratio
Ratio
Deviation
S:B
Run Ratio
Ratio
Deviation
S:B
Run Ratio
Ratio
Deviation
True Ratio
Alp
ha-
PV
P
50
232
91
54
41
1%
423
41
0%
126
42
3%
41
77
24
49
10
Bupro
pio
n
50
240
184
47
56
1%
155
56
2%
35
57
3%
55
131
49
198
46
7-a
min
ocl
onaz
epam
50
286
121
19
39
9%
12
44
21%
2
68
88%
36
94
9
5
1
Des
alk
ylf
lura
zepam
50
289
140
6
48
-27%
13
150
127%
8
241
266%
66
226
44
96
11
Chlo
rdia
zepox
ide
50
300
227
26
24
5%
59
25
14%
19
27
21%
22
255
18
10
4
Coca
eth
yle
ne
50
318
196
62
27
-1%
799
26
-3%
350
27
-1
%27
82
42
846
127
Chlo
rpro
maz
ine
50
319
214
19
30
18%
97
385
1380%
11
365
1305%
26
58
22
107
50
Clo
zapin
e 50
327
270
77
64
0%
1634
65
1%
306
64
0%
64
192
64
864
214
6-a
cety
lmorp
hin
e30
328
165
2
42
-26%
6
52
-9%
7
59
4%
57
211
2
6
4
Dil
tiaz
em
50
415
178
76
43
-1%
8926
44
-1%
823
43
-1
%44
150
56
2166
263
Alf
enta
nil
50
417
268
27
68
10%
458
62
1%
318
67
7%
62
197
13
622
272
59

Tab
le 1
6:
Cock
tail
H M
anual
exper
imen
ts h
ad 2
8 s
cans
per
targ
et a
nd e
xper
imen
ts r
un o
n t
he
auto
mate
d i
oniz
ati
on
sourc
e had 2
1 s
cans
per
targ
et.
Concentration in
blood (ng/mL)
Precursor m/z
Product m/z
Man
ual
Die
cut
Lase
rcu
t
S:B
Run Ratio
Ratio
Deviation
S:B
Run Ratio
Ratio
Deviation
S:B
Run Ratio
Ratio
Deviation
True Ratio
Norm
eper
idin
e 25
234
160
11
23
1%
39
22
-2%
7
20
-7%
22
56
9
81
14
PC
P
25
244
91
9
55
-3%
28
51
-9%
19
48
-15%
56
159
8
93
60
Mep
erid
ine
25
248
220
16
57
-1%
253
60
3%
29
62
6%
58
174
12
99
14
Dip
hen
hyd
ram
ine
25
256
167
12
44
3%
200
44
2%
110
45
4%
43
165
16
230
93
Dox
yla
min
e 25
271
167
16
88
0%
126
85
-3%
67
88
0%
88
182
18
307
106
ED
DP
25
278
234
12
41
-1%
1410
41
-2%
491
41
-3%
42
249
13
2742
619
Pro
met
haz
ine
25
285
86
6
43
-1%
17
44
2%
17
45
4%
43
198
6
16
12
Bro
mphen
iram
ine
25
319
274
21
50
5%
719
48
2%
200
49
4%
47
167
9
248
98
Lora
zepam
25
321
276
22
49
2%
295
47
-1%
159
47
-1%
48
167
11
268
111
Flu
raze
pam
25
388
315
17
23
5%
1975
23
3%
761
23
4%
22
317
12
572
48
60

Tab
le 1
7:
Cock
tail
I-M
anual
exper
imen
ts h
ad 2
8 s
cans
per
targ
et a
nd e
xper
imen
ts r
un o
n t
he
auto
mate
d i
oniz
ati
on s
ourc
e had 2
1
scans
per
targ
et. R
ed s
ha
din
g i
ndic
ate
s fa
ilure
to m
eet
det
ecti
on c
rite
ria.
Concentration in
blood ( ng/mL)
Precursor m/z
Product m/z
Man
ual
Die
cut
Lase
rcu
t
S:B
Run Ratio
Ratio
Deviation
S:B
Run Ratio
Ratio
Deviation
S:B
Run Ratio
Ratio
Deviation
True Ratio
Chlo
rphen
iram
ine
25
275
230
43
51
-4%
1192
50
-5%
26
50
-5%
53
167
28
1324
96
Morp
hin
e 25
286
152
4
79
12%
4
63
-12%
2
62
-12%
71
165
3
5
2
Ox
ym
orp
hon
e 25
302
227
8
77
6%
12
100
37%
3
112
53%
73
198
8
7
1
Zal
eplo
n
25
306
236
16
88
0%
18
99
13%
1
68
-23%
88
264
15
8
3
Met
had
one
25
310
265
36
33
1%
1763
33
3%
251
32
1%
32
105
23
306
59
Clo
naz
epam
25
316
270
5
29
-8%
3
24
-26%
1
44
39%
32
214
10
4
1
Flu
vox
amin
e 25
319
71
10
25
16%
37
24
13%
11
23
10%
21
200
4
13
4
Par
ox
etin
e 25
330
192
9
59
13%
26
57
9%
8
51
-3%
52
70
6
11
8
Busp
irone
25
386
122
36
23
28%
1977
18
1%
118
19
3%
18
95
5
91
15
Zopic
lone
25
389
245
5
35
-11%
7
37
-6%
4
33
-15%
39
112
18
7
11
61

Table 18: Cocktail J-Manual experiments had 19 scans per target and experiments run
on the automated ionization source had 18 scans per target. Red shading indicates
failure to meet detection criteria.
Conce
ntr
ati
on i
n
blo
od (ng/mL)
Pre
curs
or
m/z
Pro
duct
m/z
Manual Lasercut
S:B
Run R
atio
Rat
io
Dev
iati
on
S:B
Run R
atio
Rat
io
Dev
iati
on
Tru
e R
atio
mCPP 20 197 154 6
81 -9%8
90 1% 89 118 13 4
Methylphenidate 20 234 84 12
13 5% 114
13 4% 13 56 6 5
Nordoxepin 20 266 107 8
59 -1%10
56 -7% 60 235 14 36
Desipramine 20 267 72 17
37 79% 249
27 34% 20 193 6 5
7-aminoflunitrazepam 20 284 135 11
51 0% 9
55 8% 51 227 13 8
Trimipramine 20 295 193 8
78 10% 25
100 41% 71 208 8 26
Norfluoxetine 20 296 134 3
19 -25%4
19 -28% 26 30 10 76
Duloxetine 20 298 44 2
95 10% 14
88 1% 87 154 2 3
Benztropine 10 308 167 13
45 -1%195
1 -98% 45 165 13 14
Fluoxetine 20 310 44 15
16 30% 219
17 34% 13 148 6 3
Flunitrazepam 20 314 268 3
32 -16%2
23 -40% 38 239 7 5
Clomipramine 20 315 227 4
49 -33%10
67 -8% 73 242 5 16
Triazolam 20 343 308 13
85 11% 336
80 6% 76 239 5 13
Amlodipine 20 409 238 2
77 14% 17
79 18% 67 294 2 2
62
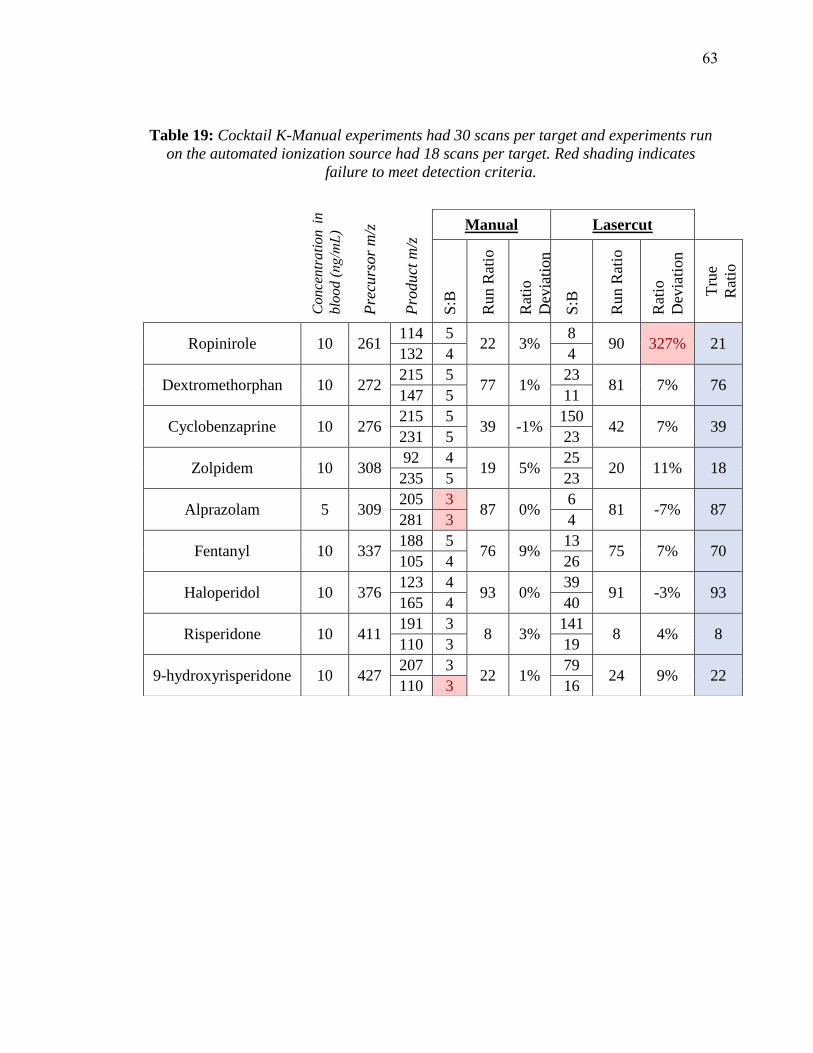
Table 19: Cocktail K-Manual experiments had 30 scans per target and experiments run
on the automated ionization source had 18 scans per target. Red shading indicates
failure to meet detection criteria.
Conce
ntr
ati
on i
n
blo
od (ng/mL)
Pre
curs
or
m/z
Pro
duct
m/z
Manual Lasercut
S:B
Run R
atio
Rat
io
Dev
iati
on
S:B
Run R
atio
Rat
io
Dev
iati
on
Tru
e
Rat
io
Ropinirole 10 261 114 5
22 3% 8
90 327% 21 132 4 4
Dextromethorphan 10 272 215 5
77 1% 23
81 7% 76 147 5 11
Cyclobenzaprine 10 276 215 5
39 -1%150
42 7% 39 231 5 23
Zolpidem 10 308 92 4
19 5% 25
20 11% 18 235 5 23
Alprazolam 5 309 205 3
87 0% 6
81 -7% 87 281 3 4
Fentanyl 10 337 188 5
76 9% 13
75 7% 70 105 4 26
Haloperidol 10 376 123 4
93 0% 39
91 -3% 93 165 4 40
Risperidone 10 411 191 3
8 3% 141
8 4% 8 110 3 19
9-hydroxyrisperidone 10 427 207 3
22 1% 79
24 9% 22 110 3 16
63
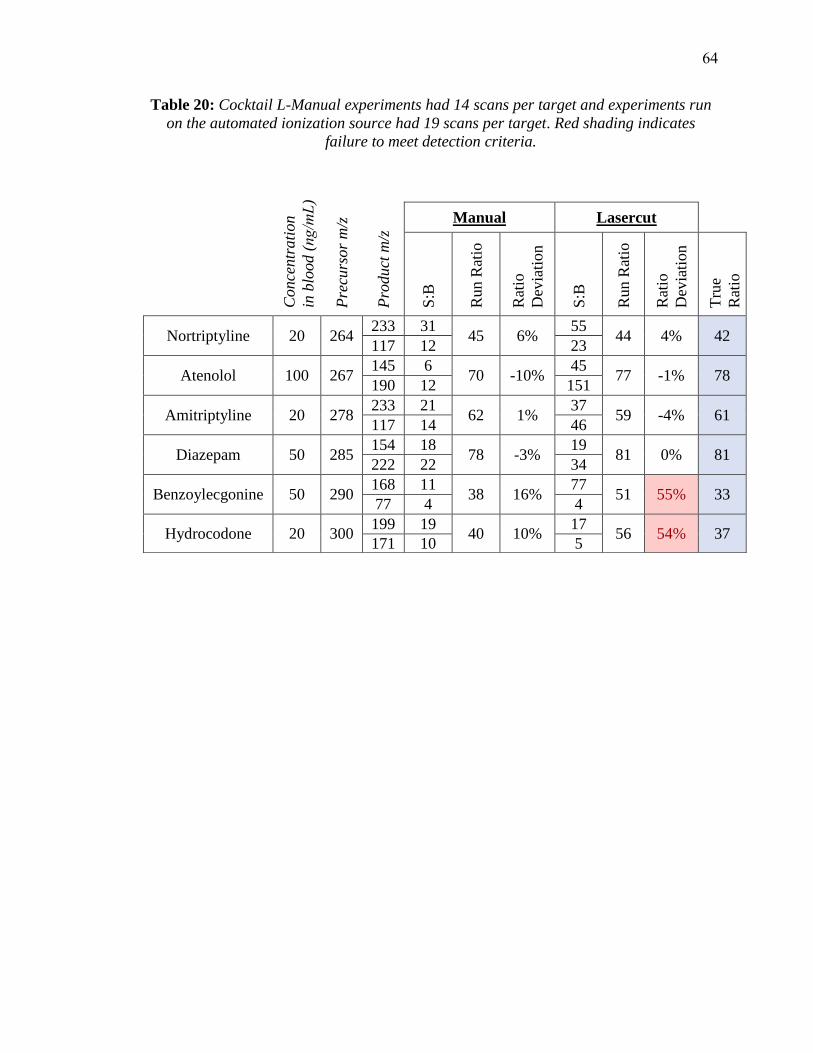
Table 20: Cocktail L-Manual experiments had 14 scans per target and experiments run
on the automated ionization source had 19 scans per target. Red shading indicates
failure to meet detection criteria.
Conce
ntr
ati
on
in b
lood (ng/mL)
Pre
curs
or
m/z
Pro
duct
m/z
Manual Lasercut
S:B
Run R
atio
Rat
io
Dev
iati
on
S:B
Run R
atio
Rat
io
Dev
iati
on
Tru
e
Rat
io
Nortriptyline 20 264 233 31
45 6% 55
44 4% 42 117 12 23
Atenolol 100 267 145 6
70 -10%45
77 -1% 78 190 12 151
Amitriptyline 20 278 233 21
62 1% 37
59 -4% 61 117 14 46
Diazepam 50 285 154 18
78 -3%19
81 0% 81 222 22 34
Benzoylecgonine 50 290 168 11
38 16% 77
51 55% 33 77 4 4
Hydrocodone 20 300 199 19
40 10% 17
56 54% 37 171 10 5
64

Table 21: Cocktail M- Manual experiments had 13 scans per target and experiments run
on the automated ionization source had 18 scans per target. Red shading indicates
failure to meet detection criteria.
Conce
ntr
ati
on
in
blo
od (ng/mL)
Pre
curs
or
m/z
Pro
duct
m/z
Manual Lasercut
S:B
Run R
atio
Rat
io
Dev
iati
on
S:B
Run R
atio
Rat
io
Dev
iati
on
Tru
e R
atio
Nordiazepam 50 271 140 44
72 6% 25
72 -6% 68 208 29 16
Doxepin 20 280 107 12
48 -8%28
51 -2% 52 165 15 28
Hydromorphone 20 286 185 6
77 11% 3
105 53% 69 157 4 3
Oxazepam 50 287 241 2
89 511% 2
188 1151% 15 77 1 2
Codeine 20 300 215 10
74 23% 4
46 -25% 61 199 4 5
Temazepam 50 301 177 2
26 -17%7
47 48% 32 239 3 3
Cocaine 50 304 182 46
23 8% 97
22 2% 21 82 14 49
Citalopram 10 325 262 16
78 66% 28
68 44% 47 234 6 12
65
6 INTERFERENCE STUDY
In order for paper spray to be a viable approach to post-mortem toxicological
screening it must be able to differentiate target analytes from endogenous substances that
exist within a matrix, and it must also be able to differentiate target analytes from other
exogenous compounds. For example, PCP is one of the analytical targets of the
developed screening method and is categorized as a schedule II controlled substance in
the US, but it shares the same molecular weight as frovatriptan, a prescription migraine
medication. In this instance, the legal medication could affect the results for a controlled
substance by producing a parent ion with the same mass to charge ratio. It is therefore
necessary to investigate the specificity of the developed method in producing accurate
results in the presence of potentially interfering compounds.
Interferences to the target analytes can arise from several different situations. Both
exogenous and endogenous isomers of an analyte may produce common daughter
fragments with the target analyte, which would result in skewed fragmentation ratios and
could create false negative results. Compounds that do not share the same mass as the
target could even interfere by producing adduct ions more complex than [M+H]+ that
have the same mass to charge ratio as the protonated adduct of the target analyte.
Isotopic interferences could also arise when molecules with moieties containing heavily
abundant isotopes, such as chlorine or bromine, are present. To a lesser extent, isotopic
interferences in larger molecules could even arise due to the C-13 isotope if the
interfering compound is found at a much higher concentration than the target analyte.
Although this makes the list of potential interferences for the project’s 154 different
analytical targets practically unquantifiable, investigating, to a reasonable extent,
potentially interfering compounds will help inform data interpretation.
To investigate compounds that could cause interferences with the developed drug
screening method, potential interferences were sorted into two classifications:
interferences that arise from exogenous substances potentially contained within blood,
and intra-target interferences that arise from isomeric or isotopic parent ion overlap
between the 154 analytical targets defined in the study.
66
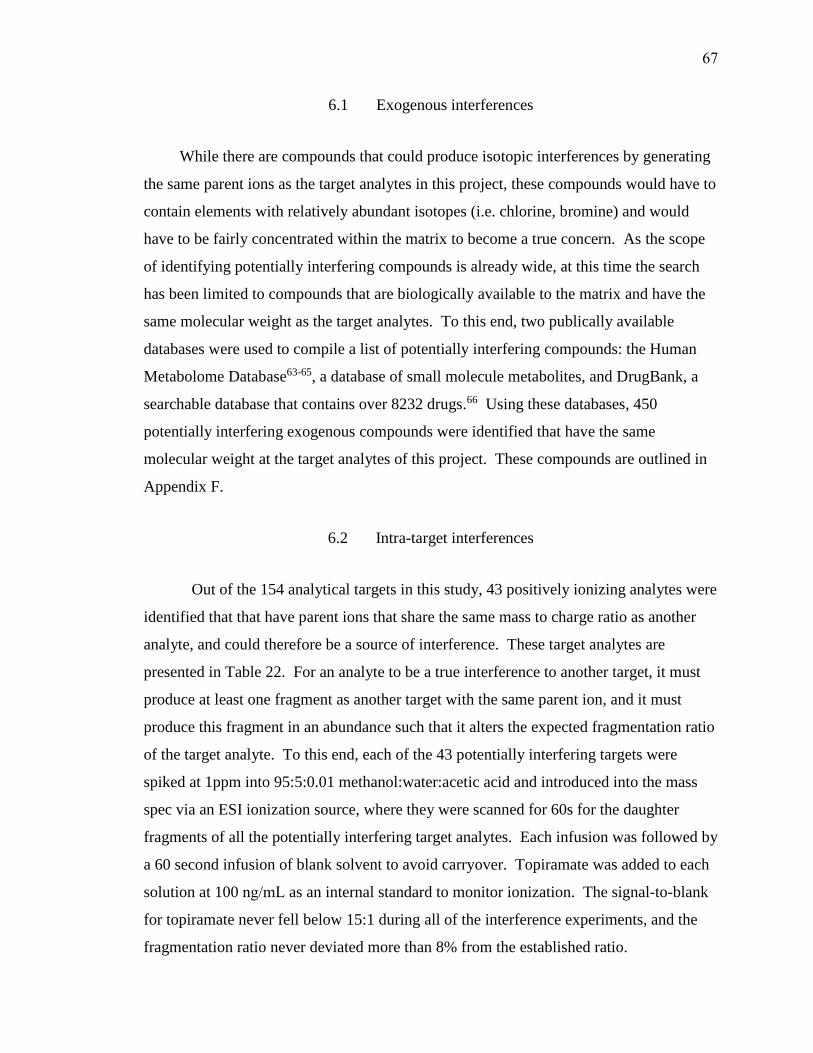
6.1 Exogenous interferences
While there are compounds that could produce isotopic interferences by generating
the same parent ions as the target analytes in this project, these compounds would have to
contain elements with relatively abundant isotopes (i.e. chlorine, bromine) and would
have to be fairly concentrated within the matrix to become a true concern. As the scope
of identifying potentially interfering compounds is already wide, at this time the search
has been limited to compounds that are biologically available to the matrix and have the
same molecular weight as the target analytes. To this end, two publically available
databases were used to compile a list of potentially interfering compounds: the Human
Metabolome Database63-65, a database of small molecule metabolites, and DrugBank, a
searchable database that contains over 8232 drugs.66 Using these databases, 450
potentially interfering exogenous compounds were identified that have the same
molecular weight at the target analytes of this project. These compounds are outlined in
Appendix F.
6.2 Intra-target interferences
Out of the 154 analytical targets in this study, 43 positively ionizing analytes were
identified that that have parent ions that share the same mass to charge ratio as another
analyte, and could therefore be a source of interference. These target analytes are
presented in Table 22. For an analyte to be a true interference to another target, it must
produce at least one fragment as another target with the same parent ion, and it must
produce this fragment in an abundance such that it alters the expected fragmentation ratio
of the target analyte. To this end, each of the 43 potentially interfering targets were
spiked at 1ppm into 95:5:0.01 methanol:water:acetic acid and introduced into the mass
spec via an ESI ionization source, where they were scanned for 60s for the daughter
fragments of all the potentially interfering target analytes. Each infusion was followed by
a 60 second infusion of blank solvent to avoid carryover. Topiramate was added to each
solution at 100 ng/mL as an internal standard to monitor ionization. The signal-to-blank
for topiramate never fell below 15:1 during all of the interference experiments, and the
fragmentation ratio never deviated more than 8% from the established ratio.
67

During these preliminary experiments, 25 target analytes were identified that had
a signal-to-blank greater than 3:1 when monitoring the SRM channels for a different
analyte. The results for the initial experiments using the ESI spray source are presented
in Table 23. These targets were investigated further, while the other 18 analytes were
concluded to not be true interferences since they added no significant increase in signal at
1000 ng/mL, a concentration much higher than the cutoff levels for most of the targets.
Table 22: Targets that share the same parent ion and could potentially interfere with
one another.
Name
Cutoff in ng/mL MW
Parent
Ion
Product
Ion 1
Product
Ion 2
Ion
Ratio
Primidone 5000 218 219.087 162.111 91.055 100:70
Meprobamate 2000 218 219.096 158.134 97.105 100:101
Amobarbital 500 226 225.116 182.139 42.066 100:47
Pentobarbital 500 226 225.116 182.144 42.043 100:45
Normeperidine 25 233 234.121 160.129 56.068 100:22
Methylphenidate 20 233 234.122 84.086 56.072 100:12
Phenytoin 5000 252 253.081 182.110 104.046 100:65
Carbamazepine-10,11-
epoxide 1000 252 253.088 180.092 210.110 100:36
Lamotrigine 1000 255 256.010 210.993 144.949 100:65
Diphenhydramine 25 255 256.129 167.098 165.073 100:48
Carisoprodol 2000 260 261.144 97.097 55.065 100:81
Ropinirole 10 260 261.145 114.128 86.099 100:25
Nordoxepin 20 265 266.120 107.042 235.118 100:57
Mirtazapine 50 265 266.133 195.104 194.091 100:41
Norsertraline 100 291 275.030 158.974 123.990 100:26
Chlorpheniramine 25 274 275.104 230.082 167.072 100:54
68

Table 22 Continued
Name
Cutoff in ng/mL MW
Parent
Ion
Product
Ion 1
Product
Ion 2
Ion
Ratio
MDPV 50 275 276.127 175.086 135.041 100:91
Cyclobenzaprine 10 275 276.141 215.092 216.106 100:56
EDDP 25 277 278.146 234.128 249.166 100:51
Venlafaxine 50 277 278.154 58.083 121.063 100:26
7-aminoclonazepam 10 285 286.057 222.134 121.109 100:85
Morphine 20 285 286.107 152.057 165.062 100:70
Pentazocine 50 285 286.162 218.155 69.068 100:29
Desalkylflurazepam 50 288 289.035 140.015 226.092 100:66
Bupivacaine 500 288 289.165 140.126 98.094 100:19
Chlordiazepoxide 50 299 300.070 227.044 241.056 100:27
Metoclopramide 100 299 300.125 227.057 184.026 100:51
Sertraline 100 305 306.067 158.971 275.068 100:84
Zaleplon 25 305 306.106 236.088 264.123 100:85
Zolpidem 10 307 308.136 235.158 92.076 100:19
Benztropine 10 307 308.149 167.074 165.069 100:68
Norpropoxyphene 50 325 308.155 100.064 44.064 100:71
Fluoxetine 20 309 310.106 44.069 148.105 100:6
Methadone 25 309 310.156 265.166 105.027 100:34
Norclozapine 50 312 313.096 192.062 270.081 100:70
Olanzapine 50 312 313.124 256.070 198.025 100:49
Clomipramine 20 314 315.120 86.087 58.072 100:37
Ranitidine 500 314 315.124 176.061 102.026 100:53
delta9-THC 10 314 315.167 193.130 123.032 100:65
Clonazepam 10 315 316.000 270.156 214.002 100:36
Oxycodone 20 315 316.115 241.094 256.128 100:82
Brompheniramine 25 318 319.060 274.026 167.065 100:52
Chlorpromazine 50 318 319.084 86.090 58.075 100:46
Fluvoxamine 20 318 319.126 71.047 200.007 100:24
69

Table 23: Using an ESI spray source, targets were analyzed at 1000 ng/mL in solutionfor the transitions used in the analysis of other targets which share the same parent ion.
S:B less than 3:1 indicated that the target would not interfere with the channels scanned
for the other target, while a greater signal routed targets through additional interference
testing. The following 25 targets were found to have S:B greater than 3:1 for the
transitions recorded below
Table 23 Continued
Target Present in
Neat Solution
Target whose
fragments were
scanned for
SRM AUC S:B
Methylphenidate Normeperdine 324 -> 56 Blank 5.4E+03
8586 Interference 4.6E+07
Lamotrigine Diphenhydramine 256 -> 165 Blank 8.0E+03
1201 Interference 9.6E+06
Ranitidine Clomipramine
315 -> 86 Blank 6.2E+04
4 Interference 2.5E+05
315 -> 58 Blank 2.6E+04
90 Interference 2.3E+06
Methadone Fluoxetine
310 -> 44 Blank 6.0E+01
64 Interference 3.8E+03
310 ->148 Blank 3.0E+01
6 Interference 1.9E+02
Normeperidine Methylphenidate
234 -> 84 Blank 5.6E+03
5 Interference 2.5E+04
234 ->56 Blank 3.4E+03
7478 Interference 2.5E+07
Pentazocine
7-Aminoclonazepam
286 -> 94 Blank 1.8E+03
63 Interference 1.1E+05
286 -> 121 Blank 4.2E+03
497 Interference 2.1E+06
Morphine
286 -> 152 Blank 1.0E+03
3059 Interference 3.2E+06
286 -> 165 Blank 1.7E+03
77 Interference 1.3E+05
Normeperidine Methylphenidate
234 -> 84 Blank 5.4E+03
5 Interference 2.5E+04
234 -> 56 Blank 3.4E+03
7478 Interference 2.5E+07
70
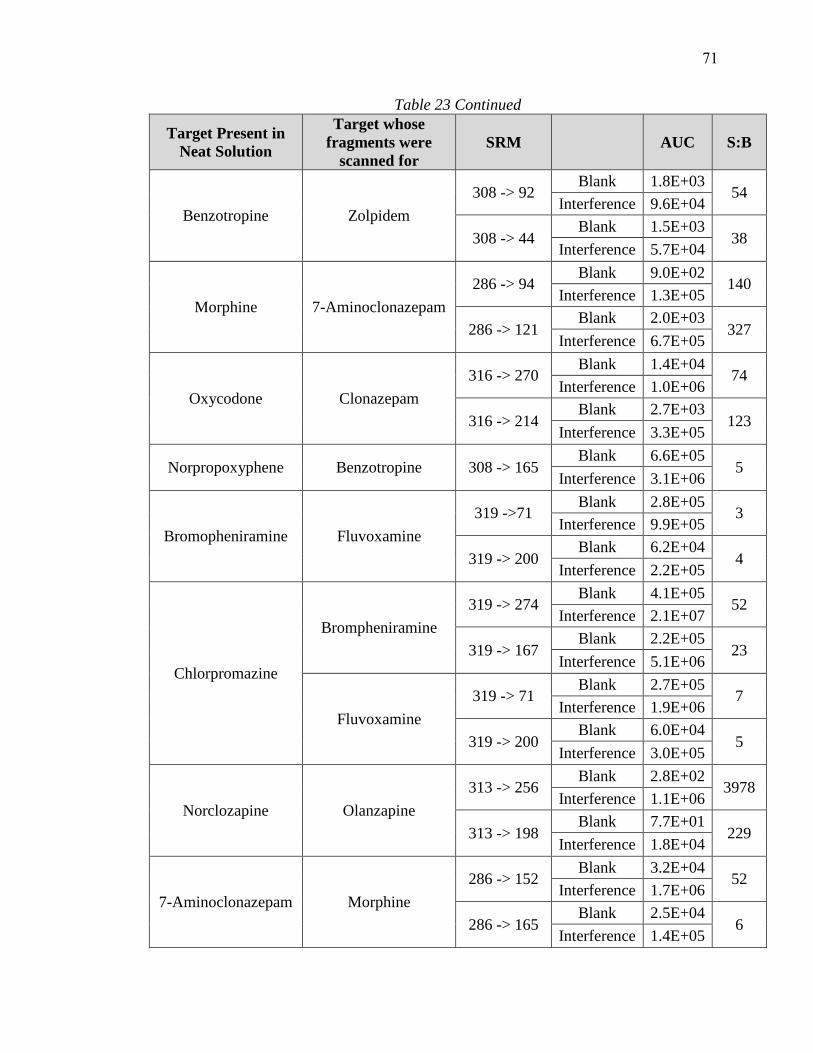
Table 23 Continued
Target Present in
Neat Solution
Target whose
fragments were
scanned for
SRM AUC S:B
Benzotropine Zolpidem
308 -> 92 Blank 1.8E+03
54 Interference 9.6E+04
308 -> 44 Blank 1.5E+03
38 Interference 5.7E+04
Morphine 7-Aminoclonazepam
286 -> 94 Blank 9.0E+02
140 Interference 1.3E+05
286 -> 121 Blank 2.0E+03
327 Interference 6.7E+05
Oxycodone Clonazepam
316 -> 270 Blank 1.4E+04
74 Interference 1.0E+06
316 -> 214 Blank 2.7E+03
123 Interference 3.3E+05
Norpropoxyphene Benzotropine 308 -> 165 Blank 6.6E+05
5 Interference 3.1E+06
Bromopheniramine Fluvoxamine
319 ->71 Blank 2.8E+05
3 Interference 9.9E+05
319 -> 200 Blank 6.2E+04
4 Interference 2.2E+05
Chlorpromazine
Brompheniramine
319 -> 274 Blank 4.1E+05
52 Interference 2.1E+07
319 -> 167 Blank 2.2E+05
23 Interference 5.1E+06
Fluvoxamine
319 -> 71 Blank 2.7E+05
7 Interference 1.9E+06
319 -> 200 Blank 6.0E+04
5 Interference 3.0E+05
Norclozapine Olanzapine
313 -> 256 Blank 2.8E+02
3978 Interference 1.1E+06
313 -> 198 Blank 7.7E+01
229 Interference 1.8E+04
7-Aminoclonazepam Morphine
286 -> 152 Blank 3.2E+04
52 Interference 1.7E+06
286 -> 165 Blank 2.5E+04
6 Interference 1.4E+05
71

Table 23 Continued
Target Present in
Neat Solution
Target whose
fragments were
scanned for
SRM AUC S:B
Chlordiazepoxide Metoclopramide 300 -> 227 Blank 5.7E+05
300 Interference 1.7E+08
Clonazepam Oxycodone
316 -> 241 Blank 1.1E+03
941 Interference 1.1E+06
316 -> 212 Blank 1.1E+03
13 Interference 1.4E+04
Desalkylflurazepam Bupivicaine
289 -> 140 Blank 1.5E+03
11121 Interference 1.7E+07
289 -> 98 Blank 1.4E+03
3 Interference 4.7E+03
Cyclobenzapirine MDPV
276 -> 175 Blank 3.1E+03
11 Interference 3.4E+04
276 -> 135 Blank 3.5E+03
3 Interference 1.1E+04
Cabamazepine,
10-,11-epoxide Phenytoin
253 -> 182 Blank 3.5E+02
25237 Interference 8.9E+06
253 -> 104 Blank 3.8E+02
119 Interference 4.5E+04
Clomipramine Ranitidine
315 ->176 Blank 3.6E+03
8 Interference 2.9E+04
315 -> 102 Blank 7.0E+02
36 Interference 2.5E+04
Fluvoxamine
Brompheniramine
319 -> 274 Blank 2.5E+03
21 Interference 5.2E+04
319 -> 167 Blank 5.2E+03
7 Interference 3.5E+04
Chlorpromazine 319 -> 58 Blank 7.3E+03
5 Interference 3.8E+04
Mirtazapine Nordoxepin
266 -> 107 Blank 1.7E+03
1196 Interference 2.0E+06
266 ->235 Blank 3.0E+02
47460 Interference 1.4E+07
72
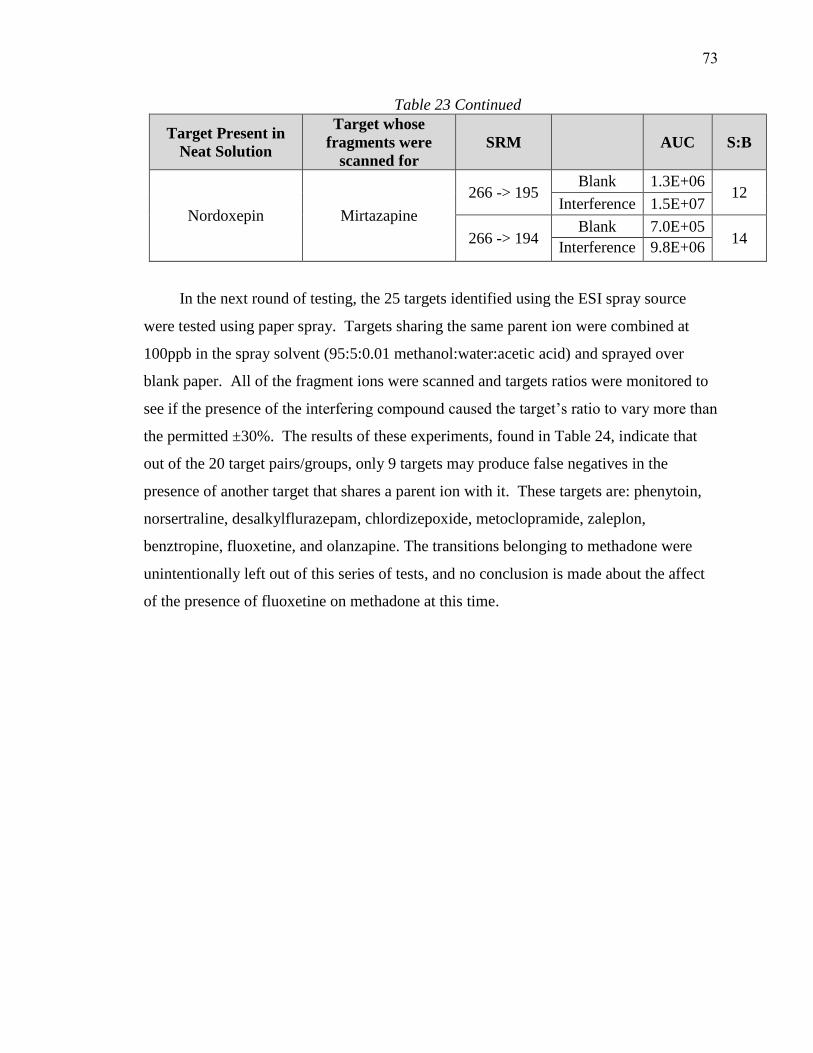
Table 23 Continued
Target Present in
Neat Solution
Target whose
fragments were
scanned for
SRM AUC S:B
Nordoxepin Mirtazapine
266 -> 195 Blank 1.3E+06
12 Interference 1.5E+07
266 -> 194 Blank 7.0E+05
14 Interference 9.8E+06
In the next round of testing, the 25 targets identified using the ESI spray source
were tested using paper spray. Targets sharing the same parent ion were combined at
100ppb in the spray solvent (95:5:0.01 methanol:water:acetic acid) and sprayed over
blank paper. All of the fragment ions were scanned and targets ratios were monitored to
see if the presence of the interfering compound caused the target’s ratio to vary more than
the permitted ±30%. The results of these experiments, found in Table 24, indicate that
out of the 20 target pairs/groups, only 9 targets may produce false negatives in the
presence of another target that shares a parent ion with it. These targets are: phenytoin,
norsertraline, desalkylflurazepam, chlordizepoxide, metoclopramide, zaleplon,
benztropine, fluoxetine, and olanzapine. The transitions belonging to methadone were
unintentionally left out of this series of tests, and no conclusion is made about the affect
of the presence of fluoxetine on methadone at this time.
73
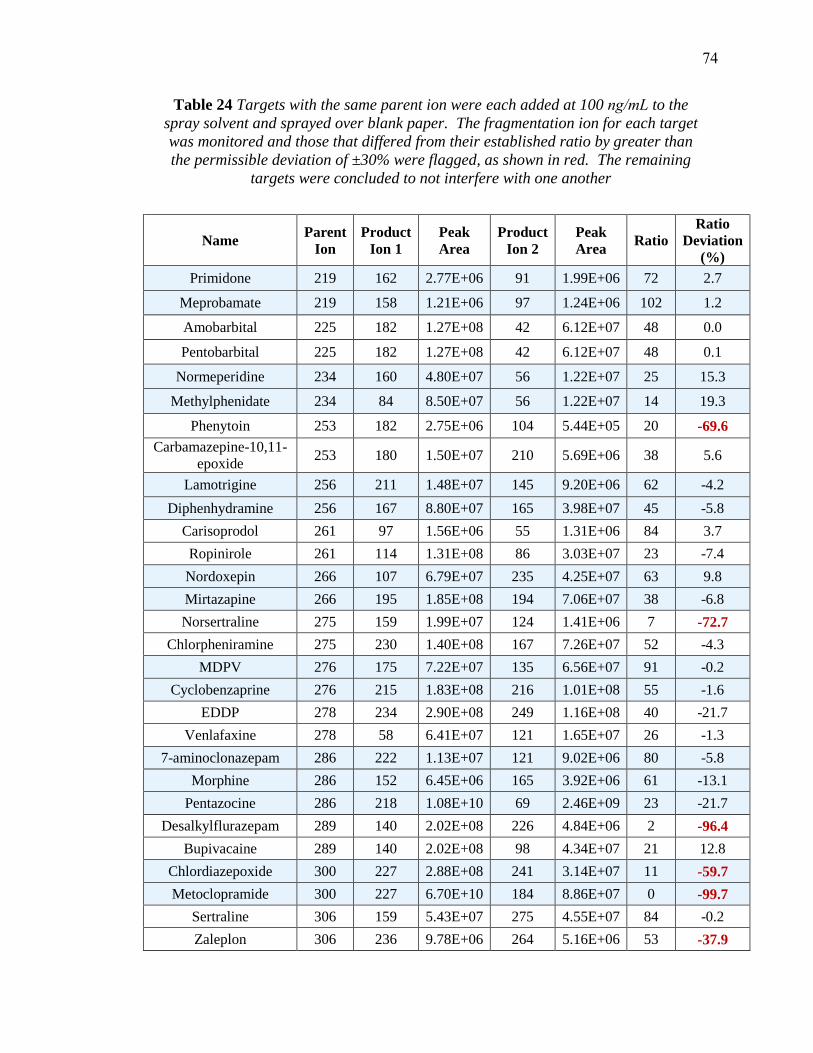
Table 24 Targets with the same parent ion were each added at 100 ng/mL to the
spray solvent and sprayed over blank paper. The fragmentation ion for each target
was monitored and those that differed from their established ratio by greater than
the permissible deviation of ±30% were flagged, as shown in red. The remaining
targets were concluded to not interfere with one another
Table 24 continued
Name Parent
Ion
Product
Ion 1
Peak
Area
Product
Ion 2
Peak
Area Ratio
Ratio
Deviation
(%)
Primidone 219 162 2.77E+06 91 1.99E+06 72 2.7
Meprobamate 219 158 1.21E+06 97 1.24E+06 102 1.2
Amobarbital 225 182 1.27E+08 42 6.12E+07 48 0.0
Pentobarbital 225 182 1.27E+08 42 6.12E+07 48 0.1
Normeperidine 234 160 4.80E+07 56 1.22E+07 25 15.3
Methylphenidate 234 84 8.50E+07 56 1.22E+07 14 19.3
Phenytoin 253 182 2.75E+06 104 5.44E+05 20 -69.6
Carbamazepine-10,11-
epoxide 253 180 1.50E+07 210 5.69E+06 38 5.6
Lamotrigine 256 211 1.48E+07 145 9.20E+06 62 -4.2
Diphenhydramine 256 167 8.80E+07 165 3.98E+07 45 -5.8
Carisoprodol 261 97 1.56E+06 55 1.31E+06 84 3.7
Ropinirole 261 114 1.31E+08 86 3.03E+07 23 -7.4
Nordoxepin 266 107 6.79E+07 235 4.25E+07 63 9.8
Mirtazapine 266 195 1.85E+08 194 7.06E+07 38 -6.8
Norsertraline 275 159 1.99E+07 124 1.41E+06 7 -72.7
Chlorpheniramine 275 230 1.40E+08 167 7.26E+07 52 -4.3
MDPV 276 175 7.22E+07 135 6.56E+07 91 -0.2
Cyclobenzaprine 276 215 1.83E+08 216 1.01E+08 55 -1.6
EDDP 278 234 2.90E+08 249 1.16E+08 40 -21.7
Venlafaxine 278 58 6.41E+07 121 1.65E+07 26 -1.3
7-aminoclonazepam 286 222 1.13E+07 121 9.02E+06 80 -5.8
Morphine 286 152 6.45E+06 165 3.92E+06 61 -13.1
Pentazocine 286 218 1.08E+10 69 2.46E+09 23 -21.7
Desalkylflurazepam 289 140 2.02E+08 226 4.84E+06 2 -96.4
Bupivacaine 289 140 2.02E+08 98 4.34E+07 21 12.8
Chlordiazepoxide 300 227 2.88E+08 241 3.14E+07 11 -59.7
Metoclopramide 300 227 6.70E+10 184 8.86E+07 0 -99.7
Sertraline 306 159 5.43E+07 275 4.55E+07 84 -0.2
Zaleplon 306 236 9.78E+06 264 5.16E+06 53 -37.9
74
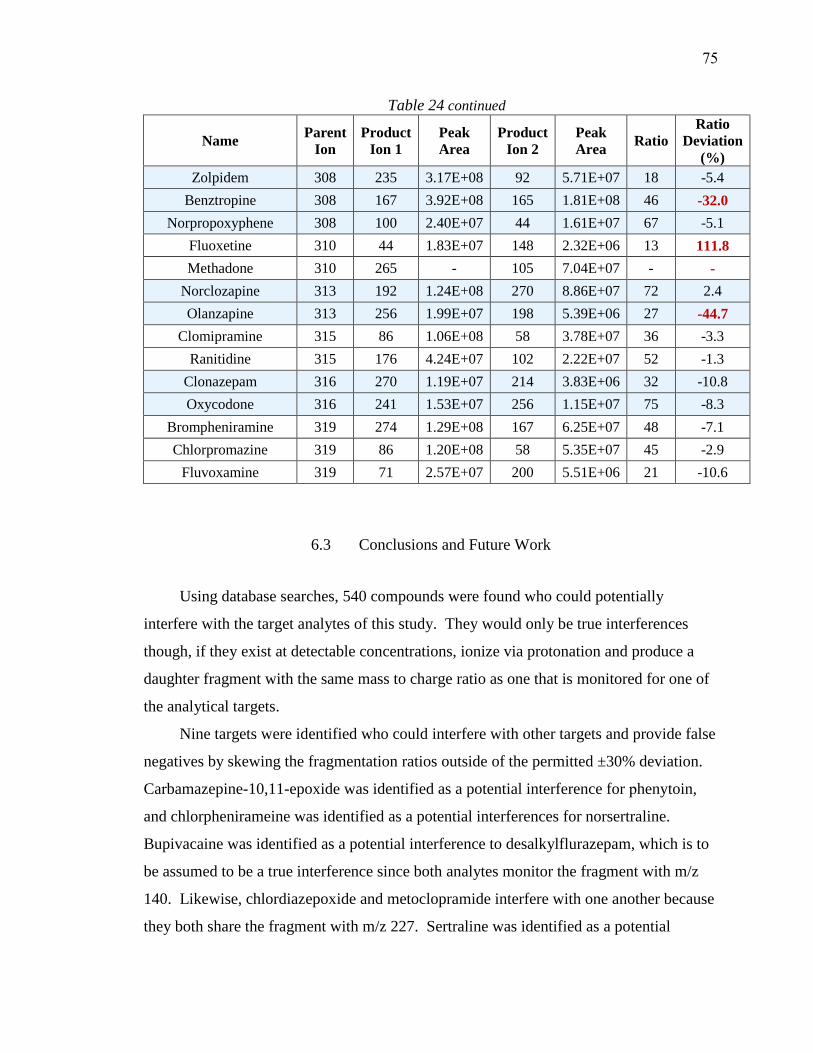
Table 24 continued
Name Parent
Ion
Product
Ion 1
Peak
Area
Product
Ion 2
Peak
Area Ratio
Ratio
Deviation
(%)
Zolpidem 308 235 3.17E+08 92 5.71E+07 18 -5.4
Benztropine 308 167 3.92E+08 165 1.81E+08 46 -32.0
Norpropoxyphene 308 100 2.40E+07 44 1.61E+07 67 -5.1
Fluoxetine 310 44 1.83E+07 148 2.32E+06 13 111.8
Methadone 310 265 - 105 7.04E+07 - -
Norclozapine 313 192 1.24E+08 270 8.86E+07 72 2.4
Olanzapine 313 256 1.99E+07 198 5.39E+06 27 -44.7
Clomipramine 315 86 1.06E+08 58 3.78E+07 36 -3.3
Ranitidine 315 176 4.24E+07 102 2.22E+07 52 -1.3
Clonazepam 316 270 1.19E+07 214 3.83E+06 32 -10.8
Oxycodone 316 241 1.53E+07 256 1.15E+07 75 -8.3
Brompheniramine 319 274 1.29E+08 167 6.25E+07 48 -7.1
Chlorpromazine 319 86 1.20E+08 58 5.35E+07 45 -2.9
Fluvoxamine 319 71 2.57E+07 200 5.51E+06 21 -10.6
6.3 Conclusions and Future Work
Using database searches, 540 compounds were found who could potentially
interfere with the target analytes of this study. They would only be true interferences
though, if they exist at detectable concentrations, ionize via protonation and produce a
daughter fragment with the same mass to charge ratio as one that is monitored for one of
the analytical targets.
Nine targets were identified who could interfere with other targets and provide false
negatives by skewing the fragmentation ratios outside of the permitted ±30% deviation.
Carbamazepine-10,11-epoxide was identified as a potential interference for phenytoin,
and chlorphenirameine was identified as a potential interferences for norsertraline.
Bupivacaine was identified as a potential interference to desalkylflurazepam, which is to
be assumed to be a true interference since both analytes monitor the fragment with m/z
140. Likewise, chlordiazepoxide and metoclopramide interfere with one another because
they both share the fragment with m/z 227. Sertraline was identified as a potential
75
interference for zaleplon, and methadone was identified as a potential interference to
fluoxetine. Finally, norclozapine was identified as a potential interference to the
detection of olanzapine.
A final set of experiments needs to be run to confirm the effect of intra-target
interferences. The nine analytes that were identified as potential interferences in neat
solution need to be analyzed in blood along with the targets that seem to cause their
fragmentation ratios to skew. The extraction efficiencies and the ionization suppression
will likely be different for each target, so the targets should be run together with the
interfering compound at a very high concentration to test for a “worst case scenario,” and
they should also be run at the cutoff levels for a more realistic assessment of the extent to
which they may interfere.
76
7 CONCLUSIONS
Drug screening is a necessary tool in postmortem investigations that focuses
analytical efforts, time, and resources. Currently, drug screening itself can consume
huge amounts of time and money in sample clean-up and analysis, and adding newly
emerging compounds can be cumbersome. Paper Spray Mass Spectrometry provides an
alternative method for drug screening that drastically simplifies the screening process,
allowing for rapid detection of a wide variety of drugs. While paper spray analysis has
historically been applied to a small focused panel of targets, by adapting existing
techniques, it has been found to be suitable to use in large-panel screening as well.
7.1 Summary of Conclusions
Two methods were developed during this project: the first was a manually run
method that used hand-cut paper. By detecting two daughter fragments and by
monitoring the ratio between their relative abundancies, this method was able to detect
114 drugs and metabolites at toxicologically relevant concentrations in blood. Using this
method, screening the entire panel of drugs can be accomplished in three sixty second
runs, requiring only 10.5 µL of blood. Screening these 114 targets, this “manual” method
would require approximately 9 minutes total analysis time. In order to really make paper
spray a viable alternative, a second, more automated and commercially available method
was developed as well.
The second method used commercially available disposable cartridges on an
automated ionization source. Under the same detection criteria used in the manually run
experiments, this method was able to successfully detect a panel of 100 drugs and
metabolites at toxicologically relevant concentrations in blood. This method would also
require 3 replicate dried blood spot samples due to the time needed for the mass
spectrometer to scan through all of the SRM channels. Because of the larger paper size,
this method uses almost four times as much blood as the manual method, but the total
volume of blood required is still less than 50 µL. The automated method has the same
analytical run time
77

as the manual method, however, there is very little down time between samples since the
cartridges do not have to be cleaned, so the entire screening process can be accomplished
in about 4 minutes.
In addition to the successively developed methods, a list of potentially interfering
compounds was compiled that can inform future data interpretation. Within the analytes
on the panel tested, 9 were identified that could potentially interfere with one another and
lead to false negatives if both a present in a sample.
7.2 Discussion
The target levels of detection used in developing these methods were based on the
lower limit of quantitation for methods used at a local toxicology laboratory. While the
level of detection for paper spray was found to be higher than the LLOQ presented by the
toxicology laboratory in some instances, other times targets were run at lower
concentrations than the reported LLOQ’s. In the instances where PS-MS was not
sufficiently sensitive, it will be important to determine if the LOD is at a toxicologically
relevant concentration; in the cases where it is more sensitive, paper spray could help
properly route samples into confirmatory testing which could potentially be false
negatives when analyzed using other methods.
The concentrations, whether run at proposed cutoff levels or experimental LOD’s,
used during analysis were established in method development using the manual method.
The higher number of target analytes that were ultimately able to be detected in the
manual method vs the automated method using the laser-cut paper suggest room for
further method optimization and development for the automated method. Although only
about half as many targets were analyzed on die-cut paper as laser-cut paper, the percent
of targets detected on the die-cut paper (87%) is much more congruent with the manual
method (86%) than the laser-cut paper is (76%). It is possible that the laser cutting
approach used during manufacturing requires some refinement. If this is the case, a new
LOD may need to be established using the laser-cut paper, especially in the 11 cases
where a target was detected using the manual method, but not using the automated
78
method with the laser-cut paper. Revisiting blood spot placement and dilution could also
prove advantageous for future experiments run on the laser-cut paper.
In this project, 14 of the originally proposed analytical targets were not included
because preliminary tests showed that they only ionized well in negative mode and would
require further optimization in order to reach acceptable limits of detection. This work
was completed in a separate project, by McKenna et. al. where an optimized solvent of
90:10:0.01 MeOH:CCl4:NH4OH was used to successfully detect all 14 targets, 4 of
which were determined to have LOD’s slightly higher than the purposed screening cutoff
concentrations.67 This work was done on an exact mass instrument, but would be
translated to a triple quadrupole instrument.
7.3 Future work
The next set of experiments that need to be run are establishing calibration curves
for each of the analytes. This will establish an experimental LOD and can help inform
acceptance criteria. One of the largest hurdles faced in this project was establishing a
permissible ratio tolerance. Ratio tolerances are always discussed in the context of
chromatography, and usually at concentrations well above the LOD. Since no intentional
chromatography is performed during PS and this project deals with some analytes near or
at their LOD, running calibration curves will help establish the robustness of fragment
ion ratios in a context that has yet to be established. This could lead to justifying either
broadening or constricting the current ±30% permissible deviation, or even a ratio
tolerance that is tied to signal to blank ratio. To run a set of calibration curves, internal
standards (IS) will need to be chosen. Since it is impractical to use a stable-labeled
internal standard for every target, work will need to be done to find a reasonable number
of analogue standards that can act as internal standards for the entire panel of targets.
Ideally, these IS’s could be cocktailed together and spiked directly into a sample.
In addition to running calibration curves, a final blinded study of postmortem
samples should be run to determine the effectiveness of the assay on true postmortem
samples. These will included blood in various degrees of decomposition and can be used
to determine the false positive and false negative rate of the assay.
79
BIBLIOGRAPHY
1. Commission Decision of 12 August 2002 implementing Council Directive
96/23/EC concerning the performance of analytical methods and the interpretation
of results. European Commission; 2002.
2. Schulz M, Iwersen-Bergmann S, Andresen H, Schmoldt A. Therapeutic and toxic
blood concentrations of nearly 1,000 drugs and other xenobiotics. Critical Care.
2012;16(4):R136-R136.
3. Directorate ECHaCP. Guidance document on analytical quality control and
validation procedures for pesticide residues analysis in food and feed. . 2013.
4. Borzelleca JF. Paracelsus: Herald of Modern Toxicology. Toxicol Sci.
2000;53(1):2-4.
5. Committee WL. WADA Technical Document – TD2010IDCR. World Antidoping
Agency;2010.
6. European Laboratory Guidelines for Legally Defensible Workplace Drug Testing
Version 1.0. 2002; 39.
7. Guidance for the Validation of Analytical Methodology and Calibration of
Equipment used for Testing of Illicit Drugs in Seized Materials and Biological
Specimens. 2009.
8. SWGTOX. Scientific Working Group for Forensic Toxicology (SWGTOX)
Standard for Mass Spectral Data Acceptance for Definitive Identification.
swgtox.org. http://www.swgtox.org/documents/PublicComment20140715.pdf.
Published July 15, 2015. Accessed August 8, 2016.
9. Logan BK, Goldberger BA, Caplan YH, et al. What is Forensic Toxicology? July
2010.
10. Ojanperä I, Kolmonen M, Pelander A. Current use of high-resolution mass
spectrometry in drug screening relevant to clinical and forensic toxicology and
doping control. Analytical and Bioanalytical Chemistry. 2012;403(5):1203-1220.
11. Bogusz MJ. Forensic Science. Elsevier Science; 2000.
80
12. Stimpfl T, Muller K, Gergov M, et al. Recommendations on Sample Preparation
of Biological Specimens for Systematic Toxicological Analysis. The International
Association of Forensic Toxicologists.
13. Lappas NT, Lappas CM. Forensic Toxicology: Principles and Concepts. Elsevier
Science; 2015.
14. Jarvis M. Simultaneous Targeted and Unknown Screening using the 3200
QTRAP LC/MS/MS System and Cliquid Software. In: AB SCIEX C, ed: AB
SCIEX; 2011.
15. Hearn WL, Jones GR, McCutcheon JR, Logan BK, Middleberg RA. Forensic
Toxicology Laboratory Guidelines. Society of Forensic Toxicologists/American
Academy of Forensic Sciences; February 23, 2006.
16. Manicke NE. NIJ 2014 Program Narrative. Indiana University-Purdue University
Indianapolis; 2014:45.
17. Liu J, Wang H, Manicke NE, Lin J-M, Cooks RG, Ouyang Z. Development,
Characterization, and Application of Paper Spray Ionization. Anal Chem.
2010;82(6):2463-2471.
18. Manicke NE, Bills BJ, Zhang C. Analysis of biofluids by paper spray MS:
advances and challenges. Bioanalysis. 2016;8(6):589-606.
19. Takyi-Williams J, Dong X, Gong H, et al. Application of paper spray-MS in PK
studies using sunitinib and benzethonium as model compounds. Bioanalysis.
2015;7(4):413-423.
20. Evard H, Kruve A, Lõhmus R, Leito I. Paper spray ionization mass spectrometry:
Study of a method for fast-screening analysis of pesticides in fruits and
vegetables. Journal of Food Composition and Analysis. 2015;41:221-225.
21. Li A, Wei P, Hsu HC, Cooks RG. Direct analysis of 4-methylimidazole in foods
using paper spray mass spectrometry. Analyst. 2013;138(16):4624-4630.
22. Taverna D, Di Donna L, Mazzotti F, Policicchio B, Sindona G. High-throughput
determination of Sudan Azo-dyes within powdered chili pepper by paper spray
mass spectrometry. J Mass Spectrom. 2013;48(5):544-547.
81
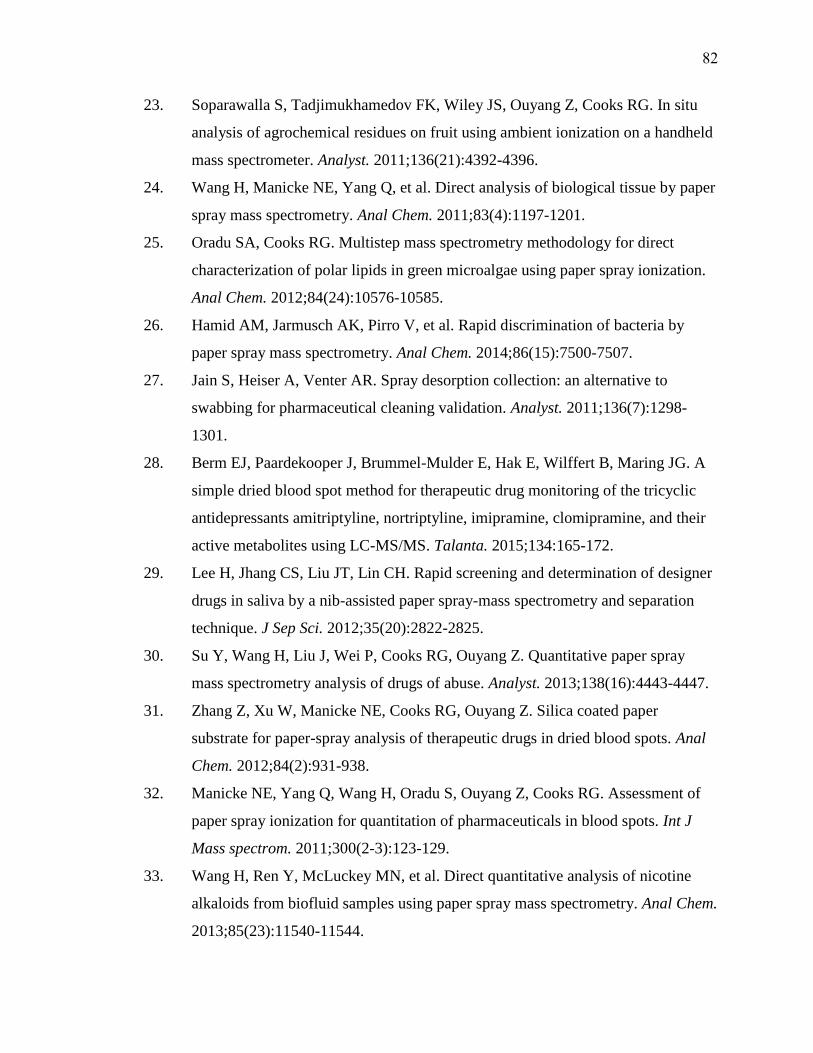
23. Soparawalla S, Tadjimukhamedov FK, Wiley JS, Ouyang Z, Cooks RG. In situ
analysis of agrochemical residues on fruit using ambient ionization on a handheld
mass spectrometer. Analyst. 2011;136(21):4392-4396.
24. Wang H, Manicke NE, Yang Q, et al. Direct analysis of biological tissue by paper
spray mass spectrometry. Anal Chem. 2011;83(4):1197-1201.
25. Oradu SA, Cooks RG. Multistep mass spectrometry methodology for direct
characterization of polar lipids in green microalgae using paper spray ionization.
Anal Chem. 2012;84(24):10576-10585.
26. Hamid AM, Jarmusch AK, Pirro V, et al. Rapid discrimination of bacteria by
paper spray mass spectrometry. Anal Chem. 2014;86(15):7500-7507.
27. Jain S, Heiser A, Venter AR. Spray desorption collection: an alternative to
swabbing for pharmaceutical cleaning validation. Analyst. 2011;136(7):1298-
1301.
28. Berm EJ, Paardekooper J, Brummel-Mulder E, Hak E, Wilffert B, Maring JG. A
simple dried blood spot method for therapeutic drug monitoring of the tricyclic
antidepressants amitriptyline, nortriptyline, imipramine, clomipramine, and their
active metabolites using LC-MS/MS. Talanta. 2015;134:165-172.
29. Lee H, Jhang CS, Liu JT, Lin CH. Rapid screening and determination of designer
drugs in saliva by a nib-assisted paper spray-mass spectrometry and separation
technique. J Sep Sci. 2012;35(20):2822-2825.
30. Su Y, Wang H, Liu J, Wei P, Cooks RG, Ouyang Z. Quantitative paper spray
mass spectrometry analysis of drugs of abuse. Analyst. 2013;138(16):4443-4447.
31. Zhang Z, Xu W, Manicke NE, Cooks RG, Ouyang Z. Silica coated paper
substrate for paper-spray analysis of therapeutic drugs in dried blood spots. Anal
Chem. 2012;84(2):931-938.
32. Manicke NE, Yang Q, Wang H, Oradu S, Ouyang Z, Cooks RG. Assessment of
paper spray ionization for quantitation of pharmaceuticals in blood spots. Int J
Mass spectrom. 2011;300(2-3):123-129.
33. Wang H, Ren Y, McLuckey MN, et al. Direct quantitative analysis of nicotine
alkaloids from biofluid samples using paper spray mass spectrometry. Anal Chem.
2013;85(23):11540-11544.
82
34. Espy RD, Teunissen SF, Manicke NE, et al. Paper spray and extraction spray mass
spectrometry for the direct and simultaneous quantification of eight drugs of abuse
in whole blood. Anal Chem. 2014;86(15):7712-7718.
35. Manicke NE, Abu-Rabie P, Spooner N, Ouyang Z, Cooks RG. Quantitative
Analysis of Therapeutic Drugs in Dried Blood Spot Samples by Paper Spray Mass
Spectrometry: An Avenue to Therapeutic Drug Monitoring. J Am Soc Mass
Spectrom. 2011;22(9):1501-1507.
36. Yang Q, Wang H, Maas JD, et al. Paper spray ionization devices for direct,
biomedical analysis using mass spectrometry. Int J Mass spectrom.
2012;312:201-207.
37. Shen L, Zhang J, Yang Q, Manicke NE, Ouyang Z. High throughput paper spray
mass spectrometry analysis. Clin Chim Acta. 2013;420:28-33.
38. Espy RD, Manicke NE, Ouyang Z, Cooks RG. Rapid analysis of whole blood by
paper spray mass spectrometry for point-of-care therapeutic drug monitoring.
Analyst. 2012;137(10):2344-2349.
39. Potter R, Manicke N, Shanks K. NIJ Project Consultation. August 2016.
40. Quimby B. Improved Forensic Toxicology Screening Using A GC/MS/NPD
System with a 725-Compound DRS Database. Agilent Technologies: Application.
2008:28.
41. Chen D, Yu J, Tao Y, et al. Qualitative screening of veterinary anti-microbial
agents in tissues, milk, and eggs of food-producing animals using liquid
chromatography coupled with tandem mass spectrometry. J Chromatogr B.
2016;1017–1018:82-88.
42. Han S, Zhou T, Yin B, He P. A sensitive and semi-quantitative method for
determination of multi-drug residues in animal body fluids using multiplex
dipstick immunoassay. Anal Chim Acta. 2016;927:64-71.
43. Alfazil AA, Anderson RA. Stability of benzodiazepines and cocaine in blood spots
stored on filter paper. J Anal Toxicol. 2008;32(7):511-515.
44. Wagner M, Tonoli D, Varesio E, Hopfgartner G. The use of mass spectrometry to
analyze dried blood spots. Mass Spectrom Rev. 2016;35(3):361-438.
83

45. Kushnir MM, Rockwood AL, Nelson GJ, Yue B, Urry FM. Assessing analytical
specificity in quantitative analysis using tandem mass spectrometry. Clin
Biochem. 2005;38(4):319-327.
46. Kaufmann A, Widmer M, Maden K. Signal suppression can bias selected reaction
monitoring ratios. Implications for the confirmation of positive findings in residue
testing. Rapid Commun Mass Spectrom. 2014;28(8):899-907.
47. Sauvage FL, Gaulier JM, Lachatre G, Marquet P. Pitfalls and prevention
strategies for liquid chromatography-tandem mass spectrometry in the selected
reaction-monitoring mode for drug analysis. Clin Chem. 2008;54(9):1519-1527.
48. Niessen WMA. Fragmentation of toxicologically relevant drugs in positive-ion
liquid chromatography–tandem mass spectrometry. Mass Spectrom Rev.
2011;30(4):626-663.
49. Mol HG, Zomer P, Garcia Lopez M, et al. Identification in residue analysis based
on liquid chromatography with tandem mass spectrometry: Experimental
evidence to update performance criteria. Anal Chim Acta. 2015;873:1-13.
50. Kaufmann A, Butcher P, Maden K, Widmer M, Giles K, Uria D. Are liquid
chromatography/electrospray tandem quadrupole fragmentation ratios
unequivocal confirmation criteria? Rapid Commun Mass Spectrom.
2009;23(7):985-998.
51. Vogeser M, Seger C. Pitfalls Associated with the Use of Liquid Chromatography–
Tandem Mass Spectrometry in the Clinical Laboratory. Clin Chem.
2010;56(8):1234-1244.
52. Lynch KL, Breaud AR, Vandenberghe H, Wu AH, Clarke W. Performance
evaluation of three liquid chromatography mass spectrometry methods for broad
spectrum drug screening. Clin Chim Acta. 2010;411(19-20):1474-1481.
53. Saar E, Beyer J, Gerostamoulos D, Drummer OH. The time-dependant post-
mortem redistribution of antipsychotic drugs (vol 222, pg 223, 2012). Forensic
Science International. 2013;228(1-3):94-94.
84
54. Saar E, Gerostamoulos D, Drummer OH, Beyer J. Comparison of extraction
efficiencies and LC–MS–MS matrix effects using LLE and SPE methods for 19
antipsychotics in human blood. Analytical & Bioanalytical Chemistry.
2009;393(2):727-734.
55. Rosano TG, Wood M, Swift TA. Postmortem Drug Screening by Non-Targeted
and Targeted Ultra-Performance Liquid Chromatography-Mass Spectrometry
Technology. J Anal Toxicol. 2011;35(7):411-423.
56. Peters F, Remane D. Aspects of matrix effects in applications of liquid
chromatography-mass spectrometry to forensic and clinical toxicology-a review.
Analytical & Bioanalytical Chemistry. 2012;403(8):2155-2172.
57. Zhang C, Manicke NE. Development of a Paper Spray Mass Spectrometry
Cartridge with Integrated Solid Phase Extraction for Bioanalysis. Anal Chem.
2015;87(12):6212-6219.
58. Cullum N, Meng C-K, Zavitsanos P. Effect of Sample Matrix on Suppression of
Ionization in Water Samples Using LC-ESI-MS. Agilent Technologies:
Application Note. 2004:10. Accessed June 27, 2016.
59. Vega C, Spence C, Zhang C, Bills BJ, Manicke NE. Ionization Suppression and
Recovery in Direct Biofluid Analysis Using Paper Spray Mass Spectrometry. J
Am Soc Mass Spectrom. 2016;27(4):726-734.
60. Shi RZ, El Gierari el TM, Manicke NE, Faix JD. Rapid measurement of
tacrolimus in whole blood by paper spray-tandem mass spectrometry (PS-
MS/MS). Clin Chim Acta. 2015;441:99-104.
61. Warnke S, Seo J, Boschmans J, et al. Protomers of Benzocaine: Solvent and
Permittivity Dependence. J Am Chem Soc. 2015;137(12):4236-4242.
62. Wang J, Aubry A, Bolgar MS, et al. Effect of mobile phase pH, aqueous-organic
ratio, and buffer concentration on electrospray ionization tandem mass
spectrometric fragmentation patterns: implications in liquid
chromatography/tandem mass spectrometric bioanalysis. Rapid Commun Mass
Spectrom. 2010;24(22):3221-3229.
63. Wishart DS, Jewison T, Guo AC, et al. HMDB 3.0--The Human Metabolome
Database in 2013. Nucleic Acids Res. 2013;41(Database issue):D801-807.
85
64. Wishart DS, Knox C, Guo AC, et al. HMDB: a knowledgebase for the human
metabolome. Nucleic Acids Res. 2009;37(Database issue):D603-610.
65. Wishart DS, Tzur D, Knox C, et al. HMDB: the Human Metabolome Database.
Nucleic Acids Res. 2007;35(Database issue):D521-526.
66. Wishart DS, Knox C, Guo AC, et al. DrugBank: a comprehensive resource for in
silico drug discovery and exploration. Nucleic Acids Res. 2006;34(Database
issue):D668-672.
67. McKenna J, Dhummakupt ES, Connell T, Demond PS, Miller DB, Nilles JM,
Manicke NE and Glaros T: Detection of Chemical Warfare Agent Simulants and
Hydrolysis Products in Biological Samples by Paper Spray Mass Spectrometry.
Analyst. In Press
86
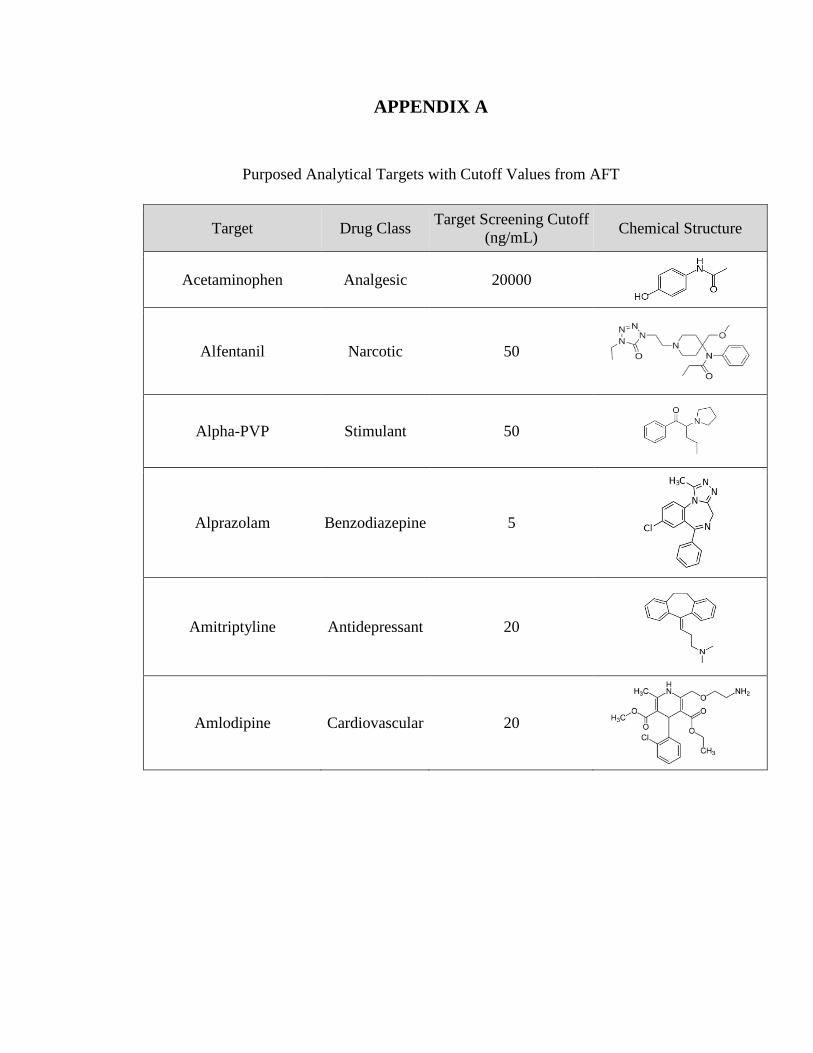
APPENDIX A
Purposed Analytical Targets with Cutoff Values from AFT
Target Drug Class Target Screening Cutoff
(ng/mL) Chemical Structure
Acetaminophen Analgesic 20000
Alfentanil Narcotic 50
Alpha-PVP Stimulant 50
Alprazolam Benzodiazepine 5
Amitriptyline Antidepressant 20
Amlodipine Cardiovascular 20

Target Drug Class Target Screening
Cutoff (ng/mL) Chemical Structure
Amobarbital Barbiturate 500
Amphetamine Amphetamine 50
Aripiprazole Antipsychotic 50
Atenolol Cardiovascular 100
Baclofen Analgesic 1000
Benzoylecgonine Cocaine 50
Benztropine Neurological 10
Benzylpiperazine Miscellaneous 50
Brompheniramine Antihistamine 25
Bupivacaine Anesthetic 500
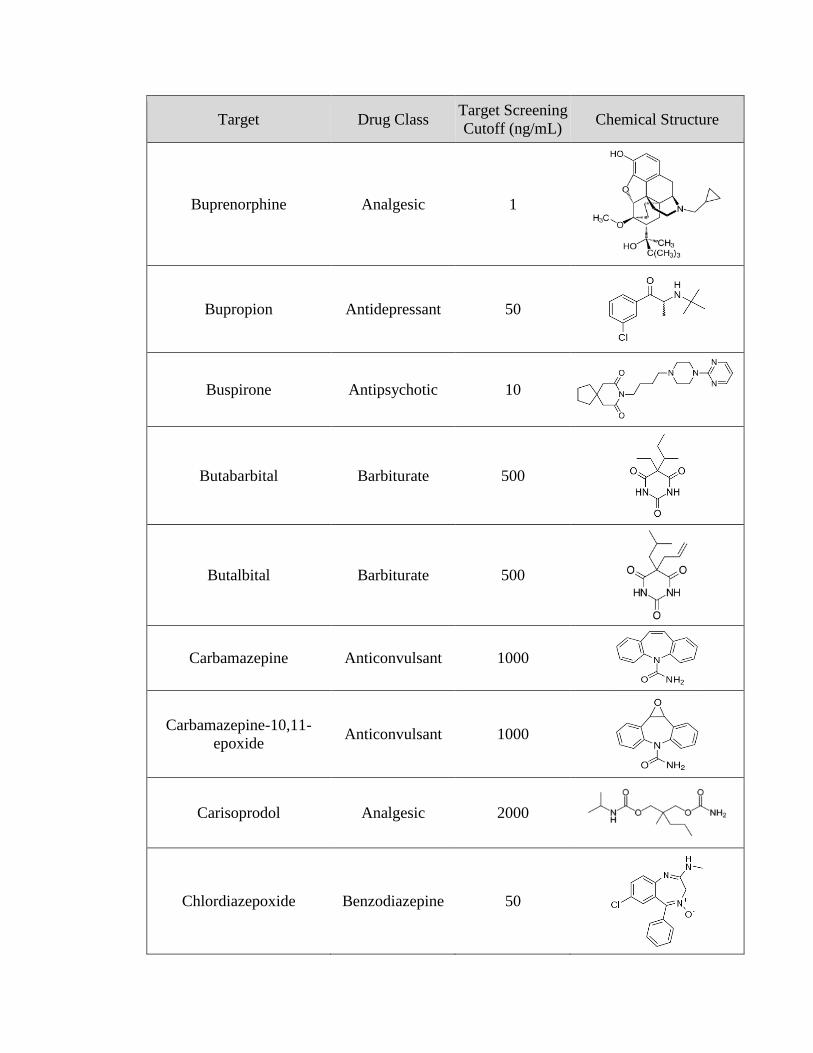
Target Drug Class Target Screening
Cutoff (ng/mL) Chemical Structure
Buprenorphine Analgesic 1
Bupropion Antidepressant 50
Buspirone Antipsychotic 10
Butabarbital Barbiturate 500
Butalbital Barbiturate 500
Carbamazepine Anticonvulsant 1000
Carbamazepine-10,11-
epoxide Anticonvulsant 1000
Carisoprodol Analgesic 2000
Chlordiazepoxide Benzodiazepine 50
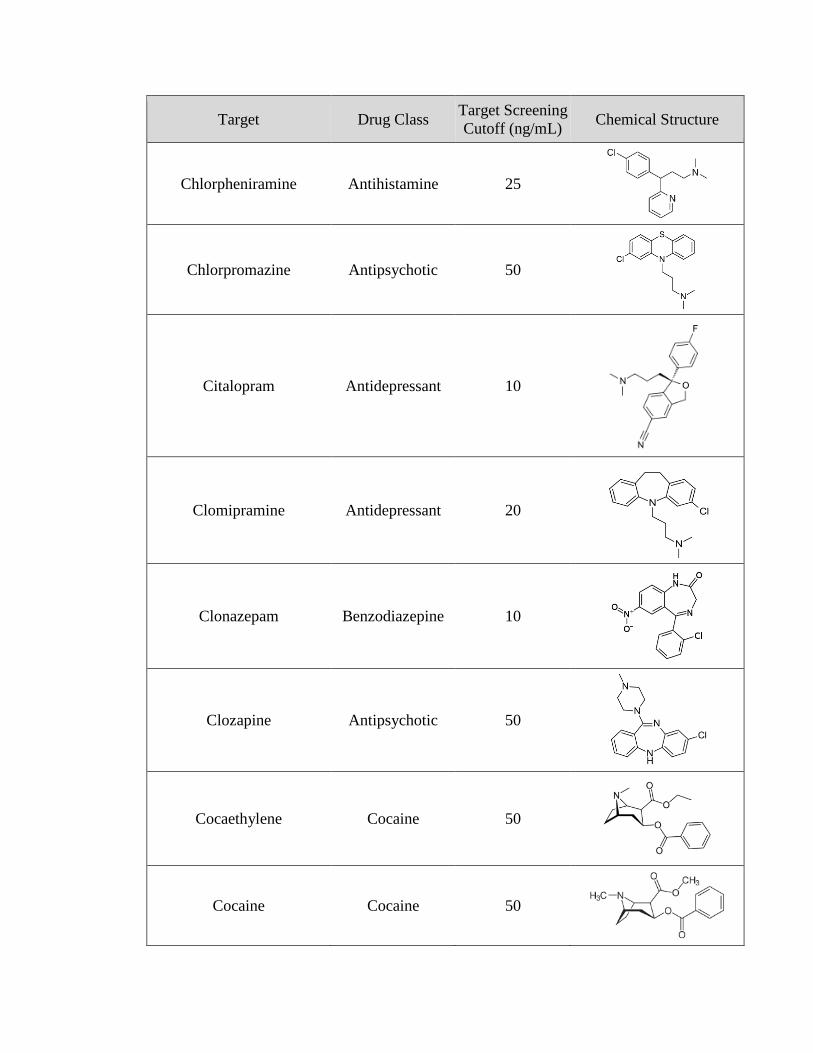
Target Drug Class Target Screening
Cutoff (ng/mL) Chemical Structure
Chlorpheniramine Antihistamine 25
Chlorpromazine Antipsychotic 50
Citalopram Antidepressant 10
Clomipramine Antidepressant 20
Clonazepam Benzodiazepine 10
Clozapine Antipsychotic 50
Cocaethylene Cocaine 50
Cocaine Cocaine 50
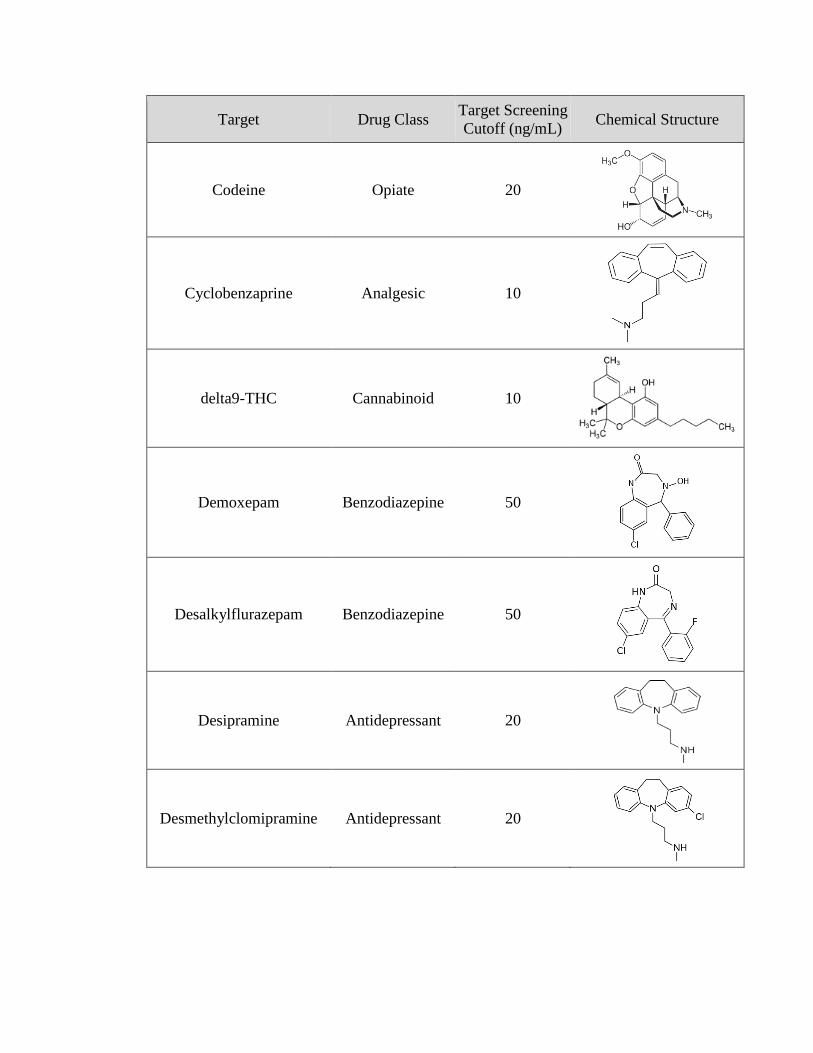
Target Drug Class Target Screening
Cutoff (ng/mL) Chemical Structure
Codeine Opiate 20
Cyclobenzaprine Analgesic 10
delta9-THC Cannabinoid 10
Demoxepam Benzodiazepine 50
Desalkylflurazepam Benzodiazepine 50
Desipramine Antidepressant 20
Desmethylclomipramine Antidepressant 20
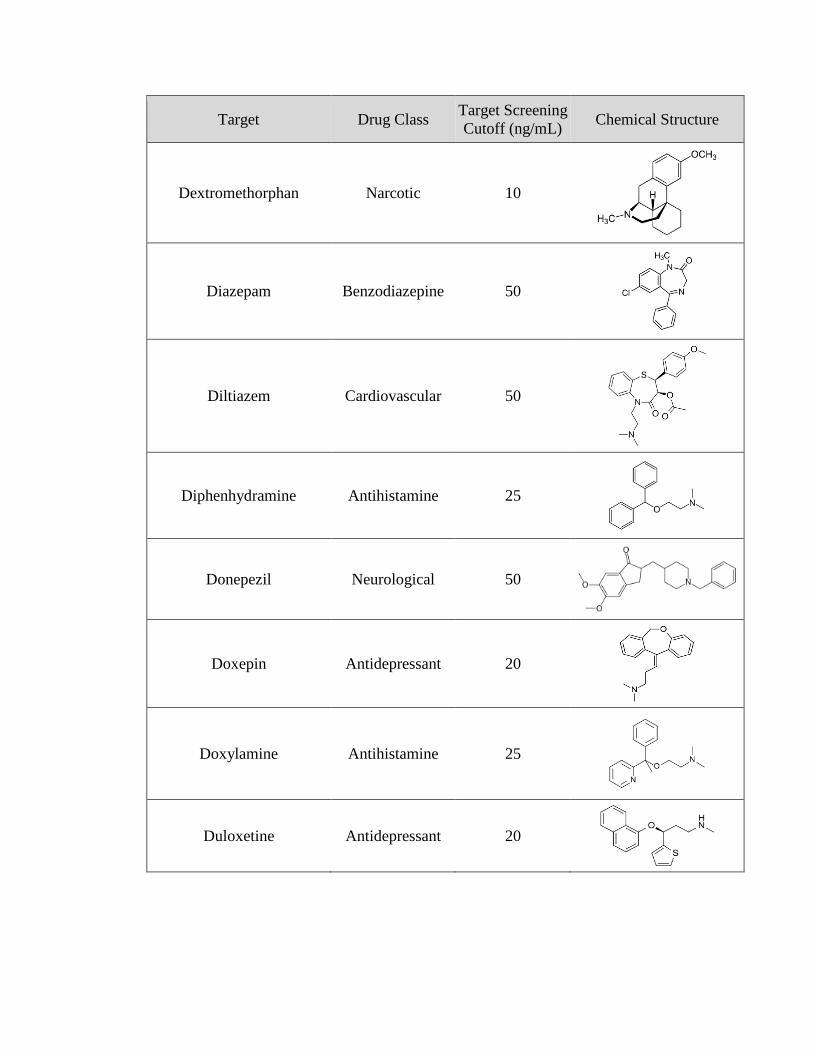
Target Drug Class Target Screening
Cutoff (ng/mL) Chemical Structure
Dextromethorphan Narcotic 10
Diazepam Benzodiazepine 50
Diltiazem Cardiovascular 50
Diphenhydramine Antihistamine 25
Donepezil Neurological 50
Doxepin Antidepressant 20
Doxylamine Antihistamine 25
Duloxetine Antidepressant 20
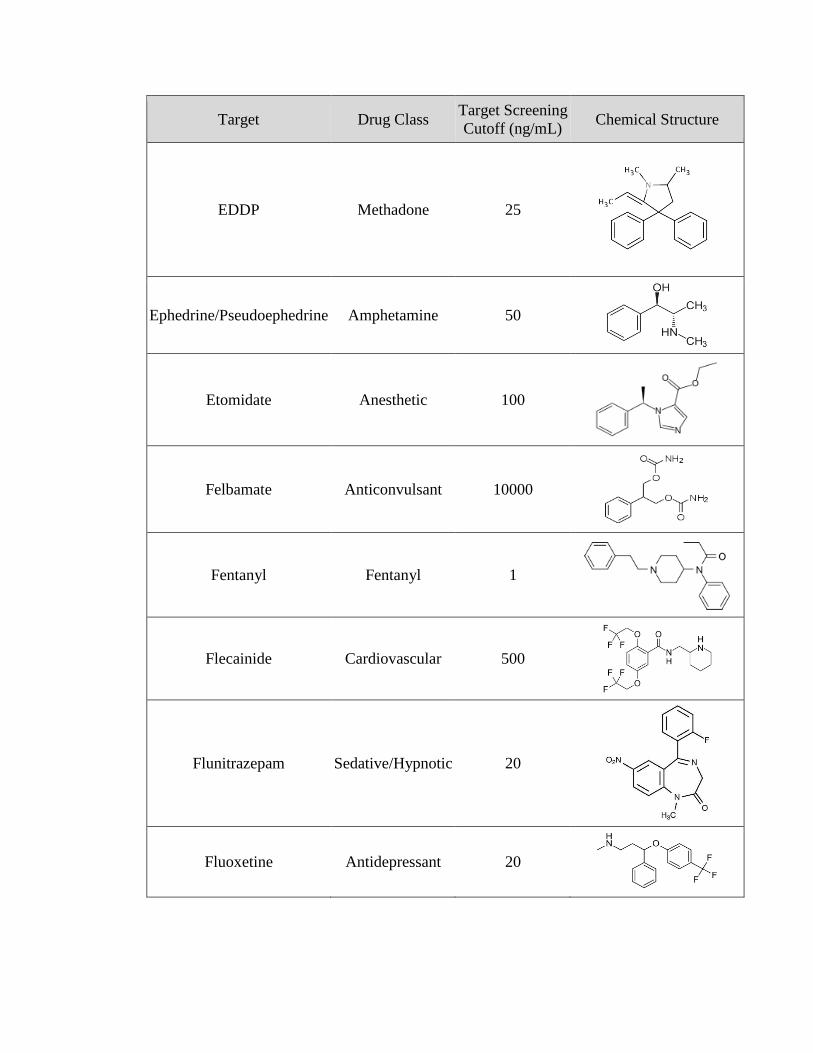
Target Drug Class Target Screening
Cutoff (ng/mL) Chemical Structure
EDDP Methadone 25
Ephedrine/Pseudoephedrine Amphetamine 50
Etomidate Anesthetic 100
Felbamate Anticonvulsant 10000
Fentanyl Fentanyl 1
Flecainide Cardiovascular 500
Flunitrazepam Sedative/Hypnotic 20
Fluoxetine Antidepressant 20

Target Drug Class Target Screening
Cutoff (ng/mL) Chemical Structure
Flurazepam Benzodiazepine 25
Fluvoxamine Antidepressant 20
Furosemide Cardiovascular 1000
Gabapentin Anticonvulsant 500
Haloperidol Antipsychotic 10
Hydrochlorothiazide Cardiovascular 100
hydrocodone Opiate 20
hydromorphone Opiate 20

Target Drug Class Target Screening
Cutoff (ng/mL) Chemical Structure
Hydroxychloroquine Analgesic 2000
Hydroxyzine Antihistamine 10
Ibuprofen Analgesic 10000
Ketamine Anesthetic 100
Labetalol Cardiovascular 50
Lamotrigine Anticonvulsant 1000
Levetiracetam Anticonvulsant 2000
Lidocaine Anesthetic 500
Lorazepam Benzodiazepine 25
mCPP Antidepressant 20
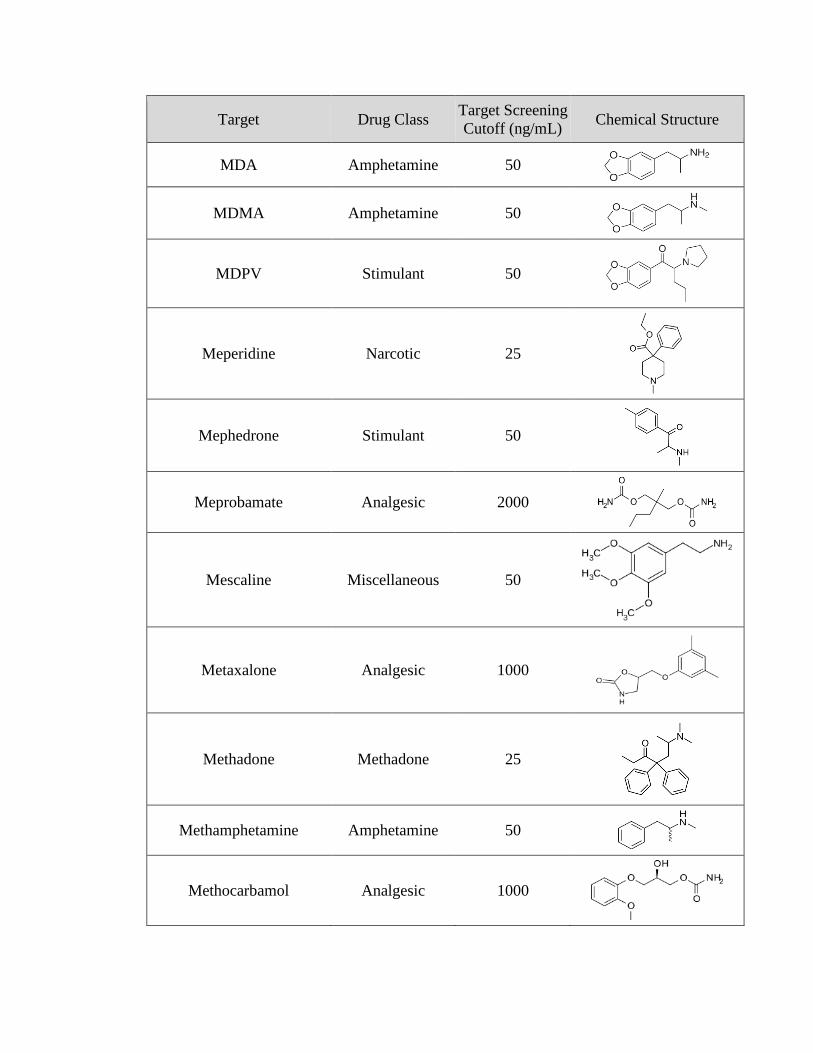
Target Drug Class Target Screening
Cutoff (ng/mL) Chemical Structure
MDA Amphetamine 50
MDMA Amphetamine 50
MDPV Stimulant 50
Meperidine Narcotic 25
Mephedrone Stimulant 50
Meprobamate Analgesic 2000
Mescaline Miscellaneous 50
Metaxalone Analgesic 1000
Methadone Methadone 25
Methamphetamine Amphetamine 50
Methocarbamol Analgesic 1000
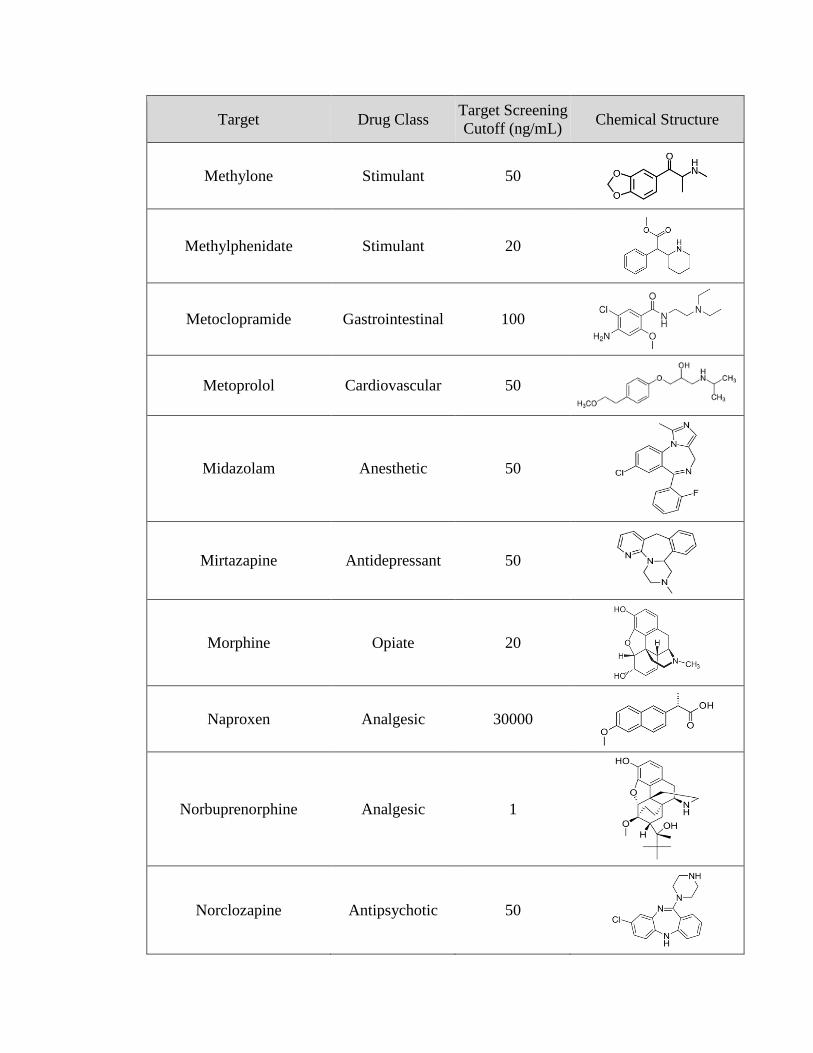
Target Drug Class Target Screening
Cutoff (ng/mL) Chemical Structure
Methylone Stimulant 50
Methylphenidate Stimulant 20
Metoclopramide Gastrointestinal 100
Metoprolol Cardiovascular 50
Midazolam Anesthetic 50
Mirtazapine Antidepressant 50
Morphine Opiate 20
Naproxen Analgesic 30000
Norbuprenorphine Analgesic 1
Norclozapine Antipsychotic 50

Target Drug Class Target Screening
Cutoff (ng/mL) Chemical Structure
Nordiazepam Benzodiazepine 50
Nordoxepin Antidepressant 20
Norfluoxetine Antidepressant 20
Norketamine Anesthetic 100
Normeperidine Narcotic 25
Norpropoxyphene Propoxyphene 50
Norsertraline Antidepressant 100
Nortramadol Analgesic 100

Target Drug Class Target Screening
Cutoff (ng/mL) Chemical Structure
Nortriptyline Antidepressant 20
Norvenlafaxine Antidepressant 50
Olanzapine Antipsychotic 50
Oxazepam Benzodiazepine 50
Oxycodone Opiate 20
Oxymorphone Opiate 20
Papaverine Cardiovascular 500
Paroxetine Antidepressant 20

Target Drug Class Target Screening
Cutoff (ng/mL) Chemical Structure
PCP Phencyclidine 25
Pentazocine Narcotics 50
Pentobarbital Barbiturate 500
Phenobarbital Barbiturate 2000
Phenytoin Anticonvulsant 5000
Pregabalin Anticonvulsant 500
Primidone Anticonvulsant 5000
Promethazine Sedative/Hypnotic 25
Propoxyphene Propoxyphene 50
Target Drug Class Target Screening
Cutoff (ng/mL) Chemical Structure
Propranolol Cardiovascular 50
Quetiapine Antipsychotic 50
Ranitidine Gastrointestinal 500
Risperidone Antipsychotic 10
Ropinirole Neurological 10
Salicylic Acid Analgesic 9000
Secobarbital Barbiturate 500
Sertraline Antidepressant 100
Sildenafil Urological 100

Target Drug Class Target Screening
Cutoff (ng/mL) Chemical Structure
Tadalafil Urological 100
Temazepam Benzodiazepine 50
TFMPP Miscellaneous 50
Thiopental Sedative/Hypnotic 2000
Topiramate Anticonvulsant 2000
Tramadol Analgesic 100
Trazodone Antidepressant 100
Triazolam Benzodiazepine 20
Trimipramine Antidepressant 20
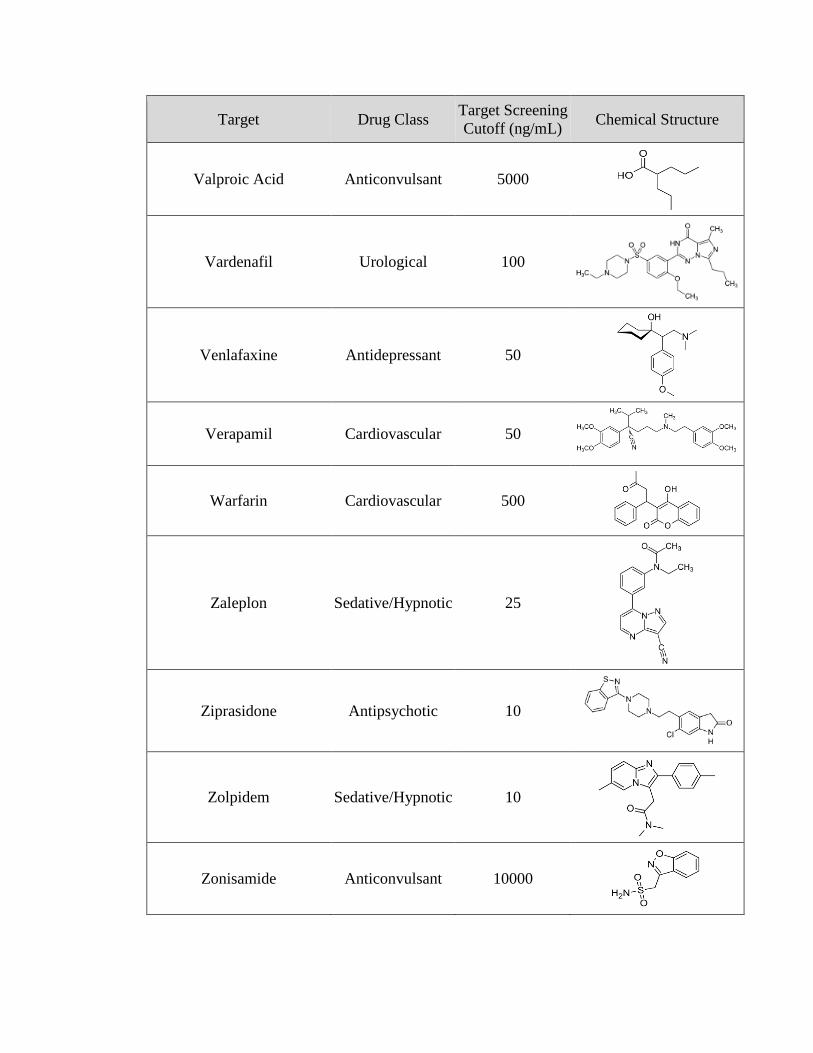
Target Drug Class Target Screening
Cutoff (ng/mL) Chemical Structure
Valproic Acid Anticonvulsant 5000
Vardenafil Urological 100
Venlafaxine Antidepressant 50
Verapamil Cardiovascular 50
Warfarin Cardiovascular 500
Zaleplon Sedative/Hypnotic 25
Ziprasidone Antipsychotic 10
Zolpidem Sedative/Hypnotic 10
Zonisamide Anticonvulsant 10000
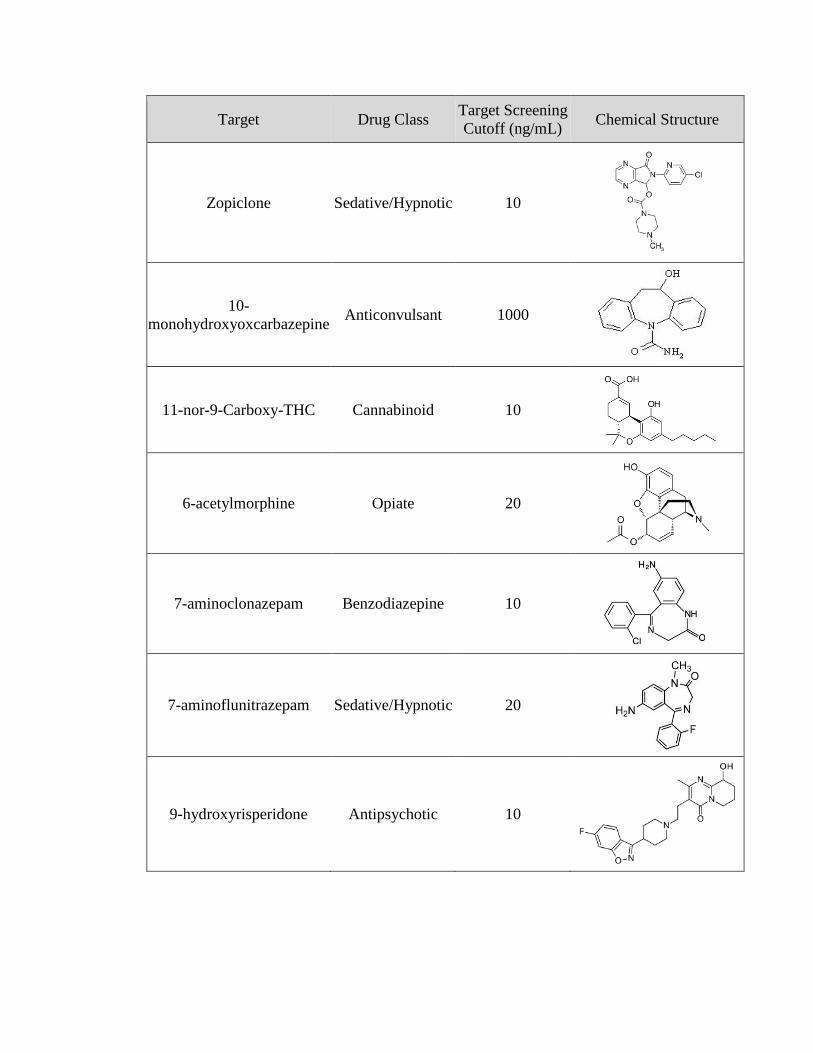
Target Drug Class Target Screening
Cutoff (ng/mL) Chemical Structure
Zopiclone Sedative/Hypnotic 10
10-
monohydroxyoxcarbazepine Anticonvulsant 1000
11-nor-9-Carboxy-THC Cannabinoid 10
6-acetylmorphine Opiate 20
7-aminoclonazepam Benzodiazepine 10
7-aminoflunitrazepam Sedative/Hypnotic 20
9-hydroxyrisperidone Antipsychotic 10

APPENDIX B
Detailed results from loading capacity and blood dilution study for the five targets
analyzed in Chapter 4.
Morphine
Whole
Blood
Diluted
Blood
Whole
Blood
Diluted
Blood
Whole
Blood
Diluted
Blood
Fragment 286 -> 152 286 -> 165 286 -> 201
5 u
L
Avg Blank 7.7E+03 5.6E+03 4.8E+03 4.7E+03 3.1E+05 3.7E+05
Stdev 4.3E+03 1.0E+03 2.5E+03 5.3E+02 7.2E+04 4.4E+04
Avg Drug 6.0E+04 7.5E+04 4.1E+04 5.3E+04 3.9E+05 4.1E+05
Stdev 6.5E+03 7.6E+03 3.6E+03 4.8E+03 8.3E+04 1.5E+04
S:B 7.8 14 8.4 11 1.3 1.1
10
uL
Avg Blank 8.5E+03 4.1E+03 4.9E+03 2.4E+03 5.0E+05 2.5E+05
Stdev 6.7E+03 2.6E+03 3.3E+03 1.3E+03 7.3E+04 1.7E+04
Avg Drug 5.6E+04 6.5E+04 4.0E+04 4.7E+04 4.5E+05 3.5E+05
Stdev 3.1E+03 2.1E+03 1.8E+03 1.7E+03 1.1E+05 5.7E+04
S:B 6.6 16 8.1 20 0.90 1.4
20
uL
Avg Blank 3.4E+03 8.7E+02 2.0E+03 6.3E+02 2.0E+03 1.2E+05
Stdev 1.2E+03 4.3E+02 6.2E+02 3.4E+02 6.2E+02 4.6E+04
Avg Drug 4.6E+04 5.3E+04 3.2E+04 3.7E+04 3.2E+04 2.6E+05
Stdev 1.4E+04 1.0E+04 9.1E+03 7.2E+03 9.1E+03 7.4E+04
S:B 13 61 16 9 16 2.3
40
uL
Avg Blank 3.9E+03 8.8E+02 2.6E+03 6.8E+02 3.7E+05 9.8E+04
Stdev 3.5E+03 1.3E+02 2.2E+03 2.3E+02 7.5E+04 3.3E+04
Avg Drug 5.4E+04 3.7E+04 3.8E+04 2.6E+04 3.3E+05 2.1E+05
Stdev 6.5E+03 6.2E+02 4.4E+03 3.2E+02 2.8E+04 5.9E+04
S:B 14 42 15 38 0.89 2.2
105
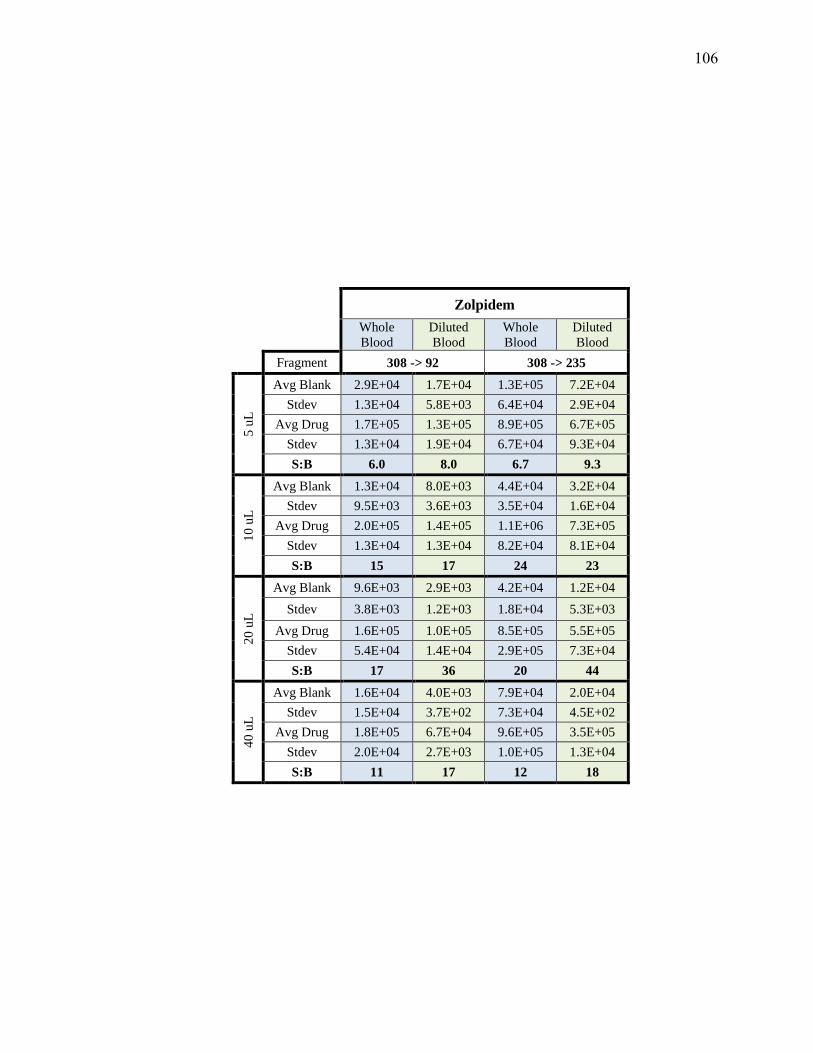
Zolpidem
Whole
Blood
Diluted
Blood
Whole
Blood
Diluted
Blood
Fragment 308 -> 92 308 -> 235
5 u
L
Avg Blank 2.9E+04 1.7E+04 1.3E+05 7.2E+04
Stdev 1.3E+04 5.8E+03 6.4E+04 2.9E+04
Avg Drug 1.7E+05 1.3E+05 8.9E+05 6.7E+05
Stdev 1.3E+04 1.9E+04 6.7E+04 9.3E+04
S:B 6.0 8.0 6.7 9.3
10
uL
Avg Blank 1.3E+04 8.0E+03 4.4E+04 3.2E+04
Stdev 9.5E+03 3.6E+03 3.5E+04 1.6E+04
Avg Drug 2.0E+05 1.4E+05 1.1E+06 7.3E+05
Stdev 1.3E+04 1.3E+04 8.2E+04 8.1E+04
S:B 15 17 24 23
20
uL
Avg Blank 9.6E+03 2.9E+03 4.2E+04 1.2E+04
Stdev 3.8E+03 1.2E+03 1.8E+04 5.3E+03
Avg Drug 1.6E+05 1.0E+05 8.5E+05 5.5E+05
Stdev 5.4E+04 1.4E+04 2.9E+05 7.3E+04
S:B 17 36 20 44
40
uL
Avg Blank 1.6E+04 4.0E+03 7.9E+04 2.0E+04
Stdev 1.5E+04 3.7E+02 7.3E+04 4.5E+02
Avg Drug 1.8E+05 6.7E+04 9.6E+05 3.5E+05
Stdev 2.0E+04 2.7E+03 1.0E+05 1.3E+04
S:B 11 17 12 18
106
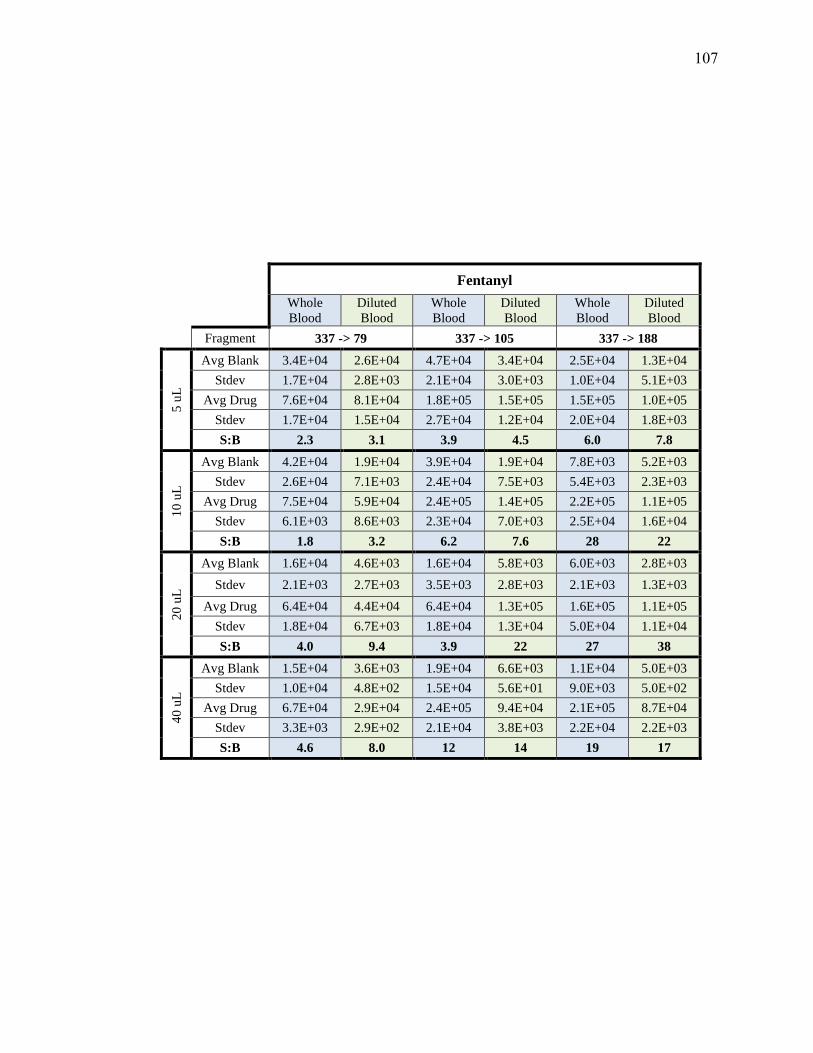
Fentanyl
Whole
Blood
Diluted
Blood
Whole
Blood
Diluted
Blood
Whole
Blood
Diluted
Blood
Fragment 337 -> 79 337 -> 105 337 -> 188
5 u
L
Avg Blank 3.4E+04 2.6E+04 4.7E+04 3.4E+04 2.5E+04 1.3E+04
Stdev 1.7E+04 2.8E+03 2.1E+04 3.0E+03 1.0E+04 5.1E+03
Avg Drug 7.6E+04 8.1E+04 1.8E+05 1.5E+05 1.5E+05 1.0E+05
Stdev 1.7E+04 1.5E+04 2.7E+04 1.2E+04 2.0E+04 1.8E+03
S:B 2.3 3.1 3.9 4.5 6.0 7.8
10
uL
Avg Blank 4.2E+04 1.9E+04 3.9E+04 1.9E+04 7.8E+03 5.2E+03
Stdev 2.6E+04 7.1E+03 2.4E+04 7.5E+03 5.4E+03 2.3E+03
Avg Drug 7.5E+04 5.9E+04 2.4E+05 1.4E+05 2.2E+05 1.1E+05
Stdev 6.1E+03 8.6E+03 2.3E+04 7.0E+03 2.5E+04 1.6E+04
S:B 1.8 3.2 6.2 7.6 28 22
20
uL
Avg Blank 1.6E+04 4.6E+03 1.6E+04 5.8E+03 6.0E+03 2.8E+03
Stdev 2.1E+03 2.7E+03 3.5E+03 2.8E+03 2.1E+03 1.3E+03
Avg Drug 6.4E+04 4.4E+04 6.4E+04 1.3E+05 1.6E+05 1.1E+05
Stdev 1.8E+04 6.7E+03 1.8E+04 1.3E+04 5.0E+04 1.1E+04
S:B 4.0 9.4 3.9 22 27 38
40
uL
Avg Blank 1.5E+04 3.6E+03 1.9E+04 6.6E+03 1.1E+04 5.0E+03
Stdev 1.0E+04 4.8E+02 1.5E+04 5.6E+01 9.0E+03 5.0E+02
Avg Drug 6.7E+04 2.9E+04 2.4E+05 9.4E+04 2.1E+05 8.7E+04
Stdev 3.3E+03 2.9E+02 2.1E+04 3.8E+03 2.2E+04 2.2E+03
S:B 4.6 8.0 12 14 19 17
107

Bu
pre
norp
hin
e
Who
le
Blo
od
Dil
ute
d
Blo
od
Who
le
Blo
od
Dil
ute
d
Blo
od
Who
le
Blo
od
Dil
ute
d
Blo
od
Who
le
Blo
od
Dil
ute
d
Blo
od
Fra
gm
ent
46
8->
10
1
46
8->
18
7
46
8->
39
6
46
8->
41
4
5 uL
Av
g B
lank
1
.0E
+3
8
.5E
+2
7
.0E
+3
6
.4E
+3
9
.7E
+2
9
.1E
+2
9
.8E
+2
9
.9E
+2
Std
ev
4.2
E+
2
7.1
E+
1
1.1
E+
3
4.3
E+
2
4.5
E+
2
8.2
E+
1
5.2
E+
2
3.1
E+
1
Av
g D
rug
3
.8E
+3
4
.0E
+3
8
.9E
+3
9
.1E
+3
6
.7E
+3
8
.1E
+3
6
.1E
+3
6
.2E
+3
Std
ev
8.2
E+
2
3.2
E+
2
7.7
E+
2
8.9
E+
2
1.6
E+
3
1.3
E+
3
1.2
E+
3
3.8
E+
2
S:B
3
.9
4.7
1
.3
1.4
6
.9
8.9
6
.2
6.3
10 uL
Av
g B
lank
1
.0E
+3
6
.5E
+2
6
.1E
+3
8
.0E
+3
1
.0E
+3
4
.5E
+2
1
.1E
+3
3
.6E
+2
Std
ev
5.2
E+
02
2
.3E
+2
1
.3E
+3
1
.1E
+3
5
.1E
+2
1
.6E
+2
6
.5E
+2
1
.8E
+2
Av
g D
rug
3
.2E
+3
3
.1E
+3
8
.3E
+3
1
.1E
+4
6
.8E
+3
5
.0E
+3
6
.0E
+3
4
.7E
+3
Std
ev
3.2
E+
2
2.9
E+
2
9.6
E+
1
6.1
E+
2
1.2
E+
3
2.3
E+
2
1.1
E+
3
1.2
E+
2
S:B
3
.1
4.7
1
.4
1.3
5
6.7
1
1
5.5
1
3
20 uL
Av
g B
lank
5
.5E
+2
1
.7E
+2
5
.0E
+3
4
.5E
+3
4
.3E
+2
1
.2E
+2
2
.1E
+2
4
.8E
+1
Std
ev
1.3
E+
2
7.9
E+
1
3.5
E+
2
7.3
E+
2
2.2
E+
1
6.2
E+
1
5.2
E+
1
1.9
E+
1
Av
g D
rug
2
.5E
+3
2
.1E
+3
7
.2E
+03
8.9
E+
3
5.3
E+
3
4.4
E+
3
4.6
E+
3
4.0
E+
3
Std
ev
9.1
E+
2
4.9
E+
2
2.0
E+
03
7.3
E+
2
1.7
E+
3
1.5
E+
3
1.8
E+
3
1.2
E+
3
S:B
4
.6
12
1.5
1
.9
12
36
22
84
40 uL
Av
g B
lank
4
.6E
+2
1
.8E
+2
5
.6E
+3
5
.7E
+3
4
.3E
+2
7
.3E
+1
3
.0E
+2
6
.4E
+1
Std
ev
3.1
E+
2
4.2
E+
1
4.3
E+
2
4.2
E+
2
3.3
E+
2
9.4
E+
0
2.2
E+
2
1.1
E+
1
Av
g D
rug
2
.5E
+3
9
.0E
+2
5
.6E
+3
5
.3E
+3
5
.5E
+3
2
.2E
+3
5
.3E
+3
1
.9E
+3
Std
ev
5.6
E+
2
2.1
E+
2
4.0
E+
2
1.5
E+
3
1.3
E+
3
3.6
E+
2
1.4
E+
3
4.1
E+
2
S:B
5
.4
5.0
0
.99
0.9
5
13
30
17
30
108

Clo
naze
pam
Who
le
Blo
od
Dil
ute
d
Blo
od
Who
le
Blo
od
Dil
ute
d
Blo
od
Who
le
Blo
od
Dil
ute
d
Blo
od
Who
le
Blo
od
Dil
ute
d
Blo
od
Fra
gm
ent
31
6 -
> 1
51
31
6 -
> 2
14
31
6 -
> 2
41
31
6 -
> 2
70
5 uL
Av
g B
lank
7
.4E
+03
4
.8E
+03
1.9
E+
03
2.1
E+
03
8
.9E
+02
6.6
E+
02
1.9
E+
04
1.6
E+
04
Std
ev
4.8
E+
03
9
.6E
+02
1.3
E+
03
2.4
E+
02
6
.8E
+02
7.8
E+
01
1.1
E+
04
9.6
E+
02
Av
g D
rug
1
.5E
+04
2
.2E
+04
1.0
E+
04
1.5
E+
04
6
.5E
+03
9.3
E+
03
4.2
E+
04
5.7
E+
04
Std
ev
7.0
E+
03
6
.1E
+03
3.4
E+
03
1.6
E+
03
2
.3E
+03
1.2
E+
03
1.4
E+
04
1.2
E+
04
S:B
2
.0
4.6
5
.4
7.1
7
.3
14
2.2
3
.5
10 uL
Av
g B
lank
1
.2E
+04
4
.1E
+03
2.9
E+
03
1.0
E+
03
1
.4E
+03
4.7
E+
02
2.5
E+
04
1.1
E+
04
Std
ev
9.0
E+
03
2
.6E
+03
2.1
E+
03
5.5
E+
02
1
.0E
+03
2.4
E+
02
1.5
E+
04
4.3
E+
03
Av
g D
rug
4
.9E
+03
1
.4E
+04
4.3
E+
03
8.1
E+
03
2
.7E
+03
5.5
E+
03
1.8
E+
04
3.5
E+
04
Std
ev
1.6
E+
03
7
.2E
+03
1.4
E+
03
3.3
E+
03
7
.8E
+02
2.2
E+
03
4.5
E+
03
1.4
E+
04
S:B
0
.42
3
.4
1.5
8
.0
2.0
1
2
0.7
5
3.1
20 uL
Av
g B
lank
4
.0E
+03
1
.0E
+03
9.2
E+
02
2.1
E+
02
3
.6E
+02
8.7
E+
01
1.0
E+
04
3.4
E+
03
Std
ev
1.1
E+
03
7
.4E
+02
3.8
E+
02
1.2
E+
02
1
.3E
+02
5.3
E+
01
1.9
E+
03
1.7
E+
03
Av
g D
rug
5
.6E
+03
4
.5E
+03
4.7
E+
03
3.7
E+
03
2
.9E
+03
2.4
E+
03
2.0
E+
04
1.6
E+
04
Std
ev
2.6
E+
03
1
.2E
+03
1.9
E+
03
1.2
E+
03
1
.2E
+03
7.6
E+
02
6.5
E+
03
4.4
E+
03
S:B
1
.4
4.3
5
.1
18
8.1
2
7
2.0
4
.8
40 uL
Av
g B
lank
2
.3E
+03
5
.2E
+02
1.0
E+
03
1.5
E+
02
5
.1E
+02
3.6
E+
01
8.0
E+
03
2.4
E+
03
Std
ev
1.7
E+
03
2
.0E
+02
7.6
E+
02
6.8
E+
01
4
.5E
+02
2.0
E+
01
4.4
E+
03
7.3
E+
02
Av
g D
rug
2
.7E
+03
1
.6E
+03
2.7
E+
03
1.2
E+
03
1
.8E
+03
6.6
E+
02
1.1
E+
04
6.0
E+
03
Std
ev
8.6
E+
02
4
.0E
+02
1.0
E+
03
2.7
E+
02
7
.0E
+02
2.0
E+
02
2.4
E+
03
1.5
E+
03
S:B
1
.2
3.0
2
.7
7.8
3
.6
19
1.4
2
.5
109
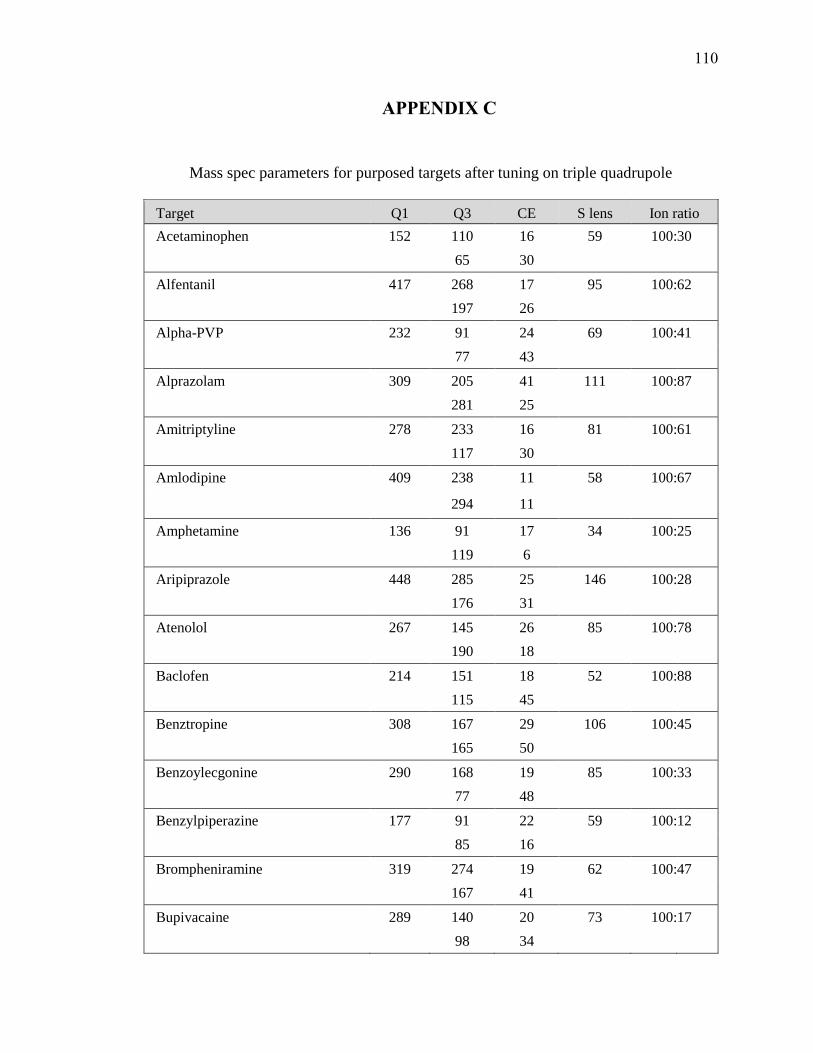
APPENDIX C
Mass spec parameters for purposed targets after tuning on triple quadrupole
Target Q1 Q3 CE S lens Ion ratio
Acetaminophen 152 110 16 59 100: 30
65 30
Alfentanil 417 268 17 95 100: 62
197 26
Alpha-PVP 232 91 24 69 100: 41
77 43
Alprazolam 309 205 41 111 100: 87
281 25
Amitriptyline 278 233 16 81 100: 61
117 30
Amlodipine 409 238 11 58 100: 67
294 11
Amphetamine 136 91 17 34 100: 25
119 6
Aripiprazole 448 285 25 146 100: 28
176 31
Atenolol 267 145 26 85 100: 78
190 18
Baclofen 214 151 18 52 100: 88
115 45
Benztropine 308 167 29 106 100: 45
165 50
Benzoylecgonine 290 168 19 85 100: 33
77 48
Benzylpiperazine 177 91 22 59 100: 12
85 16
Brompheniramine 319 274 19 62 100: 47
167 41
Bupivacaine 289 140 20 73 100: 17
98 34
110

Target Q1 Q3 CE S lens Ion ratio
Bupropion 240 184 12 53 100: 55
131 27
Buspirone 386 122 31 127 100: 18
95 50
Carbamazepine 237 194 19 82 100: 30
192 23
Carbamazepine-10,11-epoxide 253 180 30 58 100: 36
210 15
Carisoprodol 261 97 16 42 100: 83
55 29
Chlordiazepoxide 300 227 25 75 100: 22
255 20
Chlorpheniramine 275 230 17 58 100: 53
167 41
Chlorpromazine 319 214 39 78 100: 26
58 35
Citalopram 325 262 19 95 100: 47
234 28
Clomipramine 315 227 40 75 100: 73
242 26
Clonazepam 316 270 24 136 100: 32
214 36
Clozapine 327 270 22 88 100: 64
192 43
Cocaethylene 318 196 19 78 100: 27
82 32
Cocaine 304 182 19 94 100: 21
82 31
Codeine 300 215 25 97 100: 61
199 30
Cyclobenzaprine 276 215 40 87 100: 39
231 17
Demoxepam 287 180 22 113 100: 65
207 36
111
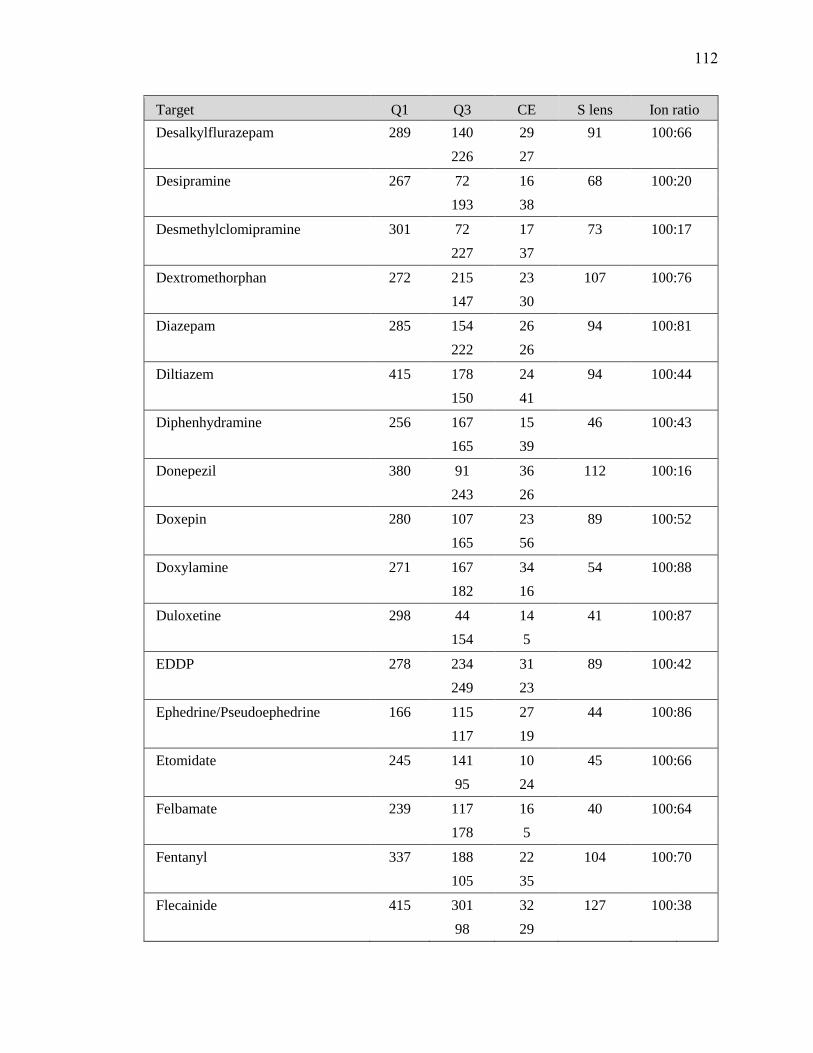
Target Q1 Q3 CE S lens Ion ratio
Desalkylflurazepam 289 140 29 91 100: 66
226 27
Desipramine 267 72 16 68 100: 20
193 38
Desmethylclomipramine 301 72 17 73 100: 17
227 37
Dextromethorphan 272 215 23 107 100: 76
147 30
Diazepam 285 154 26 94 100: 81
222 26
Diltiazem 415 178 24 94 100: 44
150 41
Diphenhydramine 256 167 15 46 100: 43
165 39
Donepezil 380 91 36 112 100: 16
243 26
Doxepin 280 107 23 89 100: 52
165 56
Doxylamine 271 167 34 54 100: 88
182 16
Duloxetine 298 44 14 41 100: 87
154 5
EDDP 278 234 31 89 100: 42
249 23
Ephedrine/Pseudoephedrine 166 115 27 44 100: 86
117 19
Etomidate 245 141 10 45 100: 66
95 24
Felbamate 239 117 16 40 100: 64
178 5
Fentanyl 337 188 22 104 100: 70
105 35
Flecainide 415 301 32 127 100: 38
98 29
112

Target Q1 Q3 CE S lens Ion ratio
Flunitrazepam 314 268 25 91 100: 38
239 33
Fluoxetine 310 44 14 56 100: 13
148 6
Flurazepam 388 315 22 90 100: 22
317 18
Fluvoxamine 319 71 16 67 100: 21
200 21
Gabapentin 172 137 15 51 100: 32
119 17
Haloperidol 376 123 37 101 100: 93
165 23
Hydrocodone 300 199 29 112 100: 37
171 38
Hydromorphone 286 185 30 97 100: 69
157 40
Hydroxyzine 375 201 19 71 100: 86
165 61
Ketamine 238 89 54 62 100: 24
125 30
Labetalol 329 162 25 71 100: 87
91 36
Lamotrigine 256 211 26 104 100: 63
145 38
Levetiracetam 171 126 15 33 100: 24
154 5
Lidocaine 235 86 18 66 100: 12
58 35
Lorazepam 321 276 18 65 100: 48
167 41
mCPP 197 154 19 71 100: 89
118 34
MDA 180 135 19 39 100: 91
133 18
113
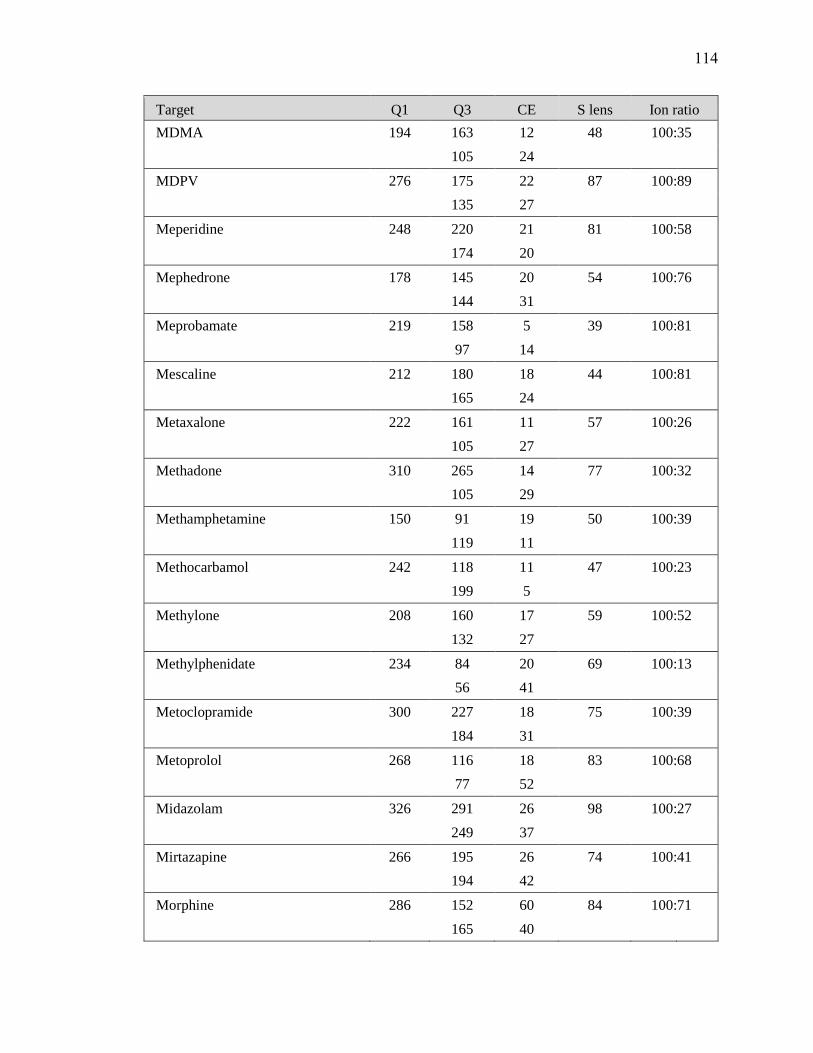
Target Q1 Q3 CE S lens Ion ratio
MDMA 194 163 12 48 100: 35
105 24
MDPV 276 175 22 87 100: 89
135 27
Meperidine 248 220 21 81 100: 58
174 20
Mephedrone 178 145 20 54 100: 76
144 31
Meprobamate 219 158 5 39 100: 81
97 14
Mescaline 212 180 18 44 100: 81
165 24
Metaxalone 222 161 11 57 100: 26
105 27
Methadone 310 265 14 77 100: 32
105 29
Methamphetamine 150 91 19 50 100: 39
119 11
Methocarbamol 242 118 11 47 100: 23
199 5
Methylone 208 160 17 59 100: 52
132 27
Methylphenidate 234 84 20 69 100: 13
56 41
Metoclopramide 300 227 18 75 100: 39
184 31
Metoprolol 268 116 18 83 100: 68
77 52
Midazolam 326 291 26 98 100: 27
249 37
Mirtazapine 266 195 26 74 100: 41
194 42
Morphine 286 152 60 84 100: 71
165 40
114
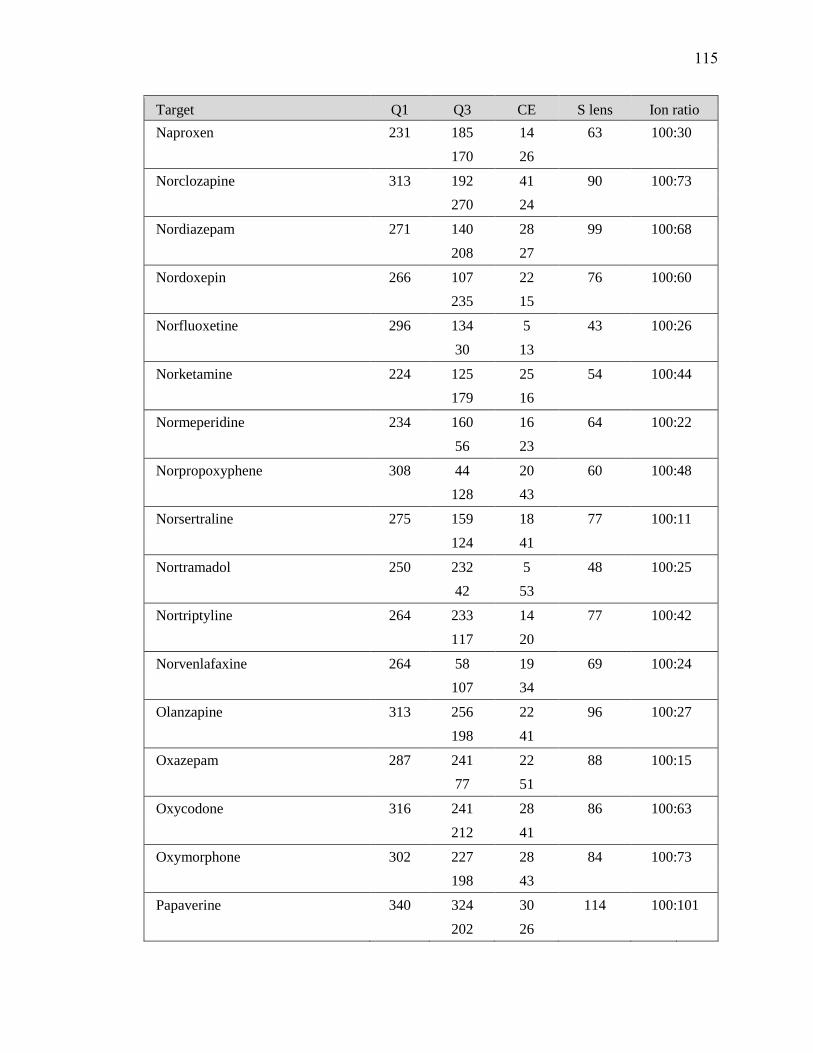
Target Q1 Q3 CE S lens Ion ratio
Naproxen 231 185 14 63 100: 30
170 26
Norclozapine 313 192 41 90 100: 73
270 24
Nordiazepam 271 140 28 99 100: 68
208 27
Nordoxepin 266 107 22 76 100: 60
235 15
Norfluoxetine 296 134 5 43 100: 26
30 13
Norketamine 224 125 25 54 100: 44
179 16
Normeperidine 234 160 16 64 100: 22
56 23
Norpropoxyphene 308 44 20 60 100: 48
128 43
Norsertraline 275 159 18 77 100: 11
124 41
Nortramadol 250 232 5 48 100: 25
42 53
Nortriptyline 264 233 14 77 100: 42
117 20
Norvenlafaxine 264 58 19 69 100: 24
107 34
Olanzapine 313 256 22 96 100: 27
198 41
Oxazepam 287 241 22 88 100: 15
77 51
Oxycodone 316 241 28 86 100: 63
212 41
Oxymorphone 302 227 28 84 100: 73
198 43
Papaverine 340 324 30 114 100: 101
202 26
115

Target Q1 Q3 CE S lens Ion ratio
Paroxetine 330 192 20 88 100: 52
70 30
PCP 244 91 34 43 100: 56
159 13
Pentazocine 286 218 20 83 100: 22
69 26
Phenytoin 253 182 18 63 100: 61
104 34
Pregabalin 160 97 23 50 100: 21
124 15
Primidone 219 162 13 51 100: 70
91 32
Promethazine 285 86 17 60 100: 43
198 27
Propoxyphene 340 266 5 50 100: 20
128 45
Propranolol 260 116 18 76 100: 88
183 18
Quetiapine 384 253 22 97 100: 64
221 36
Ranitidine 315 176 17 77 100: 49
102 34
Risperidone 411 191 28 113 100: 8
110 47
Ropinirole 261 114 19 77 100: 21
132 33
Sertraline 306 159 29 50 100: 85
275 12
Sildenafil 475 100 29 158 100: 62
283 38
Temazepam 301 177 38 87 100: 32
239 45
TFMPP 231 188 22 76 100: 23
118 39
116
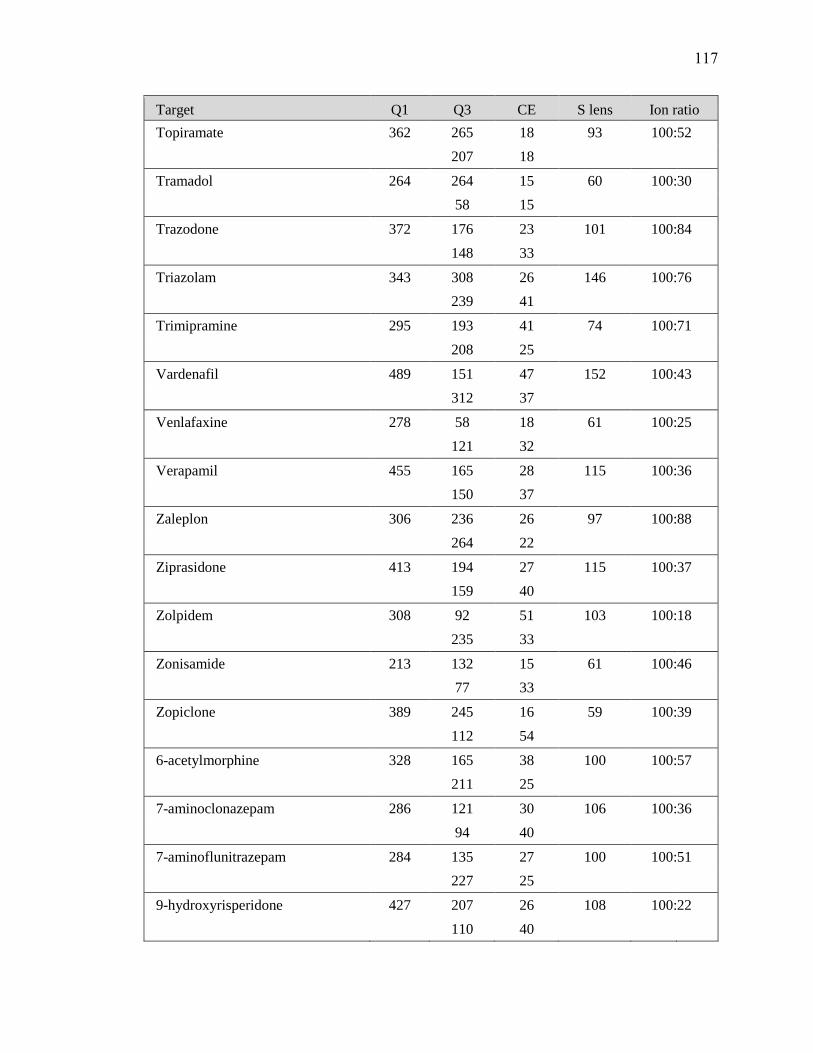
Target Q1 Q3 CE S lens Ion ratio
Topiramate 362 265 18 93 100: 52
207 18
Tramadol 264 264 15 60 100: 30
58 15
Trazodone 372 176 23 101 100: 84
148 33
Triazolam 343 308 26 146 100: 76
239 41
Trimipramine 295 193 41 74 100: 71
208 25
Vardenafil 489 151 47 152 100: 43
312 37
Venlafaxine 278 58 18 61 100: 25
121 32
Verapamil 455 165 28 115 100: 36
150 37
Zaleplon 306 236 26 97 100: 88
264 22
Ziprasidone 413 194 27 115 100: 37
159 40
Zolpidem 308 92 51 103 100: 18
235 33
Zonisamide 213 132 15 61 100: 46
77 33
Zopiclone 389 245 16 59 100: 39
112 54
6-acetylmorphine 328 165 38 100 100: 57
211 25
7-aminoclonazepam 286 121 30 106 100: 36
94 40
7-aminoflunitrazepam 284 135 27 100 100: 51
227 25
9-hydroxyrisperidone 427 207 26 108 100: 22
110 40
117
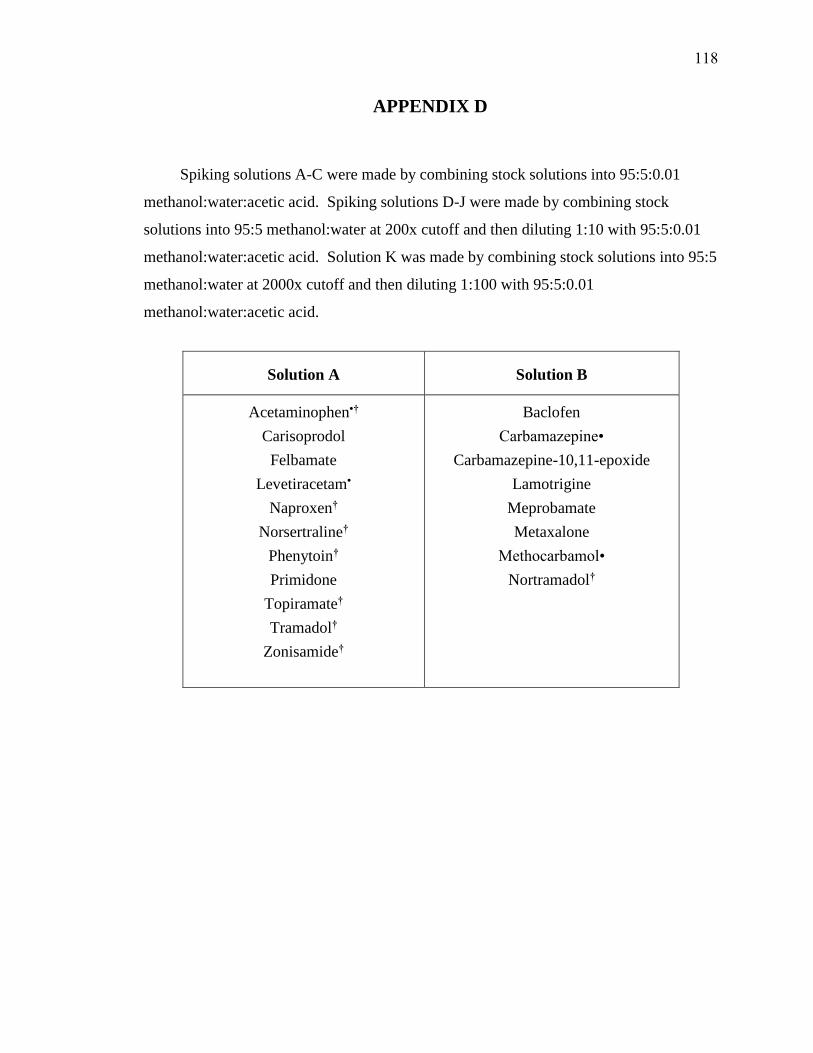
APPENDIX D
Spiking solutions A-C were made by combining stock solutions into 95:5:0.01
methanol:water:acetic acid. Spiking solutions D-J were made by combining stock
solutions into 95:5 methanol:water at 200x cutoff and then diluting 1:10 with 95:5:0.01
methanol:water:acetic acid. Solution K was made by combining stock solutions into 95:5
methanol:water at 2000x cutoff and then diluting 1:100 with 95:5:0.01
methanol:water:acetic acid.
Solution A Solution B
Acetaminophen•†
Carisoprodol
Felbamate
Levetiracetam•
Naproxen†
Norsertraline†
Phenytoin†
Primidone
Topiramate†
Tramadol†
Zonisamide†
Baclofen
Carbamazepine•
Carbamazepine-10,11-epoxide
Lamotrigine
Meprobamate
Metaxalone
Methocarbamol•
Nortramadol†
118

Solution C Solution D
Amphetamine†
Benzylpiperazine†
Bupivacaine•
Flecainide
Gabapentin
Lidocaine
Papaverine•
Pregabalin
Ranitidine•
Aripiprazole•†
Desmethylclomipramine†
Etomidate•
Ketamine
MDA†
Mescaline†
Metoclopramide•
Norketamine
Oxycodone†
Sertraline
Sildenafil
Trazodone
Vardenafil
Ziprasidone†
Solution E Solution F
Demoxepam†
Ephedrine/Pseudoephedrine
Hydroxyzine•†
Norpropoxyphene
Norvenlafaxine
Olanzapine
Pentazocine
Propoxyphene
Propranolol
Quetiapine
TFMPP
Venlafaxine
Verapamil
Donepezil•
Labetalol•
MDMA
MDPV
Mephedrone
Methamphetamine
Methylone
Metoprolol
Midazolam
Mirtazapine
Norclozapine
119
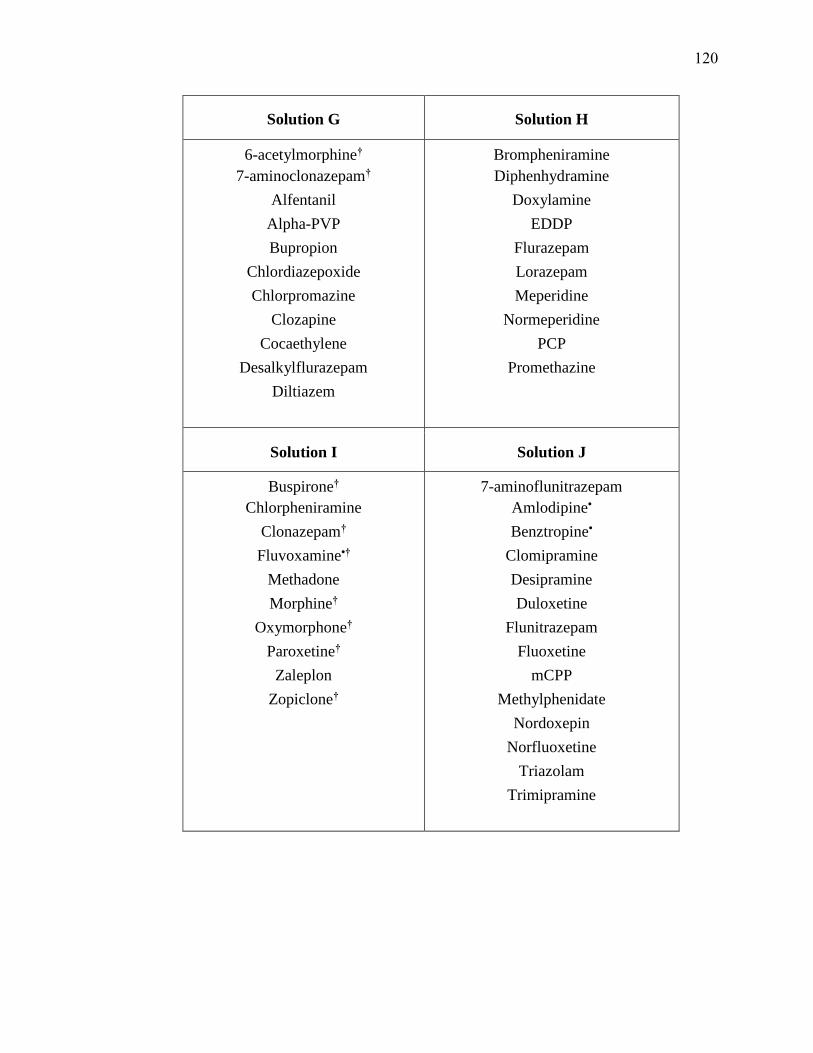
Solution G Solution H
6-acetylmorphine†
7-aminoclonazepam†
Alfentanil
Alpha-PVP
Bupropion
Chlordiazepoxide
Chlorpromazine
Clozapine
Cocaethylene
Desalkylflurazepam
Diltiazem
Brompheniramine
Diphenhydramine
Doxylamine
EDDP
Flurazepam
Lorazepam
Meperidine
Normeperidine
PCP
Promethazine
Solution I Solution J
Buspirone†
Chlorpheniramine
Clonazepam†
Fluvoxamine•†
Methadone
Morphine†
Oxymorphone†
Paroxetine†
Zaleplon
Zopiclone†
7-aminoflunitrazepam
Amlodipine•
Benztropine•
Clomipramine
Desipramine
Duloxetine
Flunitrazepam
Fluoxetine
mCPP
Methylphenidate
Nordoxepin
Norfluoxetine
Triazolam
Trimipramine
120

Solution K Solution L
9-hydroxyrisperidone
Alprazolam
Cyclobenzaprine
Dextromethorphan
Fentanyl†
Haloperidol
Risperidone
Ropinirole•
Zolpidem
Amitriptyline
Atenolol
Benzoylecgonine
Diazepam
Hydrocodone
Nortriptyline
Solution M
Citalopram
Cocaine
Codeine
Doxepine
Hydromorphone
Nordiazepam
Oxazepam
Temazepam
• Original solutions made
by dissolving powdered
Sigma reagents
† Target run at a
concentration other than
that specified by AFT
121

APPENDIX E
Detailed data by cocktail
Acetaminophen
Cocktail A
m/z 110 m/z 65 n
Manual
Spiked Average 1.02E+07 2.87E+06 4
Spiked RSD 19% 19%
Blank Average 3.49E+05 1.16E+05 4
Blank RSD 173% 144%
Laser-cut
Spiked Average 1.75E+07 4.96E+06 4
Spiked RSD 49% 51%
Blank Average 1.26E+05 8.96E+04 4
Blank RSD 29% 27%
Levetiracetam
Cocktail A
m/z 126 m/z 154 n
Manual
Spiked Average 9.37E+05 2.40E+05 4
Spiked RSD 10% 9%
Blank Average 4.01E+04 1.21E+04 4
Blank RSD 167% 143%
Laser-cut
Spiked Average 3.78E+06 9.94E+05 4
Spiked RSD 43% 47%
Blank Average 7.95E+04 1.17E+04 4
Blank RSD 42% 37%
122
Zonisamide
Cocktail A
m/z 132 m/z 77 n
Manual
Spiked Average 4.54E+06 2.19E+06 4
Spiked RSD 23% 23%
Blank Average 1.30E+05 1.11E+05 4
Blank RSD 172% 110%
Laser-cut
Spiked Average 6.52E+06 3.08E+06 4
Spiked RSD 59% 59%
Blank Average 9.71E+03 9.83E+04 4
Blank RSD 33% 22%
Primidone
Cocktail A
m/z 162 m/z 91 n
Manual
Spiked Average 2.55E+06 1.83E+06 4
Spiked RSD 33% 32%
Blank Average 6.32E+04 1.20E+05 4
Blank RSD 172% 86%
Laser-cut
Spiked Average 3.48E+06 4.09E+06 4
Spiked RSD 56% 44%
Blank Average 1.19E+04 2.27E+06 4
Blank RSD 35% 19%
Naproxen
Cocktail A
m/z 185 m/z 170 n
Manual
Spiked Average 1.12E+06 3.09E+05 4
Spiked RSD 15% 17%
Blank Average 1.66E+05 1.50E+04 4
Blank RSD 58% 105%
Laser-cut
Spiked Average 3.48E+06 5.42E+05 4
Spiked RSD 56% 56%
Blank Average 1.19E+04 7.32E+04 4
Blank RSD 35% 21%
123
Felbamate
Cocktail A
m/z 117 m/z 178 n
Manual
Spiked Average 7.17E+05 4.37E+05 4
Spiked RSD 22% 23%
Blank Average 5.26E+04 1.17E+04 4
Blank RSD 76% 173%
Laser-cut
Spiked Average 1.68E+06 1.07E+06 4
Spiked RSD 48% 48%
Blank Average 3.24E+04 1.35E+03 4
Blank RSD 18% 35%
Phenytoin
Cocktail A
m/z 182 m/z 104 n
Manual
Spiked Average 5.49E+05 3.60E+05 4
Spiked RSD 80% 80%
Blank Average 1.29E+04 8.19E+03 4
Blank RSD 121% 95%
Laser-cut
Spiked Average 2.75E+05 2.10E+05 4
Spiked RSD 67% 69%
Blank Average 2.25E+04 3.61E+04 4
Blank RSD 28% 34%
Carisoprodol
Cocktail A
m/z 97 m/z 55 n
Manual
Spiked Average 5.46E+05 3.75E+05 4
Spiked RSD 37% 29%
Blank Average 1.42E+05 8.43E+04 4
Blank RSD 33% 45%
Laser-cut
Spiked Average 1.59E+06 1.25E+06 4
Spiked RSD 31% 34%
Blank Average 8.38E+04 4.26E+04 4
Blank RSD 22% 22%
124

Tramadol
Cocktail A
m/z 264 m/z 58 n
Manual
Spiked Average 1.58E+07 4.50E+07 4
Spiked RSD 46% 48%
Blank Average 1.55E+06 1.16E+06 4
Blank RSD 52% 178%
Laser-cut
Spiked Average 7.75E+07 1.36E+08 4
Spiked RSD 18% 17%
Blank Average 3.40E+07 2.64E+04 4
Blank RSD 21% 25%
Norsertraline
Cocktail A
m/z 158 m/z 123 n
Manual
Spiked Average 3.43E+06 2.40E+05 4
Spiked RSD 41% 43%
Blank Average 1.17E+05 6.87E+03 4
Blank RSD 81% 93%
Laser-cut
Spiked Average 1.12E+07 7.89E+05 4
Spiked RSD 11% 12%
Blank Average 1.68E+05 1.38E+04 4
Blank RSD 19% 37%
125

Meprobamate
Cocktail B
m/z 158 m/z 97 n
Manual
Spiked Average 5.77E+05 5.09E+05 4
Spiked RSD 20% 20%
Blank Average 2.78E+03 2.05E+04 4
Blank RSD 51% 30%
Laser-cut
Spiked Average 9.12E+05 7.95E+05 4
Spiked RSD 21% 21%
Blank Average 1.84E+03 3.28E+04 4
Blank RSD 31% 18%
Metaxalone
Cocktail B
m/z 161 m/z 105 n
Manual
Spiked Average 1.42E+06 3.83E+05 4
Spiked RSD 21% 21%
Blank Average 1.20E+04 1.58E+04 4
Blank RSD 29% 32%
Laser-cut
Spiked Average 1.77E+06 5.04E+05 4
Spiked RSD 19% 19%
Blank Average 1.57E+04 5.78E+04 4
Blank RSD 27% 25%
Carbamazepine
Cocktail B
m/z 194 m/z 192 n
Manual
Spiked Average 1.09E+07 2.45E+06 4
Spiked RSD 14% 14%
Blank Average 6.04E+04 1.32E+04 4
Blank RSD 49% 47%
Laser-cut
Spiked Average 2.57E+07 5.76E+06 4
Spiked RSD 25% 24%
Blank Average 2.90E+04 2.76E+04 4
Blank RSD 35% 38%
126
Methocarbamol
Cocktail B
m/z 118 m/z 199 n
Manual
Spiked Average 3.49E+05 7.21E+04 4
Spiked RSD 23% 26%
Blank Average 3.24E+03 1.12E+03 4
Blank RSD 30% 29%
Laser-cut
Spiked Average 6.46E+05 1.33E+05 4
Spiked RSD 24% 24%
Blank Average 5.92E+03 1.41E+03 4
Blank RSD 27% 26%
Nortramadol
Cocktail B
m/z 232 m/z 42 n
Manual
Spiked Average 4.78E+05 9.98E+04 4
Spiked RSD 11% 20%
Blank Average 9.97E+04 2.96E+03 4
Blank RSD 14% 23%
Laser-cut
Spiked Average 1.29E+06 2.98E+05 4
Spiked RSD 16% 16%
Blank Average 2.59E+05 1.44E+04 4
Blank RSD 30% 32%
Carbamazepine-10,11-epoxide
Cocktail B
m/z 180 m/z 210 n
Manual
Spiked Average 3.58E+06 1.39E+06 4
Spiked RSD 17% 17%
Blank Average 1.45E+04 1.53E+04 4
Blank RSD 51% 27%
Laser-cut
Spiked Average 1.01E+07 3.86E+06 4
Spiked RSD 26% 26%
Blank Average 3.46E+04 2.15E+04 4
Blank RSD 20% 28%
127

Lamotrigine
Cocktail B
m/z 210 m/z 144 n
Manual
Spiked Average 2.97E+06 1.85E+06 4
Spiked RSD 16% 16%
Blank Average 3.52E+04 2.39E+04 4
Blank RSD 66% 61%
Laser-cut
Spiked Average 4.53E+06 2.88E+06 4
Spiked RSD 16% 16%
Blank Average 2.50E+04 3.47E+04 4
Blank RSD 24% 21%
Baclofen
Cocktail B
m/z 151 m/z 115 n
Manual
Spiked Average 2.82E+06 2.37E+06 4
Spiked RSD 11% 10%
Blank Average 2.99E+04 3.06E+04 4
Blank RSD 48% 34%
Laser-cut
Spiked Average 7.84E+05 7.02E+05 4
Spiked RSD 32% 31%
Blank Average 2.24E+04 6.51E+04 4
Blank RSD 39% 20%
128
Amphetamine
Cocktail C
m/z 91 m/z 119 n
Manual
Spiked Average 2.83E+06 6.61E+05 4
Spiked RSD 13% 16%
Blank Average 3.17E+05 2.99E+04 4
Blank RSD 17% 23%
Laser-cut
Spiked Average 4.53E+06 9.61E+05 4
Spiked RSD 16% 14%
Blank Average 7.48E+05 2.05E+04 4
Blank RSD 22% 31%
Pregabalin
Cocktail C
m/z 97 m/z 124 n
Manual
Spiked Average 1.26E+05 5.88E+05 4
Spiked RSD 9% 10%
Blank Average 4.48E+03 8.69E+03 4
Blank RSD 24% 36%
Laser-cut
Spiked Average 1.11E+05 4.98E+05 4
Spiked RSD 27% 27%
Blank Average 1.70E+04 4.26E+04 4
Flecainide
Cocktail C
m/z 301 m/z 98 n
Manual
Spiked Average 6.75E+06 2.73E+06 4
Spiked RSD 23% 24%
Blank Average 2.17E+04 8.15E+03 4
Blank RSD 78% 86%
Laser-cut
Spiked Average 3.47E+07 1.39E+07 4
Spiked RSD 19% 18%
Blank Average 1.71E+04 6.47E+03 4
Blank RSD 15% 15%
129
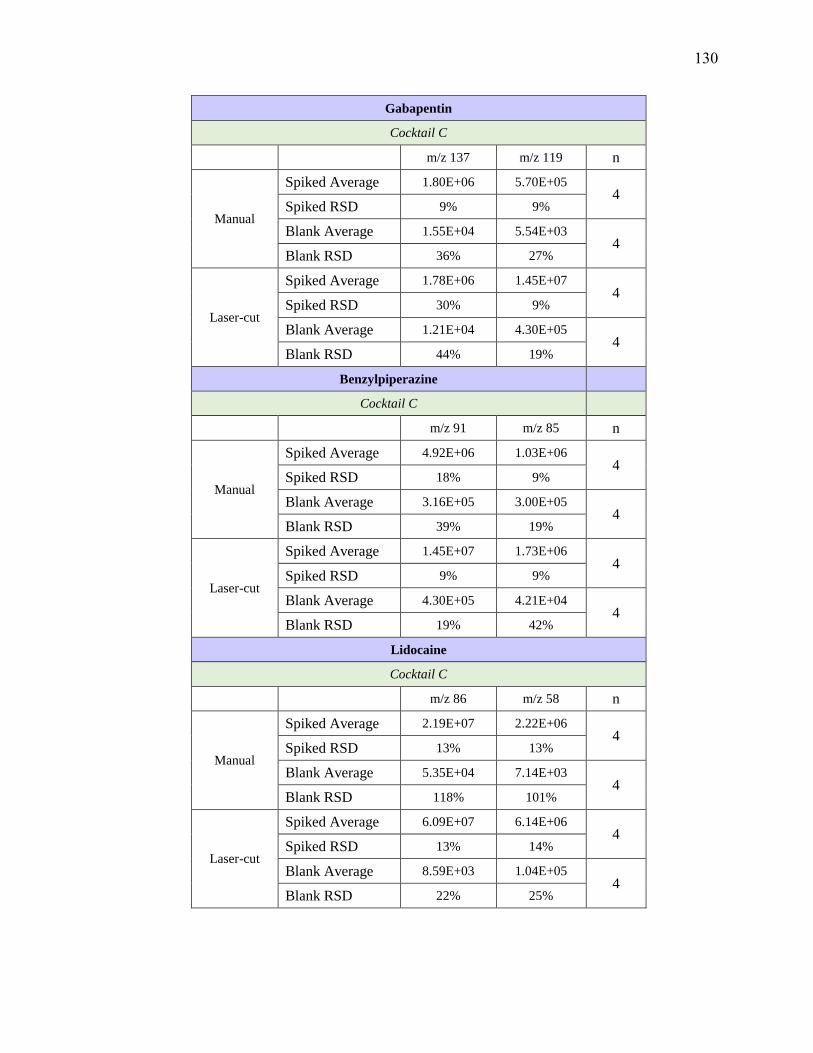
Gabapentin
Cocktail C
m/z 137 m/z 119 n
Manual
Spiked Average 1.80E+06 5.70E+05 4
Spiked RSD 9% 9%
Blank Average 1.55E+04 5.54E+03 4
Blank RSD 36% 27%
Laser-cut
Spiked Average 1.78E+06 1.45E+07 4
Spiked RSD 30% 9%
Blank Average 1.21E+04 4.30E+05 4
Blank RSD 44% 19%
Benzylpiperazine
Cocktail C
m/z 91 m/z 85 n
Manual
Spiked Average 4.92E+06 1.03E+06 4
Spiked RSD 18% 9%
Blank Average 3.16E+05 3.00E+05 4
Blank RSD 39% 19%
Laser-cut
Spiked Average 1.45E+07 1.73E+06 4
Spiked RSD 9% 9%
Blank Average 4.30E+05 4.21E+04 4
Blank RSD 19% 42%
Lidocaine
Cocktail C
m/z 86 m/z 58 n
Manual
Spiked Average 2.19E+07 2.22E+06 4
Spiked RSD 13% 13%
Blank Average 5.35E+04 7.14E+03 4
Blank RSD 118% 101%
Laser-cut
Spiked Average 6.09E+07 6.14E+06 4
Spiked RSD 13% 14%
Blank Average 8.59E+03 1.04E+05 4
Blank RSD 22% 25%
130
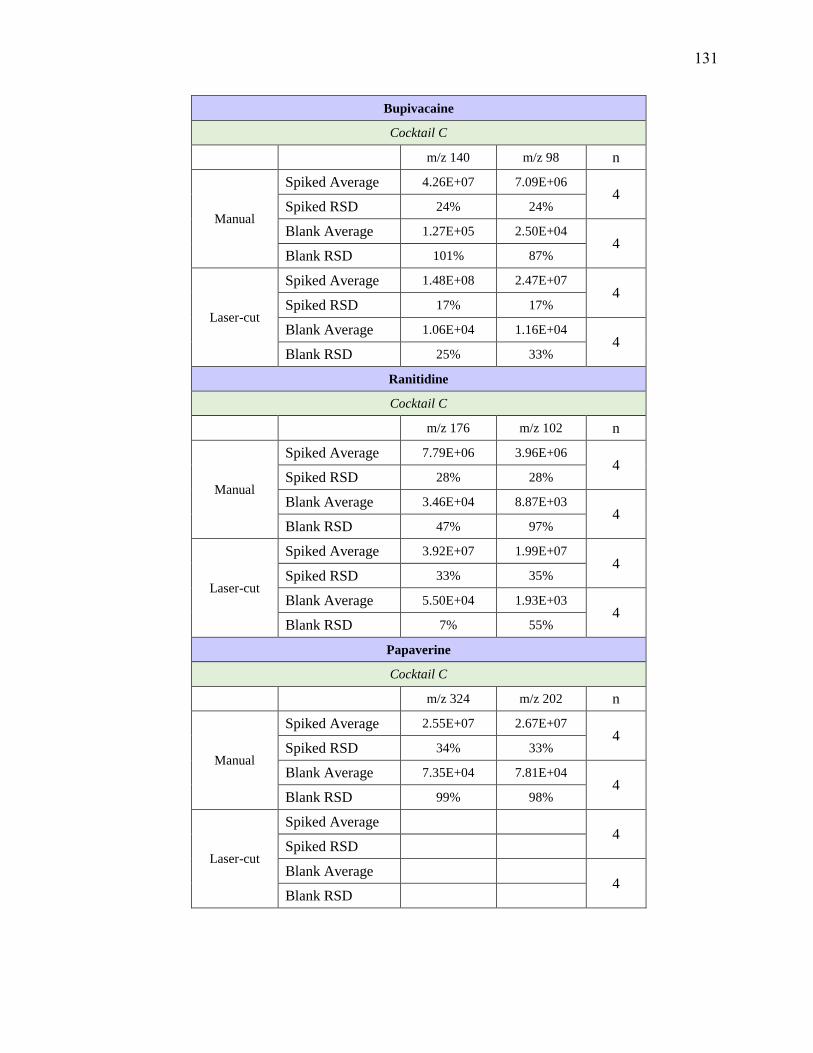
Bupivacaine
Cocktail C
m/z 140 m/z 98 n
Manual
Spiked Average 4.26E+07 7.09E+06 4
Spiked RSD 24% 24%
Blank Average 1.27E+05 2.50E+04 4
Blank RSD 101% 87%
Laser-cut
Spiked Average 1.48E+08 2.47E+07 4
Spiked RSD 17% 17%
Blank Average 1.06E+04 1.16E+04 4
Blank RSD 25% 33%
Ranitidine
Cocktail C
m/z 176 m/z 102 n
Manual
Spiked Average 7.79E+06 3.96E+06 4
Spiked RSD 28% 28%
Blank Average 3.46E+04 8.87E+03 4
Blank RSD 47% 97%
Laser-cut
Spiked Average 3.92E+07 1.99E+07 4
Spiked RSD 33% 35%
Blank Average 5.50E+04 1.93E+03 4
Blank RSD 7% 55%
Papaverine
Cocktail C
m/z 324 m/z 202 n
Manual
Spiked Average 2.55E+07 2.67E+07 4
Spiked RSD 34% 33%
Blank Average 7.35E+04 7.81E+04 4
Blank RSD 99% 98%
Laser-cut
Spiked Average 4
Spiked RSD
Blank Average 4
Blank RSD
131
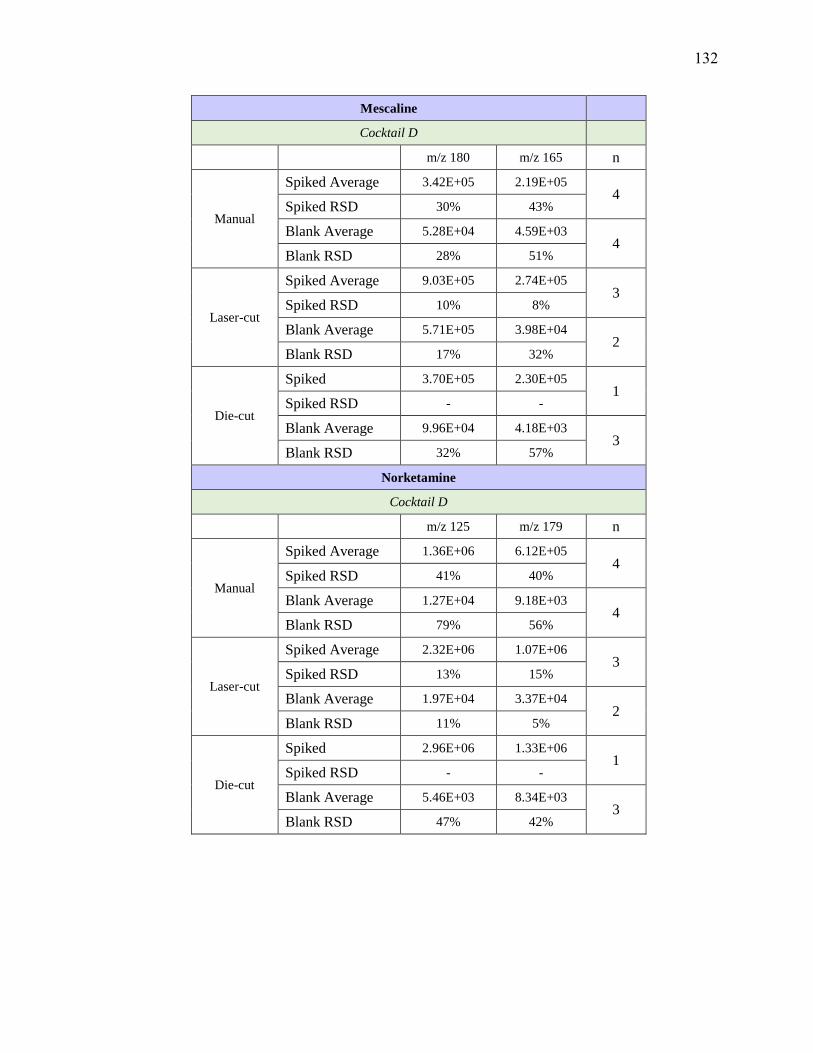
Mescaline
Cocktail D
m/z 180 m/z 165 n
Manual
Spiked Average 3.42E+05 2.19E+05 4
Spiked RSD 30% 43%
Blank Average 5.28E+04 4.59E+03 4
Blank RSD 28% 51%
Laser-cut
Spiked Average 9.03E+05 2.74E+05 3
Spiked RSD 10% 8%
Blank Average 5.71E+05 3.98E+04 2
Blank RSD 17% 32%
Die-cut
Spiked 3.70E+05 2.30E+05 1
Spiked RSD - -
Blank Average 9.96E+04 4.18E+03 3
Blank RSD 32% 57%
Norketamine
Cocktail D
m/z 125 m/z 179 n
Manual
Spiked Average 1.36E+06 6.12E+05 4
Spiked RSD 41% 40%
Blank Average 1.27E+04 9.18E+03 4
Blank RSD 79% 56%
Laser-cut
Spiked Average 2.32E+06 1.07E+06 3
Spiked RSD 13% 15%
Blank Average 1.97E+04 3.37E+04 2
Blank RSD 11% 5%
Die-cut
Spiked 2.96E+06 1.33E+06 1
Spiked RSD - -
Blank Average 5.46E+03 8.34E+03 3
Blank RSD 47% 42%
132

Ketamine
Cocktail D
m/z 89 m/z 125 n
Manual
Spiked Average 4.91E+05 1.99E+06 4
Spiked RSD 31% 30%
Blank Average 5.42E+03 1.41E+04 4
Blank RSD 77% 104%
Laser-cut
Spiked Average 1.22E+06 4.72E+06 3
Spiked RSD 23% 21%
Blank Average 3.89E+04 3.00E+04 2
Blank RSD 14% 15%
Die-cut
Spiked 1.84E+06 7.34E+06 1
Spiked RSD - -
Blank Average 8.81E+03 4.75E+03 3
Blank RSD 71% 51%
Etomidate
Cocktail D
m/z 141 m/z 95 n
Manual
Spiked Average 2.15E+06 2.27E+06 4
Spiked RSD 29% 9%
Blank Average 1.08E+05 4.46E+05 4
Blank RSD 49% 67%
Laser-cut
Spiked Average - 2.47E+06 3
Spiked RSD - 29%
Blank Average - 7.45E+04 2
Blank RSD - 10%
Die-cut
Spiked Average - 2.52E+06 1
Spiked RSD - -
Blank Average - 8.75E+04 3
Blank RSD - 47%
133

Metoclopramide
Cocktail D
m/z 227 m/z 184 n
Manual
Spiked Average 7.39E+06 2.75E+06 4
Spiked RSD 34% 34%
Blank Average 6.70E+04 3.10E+04 4
Blank RSD 107% 77%
Laser-cut
Spiked Average 3.02E+07 1.14E+07 3
Spiked RSD 32% 31%
Blank Average 1.90E+04 4.57E+04 2
Blank RSD 16% 6%
Die-cut
Spiked 7.51E+07 2.96E+07 1
Spiked RSD - -
Blank Average 1.16E+04 2.04E+04 3
Blank RSD 60% 65%
Desmethylclomipramine
Cocktail D
m/z 72 m/z 227 n
Manual
Spiked Average 3.77E+05 9.10E+04 4
Spiked RSD 36% 28%
Blank Average 3.49E+03 8.18E+03 4
Blank RSD 68% 32%
Laser-cut
Spiked Average 1.52E+06 3.55E+05 3
Spiked RSD 6% 13%
Blank Average 1.23E+03 2.77E+04 2
Blank RSD 6% 11%
Die-cut
Spiked 1.98E+06 5.09E+05 1
Spiked RSD - -
Blank Average 1.15E+03 1.70E+04 3
Blank RSD 83% 78%
134

Sertraline
Cocktail D
m/z 158 m/z 275 n
Manual
Spiked Average 2.66E+05 2.16E+05 4
Spiked RSD 33% 37%
Blank Average 8.49E+03 2.66E+03 4
Blank RSD 44% 65%
Laser-cut
Spiked Average 8.95E+05 7.37E+05 3
Spiked RSD 6% 6%
Blank Average 1.89E+04 2.11E+03 2
Blank RSD 4% 16%
Die-cut
Spiked 9.17E+05 7.68E+05 1
Spiked RSD - -
Blank Average 1.27E+04 2.19E+03 3
MDA
Cocktail D
m/z 135 m/z 133 n
Manual
Spiked Average 2.86E+05 2.66E+05 4
Spiked RSD 33% 34%
Blank Average 1.15E+04 1.54E+04 4
Blank RSD 38% 28%
Laser-cut
Spiked Average 4.48E+05 4.48E+05 3
Spiked RSD 5% 5%
Blank Average 3.78E+04 3.78E+04 2
Blank RSD 22% 22%
Die-cut
Spiked 4.87E+05 4.87E+05 1
Spiked RSD - -
Blank Average 2.08E+04 2.08E+04 3
Blank RSD 46% 46%
135

Oxycodone
Cocktail D
m/z 241 m/z 212 n
Manual
Spiked Average 2.84E+05 1.84E+05 4
Spiked RSD 36% 33%
Blank Average 9.80E+03 9.51E+03 4
Blank RSD 36% 39%
Laser-cut
Spiked Average 4.93E+05 3.42E+05 3
Spiked RSD 17% 19%
Blank Average 1.51E+04 3.31E+04 2
Blank RSD 19% 13%
Die-cut
Spiked 4.52E+05 3.06E+05 1
Spiked RSD - -
Blank Average 7.39E+03 1.24E+04 3
Blank RSD 66% 70%
Trazodone
Cocktail D
m/z 176 m/z 148 n
Manual
Spiked Average 2.52E+06 2.09E+06 4
Spiked RSD 36% 35%
Blank Average 3.54E+04 2.76E+04 4
Blank RSD 52% 53%
Laser-cut
Spiked Average 9.91E+06 8.19E+06 3
Spiked RSD 23% 24%
Blank Average 2.29E+04 4.90E+04 2
Blank RSD 6% 7%
Die-cut
Spiked 1.33E+07 1.10E+07 1
Spiked RSD - -
Blank Average 4.19E+04 1.20E+04 3
Blank RSD 35% 62%
136

Ziprasidone
Cocktail D
m/z 194 m/z 159 n
Manual
Spiked Average 7.30E+05 5.93E+05 4
Spiked RSD 49% 23%
Blank Average 5.68E+03 9.76E+04 4
Blank RSD 69% 68%
Laser-cut
Spiked Average 1.32E+06 5.98E+05 3
Spiked RSD 16% 16%
Blank Average 1.50E+04 9.83E+04 2
Blank RSD 6% 0%
Die-cut
Spiked 7.82E+05 3.43E+05 1
Spiked RSD - -
Blank Average 6.23E+03 4.46E+04 3
Blank RSD 54% 34%
Aripiprazole
Cocktail D
m/z 285 m/z 176 n
Manual
Spiked Average 8.62E+05 2.46E+05 4
Spiked RSD 46% 43%
Blank Average 1.16E+04 7.07E+03 4
Blank RSD 48% 27%
Laser-cut
Spiked Average 1.93E+06 5.46E+05 3
Spiked RSD 11% 11%
Blank Average 8.94E+03 9.71E+03 2
Blank RSD 4% 20%
Die-cut
Spiked 1.50E+06 4.28E+05 1
Spiked RSD - -
Blank Average 3.85E+03 9.49E+03 3
Blank RSD 50% 52%
137
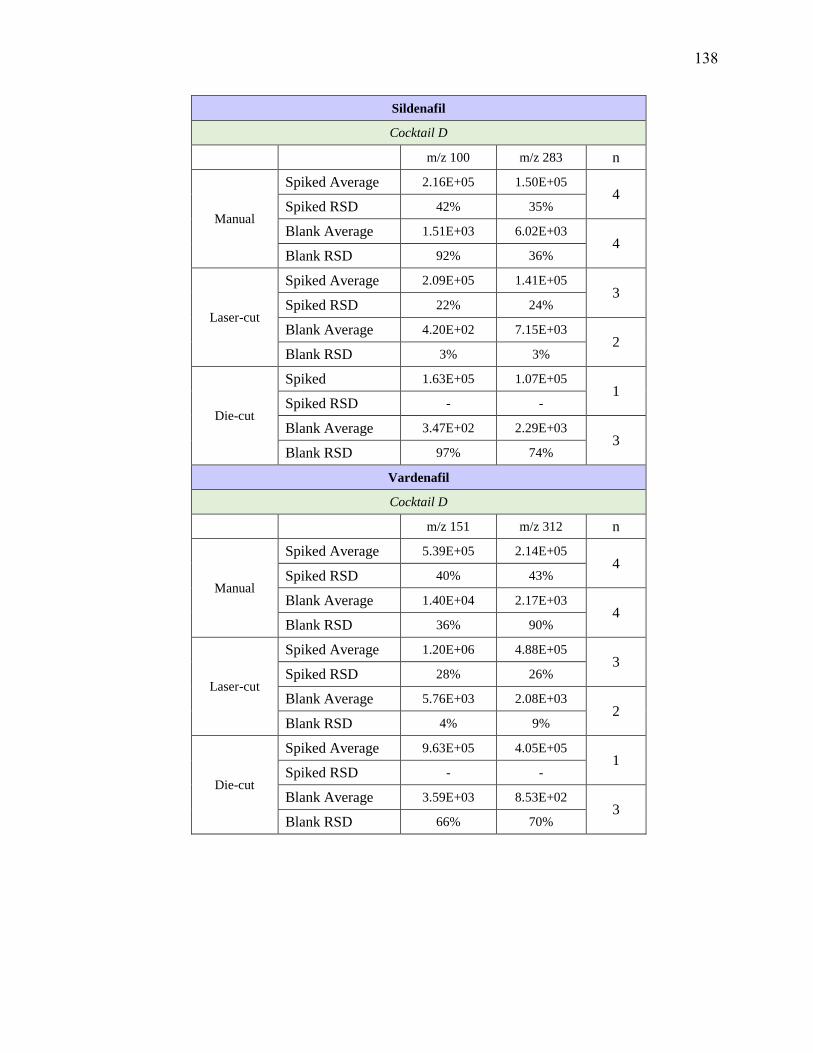
Sildenafil
Cocktail D
m/z 100 m/z 283 n
Manual
Spiked Average 2.16E+05 1.50E+05 4
Spiked RSD 42% 35%
Blank Average 1.51E+03 6.02E+03 4
Blank RSD 92% 36%
Laser-cut
Spiked Average 2.09E+05 1.41E+05 3
Spiked RSD 22% 24%
Blank Average 4.20E+02 7.15E+03 2
Blank RSD 3% 3%
Die-cut
Spiked 1.63E+05 1.07E+05 1
Spiked RSD - -
Blank Average 3.47E+02 2.29E+03 3
Blank RSD 97% 74%
Vardenafil
Cocktail D
m/z 151 m/z 312 n
Manual
Spiked Average 5.39E+05 2.14E+05 4
Spiked RSD 40% 43%
Blank Average 1.40E+04 2.17E+03 4
Blank RSD 36% 90%
Laser-cut
Spiked Average 1.20E+06 4.88E+05 3
Spiked RSD 28% 26%
Blank Average 5.76E+03 2.08E+03 2
Blank RSD 4% 9%
Die-cut
Spiked Average 9.63E+05 4.05E+05 1
Spiked RSD - -
Blank Average 3.59E+03 8.53E+02 3
Blank RSD 66% 70%
138
Ephedrine/Pseudoephedrine
Cocktail E
m/z 115 m/z 117 n
Manual
Spiked Average 1.85E+05 1.54E+05 4
Spiked RSD 4% 6%
Blank Average 7.04E+03 5.66E+03 4
Blank RSD 112% 108%
Laser-cut
Spiked Average 3.55E+05 3.07E+05 4
Spiked RSD 36% 37%
Blank Average 3.87E+03 9.06E+03 2
Blank RSD 1% 28%
Die-cut
Spiked Average 4.39E+05 3.62E+05 4
Spiked RSD 13% 13%
Blank Average 9.95E+03 7.31E+03 3
Blank RSD 41% 56%
TFMPP
Cocktail E
m/z 188 m/z 118 n
Manual
Spiked Average 6.26E+05 1.50E+05 4
Spiked RSD 11% 10%
Blank Average 1.49E+04 6.71E+03 4
Blank RSD 96% 66%
Laser-cut
Spiked Average 7.98E+05 2.45E+05 4
Spiked RSD 11% 25%
Blank Average 3.16E+04 4.23E+04 2
Blank RSD 7% 10%
Die-cut
Spiked Average 1.20E+06 2.85E+05 4
Spiked RSD 15% 17%
Blank Average 2.19E+04 1.42E+04 3
Blank RSD 63% 63%
139
Propranolol
Cocktail E
m/z 116 m/z 183 n
Manual
Spiked Average 3.13E+05 2.80E+05 4
Spiked RSD 8% 8%
Blank Average 7.13E+03 1.23E+04 4
Blank RSD 125% 73%
Laser-cut
Spiked Average 8.76E+05 7.77E+05 4
Spiked RSD 21% 22%
Blank Average 6.21E+03 1.49E+04 2
Blank RSD 15% 1%
Die-cut
Spiked Average 1.04E+06 9.41E+05 4
Spiked RSD 12% 11%
Blank Average 1.86E+03 1.31E+04 3
Blank RSD 67% 36%
Norvenlafaxine
Cocktail E
m/z 58 m/z 107 n
Manual
Spiked Average 5.46E+05 1.30E+05 4
Spiked RSD 12% 12%
Blank Average 3.26E+04 1.04E+04 4
Blank RSD 123% 52%
Laser-cut
Spiked Average 1.95E+06 6.53E+05 4
Spiked RSD 53% 57%
Blank Average 3.13E+04 1.94E+05 2
Blank RSD 41% 19%
Die-cut
Spiked Average 2.39E+06 6.22E+05 4
Spiked RSD 21% 22%
Blank Average 4.90E+03 9.72E+04 3
Blank RSD 39% 68%
140

Venlafaxine
Cocktail E
m/z 58 m/z 121 n
Manual
Spiked Average 9.77E+05 2.56E+05 4
Spiked RSD 17% 17%
Blank Average 1.05E+04 1.26E+04 4
Blank RSD 150% 56%
Laser-cut
Spiked Average 3.70E+06 1.34E+06 4
Spiked RSD 47% 46%
Blank Average 1.61E+04 1.74E+05 2
Blank RSD 21% 9%
Die-cut
Spiked Average 5.80E+06 1.52E+06 4
Spiked RSD 24% 24%
Blank Average 6.48E+03 9.21E+04 3
Blank RSD 75% 68%
Pentazocine
Cocktail E
m/z 218 m/z 69 n
Manual
Spiked Average 1.58E+06 3.75E+05 4
Spiked RSD 15% 14%
Blank Average 2.18E+04 3.47E+04 4
Blank RSD 132% 40%
Laser-cut
Spiked Average 6.86E+06 1.60E+06 4
Spiked RSD 40% 40%
Blank Average 2.55E+04 1.06E+05 2
Blank RSD 7% 11%
Die-cut
Spiked Average 9.67E+06 2.17E+06 4
Spiked RSD 25% 25%
Blank Average 1.25E+04 1.26E+05 3
Blank RSD 52% 70%
141

Demoxepam
Cocktail E
m/z 179 m/z 207 n
Manual
Spiked Average 1.91E+04 1.52E+04 4
Spiked RSD 21% 18%
Blank Average 3.17E+03 5.62E+03 4
Blank RSD 76% 68%
Laser-cut
Spiked Average 4.53E+04 3.14E+04 4
Spiked RSD 56% 59%
Blank Average 7.20E+03 6.92E+03 2
Blank RSD 16% 7%
Die-cut
Spiked Average 4.43E+04 2.95E+04 4
Spiked RSD 41% 45%
Blank Average 2.40E+03 2.93E+03 3
Blank RSD 62% 64%
Norpropoxyphene
Cocktail E
m/z 44 m/z 128 n
Manual
Spiked Average 2.62E+05 1.28E+05 4
Spiked RSD 20% 19%
Blank Average 4.31E+03 6.32E+03 4
Blank RSD 115% 72%
Laser-cut
Spiked Average 1.39E+06 7.25E+05 4
Spiked RSD 27% 22%
Blank Average 2.32E+03 2.94E+04 2
Blank RSD 17% 8%
Die-cut
Spiked Average 1.98E+06 9.67E+05 4
Spiked RSD 31% 32%
Blank Average 2.32E+03 1.37E+04 3
Blank RSD 52% 55%
142
Olanzapine
Cocktail E
m/z 256 m/z 198 n
Manual
Spiked Average 1.12E+05 3.07E+04 4
Spiked RSD 16% 14%
Blank Average 4.02E+03 2.78E+03 4
Blank RSD 66% 52%
Laser-cut
Spiked Average 5.66E+05 1.74E+05 4
Spiked RSD 32% 41%
Blank Average 8.51E+03 2.20E+04 2
Blank RSD 19% 3%
Die-cut
Spiked Average 4.10E+05 1.35E+05 4
Spiked RSD 22% 29%
Blank Average 1.05E+04 7.75E+04 3
Blank RSD 57% 83%
Propoxyphene
Cocktail E
m/z 266 m/z 128 n
Manual
Spiked Average 3.23E+05 6.67E+04 4
Spiked RSD 14% 13%
Blank Average 1.03E+04 6.59E+03 4
Blank RSD 64% 70%
Laser-cut
Spiked Average 1.26E+06 2.68E+05 4
Spiked RSD 48% 47%
Blank Average 3.76E+03 1.89E+04 2
Blank RSD 5% 1%
Die-cut
Spiked Average 1.73E+06 3.43E+05 4
Spiked RSD 25% 25%
Blank Average 4.07E+03 1.59E+04 3
Blank RSD 15% 75%
143

Hydroxyzine
Cocktail E
m/z 201 m/z 165 n
Manual
Spiked Average 2.20E+06 1.82E+06 4
Spiked RSD 10% 10%
Blank Average 7.89E+04 3.24E+04 4
Blank RSD 63% 109%
Laser-cut
Spiked Average 8.73E+06 7.46E+06 4
Spiked RSD 40% 42%
Blank Average 4.40E+04 7.12E+03 2
Blank RSD 14% 4%
Die-cut
Spiked Average 1.19E+07 1.00E+07 4
Spiked RSD 20% 20%
Blank Average 9.63E+04 5.27E+03 3
Blank RSD 48% 65%
Quetiapine
Cocktail E
m/z 253 m/z 221 n
Manual
Spiked Average 2.36E+06 1.51E+06 4
Spiked RSD 11% 10%
Blank Average 3.58E+04 1.87E+04 4
Blank RSD 109% 128%
Laser-cut
Spiked Average 9.93E+06 6.44E+06 4
Spiked RSD 52% 53%
Blank Average 9.03E+03 1.34E+04 2
Blank RSD 13% 5%
Die-cut
Spiked Average 1.08E+07 6.97E+06 4
Spiked RSD 25% 25%
Blank Average 9.96E+03 8.58E+03 3
Blank RSD 83% 84%
144

Verapamil
Cocktail E
m/z 165 m/z n
Manual
Spiked Average 1.57E+06 5.76E+05 4
Spiked RSD 10% 10%
Blank Average 4.59E+04 7.21E+03 4
Blank RSD 72% 138%
Laser-cut
Spiked Average 8.45E+06 3.16E+06 4
Spiked RSD 14% 14%
Blank Average 1.72E+04 8.86E+03 2
Blank RSD 6% 28%
Die-cut
Spiked Average 1.16E+07 4.30E+06 4
Spiked RSD 26% 26%
Blank Average 1.80E+04 2.94E+03 3
Blank RSD 44% 54%
145
Mephedrone
Cocktail F
m/z 145 m/z 144 n
Manual
Spiked Average 1.09E+06 8.11E+05 4
Spiked RSD 8% 9%
Blank Average 1.39E+04 7.25E+03 4
Blank RSD 42% 77%
Laser-cut
Spiked Average 1.85E+06 1.39E+06 4
Spiked RSD 20% 19%
Blank Average 1.40E+04 1.22E+04 2
Blank RSD 25% 44%
Die-cut
Spiked Average 4.78E+06 3.58E+06 4
Spiked RSD 3% 4%
Blank Average 2.08E+04 1.28E+04 3
Blank RSD 61% 34%
MDMA
Cocktail F
m/z 163 m/z 105 n
Manual
Spiked Average 1.11E+06 4.03E+05 4
Spiked RSD 7% 7%
Blank Average 9.74E+03 1.01E+04 4
Blank RSD 68% 42%
Laser-cut
Spiked Average 2.26E+06 8.64E+05 4
Spiked RSD 17% 19%
Blank Average 5.76E+03 4.23E+04 2
Blank RSD 31% 30%
Die-cut
Spiked Average 3.58E+06 1.32E+06 4
Spiked RSD 10% 11%
Blank Average 5.30E+03 5.83E+04 3
Blank RSD 95% 80%
146

Methylone
Cocktail F
m/z 160 m/z 132 n
Manual
Spiked Average 1.09E+06 5.76E+05 4
Spiked RSD 8% 9%
Blank Average 1.88E+04 1.59E+04 4
Blank RSD 43% 18%
Laser-cut
Spiked Average 2.08E+06 1.13E+06 4
Spiked RSD 23% 26%
Blank Average 6.75E+04 7.23E+04 2
Blank RSD 7% 13%
Die-cut
Spiked Average 4.00E+06 2.10E+06 4
Spiked RSD 13% 13%
Blank Average 1.85E+04 4.70E+04 3
Blank RSD 112% 80%
Mirtazapine
Cocktail F
m/z 195 m/z 194 n
Manual
Spiked Average 1.60E+06 6.46E+05 4
Spiked RSD 9% 9%
Blank Average 1.47E+04 6.39E+03 4
Blank RSD 57% 43%
Laser-cut
Spiked Average 3.77E+06 1.57E+06 4
Spiked RSD 26% 27%
Blank Average 2.25E+04 6.16E+04 2
Blank RSD 1% 19%
Die-cut
Spiked Average 6.69E+06 2.73E+06 4
Spiked RSD 7% 7%
Blank Average 2.03E+04 5.24E+04 3
Blank RSD 49% 46%
147

Metoprolol
Cocktail F
m/z 116 m/z 77 n
Manual
Spiked Average 2.78E+05 2.08E+05 4
Spiked RSD 8% 7%
Blank Average 4.00E+03 1.85E+04 4
Blank RSD 77% 33%
Laser-cut
Spiked Average 8.10E+05 7.23E+05 4
Spiked RSD 10% 20%
Blank Average 2.22E+03 1.24E+05 2
Blank RSD 34% 18%
Die-cut
Spiked Average 1.14E+06 8.18E+05 4
Spiked RSD 11% 11%
Blank Average 1.15E+03 4.61E+04 3
Blank RSD 110% 59%
MDPV
Cocktail F
m/z 175 m/z 135 n
Manual
Spiked Average 1.26E+06 1.12E+06 4
Spiked RSD 18% 18%
Blank Average 1.37E+04 1.33E+04 4
Blank RSD 40% 47%
Laser-cut
Spiked Average 2.83E+06 2.66E+06 4
Spiked RSD 38% 39%
Blank Average 1.74E+04 8.56E+04 2
Blank RSD 28% 10%
Die-cut
Spiked Average 5.39E+06 4.82E+06 4
Spiked RSD 22% 23%
Blank Average 1.74E+04 5.36E+04 3
Blank RSD 65% 40%
148

Norclozapine
Cocktail F
m/z 192 m/z 270 n
Manual
Spiked Average 3.97E+05 2.93E+05 4
Spiked RSD 10% 10%
Blank Average 5.86E+03 4.94E+03 4
Blank RSD 53% 52%
Laser-cut
Spiked Average 6.90E+05 5.11E+05 4
Spiked RSD 21% 21%
Blank Average 7.64E+03 1.12E+04 2
Blank RSD 16% 67%
Die-cut
Spiked Average 9.77E+05 7.15E+05 4
Spiked RSD 14% 15%
Blank Average 5.41E+03 8.48E+03 3
Blank RSD 73% 45%
Midazolam
Cocktail F
m/z 291 m/z 249 n
Manual
Spiked Average 1.18E+06 3.33E+05 4
Spiked RSD 10% 10%
Blank Average 2.63E+04 7.59E+03 4
Blank RSD 89% 83%
Laser-cut
Spiked Average 2.84E+06 7.99E+05 4
Spiked RSD 38% 37%
Blank Average 8.05E+02 2.37E+03 2
Blank RSD 27% 21%
Die-cut
Spiked Average 5.40E+06 1.51E+06 4
Spiked RSD 14% 13%
Blank Average 4.86E+02 1.01E+03 3
Blank RSD 80% 80%
149

Labetalol
Cocktail F
m/z 162 m/z 91 n
Manual
Spiked Average 3.31E+05 3.16E+05 4
Spiked RSD 21% 18%
Blank Average 8.10E+03 3.04E+04 4
Blank RSD 61% 40%
Laser-cut
Spiked Average 3.22E+05 3.06E+05 4
Spiked RSD 28% 30%
Blank Average 1.34E+04 4.01E+04 2
Blank RSD 8% 19%
Die-cut
Spiked Average 3.84E+05 3.58E+05 4
Spiked RSD 16% 15%
Blank Average 7.53E+03 3.84E+04 3
Blank RSD 63% 84%
Donepezil
Cocktail F
m/z 91 m/z 243 n
Manual
Spiked Average 1.75E+06 2.81E+05 4
Spiked RSD 11% 12%
Blank Average 2.35E+04 4.56E+03 4
Blank RSD 48% 44%
Laser-cut
Spiked Average 6.20E+06 1.01E+06 4
Spiked RSD 18% 18%
Blank Average 2.28E+04 4.06E+03 2
Blank RSD 6% 11%
Die-cut
Spiked Average 1.19E+07 1.91E+06 4
Spiked RSD 12% 12%
Blank Average 1.92E+04 2.73E+03 3
Blank RSD 39% 64%
150
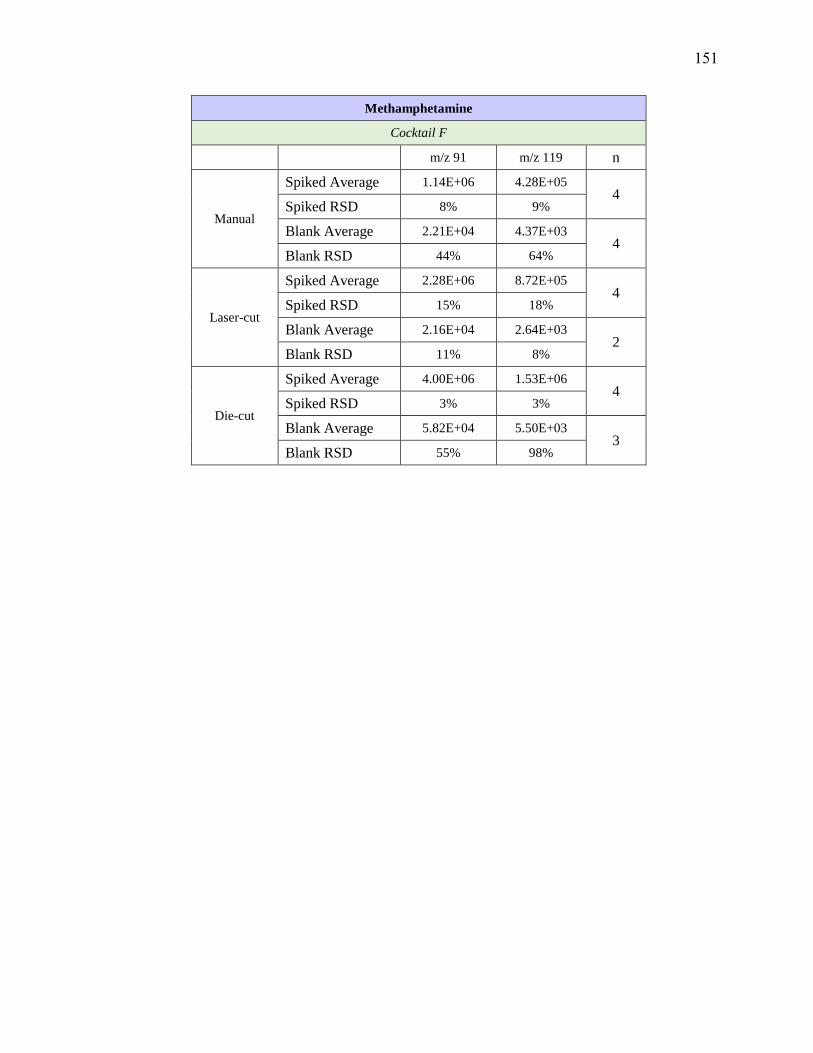
Methamphetamine
Cocktail F
m/z 91 m/z 119 n
Manual
Spiked Average 1.14E+06 4.28E+05 4
Spiked RSD 8% 9%
Blank Average 2.21E+04 4.37E+03 4
Blank RSD 44% 64%
Laser-cut
Spiked Average 2.28E+06 8.72E+05 4
Spiked RSD 15% 18%
Blank Average 2.16E+04 2.64E+03 2
Blank RSD 11% 8%
Die-cut
Spiked Average 4.00E+06 1.53E+06 4
Spiked RSD 3% 3%
Blank Average 5.82E+04 5.50E+03 3
Blank RSD 55% 98%
151
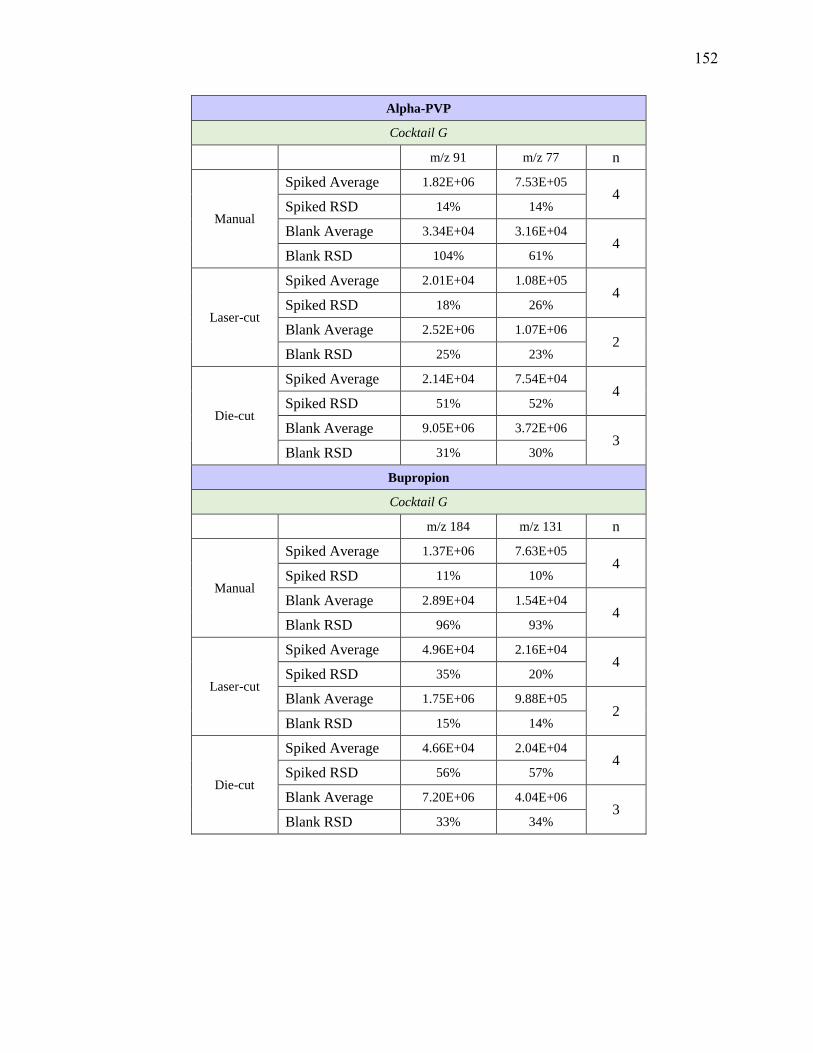
Alpha-PVP
Cocktail G
m/z 91 m/z 77 n
Manual
Spiked Average 1.82E+06 7.53E+05 4
Spiked RSD 14% 14%
Blank Average 3.34E+04 3.16E+04 4
Blank RSD 104% 61%
Laser-cut
Spiked Average 2.01E+04 1.08E+05 4
Spiked RSD 18% 26%
Blank Average 2.52E+06 1.07E+06 2
Blank RSD 25% 23%
Die-cut
Spiked Average 2.14E+04 7.54E+04 4
Spiked RSD 51% 52%
Blank Average 9.05E+06 3.72E+06 3
Blank RSD 31% 30%
Bupropion
Cocktail G
m/z 184 m/z 131 n
Manual
Spiked Average 1.37E+06 7.63E+05 4
Spiked RSD 11% 10%
Blank Average 2.89E+04 1.54E+04 4
Blank RSD 96% 93%
Laser-cut
Spiked Average 4.96E+04 2.16E+04 4
Spiked RSD 35% 20%
Blank Average 1.75E+06 9.88E+05 2
Blank RSD 15% 14%
Die-cut
Spiked Average 4.66E+04 2.04E+04 4
Spiked RSD 56% 57%
Blank Average 7.20E+06 4.04E+06 3
Blank RSD 33% 34%
152

7-aminoclonazepam
Cocktail G
m/z 121 m/z 94 n
Manual
Spiked Average 1.76E+05 6.92E+04 4
Spiked RSD 18% 18%
Blank Average 9.32E+03 7.98E+03 4
Blank RSD 61% 53%
Laser-cut
Spiked Average 3.57E+04 5.48E+04 4
Spiked RSD 34% 22%
Blank Average 7.70E+04 5.21E+04 2
Blank RSD 26% 31%
Die-cut
Spiked Average 1.92E+04 2.17E+04 4
Spiked RSD 51% 68%
Blank Average 2.37E+05 1.03E+05 3
Blank RSD 40% 38%
Desalkylflurazepam
Cocktail G
m/z 140 m/z 226 n
Manual
Spiked Average 3.19E+05 1.54E+05 4
Spiked RSD 16% 33%
Blank Average 5.43E+04 3.51E+03 4
Blank RSD 52% 125%
Laser-cut
Spiked Average 4.50E+03 8.07E+03 4
Spiked RSD 22% 12%
Blank Average 3.69E+04 8.90E+04 2
Blank RSD 20% 19%
Die-cut
Spiked Average 1.06E+04 2.16E+03 4
Spiked RSD 85% 73%
Blank Average 1.39E+05 2.08E+05 3
Blank RSD 21% 26%
153

Chlordiazepoxide
Cocktail G
m/z 227 m/z 255 n
Manual
Spiked Average 6.81E+05 1.61E+05 4
Spiked RSD 11% 12%
Blank Average 2.61E+04 9.06E+03 4
Blank RSD 74% 44%
Laser-cut
Spiked Average 1.28E+04 1.80E+04 4
Spiked RSD 24% 2%
Blank Average 2.42E+05 6.41E+04 2
Blank RSD 22% 20%
Die-cut
Spiked Average 8.80E+03 1.31E+04 4
Spiked RSD 53% 57%
Blank Average 5.17E+05 1.30E+05 3
Blank RSD 29% 28%
Cocaethylene
Cocktail G
m/z 196 m/z 82 n
Manual
Spiked Average 3.53E+06 9.50E+05 4
Spiked RSD 10% 10%
Blank Average 5.74E+04 2.28E+04 4
Blank RSD 103% 79%
Laser-cut
Spiked Average 1.73E+04 1.27E+04 4
Spiked RSD 2% 16%
Blank Average 6.06E+06 1.62E+06 2
Blank RSD 19% 20%
Die-cut
Spiked Average 3.33E+04 8.27E+03 4
Spiked RSD 84% 57%
Blank Average 2.66E+07 7.00E+06 3
Blank RSD 27% 27%
154

Chlorpromazine
Cocktail G
m/z 214 m/z 58 n
Manual
Spiked Average 3.65E+04 1.37E+05 4
Spiked RSD 10% 11%
Blank Average 1.90E+03 6.27E+03 4
Blank RSD 62% 48%
Laser-cut
Spiked Average 8.04E+03 6.49E+03 4
Spiked RSD 12% 27%
Blank Average 8.90E+04 3.25E+05 2
Blank RSD 19% 18%
Die-cut
Spiked Average 2.15E+03 7.47E+03 4
Spiked RSD 73% 56%
Blank Average 2.08E+05 8.02E+05 3
Blank RSD 26% 26%
Clozapine
Cocktail G
m/z 270 m/z 192 n
Manual
Spiked Average 1.32E+06 8.41E+05 4
Spiked RSD 10% 10%
Blank Average 1.72E+04 1.32E+04 4
Blank RSD 118% 104%
Laser-cut
Spiked Average 8.55E+03 7.83E+03 4
Spiked RSD 1% 24%
Blank Average 2.61E+06 1.68E+06 2
Blank RSD 25% 25%
Die-cut
Spiked Average 3.76E+03 4.60E+03 4
Spiked RSD 57% 77%
Blank Average 6.15E+06 3.97E+06 3
Blank RSD 36% 37%
155
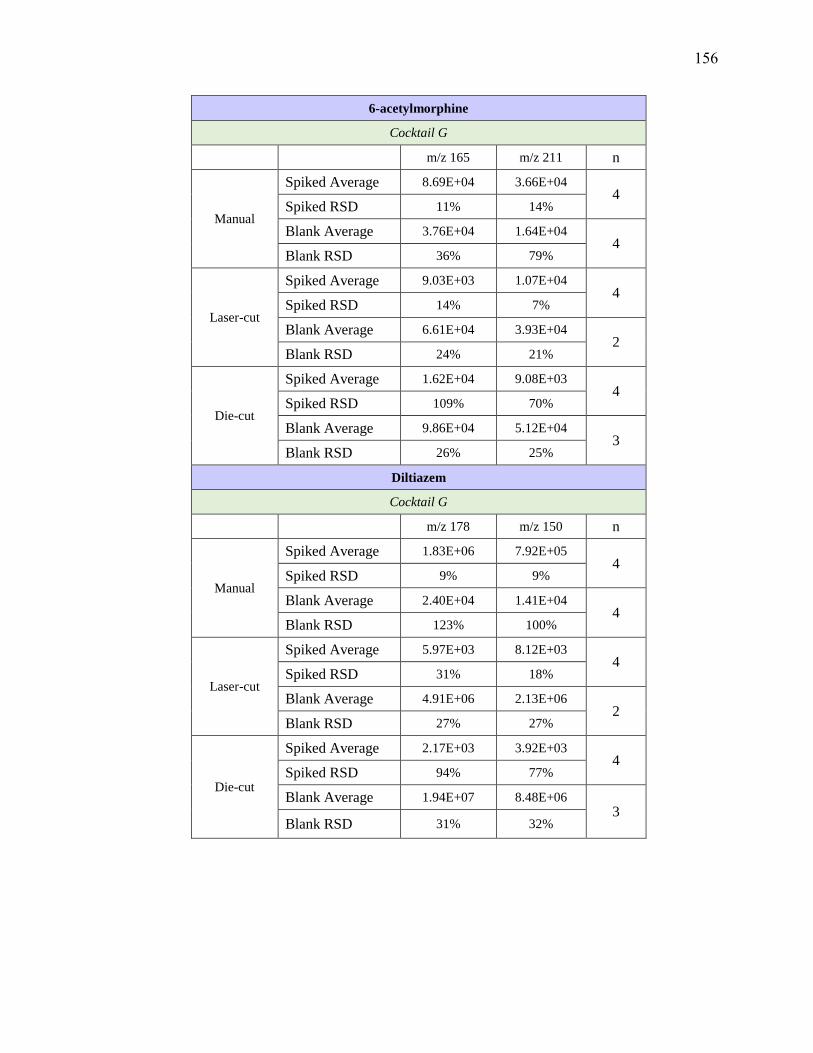
6-acetylmorphine
Cocktail G
m/z 165 m/z 211 n
Manual
Spiked Average 8.69E+04 3.66E+04 4
Spiked RSD 11% 14%
Blank Average 3.76E+04 1.64E+04 4
Blank RSD 36% 79%
Laser-cut
Spiked Average 9.03E+03 1.07E+04 4
Spiked RSD 14% 7%
Blank Average 6.61E+04 3.93E+04 2
Blank RSD 24% 21%
Die-cut
Spiked Average 1.62E+04 9.08E+03 4
Spiked RSD 109% 70%
Blank Average 9.86E+04 5.12E+04 3
Blank RSD 26% 25%
Diltiazem
Cocktail G
m/z 178 m/z 150 n
Manual
Spiked Average 1.83E+06 7.92E+05 4
Spiked RSD 9% 9%
Blank Average 2.40E+04 1.41E+04 4
Blank RSD 123% 100%
Laser-cut
Spiked Average 5.97E+03 8.12E+03 4
Spiked RSD 31% 18%
Blank Average 4.91E+06 2.13E+06 2
Blank RSD 27% 27%
Die-cut
Spiked Average 2.17E+03 3.92E+03 4
Spiked RSD 94% 77%
Blank Average 1.94E+07 8.48E+06 3
Blank RSD 31% 32%
156

Alfentanil
Cocktail G
m/z 268 m/z 197 n
Manual
Spiked Average 1.71E+05 1.17E+05 4
Spiked RSD 11% 10%
Blank Average 6.35E+03 8.68E+03 4
Blank RSD 61% 39%
Laser-cut
Spiked Average 6.27E+02 2.05E+03 4
Spiked RSD 16% 14%
Blank Average 1.99E+05 1.33E+05 2
Blank RSD 32% 30%
Die-cut
Spiked Average 3.07E+03 3.79E+03 4
Spiked RSD 100% 74%
Blank Average 1.41E+06 8.76E+05 3
Blank RSD 42% 39%
157
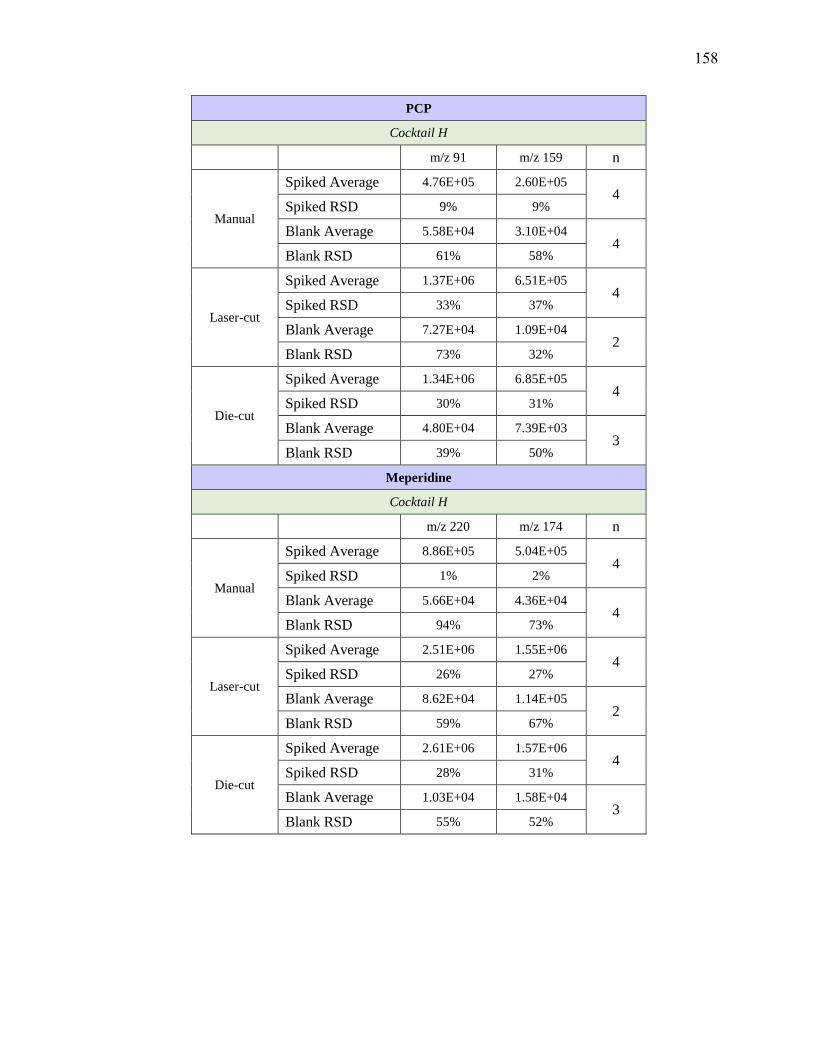
PCP
Cocktail H
m/z 91 m/z 159 n
Manual
Spiked Average 4.76E+05 2.60E+05 4
Spiked RSD 9% 9%
Blank Average 5.58E+04 3.10E+04 4
Blank RSD 61% 58%
Laser-cut
Spiked Average 1.37E+06 6.51E+05 4
Spiked RSD 33% 37%
Blank Average 7.27E+04 1.09E+04 2
Blank RSD 73% 32%
Die-cut
Spiked Average 1.34E+06 6.85E+05 4
Spiked RSD 30% 31%
Blank Average 4.80E+04 7.39E+03 3
Blank RSD 39% 50%
Meperidine
Cocktail H
m/z 220 m/z 174 n
Manual
Spiked Average 8.86E+05 5.04E+05 4
Spiked RSD 1% 2%
Blank Average 5.66E+04 4.36E+04 4
Blank RSD 94% 73%
Laser-cut
Spiked Average 2.51E+06 1.55E+06 4
Spiked RSD 26% 27%
Blank Average 8.62E+04 1.14E+05 2
Blank RSD 59% 67%
Die-cut
Spiked Average 2.61E+06 1.57E+06 4
Spiked RSD 28% 31%
Blank Average 1.03E+04 1.58E+04 3
Blank RSD 55% 52%
158

Diphenhydramine
Cocktail H
m/z 167 m/z 165 n
Manual
Spiked Average 8.30E+05 3.63E+05 4
Spiked RSD 2% 1%
Blank Average 6.65E+04 2.33E+04 4
Blank RSD 73% 92%
Laser-cut
Spiked Average 2.33E+06 1.04E+06 4
Spiked RSD 28% 30%
Blank Average 2.11E+04 1.11E+04 2
Blank RSD 30% 52%
Die-cut
Spiked Average 2.49E+06 1.09E+06 4
Spiked RSD 26% 27%
Blank Average 1.25E+04 4.73E+03 3
Blank RSD 43% 50%
Doxylamine
Cocktail H
m/z 167 m/z 182 n
Manual
Spiked Average 1.60E+06 1.41E+06 4
Spiked RSD 7% 8%
Blank Average 9.87E+04 7.62E+04 4
Blank RSD 84% 96%
Laser-cut
Spiked Average 3.68E+06 3.22E+06 4
Spiked RSD 37% 34%
Blank Average 5.48E+04 3.03E+04 2
Blank RSD 60% 5%
Die-cut
Spiked Average 4.15E+06 3.53E+06 4
Spiked RSD 32% 31%
Blank Average 3.29E+04 1.15E+04 3
Blank RSD 43% 34%
159

EDDP
Cocktail H
m/z 234 m/z 249 n
Manual
Spiked Average 2.81E+06 1.15E+06 4
Spiked RSD 9% 10%
Blank Average 2.26E+05 9.19E+04 4
Blank RSD 118% 118%
Laser-cut
Spiked Average 1.45E+07 5.95E+06 4
Spiked RSD 28% 28%
Blank Average 2.96E+04 9.61E+03 2
Blank RSD 54% 54%
Die-cut
Spiked Average 1.46E+07 6.05E+06 4
Spiked RSD 30% 31%
Blank Average 1.04E+04 2.21E+03 3
Blank RSD 36% 61%
Promethazine
Cocktail H
m/z 86 m/z 198 n
Manual
Spiked Average 3.07E+05 1.31E+05 4
Spiked RSD 1% 1%
Blank Average 5.14E+04 2.13E+04 4
Blank RSD 34% 39%
Laser-cut
Spiked Average 8.55E+05 3.82E+05 4
Spiked RSD 30% 32%
Blank Average 5.14E+04 3.27E+04 2
Blank RSD 0% 16%
Die-cut
Spiked Average 7.36E+05 3.23E+05 4
Spiked RSD 28% 29%
Blank Average 4.40E+04 1.98E+04 3
Blank RSD 26% 23%
160

Brompheniramine
Cocktail H
m/z 274 m/z 167 n
Manual
Spiked Average 7.88E+05 3.90E+05 4
Spiked RSD 5% 5%
Blank Average 3.67E+04 4.20E+04 4
Blank RSD 93% 38%
Laser-cut
Spiked Average 2.64E+06 1.29E+06 4
Spiked RSD 32% 34%
Blank Average 1.32E+04 1.31E+04 2
Blank RSD 69% 77%
Die-cut
Spiked Average 2.45E+06 1.17E+06 4
Spiked RSD 27% 28%
Blank Average 3.41E+03 4.74E+03 3
Blank RSD 63% 63%
Lorazepam
Cocktail H
m/z 276 m/z 167 n
Manual
Spiked Average 7.82E+05 3.80E+05 4
Spiked RSD 5% 4%
Blank Average 3.51E+04 3.46E+04 4
Blank RSD 95% 47%
Laser-cut
Spiked Average 2.54E+06 1.20E+06 4
Spiked RSD 29% 30%
Blank Average 1.60E+04 1.08E+04 2
Blank RSD 43% 66%
Die-cut
Spiked Average 2.41E+06 1.14E+06 4
Spiked RSD 26% 26%
Blank Average 8.18E+03 4.27E+03 3
Blank RSD 30% 65%
161
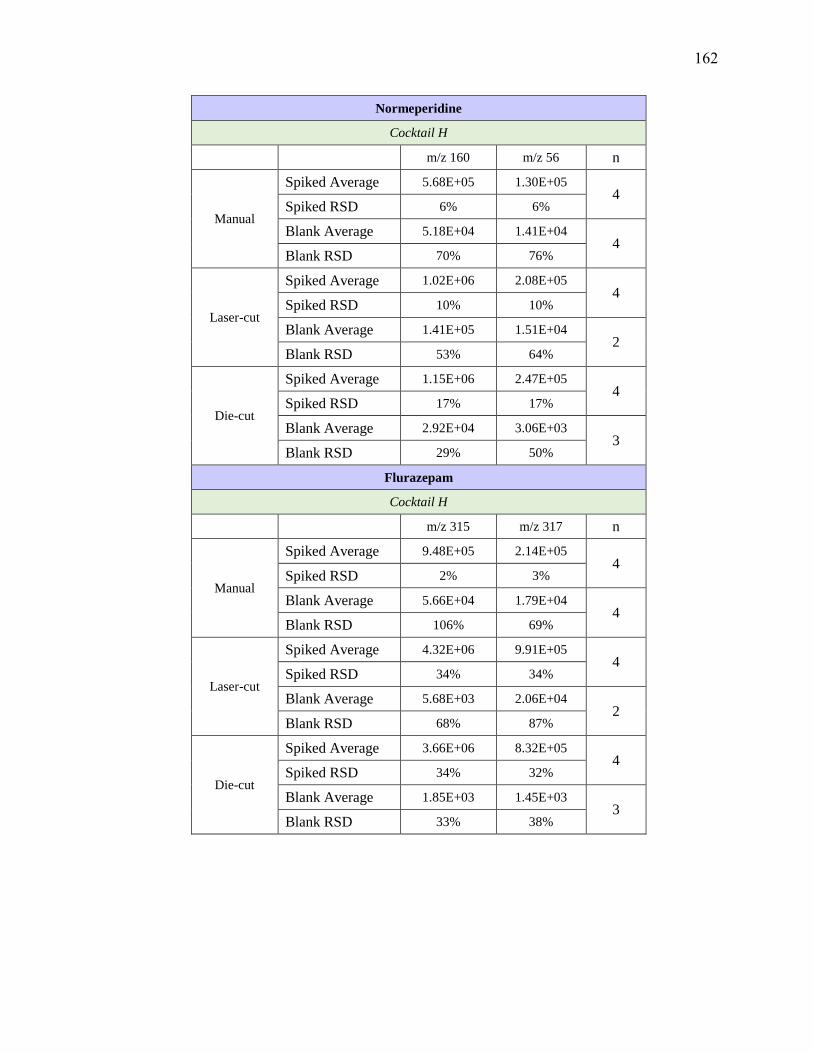
Normeperidine
Cocktail H
m/z 160 m/z 56 n
Manual
Spiked Average 5.68E+05 1.30E+05 4
Spiked RSD 6% 6%
Blank Average 5.18E+04 1.41E+04 4
Blank RSD 70% 76%
Laser-cut
Spiked Average 1.02E+06 2.08E+05 4
Spiked RSD 10% 10%
Blank Average 1.41E+05 1.51E+04 2
Blank RSD 53% 64%
Die-cut
Spiked Average 1.15E+06 2.47E+05 4
Spiked RSD 17% 17%
Blank Average 2.92E+04 3.06E+03 3
Blank RSD 29% 50%
Flurazepam
Cocktail H
m/z 315 m/z 317 n
Manual
Spiked Average 9.48E+05 2.14E+05 4
Spiked RSD 2% 3%
Blank Average 5.66E+04 1.79E+04 4
Blank RSD 106% 69%
Laser-cut
Spiked Average 4.32E+06 9.91E+05 4
Spiked RSD 34% 34%
Blank Average 5.68E+03 2.06E+04 2
Blank RSD 68% 87%
Die-cut
Spiked Average 3.66E+06 8.32E+05 4
Spiked RSD 34% 32%
Blank Average 1.85E+03 1.45E+03 3
Blank RSD 33% 38%
162
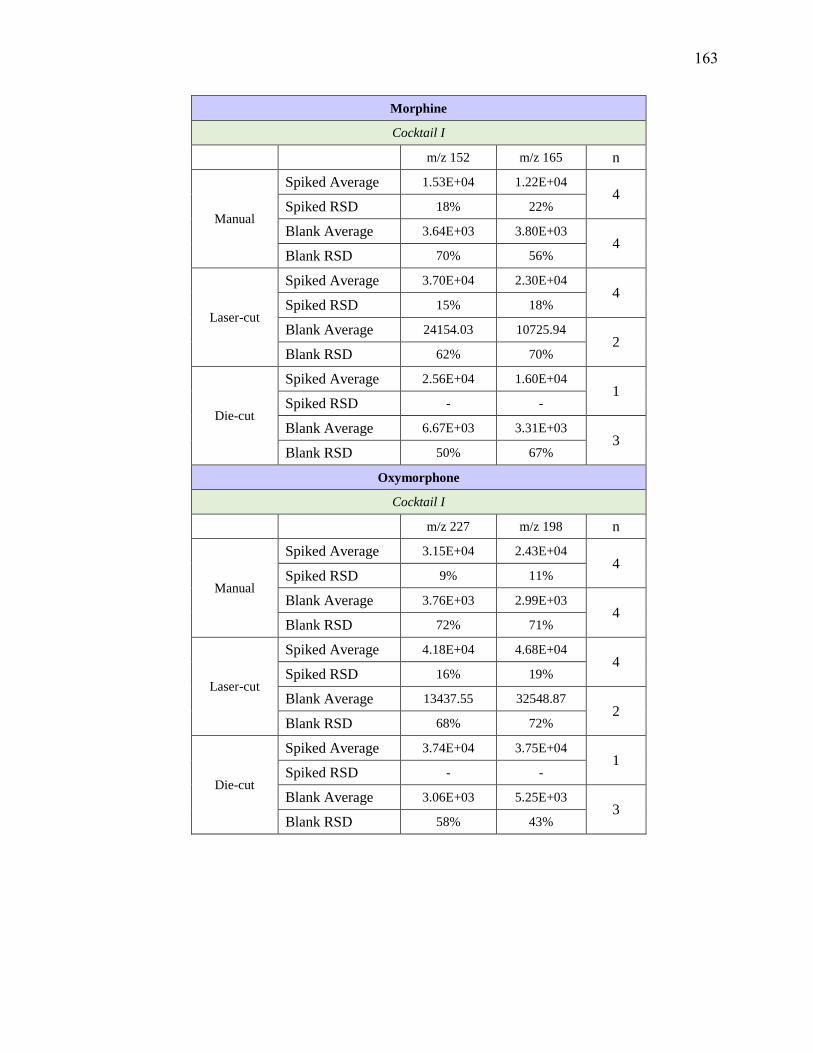
Morphine
Cocktail I
m/z 152 m/z 165 n
Manual
Spiked Average 1.53E+04 1.22E+04 4
Spiked RSD 18% 22%
Blank Average 3.64E+03 3.80E+03 4
Blank RSD 70% 56%
Laser-cut
Spiked Average 3.70E+04 2.30E+04 4
Spiked RSD 15% 18%
Blank Average 24154.03 10725.94 2
Blank RSD 62% 70%
Die-cut
Spiked Average 2.56E+04 1.60E+04 1
Spiked RSD - -
Blank Average 6.67E+03 3.31E+03 3
Blank RSD 50% 67%
Oxymorphone
Cocktail I
m/z 227 m/z 198 n
Manual
Spiked Average 3.15E+04 2.43E+04 4
Spiked RSD 9% 11%
Blank Average 3.76E+03 2.99E+03 4
Blank RSD 72% 71%
Laser-cut
Spiked Average 4.18E+04 4.68E+04 4
Spiked RSD 16% 19%
Blank Average 13437.55 32548.87 2
Blank RSD 68% 72%
Die-cut
Spiked Average 3.74E+04 3.75E+04 1
Spiked RSD - -
Blank Average 3.06E+03 5.25E+03 3
Blank RSD 58% 43%
163

Zaleplon
Cocktail I
m/z 236 m/z 264 n
Manual
Spiked Average 5.80E+04 5.11E+04 4
Spiked RSD 41% 41%
Blank Average 3.72E+03 3.41E+03 4
Blank RSD 91% 66%
Laser-cut
Spiked Average 5.74E+04 3.91E+04 4
Spiked RSD 31% 25%
Blank Average 40471.3 13342.55 2
Blank RSD 64% 60%
Die-cut
Spiked Average 6.25E+04 6.21E+04 1
Spiked RSD - -
Blank Average 3.55E+03 7.67E+03 3
Blank RSD 64% 88%
Methadone
Cocktail I
m/z 265 m/z 105 n
Manual
Spiked Average 1.34E+06 4.41E+05 4
Spiked RSD 11% 10%
Blank Average 3.69E+04 1.89E+04 4
Blank RSD 148% 111%
Laser-cut
Spiked Average 3.88E+06 1.26E+06 4
Spiked RSD 32% 33%
Blank Average 15483.3 21467.25 2
Blank RSD 51% 74%
Die-cut
Spiked Average 1.11E+07 3.66E+06 1
Spiked RSD - -
Blank Average 6.30E+03 1.20E+04 3
Blank RSD 64% 50%
164

Clonazepam
Cocktail I
m/z 270 m/z 214 n
Manual
Spiked Average 6.41E+04 1.88E+04 4
Spiked RSD 50% 51%
Blank Average 1.17E+04 1.90E+03 4
Blank RSD 52% 70%
Laser-cut
Spiked Average 5.63E+04 2.50E+04 4
Spiked RSD 29% 31%
Blank Average 71418.77 29487.67 2
Blank RSD 70% 74%
Die-cut
Spiked Average 5.33E+04 1.27E+04 1
Spiked RSD - -
Blank Average 2.09E+04 3.07E+03 3
Blank RSD 48% 44%
Fluvoxamine
Cocktail I
m/z 71 m/z 200 n
Manual
Spiked Average 1.02E+05 2.55E+04 4
Spiked RSD 4% 9%
Blank Average 1.00E+04 6.20E+03 4
Blank RSD 63% 44%
Laser-cut
Spiked Average 1.76E+05 4.06E+04 4
Spiked RSD 9% 8%
Blank Average 16634.52 10218.4 2
Blank RSD 86% 6%
Die-cut
Spiked Average 3.50E+05 8.35E+04 1
Spiked RSD - -
Blank Average 9.53E+03 6.28E+03 3
Blank RSD 42% 24%
165
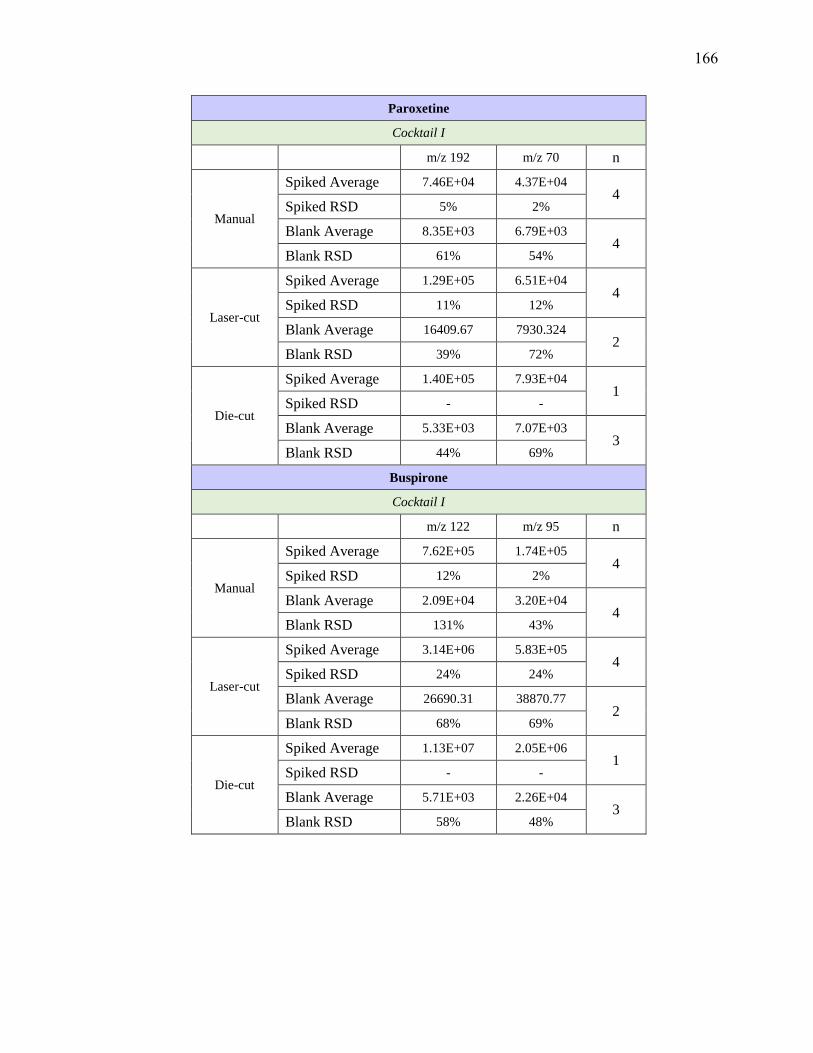
Paroxetine
Cocktail I
m/z 192 m/z 70 n
Manual
Spiked Average 7.46E+04 4.37E+04 4
Spiked RSD 5% 2%
Blank Average 8.35E+03 6.79E+03 4
Blank RSD 61% 54%
Laser-cut
Spiked Average 1.29E+05 6.51E+04 4
Spiked RSD 11% 12%
Blank Average 16409.67 7930.324 2
Blank RSD 39% 72%
Die-cut
Spiked Average 1.40E+05 7.93E+04 1
Spiked RSD - -
Blank Average 5.33E+03 7.07E+03 3
Blank RSD 44% 69%
Buspirone
Cocktail I
m/z 122 m/z 95 n
Manual
Spiked Average 7.62E+05 1.74E+05 4
Spiked RSD 12% 2%
Blank Average 2.09E+04 3.20E+04 4
Blank RSD 131% 43%
Laser-cut
Spiked Average 3.14E+06 5.83E+05 4
Spiked RSD 24% 24%
Blank Average 26690.31 38870.77 2
Blank RSD 68% 69%
Die-cut
Spiked Average 1.13E+07 2.05E+06 1
Spiked RSD - -
Blank Average 5.71E+03 2.26E+04 3
Blank RSD 58% 48%
166
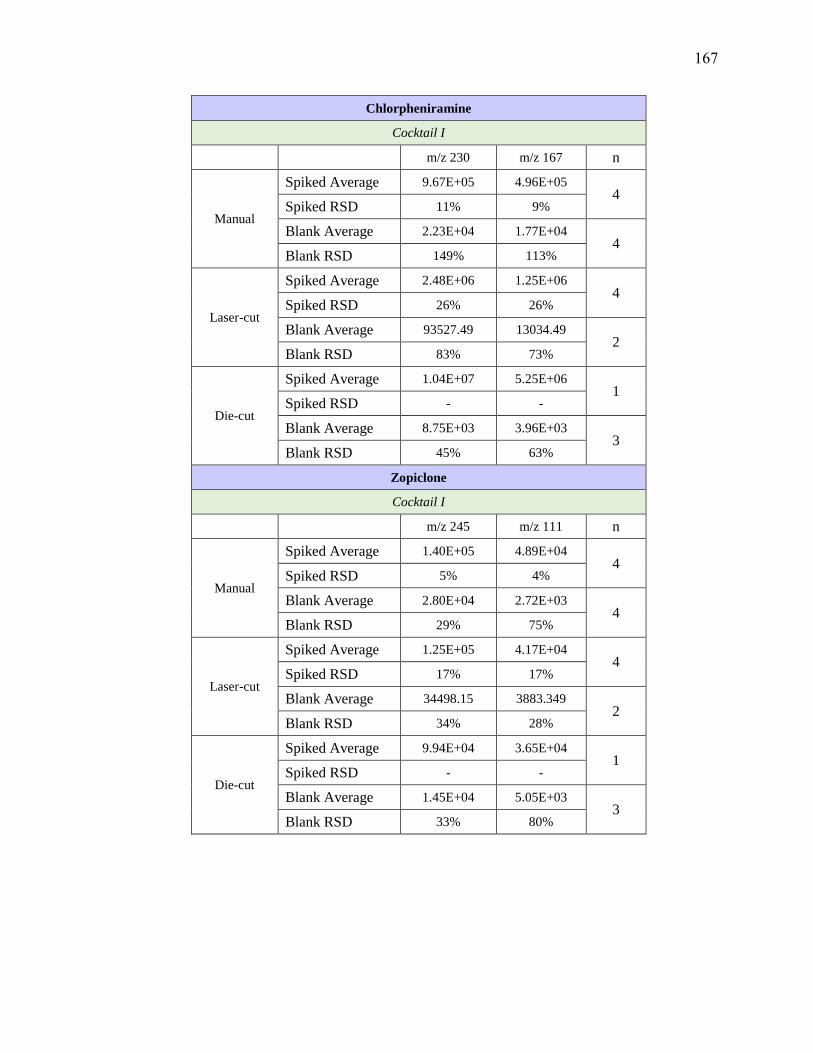
Chlorpheniramine
Cocktail I
m/z 230 m/z 167 n
Manual
Spiked Average 9.67E+05 4.96E+05 4
Spiked RSD 11% 9%
Blank Average 2.23E+04 1.77E+04 4
Blank RSD 149% 113%
Laser-cut
Spiked Average 2.48E+06 1.25E+06 4
Spiked RSD 26% 26%
Blank Average 93527.49 13034.49 2
Blank RSD 83% 73%
Die-cut
Spiked Average 1.04E+07 5.25E+06 1
Spiked RSD - -
Blank Average 8.75E+03 3.96E+03 3
Blank RSD 45% 63%
Zopiclone
Cocktail I
m/z 245 m/z 111 n
Manual
Spiked Average 1.40E+05 4.89E+04 4
Spiked RSD 5% 4%
Blank Average 2.80E+04 2.72E+03 4
Blank RSD 29% 75%
Laser-cut
Spiked Average 1.25E+05 4.17E+04 4
Spiked RSD 17% 17%
Blank Average 34498.15 3883.349 2
Blank RSD 34% 28%
Die-cut
Spiked Average 9.94E+04 3.65E+04 1
Spiked RSD - -
Blank Average 1.45E+04 5.05E+03 3
Blank RSD 33% 80%
167

Methylphenidate
Cocktail J
m/z 84 m/z 56 n
Manual
Spiked Average 9.00E+05 1.18E+05 4
Spiked RSD 7% 7%
Blank Average 7.69E+04 1.96E+04 4
Blank RSD 43% 36%
Laser-cut
Spiked Average 2.67E+06 3.60E+05 4
Spiked RSD 25% 20%
Blank Average 2.34E+04 7.49E+04 3
Blank RSD 40% 38%
Nordoxepin
Cocktail J
m/z 107 m/z 235 n
Manual
Spiked Average 1.06E+05 6.27E+04 4
Spiked RSD 4% 5%
Blank Average 1.27E+04 4.58E+03 4
Blank RSD 55% 72%
Laser-cut
Spiked Average 2.73E+05 1.53E+05 4
Spiked RSD 6% 6%
Blank Average 2.64E+04 4.20E+03 3
Blank RSD 50% 68%
Desipramine
Cocktail J
m/z 72 m/z 193 n
Manual
Spiked Average 1.54E+05 5.64E+04 4
Spiked RSD 5% 6%
Blank Average 8.80E+03 9.66E+03 4
Blank RSD 69% 32%
Laser-cut
Spiked Average 4.34E+05 1.16E+05 4
Spiked RSD 6% 5%
Blank Average 1.74E+03 2.35E+04 3
Blank RSD 59% 53%
168
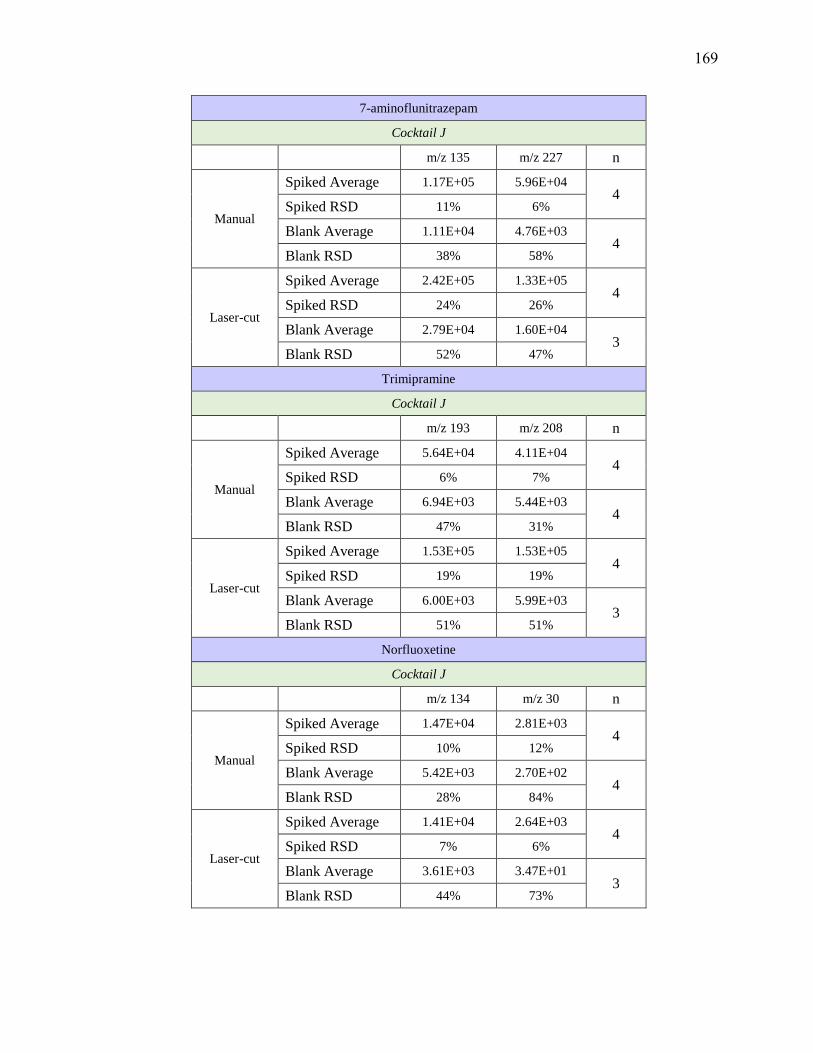
7-aminoflunitrazepam
Cocktail J
m/z 135 m/z 227 n
Manual
Spiked Average 1.17E+05 5.96E+04 4
Spiked RSD 11% 6%
Blank Average 1.11E+04 4.76E+03 4
Blank RSD 38% 58%
Laser-cut
Spiked Average 2.42E+05 1.33E+05 4
Spiked RSD 24% 26%
Blank Average 2.79E+04 1.60E+04 3
Blank RSD 52% 47%
Trimipramine
Cocktail J
m/z 193 m/z 208 n
Manual
Spiked Average 5.64E+04 4.11E+04 4
Spiked RSD 6% 7%
Blank Average 6.94E+03 5.44E+03 4
Blank RSD 47% 31%
Laser-cut
Spiked Average 1.53E+05 1.53E+05 4
Spiked RSD 19% 19%
Blank Average 6.00E+03 5.99E+03 3
Blank RSD 51% 51%
Norfluoxetine
Cocktail J
m/z 134 m/z 30 n
Manual
Spiked Average 1.47E+04 2.81E+03 4
Spiked RSD 10% 12%
Blank Average 5.42E+03 2.70E+02 4
Blank RSD 28% 84%
Laser-cut
Spiked Average 1.41E+04 2.64E+03 4
Spiked RSD 7% 6%
Blank Average 3.61E+03 3.47E+01 3
Blank RSD 44% 73%
169

Duloxetine
Cocktail J
m/z 44 m/z 154 n
Manual
Spiked Average 1.16E+04 1.11E+04 4
Spiked RSD 37% 31%
Blank Average 5.94E+03 5.66E+03 4
Blank RSD 66% 66%
Laser-cut
Spiked Average 1.70E+04 1.49E+04 4
Spiked RSD 9% 4%
Blank Average 1.21E+03 4.43E+03 3
Blank RSD 82% 46%
Benztropine
Cocktail J
m/z 167 m/z 165 n
Manual
Spiked Average 4.06E+05 1.82E+05 4
Spiked RSD 7% 8%
Blank Average 3.03E+04 1.44E+04 4
Blank RSD 38% 41%
Laser-cut
Spiked Average 1.97E+06 8.94E+05 4
Spiked RSD 18% 19%
Blank Average 1.01E+04 7.58E+03 3
Blank RSD 59% 64%
Fluoxetine
Cocktail J
m/z 44 m/z 148 n
Manual
Spiked Average 4.47E+04 7.32E+03 4
Spiked RSD 4% 7%
Blank Average 3.01E+03 1.26E+03 4
Blank RSD 70% 12%
Laser-cut
Spiked Average 1.03E+05 1.79E+04 4
Spiked RSD 4% 7%
Blank Average 4.71E+02 6.06E+03 3
Blank RSD 61% 49%
170

Flunitrazepam
Cocktail J
m/z 268 m/z 239 n
Manual
Spiked Average 8.77E+04 2.80E+04 4
Spiked RSD 14% 15%
Blank Average 2.56E+04 3.91E+03 4
Blank RSD 47% 56%
Laser-cut
Spiked Average 1.38E+05 3.16E+04 4
Spiked RSD 18% 22%
Blank Average 5.66E+04 6.22E+03 3
Blank RSD 56% 54%
Clomipramine
Cocktail J
m/z 227 m/z 242 n
Manual
Spiked Average 3.20E+04 2.05E+04 4
Spiked RSD 3% 5%
Blank Average 8.74E+03 4.26E+03 4
Blank RSD 33% 37%
Laser-cut
Spiked Average 1.11E+05 7.42E+04 4
Spiked RSD 11% 10%
Blank Average 1.09E+04 4.75E+03 3
Blank RSD 69% 57%
Triazolam
Cocktail J
m/z 308 m/z 239 n
Manual
Spiked Average 4.48E+04 3.81E+04 4
Spiked RSD 12% 12%
Blank Average 3.35E+03 7.35E+03 4
Blank RSD 85% 42%
Laser-cut
Spiked Average 1.83E+05 1.47E+05 4
Spiked RSD 27% 24%
Blank Average 5.43E+02 1.14E+04 3
Blank RSD 66% 60%
171
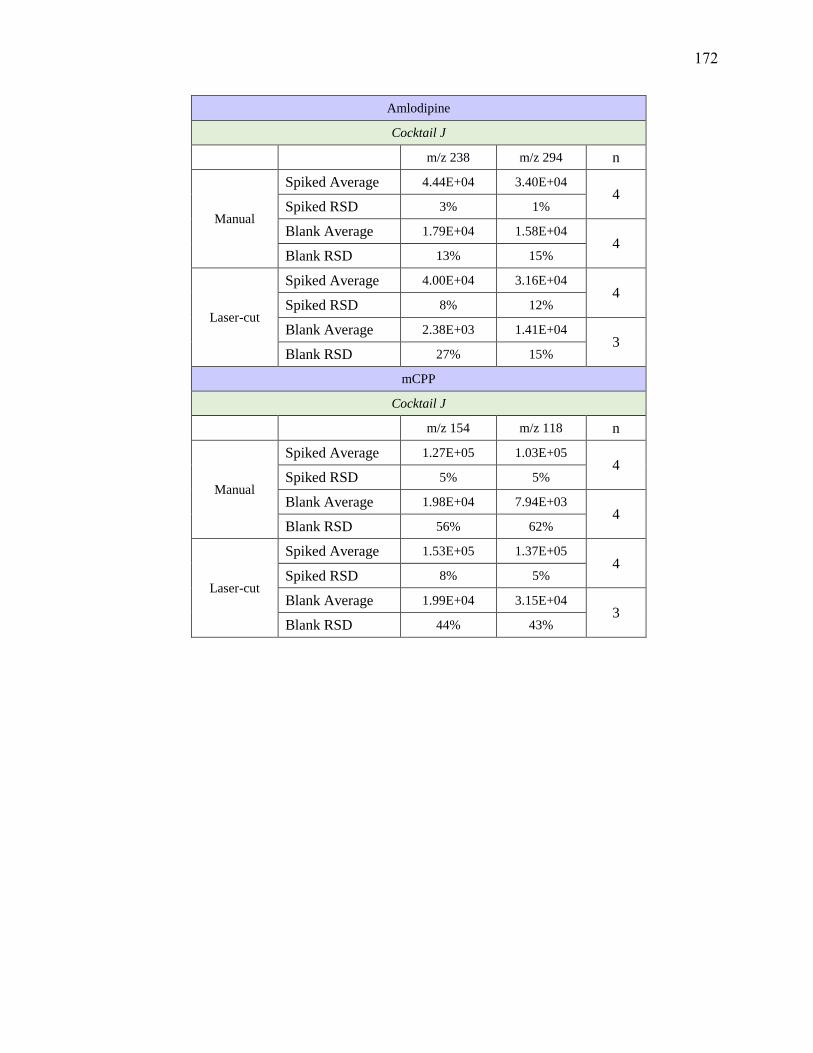
Amlodipine
Cocktail J
m/z 238 m/z 294 n
Manual
Spiked Average 4.44E+04 3.40E+04 4
Spiked RSD 3% 1%
Blank Average 1.79E+04 1.58E+04 4
Blank RSD 13% 15%
Laser-cut
Spiked Average 4.00E+04 3.16E+04 4
Spiked RSD 8% 12%
Blank Average 2.38E+03 1.41E+04 3
Blank RSD 27% 15%
mCPP
Cocktail J
m/z 154 m/z 118 n
Manual
Spiked Average 1.27E+05 1.03E+05 4
Spiked RSD 5% 5%
Blank Average 1.98E+04 7.94E+03 4
Blank RSD 56% 62%
Laser-cut
Spiked Average 1.53E+05 1.37E+05 4
Spiked RSD 8% 5%
Blank Average 1.99E+04 3.15E+04 3
Blank RSD 44% 43%
172
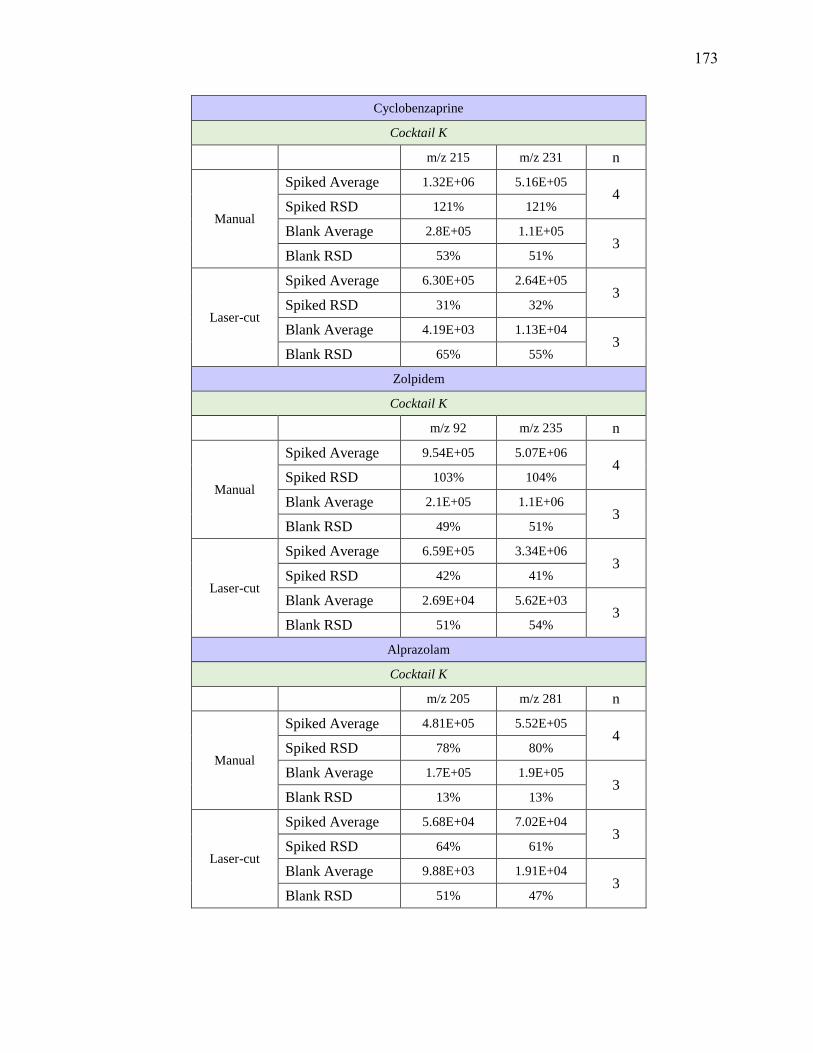
Cyclobenzaprine
Cocktail K
m/z 215 m/z 231 n
Manual
Spiked Average 1.32E+06 5.16E+05 4
Spiked RSD 121% 121%
Blank Average 2.8E+05 1.1E+05 3
Blank RSD 53% 51%
Laser-cut
Spiked Average 6.30E+05 2.64E+05 3
Spiked RSD 31% 32%
Blank Average 4.19E+03 1.13E+04 3
Blank RSD 65% 55%
Zolpidem
Cocktail K
m/z 92 m/z 235 n
Manual
Spiked Average 9.54E+05 5.07E+06 4
Spiked RSD 103% 104%
Blank Average 2.1E+05 1.1E+06 3
Blank RSD 49% 51%
Laser-cut
Spiked Average 6.59E+05 3.34E+06 3
Spiked RSD 42% 41%
Blank Average 2.69E+04 5.62E+03 3
Blank RSD 51% 54%
Alprazolam
Cocktail K
m/z 205 m/z 281 n
Manual
Spiked Average 4.81E+05 5.52E+05 4
Spiked RSD 78% 80%
Blank Average 1.7E+05 1.9E+05 3
Blank RSD 13% 13%
Laser-cut
Spiked Average 5.68E+04 7.02E+04 3
Spiked RSD 64% 61%
Blank Average 9.88E+03 1.91E+04 3
Blank RSD 51% 47%
173
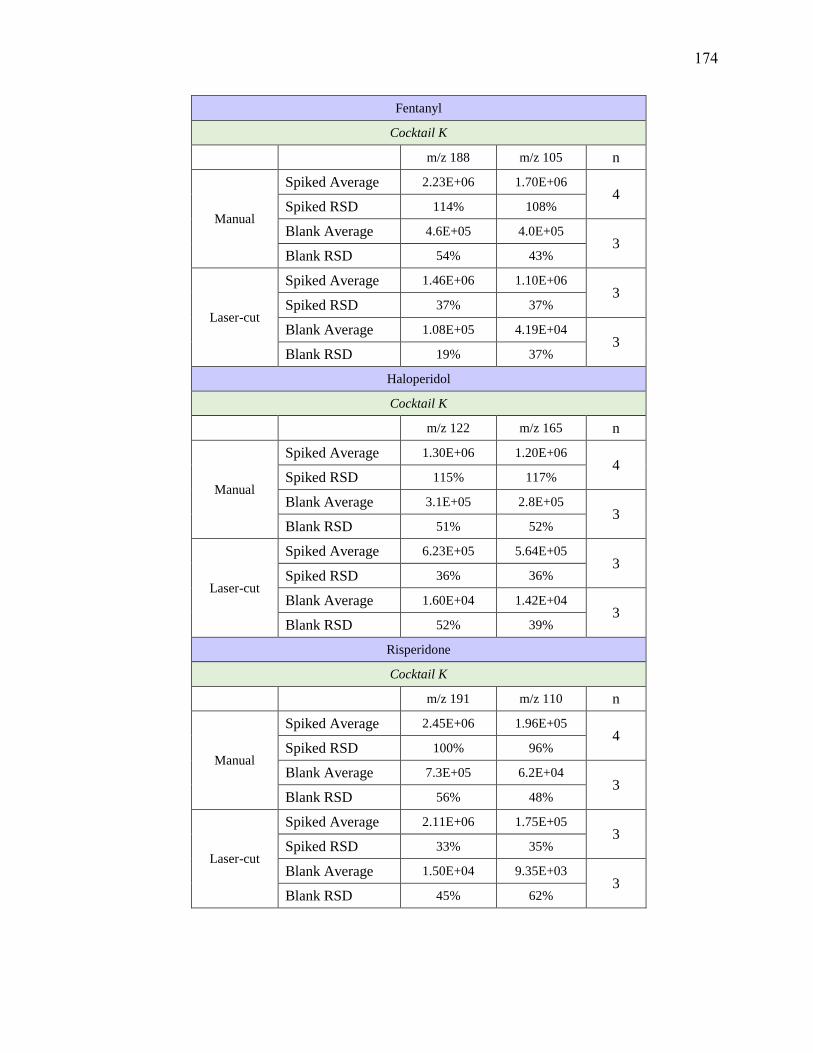
Fentanyl
Cocktail K
m/z 188 m/z 105 n
Manual
Spiked Average 2.23E+06 1.70E+06 4
Spiked RSD 114% 108%
Blank Average 4.6E+05 4.0E+05 3
Blank RSD 54% 43%
Laser-cut
Spiked Average 1.46E+06 1.10E+06 3
Spiked RSD 37% 37%
Blank Average 1.08E+05 4.19E+04 3
Blank RSD 19% 37%
Haloperidol
Cocktail K
m/z 122 m/z 165 n
Manual
Spiked Average 1.30E+06 1.20E+06 4
Spiked RSD 115% 117%
Blank Average 3.1E+05 2.8E+05 3
Blank RSD 51% 52%
Laser-cut
Spiked Average 6.23E+05 5.64E+05 3
Spiked RSD 36% 36%
Blank Average 1.60E+04 1.42E+04 3
Blank RSD 52% 39%
Risperidone
Cocktail K
m/z 191 m/z 110 n
Manual
Spiked Average 2.45E+06 1.96E+05 4
Spiked RSD 100% 96%
Blank Average 7.3E+05 6.2E+04 3
Blank RSD 56% 48%
Laser-cut
Spiked Average 2.11E+06 1.75E+05 3
Spiked RSD 33% 35%
Blank Average 1.50E+04 9.35E+03 3
Blank RSD 45% 62%
174
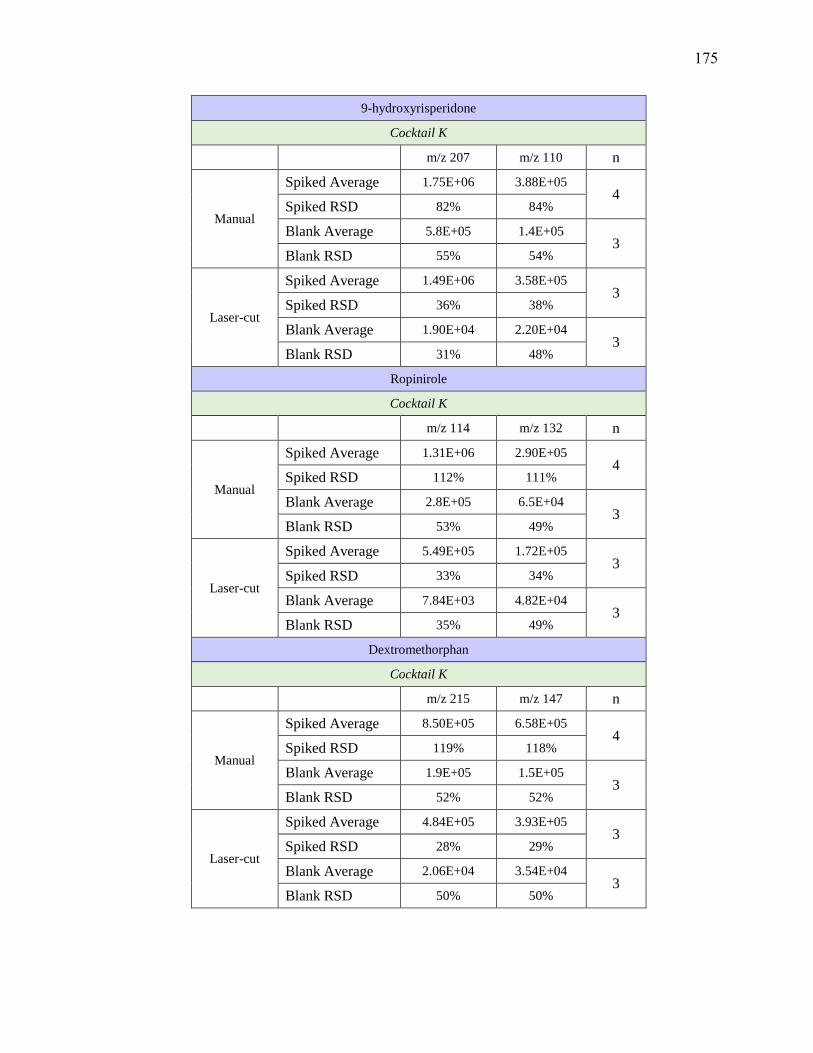
9-hydroxyrisperidone
Cocktail K
m/z 207 m/z 110 n
Manual
Spiked Average 1.75E+06 3.88E+05 4
Spiked RSD 82% 84%
Blank Average 5.8E+05 1.4E+05 3
Blank RSD 55% 54%
Laser-cut
Spiked Average 1.49E+06 3.58E+05 3
Spiked RSD 36% 38%
Blank Average 1.90E+04 2.20E+04 3
Blank RSD 31% 48%
Ropinirole
Cocktail K
m/z 114 m/z 132 n
Manual
Spiked Average 1.31E+06 2.90E+05 4
Spiked RSD 112% 111%
Blank Average 2.8E+05 6.5E+04 3
Blank RSD 53% 49%
Laser-cut
Spiked Average 5.49E+05 1.72E+05 3
Spiked RSD 33% 34%
Blank Average 7.84E+03 4.82E+04 3
Blank RSD 35% 49%
Dextromethorphan
Cocktail K
m/z 215 m/z 147 n
Manual
Spiked Average 8.50E+05 6.58E+05 4
Spiked RSD 119% 118%
Blank Average 1.9E+05 1.5E+05 3
Blank RSD 52% 52%
Laser-cut
Spiked Average 4.84E+05 3.93E+05 3
Spiked RSD 28% 29%
Blank Average 2.06E+04 3.54E+04 3
Blank RSD 50% 50%
175

Benzoylecgonine
Cocktail L
m/z 168 m/z 77 n
Manual
Spiked Average 4.30E+05 1.65E+05 4
Spiked RSD 42% 37%
Blank Average 4.05E+04 3.76E+04 4
Blank RSD 62% 92%
Laser-cut
Spiked Average 7.02E+05 3.58E+05 4
Spiked RSD 84% 75%
Blank Average 9.14E+03 8.12E+04 4
Blank RSD 85% 85%
Amitriptyline
Cocktail L
m/z 233 m/z 117 n
Manual
Spiked Average 2.30E+05 1.42E+05 4
Spiked RSD 17% 17%
Blank Average 1.07E+04 1.01E+04 4
Blank RSD 67% 77%
Laser-cut
Spiked Average 7.67E+05 4.51E+05 4
Spiked RSD 43% 41%
Blank Average 2.06E+04 9.81E+03 4
Blank RSD 53% 59%
Nortriptyline
Cocktail L
m/z 233 m/z 117 n
Manual
Spiked Average 1.83E+05 8.16E+04 4
Spiked RSD 16% 12%
Blank Average 5.82E+03 6.54E+03 4
Blank RSD 84% 66%
Laser-cut
Spiked Average 3.87E+05 1.70E+05 4
Spiked RSD 18% 14%
Blank Average 7.10E+03 7.29E+03 4
Blank RSD 21% 69%
176

Atenolol
Cocktail L
m/z 145 m/z 190 n
Manual
Spiked Average 9.32E+05 6.53E+05 4
Spiked RSD 18% 19%
Blank Average 1.47E+05 5.46E+04 4
Blank RSD 84% 103%
Laser-cut
Spiked Average 9.65E+05 7.43E+05 4
Spiked RSD 3% 4%
Blank Average 2.15E+04 4.91E+03 4
Blank RSD 66% 63%
Hydrocodone
Cocktail L
m/z 199 m/z 171 n
Manual
Spiked Average 1.87E+05 7.52E+04 4
Spiked RSD 18% 16%
Blank Average 9.96E+03 7.35E+03 4
Blank RSD 67% 70%
Laser-cut
Spiked Average 1.57E+05 8.85E+04 4
Spiked RSD 10% 36%
Blank Average 9.32E+03 1.68E+04 4
Blank RSD 89% 86%
Diazepam
Cocktail L
m/z 154 m/z 222 n
Manual
Spiked Average 2.53E+05 1.98E+05 4
Spiked RSD 26% 23%
Blank Average 1.40E+04 8.84E+03 4
Blank RSD 91% 105%
Laser-cut
Spiked Average 1.67E+05 1.35E+05 4
Spiked RSD 25% 27%
Blank Average 8.90E+03 4.00E+03 4
Blank RSD 83% 81%
177

Temazepam
Cocktail M
m/z 177 m/z 239 n
Manual
Spiked Average 5.10E+04 1.35E+04 4
Spiked RSD 14% 9%
Blank Average 2.44E+04 4.00E+03 4
Blank RSD 70% 56%
Laser-cut
Spiked Average 4.33E+04 2.05E+04 4
Spiked RSD 27% 30%
Blank Average 6.43E+03 5.90E+03 4
Blank RSD 93% 74%
Doxepine
Cocktail M
m/z 107 m/z 165 n
Manual
Spiked Average 2.08E+05 9.94E+04 4
Spiked RSD 17% 18%
Blank Average 1.76E+04 6.45E+03 4
Blank RSD 73% 79%
Laser-cut
Spiked Average 5.21E+05 2.65E+05 4
Spiked RSD 24% 24%
Blank Average 1.83E+04 9.39E+03 4
Blank RSD 51% 75%
Nordiazepam
Cocktail M
m/z 140 m/z 208 n
Manual
Spiked Average 2.05E+05 1.47E+05 4
Spiked RSD 25% 25%
Blank Average 4.64E+03 5.02E+03 4
Blank RSD 29% 46%
Laser-cut
Spiked Average 8.33E+04 6.05E+04 4
Spiked RSD 33% 33%
Blank Average 3.40E+03 3.71E+03 4
Blank RSD 99% 75%
178

Citalopram
Cocktail M
m/z 262 m/z 234 n
Manual
Spiked Average 3.01E+04 2.35E+04 4
Spiked RSD 17% 11%
Blank Average 1.83E+03 3.90E+03 4
Blank RSD 63% 58%
Laser-cut
Spiked Average 7.36E+04 4.99E+04 4
Spiked RSD 17% 16%
Blank Average 2.62E+03 4.18E+03 4
Blank RSD 73% 49%
Oxazepam
Cocktail M
m/z 241 m/z 77 n
Manual
Spiked Average 1.49E+05 1.33E+05 4
Spiked RSD 20% 31%
Blank Average 8.73E+04 9.94E+04 4
Blank RSD 65% 83%
Laser-cut
Spiked Average 1.24E+05 2.33E+05 4
Spiked RSD 30% 23%
Blank Average 5.67E+04 1.23E+05 4
Blank RSD 64% 46%
Hydromorphone
Cocktail M
m/z 185 m/z 157 n
Manual
Spiked Average 4.71E+04 3.63E+04 4
Spiked RSD 10% 11%
Blank Average 7.64E+03 8.64E+03 4
Blank RSD 42% 61%
Laser-cut
Spiked Average 7.12E+04 7.50E+04 4
Spiked RSD 16% 24%
Blank Average 1.53E+04 2.84E+04 4
Blank RSD 67% 66%
179

Codeine
Cocktail M
m/z 215 m/z 199 n
Manual
Spiked Average 4.74E+04 3.53E+04 4
Spiked RSD 14% 20%
Blank Average 4.67E+03 9.95E+03 4
Blank RSD 57% 67%
Laser-cut
Spiked Average 9.30E+04 4.25E+04 4
Spiked RSD 24% 21%
Blank Average 2.54E+04 9.31E+03 4
Blank RSD 76% 88%
Cocaine
Cocktail M
m/z 182 m/z 82 n
Manual
Spiked Average 2.40E+06 5.54E+05 4
Spiked RSD 18% 18%
Blank Average 5.27E+04 3.97E+04 4
Blank RSD 12% 81%
Laser-cut
Spiked Average 5.73E+06 1.26E+06 4
Spiked RSD 40% 40%
Blank Average 5.89E+04 2.55E+04 4
Blank RSD 183% 104%
180
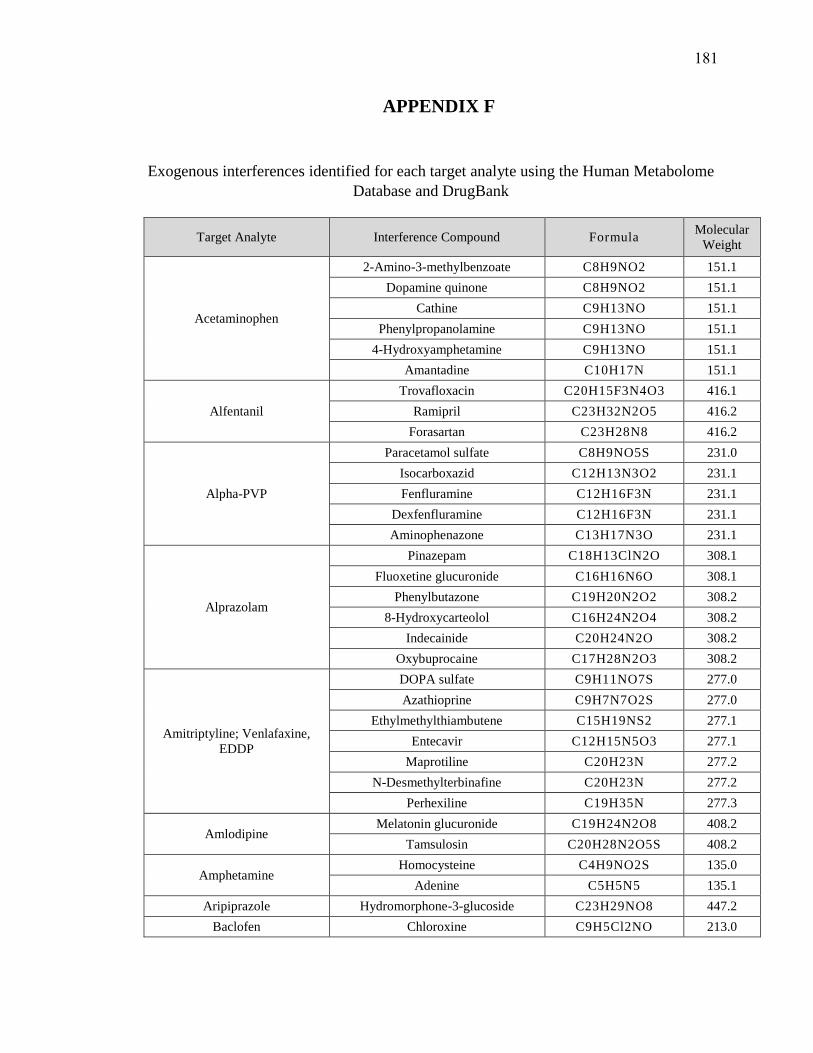
APPENDIX F
Exogenous interferences identified for each target analyte using the Human Metabolome
Database and DrugBank
Target Analyte Interference Compound Formula Molecular
Weight
Acetaminophen
2-Amino-3-methylbenzoate C8H9NO2 151.1
Dopamine quinone C8H9NO2 151.1
Cathine C9H13NO 151.1
Phenylpropanolamine C9H13NO 151.1
4-Hydroxyamphetamine C9H13NO 151.1
Amantadine C10H17N 151.1
Alfentanil
Trovafloxacin C20H15F3N4O3 416.1
Ramipril C23H32N2O5 416.2
Forasartan C23H28N8 416.2
Alpha-PVP
Paracetamol sulfate C8H9NO5S 231.0
Isocarboxazid C12H13N3O2 231.1
Fenfluramine C12H16F3N 231.1
Dexfenfluramine C12H16F3N 231.1
Aminophenazone C13H17N3O 231.1
Alprazolam
Pinazepam C18H13ClN2O 308.1
Fluoxetine glucuronide C16H16N6O 308.1
Phenylbutazone C19H20N2O2 308.2
8-Hydroxycarteolol C16H24N2O4 308.2
Indecainide C20H24N2O 308.2
Oxybuprocaine C17H28N2O3 308.2
Amitriptyline; Venlafaxine,
EDDP
DOPA sulfate C9H11NO7S 277.0
Azathioprine C9H7N7O2S 277.0
Ethylmethylthiambutene C15H19NS2 277.1
Entecavir C12H15N5O3 277.1
Maprotiline C20H23N 277.2
N-Desmethylterbinafine C20H23N 277.2
Perhexiline C19H35N 277.3
Amlodipine Melatonin glucuronide C19H24N2O8 408.2
Tamsulosin C20H28N2O5S 408.2
Amphetamine Homocysteine C4H9NO2S 135.0
Adenine C5H5N5 135.1
Aripiprazole Hydromorphone-3-glucoside C23H29NO8 447.2
Baclofen Chloroxine C9H5Cl2NO 213.0
181

Target Analyte Interference Compound Formula Molecular
Weight
Carmustine C5H9Cl2N3O2 213.0
Droxidopa C9H11NO5 213.1
Phenazopyridine C11H11N5 213.1
Guanadrel Sulfate C10H19N3O2 213.1
Benzoylecgonine
Quinethazone C10H12ClN3O3S 289.0
Chlophedianol C17H20ClNO 289.1
Clofedanol C17H20ClNO 289.1
Norcocaine C16H19NO4 289.1
Chloropyramine C16H20ClN3 289.1
Hydroxylated N-acetyl desmethyl
frovatriptan C15H19N3O3 289.1
Hyoscyamine C17H23NO3 289.2
Donepezil metabolite M4 C17H23NO3 289.2
Atropine C17H23NO3 289.2
Dyclonine C18H27NO2 289.2
Benztropine; Zolpidem
2-oxobrimonidine C11H10BrN5O 307.0
Nitazoxanide C12H9N3O5S 307.0
Histamine Phosphate C5H15N3O8P2 307.0
Glutathione C10H17N3O6S 307.1
Tolnaftate C19H17NOS 307.1
Alcaftadine C19H21N3O 307.2
Ibopamine C17H25NO4 307.2
Hydroxyterbinafine C21H25NO 307.2
Betaxolol C18H29NO3 307.2
Fingolimod C19H33NO2 307.3
Benzylpiperazine
Pemoline C9H8N2O2 176.1
4-Methylaminorex C10H12N2O 176.1
Cotinine C10H12N2O 176.1
Brompheniramine;
Chlorpromazine, Fluvoxamine
Clotiazepam C16H15ClN2OS 318.1
fluvoxamino acid C14H17F3N2O3 318.1
5-Hydroxyemedastine C17H26N4O2 318.2
Glycopyrrolate C19H28NO3 318.2
Tridihexethyl C21H36NO 318.3
Buprenorphine
N-Desmethylrosuvastatin C21H26FN3O6S 467.2
4-Hydroxytamoxifen sulfate C26H29NO5S 467.2
Tobramycin C18H37N5O9 467.3
Buprenorphine Tiropramide C28H41N3O3 467.3
Bupropion
9-Carboxymethoxymethylguanine C8H9N5O4 239.1
Salbutamol C13H21NO3 239.2
Moprolol C13H21NO3 239.2
182
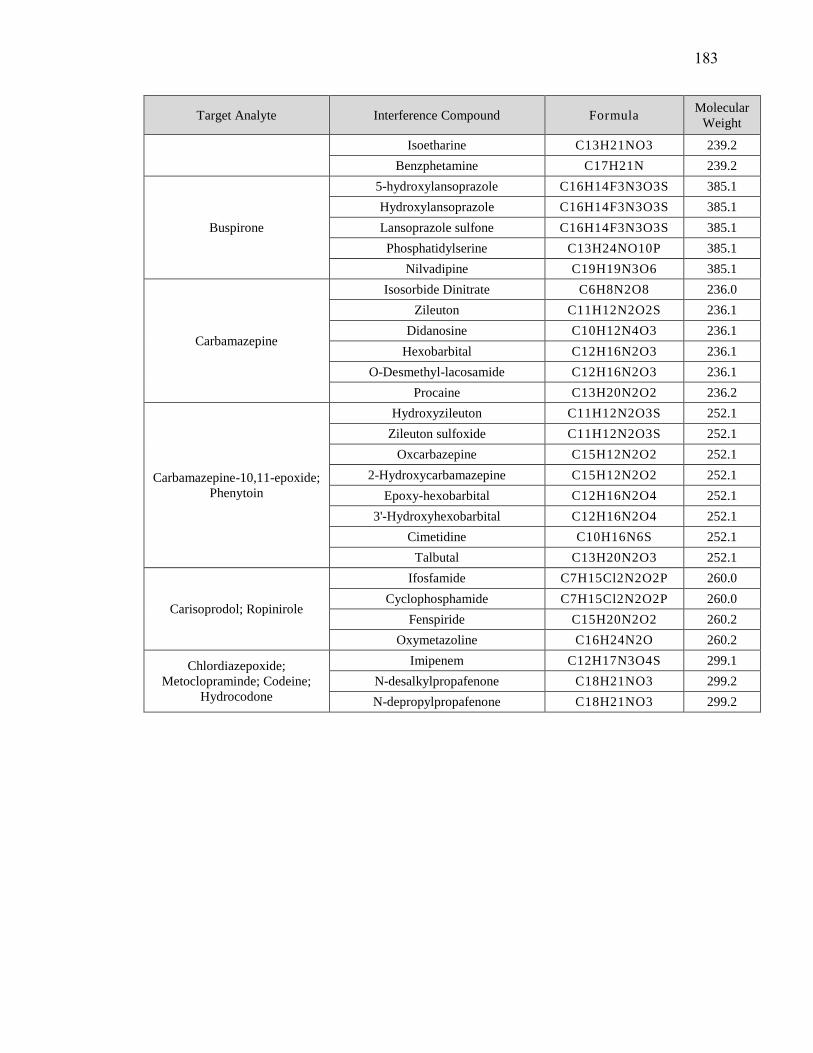
Target Analyte Interference Compound Formula Molecular
Weight
Isoetharine C13H21NO3 239.2
Benzphetamine C17H21N 239.2
Buspirone
5-hydroxylansoprazole C16H14F3N3O3S 385.1
Hydroxylansoprazole C16H14F3N3O3S 385.1
Lansoprazole sulfone C16H14F3N3O3S 385.1
Phosphatidylserine C13H24NO10P 385.1
Nilvadipine C19H19N3O6 385.1
Carbamazepine
Isosorbide Dinitrate C6H8N2O8 236.0
Zileuton C11H12N2O2S 236.1
Didanosine C10H12N4O3 236.1
Hexobarbital C12H16N2O3 236.1
O-Desmethyl-lacosamide C12H16N2O3 236.1
Procaine C13H20N2O2 236.2
Carbamazepine-10,11-epoxide;
Phenytoin
Hydroxyzileuton C11H12N2O3S 252.1
Zileuton sulfoxide C11H12N2O3S 252.1
Oxcarbazepine C15H12N2O2 252.1
2-Hydroxycarbamazepine C15H12N2O2 252.1
Epoxy-hexobarbital C12H16N2O4 252.1
3'-Hydroxyhexobarbital C12H16N2O4 252.1
Cimetidine C10H16N6S 252.1
Talbutal C13H20N2O3 252.1
Carisoprodol; Ropinirole
Ifosfamide C7H15Cl2N2O2P 260.0
Cyclophosphamide C7H15Cl2N2O2P 260.0
Fenspiride C15H20N2O2 260.2
Oxymetazoline C16H24N2O 260.2
Chlordiazepoxide;
Metoclopraminde; Codeine;
Hydrocodone
Imipenem C12H17N3O4S 299.1
N-desalkylpropafenone C18H21NO3 299.2
N-depropylpropafenone C18H21NO3 299.2
183
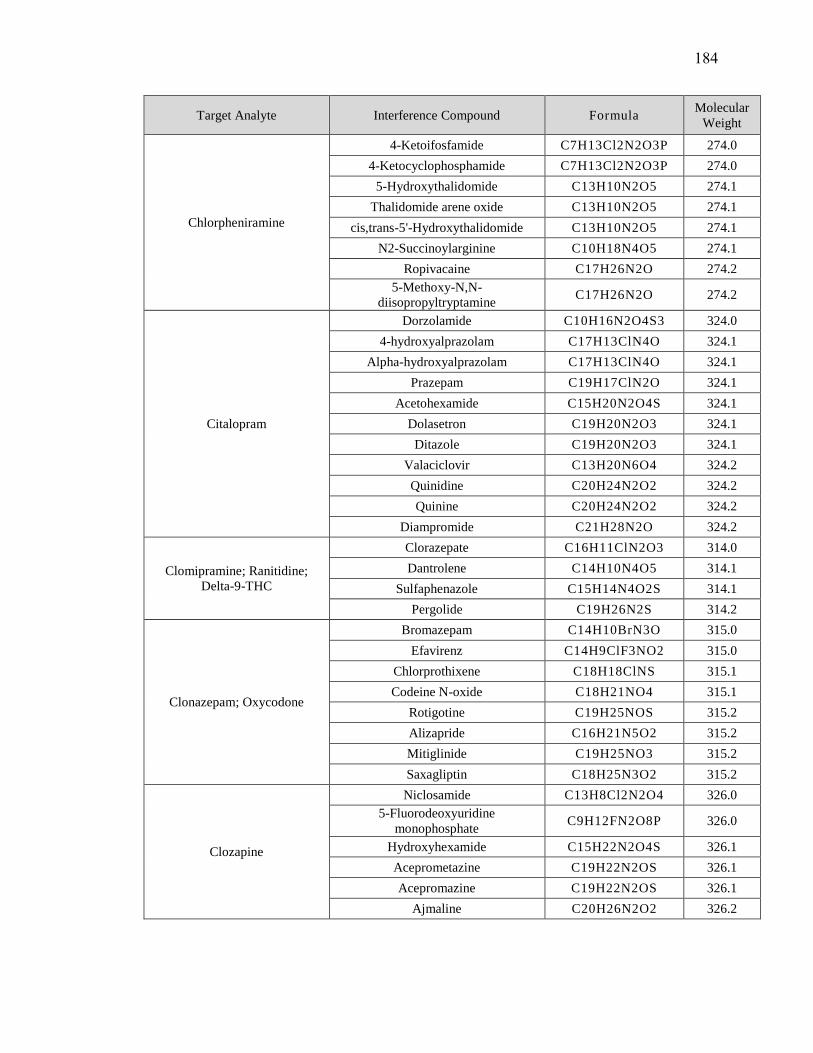
Target Analyte Interference Compound Formula Molecular
Weight
Chlorpheniramine
4-Ketoifosfamide C7H13Cl2N2O3P 274.0
4-Ketocyclophosphamide C7H13Cl2N2O3P 274.0
5-Hydroxythalidomide C13H10N2O5 274.1
Thalidomide arene oxide C13H10N2O5 274.1
cis,trans-5'-Hydroxythalidomide C13H10N2O5 274.1
N2-Succinoylarginine C10H18N4O5 274.1
Ropivacaine C17H26N2O 274.2
5-Methoxy-N,N-
diisopropyltryptamine C17H26N2O 274.2
Citalopram
Dorzolamide C10H16N2O4S3 324.0
4-hydroxyalprazolam C17H13ClN4O 324.1
Alpha-hydroxyalprazolam C17H13ClN4O 324.1
Prazepam C19H17ClN2O 324.1
Acetohexamide C15H20N2O4S 324.1
Dolasetron C19H20N2O3 324.1
Ditazole C19H20N2O3 324.1
Valaciclovir C13H20N6O4 324.2
Quinidine C20H24N2O2 324.2
Quinine C20H24N2O2 324.2
Diampromide C21H28N2O 324.2
Clomipramine; Ranitidine;
Delta-9-THC
Clorazepate C16H11ClN2O3 314.0
Dantrolene C14H10N4O5 314.1
Sulfaphenazole C15H14N4O2S 314.1
Pergolide C19H26N2S 314.2
Clonazepam; Oxycodone
Bromazepam C14H10BrN3O 315.0
Efavirenz C14H9ClF3NO2 315.0
Chlorprothixene C18H18ClNS 315.1
Codeine N-oxide C18H21NO4 315.1
Rotigotine C19H25NOS 315.2
Alizapride C16H21N5O2 315.2
Mitiglinide C19H25NO3 315.2
Saxagliptin C18H25N3O2 315.2
Clozapine
Niclosamide C13H8Cl2N2O4 326.0
5-Fluorodeoxyuridine
monophosphateC9H12FN2O8P 326.0
Hydroxyhexamide C15H22N2O4S 326.1
Aceprometazine C19H22N2OS 326.1
Acepromazine C19H22N2OS 326.1
Ajmaline C20H26N2O2 326.2
184
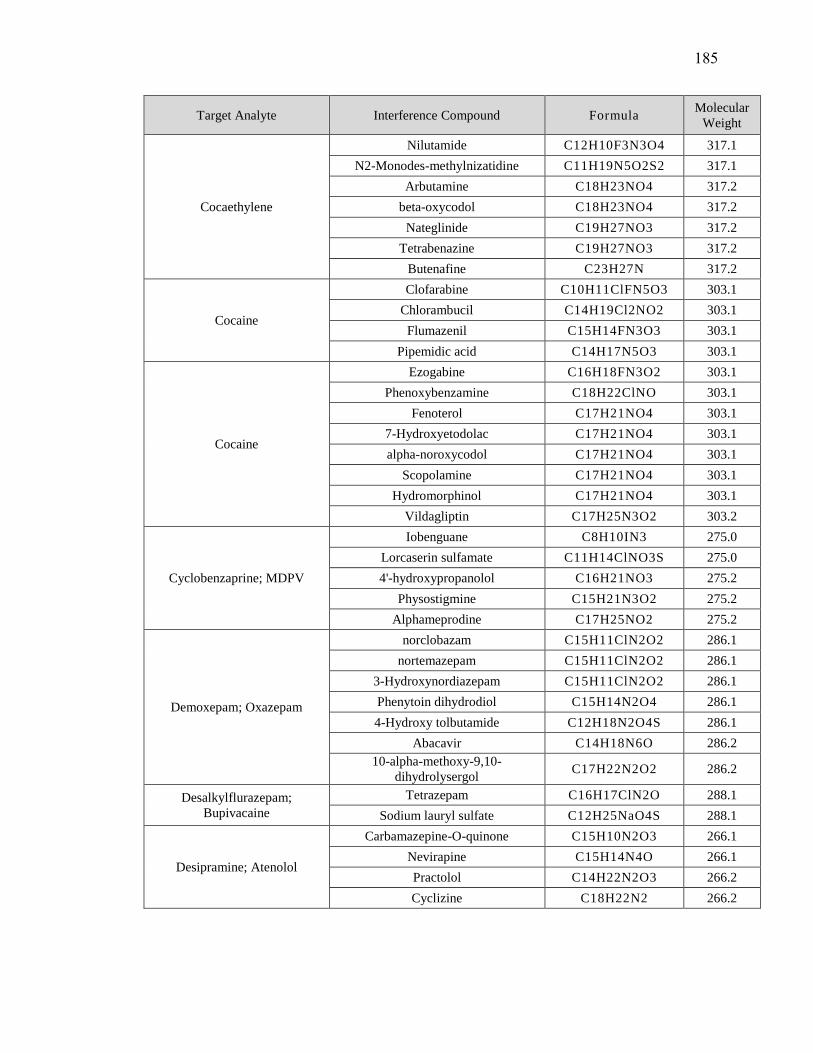
Target Analyte Interference Compound Formula Molecular
Weight
Cocaethylene
Nilutamide C12H10F3N3O4 317.1
N2-Monodes-methylnizatidine C11H19N5O2S2 317.1
Arbutamine C18H23NO4 317.2
beta-oxycodol C18H23NO4 317.2
Nateglinide C19H27NO3 317.2
Tetrabenazine C19H27NO3 317.2
Butenafine C23H27N 317.2
Cocaine
Clofarabine C10H11ClFN5O3 303.1
Chlorambucil C14H19Cl2NO2 303.1
Flumazenil C15H14FN3O3 303.1
Pipemidic acid C14H17N5O3 303.1
Cocaine
Ezogabine C16H18FN3O2 303.1
Phenoxybenzamine C18H22ClNO 303.1
Fenoterol C17H21NO4 303.1
7-Hydroxyetodolac C17H21NO4 303.1
alpha-noroxycodol C17H21NO4 303.1
Scopolamine C17H21NO4 303.1
Hydromorphinol C17H21NO4 303.1
Vildagliptin C17H25N3O2 303.2
Cyclobenzaprine; MDPV
Iobenguane C8H10IN3 275.0
Lorcaserin sulfamate C11H14ClNO3S 275.0
4'-hydroxypropanolol C16H21NO3 275.2
Physostigmine C15H21N3O2 275.2
Alphameprodine C17H25NO2 275.2
Demoxepam; Oxazepam
norclobazam C15H11ClN2O2 286.1
nortemazepam C15H11ClN2O2 286.1
3-Hydroxynordiazepam C15H11ClN2O2 286.1
Phenytoin dihydrodiol C15H14N2O4 286.1
4-Hydroxy tolbutamide C12H18N2O4S 286.1
Abacavir C14H18N6O 286.2
10-alpha-methoxy-9,10-
dihydrolysergol C17H22N2O2 286.2
Desalkylflurazepam;
Bupivacaine
Tetrazepam C16H17ClN2O 288.1
Sodium lauryl sulfate C12H25NaO4S 288.1
Desipramine; Atenolol
Carbamazepine-O-quinone C15H10N2O3 266.1
Nevirapine C15H14N4O 266.1
Practolol C14H22N2O3 266.2
Cyclizine C18H22N2 266.2
185
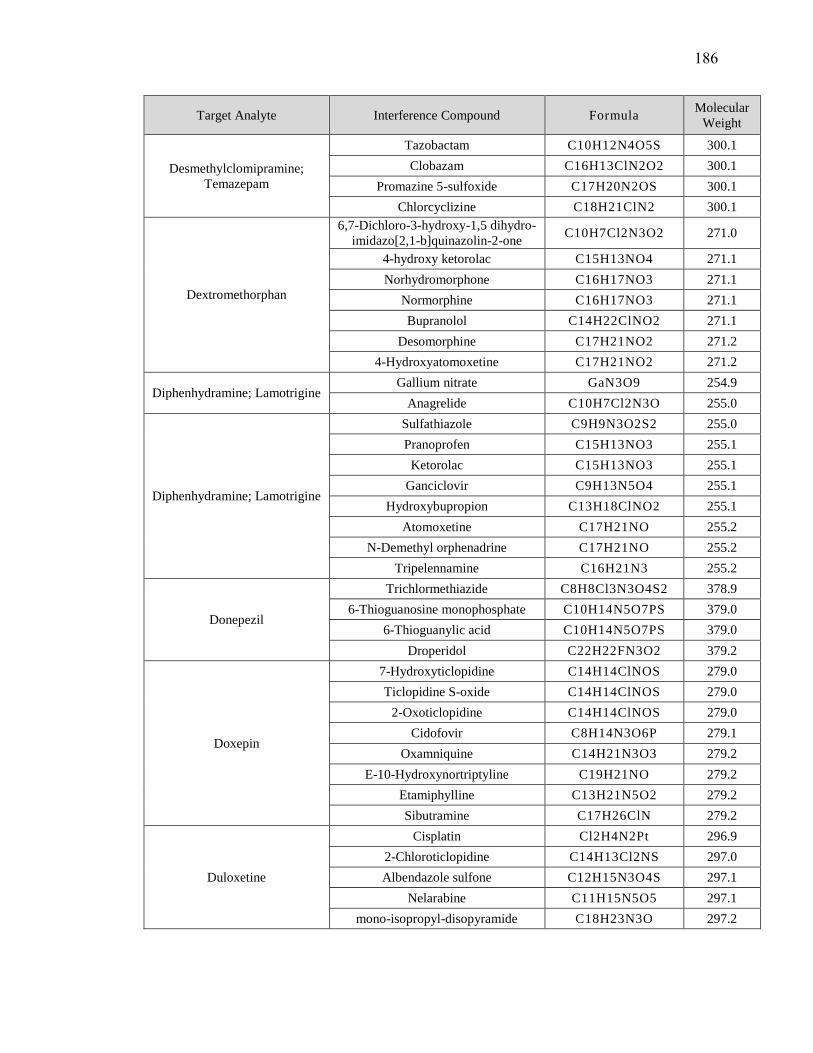
Target Analyte Interference Compound Formula Molecular
Weight
Desmethylclomipramine;
Temazepam
Tazobactam C10H12N4O5S 300.1
Clobazam C16H13ClN2O2 300.1
Promazine 5-sulfoxide C17H20N2OS 300.1
Chlorcyclizine C18H21ClN2 300.1
Dextromethorphan
6,7-Dichloro-3-hydroxy-1,5 dihydro-
imidazo[2,1-b]quinazolin-2-one C10H7Cl2N3O2 271.0
4-hydroxy ketorolac C15H13NO4 271.1
Norhydromorphone C16H17NO3 271.1
Normorphine C16H17NO3 271.1
Bupranolol C14H22ClNO2 271.1
Desomorphine C17H21NO2 271.2
4-Hydroxyatomoxetine C17H21NO2 271.2
Diphenhydramine; Lamotrigine Gallium nitrate GaN3O9 254.9
Anagrelide C10H7Cl2N3O 255.0
Diphenhydramine; Lamotrigine
Sulfathiazole C9H9N3O2S2 255.0
Pranoprofen C15H13NO3 255.1
Ketorolac C15H13NO3 255.1
Ganciclovir C9H13N5O4 255.1
Hydroxybupropion C13H18ClNO2 255.1
Atomoxetine C17H21NO 255.2
N-Demethyl orphenadrine C17H21NO 255.2
Tripelennamine C16H21N3 255.2
Donepezil
Trichlormethiazide C8H8Cl3N3O4S2 378.9
6-Thioguanosine monophosphate C10H14N5O7PS 379.0
6-Thioguanylic acid C10H14N5O7PS 379.0
Droperidol C22H22FN3O2 379.2
Doxepin
7-Hydroxyticlopidine C14H14ClNOS 279.0
Ticlopidine S-oxide C14H14ClNOS 279.0
2-Oxoticlopidine C14H14ClNOS 279.0
Cidofovir C8H14N3O6P 279.1
Oxamniquine C14H21N3O3 279.2
E-10-Hydroxynortriptyline C19H21NO 279.2
Etamiphylline C13H21N5O2 279.2
Sibutramine C17H26ClN 279.2
Duloxetine
Cisplatin Cl2H4N2Pt 296.9
2-Chloroticlopidine C14H13Cl2NS 297.0
Albendazole sulfone C12H15N3O4S 297.1
Nelarabine C11H15N5O5 297.1
mono-isopropyl-disopyramide C18H23N3O 297.2
186
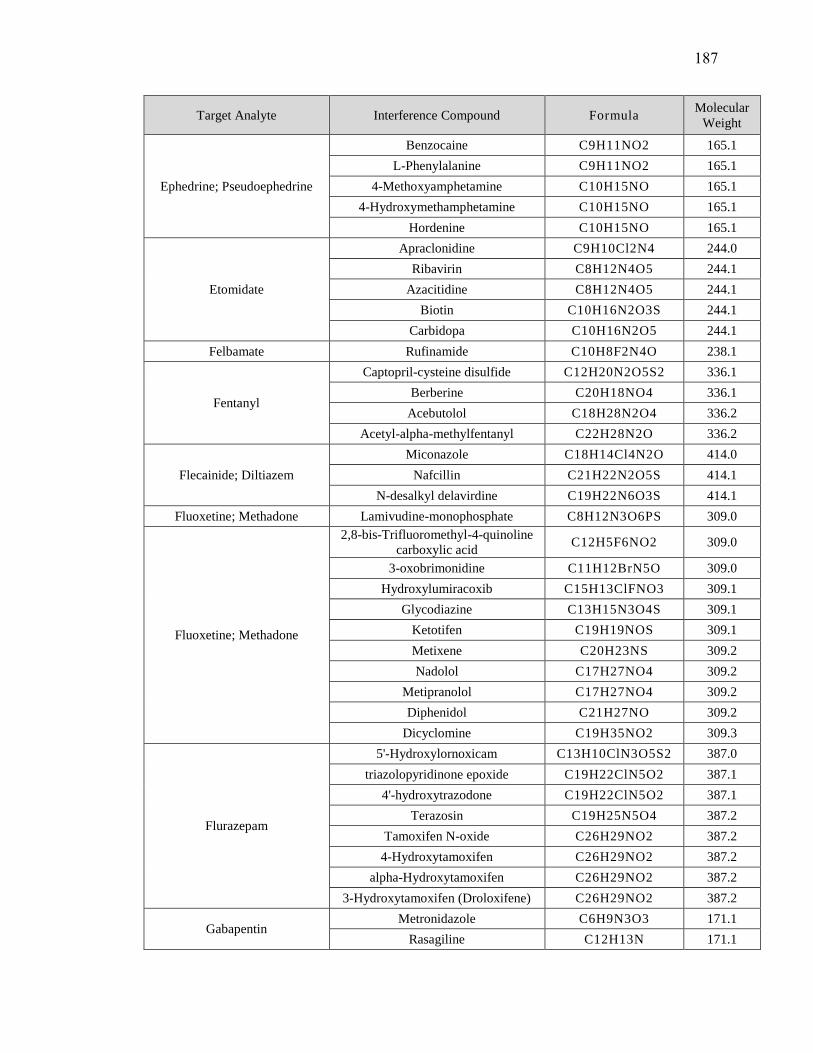
Target Analyte Interference Compound Formula Molecular
Weight
Ephedrine; Pseudoephedrine
Benzocaine C9H11NO2 165.1
L-Phenylalanine C9H11NO2 165.1
4-Methoxyamphetamine C10H15NO 165.1
4-Hydroxymethamphetamine C10H15NO 165.1
Hordenine C10H15NO 165.1
Etomidate
Apraclonidine C9H10Cl2N4 244.0
Ribavirin C8H12N4O5 244.1
Azacitidine C8H12N4O5 244.1
Biotin C10H16N2O3S 244.1
Carbidopa C10H16N2O5 244.1
Felbamate Rufinamide C10H8F2N4O 238.1
Fentanyl
Captopril-cysteine disulfide C12H20N2O5S2 336.1
Berberine C20H18NO4 336.1
Acebutolol C18H28N2O4 336.2
Acetyl-alpha-methylfentanyl C22H28N2O 336.2
Flecainide; Diltiazem
Miconazole C18H14Cl4N2O 414.0
Nafcillin C21H22N2O5S 414.1
N-desalkyl delavirdine C19H22N6O3S 414.1
Fluoxetine; Methadone Lamivudine-monophosphate C8H12N3O6PS 309.0
Fluoxetine; Methadone
2,8-bis-Trifluoromethyl-4-quinoline
carboxylic acid C12H5F6NO2 309.0
3-oxobrimonidine C11H12BrN5O 309.0
Hydroxylumiracoxib C15H13ClFNO3 309.1
Glycodiazine C13H15N3O4S 309.1
Ketotifen C19H19NOS 309.1
Metixene C20H23NS 309.2
Nadolol C17H27NO4 309.2
Metipranolol C17H27NO4 309.2
Diphenidol C21H27NO 309.2
Dicyclomine C19H35NO2 309.3
Flurazepam
5'-Hydroxylornoxicam C13H10ClN3O5S2 387.0
triazolopyridinone epoxide C19H22ClN5O2 387.1
4'-hydroxytrazodone C19H22ClN5O2 387.1
Terazosin C19H25N5O4 387.2
Tamoxifen N-oxide C26H29NO2 387.2
4-Hydroxytamoxifen C26H29NO2 387.2
alpha-Hydroxytamoxifen C26H29NO2 387.2
3-Hydroxytamoxifen (Droloxifene) C26H29NO2 387.2
Gabapentin Metronidazole C6H9N3O3 171.1
Rasagiline C12H13N 171.1
187

Target Analyte Interference Compound Formula Molecular
Weight
Haloperidol
Azidocillin C16H17N5O4S 375.1
Tiagabine C20H25NO2S2 375.1
Gatifloxacin C19H22FN3O4 375.2
Benzylmorphine C24H25NO3 375.2
Hydroxychloroquine Almotriptan C17H25N3O2S 335.2
Naratriptan C17H25N3O2S 335.2
Hydroxyzine
Bromhexine C14H20Br2N2 374.0
Etoricoxib 1'-N'-oxide C18H15ClN2O3S 374.0
6-Hydroxymethyletoricoxib C18H15ClN2O3S 374.0
N-Desmethylzopiclone C16H15ClN6O3 374.1
omega-hydroxyfinasteride C22H34N2O3 374.3
Ketamine 2-Amino-5-benzoylbenzimidazole C14H11N3O 237.1
Labetalol
7-hydroxyolanzapine C17H20N4OS 328.1
2-hydroxymethylolanzapine C17H20N4OS 328.1
Tiapride C15H24N2O4S 328.1
Labetalol
Methotrimeprazine C19H24N2OS 328.2
7-hydroxygranisetron C18H24N4O2 328.2
Stanozolol C21H32N2O 328.3
Levetiracetam Propylthiouracil C7H10N2OS 170.1
Lidocaine
p-Chlorobenzene sulfonyl urea C7H7ClN2O3S 234.0
4,4'-methanol-bisbenzonitrile C15H10N2O 234.1
4'-hydroxymephenytoin C12H14N2O3 234.1
S-4-Hydroxymephenytoin C12H14N2O3 234.1
Epirizole C11H14N4O2 234.1
Lorazepam Enoxacin C15H17FN4O3 320.1
mCPP
3,7-Dimethyluric acid C7H8N4O3 196.1
1,9-Dimethyluric acid C7H8N4O3 196.1
7,9-Dimethyluric acid C7H8N4O3 196.1
1,3-Dimethyluric acid C7H8N4O3 196.1
1,7-Dimethyluric acid C7H8N4O3 196.1
MDA
Hippuric acid C9H9NO3 179.1
Acetylisoniazid C8H9N3O2 179.1
Glucosamine C6H13NO5 179.1
Mexiletine C11H17NO 179.1
Methylephedrine C11H17NO 179.1
Methoxyphenamine C11H17NO 179.1
Rimantadine C12H21N 179.2
Memantine C12H21N 179.2
188
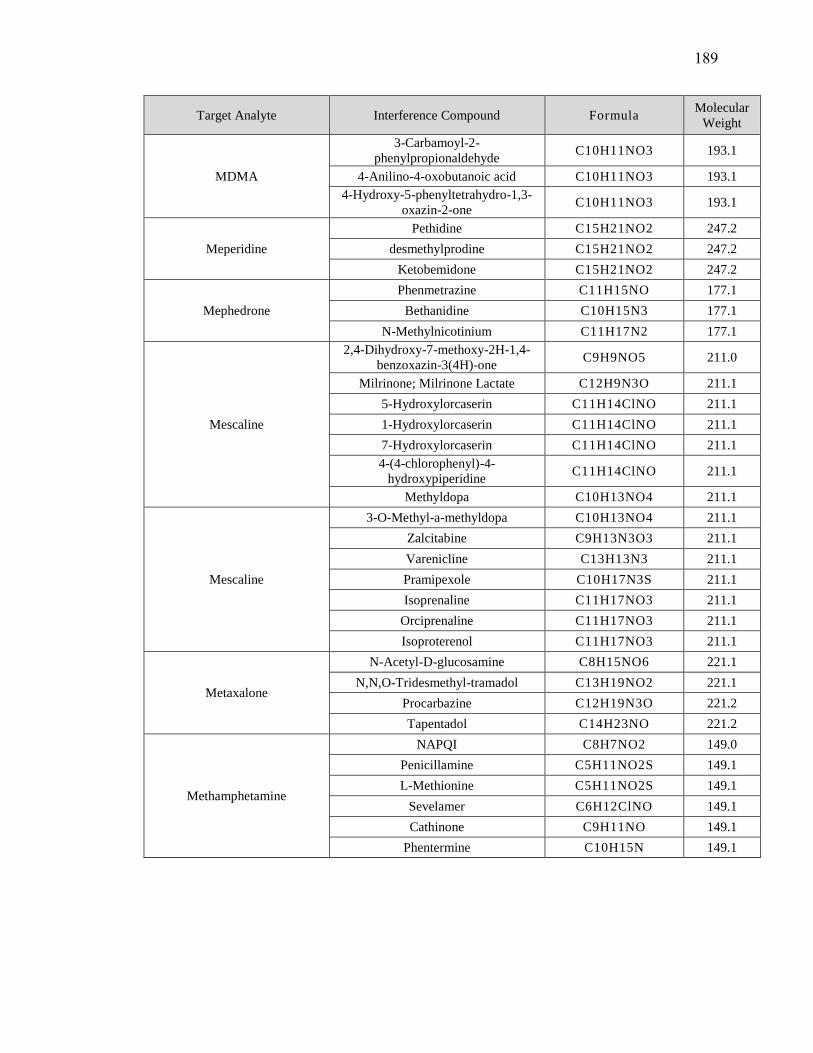
Target Analyte Interference Compound Formula Molecular
Weight
MDMA
3-Carbamoyl-2-
phenylpropionaldehyde C10H11NO3 193.1
4-Anilino-4-oxobutanoic acid C10H11NO3 193.1
4-Hydroxy-5-phenyltetrahydro-1,3-
oxazin-2-one C10H11NO3 193.1
Meperidine
Pethidine C15H21NO2 247.2
desmethylprodine C15H21NO2 247.2
Ketobemidone C15H21NO2 247.2
Mephedrone
Phenmetrazine C11H15NO 177.1
Bethanidine C10H15N3 177.1
N-Methylnicotinium C11H17N2 177.1
Mescaline
2,4-Dihydroxy-7-methoxy-2H-1,4-
benzoxazin-3(4H)-one C9H9NO5 211.0
Milrinone; Milrinone Lactate C12H9N3O 211.1
5-Hydroxylorcaserin C11H14ClNO 211.1
1-Hydroxylorcaserin C11H14ClNO 211.1
7-Hydroxylorcaserin C11H14ClNO 211.1
4-(4-chlorophenyl)-4-
hydroxypiperidine C11H14ClNO 211.1
Methyldopa C10H13NO4 211.1
Mescaline
3-O-Methyl-a-methyldopa C10H13NO4 211.1
Zalcitabine C9H13N3O3 211.1
Varenicline C13H13N3 211.1
Pramipexole C10H17N3S 211.1
Isoprenaline C11H17NO3 211.1
Orciprenaline C11H17NO3 211.1
Isoproterenol C11H17NO3 211.1
Metaxalone
N-Acetyl-D-glucosamine C8H15NO6 221.1
N,N,O-Tridesmethyl-tramadol C13H19NO2 221.1
Procarbazine C12H19N3O 221.2
Tapentadol C14H23NO 221.2
Methamphetamine
NAPQI C8H7NO2 149.0
Penicillamine C5H11NO2S 149.1
L-Methionine C5H11NO2S 149.1
Sevelamer C6H12ClNO 149.1
Cathinone C9H11NO 149.1
Phentermine C10H15N 149.1
189

Target Analyte Interference Compound Formula Molecular
Weight
Methocarbamol
Moxonidine C9H12ClN5O 241.1
3'-Amino-3'-deoxythimidine C10H15N3O4 241.1
Mefenamic acid C15H15NO2 241.1
Tetrahydrobiopterin C9H15N5O3 241.1
N,N-Didemethyl orphenadrine C16H19NO 241.1
N-Desmethyldiphenhydramine C16H19NO 241.1
Methylone
triazolopropionic acid C9H9N3O3 207.1
Isoniazid pyruvate C9H9N3O3 207.1
Carbamazepine iminoquinone C14H9NO 207.1
N-isopropylterephthalamic acid C11H13NO3 207.1
4-(Methylnitrosamino)-1-(3-pyridyl)-
1-butanoneC10H13N3O2 207.1
Ciclopirox C12H17NO2 207.1
N-Desmethyl tapentadol C13H21NO 207.2
Methylphenidate;
Normeperidine
Dopamine 3-O-sulfate C8H11NO5S 233.0
Dopamine 4-sulfate C8H11NO5S 233.0
Lomustine C9H16ClN3O2 233.1
N,N-Didesmethyltramadol C15H23NO 233.2
Metoprolol
Sulfisoxazole C11H13N3O3S 267.1
Sulfamoxole C11H13N3O3S 267.1
Zidovudine C10H13N5O4 267.1
Adenosine C10H13N5O4 267.1
Vidarabine C10H13N5O4 267.1
Metoprolol
4-amino-MX C12H17N3O4 267.1
Apomorphine C17H17NO2 267.1
Voglibose C10H21NO7 267.1
Mirtazapine; Nordoxepine Desacetyl-nitazoxanide C10H7N3O4S 265.0
Mirtazapine; Nordoxepine
Isoniazid alpha-ketoglutaric acid C11H11N3O5 265.1
Albendazole C12H15N3O2S 265.1
Streptozocin C8H15N3O7 265.1
Thiamine C12H17N4OS 265.1
E-10-Hydroxydesmethylnortriptyline C18H19NO 265.1
Antazoline C17H19N3 265.2
Oxprenolol C15H23NO3 265.2
4-Hydroxy-alprenolol C15H23NO3 265.2
Naproxen; TFMPP
Diazoxide C8H7ClN2O2S 230.0
Guanabenz C8H8Cl2N4 230.0
Hydralazine pyruvate hydrazone C11H10N4O2 230.1
cyclic Melatonin C13H14N2O2 230.1
Ibudilast C14H18N2O 230.1
190
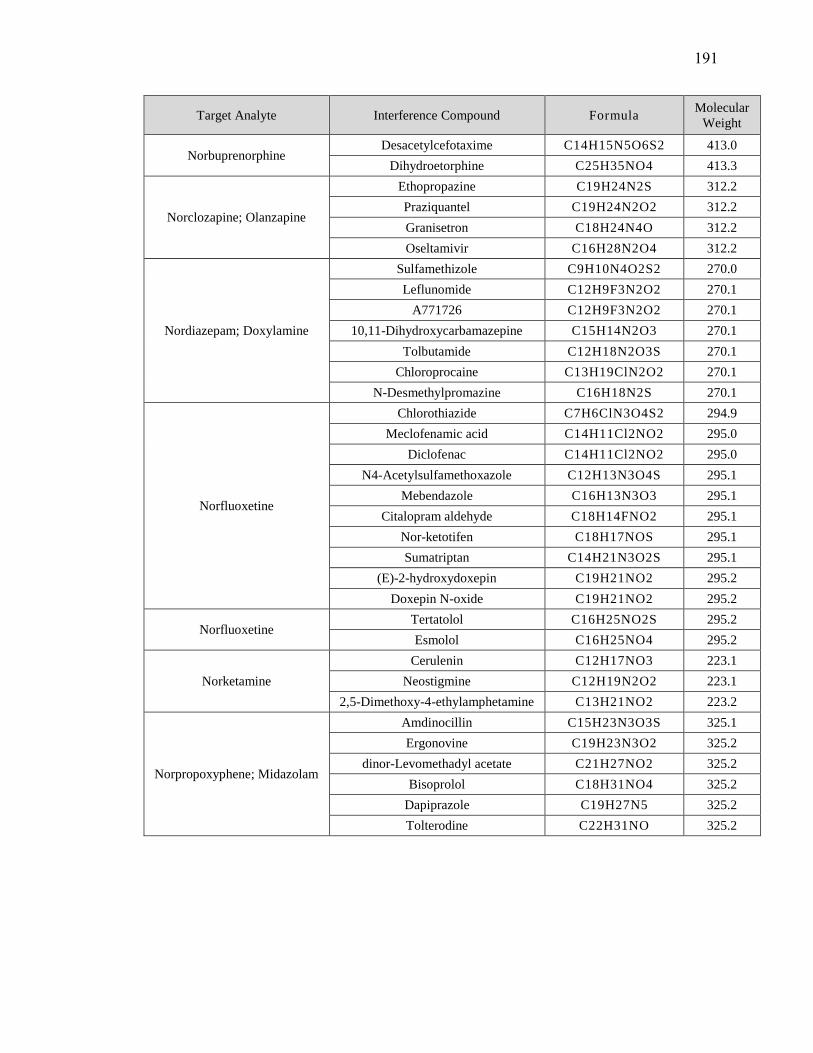
Target Analyte Interference Compound Formula Molecular
Weight
Norbuprenorphine Desacetylcefotaxime C14H15N5O6S2 413.0
Dihydroetorphine C25H35NO4 413.3
Norclozapine; Olanzapine
Ethopropazine C19H24N2S 312.2
Praziquantel C19H24N2O2 312.2
Granisetron C18H24N4O 312.2
Oseltamivir C16H28N2O4 312.2
Nordiazepam; Doxylamine
Sulfamethizole C9H10N4O2S2 270.0
Leflunomide C12H9F3N2O2 270.1
A771726 C12H9F3N2O2 270.1
10,11-Dihydroxycarbamazepine C15H14N2O3 270.1
Tolbutamide C12H18N2O3S 270.1
Chloroprocaine C13H19ClN2O2 270.1
N-Desmethylpromazine C16H18N2S 270.1
Norfluoxetine
Chlorothiazide C7H6ClN3O4S2 294.9
Meclofenamic acid C14H11Cl2NO2 295.0
Diclofenac C14H11Cl2NO2 295.0
N4-Acetylsulfamethoxazole C12H13N3O4S 295.1
Mebendazole C16H13N3O3 295.1
Citalopram aldehyde C18H14FNO2 295.1
Nor-ketotifen C18H17NOS 295.1
Sumatriptan C14H21N3O2S 295.1
(E)-2-hydroxydoxepin C19H21NO2 295.2
Doxepin N-oxide C19H21NO2 295.2
Norfluoxetine Tertatolol C16H25NO2S 295.2
Esmolol C16H25NO4 295.2
Norketamine
Cerulenin C12H17NO3 223.1
Neostigmine C12H19N2O2 223.1
2,5-Dimethoxy-4-ethylamphetamine C13H21NO2 223.2
Norpropoxyphene; Midazolam
Amdinocillin C15H23N3O3S 325.1
Ergonovine C19H23N3O2 325.2
dinor-Levomethadyl acetate C21H27NO2 325.2
Bisoprolol C18H31NO4 325.2
Dapiprazole C19H27N5 325.2
Tolterodine C22H31NO 325.2
191

Target Analyte Interference Compound Formula Molecular
Weight
Norsertraline
Brimonidine C11H10BrN5 291.0
Orciprenaline-3-O-sulfate C11H17NO6S 291.1
Diethylthiambutene C16H21NS2 291.1
Desethylchloroquine C16H22ClN3 291.2
Cyclopentolate C17H25NO3 291.2
Levobunolol C17H25NO3 291.2
Terbinafine C21H25N 291.2
Penbutolol C18H29NO2 291.2
Nortramadol
Alendronate C4H13NO7P2 249.0
Norepinephrine sulfate C8H11NO6S 249.0
Sulfapyridine C11H11N3O2S 249.1
Epinastine C16H15N3 249.1
Desmethylnortriptyline C18H19N 249.2
Tenocyclidine C15H23NS 249.2
Alprenolol C15H23NO2 249.2
N,O-Didesmethylvenlafaxine C15H23NO2 249.2
Norvenlafaxine; Nortrityline,
Tramaol
Amfecloral C11H12Cl3N 263.0
Epinephrine sulfate C9H13NO6S 263.0
Ticlopidine C14H14ClNS 263.1
Gemcitabine C9H11F2N3O4 263.1
Dimethylthiambutene C14H17NS2 263.1
desethylzaleplon C15H13N5 263.1
Protriptyline C19H21N 263.2
demethylmaprotiline C19H21N 263.2
2-Ethyl-5-methyl-3,3-diphenyl-1-
pyrroline C19H21N 263.2
Protriptyline C19H21N 263.2
Lisdexamfetamine C15H25N3O 263.2
Oxymorphone Carboxybupranolol C14H20ClNO4 301.1
Oxymorphone
Noroxycodone C17H19NO4 301.1
Dihydrocodeine C18H23NO3 301.2
Dobutamine C18H23NO3 301.2
Trihexyphenidyl C20H31NO 301.2
Paroxetine
Nitisinone C14H10F3NO5 329.1
8-Hydroxyamoxapine C17H16ClN3O2 329.1
Dopamine glucuronide C14H19NO8 329.1
Cloperastine C20H24ClNO 329.2
Trilostane C20H27NO3 329.2
N-desethyloxybutynin C20H27NO3 329.2
192
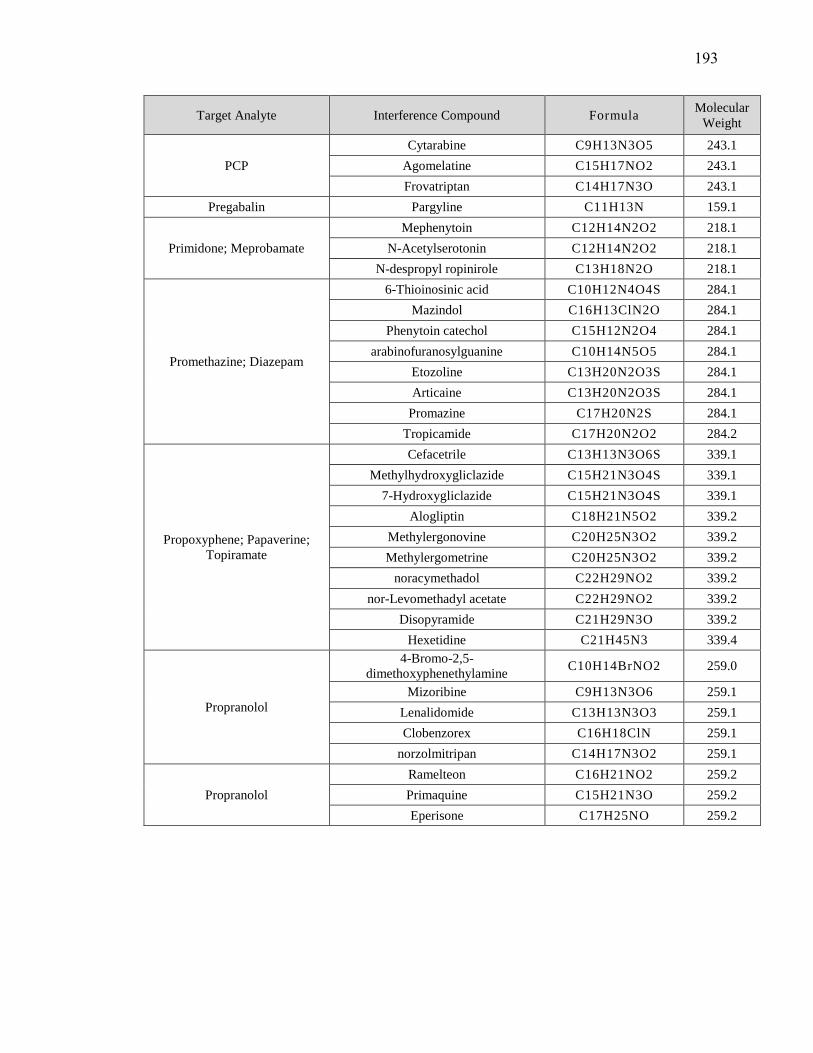
Target Analyte Interference Compound Formula Molecular
Weight
PCP
Cytarabine C9H13N3O5 243.1
Agomelatine C15H17NO2 243.1
Frovatriptan C14H17N3O 243.1
Pregabalin Pargyline C11H13N 159.1
Primidone; Meprobamate
Mephenytoin C12H14N2O2 218.1
N-Acetylserotonin C12H14N2O2 218.1
N-despropyl ropinirole C13H18N2O 218.1
Promethazine; Diazepam
6-Thioinosinic acid C10H12N4O4S 284.1
Mazindol C16H13ClN2O 284.1
Phenytoin catechol C15H12N2O4 284.1
arabinofuranosylguanine C10H14N5O5 284.1
Etozoline C13H20N2O3S 284.1
Articaine C13H20N2O3S 284.1
Promazine C17H20N2S 284.1
Tropicamide C17H20N2O2 284.2
Propoxyphene; Papaverine;
Topiramate
Cefacetrile C13H13N3O6S 339.1
Methylhydroxygliclazide C15H21N3O4S 339.1
7-Hydroxygliclazide C15H21N3O4S 339.1
Alogliptin C18H21N5O2 339.2
Methylergonovine C20H25N3O2 339.2
Methylergometrine C20H25N3O2 339.2
noracymethadol C22H29NO2 339.2
nor-Levomethadyl acetate C22H29NO2 339.2
Disopyramide C21H29N3O 339.2
Hexetidine C21H45N3 339.4
Propranolol
4-Bromo-2,5-
dimethoxyphenethylamine C10H14BrNO2 259.0
Mizoribine C9H13N3O6 259.1
Lenalidomide C13H13N3O3 259.1
Clobenzorex C16H18ClN 259.1
norzolmitripan C14H17N3O2 259.1
Propranolol
Ramelteon C16H21NO2 259.2
Primaquine C15H21N3O 259.2
Eperisone C17H25NO 259.2
193
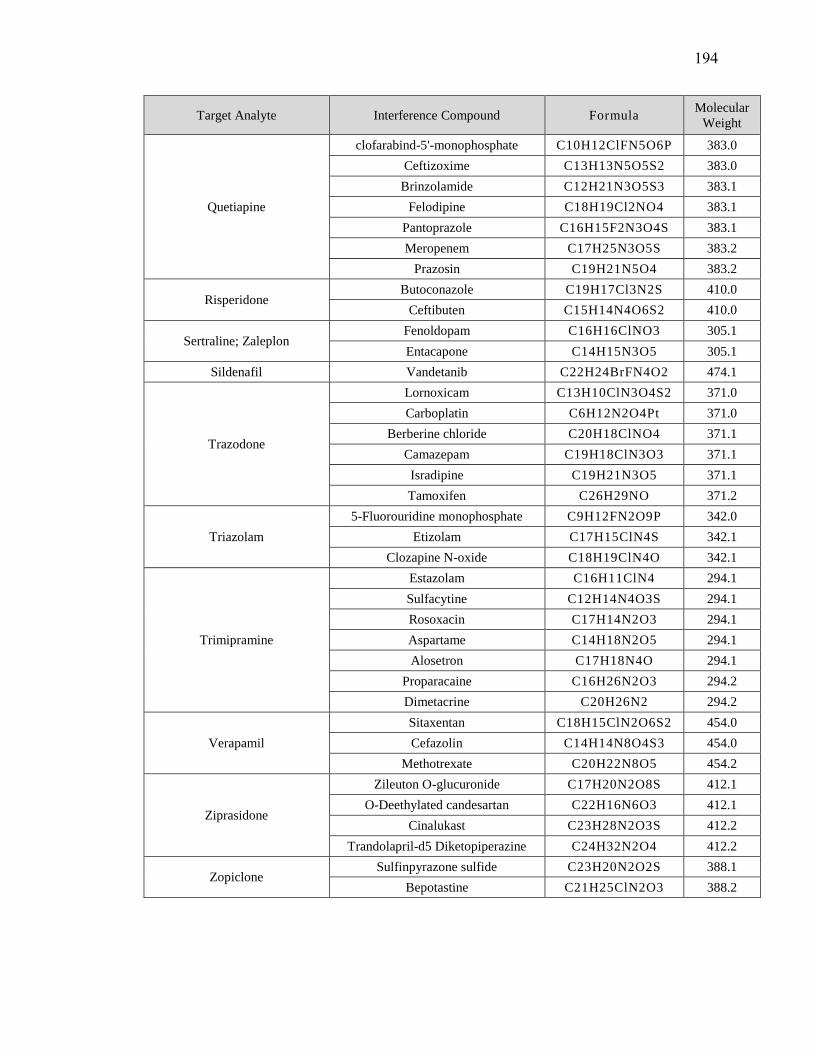
Target Analyte Interference Compound Formula Molecular
Weight
Quetiapine
clofarabind-5'-monophosphate C10H12ClFN5O6P 383.0
Ceftizoxime C13H13N5O5S2 383.0
Brinzolamide C12H21N3O5S3 383.1
Felodipine C18H19Cl2NO4 383.1
Pantoprazole C16H15F2N3O4S 383.1
Meropenem C17H25N3O5S 383.2
Prazosin C19H21N5O4 383.2
Risperidone Butoconazole C19H17Cl3N2S 410.0
Ceftibuten C15H14N4O6S2 410.0
Sertraline; Zaleplon Fenoldopam C16H16ClNO3 305.1
Entacapone C14H15N3O5 305.1
Sildenafil Vandetanib C22H24BrFN4O2 474.1
Trazodone
Lornoxicam C13H10ClN3O4S2 371.0
Carboplatin C6H12N2O4Pt 371.0
Berberine chloride C20H18ClNO4 371.1
Camazepam C19H18ClN3O3 371.1
Isradipine C19H21N3O5 371.1
Tamoxifen C26H29NO 371.2
Triazolam
5-Fluorouridine monophosphate C9H12FN2O9P 342.0
Etizolam C17H15ClN4S 342.1
Clozapine N-oxide C18H19ClN4O 342.1
Trimipramine
Estazolam C16H11ClN4 294.1
Sulfacytine C12H14N4O3S 294.1
Rosoxacin C17H14N2O3 294.1
Aspartame C14H18N2O5 294.1
Alosetron C17H18N4O 294.1
Proparacaine C16H26N2O3 294.2
Dimetacrine C20H26N2 294.2
Verapamil
Sitaxentan C18H15ClN2O6S2 454.0
Cefazolin C14H14N8O4S3 454.0
Methotrexate C20H22N8O5 454.2
Ziprasidone
Zileuton O-glucuronide C17H20N2O8S 412.1
O-Deethylated candesartan C22H16N6O3 412.1
Cinalukast C23H28N2O3S 412.2
Trandolapril-d5 Diketopiperazine C24H32N2O4 412.2
Zopiclone Sulfinpyrazone sulfide C23H20N2O2S 388.1
Bepotastine C21H25ClN2O3 388.2
194
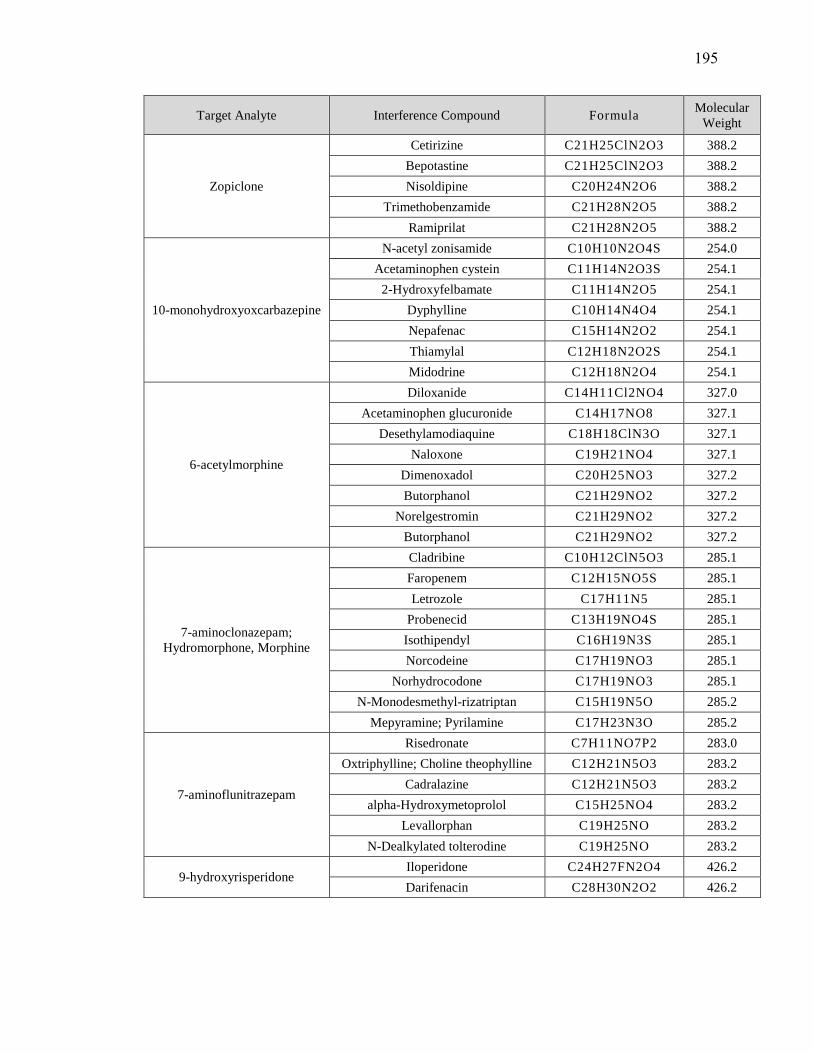
Target Analyte Interference Compound Formula Molecular
Weight
Zopiclone
Cetirizine C21H25ClN2O3 388.2
Bepotastine C21H25ClN2O3 388.2
Nisoldipine C20H24N2O6 388.2
Trimethobenzamide C21H28N2O5 388.2
Ramiprilat C21H28N2O5 388.2
10-monohydroxyoxcarbazepine
N-acetyl zonisamide C10H10N2O4S 254.0
Acetaminophen cystein C11H14N2O3S 254.1
2-Hydroxyfelbamate C11H14N2O5 254.1
Dyphylline C10H14N4O4 254.1
Nepafenac C15H14N2O2 254.1
Thiamylal C12H18N2O2S 254.1
Midodrine C12H18N2O4 254.1
6-acetylmorphine
Diloxanide C14H11Cl2NO4 327.0
Acetaminophen glucuronide C14H17NO8 327.1
Desethylamodiaquine C18H18ClN3O 327.1
Naloxone C19H21NO4 327.1
Dimenoxadol C20H25NO3 327.2
Butorphanol C21H29NO2 327.2
Norelgestromin C21H29NO2 327.2
Butorphanol C21H29NO2 327.2
7-aminoclonazepam;
Hydromorphone, Morphine
Cladribine C10H12ClN5O3 285.1
Faropenem C12H15NO5S 285.1
Letrozole C17H11N5 285.1
Probenecid C13H19NO4S 285.1
Isothipendyl C16H19N3S 285.1
Norcodeine C17H19NO3 285.1
Norhydrocodone C17H19NO3 285.1
N-Monodesmethyl-rizatriptan C15H19N5O 285.2
Mepyramine; Pyrilamine C17H23N3O 285.2
7-aminoflunitrazepam
Risedronate C7H11NO7P2 283.0
Oxtriphylline; Choline theophylline C12H21N5O3 283.2
Cadralazine C12H21N5O3 283.2
alpha-Hydroxymetoprolol C15H25NO4 283.2
Levallorphan C19H25NO 283.2
N-Dealkylated tolterodine C19H25NO 283.2
9-hydroxyrisperidoneIloperidone C24H27FN2O4 426.2
Darifenacin C28H30N2O2 426.2
195