Implementation of Partial Least Squares (PLS) Modeling in ...
Korean J. Chem. Eng., 20(6), 977-984 (2003)
Korea
riks-xic-withurtiandon-od
l asla-od
n inral
dic-LS ex-me-rem-LS in-
anuses-PA
o thelityrac-es in
977
†To whom correspondence should be addressed.E-mail: [email protected]
Application of Partial Least Squares Methodsto a Terephthalic Acid Manufacturing Process for Product Quality Control
In-Su Han, Minjin Kim, Chang-Hyun Lee*, Woonou Cha*, Byoung-Kyoung Ham**, Jy-Hyo Jeong**,Haksoo Lee**, Chang-Bock Chung*** and Chonghun Han†
Department of Chemical Engineering, Pohang University of Science and Technology, Pohang, Gyeongbuk 790-784, *e-Management Team, SK Chemicals, Suwon, Gyeonggi 440-745, Korea**Petrochemical Production Team, SK Chemicals, Ulsan 680-160, Korea
***Faculty of Chemical Engineering, Chonnam National University, Gwangju 500-757, Korea(Received 31 September 2002 • accepted 8 August 2003)
Abstract−−−−This paper deals with an application of partial least squares (PLS) methods to an industrial terephthalicacid (TPA) manufacturing process to identify and remove the major causes of variability in the product quality.Multivariate statistical analyses were performed to find the major causes of variability in the product quality, usingthe PLS models built from historical data measured on the process and quality variables. It was found from the PLSanalyses that the variations in the catalyst concentrations and the process throughput significantly affect the productquality, and that the quality variations are propagated from the oxidation unit to the digestion units of the TPA process.A simulation-based approach was addressed to roughly estimate the effects of eliminating the major causes on theproduct quality using the PLS models. Based on the results that considerable amounts of the variations in the productquality could be reduced, we have proposed practical approaches for removing the major causes of product qualityvariations in the TPA manufacturing process.
Key words: Terephthalic Acid, Partial Least Squares (PLS), Quality Control, Empirical Modeling, Multivariate Analysis
INTRODUCTION
Terephthalic acid (TPA) is a monomer used to manufacture poly-ethylene terephthalate (PET), which then is formed into films, tex-tiles, bottles, and plastic molds. The manufacturing processes arereceiving increased attention due to steady growth in the demandfor PET in the expanding market. Several types of commercial pro-cesses each licensed by Amoco, Eastman-Kodak, or Mitsubishi arebeing operated to manufacture TPA in the world [Kroschwitz, 1991].In all these commercial processes, p-xylene is partially oxidized byair to TPA, where 4-carboxybenzaldehyde (4-CBA) is inevitablyformed as an undesirable by-product. The amount of the 4-CBAcontained in the TPA product mainly determines the product qual-ity since the 4-CBA hinders stable polymerization of TPA in thesubsequent PET manufacturing process [Kim et al., 2001]. Hence,it is desirable to minimize not only the formation of 4-CBA but alsoits fluctuation in the TPA manufacturing process to keep up the uni-formity in the PET product quality during a certain period of opera-tion. To achieve the goal, TPA manufacturers have adopted vari-ous process systems approaches such as modeling, optimization,control, and statistical analysis of the process [Jaisinghani et al., 1997;Cincotti et al., 1999].
Multivariate statistical projection methods, such as partial leastsquares (PLS) methods, principal component analysis (PCA) or prin-cipal component regression (PCR) are widely used as powerful toolsto identify the sources of quality deviations and process faults and
to model processes and product qualities in various industries. Eson et al. [1995] carried out multivariate analyses of aquatic toity data using a PLS method and compared its performance an MLR (multiple linear regression) method. MacGregor and Ko[1995] gave an overview of these methods and applied PCA PLS methods to an industrial polymerization process for online mitoring and fault diagnosis. Fujii et al. [1997] used a PLS methto select the important variables for empirical modeling as welto build the models for predicting the top composition in a distiltion column. Recently, Hong et al. [1999] employed a PLS methto design a soft sensor for the prediction of toluene compositioan industrial splitter column. They divided a data set into sevesub-groups using a PCA clustering method to improve the pretion capability of the soft sensor by constructing several local Pmodels. Liu et al. [2000] proposed a nonlinear PLS method bytending the conventional linear PLS method to a nonlinear frawork and applied their PLS method to a distillation column. Morecently, Han and Han [2003] developed a hybrid model by cobining a thermodynamic compression/expansion model into a Pmodel to predict the power consumption/generation rates of andustrial compression/expansion system.
In this article, we present an application of a PLS method toindustrial TPA manufacturing process to investigate the major caof variability in the quality (4-CBA concentration) of the TPA product. First, we present a brief overview of PLS methods and the Tmanufacturing process. Then, the PLS methods are applied tprocess to find the major causes of variability in the product quaand to simulate the effects of eliminating these causes. Finally, ptical approaches are proposed to get rid of the revealed caus
978 I.-S. Han et al.
a-
tentmbi-
llyally
ski,
r- var-
lud-
LS)tiallyPLSre
A inopri-m
ida-a-ized-ee as
the TPA manufacturing process.
BACKGROUND ON PARTIAL LEASTSQUARES METHODS
Multivariate statistical projection methods are recognized as state-of-the-art techniques for the analysis and modeling of chemical pro-cesses, and comprise several specific methods such as PCA, PCR,and PLS [Fujii et al., 1997; Neogi and Schlags, 1998]. Since thisstudy mainly relies on a PLS method, we give a brief overview ofit, referring the readers to the literature for the other methods [Woldet al., 1987; Wise and Gallagher, 1996].
A PLS method has been widely used as a powerful tool for con-structing empirical models from lab and field measurement data. Ittypically provides more robust and reliable models than ordinaryleast squares methods, particularly when the data are noisy and highlycorrelated with each other [Eriksson et al., 1995; Neogi and Schlags,1998]. The basic concept of the PLS method is to project the highdimensional spaces of the input and output data obtained from aprocess onto the low dimensional feature (latent) spaces and thento find the best relation between the feature vectors. It is capable ofdealing with singular and highly correlated regression problems whichthe traditional multiple linear regression methods cannot handle. Inaddition, it enables the modeling results to be easily interpreted byproviding helpful information in the form of scores, loadings, andregression coefficients.
The first step in a PLS modeling is to arrange the measurementson k process variables and quality variables at n different samplingtimes into an n×k process data matrix X and an n×m output ma-trix Y, respectively. Then, after being scaled and mean-centered, eachX and Y matrix is decomposed as a sum of series of rank-one ma-trices according to the following outer relations:
(1)
(2)
Finally, the inner relation is described by the following equation:
(3)
In the above, T and U represent the score matrices that summrize X and Y variables, respectively, while P and Q the loading ma-trices that show the influences of X and Y, respectively. The scorevectors ta are calculated sequentially from the data for each lavariable a (also called the PLS dimension) such that the linear conations of the X and Y variables defined by ta=Xpa and ua=Yqa
maximize the covariance between X and Y that is explained at eachlatent variable. The total number of latent variables A is typicamuch lower than the number of process variables k and is usudetermined by means of cross-validations [Geladi and Kowal1986]. If one uses all the latent variables (A=k) to describe X andY variables, the residual matrices E and F will be zeros. The PLSregression coefficients B in Eq. (3) are determined from the undelying PLS model and can be used to interpret how the processiables X are correlated to the quality variables Y. Typically, the mostinstructive method to calculate the PLS model parameters incing the scores (T and U), the loadings (P and Q), and the weights (W)is known as the nonlinear iterative partial least squares (NIPAalgorithm in which the PLS parameters are computed sequenfor each latent variable. Details on the general concepts of the modeling and the NIPALS algorithm are shown in the literatu[Geladi and Kowalski, 1986].
PROCESS DESCRIPTION
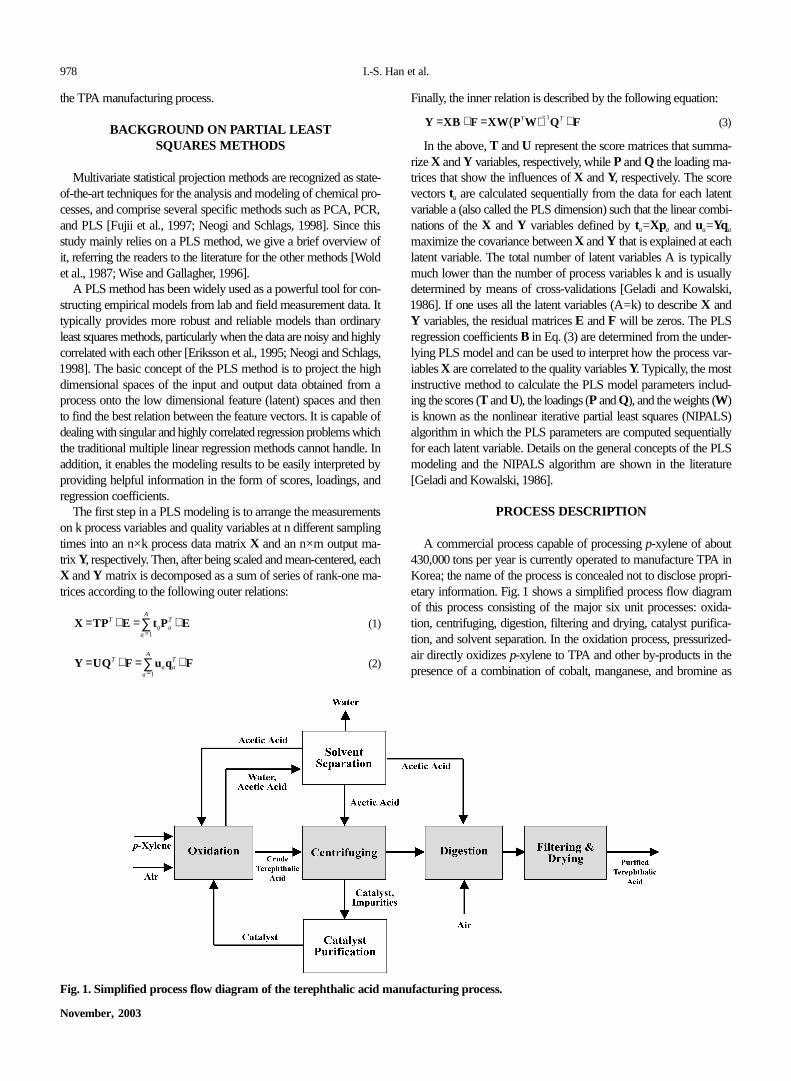
A commercial process capable of processing p-xylene of about430,000 tons per year is currently operated to manufacture TPKorea; the name of the process is concealed not to disclose pretary information. Fig. 1 shows a simplified process flow diagraof this process consisting of the major six unit processes: oxtion, centrifuging, digestion, filtering and drying, catalyst purifiction, and solvent separation. In the oxidation process, pressurair directly oxidizes p-xylene to TPA and other by-products in thpresence of a combination of cobalt, manganese, and bromin
X = TPT + E = taPa
T + E
a = 1
A
∑
Y = UQT + F = uaqa
T + F
a = 1
A
∑
Y = XB + F = XW PTW( ) − 1QT + F
Fig. 1. Simplified process flow diagram of the terephthalic acid manufacturing process.
November, 2003
Application of PLS Methods to a TPA Manufacturing Process for Product Quality Control 979
are de-
for-llectholeea-
d theata-
eightoxi-stionles 1ida-
PLS
],
,
,
in]
]
C]
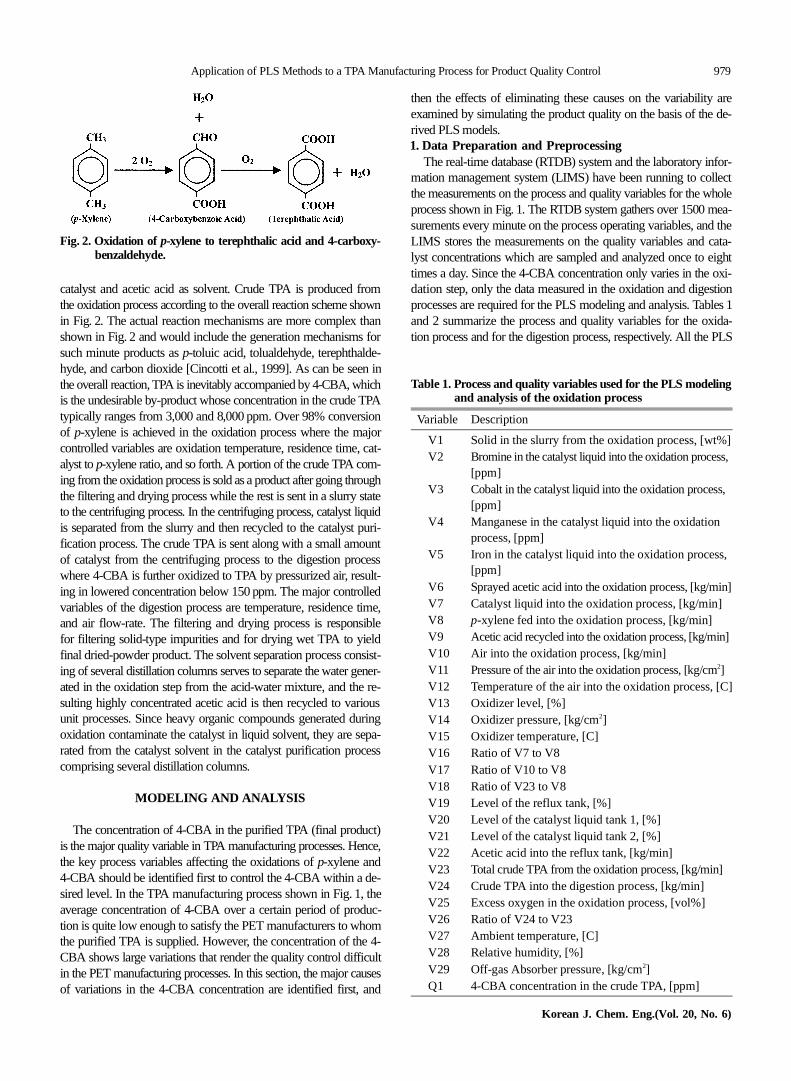
catalyst and acetic acid as solvent. Crude TPA is produced fromthe oxidation process according to the overall reaction scheme shownin Fig. 2. The actual reaction mechanisms are more complex thanshown in Fig. 2 and would include the generation mechanisms forsuch minute products as p-toluic acid, tolualdehyde, terephthalde-hyde, and carbon dioxide [Cincotti et al., 1999]. As can be seen inthe overall reaction, TPA is inevitably accompanied by 4-CBA, whichis the undesirable by-product whose concentration in the crude TPAtypically ranges from 3,000 and 8,000 ppm. Over 98% conversionof p-xylene is achieved in the oxidation process where the majorcontrolled variables are oxidation temperature, residence time, cat-alyst to p-xylene ratio, and so forth. A portion of the crude TPA com-ing from the oxidation process is sold as a product after going throughthe filtering and drying process while the rest is sent in a slurry stateto the centrifuging process. In the centrifuging process, catalyst liquidis separated from the slurry and then recycled to the catalyst puri-fication process. The crude TPA is sent along with a small amountof catalyst from the centrifuging process to the digestion processwhere 4-CBA is further oxidized to TPA by pressurized air, result-ing in lowered concentration below 150 ppm. The major controlledvariables of the digestion process are temperature, residence time,and air flow-rate. The filtering and drying process is responsiblefor filtering solid-type impurities and for drying wet TPA to yieldfinal dried-powder product. The solvent separation process consist-ing of several distillation columns serves to separate the water gener-ated in the oxidation step from the acid-water mixture, and the re-sulting highly concentrated acetic acid is then recycled to variousunit processes. Since heavy organic compounds generated duringoxidation contaminate the catalyst in liquid solvent, they are sepa-rated from the catalyst solvent in the catalyst purification processcomprising several distillation columns.
MODELING AND ANALYSIS
The concentration of 4-CBA in the purified TPA (final product)is the major quality variable in TPA manufacturing processes. Hence,the key process variables affecting the oxidations of p-xylene and4-CBA should be identified first to control the 4-CBA within a de-sired level. In the TPA manufacturing process shown in Fig. 1, theaverage concentration of 4-CBA over a certain period of produc-tion is quite low enough to satisfy the PET manufacturers to whomthe purified TPA is supplied. However, the concentration of the 4-CBA shows large variations that render the quality control difficultin the PET manufacturing processes. In this section, the major causesof variations in the 4-CBA concentration are identified first, and
then the effects of eliminating these causes on the variabilityexamined by simulating the product quality on the basis of therived PLS models.1. Data Preparation and Preprocessing
The real-time database (RTDB) system and the laboratory inmation management system (LIMS) have been running to cothe measurements on the process and quality variables for the wprocess shown in Fig. 1. The RTDB system gathers over 1500 msurements every minute on the process operating variables, anLIMS stores the measurements on the quality variables and clyst concentrations which are sampled and analyzed once to times a day. Since the 4-CBA concentration only varies in the dation step, only the data measured in the oxidation and digeprocesses are required for the PLS modeling and analysis. Taband 2 summarize the process and quality variables for the oxtion process and for the digestion process, respectively. All the
Fig. 2. Oxidation of p-xylene to terephthalic acid and 4-carboxy-benzaldehyde.
Table 1. Process and quality variables used for the PLS modelingand analysis of the oxidation process
Variable Description
V1 Solid in the slurry from the oxidation process, [wt%V2 Bromine in the catalyst liquid into the oxidation process
[ppm]V3 Cobalt in the catalyst liquid into the oxidation process
[ppm]V4 Manganese in the catalyst liquid into the oxidation
process, [ppm]V5 Iron in the catalyst liquid into the oxidation process
[ppm]V6 Sprayed acetic acid into the oxidation process, [kg/mV7 Catalyst liquid into the oxidation process, [kg/min]V8 p-xylene fed into the oxidation process, [kg/min]V9 Acetic acid recycled into the oxidation process, [kg/minV10 Air into the oxidation process, [kg/min]V11 Pressure of the air into the oxidation process, [kg/cm2]V12 Temperature of the air into the oxidation process, [V13 Oxidizer level, [%]V14 Oxidizer pressure, [kg/cm2]V15 Oxidizer temperature, [C]V16 Ratio of V7 to V8V17 Ratio of V10 to V8V18 Ratio of V23 to V8V19 Level of the reflux tank, [%]V20 Level of the catalyst liquid tank 1, [%]V21 Level of the catalyst liquid tank 2, [%]V22 Acetic acid into the reflux tank, [kg/min]V23 Total crude TPA from the oxidation process, [kg/min]V24 Crude TPA into the digestion process, [kg/min]V25 Excess oxygen in the oxidation process, [vol%]V26 Ratio of V24 to V23V27 Ambient temperature, [C]V28 Relative humidity, [%]V29 Off-gas Absorber pressure, [kg/cm2]Q1 4-CBA concentration in the crude TPA, [ppm]
Korean J. Chem. Eng.(Vol. 20, No. 6)
980 I.-S. Han et al.
96].ountspro-
thattionspo-a-
cessLS bytheob-var-uche-ture
and
nsPLS the thetion vari-od-hichAoodaultsf ac-
com-data that
pre-own val-e of thecen-es-l forthens)lus-r aionsria-ns.od-
iablyen-
forore
models built here use the historical data measured during the last10 month long operation of the TPA manufacturing process.
A problem arises here because the quality variables are measuredmuch less frequently than the process variables and further becausethe time stamps marked on each measurement would not exactlymatch between the two types of variables due to time-delays. Toresolve the problem, the original process data matrix with size n×kis rearranged into a new matrix with size l×(k×s) by selecting s rowslocated around the time stamps of the quality variables in the originalprocess data matrix as time-shifted variables that accounts for time-
delays [Wise and Gallagher, 1996; Dayal and MacGregor, 19Fig. 3 depicts the arrangement of a process data matrix that accfor time-delays as well as conforms the observations for the cess variables to those for the quality variables.
After the data matrices were rearranged, statistical outliers might appear due to measurement errors or abnormal operawere removed from the data set on the basis of principal comnent analysis [Wold et al., 1987]. Then, the following two data mtrices (each of which includes the observations both for the provariables and for the quality variable) were prepared for the Pmodeling: the data matrix 1 with the size of 306 observations206 variables (205 input variables and 1 output variable) for oxidation process, and the data matrix 2 with the size of 621 servations by 163 variables (162 input variables and 1 output iable) for the digestion process. Performing a PLS modeling to san arranged data matrix is similar to identifying an ARX (Auto Rgressive eXogeneous) model; details can be found in the litera[Wise and Gallagher, 1996; Dayal and MacGregor, 1996; Shi MacGregor, 2000].2. PLS Modeling and Analysis
To identify the correlations between the 4-CBA concentratioand the process variables including catalyst concentrations, models for the oxidation and digestion processes are built fromdata matrix 1 and 2, respectively. After cross-validations usingdata matrices are performed, the final PLS model for the oxidaprocess has seven latent variables and explains 62.2% of theance in the 4-CBA concentration of crude TPA (Q1). The PLS mel for the digestion process needs eight latent variables with w55.3% of the variability in the 4-CBA concentration of purified TP(Q2) is captured. Note that the PLS modeling results are quite gif we consider the fact that there should exist numerous sensor fand measurement errors in the process and quality variables otual processes and that the PLS models attempt to explain the “mon-cause” variations [MacGregor et al., 1994] in the process and to exclude the random variations and measurement errorsare uncorrelated with other process and quality variables.
Fig. 4 compares the measured 4-CBA concentrations with thedicted ones in the crude TPA from the oxidation process. As shin the figure, the predicted values agree well with the measuredues in trend, and most of the deviations from the average valuthe total observations can be predicted by the PLS model foroxidation process. Fig. 5 compares the measured 4-CBA contrations with the predicted ones in the purified TPA from the digtion process. Though the variance captured by the PLS modethe digestion process is relatively low compared with that for oxidation process, the major trend (showing long-term variatioof the measured 4-CBA concentrations is well predicted as iltrated in the figure. Since the quality variations (Q1 and Q2) folong operation period are rather undesirable than small fluctuatfor a short operation period, the predictions of the long-term vations are more important than those of the short-term variatioBecause the major trends are well predicted by using the PLS mels as shown in Figs. 4 and 5, both the PLS models can be relused for analyzing the causes of variability in the 4-CBA conctrations.
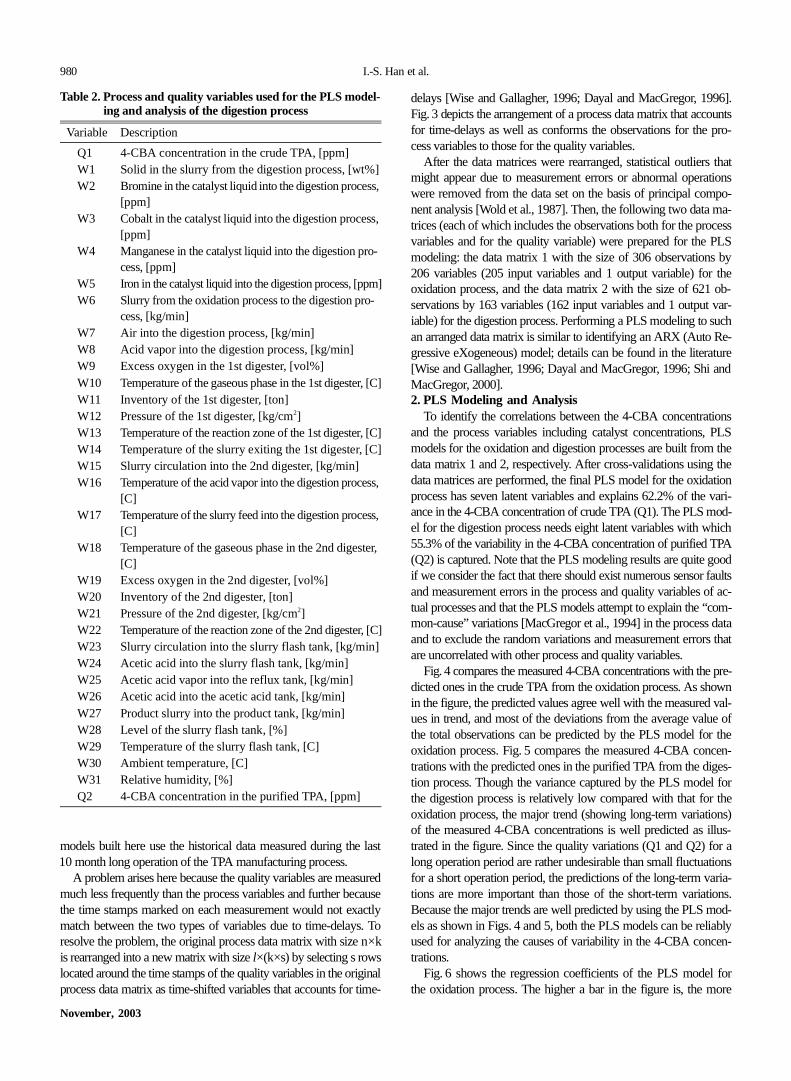
Fig. 6 shows the regression coefficients of the PLS model the oxidation process. The higher a bar in the figure is, the m
Table 2. Process and quality variables used for the PLS model-ing and analysis of the digestion process
Variable Description
Q1 4-CBA concentration in the crude TPA, [ppm]W1 Solid in the slurry from the digestion process, [wt%]W2 Bromine in the catalyst liquid into the digestion process,
[ppm]W3 Cobalt in the catalyst liquid into the digestion process,
[ppm]W4 Manganese in the catalyst liquid into the digestion pro-
cess, [ppm]W5 Iron in the catalyst liquid into the digestion process, [ppm]W6 Slurry from the oxidation process to the digestion pro-
cess, [kg/min]W7 Air into the digestion process, [kg/min]W8 Acid vapor into the digestion process, [kg/min]W9 Excess oxygen in the 1st digester, [vol%]W10 Temperature of the gaseous phase in the 1st digester, [C]W11 Inventory of the 1st digester, [ton]W12 Pressure of the 1st digester, [kg/cm2]W13 Temperature of the reaction zone of the 1st digester, [C]W14 Temperature of the slurry exiting the 1st digester, [C]W15 Slurry circulation into the 2nd digester, [kg/min]W16 Temperature of the acid vapor into the digestion process,
[C]W17 Temperature of the slurry feed into the digestion process,
[C]W18 Temperature of the gaseous phase in the 2nd digester,
[C]W19 Excess oxygen in the 2nd digester, [vol%]W20 Inventory of the 2nd digester, [ton]W21 Pressure of the 2nd digester, [kg/cm2]W22 Temperature of the reaction zone of the 2nd digester, [C]W23 Slurry circulation into the slurry flash tank, [kg/min]W24 Acetic acid into the slurry flash tank, [kg/min]W25 Acetic acid vapor into the reflux tank, [kg/min]W26 Acetic acid into the acetic acid tank, [kg/min]W27 Product slurry into the product tank, [kg/min]W28 Level of the slurry flash tank, [%]W29 Temperature of the slurry flash tank, [C]W30 Ambient temperature, [C]W31 Relative humidity, [%]Q2 4-CBA concentration in the purified TPA, [ppm]
November, 2003

Application of PLS Methods to a TPA Manufacturing Process for Product Quality Control 981
ugh-ion
forcon-A
ar-a-
tionAlyst af-.
bili-
effect the corresponding variable has on the quality variable. Andthe sign of a regression coefficient denotes the direction of the effecton the quality variable. As shown in the figure, the concentrationsof the catalysts (V2 and V4) into the oxidation process are stronglycorrelated to the 4-CBA concentration of crude TPA. Especially,the manganese concentration has a positive correlation to the con-centration of the 4-CBA in the oxidation process, but the brominehas a strong negative correlation contrary to the manganese con-centration. It implies that small fluctuations in the catalyst concen-trations lead to large variability in the concentration of the 4-CBAin the crude TPA and thus that the catalyst concentrations shouldbe elaborately controlled to reduce the quality variations. The pro-cess variables (V8 and V15) associated with the process through-put also highly affect the variability in the 4-CBA concentration ofcrude TPA. Therefore, we can reach the conclusion that the variations
in the catalyst concentration and the changes in the process throput are the major sources of variability in the 4-CBA concentratof crude TPA.
Fig. 7 shows the regression coefficients of the PLS model the digestion process. As can be seen in the figure, the 4-CBA centration of crude TPA (Q1) is strongly correlated with the 4-CBconcentration of purified TPA (Q2). It means that most of the viations in the purified TPA quality are propagated from the oxidtion process, and consequently that the stabilization of oxidaprocess is very important to reduce the variability in the 4-CBconcentration of purified TPA. In the digestion process, the cataconcentrations (W3 and W4) and the flow rate of air (W7) alsofect the 4-CBA concentration of purified TPA as shown in Fig. 73. Estimation of the Variability in the Product Quality
The PLS models are used to investigate the effects of the sta
Fig. 3. Arrangement of an original process data matrix into a new process data matrix; the gray-colored rows indicate the observationsfor the process variables corresponding to the time stamps at which the quality variables are measured.
Fig. 4. 4-CBA concentrations of crude TPA predicted by the PLSmodel for the oxidation process.
Fig. 5. 4-CBA concentrations of purified TPA predicted by thePLS model for the digestion process.
Korean J. Chem. Eng.(Vol. 20, No. 6)
982 I.-S. Han et al.
ftere sta-heon- thetra-ula- per-.6%,es-elsri-pres-ffect
zation of variability both in the catalyst concentrations and in theprocess throughput on the variations in the 4-CBA concentrations(Q1 and Q2). Using the PLS models for the oxidation and diges-tion processes, the simulation results are obtained at two differentoperating conditions: one is the actual condition during the period ofthe data sampling, and the other is an assumed scenario in whichthe catalyst concentrations (V2-4 and W2-4) and the process vari-ables (V7-8, V10, V15-18, V23-24, V26, W6-7, W10, W13, W18,W22, and W17) associated with the process throughput are stabi-lized by intentionally reducing their standard deviations to halvesthe actual values. In all the simulations, the concentrations of 4-CBA(Q1) predicted by the PLS model for the oxidation process are usedas an input vector of the PLS model for the digestion process. Then,the effect of the stabilization can be roughly estimated by compar-ing the simulation results obtained at the two different operatingconditions under the assumption that all the process variables areindependent of each other, hence freely adjustable.
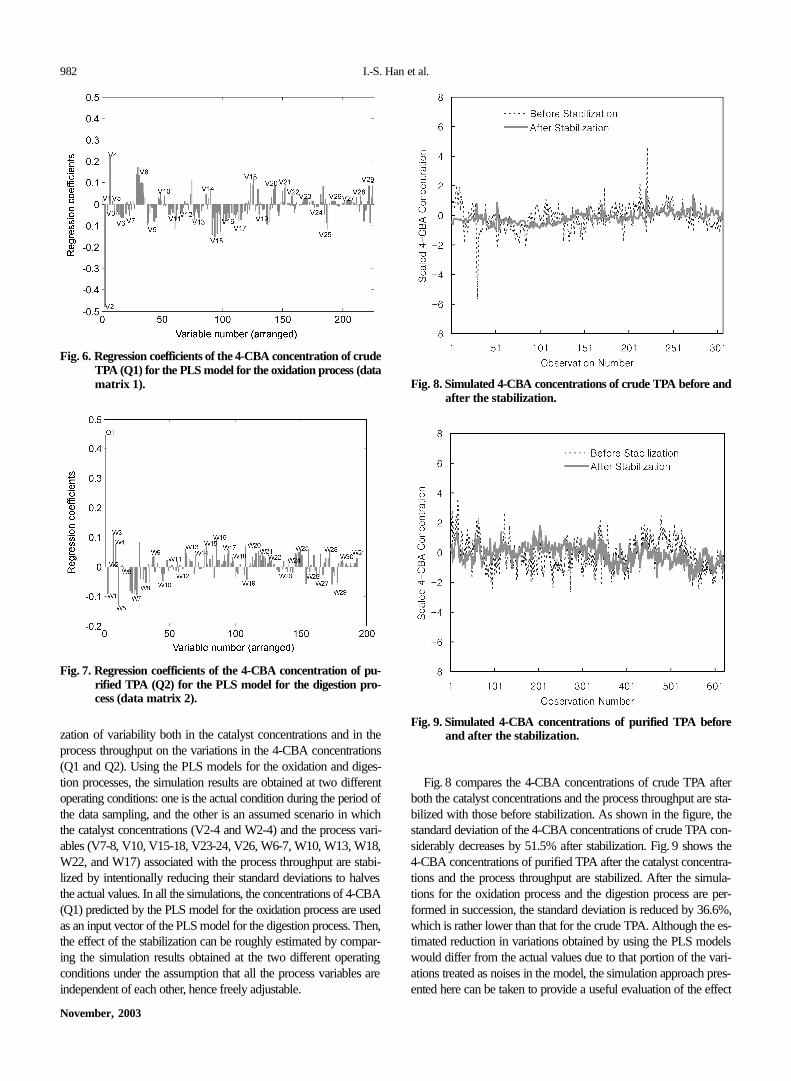
Fig. 8 compares the 4-CBA concentrations of crude TPA aboth the catalyst concentrations and the process throughput arbilized with those before stabilization. As shown in the figure, tstandard deviation of the 4-CBA concentrations of crude TPA csiderably decreases by 51.5% after stabilization. Fig. 9 shows4-CBA concentrations of purified TPA after the catalyst concentions and the process throughput are stabilized. After the simtions for the oxidation process and the digestion process areformed in succession, the standard deviation is reduced by 36which is rather lower than that for the crude TPA. Although the timated reduction in variations obtained by using the PLS modwould differ from the actual values due to that portion of the vaations treated as noises in the model, the simulation approach ented here can be taken to provide a useful evaluation of the e
Fig. 6. Regression coefficients of the 4-CBA concentration of crudeTPA (Q1) for the PLS model for the oxidation process (datamatrix 1).
Fig. 7. Regression coefficients of the 4-CBA concentration of pu-rified TPA (Q2) for the PLS model for the digestion pro-cess (data matrix 2).
Fig. 8. Simulated 4-CBA concentrations of crude TPA before andafter the stabilization.
Fig. 9. Simulated 4-CBA concentrations of purified TPA beforeand after the stabilization.
November, 2003
Application of PLS Methods to a TPA Manufacturing Process for Product Quality Control 983
anndonlynts
ingajorti-
od-alitys of
heinves-ticalaled
sys-ating areess.
jectant
of stabilizing the major causes of variations.
PRACTICAL APPROACHESTO PRODUCT QUALITY CONTROL
As one can see from the PLS regression coefficients and the sim-ulation results shown in the previous section, the major causes ofvariability in the 4-CBA concentrations are the fluctuations in thecatalyst concentrations and changes in the process throughput. Thus,we have to get rid of these causes in order to achieve more uniformconcentrations of 4-CBA both in the oxidation process and in thedigestion process. In practice, to stabilize the catalyst concentra-tions in the TPA manufacturing process, the concentrations of thecatalysts into the oxidation process should be measured online byusing a near-infrared spectroscopy. Then, a control system that usesthe measured concentrations can be devised to keep the ratio of cat-alyst to p-xylene at a constant value in the oxidation and digestionprocesses. A simple proportional-integral-derivative (PID) controlsystem can be adopted for adjusting the flow rate of the catalystliquid into the oxidation process if the only control objective is toregulate the total catalyst to p-xylene ratio. However, to regulateboth the catalyst composition (cobalt, bromine, and manganese)and the total catalyst to p-xylene ratio, a more sophisticated controlsystem such as a model predictive controller [Jaisinghani et al., 1997;Hur et al., 2003] should be employed for the TPA manufacturingprocess shown in Fig. 1.
Typically, the process throughput varies depending on the pro-duction schedule and on a sudden or scheduled maintenance forthe unit processes. Thus, it is hard to directly reduce the variabilityin the process throughput. Since a change in the process through-put would inevitably make the 4-CBA concentrations in the oxida-tion and digestion processes deviate from the target values, we haveto look for key process variables to adjust for the purpose of regulat-ing the 4-CBA concentrations. Such variables should fulfill the re-quirement that they not only have strong and consistent effect onthe 4-CBA concentrations but also be easily adjustable without vio-lating the operating conditions. Figs. 6 and 7 can be used to screenthe candidates of the key process variables that satisfy the require-ment. As a result, we chose the temperature of the oxidizer (V15)as the most suitable process variable for regulating the 4-CBA inthe crude TPA in the oxidization process. For controlling the 4-CBAin the purified TPA in the digestion process, we selected the flowrate of the air into the digestion process (W7) and the temperatureof the 1st digester (W13).
If there is a change in the process throughput, we have to adjustthe set-point of the oxidizer temperature to prevent the 4-CBA con-centration of crude TPA from drifting from a target value. In thiscase, the following empirical relation can be used to set up a newset-point of the temperature:
C4CBA, CTA=α1Ff+α2TOXD+α3 (4)
Similarly, the 4-CBA concentration of purified TPA can also be re-gulated by adjusting the set-points of both the air flow rate and thedigester temperature, based on the following equation:
C4CBA, PTA=β1Ff+β2TDIG+β3FaDIG+β4 (5)
In the equations above, the model coefficients (α1, α2, α3 and β1, β2,
β3, β4) are determined by designing suitable experiments [Colemand Montgomery, 1993; Montgomery, 2001] for the oxidation adigestion processes. However, the determined coefficients are valid within the normal operating regions where the experimeare performed.
CONCLUSIONS
PLS methods were applied to an industrial TPA manufacturprocess to investigate the major causes of variability in the mquality variable (4-CBA concentration in the TPA product). Mulvariate statistical analyses were performed by using the PLS mels built from historical data measured on the process and quvariables in the TPA manufacturing process. The major causevariability in the product quality were successfully found from tPLS analyses, and the effects of eliminating these causes were tigated via the simulations using the derived PLS models. Pracapproaches to getting rid of the major causes, which were revethrough the PLS analyses, were proposed to design controltems for stabilizing the catalyst concentrations and to set up operconditions on the basis of a simple linear equation when therechanges in the process throughput of the TPA manufacturing proc
ACKNOWLEDGMENT
This work was supported in part by the Brain Korea 21 Proand the Ministry of Commerce, Industry and Energy (MOICE) (grNo. IMT2000-00015993).
NOMENCLATURE
B : k×m matrix of regression coefficientsC4CBA, CTA : 4-CBA concentration of crude TPAC4CBA, PTA : 4-CBA concentration of purified TPAE : n×k residual matrix for XF : n×m residual matrix for YFaDIG : flow rate of the air entering the digestion processFf : throughput of p-xylene feedP : k×A loading matrix for Xpa : loading vector with the size of k×1 for X in a latent variable aQ : m×A loading matrix for Yqa : loading vector with the size of m×1 for Y in a latent vari-
able aT : n×A score matrix for XTDIG : digester temperatureTOXD : oxidizer temperatureta : score vector with the size of n×1 for X in a latent variable aU : n×A score matrix for Yua : score vector with the size of n×1 for Y in a latent variable aW : k×A matrix of weight vectorwa : vector of weights with the size of k×1 for X variables in a
latent variable aX : matrix of process data with the size of n×kY : matrix of quality data with the size of n×m
SubscriptsA : total number of latent variables
Korean J. Chem. Eng.(Vol. 20, No. 6)
984 I.-S. Han et al.
sor
l inDe-
TA
etic
y
sedor
ro-
lti-
n
an
ing
p-
sis,”
a : index of latent variablek : number of process variables for Xl : number of sampling times for the quality variablesm : number of quality variables for Yn : number of sampling times for X or Ys : number of rows selected in an original data matrix for rear-
rangement to a final data matrix
Greek Lettersα1, α2, α3 : model coefficients of Eq. (4)β1, β2, β3, β4 : model coefficients of Eq. (5)
REFERENCES
Cincotti, A., Orru, R. and Cao, G., “Kinetics and Related EngineeringAspects of Catalyst Liquid-Phase Oxidation of p-Xylene to Tereph-thalic Acid,” Catalyst Today, 52, 331 (1999).
Coleman, D. E. and Montgomery, D. C., “A Systematic Approach toPlanning for a Designed Industrial Experiment,” Technometrics, 35,1 (1993).
Dayal, B. S. and MacGregor, J. F., “Identification of Finite Impulse Re-sponse Models: Methods and Robustness Issues,” Ind. Eng. Chem.Res., 35, 4078 (1996).
Eriksson, L., Hermens, J. L. M., Johansson, E., Verhaar, H. J. M. andWold, S., “Multivariate Analysis of Aquatic Toxicity Data with PLS,”Aquatic Sciences, 57, 217 (1995).
Fujii, H., Lakshminarayanan, S. and Shah, S. L., “Application of thePLS Technique to the Estimation of Distillation Tower Top Compo-sition,” Preprint of IFAC Symposium on Advanced Control of Chem-ical Processes, 529 (1997).
Geladi, P. and Kowalski, B. R., ”Partial Least-Squares Regression: ATutorial,” Analytica Chimica Acta, 185, 1 (1986).
Han, I.-S. and Han, C., “Modeling of Multistage Air-Compression Sys-tems in Chemical Processes,” Ind. Eng. Chem. Res., 42, 2209 (2003).
Hong, S. J., Hua, C. K. and Han, C., “Local Composition Soft Senin a Distillation Column using PLS,” HWAHAK KONGHAK, 37,445 (1999).
Hur, S. M., Park, M. J. and Rhee, H. K., “Polymer Property Controa Continuous Styrene Polymerization Reactor Using Model-on-mand Predictive Controller,” Korean J. Chem. Eng., 20, 14 (2003).
Jaisinghani, R., Sims, R. and Lamshing, W., “APC Improves TA/PPlant Profits,” Hydrocarbon Processing, Oct., 99 (1997).
Kim, J. Y., Kim, H. Y. and Yeo, Y. K., “Identification of Kinetics of Di-rect Esterification Reactions for PET Synthesis Based on a GenAlgorithm,” Korean J. Chem. Eng., 18, 432 (2001).
Kroschwitz, J. I.,”Encyclopedia of Chemical Technology,” John Wile& Sons, New York, USA (1991).
Liu, J., Min, K., Han, C. and Chang, K. S., “Robust Nonlinear PLS Baon Neural Networks and Application to Composition Estimator fHigh-Purity Distillation Colums,” Korean J. Chem. Eng., 17, 184(2000).
MacGregor, J. F., Jaeckle, C., Kiparissides, C. and Koutoudi, M., “Pcess Monitoring and Diagnosis by Multiblock PLS Methods,” AIChEJ., 40, 826 (1994).
MacGregor, J. F. and Kourti, T., “Statistical Process Control of Muvariate Processes,” Control Eng. Practice, 3, 403 (1995).
Montgomery, D. C., “Introduction to Statistical Quality Control,” JohWiley & Sons, New York (2001)
Neogi, D. and Schlags, C. E., “Multivariate Statistical Analysis of Emulsion Batch Process,” Ind. Eng. Chem. Res., 37, 3971 (1998).
Shi, R. and MacGregor, J. F., “Modeling of Dynamic Systems usLatent Variable and Subspace Methods,” J. Chemometrics, 14, 423(2000).
Wise, B. M. and Gallagher, N. B., “The Process Chemometrics Aproach to Process Monitoring and Fault Detection,” J. Proc. Cont.,6, 329 (1996).
Wold, S., Esbensen, K. and Geladi, P., “Principal Component AnalyChemometrics and Intelligent Laboratory Systems, 2, 37 (1987).
November, 2003